effect of mixture component characteristics on property...
TRANSCRIPT

1
EFFECT OF MIXTURE COMPONENT CHARACTERISTICS ON PROPERTY AND PERFORMANCE OF SUPERPAVE MIXTURES
By
SANGHYUN CHUN
A DISSERTATION PRESENTED TO THE GRADUATE SCHOOL OF THE UNIVERSITY OF FLORIDA IN PARTIAL FULFILLMENT
OF THE REQUIREMENTS FOR THE DEGREE OF DOCTOR OF PHILOSOPHY
UNIVERSITY OF FLORIDA
2012

2
© 2012 Sanghyun Chun

3
To my beloved wife, Eunsong Lee and lovely son, Woobin Chun

4
ACKNOWLEDGMENTS
It is a great pleasure for me to thank and acknowledge the individuals who advised
and supported during the course of my doctoral program. First of all, I would like to
express my heartfelt appreciation to my committee chairman, Dr. Reynaldo Roque for
his invaluable guidance and support throughout my studies at the University of Florida. I
would not have been able to reach this great moment of my life without his
encouragement, advice, and mentoring. I would like to extend my gratitude to other
committee members, Dr. Mang Tia, Dr. Dennis R. Hiltunen, Dr. Peter G. Ifju, and Dr.
Claude Villiers, for their support to accomplish my doctoral study.
I also would like to express my sincere appreciation to Mr. George Lopp, Dr. Jian
Zou, Dr. Weitao Li, Michael Bekoe, and Cristian Cocconcelli for their constructive advice
and assistance on laboratory testing, data analysis, and field works. Many thanks would
also be given to all former and current students in the materials group of the
Department of Civil and Coastal Engineering at the University of Florida for their help
and friendship. Special thanks would go to Dr. Sungho Kim, Dr. Jaeseung Kim, Dr.
Chulseung Koh, and Hyungsuk Lee for their encouragement and friendship.
Lastly, I would like to thank my parents, Kijoon Chun and Wollim Myung, parents-
in-law, Hwayoung Lee and Chunghee Shin, my sister, Seieun Chun, my brother,
Sangkeun Chun, my wife, Eunsong Lee and my son Woobin Chun for their enduring
trust, encouragement and support.

5
TABLE OF CONTENTS page
ACKNOWLEDGMENTS .................................................................................................. 4
LIST OF TABLES ............................................................................................................ 8
LIST OF FIGURES .......................................................................................................... 9
LIST OF ABBREVIATIONS ........................................................................................... 12
ABSTRACT ................................................................................................................... 14
CHAPTERS
1 INTRODUCTION .................................................................................................... 16
1.1 Background ....................................................................................................... 16
1.2 Hypothesis ........................................................................................................ 18
1.3 Objectives ......................................................................................................... 19
1.4 Scope ................................................................................................................ 19
1.5 Research Approach .......................................................................................... 20
2 CHARACTERIZATION OF MIXTURE GRADATION AND RESULTING VOLUMETRIC PROPERTIES (DOMINANT AGGREGATE SIZE RANGE-INTERSTITIAL COMPONENT (DASR-IC) MODEL) ............................................... 22
2.1 Background ....................................................................................................... 22
2.2 Dominant Aggregate Size Range (DASR) ........................................................ 22
2.3 DASR Porosity .................................................................................................. 23
2.4 Interstitial Component (IC) of Mixture Gradation ............................................... 24
2.5 Disruption Factor (DF) ...................................................................................... 25
2.6 Effective Film Thickness (EFT) ......................................................................... 26
2.7 Ratio between Coarse Portion and Fine Portion of Fine Aggregates (CFA/FFA) ........................................................................................................... 29
2.8 Summary .......................................................................................................... 30
3 IMPLEMENTATION OF BINDER AND MIXTURE TESTS ON FIELD CORES FOR SUPERPAVE MIXTURES IN FLORIDA ......................................................... 31
3.1 Background ....................................................................................................... 31
3.2 Binder Recovery and Binder Tests ................................................................... 31
3.2.1 Binder Recovery ...................................................................................... 32
3.2.2 Penetration Test ...................................................................................... 32
3.2.3 Viscosity Test .......................................................................................... 33
3.2.4 Dynamic Shear Rheometer Test (DSR) .................................................. 35
3.2.5 Bending Beam Rheometer Test (BBR) .................................................... 37
6
3.2.6 Multiple Stress Creep Recovery Test (MSCR) ........................................ 39
3.3 Mixture Tests .................................................................................................... 42
3.3.1 Test Specimen Preparation ..................................................................... 42
3.3.1.1 Measuring, Cataloguing, and Inspecting ........................................ 42
3.3.1.2 Cutting ............................................................................................ 43
3.3.1.3 Gage Points Attachment ................................................................ 44
3.3.2 Test Procedure ........................................................................................ 45
3.3.2.1 Resilient Modulus Test ................................................................... 45
3.3.2.2 Creep Test ..................................................................................... 46
3.3.2.3 Tensile Strength Test ..................................................................... 48
3.3.3 Superpave IDT Test Results ................................................................... 50
3.3.4 Moisture-Damaged Projects .................................................................... 58
3.4 Summary .......................................................................................................... 63
4 EVALUATION OF FIELD MIXTURE PERFORMANCE USING DASR-IC MODEL PARAMETERS ......................................................................................... 64
4.1 Background ....................................................................................................... 64
4.2 Implementation of Gradation Analysis for Superpave Mixtures ........................ 64
4.3 Evaluation of Gradation Analysis Results for Superpave Projects .................... 67
4.4 Evaluation of Field Mixture Performance .......................................................... 69
4.4.1 Field Performance: Rutting ...................................................................... 70
4.4.2 Field Performance: Cracking ................................................................... 74
4.5 Summary .......................................................................................................... 78
5 IDENTIFICATION OF PREDICTIVE MIXTURE PROPERTY RELATIONSHIPS AND MODEL DEVELOPMENT .............................................................................. 80
5.1 Background ....................................................................................................... 80
5.2 Existing Material Property Models in the HMA-FM-E Model ............................. 81
5.2.1 AC Stiffness Aging Sub-Model ................................................................ 81
5.2.2 Fracture Energy Limit Aging Sub-Model .................................................. 83
5.3 Key Elements for Material Property Relationships ............................................ 85
5.3.1 DASR-IC Model Parameters ................................................................... 86
5.3.2 Initial Material Properties ......................................................................... 87
5.3.3 Factors Related to Non-Healable Permanent Damage ........................... 88
5.4 Development of Predictive Material Property Relationships ............................. 88
5.4.1 Relationships for Initial Material Properties ............................................. 89
5.4.1.1 Initial Fracture Energy Relationship ............................................... 90
5.4.1.2 Initial Creep Rate Relationship ....................................................... 92
5.4.2 Models for Changes in Material Properties .............................................. 98
5.4.2.1 AC Stiffness Model......................................................................... 99
5.4.2.2 Fracture Energy Limit Model ........................................................ 100
5.5 Summary ........................................................................................................ 103
7
6 EVALUATION OF DASR-IC CRITERIA USING HMA-FM-E MODEL ................... 104
6.1 Background ..................................................................................................... 104
6.2 Enhanced HMA Fracture Mechanics Based Model (HMA-FM-E Model) ......... 104
6.3 Input Module ................................................................................................... 105
6.4 Model Prediction Results ................................................................................ 108
6.5 Relationships between DASR-IC Criteria and Model Prediction Results ........ 110
6.6 Summary ........................................................................................................ 113
7 CLOSURE ............................................................................................................ 114
7.1 Summary and Findings ................................................................................... 114
7.2 Conclusions .................................................................................................... 115
7.3 Recommendations and Future Works............................................................. 116
APPENDIX: DETERMINISTIC PROCEDURE FOR ESTIMATION OF CRACK INITIATION TIME BASED ON CRACK RATING DATA ........................................ 118
LIST OF REFERENCES ............................................................................................. 121
BIOGRAPHICAL SKETCH .......................................................................................... 124
8
LIST OF TABLES
Table page 1-1 Mixture information of Superpave projects evaluated .......................................... 20
3-1 Asphalt binder used for Superpave projects evaluated ........................................ 31
3-2 Mixture information for 11 Superpave projects ..................................................... 50
3-3 Project information for moisture-damaged sections ............................................. 59
4-1 Mixture information of Superpave projects analyzed ............................................ 65
4-2 DASR-IC parameters calculated for Superpave projects ..................................... 65
4-3 Crack initiation time and cracking status determined for Superpave projects ...... 75
6-1 Summary of input data characteristics for the HMA-FM-E model ...................... 106
6-2 Data used for model prediction .......................................................................... 107
6-3 Predicted top-down cracking performance using HMA-FM-E model .................. 109
9
LIST OF FIGURES
Figure page 1-1 DASR and IC for three different types of mixture (After Kim et al., 2006) ............ 17
1-2 Overall research approach flowchart .................................................................... 21
2-1 Mixture components for calculation of DASR porosity (Kim et al., 2006) ............. 24
2-2 Configuration of different DF values (Guarin, 2009) ............................................. 26
2-3 Effective film thickness vs. theoretical film thickness ........................................... 27
2-4 Conceptual drawing of film thickness effect ......................................................... 28
2-5 Determination of CFA/FFA ................................................................................... 29
3-1 Penetration test results for Superpave projects ................................................... 33
3-2 Viscosity test results for Superpave projects ........................................................ 34
3-3 Change in viscosity with aging for Superpave projects ........................................ 35
3-4 G*∙sinδ, 10 rad/sec at 25 °C (77 °F) for Superpave projects ................................ 36
3-5 S(t), 60 seconds loading time at -12 °C (10.4 °F) for Superpave projects ............ 38
3-6 m-value, 60 seconds loading time at -12 °C (10.4 °F) for Superpave projects ..... 38
3-7 MSCR average recovery at 64 °C (147.2 °F) for Superpave projects .................. 40
3-8 MSCR nonrecoverable compliance at 64 °C (147.2 °F) for Superpave projects .. 41
3-9 Measuring, cataloguing, and inspecting work for field cores ................................ 43
3-10 Cut specimens for Superpave IDT tests ............................................................... 43
3-11 Cutting machine used in this study ....................................................................... 44
3-12 Gage points attachment ....................................................................................... 44
3-13 Superpave IDT tests ............................................................................................ 45
3-14 Power model of creep compliance ....................................................................... 47
3-15 Determination of fracture energy and dissipated creep strain energy to failure ... 49
3-16 Change in resilient modulus over time ................................................................. 52
10
3-17 Change in creep compliance over time ................................................................ 53
3-18 Change in creep rate over time ............................................................................ 54
3-19 Change in tensile strength over time .................................................................... 55
3-20 Change in failure strain over time ......................................................................... 56
3-21 Change in fracture energy over time .................................................................... 57
3-22 Change in air voids over time ............................................................................... 60
3-23 Initial rate of reduction in normalized fracture energy over time ........................... 61
3-24 Initial rate of reduction in normalized energy ratio over time ................................ 62
4-1 Initial fracture energy and creep rate for Superpave projects evaluated .............. 66
4-2 Field rutting performance for Superpave projects evaluated ................................ 71
4-3 Rutting performance evaluation using DASR-IC parameters ............................... 73
4-4 Determination of observed crack initiation time for Project 1 and 2 ...................... 74
4-5 Field cracking performance for Superpave projects evaluated ............................ 75
4-6 Cracking performance evaluation using DASR-IC parameters ............................ 77
5-1 Schematic plot for AC stiffness at surface vs. age ............................................... 82
5-2 Schematic plot for creep rate vs. age ................................................................... 83
5-3 Schematic plot for normalized change in AC stiffness vs. age ............................. 84
5-4 Schematic plot for FE limit vs. age ....................................................................... 85
5-5 Two material property relationships ..................................................................... 86
5-6 FE limit aging curve at different initial FE (k1=3 (Roque et al. 2010)) ................... 88
5-7 Flowchart for development of predictive material property relationships .............. 89
5-8 Relationship between initial fracture energy and DASR porosity ......................... 90
5-9 Relationship between initial fracture energy and disruption factor ....................... 91
5-10 Relationship between initial fracture energy and effective film thickness ............. 91
5-11 Predicted vs. measured initial fracture energy ..................................................... 92

11
5-12 Relationship between initial creep rate and DASR porosity ................................. 93
5-13 Relationship between initial creep rate and DF .................................................... 94
5-14 Relationship between initial creep rate and EFT .................................................. 94
5-15 Relationship between initial creep rate and CFA/FFA .......................................... 95
5-16 Effect of polymer modification on relationship between initial creep rate and CFA/FFA ............................................................................................................ 96
5-17 Relationship between initial creep rate and viscosity ........................................... 97
5-18 Relationship between initial creep rate and effective asphalt content .................. 97
5-19 Relationship between initial creep rate and G*∙sinδ ............................................. 98
5-20 Proposed AC stiffness model ............................................................................. 100
5-21 Proposed FE limit model .................................................................................... 102
6-1 General framework of the HMA-FM-E model ..................................................... 105
6-2 Predicted crack amount increase over time using HMA-FM-E model ................ 110
6-3 Relationships between DASR-IC criteria and field cracking performance .......... 112
A-1 Determination of observed crack initiation time for Project 1 and 2 ................... 118
A-2 Determination of observed crack initiation time for Project 3 and 4 ................... 118
A-3 Determination of observed crack initiation time for Project 5 and 6 ................... 119
A-4 Determination of observed crack initiation time for Project 7 and 8 ................... 119
A-5 Determination of observed crack initiation time for Project 9 and 10 ................. 120
A-6 Determination of observed crack initiation time for Project 11 and 12 ............... 120

12
LIST OF ABBREVIATIONS
AASHTO American Association of State Highway and Transportation Officials
AC Asphalt Concrete
APT Accelerated Pavement Testing
ASTM American Society for Testing and Materials
BBR Bending Beam Rheometer
CFA/FFA Ratio of Coarse Fine Aggregate to Fine Fine Aggregate
DASR Dominant Aggregate Size Range
DF Disruption Factor
DSR Dynamic Shear Rheometer
EAC Effective Asphalt Content
EFT Effective Film Thickness
ESAL Equivalent Single Axle Load
FDOT Florida Department of Transportation
FWD Falling Weight Deflectometer
JMF Job-Mix-Formula
HMA Hot-Mix Asphalt
HMA-FM-E Enhanced Hot-Mix Asphalt Fracture Mechanics Based Model
IA Independent Assurance
IC Interstitial Component
IDT Indirect Tension Test
ITLT Indirect Tension Test at Low Temperatures
IV Interstitial Volume
MEPDG Mechanistic Empirical Pavement Design Guide
MSCR Multiple Stress Creep Recovery
13
NCHRP National Cooperative Highway Research Program
PAV Pressure Aging Vessel
PG Performance Grade
QA Quality Assurance
QC Quality Control
TCE Trichloroethylene
TF Theoretical Film Thickness
UF University of Florida
VMA Voids in Mineral Aggregate

14
Abstract of Dissertation Presented to the Graduate School of the University of Florida in Partial Fulfillment of the Requirements for the Degree of Doctor of Philosophy
EFFECT OF MIXTURE COMPONENT CHARACTERISTICS ON PROPERTY AND
PERFORMANCE OF SUPERPAVE MIXTURES
By
Sanghyun Chun
August 2012
Chair: Reynaldo Roque Major: Civil Engineering
This study was conducted to evaluate the effect of mixture component
characteristics (i.e. DASR and IC) on properties and performance of Superpave
mixtures, specializing in the development of a set of implementable gradation and
volumetric criteria, and Hot-Mix-Asphalt (HMA) mixture property predictive relationships
based on mixture component characterization.
Four DASR-IC model parameters including DASR porosity, DF, EFT, and
CFA/FFA have formed the DASR-IC criteria to effectively address the two primary
components (i.e. DASR and IC) of asphalt mixtures that play a major role on properties
and performance. Field performance evaluation of different Superpave mixtures was
conducted to identify the relationships between the four DASR-IC parameters and field
performance. Based on results analyzed, it was found that the introduction of DASR-IC
criteria as performance-related design parameters to current mix design guidelines and
specifications will lead to better and more consistent field rutting and cracking
performance of Superpave mixtures.
In addition, the DASR-IC criteria will also provide a more rational method to
consider the effect of DASR and IC on mixture behavior which strongly affects HMA

15
fracture properties. Therefore, it is expected that this criteria will have a potential to
identify the effect of mixture gradation and volumetric characteristics on mixture fracture
properties which is more reliably related to performance of asphalt mixtures.
Relationships able to predict initial fracture energy and creep rate, which are the
properties known to govern the change in material property over time and are also
required for performance model predictions, were developed in this study.
Furthermore, conceptual relationships were identified to describe changes in these
properties over time (aging) by including the effect of the non-healable permanent
damage related to load and moisture. This can serve as the foundation for further
development of improved models to predict mixture properties as a function of age in
the field based on additional field data and laboratory studies using more advanced
laboratory conditioning procedures. The verified relationships will also serve to provide
reliable inputs for prediction of service life using pavement performance prediction
models.

16
CHAPTER 1 INTRODUCTION
1.1 Background
It is now generally agreed that aggregate gradation is one of the most important
factors that affects the properties and performance of asphalt mixtures. Having suitable
gradation characteristics including appropriate aggregate particle size distribution and
resulting volumetric properties is obviously important to ensure good field mixture
performance. Therefore, aggregate related parameters have been studied to identify
their effects on observed field performance of asphalt mixtures. Although different
parameters, including effective film thickness and other volumetric parameters were
found to affect mixture performance, consensus has not been reached regarding
rational design guidelines and criteria, especially as related to the selection of the best
aggregate blend to achieve optimal performance.
The Superpave field monitoring project recently completed at the University of
Florida has determined that existing mix design criteria included in Superpave system
such as Voids in Mineral Aggregate (VMA), gradation control points, and effective
asphalt content do not capture all critical aspects of gradation and resulting volumetric
properties found to be most strongly related to field mixture performance (Roque et Al.,
2011). Thereby, Superpave mixture performance varied significantly among mixtures
that met all existing design and construction specification criteria. Therefore, there was
a need to identify and verify additional criteria that can assure better and more
consistent Superpave mixture performance. It was also found that differences in
performance could not explained by differences in binder properties between mixtures.

17
It appeared that differences in performance were primarily controlled by differences in
gradation and resulting volumetric properties between mixtures.
According to previous work conducted by University of Florida researchers,
gradation characteristics of mixture can be expressed by separating the gradation into
two major components: Dominant Aggregate Size Range (DASR) and Interstitial
Component (IC) (After Kim et al., 2006). It has been shown that parameters describing
the characteristics of these components, which were determined based on packing
theory and particle size distributions, seemed to be well correlated to mixture
performance. Kim et al. (2006) indicated in their research that porosity can be used as a
criterion to ensure contact between DASR particles within the asphalt mixture to provide
adequate interlocking and resistance to deformation and fracture. The work has clearly
shown that DASR porosity can be used as an indicator which reflects the characteristics
of coarse aggregate structure. The schematic of the DASR and IC concept for three
different types of mixtures is illustrated in Figure 1-1.
IC
DASR
IC
DASR
(a) SMA Mixture (b) Coarse Dense Mixture (c) Fine Dense Mixture
Figure 1-1. DASR and IC for three different types of mixture (After Kim et al., 2006)
The work has also concluded that properties and characteristics of IC will strongly
influence rutting and cracking resistance of asphalt mixtures. For the purpose of IC

18
characterization, a new parameter called Disruption Factor (DF) was conceived and
developed by Guarin (2009) to evaluate the potential of IC particles to disrupt the DASR
structure. It was found that DF appeared to be one good indicator to describe IC
characteristics with respect to volumetric distribution of IC. However, DF only considers
volumetric distribution of IC to determine the potential of the finer portion of the
mixture’s gradation (i.e., IC) to disrupt the DASR structure. Therefore, there was a need
to identify and develop additional parameters to more effectively characterize the IC of
asphalt mixture with regard to stiffening effect of IC on mixture and structure of IC.
1.2 Hypothesis
Since there was a need to address more aspects of IC characteristics to better
capture the effects of IC on key mixture properties and expected performance, two new
parameters, effective film thickness (EFT) and ratio of coarse fine aggregate to fine fine
aggregate (CFA/FFA), were added in addition to DF in this study for further IC
characterization. It was expected that these two parameters will provide a more rational
way to identify mixture behavior as mastic which is considered to strongly affect Hot-Mix
Asphalt (HMA) fracture properties. Therefore, the addition of EFT and CFA/FFA will give
a more potential to identify the effect of IC characteristics on properties which is more
reliably related to performance of asphalt mixtures. The following two hypotheses were
made in this study.
Interstitial component (IC) characteristics related to the aggregate structure and binder distribution within the IC have an important effect on mixture fracture properties as well as on pavement cracking performance.
Gradation and volumetric parameters that effectively characterize the DASR and IC can be used to predict mixture fracture properties.

19
1.3 Objectives
The primary objective of this study is to evaluate the effect of mixture component
characteristics (i.e., DASR and IC) on properties and performance of Superpave
mixtures. Detailed objectives are summarized as follows.
Further develop the DASR-IC criteria to more effectively characterize both coarse (DASR) and fine (IC) portions of mixture gradation and resulting volumetric properties that play a major role on mixture performance.
Evaluate and verify the DASR-IC criteria as an effective and implementable set of gradation and volumetric criteria for mixture design and construction specification that can help to assure better and more consistent field mixture performance.
Identify key mixture component characteristics associated with mixture fracture properties and changes in these properties (i.e., fracture energy and creep rate) over time.
Develop predictive relationships for mixture fracture properties, specifically fracture energy and creep rate, which have shown to strongly affect (or influence) pavement cracking performance in the field.
Identify and further develop improved forms of the HMA fracture property aging model in an effort to more accurately predict pavement cracking performance.
1.4 Scope
Eleven Superpave monitoring project field sections were evaluated including
different types of gradation, aggregate, and asphalt binder. It is noted that fairly wide
ranges of Superpave mixture were evaluated in this study. All mixture data were
obtained or determined from field cores including gradation, binder properties,
volumetric properties, and mixture properties. The standard University of Florida (UF)
Superpave Indirect Tension Tests (IDT) were performed at 10 °C and 20 °C, to obtain
the HMA fracture properties of the different Superpave mixtures used for evaluation.
Enhanced Hot-Mix Asphalt Fracture Mechanics Based Model (HMA-FM-E) was
20
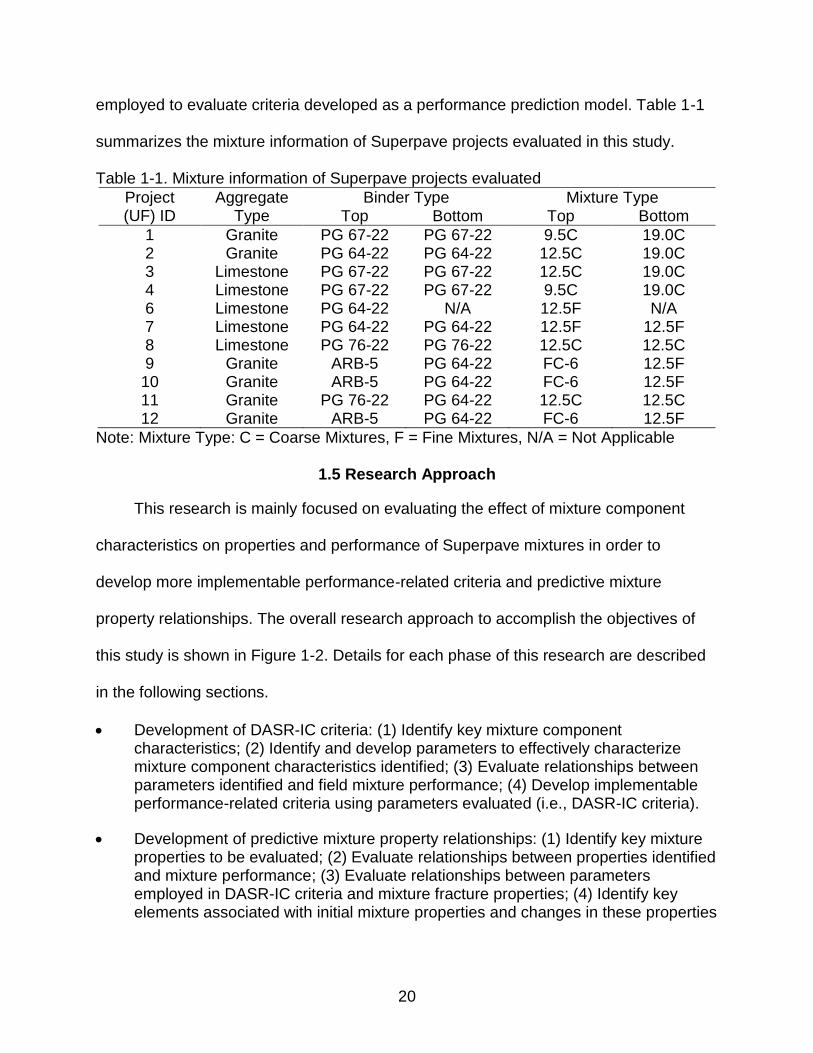
employed to evaluate criteria developed as a performance prediction model. Table 1-1
summarizes the mixture information of Superpave projects evaluated in this study.
Table 1-1. Mixture information of Superpave projects evaluated
Project (UF) ID
Aggregate Type
Binder Type Mixture Type Top Bottom Top Bottom
1 Granite PG 67-22 PG 67-22 9.5C 19.0C 2 Granite PG 64-22 PG 64-22 12.5C 19.0C 3 Limestone PG 67-22 PG 67-22 12.5C 19.0C 4 Limestone PG 67-22 PG 67-22 9.5C 19.0C 6 Limestone PG 64-22 N/A 12.5F N/A 7 Limestone PG 64-22 PG 64-22 12.5F 12.5F 8 Limestone PG 76-22 PG 76-22 12.5C 12.5C 9 Granite ARB-5 PG 64-22 FC-6 12.5F 10 Granite ARB-5 PG 64-22 FC-6 12.5F 11 Granite PG 76-22 PG 64-22 12.5C 12.5C 12 Granite ARB-5 PG 64-22 FC-6 12.5F
Note: Mixture Type: C = Coarse Mixtures, F = Fine Mixtures, N/A = Not Applicable
1.5 Research Approach
This research is mainly focused on evaluating the effect of mixture component
characteristics on properties and performance of Superpave mixtures in order to
develop more implementable performance-related criteria and predictive mixture
property relationships. The overall research approach to accomplish the objectives of
this study is shown in Figure 1-2. Details for each phase of this research are described
in the following sections.
Development of DASR-IC criteria: (1) Identify key mixture component characteristics; (2) Identify and develop parameters to effectively characterize mixture component characteristics identified; (3) Evaluate relationships between parameters identified and field mixture performance; (4) Develop implementable performance-related criteria using parameters evaluated (i.e., DASR-IC criteria).
Development of predictive mixture property relationships: (1) Identify key mixture properties to be evaluated; (2) Evaluate relationships between properties identified and mixture performance; (3) Evaluate relationships between parameters employed in DASR-IC criteria and mixture fracture properties; (4) Identify key elements associated with initial mixture properties and changes in these properties

21
over time (aging); (5) Develop predictive relationships for initial mixture properties; (6) Develop improved forms of mixture property aging model.
Evaluation of criteria developed: (1) Evaluate criteria developed using performance prediction model (HMA-FM-E model); (2) Validate and refine criteria developed using additional field and laboratory data.
Figure 1-2. Overall research approach flowchart
22
CHAPTER 2 CHARACTERIZATION OF MIXTURE GRADATION AND RESULTING VOLUMETRIC
PROPERTIES (DOMINANT AGGREGATE SIZE RANGE-INTERSTITIAL COMPONENT (DASR-IC) MODEL)
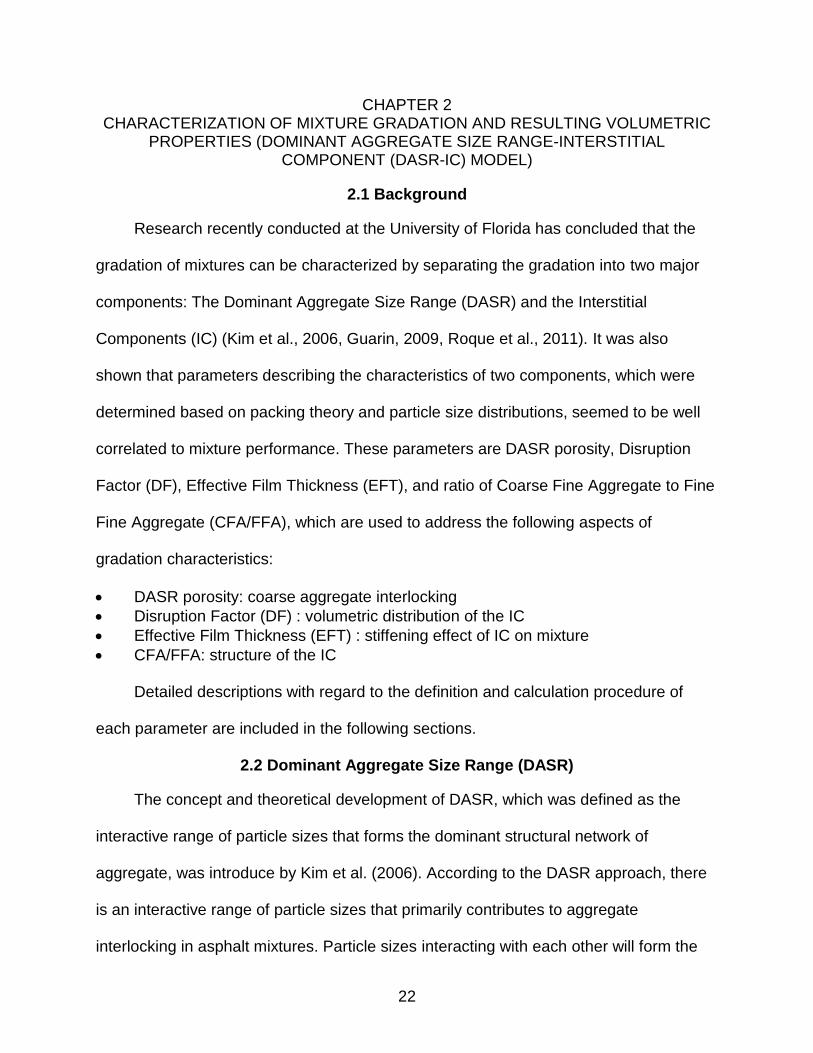
2.1 Background
Research recently conducted at the University of Florida has concluded that the
gradation of mixtures can be characterized by separating the gradation into two major
components: The Dominant Aggregate Size Range (DASR) and the Interstitial
Components (IC) (Kim et al., 2006, Guarin, 2009, Roque et al., 2011). It was also
shown that parameters describing the characteristics of two components, which were
determined based on packing theory and particle size distributions, seemed to be well
correlated to mixture performance. These parameters are DASR porosity, Disruption
Factor (DF), Effective Film Thickness (EFT), and ratio of Coarse Fine Aggregate to Fine
Fine Aggregate (CFA/FFA), which are used to address the following aspects of
gradation characteristics:
DASR porosity: coarse aggregate interlocking
Disruption Factor (DF) : volumetric distribution of the IC
Effective Film Thickness (EFT) : stiffening effect of IC on mixture
CFA/FFA: structure of the IC
Detailed descriptions with regard to the definition and calculation procedure of
each parameter are included in the following sections.
2.2 Dominant Aggregate Size Range (DASR)
The concept and theoretical development of DASR, which was defined as the
interactive range of particle sizes that forms the dominant structural network of
aggregate, was introduce by Kim et al. (2006). According to the DASR approach, there
is an interactive range of particle sizes that primarily contributes to aggregate
interlocking in asphalt mixtures. Particle sizes interacting with each other will form the
23
primary structure to resist deformation and fracture. Particle sizes smaller than the
DASR will serve to fill the voids between DASR particles, called the interstitial volume.
The IC particles combined with binder form a secondary structure to help resist
deformation and fracture, and it is the primary source of adhesion and resistance to
tension. Particle sizes larger than the DASR will simply float in the DASR matrix and will
not play a major role in the aggregate structure.
The DASR, which is determined by conducting particle interaction analysis based
on packing theory, can be composed of one size or multiple sizes. It was concluded that
the DASR should be composed of coarse enough particles, and that all contiguous
particle sizes determined to be interactive can be considered as part of the DASR.
2.3 DASR Porosity
Porosity has been widely used in the field of soil mechanics as a dimensionless
parameter that indicates the relative ratio of voids to total volume. It has been
determined that the porosity of granular materials should be no greater than 50 % for
particles to have contact with each other (i.e. to be interactive) (Lambe and Whitman,
1969). Research conducted by Kim et al. (2006) indicated that porosity can be used as
a criterion to ensure contact between DASR particles within the asphalt mixture to
provide adequate interlocking and resistance to deformation and fracture.
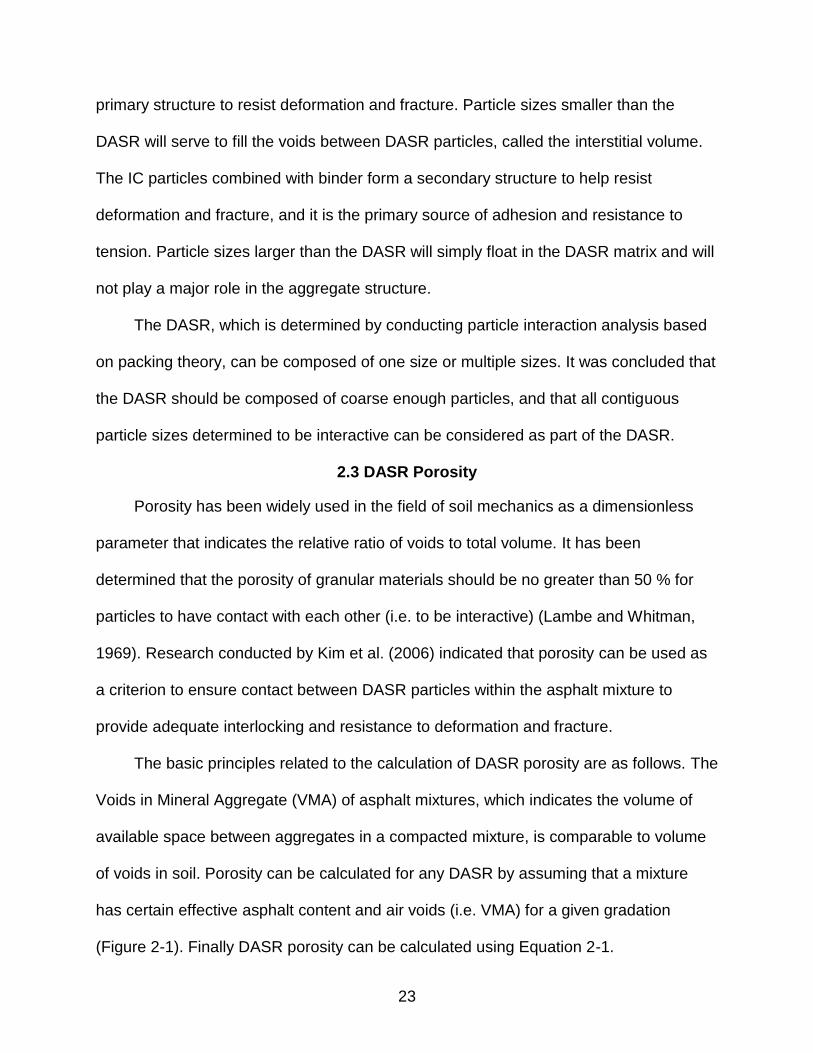
The basic principles related to the calculation of DASR porosity are as follows. The
Voids in Mineral Aggregate (VMA) of asphalt mixtures, which indicates the volume of
available space between aggregates in a compacted mixture, is comparable to volume
of voids in soil. Porosity can be calculated for any DASR by assuming that a mixture
has certain effective asphalt content and air voids (i.e. VMA) for a given gradation
(Figure 2-1). Finally DASR porosity can be calculated using Equation 2-1.

24
Figure 2-1. Mixture components for calculation of DASR porosity (Kim et al., 2006)
(2-1)
Where, ηDASR = DASR porosity, VV(DASR) = volume of voids within DASR, VT(DASR) =
total volume available for DASR particles, VICAGG = volume of IC aggregates, VMA =
voids in mineral aggregate, VTM = total volume of mixture, VAGG>DASR = volume of
particles bigger than DASR.
2.4 Interstitial Component (IC) of Mixture Gradation
As illustrated in Figure 1-1, the interstitial component is the material including
asphalt, fine aggregates, and air voids that exists within the interstices of the DASR,
and volume of this material is considered as the interstitial volume (IV). Research
conducted by Guarin (2009) concluded that properties and characteristics of the IC will
strongly influence the rutting and cracking resistance of asphalt mixtures.
The IC should fill the voids within the aggregates larger than the IC without
disrupting the DASR structure. As the DASR-IC model assumes that the particles bigger
than the DASR are floating in the DASR structure, it would be reasonable to accept that
DASRAGGTM
ICAGG
DASRT
DASRV
DASRVV
VMAV
V
V
)(
)(
25
the effect of the DASR voids structure could be utilized to evaluate the total voids
structure for the IC including the particles bigger than the DASR. Information on the IC
characteristics is fundamental to understand and predict how the IC will fit into the IV
and consequently to determine whether the DASR structure would be disrupted by the
IC. The characteristics of the IC are expected to have a strong influence on key mixture
properties including fracture energy and creep rate, as well as property changes due to
aging. Therefore, it was expected that DASR-IC parameters would correlate well with
the mixture performance, including rutting and cracking.
2.5 Disruption Factor (DF)
A new parameter called the Disruption Factor (DF) was conceived and developed
by Guarin (2009) to determine the potential of the finer portion of the mixture’s gradation
to disrupt the DASR structure. It was shown in laboratory studies that the DF can
effectively evaluate the potential of IC particles to disrupt the DASR structure. DF can
be calculated using the following equation.
(2-2)
Guarin also proffered an optimal DF range to attain better rutting and cracking
performance of asphalt mixture. According to the DF approach, the IC aggregates
would not be involved in transmitting load between the DASR aggregates if the DF is
low. In this case, the DASR structure would get no additional support or benefit from the
IC particles. In the case of high DF, mixture performance would be negatively affected
because the DASR structure would be disrupted by the IC aggregates. Lastly, if the DF
is in the optimal range, better mixture performance would be expected because the IC
aggregates will be involved in resisting shear stresses with the DASR structure.
voidsDASRofVolume
particlesICdistuptiveypotentiallofVolumeDF
26
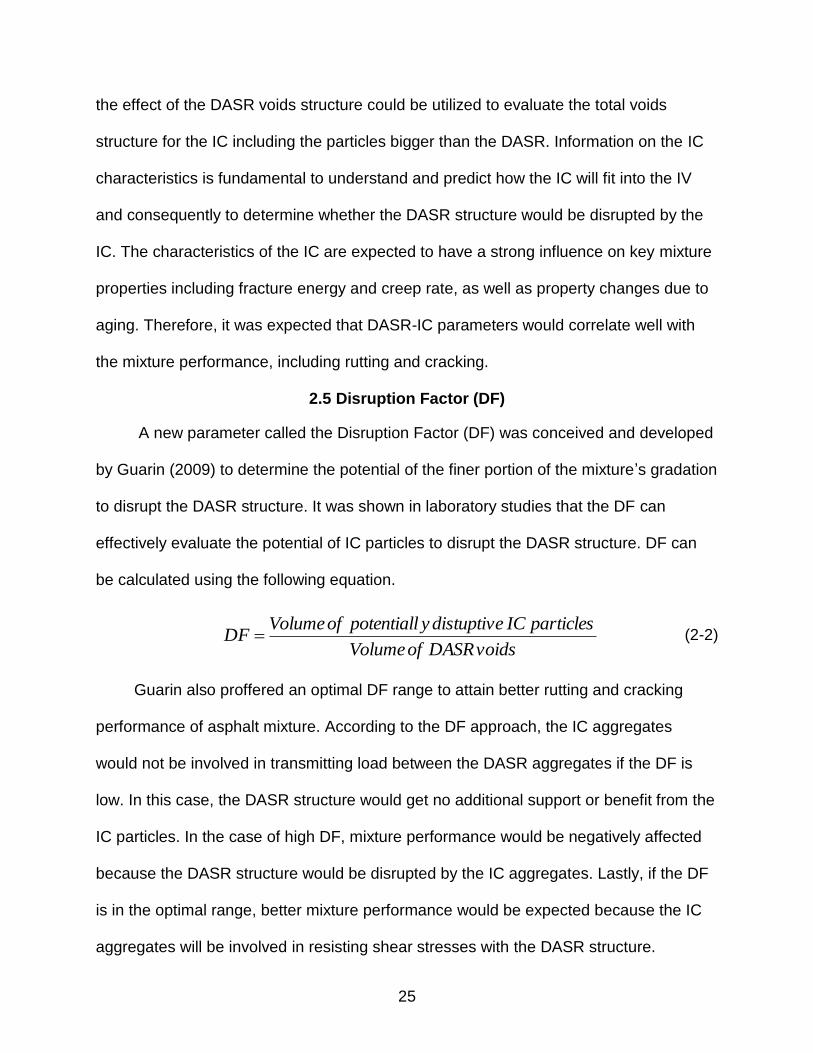
Therefore, it is expected that the DF will appear to be one good indicator to describe the
IC characteristics with respect to the volumetric distribution of IC particles, and a link
between the DF and material properties which are related to the performance of asphalt
mixtures. Figure 2-2 is a pictorial representation of the different configurations of DF
values: low, optimal, and high.
(a) DF < Optimal DF range (b) DF = Optimal DF range (c) DF > Optimal DF range Figure 2-2. Configuration of different DF values (Guarin, 2009)
2.6 Effective Film Thickness (EFT)
The film thickness of asphalt mixtures has been used to help explain aging
phenomena, and many researchers have attempted to evaluate the relationship
between film thickness and mixture performance. Kandhal and Chakraborty (1996) have
shown that this parameter can be utilized as an indicator to characterize the durability
and fatigue resistance of asphalt mixtures. However, it is still controversial with regard
to its application in the mix design of HMA. More importantly, Superpave system does
not have any requirements or guidelines regarding film thickness.
Typically, apparent film thickness (or theoretical film thickness, TF), which is
calculated by dividing the effective binder volume by the surface area of the aggregates,
has been used for film thickness analysis. However, many researchers have questioned
the relevance of this concept because it may not represent the distribution of binder in
27
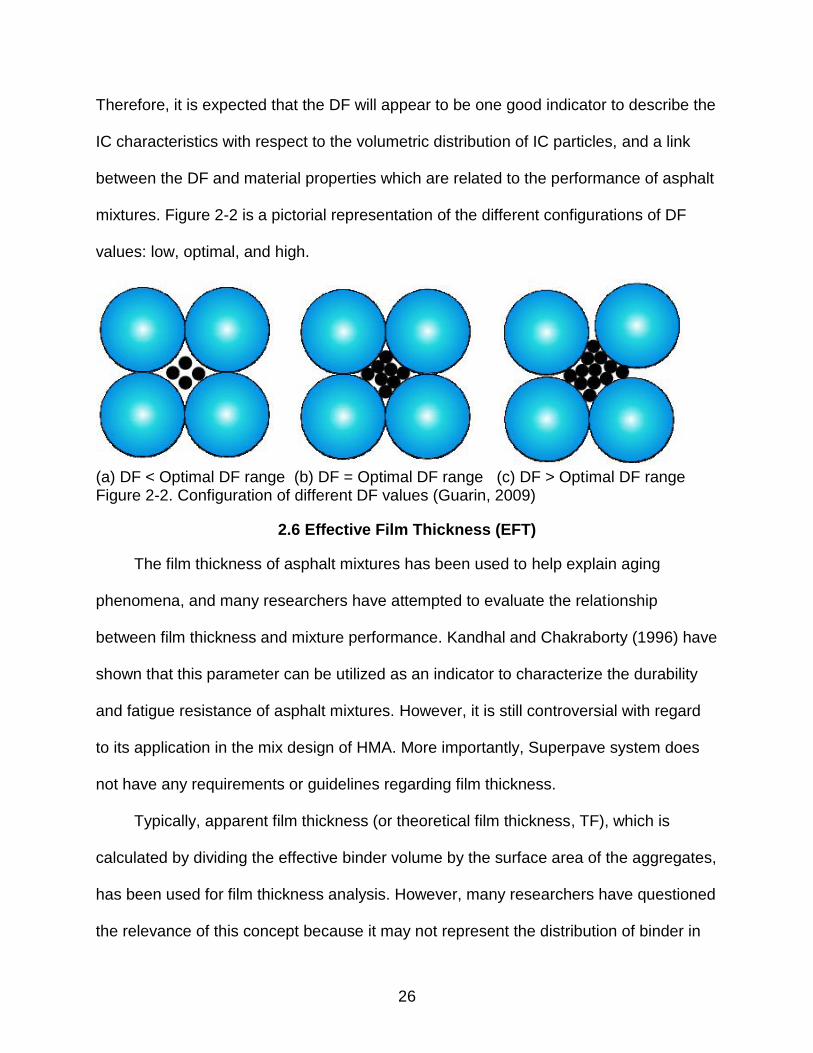
the mixture. Nukunya et al. (2001) introduced a new concept of effective film thickness
(EFT), which can be calculated by using the effective volumetric properties of asphalt
mixture. They concluded that the effective volumetric properties including the EFT seem
to effectively evaluate aging effects and correlated well with mixture properties.
In this study, the EFT was selected to act as a surrogate to stiffening effect of
interstitial component on mixture. Figure 2-3 is a pictorial representation of the
difference between EFT and TF. The EFT can be calculated by using the following
equation.
(2-3)
Where, Vbe = effective volume of asphalt binder, SA = surface area of fine
aggregate, WT = total weight of mixture, PFAGG = percent fine aggregate by mass of
total mixture, Pb = asphalt content percent by mass of total mixture, Abs = absorption,
PAGG = percent aggregate by mass of total mixture, Gb = Specific gravity of asphalt
binder.
EFT
Mastic: Fine Aggregate + Asphalt Binder
(a) Effective Film Thickness
TF
Asphalt Binder: Uniformly distributed over all aggregate particles
(b) Theoretical Film Thickness
Figure 2-3. Effective film thickness vs. theoretical film thickness
1000
100/)(
bAGG
AGGb
AGGT
be
GPFSA
PAbsP
PFWSA
VmicronsEFT

28
Adequate interstitial volume is important for mixtures to have sufficient strain
tolerance, which can be controlled by having an acceptable range of effective film
thickness (EFT). EFT of asphalt mixtures is related to the stiffening effect of IC on
mixture, and the fineness of the IC aggregates is the primary factor to control the EFT.
In this study, the parameter EFT was evaluated and used to establish a set of
performance-related design criteria and predictive relationships for fracture properties of
asphalt mixtures. It was expected that the EFT is associated with the time-dependent
response and brittleness of asphalt mixtures. For example, higher EFT results in higher
creep rate and higher fracture energy. Figure 2-4 shows a schematic that conceptually
illustrates how EFT affects mixture properties for two cases which have same
component materials.
σ1
σ1 σ1
σ1
Case 1
σ1
εA = σ1 /EAC
σ1
εB = (1/EAC)(σ1-νσ3)
Case 2
σ3
σ1
σ1 σ1
σ1
σ1
σ1
Case 1
σ1
εA = σ1 /EAC
σ1
εB = (1/EAC)(σ1-νσ3)
Case 2
σ3
Note: Then εA > εB, therefore, EA < EB
Figure 2-4. Conceptual drawing of film thickness effect
The white color portion of Figure 2-4 shows the asphalt binder part, while the gray
color portion represents the aggregates. In the case of thicker EFT represented by case
1, material will tolerate higher strain (i.e. less brittle) than the thinner EFT (case 2) and it

29
will generally be broken by micro-damage development with high strain at low stress
level. However, in the case of thinner EFT described by case 2, material will exhibit less
strain tolerance and failed in a brittle manner with low strain at high stress (local stress)
level. Therefore, mixtures should have an acceptable range of EFT for adequate strain
tolerance and EFT can be controlled by limiting fineness of fine aggregate portion (i.e.
IC) of mixture’s gradation.
2.7 Ratio between Coarse Portion and Fine Portion of Fine Aggregates (CFA/FFA)
Preliminary analyses indicated that the fineness of the fine aggregate portion of
the interstitial components was strongly related to effective film thickness. However,
EFT does not reflect the effect of particle interaction within the IC, which could be one
important factor for IC characterization. Therefore, a new parameter CFA/FFA, which is
the ratio between the coarse portion and fine portion of the IC particles, was introduced
to characterize the structure of the IC of mixture’s gradation.
0
10
20
30
40
50
60
70
80
90
100
(Sieve Size)0.45
% P
ass
ing
19.012.59.5#4#8#16#200
CFA
DASR
FFA
IC
IC DASR
● High CFA/FFA
- Too coarse
- High creep rate
● Low CFA/FFA
- Too fine
- High creep rate
FFA CFA
Figure 2-5. Determination of CFA/FFA

30
In this study, CFA/FFA was used as an indicator to represent the fineness and
aggregate structure of the IC. It was hypothesized that CFA/FFA was related to the
creep response or time-dependent response of asphalt mixture. Figure 2-5 describes
the basic principle of determining the CFA/FFA.
2.8 Summary
For DASR-IC characterization, two existing parameters including DASR porosity
and DF, and two more parameters including EFT and CFA/FFA were newly added,
especially for further IC characterization. Finally, four parameters identified including
DASR porosity, DF, EFT, and CFA/FFA have formed the DASR-IC criteria to effectively
address the two primary components of asphalt mixtures (i.e. both coarse (DASR) and
fine (IC) portions of mixture gradation and resulting volumetric properties) that play a
major role on properties and performance. These parameters (i.e. four DASR-IC
parameters) were used for evaluation conducted in this study.
31
CHAPTER 3 IMPLEMENTATION OF BINDER AND MIXTURE TESTS ON FIELD CORES FOR
SUPERPAVE MIXTURES IN FLORIDA
3.1 Background
Binder and mixture tests on field cores were conducted to determine binder and
mixture properties for different Superpave projects in Florida. The information obtained
was used to establish reasonable and effective mixture design guidelines and criteria,
performance-related laboratory properties, and parameters, and predictive mixture
property relationships. All binder tests were performed according to FDOT test methods,
and HMA fracture mechanics model was used to analyze mixture test results.
3.2 Binder Recovery and Binder Tests
Asphalt binder recoveries and binder tests were conducted for cores obtained from
different Superpave projects. Binder tests, including penetration test at 25 °C, viscosity
test at 60 °C, dynamic shear rheometer (DSR) test, bending beam rheometer (BBR) test,
and multiple stress creep recovery (MSCR) test, were performed in this study. The
binder testing plan is summarized below, and Table 3-1 represents the asphalt binder
used on the Superpave projects evaluated.
Penetration test at 25 °C (77 °F)
Viscosity test at 60 °C (140 °F)
Dynamic shear rheometer (DSR) test at 25 °C (77 °F)
Bending beam rheometer (BBR) test at -12 °C (10.4 °F)
Multiple stress creep recovery (MSCR) test at 64 °C (147.2 °F)
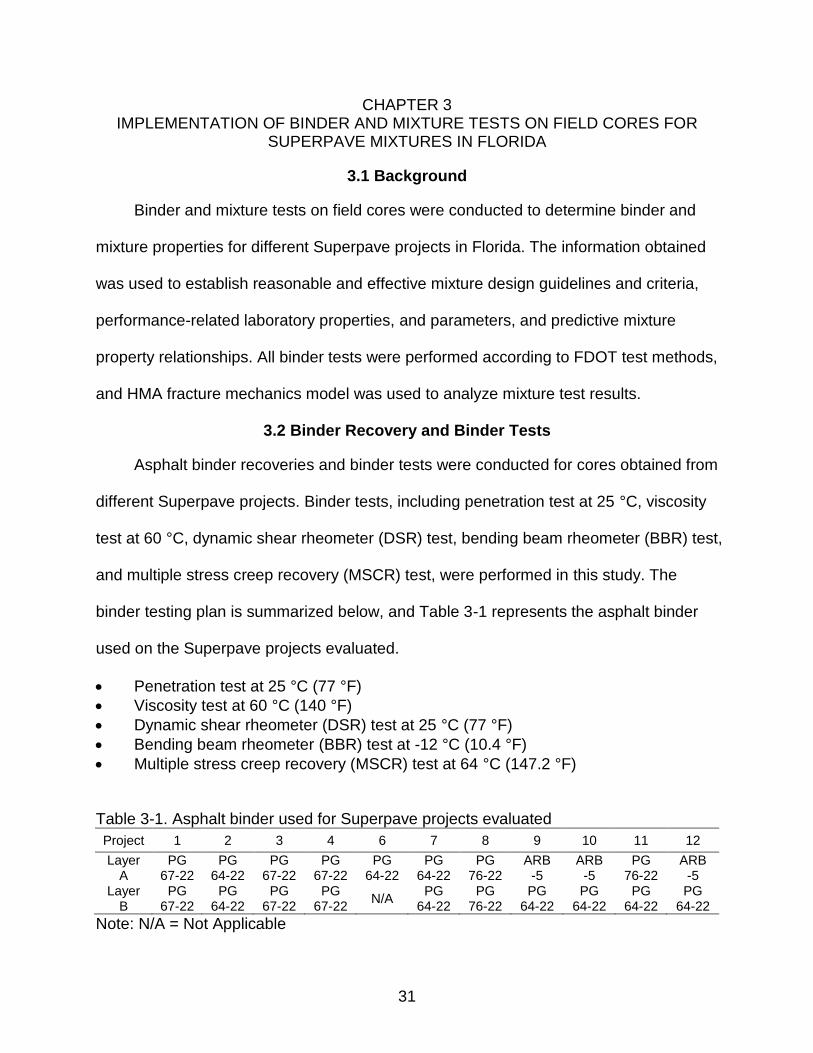
Table 3-1. Asphalt binder used for Superpave projects evaluated
Project 1 2 3 4 6 7 8 9 10 11 12
Layer A
PG 67-22
PG 64-22
PG 67-22
PG 67-22
PG 64-22
PG 64-22
PG 76-22
ARB -5
ARB -5
PG 76-22
ARB -5
Layer B
PG 67-22
PG 64-22
PG 67-22
PG 67-22
N/A PG
64-22 PG
76-22 PG
64-22 PG
64-22 PG
64-22 PG
64-22
Note: N/A = Not Applicable
32
3.2.1 Binder Recovery
Asphalt recovery was performed by using the solvent extraction method for cut
cores obtained from the different Superpave projects, including Superpave top and
bottom layers which were denoted as layer A and B, respectively. Trichloroethylene
(TCE) was used as a solvent for binder recovery and the test procedure was carefully
followed to minimize any additional aging of the binder during the binder recovery
operation according to FDOT test methods.
3.2.2 Penetration Test
The penetration test is one of the oldest and simplest empirical tests used to
measure the consistency of asphalt binder. In general, penetration test is performed at
25 ˚C which is considered approximately representative value of average service
temperature for asphalt pavement. The depth of penetration is measured in units of 0.1
mm and reported in penetration units. For example, if the penetration depth of the
needle is 8 mm, the penetration number of asphalt binder is 80. The description and
practice of standard penetration test method is designated and reported in AASHTO T
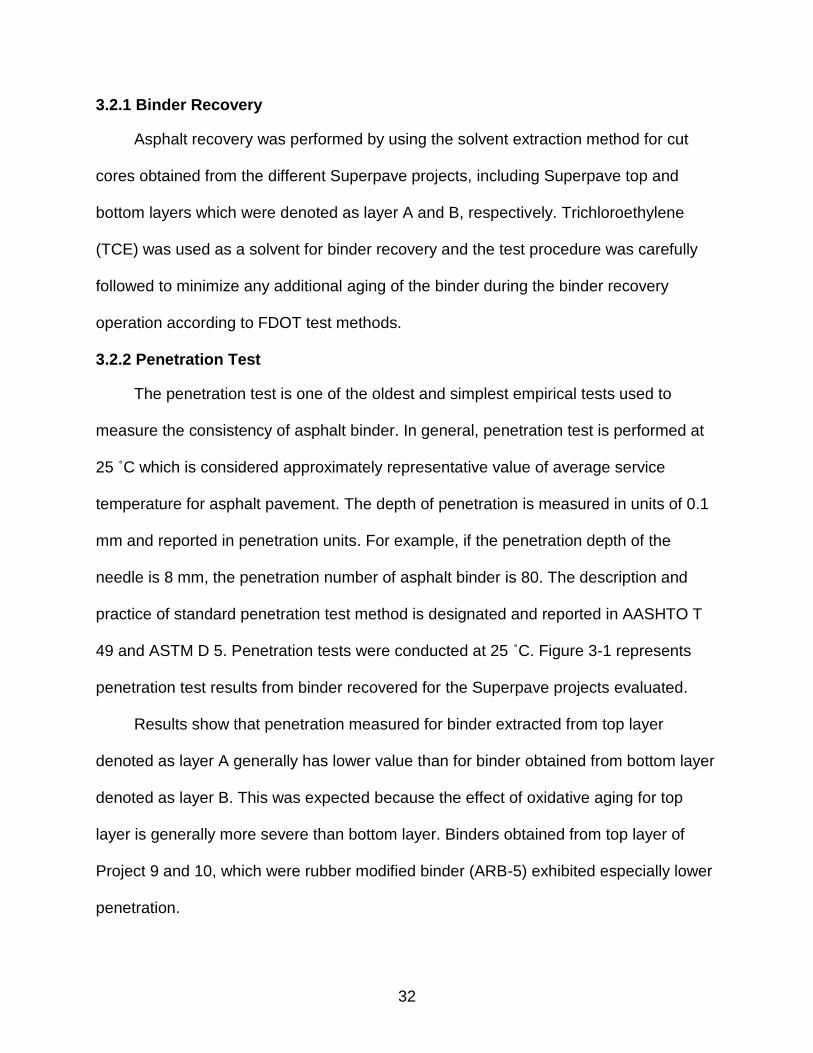
49 and ASTM D 5. Penetration tests were conducted at 25 ˚C. Figure 3-1 represents
penetration test results from binder recovered for the Superpave projects evaluated.
Results show that penetration measured for binder extracted from top layer
denoted as layer A generally has lower value than for binder obtained from bottom layer
denoted as layer B. This was expected because the effect of oxidative aging for top
layer is generally more severe than bottom layer. Binders obtained from top layer of
Project 9 and 10, which were rubber modified binder (ARB-5) exhibited especially lower
penetration.
33
Penetration Test Results for Superpave Projects
0
10
20
30
40
50
Project (UF) ID
Pen
etr
ati
on
at
25
oC
WP-Layer A
WP-Layer B
1(U) 2(C) 3(C) 4(C) 6(C) 7(U) 8(C) 9(C) 10(C) 11(U) 12(C)
Note: (C) = Cracked, (U) = Uncracked Figure 3-1. Penetration test results for Superpave projects
3.2.3 Viscosity Test
Viscosity represents the resistance to flow of a fluid and it can be simply defined
as the ratio of shear stress to shear rate. As opposed to other empirical tests including
penetration test, viscosity is a fundamental property. However, viscosity is generally
measured at only one temperature, so it does not cover the full range of construction
and service conditions.
Viscosity test is usually performed at 60 ˚C which is approximately considered to
be representative of the maximum in-service surface temperature of asphalt pavement.
The description and practice of standard absolute viscosity test method is described in
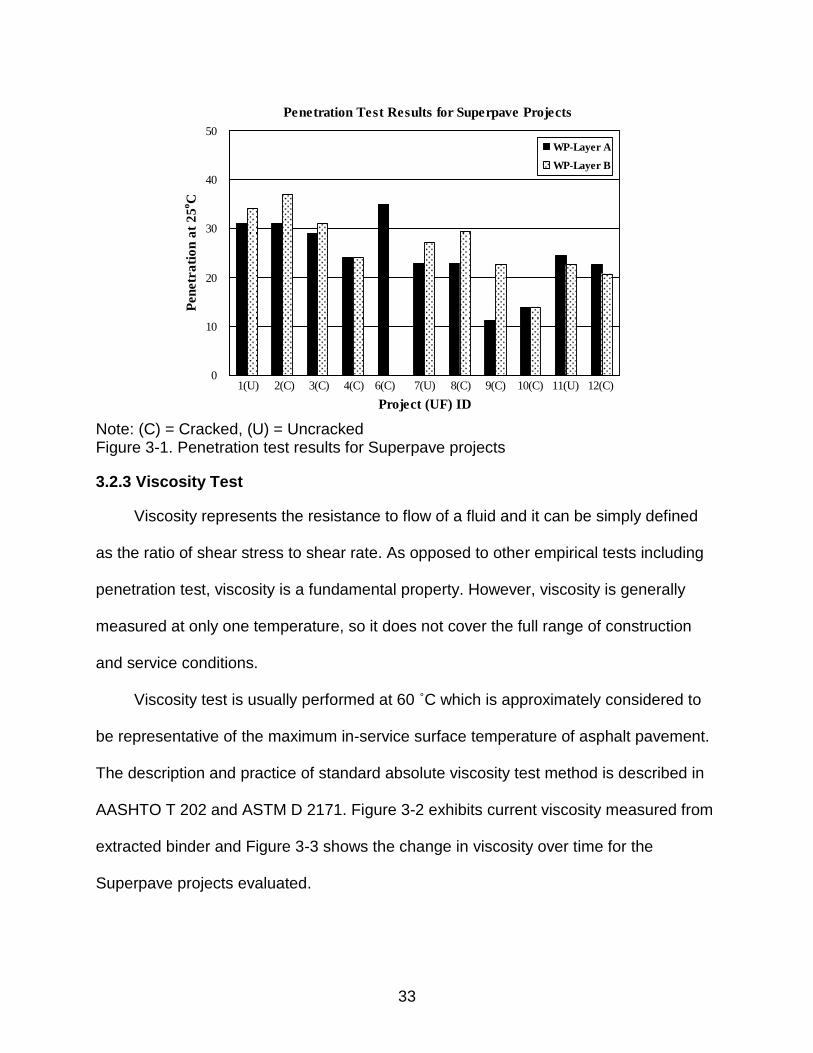
AASHTO T 202 and ASTM D 2171. Figure 3-2 exhibits current viscosity measured from
extracted binder and Figure 3-3 shows the change in viscosity over time for the
Superpave projects evaluated.

34
Viscosity Test Results for Superpave Projects
0
20000
40000
60000
80000
100000
120000
140000
160000
Project (UF) ID
Vis
co
sity
at
60
oC
, P
ois
es
WP-Layer A
WP-Layer B
1(U) 2(C)
(C)
3(C) 4(C) 6(C) 7(U) 8(C) 9(C) 10(C) 11(U) 12(C)
Note: (C) = Cracked, (U) = Uncracked Figure 3-2. Viscosity test results for Superpave projects
Change in Viscosity with Aging (Layer A)
0
20000
40000
60000
80000
100000
120000
140000
160000
0 2 4 6 8 10 12 14
Year Aged
Vis
co
sity
at
60
°C (
14
0°F
), P
ois
e
P1
P2
P3
P4
P6
P7
P8
P9
P10
P11
P12
(a) Layer A
35
Change in Viscosity with Aging (Layer B)
0
20000
40000
60000
80000
100000
120000
140000
160000
0 2 4 6 8 10 12 14
Year Aged
Vis
co
sity
at
60
°C (
14
0°F
), P
ois
e
P1
P2
P3
P4
P7
P9
P10
P11
P12
(b) Layer B
Note: (C) = Cracked, (U) = Uncracked Figure 3-3. Change in viscosity with aging for Superpave projects
Due to more severe effect of oxidative aging caused by higher surface
temperature, the top layer showed higher viscosity as well as higher rate of increase in
viscosity than the bottom layer. Specifically, top layer (Layer A) of Project 8 through 12
which included polymer modified (PG 76-22) and rubber modified binder (ARB-5)
sections indicated higher viscosity with around six to nine years of aging in the field.
Also, as indicated in Figure 3-3 (a), these sections showed higher rate of increase in
viscosity with aging.
3.2.4 Dynamic Shear Rheometer Test (DSR)
The dynamic shear rheometer (DSR) test is used in the Superpave system to
characterize the viscous and elastic behavior of asphalt binder at intermediate and high
service temperatures. The DSR measures the complex shear modulus G* and phase
angle δ of asphalt binder to determine the characteristics of elastic and viscous
components at pavement service temperatures. Specifically, G* and δ measured are
36
utilized as the indicators to predict two HMA distresses: rutting and fatigue cracking.
The description and practice of standard DSR test method is designated and reported in
AASHTO TP 5. In the Superpave asphalt binder specification, two parameters have
been chosen (G*/sinδ, and G*∙sinδ) for evaluation of rutting and fatigue cracking,
respectively.
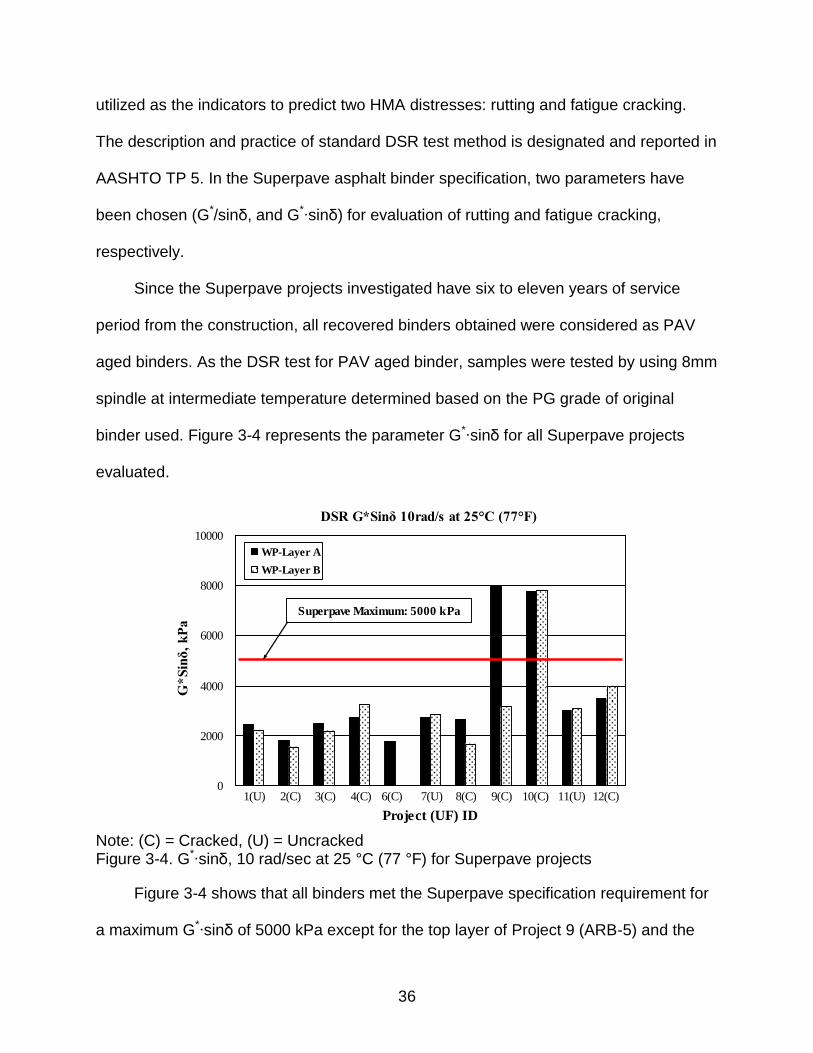
Since the Superpave projects investigated have six to eleven years of service
period from the construction, all recovered binders obtained were considered as PAV
aged binders. As the DSR test for PAV aged binder, samples were tested by using 8mm
spindle at intermediate temperature determined based on the PG grade of original
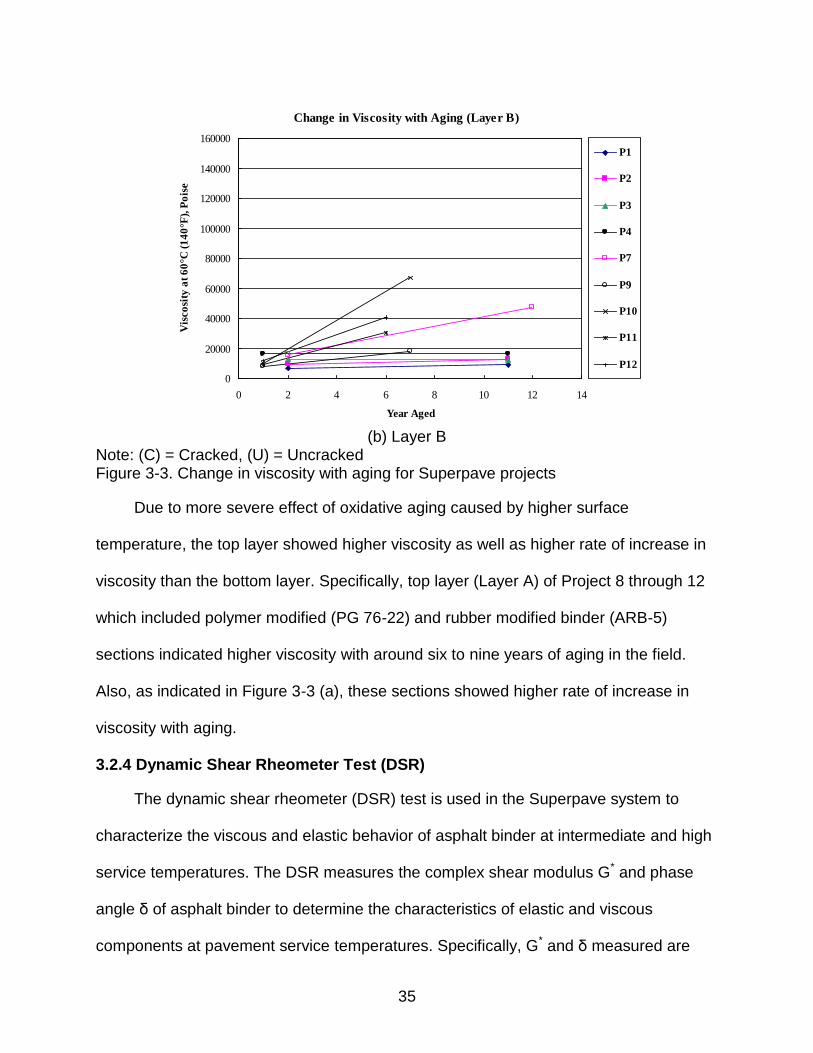
binder used. Figure 3-4 represents the parameter G*∙sinδ for all Superpave projects
evaluated.
DSR G*Sinδ 10rad/s at 25°C (77°F)
0
2000
4000
6000
8000
10000
Project (UF) ID
G*
Sin
δ,
kP
a
WP-Layer A
WP-Layer B
1(U) 2(C) 3(C) 4(C) 6(C) 7(U) 8(C) 9(C) 10(C) 11(U) 12(C)
Superpave Maximum: 5000 kPa
Note: (C) = Cracked, (U) = Uncracked Figure 3-4. G*∙sinδ, 10 rad/sec at 25 °C (77 °F) for Superpave projects
Figure 3-4 shows that all binders met the Superpave specification requirement for
a maximum G*∙sinδ of 5000 kPa except for the top layer of Project 9 (ARB-5) and the

37
top and bottom layer of Project 10 (Top: ARB-5. Bottom: PG 64-22). G*∙sinδ is typically
considered as an indicator of resistance to fatigue cracking because it indicates an
amount of energy dissipated meaning that higher G*∙sinδ is related to higher energy
loss. However, based on the results shown in Figure 3-4, and considering the cracking
performance, it appeared questionable whether the parameter G*∙sinδ was consistently
correlated with cracking performance of mixtures.
3.2.5 Bending Beam Rheometer Test (BBR)
The bending beam rheometer (BBR) test is used in the Superpave system to
determine the propensity of asphalt binders to thermal cracking at low temperatures.
The BBR calculates the creep stiffness of asphalt binder (S(t)) and the rate of change of
the stiffness (m-value). The creep stiffness (S(t)) is related to the thermal stresses
developed in the HMA pavement as a result of thermal contraction, while the slope of
the stiffness curve, m-value, is associated with the ability of HMA pavement to relieve
thermal stresses. In other words, m-value is an indicator of the binder’s ability to relax
stresses by asphalt binder flow. The Superpave binder specification requires a
maximum limit of creep stiffness and the minimum limit of m-value. The description and
practice of standard BBR test method is designated and reported in AASHTO TP 1.
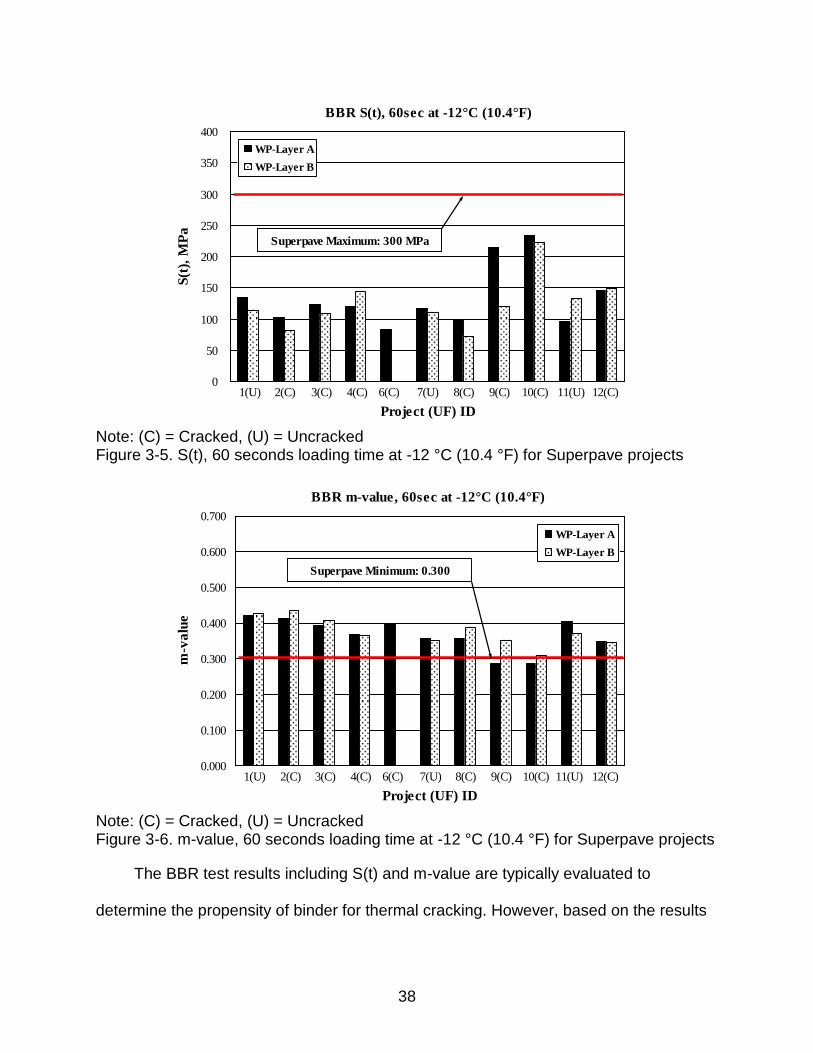
The BBR tests for PAV aged binder samples were tested at PG grade temperature
according to their original specification. Figures 3-5 and 3-6 represent the parameters
S(t) and m-value as a result of the BBR testing for all Superpave project sections,
respectively. Figure 3-5 shows that all binders met the Superpave specification
requirement for a maximum S(t) of 300 MPa. Figure 3-6 indicates that all binders also
met the Superpave specification requirement for a minimum m-value of 0.3 except for
the top layers of Project 9 (ARB-5) and Project 10 (ARB-5).
38
BBR S(t), 60sec at -12°C (10.4°F)
0
50
100
150
200
250
300
350
400
Project (UF) ID
S(t
), M
Pa
WP-Layer A
WP-Layer B
1(U) 2(C) 3(C) 4(C) 6(C) 7(U) 8(C) 9(C) 10(C) 11(U) 12(C)
Superpave Maximum: 300 MPa
Note: (C) = Cracked, (U) = Uncracked Figure 3-5. S(t), 60 seconds loading time at -12 °C (10.4 °F) for Superpave projects
BBR m-value, 60sec at -12°C (10.4°F)
0.000
0.100
0.200
0.300
0.400
0.500
0.600
0.700
Project (UF) ID
m-v
alu
e
WP-Layer A
WP-Layer B
1(U) 2(C) 3(C) 4(C) 6(C) 7(U) 8(C) 9(C) 10(C) 11(U) 12(C)
Superpave Minimum: 0.300
Note: (C) = Cracked, (U) = Uncracked Figure 3-6. m-value, 60 seconds loading time at -12 °C (10.4 °F) for Superpave projects
The BBR test results including S(t) and m-value are typically evaluated to
determine the propensity of binder for thermal cracking. However, based on the results

39
shown by Figure 3-5 and 3-6, it appeared also questionable whether the parameters
S(t) and m-value were consistently correlated with cracking performance of mixtures.
3.2.6 Multiple Stress Creep Recovery Test (MSCR)
The multiple stress creep recovery (MSCR) test is used to identify the presence of
elastic response in the asphalt binder and the change of elastic response under shear
creep and recovery using two different stress levels at a specified temperature. In
general, the percent recovery of asphalt binders in the MSCR test is affected by the
type and amount of polymer used in the polymer modified asphalt binder. Thus, it can
be used as an indicator for determining whether polymer was utilized. In addition, non-
recoverable creep compliance has been used as an indicator of the asphalt binder’s
resistance to permanent deformation under repeated load. D’Angelo et al. (2009, 2010)
found that rutting is typically reduced by half as the non-recoverable creep compliance
is reduced by half.
The description and practice of standard MSCR test method is designated and
reported in AASHTO TP 70-07 and ASTM D 7405. The MSCR test was conducted by
using an 8 mm spindle at the environmental grade temperature (64 °C) for the State of
Florida. Figure 3-7 and 3-8 represent the MSCR test results including average recovery
and non-recoverable compliance for all Superpave project sections, respectively. Figure
3-7 clearly shows that MSCR average percent recovery can distinguish the presence of
polymers in asphalt binders. In general, percent recovery of polymer modified binders
was greater than base binders including PG 64-22 and PG 67-22 for both stress levels.
Rubber modified binders also showed relatively high percent recovery than base
binders. Since the percent recovery indicates the elastic response of asphalt binder,

40
polymer modified binders (PG 76-22) appear to exhibit higher elastic response and less
sensitivity to change of stress level.
0.0
20.0
40.0
60.0
80.0
100.0
Av
era
ge
Rec
ov
ery
(%
)
Project (UF) ID
MSCR Average Recovery at 64.0 °C (147.2 °F) - Layer A
P1 (PG 67-22)
P2 (PG 64-22)
P3 (PG 67-22)
P4 (PG 67-22)
P6 (PG 64-22)
P7 (PG 64-22)
P8 (PG 76-22)
P9 (ARB-5)
P10 (ARB-5)
P11 (PG 76-22)
P12 (ARB-5)
0.1 kPa 3.2 kPa
(a) Layer A
0.0
20.0
40.0
60.0
80.0
100.0
Av
era
ge
Rec
ov
ery
(%
)
Project (UF) ID
MSCR Average Recovery at 64.0 °C (147.2 °F) - Layer B
P1 (PG 67-22)
P2 (PG 64-22)
P3 (PG 67-22)
P4 (PG 67-22)
P7 (PG 64-22)
P8 (PG 76-22)
P9 (PG 64-22)
P10 (PG 64-22)
P11 (PG 64-22)
P12 (PG 64-22)
0.1 kPa 3.2 kPa
(b) Layer B
Figure 3-7. MSCR average recovery at 64 °C (147.2 °F) for Superpave projects

41
0.0
0.5
1.0
1.5
2.0
2.5
Jn
r(1
/kP
a)
Project (UF) ID
MSCR Non-Recoverable Compliance at 64.0 °C (147.2 °F)
- Layer A
P1 (PG 67-22)
P2 (PG 64-22)
P3 (PG 67-22)
P4 (PG 67-22)
P6 (PG 64-22)
P7 (PG 64-22)
P8 (PG 76-22)
P9 (ARB-5)
P10 (ARB-5)
P11 (PG 76-22)
P12 (ARB-5)
0.1 kPa 3.2 kPa
(a) Layer A
0.0
0.5
1.0
1.5
2.0
2.5
Jn
r(1
/kP
a)
Project (UF) ID
MSCR Non-Recoverable Compliance at 64.0 °C (147.2 °F)
- Layer B
P1 (PG 67-22)
P2 (PG 64-22)
P3 (PG 67-22)
P4 (PG 67-22)
P7 (PG 64-22)
P8 (PG 76-22)
P9 (PG 64-22)
P10 (PG 64-22)
P11 (PG 64-22)
P12 (PG 64-22)
0.1 kPa 3.2 kPa
(b) Layer B
Figure 3-8. MSCR nonrecoverable compliance at 64 °C (147.2 °F) for Superpave projects
Based on Figure 3-8, polymer and rubber modified binders normally showed lower
non-recoverable compliance than base binders for both stress levels. According to
42
D’Angelo et al. (2009), nonrecoverable compliance can be used for evaluating the
rutting resistance of asphalt binder. However, on the basis of the results analyzed, it
seemed questionable whether it is consistently correlated with rutting performance of
mixtures in the field.
3.3 Mixture Tests
Superpave IDT tests were performed on field cores obtained from the Superpave
projects evaluated to determine mixture properties including modulus, creep compliance,
strength, failure strain, and fracture energy and to identify the change in key mixture
properties as a function of age in the field. Tests were performed at 10 °C and 20 °C.
3.3.1 Test Specimen Preparation
Specimens were prepared for laboratory testing using field cores obtained from
Superpave projects evaluated. Specific gravity (Gmb) test was conducted on each cut
cores and air voids were calculated using the Gmb and original (first time of coring)
maximum specific gravity (Gmm). It should be noted that Gmm could change with time,
especially for moisture-damaged projects. For moisture-damaged projects, air voids
determined using original Gmm are probably conservatively low (i.e. true air voids of
moisture-damaged projects are likely higher than air voids calculated using original
Gmm). Cores of similar air voids were grouped for standard Superpave IDT tests.
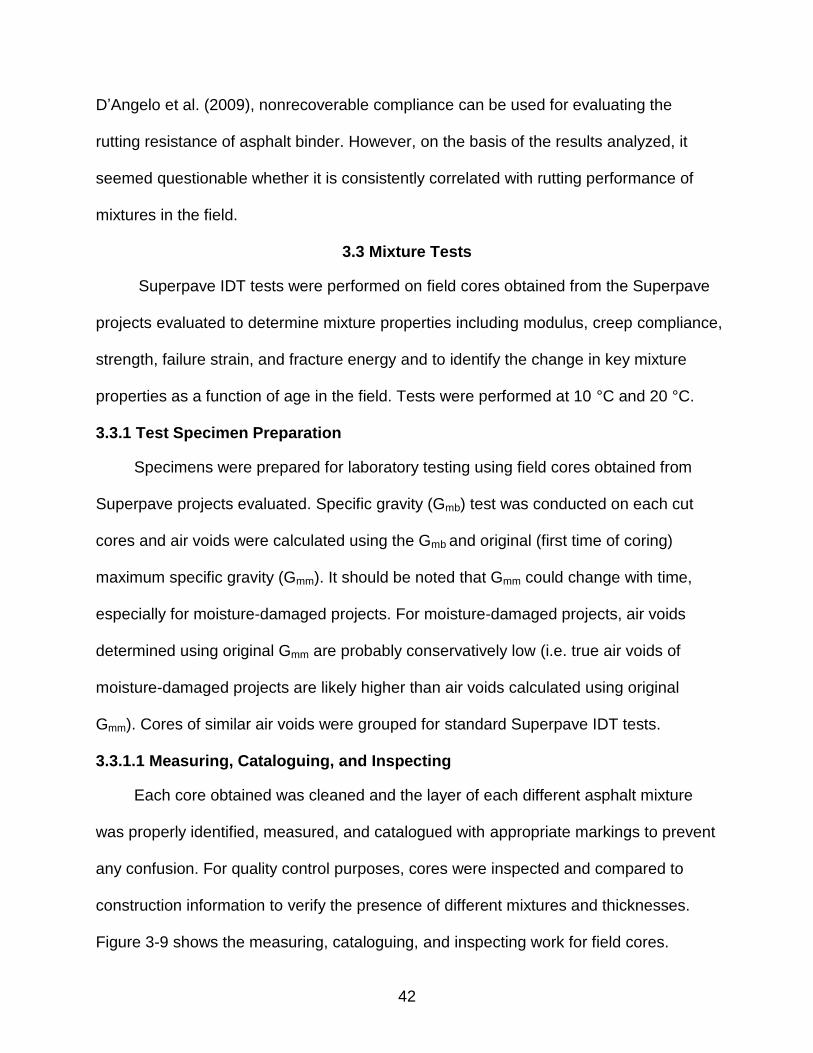
3.3.1.1 Measuring, Cataloguing, and Inspecting
Each core obtained was cleaned and the layer of each different asphalt mixture
was properly identified, measured, and catalogued with appropriate markings to prevent
any confusion. For quality control purposes, cores were inspected and compared to
construction information to verify the presence of different mixtures and thicknesses.
Figure 3-9 shows the measuring, cataloguing, and inspecting work for field cores.
43
Figure 3-9. Measuring, cataloguing, and inspecting work for field cores
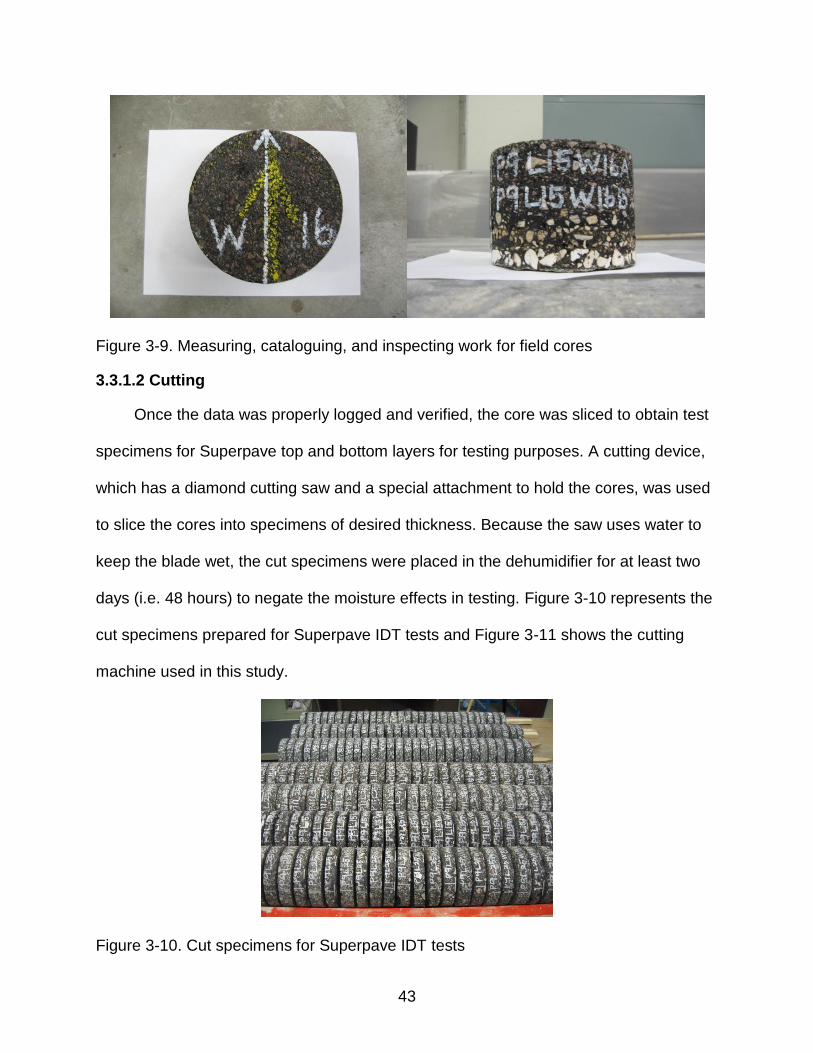
3.3.1.2 Cutting
Once the data was properly logged and verified, the core was sliced to obtain test
specimens for Superpave top and bottom layers for testing purposes. A cutting device,
which has a diamond cutting saw and a special attachment to hold the cores, was used
to slice the cores into specimens of desired thickness. Because the saw uses water to
keep the blade wet, the cut specimens were placed in the dehumidifier for at least two
days (i.e. 48 hours) to negate the moisture effects in testing. Figure 3-10 represents the
cut specimens prepared for Superpave IDT tests and Figure 3-11 shows the cutting
machine used in this study.
Figure 3-10. Cut specimens for Superpave IDT tests
44
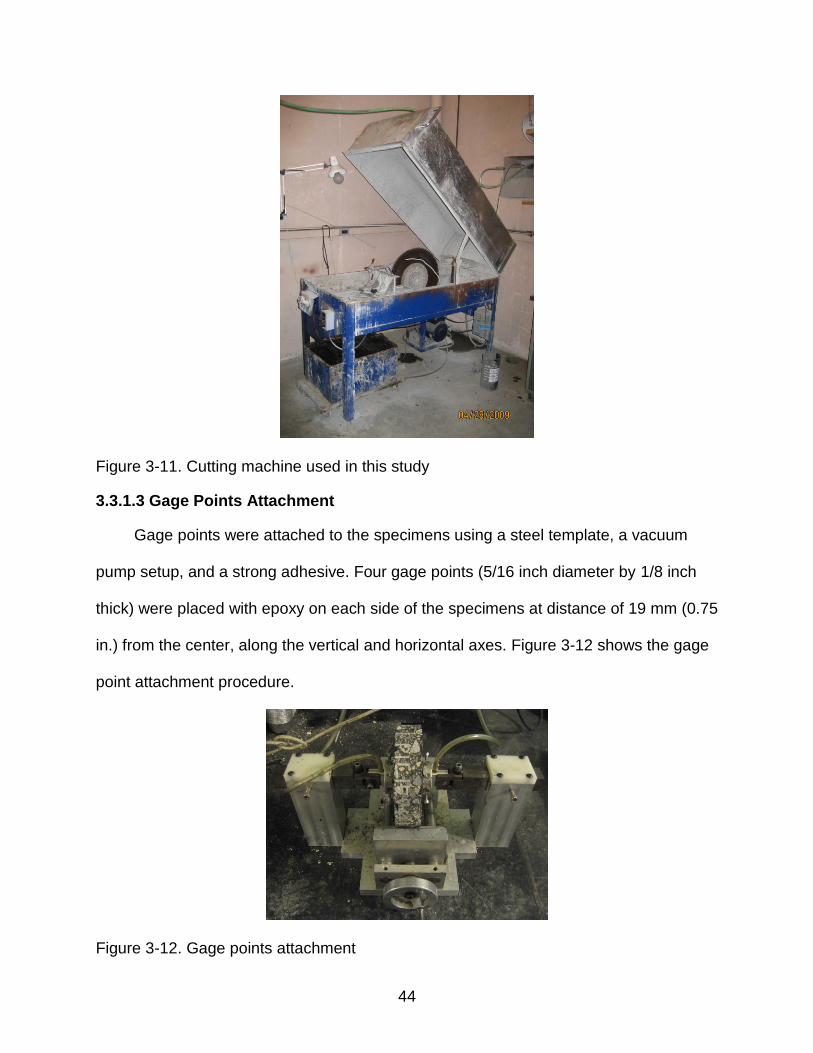
Figure 3-11. Cutting machine used in this study
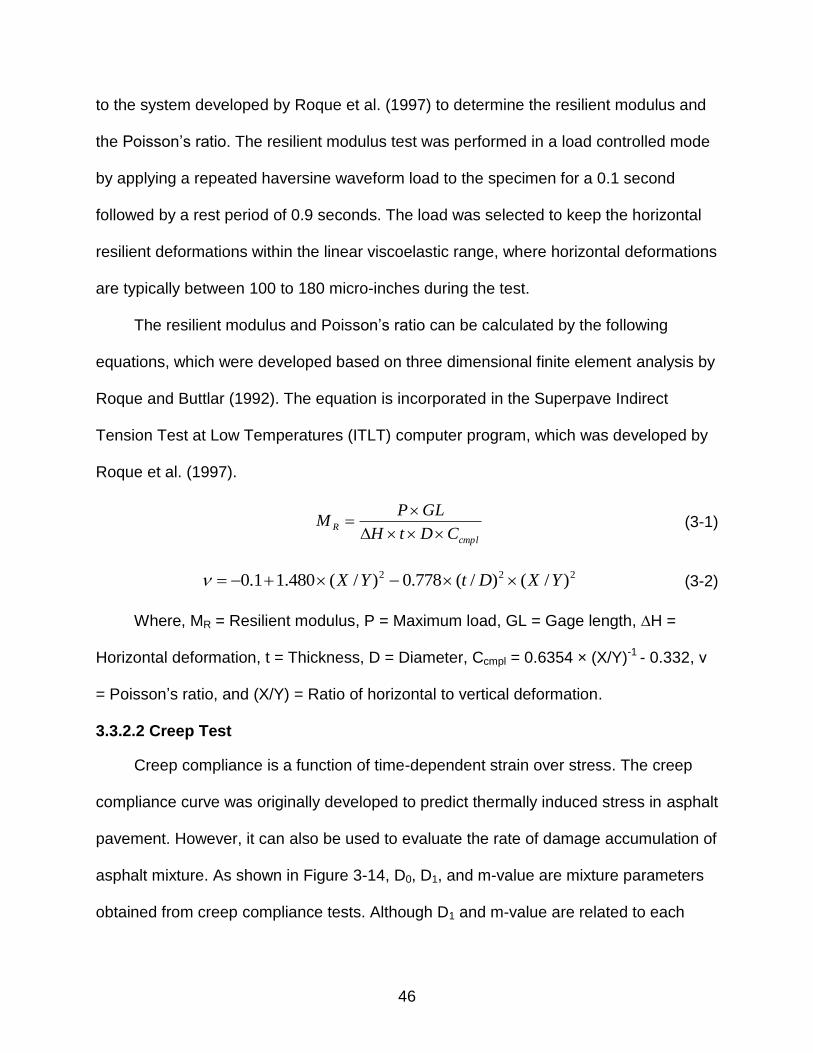
3.3.1.3 Gage Points Attachment
Gage points were attached to the specimens using a steel template, a vacuum
pump setup, and a strong adhesive. Four gage points (5/16 inch diameter by 1/8 inch
thick) were placed with epoxy on each side of the specimens at distance of 19 mm (0.75
in.) from the center, along the vertical and horizontal axes. Figure 3-12 shows the gage
point attachment procedure.
Figure 3-12. Gage points attachment

45
During this process, the loading axis previously marked on the specimens was
checked and clarified. This procedure helped for the placement of specimen in the
testing chamber and assured proper loading of the specimen.
3.3.2 Test Procedure
One set of Superpave IDT tests including resilient modulus, creep compliance,
and strength test were performed on each specimen for the Superpave projects
evaluated to determine modulus, creep compliance, strength, failure strain, and fracture
energy at 10 °C and 20 °C. These test results provide the properties to identify changes
in key mixture properties over time with aging environment in the field. In addition, as it
mentioned previously, this information was also critical to identify material properties
and prediction model evaluation, and to calibrate and validate the pavement
performance prediction model. The material testing system (MTS) used for this study,
and test configuration of Superpave IDT test set-up are shown in Figure 3-13.
Figure 3-13. Superpave IDT tests
3.3.2.1 Resilient Modulus Test
The resilient modulus is defined as the ratio of the applied stress to the
recoverable strain when repeated loads are applied. The test was conducted according
46
to the system developed by Roque et al. (1997) to determine the resilient modulus and
the Poisson’s ratio. The resilient modulus test was performed in a load controlled mode
by applying a repeated haversine waveform load to the specimen for a 0.1 second
followed by a rest period of 0.9 seconds. The load was selected to keep the horizontal
resilient deformations within the linear viscoelastic range, where horizontal deformations
are typically between 100 to 180 micro-inches during the test.
The resilient modulus and Poisson’s ratio can be calculated by the following
equations, which were developed based on three dimensional finite element analysis by
Roque and Buttlar (1992). The equation is incorporated in the Superpave Indirect
Tension Test at Low Temperatures (ITLT) computer program, which was developed by
Roque et al. (1997).
cmpl
RCDtH
GLPM
(3-1)
222 )/()/(778.0)/(480.11.0 YXDtYX (3-2)
Where, MR = Resilient modulus, P = Maximum load, GL = Gage length, ∆H =
Horizontal deformation, t = Thickness, D = Diameter, Ccmpl = 0.6354 × (X/Y)-1 - 0.332, ν
= Poisson’s ratio, and (X/Y) = Ratio of horizontal to vertical deformation.
3.3.2.2 Creep Test
Creep compliance is a function of time-dependent strain over stress. The creep
compliance curve was originally developed to predict thermally induced stress in asphalt
pavement. However, it can also be used to evaluate the rate of damage accumulation of
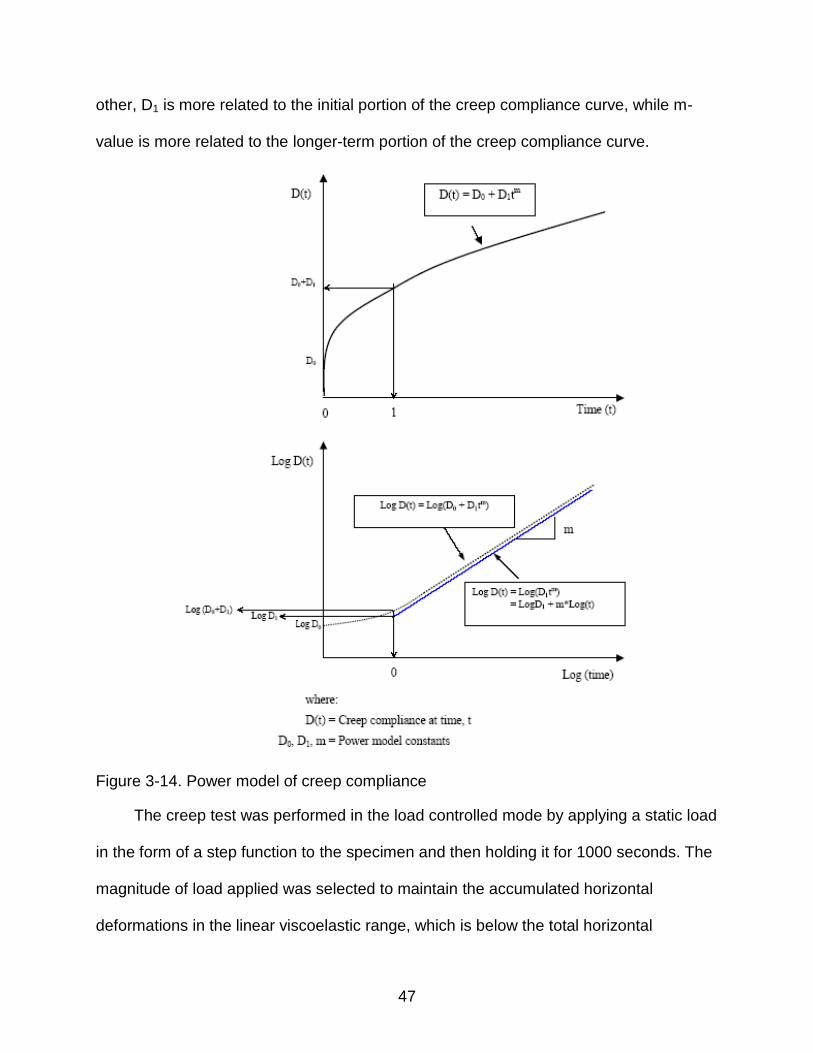
asphalt mixture. As shown in Figure 3-14, D0, D1, and m-value are mixture parameters
obtained from creep compliance tests. Although D1 and m-value are related to each
47
other, D1 is more related to the initial portion of the creep compliance curve, while m-
value is more related to the longer-term portion of the creep compliance curve.
Figure 3-14. Power model of creep compliance
The creep test was performed in the load controlled mode by applying a static load
in the form of a step function to the specimen and then holding it for 1000 seconds. The
magnitude of load applied was selected to maintain the accumulated horizontal
deformations in the linear viscoelastic range, which is below the total horizontal

48
deformation of 750 micro-inches. Although the range of horizontal deformation at 100
seconds can vary depending upon test temperature, specimen type, and the level of
aging, a horizontal deformation of 100 to 130 micro-inches at 100 seconds is generally
considered to be acceptable.
The Superpave Indirect Tension Test at Low Temperatures (ITLT) computer
program was used to determine creep properties of the mixtures by analyzing the load
and deformation data. Creep compliance and Poisson’s ratio are computed by the
following equations.
GLP
CDtHtD
cmpl
)( (3-3)
222 )/()/(778.0)/(480.11.0 YXDtYX (3-4)
Where, D(t) = Creep compliance at time t (1/psi), ∆H, t, D, Ccmpl, GL, ν, P, and
(X/Y) are same as described above.
3.3.2.3 Tensile Strength Test
Failure limits including tensile strength, failure strain, and fracture energy were
determined from strength test. These properties can be used for estimating the cracking
resistance of the asphalt mixtures. The strength test was conducted in a displacement
controlled mode by applying a constant rate of displacement of 50 mm/min until the
specimen failed. The maximum tensile strength is calculated as the following equation.
Db
CPS sx
t
2 (3-5)
Where, St = Maximum indirect tensile strength, P = Failure load at first crack, Csx =
0.948 – 0.01114 × (b/D) – 0.2693 × ν +1.436(b/D) × ν, b = Thickness, D = Diameter,
and ν = Poisson’s ratio.
49
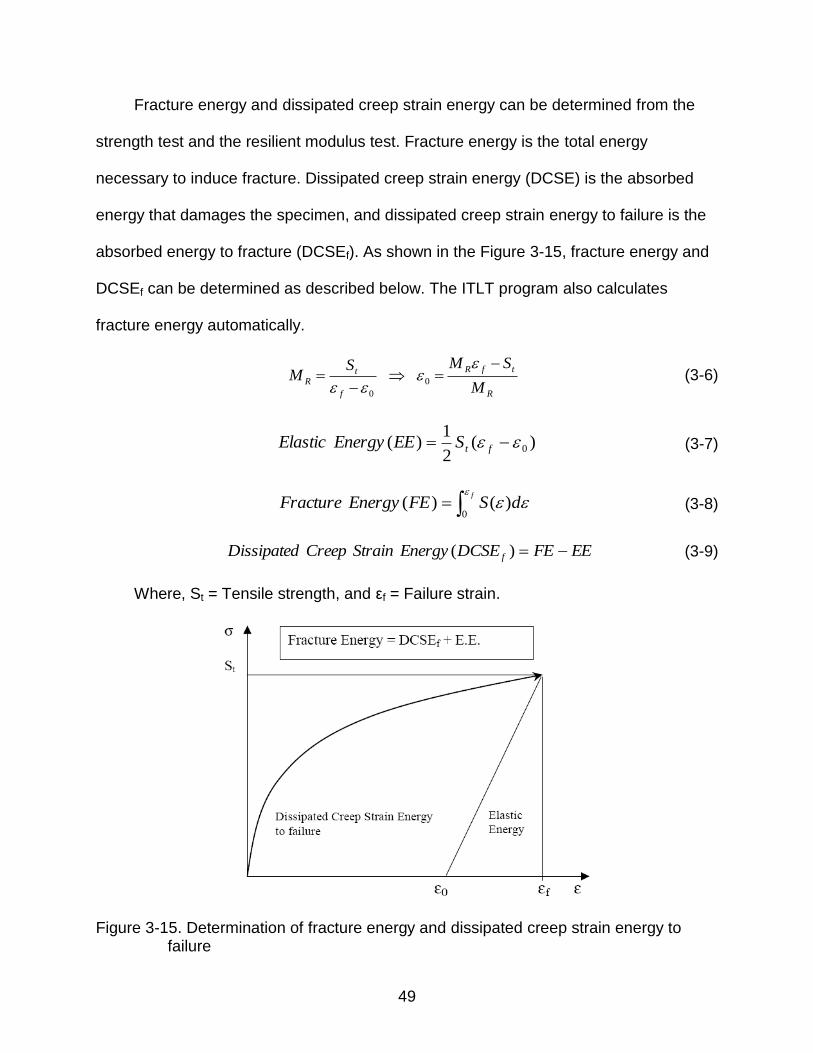
Fracture energy and dissipated creep strain energy can be determined from the
strength test and the resilient modulus test. Fracture energy is the total energy
necessary to induce fracture. Dissipated creep strain energy (DCSE) is the absorbed
energy that damages the specimen, and dissipated creep strain energy to failure is the
absorbed energy to fracture (DCSEf). As shown in the Figure 3-15, fracture energy and
DCSEf can be determined as described below. The ITLT program also calculates
fracture energy automatically.
R
tfR
f
tR
M
SMSM
0
0
(3-6)
)(2
1)( 0 ftSEEEnergyElastic (3-7)
f
dSFEEnergyFracture
0
)()( (3-8)
EEFEDCSEEnergyStrainCreepDissipated f )( (3-9)
Where, St = Tensile strength, and εf = Failure strain.
Figure 3-15. Determination of fracture energy and dissipated creep strain energy to failure
50
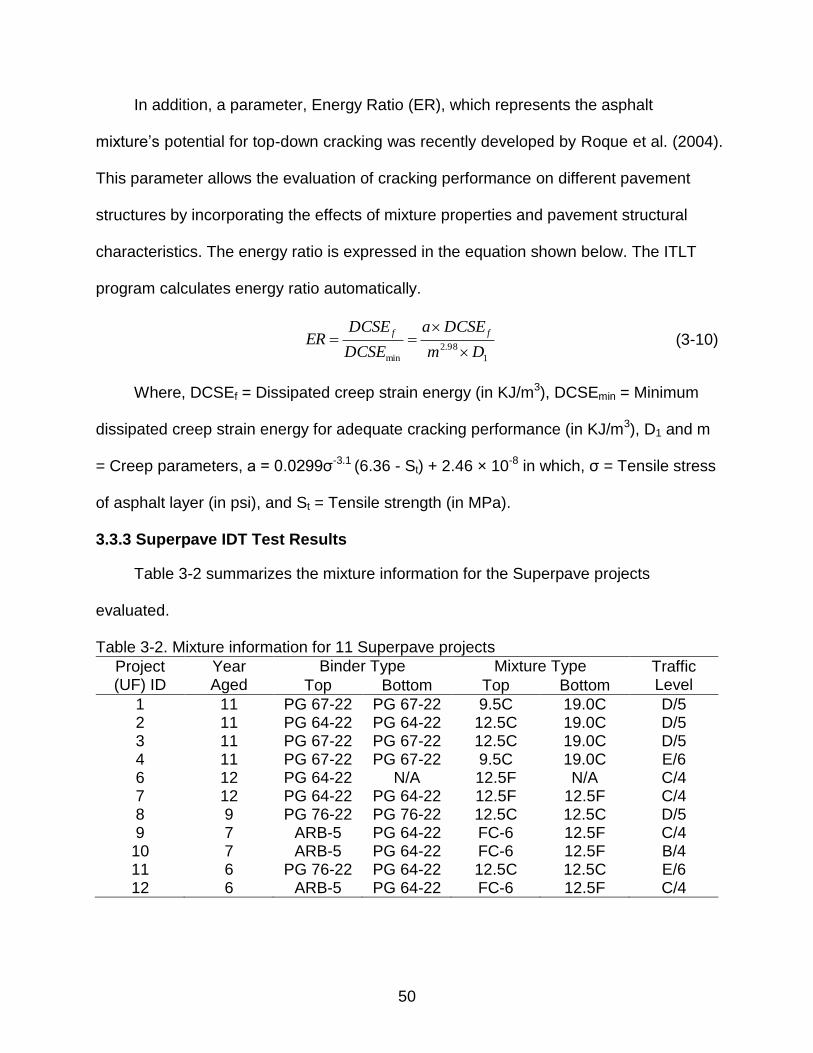
In addition, a parameter, Energy Ratio (ER), which represents the asphalt
mixture’s potential for top-down cracking was recently developed by Roque et al. (2004).
This parameter allows the evaluation of cracking performance on different pavement
structures by incorporating the effects of mixture properties and pavement structural
characteristics. The energy ratio is expressed in the equation shown below. The ITLT
program calculates energy ratio automatically.
1
98.2
min Dm
DCSEa
DCSE
DCSEER
ff
(3-10)
Where, DCSEf = Dissipated creep strain energy (in KJ/m3), DCSEmin = Minimum
dissipated creep strain energy for adequate cracking performance (in KJ/m3), D1 and m
= Creep parameters, a = 0.0299σ-3.1 (6.36 - St) + 2.46 × 10⁻⁸ in which, σ = Tensile stress
of asphalt layer (in psi), and St = Tensile strength (in MPa).
3.3.3 Superpave IDT Test Results
Table 3-2 summarizes the mixture information for the Superpave projects
evaluated.
Table 3-2. Mixture information for 11 Superpave projects
Project (UF) ID
Year Aged
Binder Type Mixture Type Traffic Level Top Bottom Top Bottom
1 11 PG 67-22 PG 67-22 9.5C 19.0C D/5 2 11 PG 64-22 PG 64-22 12.5C 19.0C D/5 3 11 PG 67-22 PG 67-22 12.5C 19.0C D/5 4 11 PG 67-22 PG 67-22 9.5C 19.0C E/6 6 12 PG 64-22 N/A 12.5F N/A C/4 7 12 PG 64-22 PG 64-22 12.5F 12.5F C/4 8 9 PG 76-22 PG 76-22 12.5C 12.5C D/5 9 7 ARB-5 PG 64-22 FC-6 12.5F C/4 10 7 ARB-5 PG 64-22 FC-6 12.5F B/4 11 6 PG 76-22 PG 64-22 12.5C 12.5C E/6 12 6 ARB-5 PG 64-22 FC-6 12.5F C/4
51
The test results obtained from the Superpave IDT were analyzed using the ITLT
computer program developed at the University of Florida. A comprehensive analysis of
test results was conducted to identify the trend of changes in key mixture properties
including fracture energy, creep rate, resilient modulus, creep compliance, tensile
strength, and failure strain as a function of age and environment for different Superpave
mixtures.
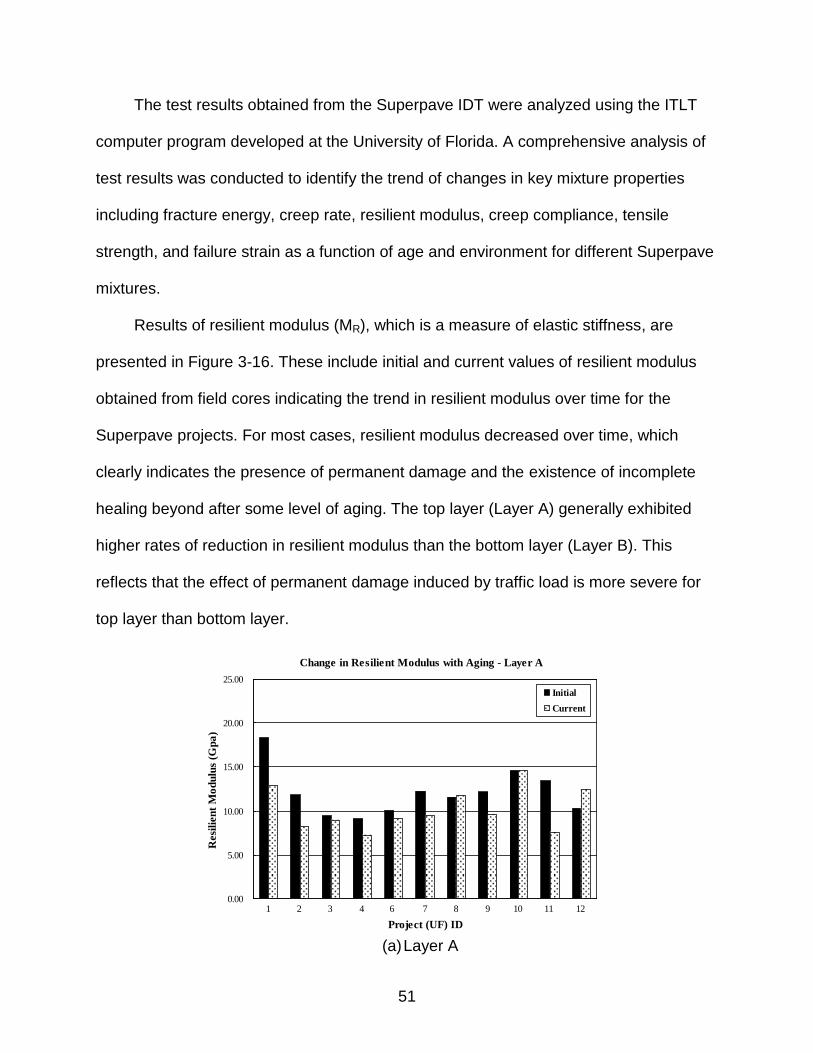
Results of resilient modulus (MR), which is a measure of elastic stiffness, are
presented in Figure 3-16. These include initial and current values of resilient modulus
obtained from field cores indicating the trend in resilient modulus over time for the
Superpave projects. For most cases, resilient modulus decreased over time, which
clearly indicates the presence of permanent damage and the existence of incomplete
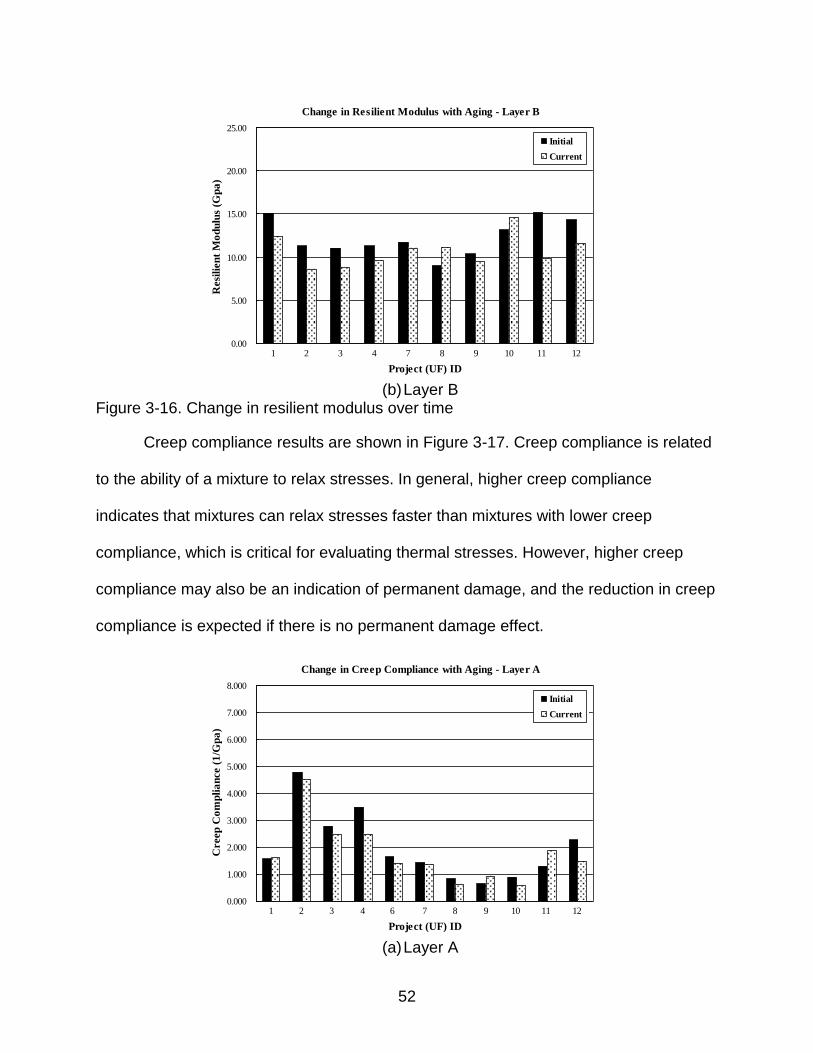
healing beyond after some level of aging. The top layer (Layer A) generally exhibited
higher rates of reduction in resilient modulus than the bottom layer (Layer B). This
reflects that the effect of permanent damage induced by traffic load is more severe for
top layer than bottom layer.
Change in Resilient Modulus with Aging - Layer A
0.00
5.00
10.00
15.00
20.00
25.00
Project (UF) ID
Resi
lien
t M
od
ulu
s (G
pa
)
Initial
Current
1 7 8 9 10 11 122 3 4 6
(a) Layer A
52
Change in Resilient Modulus with Aging - Layer B
0.00
5.00
10.00
15.00
20.00
25.00
Project (UF) ID
Resi
lien
t M
od
ulu
s (G
pa
)
Initial
Current
1 7 8 9 10 11 122 3 4
(b) Layer B
Figure 3-16. Change in resilient modulus over time
Creep compliance results are shown in Figure 3-17. Creep compliance is related
to the ability of a mixture to relax stresses. In general, higher creep compliance
indicates that mixtures can relax stresses faster than mixtures with lower creep
compliance, which is critical for evaluating thermal stresses. However, higher creep
compliance may also be an indication of permanent damage, and the reduction in creep
compliance is expected if there is no permanent damage effect.
Change in Creep Compliance with Aging - Layer A
0.000
1.000
2.000
3.000
4.000
5.000
6.000
7.000
8.000
Project (UF) ID
Creep
Co
mp
lia
nce (
1/G
pa
)
Initial
Current
1 7 8 9 10 11 122 3 4 6
(a) Layer A

53
Change in Creep Compliance with Aging - Layer B
0.000
1.000
2.000
3.000
4.000
5.000
6.000
7.000
8.000
Project (UF) ID
Creep
Co
mp
lia
nce (
1/G
pa
)
Initial
Current
1 7 8 9 10 11 122 3 4
(b) Layer B
Figure 3-17. Change in creep compliance over time
Creep rate, or the rate of change of creep compliance, is related to rate of damage.
Figure 3-18 shows the creep rate results. For mixtures not affected by moisture damage
(Project 1 through 8), creep rate of the top and bottom layers generally decreased over
time, which indicates that oxidative aging had a predominant effect on change in creep
rate.
Change in Creep Rate with Aging - Layer A
0.00E+00
5.00E-09
1.00E-08
1.50E-08
2.00E-08
2.50E-08
3.00E-08
Project (UF) ID
Creep
Ra
te (
1/p
si∙s
ec)
Initial
Current
1 7 8 9 10 11 122 3 4 6
(a) Layer A
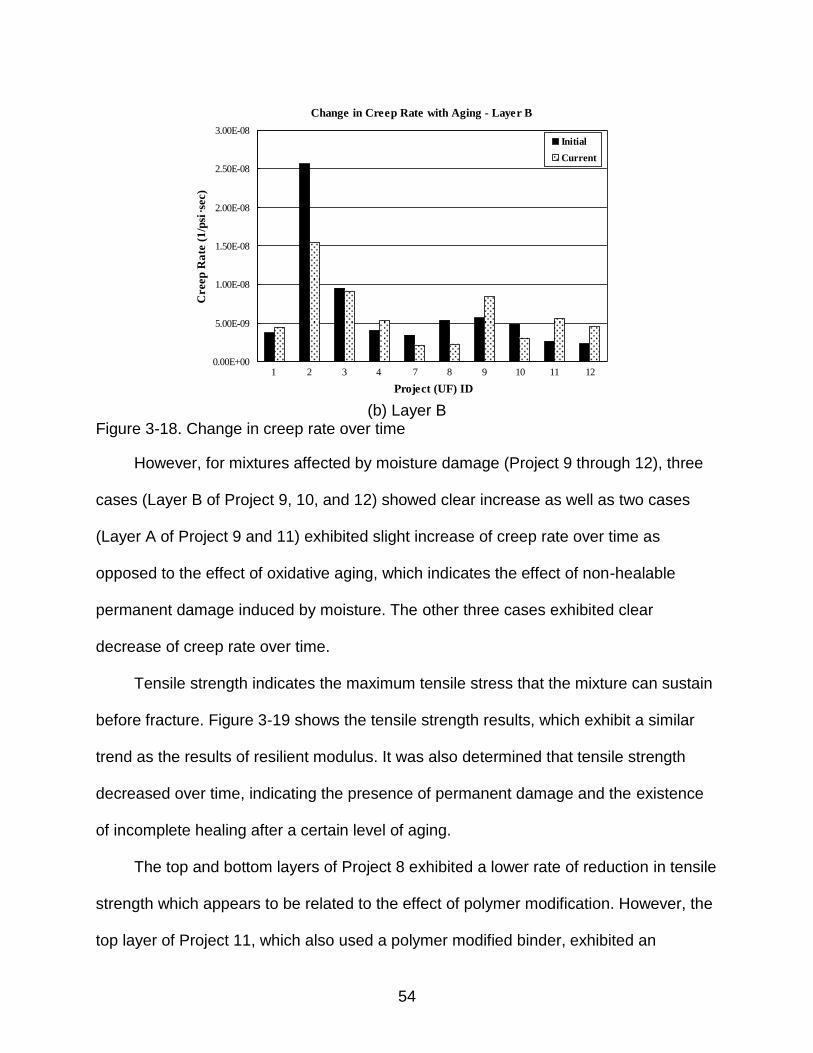
54
Change in Creep Rate with Aging - Layer B
0.00E+00
5.00E-09
1.00E-08
1.50E-08
2.00E-08
2.50E-08
3.00E-08
Project (UF) ID
Creep
Ra
te (
1/p
si∙s
ec)
Initial
Current
1 7 8 9 10 11 122 3 4
(b) Layer B
Figure 3-18. Change in creep rate over time
However, for mixtures affected by moisture damage (Project 9 through 12), three
cases (Layer B of Project 9, 10, and 12) showed clear increase as well as two cases
(Layer A of Project 9 and 11) exhibited slight increase of creep rate over time as
opposed to the effect of oxidative aging, which indicates the effect of non-healable
permanent damage induced by moisture. The other three cases exhibited clear
decrease of creep rate over time.
Tensile strength indicates the maximum tensile stress that the mixture can sustain
before fracture. Figure 3-19 shows the tensile strength results, which exhibit a similar
trend as the results of resilient modulus. It was also determined that tensile strength
decreased over time, indicating the presence of permanent damage and the existence
of incomplete healing after a certain level of aging.
The top and bottom layers of Project 8 exhibited a lower rate of reduction in tensile
strength which appears to be related to the effect of polymer modification. However, the
top layer of Project 11, which also used a polymer modified binder, exhibited an
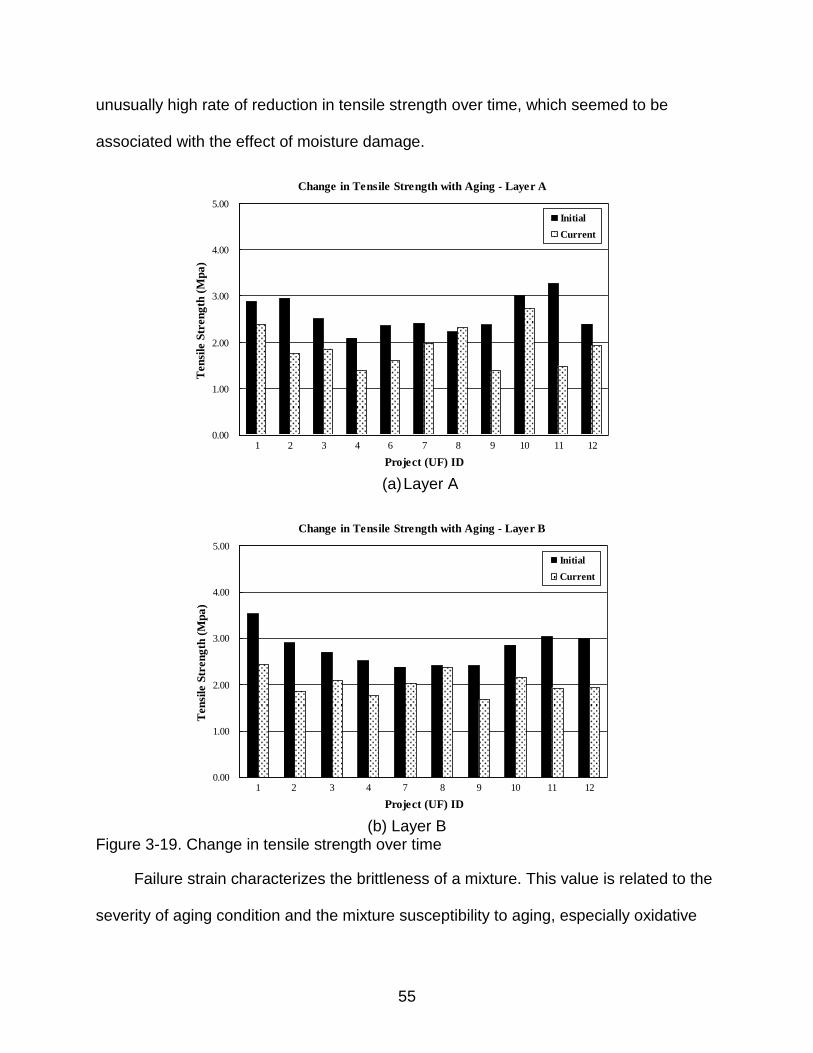
55
unusually high rate of reduction in tensile strength over time, which seemed to be
associated with the effect of moisture damage.
Change in Tensile Strength with Aging - Layer A
0.00
1.00
2.00
3.00
4.00
5.00
Project (UF) ID
Ten
sile
Str
en
gth
(M
pa
)
Initial
Current
1 7 8 9 10 11 122 3 4 6
(a) Layer A
Change in Tensile Strength with Aging - Layer B
0.00
1.00
2.00
3.00
4.00
5.00
Project (UF) ID
Ten
sile
Str
en
gth
(M
pa
)
Initial
Current
1 7 8 9 10 11 122 3 4
(b) Layer B
Figure 3-19. Change in tensile strength over time
Failure strain characterizes the brittleness of a mixture. This value is related to the
severity of aging condition and the mixture susceptibility to aging, especially oxidative
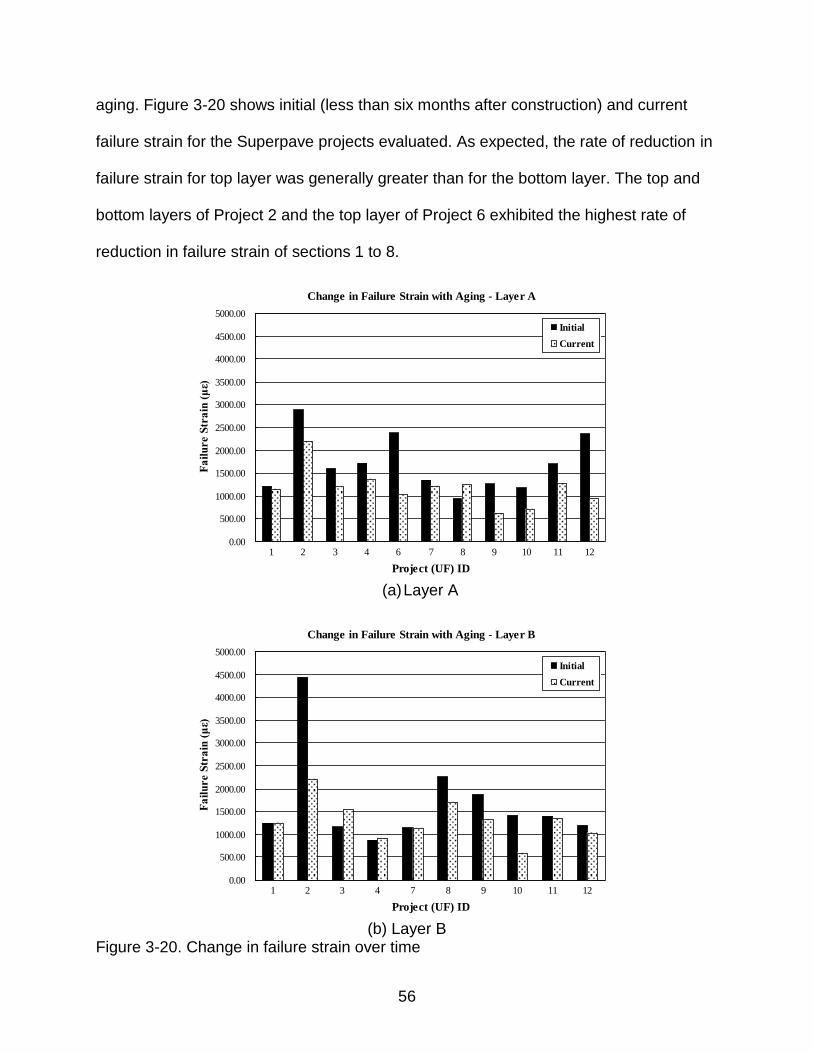
56
aging. Figure 3-20 shows initial (less than six months after construction) and current
failure strain for the Superpave projects evaluated. As expected, the rate of reduction in
failure strain for top layer was generally greater than for the bottom layer. The top and
bottom layers of Project 2 and the top layer of Project 6 exhibited the highest rate of
reduction in failure strain of sections 1 to 8.
Change in Failure Strain with Aging - Layer A
0.00
500.00
1000.00
1500.00
2000.00
2500.00
3000.00
3500.00
4000.00
4500.00
5000.00
Project (UF) ID
Fa
ilu
re S
tra
in (
με)
Initial
Current
1 7 8 9 10 11 122 3 4 6
(a) Layer A
Change in Failure Strain with Aging - Layer B
0.00
500.00
1000.00
1500.00
2000.00
2500.00
3000.00
3500.00
4000.00
4500.00
5000.00
Project (UF) ID
Fa
ilu
re S
tra
in (
με)
Initial
Current
1 7 8 9 10 11 122 3 4
(b) Layer B
Figure 3-20. Change in failure strain over time

57
Projects 9 through 12, which showed evidence of moisture damage, also exhibited
a high reduction in failure strain. High initial and current air voids as well as the increase
in air voids over time caused by the moisture damage for these sections may have
accelerated the effect of oxidative aging, so the mixture embrittled within a relatively
short period of time.
Change in Fracture Energy with Aging - Layer A
0.00
2.00
4.00
6.00
8.00
10.00
12.00
Project (UF) ID
Fra
ctu
re E
nerg
y (
KJ
/m3)
Initial
Current
1 7 8 9 10 11 122 3 4 6
(a) Layer A
Change in Fracture Energy with Aging - Layer B
0.00
2.00
4.00
6.00
8.00
10.00
12.00
Project (UF) ID
Fra
ctu
re E
nerg
y (
KJ
/m3)
Initial
Current
1 7 8 9 10 11 122 3 4
(b) Layer B
Figure 3-21. Change in fracture energy over time

58
Fracture energy reflects the mixture’s resistance to damage without fracturing. It
has been identified as a good indicator of cracking performance of asphalt pavements
having similar pavement structure, traffic and environmental condition. Fracture energy
results for the eleven Superpave projects are presented in Figure 3-21. As expected,
fracture energy has decreased over time. This observation was the basis for the fracture
energy aging model introduced in the NCHRP Project 01-42A.
Based on the results shown in Figure 3-21, it seemed clear that higher initial FE
results in higher rate of reduction in FE with aging. Also, the top layers exhibited
relatively higher rates of reduction in FE than the bottom layers for most projects.
However, the rate of reduction in FE for projects showing evidence of moisture damage
(Project 9, 10, 11 and 12) exhibited unusually high rates of reduction in FE regardless of
the initial FE magnitude and layer depth.
3.3.4 Moisture-Damaged Projects
Moisture damage of asphalt mixture is a major distress mode that can result in
significant costs for repair and rehabilitation. The effect of moisture on asphalt mixture
involves various factors acting simultaneously including the effect of moisture
susceptibility of asphalt mixture, stresses induced by traffic load, environmental
condition, and moisture. Many researchers have tried to identify relationships between
asphalt mixture properties and moisture (Schmidt et al. 1972, Fwa et al. 1995, and
Lottman 1986). However, the mechanism and effect of moisture damage have not yet
been fully identified or verified.
During the inspection process of the cores obtained, evidence of moisture damage
was visually identified in the form of stripping for Project 9, 10, 11, and 12. Stripping was
particularly prominent at the interface between top and bottom Superpave layers. These

59
projects are relatively new pavements (six to seven years of age). Specifically, as
shown in Table 3-3, use of granite aggregates was common to all moisture damaged
projects. No moisture damage was observed for projects produced with limestone
aggregate. Three of the four projects (Projects 9, 10, and 12) had fine-graded mixtures
with rubber modified binder (ARB-5) in the top layer and PG 64-22 binder in the bottom
layer. The fourth project had a coarse-graded mixture with SBS-modified binder in the
top layer and PG 64-22 binder in the bottom layer. Table 3-3 summarizes project
information and the moisture damaged sections are highlighted.
Table 3-3. Project information for moisture-damaged sections
Project (UF) ID
Year Aged
Aggregate Type
Binder Type Mixture Type Traffic Level Top Bottom Top Bottom
1 11 Granite PG 67-22 PG 67-22 9.5C 19.0C D/5 2 11 Granite PG 64-22 PG 64-22 12.5C 19.0C D/5 3 11 Limestone PG 67-22 PG 67-22 12.5C 19.0C D/5 4 11 Limestone PG 67-22 PG 67-22 9.5C 19.0C E/6 6 12 Limestone PG 64-22 N/A 12.5F N/A C/4 7 12 Limestone PG 64-22 PG 64-22 12.5F 12.5F C/4 8 9 Limestone PG 76-22 PG 76-22 12.5C 12.5C D/5 9 7 Granite ARB-5 PG 64-22 FC-6 12.5F C/4
10 7 Granite ARB-5 PG 64-22 FC-6 12.5F B/4 11 6 Granite PG 76-22 PG 64-22 12.5C 12.5C E/6
Note: N/A = Not Applicable
Several unique trends were identified for moisture damaged sections with regard
to the change in fracture energy and air voids over time. Relatively high initial and/or
current air voids were measured on field cores obtained from layer A for Project 9 and
10. In some cases (Layer A of Project 9 and 11 and layer B of Project 9, 11, and 12),
the air voids increased over time, which appeared to be related to the displacement of
material caused by moisture damage. Figure 3-22 shows the change in air voids for
Superpave projects evaluated including layers A and B, respectively.

60
Change in Air Voids for Superpave Projects (Layer A - WP)
0.0
2.0
4.0
6.0
8.0
10.0
12.0
Project (UF) ID
Air
Vo
ids
(%)
Initial Air Voids
Current Air Voids
1 2 7 83 4 6 11 129 10
(a) Layer A
Change in Air Voids for Superpave Projects (Layer B - WP)
0.0
2.0
4.0
6.0
8.0
10.0
12.0
Project (UF) ID
Air
Vo
ids
(%)
Initial Air Voids
Current Air Voids
1 2 7 83 4 11 129 10
(b) Layer B
Note: “WP” denotes the “Wheel Path” Figure 3-22. Change in air voids over time
In addition, as shown in Figure 3-23, much greater rate of reduction in normalized
fracture energy was obtained for moisture damaged sections. Rate of reduction of
normalized fracture energy over time was calculated to account for the difference in age
between moisture damaged sections and other sections. Figure 3-23 shows the initial

61
rate of reduction in normalized fracture energy for Superpave projects evaluated
including layer A and B, respectively.
Initial Rate of Reduction in Normalized Fracture Energy - Layer A
-1.600
-1.400
-1.200
-1.000
-0.800
-0.600
-0.400
-0.200
0.000
Project (UF) ID
dF
En
(t)/
dt
at
t=0
64321 9 10 11 127
Initial Rate of Reduction in Normalized Fracture Energy - Layer A
-1.600
-1.400
-1.200
-1.000
-0.800
-0.600
-0.400
-0.200
0.000
Project (UF) ID
dF
En
(t)/
dt
at
t=0
64321 9 10 11 127
(a) Layer A
Initial Rate of Reduction in Normalized Fracture Energy - Layer B
-1.600
-1.400
-1.200
-1.000
-0.800
-0.600
-0.400
-0.200
0.000
Project (UF) ID
dF
En
(t)/
dt
at
t=0
84321 9 10 11 127
Unusually High Initial FE
Initial Rate of Reduction in Normalized Fracture Energy - Layer B
-1.600
-1.400
-1.200
-1.000
-0.800
-0.600
-0.400
-0.200
0.000
Project (UF) ID
dF
En
(t)/
dt
at
t=0
84321 9 10 11 127
Unusually High Initial FE
(b) Layer B
Note: dFEn(t)/dt at t=0 denotes the initial rate of reduction in normalized fracture energy Figure 3-23. Initial rate of reduction in normalized fracture energy over time

62
Birgisson et al. (2004) indicated that the Energy Ratio (ER) can be used to
evaluate the effect of moisture damage on changes in fracture resistance of asphalt
mixtures.
Initial Rate of Reduction in Normalized Energy Ratio - Layer A
-2.000
-1.800
-1.600
-1.400
-1.200
-1.000
-0.800
-0.600
-0.400
-0.200
0.000
Project (UF) ID
dE
Rn
(t)/
dt
at
t=0
64321 7 9 11 1210
(a) Layer A
Initial Rate of Reduction in Normalized Energy Ratio - Layer B
-2.000
-1.800
-1.600
-1.400
-1.200
-1.000
-0.800
-0.600
-0.400
-0.200
0.000
Project (UF) ID
dE
Rn
(t)/
dt
at
t=0
74321 8 10 11 129
(b) Layer B
Note: dERn(t)/dt at t=0 denotes the initial rate of reduction in normalized energy ratio Figure 3-24. Initial rate of reduction in normalized energy ratio over time
63
Figure 3-24 clearly shows that a much greater reduction in normalized ER was
observed in moisture damaged sections. In other words, the effect of moisture
dramatically reduced the fracture resistance of asphalt mixtures, and the ER was
capable of detecting the effect of moisture damage. Figure 3-24 clearly indicates that
the ER is very sensitive to, and therefore able to capture the effects of moisture damage.
As expected, high rate of reduction in normalized ER with aging was identified for
moisture damaged sections.
3.4 Summary
Binder and mixture tests were performed on field cores to determine key binder
and mixture properties to identify the change in these properties as a function of age
and environment in the field for different Superpave projects in Florida. Test results
were carefully analyzed and further used to develop implementable mixture design
criteria (i.e. DASR-IC criteria), predictive mixture property relationships, and material
property prediction model evaluation.
64
CHAPTER 4 EVALUATION OF FIELD MIXTURE PERFORMANCE USING DASR-IC MODEL
PARAMETERS
4.1 Background
Four DASR-IC model parameters including DASR porosity, DF, EFT, and
CFA/FFA have formed the DASR-IC criteria to effectively address the two primary
components (i.e. DASR and IC) of asphalt mixtures that play a major role on properties
and performance. Field performance evaluation of different Superpave mixtures was
conducted to identify the relationships between the four DASR-IC parameters and field
performance.
4.2 Implementation of Gradation Analysis for Superpave Mixtures
Gradation analysis was conducted for different Superpave mixtures evaluated as
part of Superpave monitoring projects sponsored by FDOT. Table 4-1 summarizes
mixture information of Superpave projects analyzed. The actual reliability level for all
binder’s true grades is 98 % for the seven-day average high temperature and the one-
day low temperature.
In this study, extensive sampling was made by taking field cores from different
Superpave mixtures constructed throughout the state of Florida. It is noted that in-place
gradations were determined from field cores. These gradations are not simply job-mix-
formula (JMF) gradations that may or may not be representative of the final results in
the field. In addition, asphalt binder recovery was performed by using the solvent
extraction method, and all mixture volumetric properties required were obtained from cut
cores.
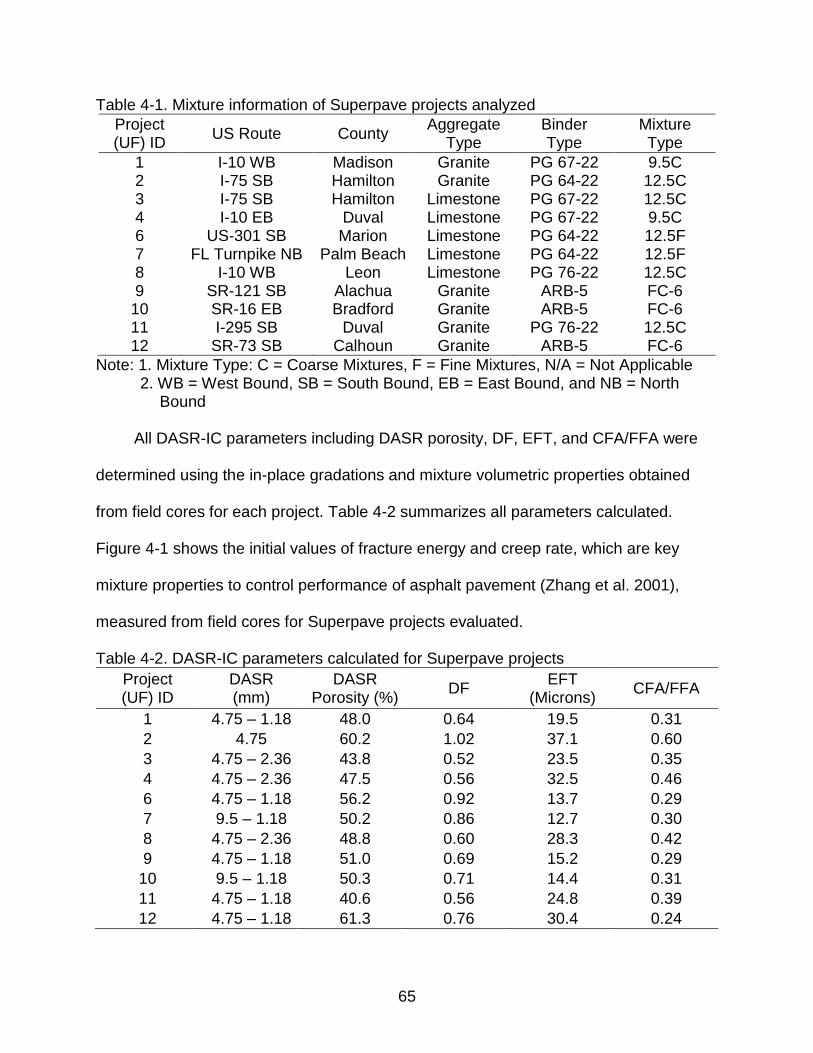
65
Table 4-1. Mixture information of Superpave projects analyzed
Project (UF) ID
US Route County Aggregate
Type Binder Type
Mixture Type
1 I-10 WB Madison Granite PG 67-22 9.5C 2 I-75 SB Hamilton Granite PG 64-22 12.5C 3 I-75 SB Hamilton Limestone PG 67-22 12.5C 4 I-10 EB Duval Limestone PG 67-22 9.5C 6 US-301 SB Marion Limestone PG 64-22 12.5F 7 FL Turnpike NB Palm Beach Limestone PG 64-22 12.5F 8 I-10 WB Leon Limestone PG 76-22 12.5C 9 SR-121 SB Alachua Granite ARB-5 FC-6
10 SR-16 EB Bradford Granite ARB-5 FC-6 11 I-295 SB Duval Granite PG 76-22 12.5C 12 SR-73 SB Calhoun Granite ARB-5 FC-6
Note: 1. Mixture Type: C = Coarse Mixtures, F = Fine Mixtures, N/A = Not Applicable 2. WB = West Bound, SB = South Bound, EB = East Bound, and NB = North
Bound
All DASR-IC parameters including DASR porosity, DF, EFT, and CFA/FFA were
determined using the in-place gradations and mixture volumetric properties obtained
from field cores for each project. Table 4-2 summarizes all parameters calculated.
Figure 4-1 shows the initial values of fracture energy and creep rate, which are key
mixture properties to control performance of asphalt pavement (Zhang et al. 2001),
measured from field cores for Superpave projects evaluated.
Table 4-2. DASR-IC parameters calculated for Superpave projects
Project (UF) ID
DASR (mm)
DASR Porosity (%)
DF EFT
(Microns) CFA/FFA
1 4.75 – 1.18 48.0 0.64 19.5 0.31
2 4.75 60.2 1.02 37.1 0.60
3 4.75 – 2.36 43.8 0.52 23.5 0.35
4 4.75 – 2.36 47.5 0.56 32.5 0.46
6 4.75 – 1.18 56.2 0.92 13.7 0.29
7 9.5 – 1.18 50.2 0.86 12.7 0.30
8 4.75 – 2.36 48.8 0.60 28.3 0.42
9 4.75 – 1.18 51.0 0.69 15.2 0.29
10 9.5 – 1.18 50.3 0.71 14.4 0.31
11 4.75 – 1.18 40.6 0.56 24.8 0.39
12 4.75 – 1.18 61.3 0.76 30.4 0.24
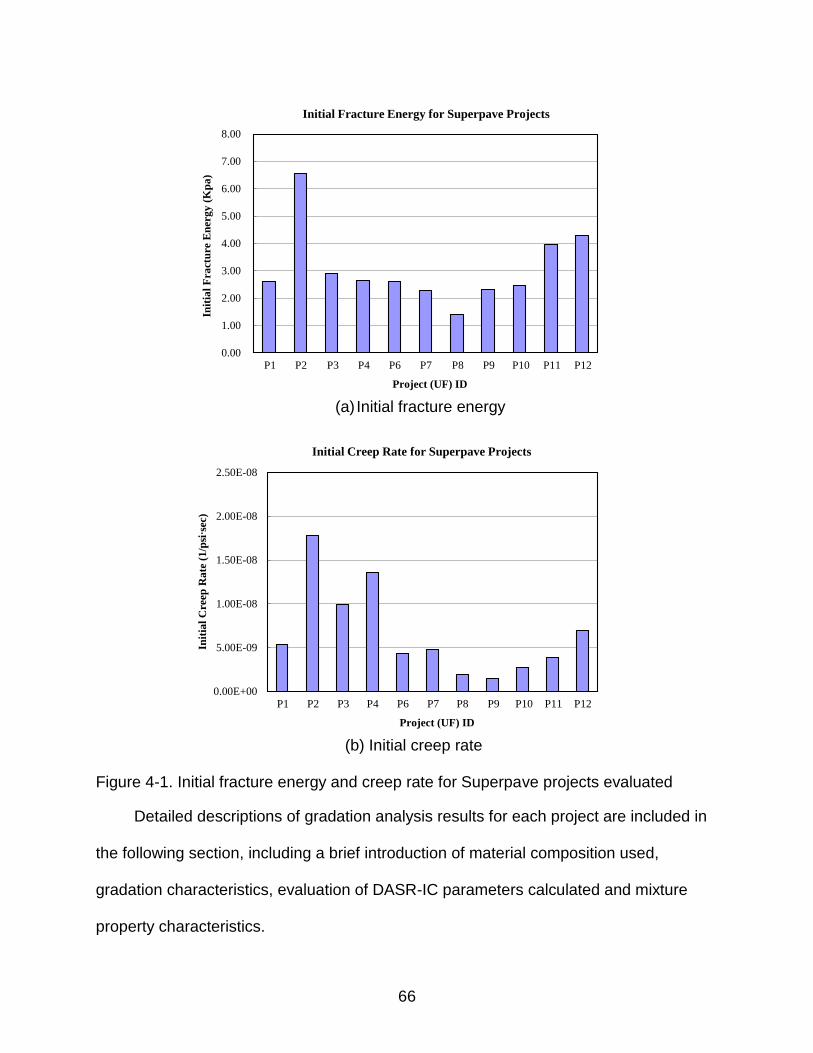
66
0.00
1.00
2.00
3.00
4.00
5.00
6.00
7.00
8.00
Init
ial
Fra
ctu
re E
ner
gy
(K
pa
)
Project (UF) ID
Initial Fracture Energy for Superpave Projects
P1 P2 P3 P7 P9 P10P8 P11 P12P6P4
(a) Initial fracture energy
0.00E+00
5.00E-09
1.00E-08
1.50E-08
2.00E-08
2.50E-08
Init
ial
Cre
ep R
ate
(1
/psi∙s
ec)
Project (UF) ID
Initial Creep Rate for Superpave Projects
P1 P2 P3 P7 P9 P10P8 P11 P12P6P4
(b) Initial creep rate
Figure 4-1. Initial fracture energy and creep rate for Superpave projects evaluated
Detailed descriptions of gradation analysis results for each project are included in
the following section, including a brief introduction of material composition used,
gradation characteristics, evaluation of DASR-IC parameters calculated and mixture
property characteristics.
67
4.3 Evaluation of Gradation Analysis Results for Superpave Projects
Project 1 was constructed with 9.5 mm coarse-graded Superpave mixture using
granite aggregate. PG 67-22 binder was used for this project. Gradation analysis results
indicated that Project 1 exhibited a continuous gradation pattern with good interaction
within the DASR structure. All gradation parameters were within the acceptable range.
Mixture test results indicated that initial fracture energy and creep rate were in a range
associated with good-performing mixtures.
Project 2 was constructed using 12.5 mm coarse-graded Superpave mixture.
Granite aggregate was used with PG 64-22 binder. Project 2 exhibited high values of
DASR porosity and DF with poor interaction within the DASR structure. In addition,
uncommonly high EFT and CFA/FFA were identified. It appeared that the gradation
characteristics mentioned above resulted in the unusually high initial fracture energy
and creep rate.
Project 3 was constructed with 12.5 mm coarse-graded Superpave mixture.
Limestone aggregate was used along with PG 67-22 binder. As with Project 1, Project 3
exhibited a continuous gradation pattern with good interaction within the DASR structure.
However, DF was relatively low which led to high creep rate and is probably related to
the poor cracking performance observed for Project 3.
Project 4 was constructed with 9.5 mm coarse-graded Superpave mixture.
Limestone aggregate was used with PG 67-22 binder. Project 4 exhibited an acceptable
DASR porosity, but also had relatively high EFT and CFA/FFA with low DF, indicating
that the IC aggregates would not be involved in transmitting load between the DASR
aggregates. Mixture test results indicated relatively high initial creep rate, which

68
appeared to be associated with the high EFT and CFA/FFA along with the low DF of
Project 4.
Project 6 was constructed with 12.5 mm fine-graded Superpave mixture.
Limestone aggregate was used along with PG 64-22 asphalt binder. Based on the
gradation analysis results, Project 6 had high DASR porosity and relatively high DF,
indicating potentially poor mixture performance. In fact, relatively poor field performance
for both rutting and cracking was identified based on the PCS data and field
investigation.
Project 7 was constructed with 12.5 mm fine-graded Superpave mixture.
Limestone aggregate was used with PG 64-22 binder. Project 7 exhibited a continuous
gradation pattern with good interaction within the DASR structure. However, the DASR
porosity was in the marginal range with DF within the acceptable range. Acceptable
values of initial fracture energy and creep rate were determined for mixture tests.
Project 8 was constructed with 12.5 mm coarse-graded Superpave mixture.
Limestone aggregate was used along with an SBS modified binder. Project 8 exhibited
a continuous gradation pattern with good interaction within the DASR structure.
However, the DASR porosity was in the marginal range with DF within the acceptable
range. Project 8 mixture exhibited relatively high EFT and CFA/FFA which may be
associated with high damage rate. However, mixture test results indicated that initial
creep rate was within the range considered to be acceptable. This was probably due to
the beneficial effect of polymer modification. More details regarding material property
relationships will be introduced in Chapter 5.
69
Projects 9 through 12 were categorized as unusual projects from the standpoint of
gradation effects and material property relationships because evidence of moisture
damage was observed. Results of gradation analysis for these sections are included in
the Table 4-2. Also, results of initial fracture energy and creep rate are included along
with normal projects in Figure 4-1. However, moisture damaged sections have to be
dealt with differently from other sections for the performance evaluation. Therefore,
moisture damaged sections, Project 9, 10, 11, and 12, were excluded from performance
evaluation in this study.
4.4 Evaluation of Field Mixture Performance
Performance evaluation of different Superpave mixtures was conducted to identify
effects of gradation characteristics on field performance using the DASR-IC model
parameters. Field rutting and cracking performance data were collected as part of
Superpave monitoring projects conducted at the University of Florida. Structural
deficiencies were not found for Superpave projects evaluated in this study. Based on
moduli determined by backcalculation of falling weight deflectometer test (FWD) results
obtained at multiple times during the service life, changes in base and subgrade moduli
were not significant over time. Actual backcalculated base moduli varied from 0.30 to
0.52 Gpa (44100 to 74900 psi), which indicated competent base moduli for asphalt
pavement. Gradation analysis results were used as gradation parameters for the
evaluation. Based on the results introduced in prior research (Kim et al. 2006, Guarin
2009, Roque et al. 2011) and analyses performed in this study, acceptable ranges of
each parameter were identified:
DASR porosity (%): 38 – 52 (48 – 52: Marginal DASR porosity)
DF: 0.60 – 0.90

70
EFT (microns): 12.5 – 25.0
CFA/FFA: 0.28 – 0.36
It is noted that binder properties obtained from field cores still met the Superpave
specification requirement regarding six to eleven year-old pavement for Superpave
projects evaluated (Roque et al. 2011). In other words, parameters from binder tests did
not appear to be consistently correlated with field performance of Superpave mixtures.
Furthermore, based on the Quality Control (QC), Quality Assurance (QA), and
Independent Assurance (IA) data, all projects met relevant construction specification
criteria including job-mix-formula (JMF) for gradation, air voids, binder content and in-
place density.
4.4.1 Field Performance: Rutting
Comprehensive monitoring of field rutting performance was conducted for
Superpave mixtures as part of Superpave monitoring projects sponsored by FDOT.
Field rut depth measured from construction throughout the pavement’s life using
transverse profilograph was used for the evaluation. The results are presented in terms
of rut depth per ESALs (inch/ESALs×106) to normalize the effect of traffic volume
between the different projects. In addition, the rut depth/ESALs at two years values
were used for analysis to account for the fact that the rate of rutting generally decreases
with time. Careful analysis of rut profiles with time has clearly shown that this
phenomenon is associated with the fact that the rut basin continues to widen with
continued loading, while rut depth does not increase very much. Figure 4-2 shows the
rut depth/ESALs at two years for the Superpave projects evaluated. Projects 1, 2 and 6
exhibited relatively high rut depth/ESALs, which indicates poor field rutting performance,
compared to other projects.

71
0.00
0.05
0.10
0.15
0.20
0.25
0.30
Ru
t D
epth
/ES
AL
s at
2 Y
ears
(in
/mil
lion
)
Project (UF) ID
Rut Depth/ESALs for Superpave Projects
P1 P2 P3 P7 P8P6P4
Figure 4-2. Field rutting performance for Superpave projects evaluated
Figure 4-3 shows the results of rutting performance evaluation using DASR-IC
parameters for Superpave projects. Figure 4-3 (a) clearly indicates that mixtures with
good DASR porosity exhibited much lower rut depth/ESALs, which reflects good field
rutting performance, than mixtures with high DASR porosity (i.e. outside the acceptable
range). For mixtures with marginal DASR porosity, it was noted that mixtures could
exhibit either good or bad rutting performance.
Based on Figure 4-3 (b), the range of DF appears to be correlated with DASR
porosity. Mixtures with DF within the acceptable range exhibited lower rut depth/ESALs,
except for Project 1. Project 1 had marginal DASR porosity which appeared to result in
relatively bad performance. Mixtures with high DF clearly exhibited high rut
depth/ESALs. However, Projects 3 and 4 exhibited good rutting performance, even
though the DF was relatively low. Gradation analysis results indicated that these two
sections had good DASR porosity with good interaction within the DASR structure.
Similar trends were also identified for relations between rut depth/ESALs and EFT and

72
CFA/FFA (see Figures 4-3 (c) and (d)). It is noted that Project 8 exhibited good rutting
performance with marginal DASR porosity which was probably related to the beneficial
effect of polymer modification.
0.00
0.05
0.10
0.15
0.20
0.25
Ru
t D
ep
th/E
SA
Ls
at
2 Y
ea
rs
(in
/mil
lio
n)
DASR Porosity Range
Relation between DASR Porosity and RD/ESALs
P3 P4 P1 P7 P2 P6P8
38 ≤ ηDASR < 48 48 ≤ ηDASR < 52 ηDASR ≥ 52
Good Marginal High
(a) DASR porosity
0.00
0.05
0.10
0.15
0.20
0.25
Ru
t D
epth
/ES
AL
s a
t 2
Yea
rs (
in/m
illi
on
)
Disruption Factor Range
Relation between Disruption Factor and RD/ESALs
P3 P4 P1 P7 P2 P6P8
DF < 0.60 0.60 ≤ DF < 0.90 DF ≥ 0.90
Low Good High
(b) Disruption factor
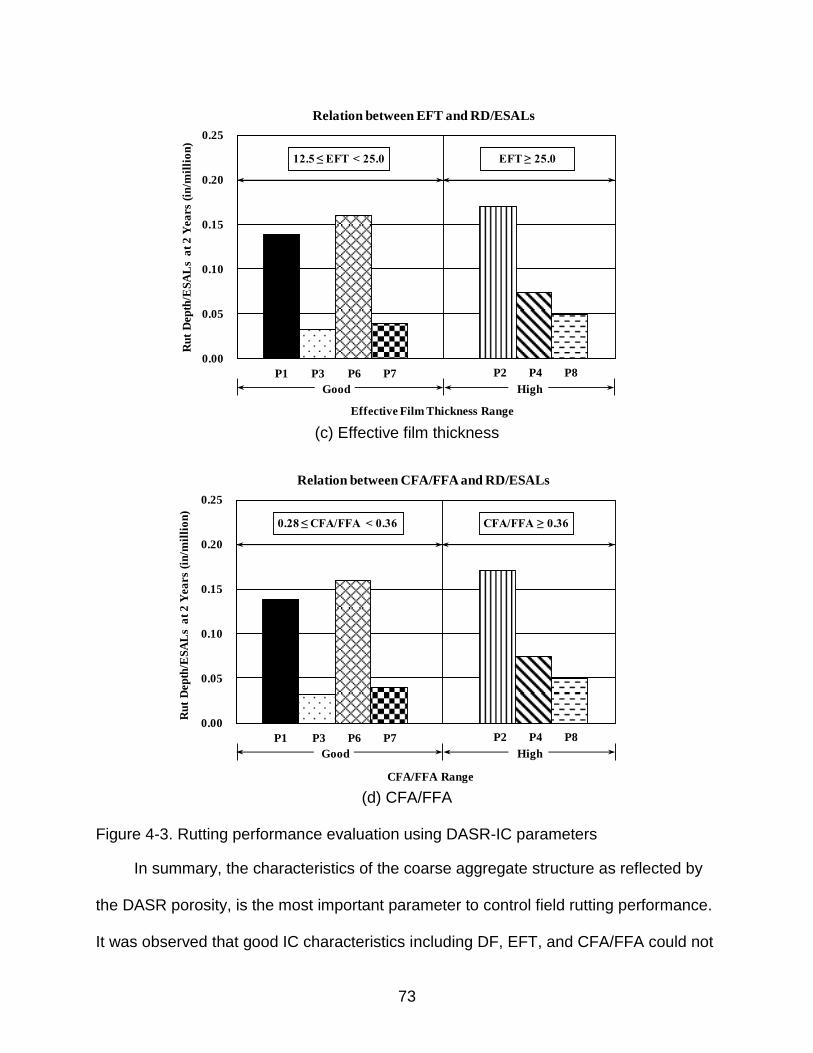
73
0.00
0.05
0.10
0.15
0.20
0.25
Ru
t D
ep
th/E
SA
Ls
at
2 Y
ea
rs
(in
/mil
lio
n)
Effective Film Thickness Range
Relation between EFT and RD/ESALs
P1 P3 P6 P7 P4 P8P2
12.5 ≤ EFT < 25.0 EFT ≥ 25.0
Good High
(c) Effective film thickness
0.00
0.05
0.10
0.15
0.20
0.25
Ru
t D
ep
th/E
SA
Ls
at
2 Y
ea
rs
(in
/mil
lio
n)
CFA/FFA Range
Relation between CFA/FFA and RD/ESALs
P1 P3 P6 P7 P4 P8P2
0.28 ≤ CFA/FFA < 0.36 CFA/FFA ≥ 0.36
Good High
(d) CFA/FFA
Figure 4-3. Rutting performance evaluation using DASR-IC parameters
In summary, the characteristics of the coarse aggregate structure as reflected by
the DASR porosity, is the most important parameter to control field rutting performance.
It was observed that good IC characteristics including DF, EFT, and CFA/FFA could not

74
overcome the problems associated with a mixture with DASR porosity outside the
acceptable range. Therefore, the DASR porosity criteria introduced appeared to provide
an effective tool that can accurately distinguish the field rutting performance of
Superpave mixtures.
4.4.2 Field Performance: Cracking
Field cracking performance was also monitored for the Superpave projects as part
of Superpave monitoring projects sponsored by FDOT. As the indicator of cracking
performance evaluation, crack initiation time for each project was estimated using the
approach based on the information obtained from comprehensive field investigation
conducted by the University of Florida research team and the crack rating history data
from the pavement condition survey (PCS) performed by the FDOT (Roque et al. 2011).
Figure 4-4 indicates the deterministic procedure used to estimate crack initiation time
based on PCS data for Projects 1 and 2. Appendix A includes the deterministic
procedure to estimate crack initiation time using crack rating data for all Superpave
projects evaluated.
0
1
2
3
4
5
6
7
8
9
10
0 10 20 30 40
Time (year)
Cra
ck
Ra
tin
g
P1
P2
Crack Initiation
at Year 10
Crack Initiation at Year 16
(linear extrapolation)
Figure 4-4. Determination of observed crack initiation time for Project 1 and 2
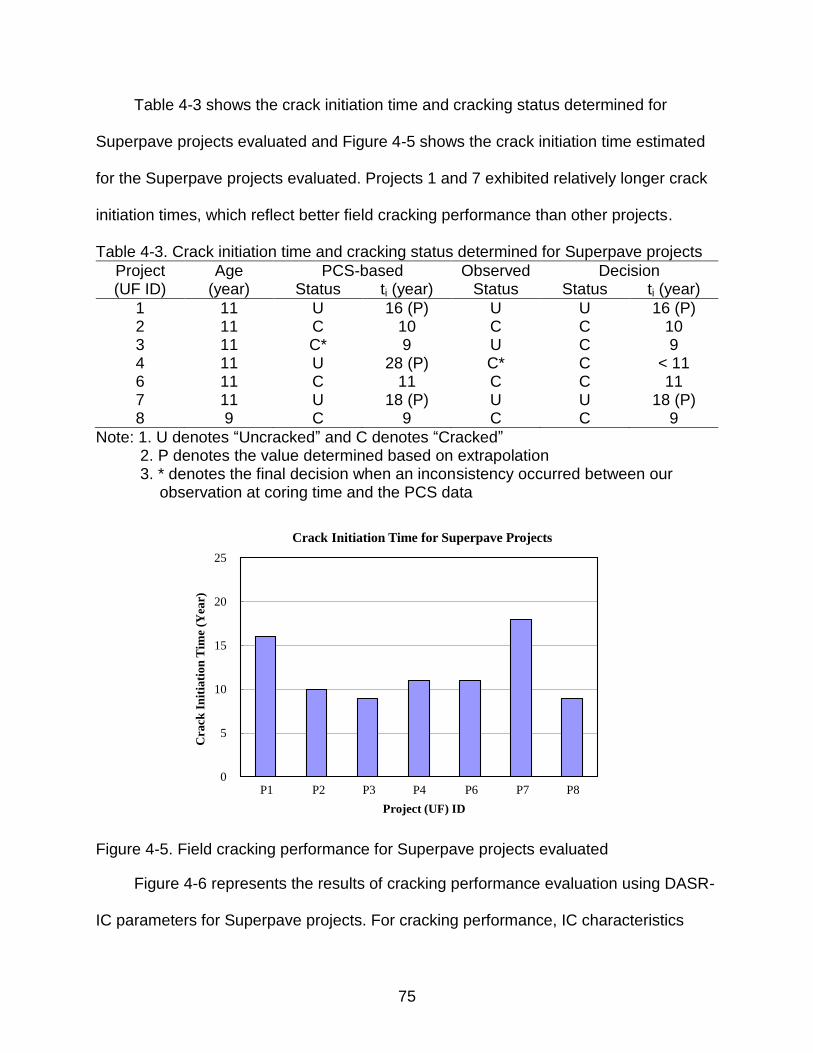
75
Table 4-3 shows the crack initiation time and cracking status determined for
Superpave projects evaluated and Figure 4-5 shows the crack initiation time estimated
for the Superpave projects evaluated. Projects 1 and 7 exhibited relatively longer crack
initiation times, which reflect better field cracking performance than other projects.
Table 4-3. Crack initiation time and cracking status determined for Superpave projects
Project (UF ID)
Age (year)
PCS-based Observed Decision Status ti (year) Status Status ti (year)
1 11 U 16 (P) U U 16 (P) 2 11 C 10 C C 10 3 11 C* 9 U C 9 4 11 U 28 (P) C* C < 11 6 11 C 11 C C 11 7 11 U 18 (P) U U 18 (P) 8 9 C 9 C C 9
Note: 1. U denotes “Uncracked” and C denotes “Cracked” 2. P denotes the value determined based on extrapolation 3. * denotes the final decision when an inconsistency occurred between our
observation at coring time and the PCS data
0
5
10
15
20
25
Cra
ck I
nit
iati
on
Tim
e (Y
ear)
Project (UF) ID
Crack Initiation Time for Superpave Projects
P1 P2 P3 P7 P8P6P4
Figure 4-5. Field cracking performance for Superpave projects evaluated
Figure 4-6 represents the results of cracking performance evaluation using DASR-
IC parameters for Superpave projects. For cracking performance, IC characteristics
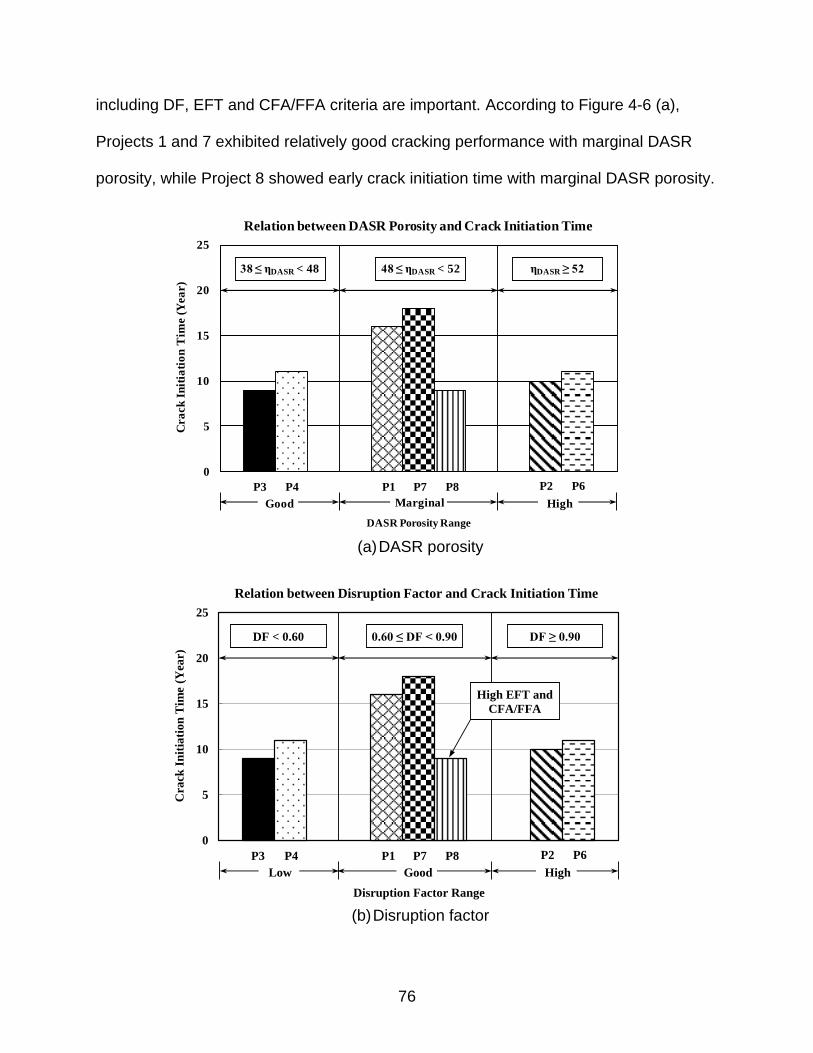
76
including DF, EFT and CFA/FFA criteria are important. According to Figure 4-6 (a),
Projects 1 and 7 exhibited relatively good cracking performance with marginal DASR
porosity, while Project 8 showed early crack initiation time with marginal DASR porosity.
0
5
10
15
20
25
Cra
ck
In
itia
tio
n T
ime (
Yea
r)
DASR Porosity Range
Relation between DASR Porosity and Crack Initiation Time
P3 P4 P1 P7 P2 P6P8
38 ≤ ηDASR < 48 48 ≤ ηDASR < 52 ηDASR ≥ 52
Good Marginal High
(a) DASR porosity
0
5
10
15
20
25
Cra
ck I
nit
iati
on
Tim
e (Y
ear)
Disruption Factor Range
Relation between Disruption Factor and Crack Initiation Time
P3 P4 P1 P7 P2 P6P8
DF < 0.60 0.60 ≤ DF < 0.90 DF ≥ 0.90
High EFT and
CFA/FFA
Low Good High
(b) Disruption factor

77
0
5
10
15
20
25
Cra
ck
In
itia
tio
n T
ime (
Yea
r)
Effective Film Thickness Range
Relation between EFT and Crack Initiation Time
P1 P3 P6 P7 P4 P8P2
12.5 ≤ EFT < 25.0 EFT ≥ 25.0
Good High
(c) Effective film thickness
0
5
10
15
20
25
Cra
ck
In
itia
tio
n T
ime (
Yea
r)
CFA/FFA Range
Relation between CFA/FFA and Crack Initiation Time
P1 P3 P6 P7 P4 P8P2
0.28 ≤ CFA/FFA < 0.36 CFA/FFA ≥ 0.36
Good High
(d) CFA/FFA
Figure 4-6. Cracking performance evaluation using DASR-IC parameters
However, all three Projects (Project 1, 7 and 8) indicated good ranges of DF as
shown in Figure 4-6 (b). In this case, the EFT and CFA/FFA, which characterize binder
78
distribution, fineness and aggregate structure of the IC, seemed to play an important
role on cracking performance. Figures 4-6 (c) and (d) show that Projects 1 and 7
exhibited good ranges of both EFT and CFA/FFA. Project 8 exhibited higher ranges of
EFT and CFA/FFA which potentially resulted in poor field cracking performance even
though it had a polymer-modified binder. It is noted that mixtures should have
acceptable ranges of EFT and CFA/FFA for adequate strain tolerance. The EFT and
CFA/FFA can be controlled by limiting fineness of the fine aggregate portion.
In addition, Figures 4-6 (c) and (d) indicate that mixtures with high EFT and
CFA/FFA clearly exhibited shorter crack initiation time, which reflects bad field cracking
performance, than mixtures with good EFT and CFA/FFA. However, Project 3 and 6
exhibited bad cracking performance, even though the EFT and CFA/FFA were within
the acceptable ranges. Gradation analysis results indicated that these two sections had
either low (Project 3) or high (Project 6) DF (see Figure 4-6 (b)). The effect of bad DF is
probably related to poor cracking performance for Projects 3 and 6. On the basis of field
cracking performance evaluation, it appeared that the DF criteria should be considered
in conjunction with EFT and CFA/FFA criteria to effectively distinguish the field cracking
performance.
4.5 Summary
A comprehensive field performance evaluation for both rutting and cracking was
conducted using the DASR-IC model parameters to identify and verify performance-
related criteria. Based on results analyzed, it was expected that the introduction of
DASR-IC criteria as performance-related design parameters to current mix design
guidelines and specifications will lead to better and more consistent field rutting and
cracking performance of Superpave mixtures. In addition, the DASR-IC criteria will also

79
provide a more rational method to consider the effect of IC on mixture behavior which
strongly affects HMA fracture properties. Therefore, it is expected that this criteria will
have a potential to identify the effect of mixture gradation and volumetric characteristics
on properties which is more reliably related to performance of asphalt mixtures.
80
CHAPTER 5 IDENTIFICATION OF PREDICTIVE MIXTURE PROPERTY RELATIONSHIPS AND
MODEL DEVELOPMENT
5.1 Background
The current lack of material property models that can accurately describe the
changes in material properties over time under field conditions is probably the greatest
deficiency in our ability to accurately predict pavement performance. Therefore, there is
a need to evaluate existing material property models and develop improved models for
use in the prediction of pavement performance.
Previous research has shown that fracture energy, which is associated with
mixture’s tolerance to damage, and creep rate, which is related to the rate of damage
accumulation in the mixture, were key material properties that affect cracking
performance of asphalt pavements (Sedwick 1998, and Zhang et al. 2001). Thusly, two
models, part of the Enhanced Hot-Mix Asphalt Fracture Mechanics based Model (HMA-
FM-E) developed during the completion of NCHRP Project 01-42A (Roque et al. 2010)
and directly associated with these two material properties were selected for evaluation
in this study. These are the AC stiffness (creep compliance) aging sub-model and the
fracture energy limit aging sub-model.
Superpave monitoring projects, recently conducted at the University of Florida
(UF), provided an unique opportunity to have material property data for several
pavements throughout their early pavement life cycles, and to evaluate the selected
material property models using this historical data. In addition, four Dominant Aggregate
Size Range-Interstitial Component (DASR-IC) model parameters were identified from
the Superpave monitoring projects to be strongly related to cracking performance of
asphalt mixtures: DASR porosity, disruption factor (DF), effective film thickness (EFT),
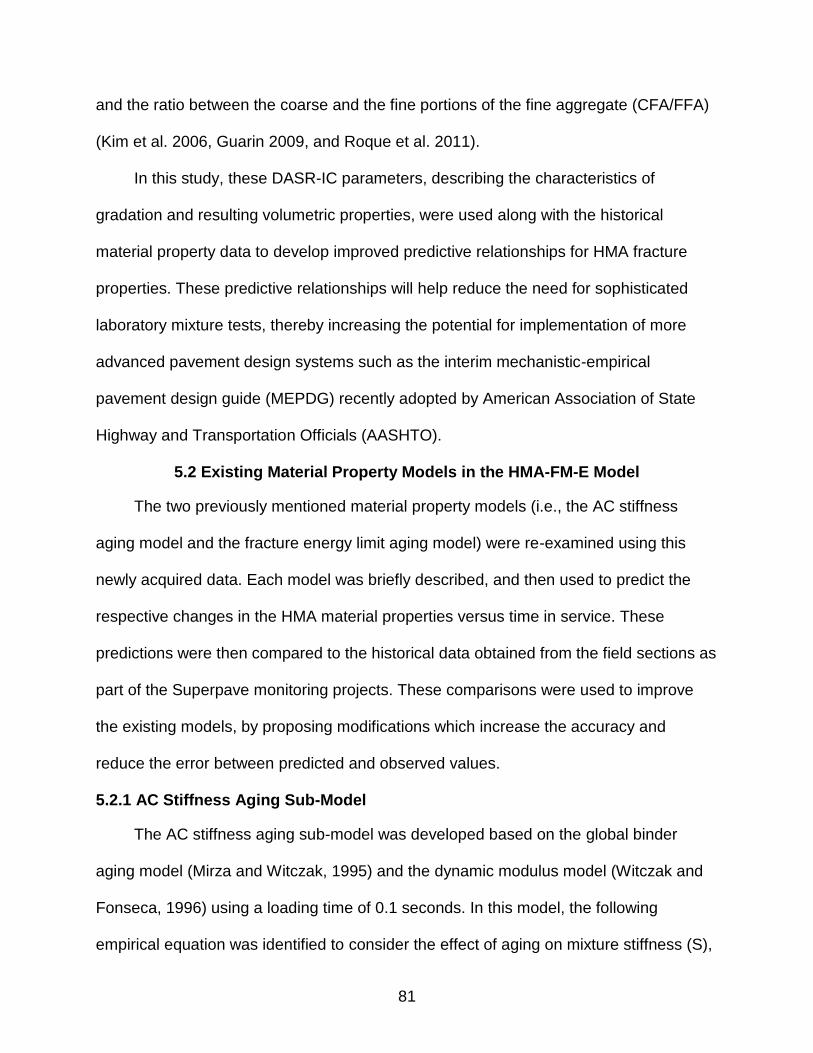
81
and the ratio between the coarse and the fine portions of the fine aggregate (CFA/FFA)
(Kim et al. 2006, Guarin 2009, and Roque et al. 2011).
In this study, these DASR-IC parameters, describing the characteristics of
gradation and resulting volumetric properties, were used along with the historical
material property data to develop improved predictive relationships for HMA fracture
properties. These predictive relationships will help reduce the need for sophisticated
laboratory mixture tests, thereby increasing the potential for implementation of more
advanced pavement design systems such as the interim mechanistic-empirical
pavement design guide (MEPDG) recently adopted by American Association of State
Highway and Transportation Officials (AASHTO).
5.2 Existing Material Property Models in the HMA-FM-E Model
The two previously mentioned material property models (i.e., the AC stiffness
aging model and the fracture energy limit aging model) were re-examined using this
newly acquired data. Each model was briefly described, and then used to predict the
respective changes in the HMA material properties versus time in service. These
predictions were then compared to the historical data obtained from the field sections as
part of the Superpave monitoring projects. These comparisons were used to improve
the existing models, by proposing modifications which increase the accuracy and
reduce the error between predicted and observed values.
5.2.1 AC Stiffness Aging Sub-Model
The AC stiffness aging sub-model was developed based on the global binder
aging model (Mirza and Witczak, 1995) and the dynamic modulus model (Witczak and
Fonseca, 1996) using a loading time of 0.1 seconds. In this model, the following
empirical equation was identified to consider the effect of aging on mixture stiffness (S),
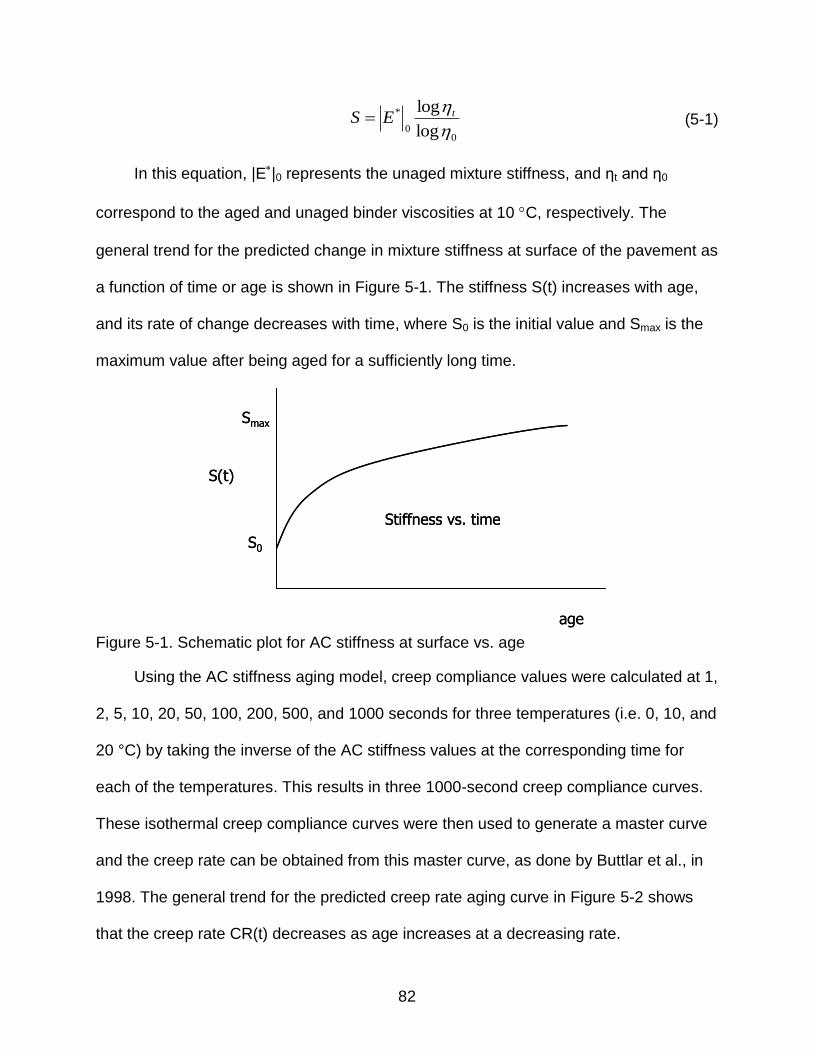
82
00
*
log
log
tES (5-1)
In this equation, |E|0 represents the unaged mixture stiffness, and ηt and η0
correspond to the aged and unaged binder viscosities at 10 C, respectively. The
general trend for the predicted change in mixture stiffness at surface of the pavement as
a function of time or age is shown in Figure 5-1. The stiffness S(t) increases with age,
and its rate of change decreases with time, where S0 is the initial value and Smax is the
maximum value after being aged for a sufficiently long time.
S(t)
age
Stiffness vs. time
Smax
S0
S(t)
age
Stiffness vs. time
Smax
S0
Figure 5-1. Schematic plot for AC stiffness at surface vs. age
Using the AC stiffness aging model, creep compliance values were calculated at 1,
2, 5, 10, 20, 50, 100, 200, 500, and 1000 seconds for three temperatures (i.e. 0, 10, and
20 °C) by taking the inverse of the AC stiffness values at the corresponding time for
each of the temperatures. This results in three 1000-second creep compliance curves.
These isothermal creep compliance curves were then used to generate a master curve
and the creep rate can be obtained from this master curve, as done by Buttlar et al., in
1998. The general trend for the predicted creep rate aging curve in Figure 5-2 shows
that the creep rate CR(t) decreases as age increases at a decreasing rate.
83
CR(t)
CRi
CRmin
age
Creep rate vs. time
Figure 5-2. Schematic plot for creep rate vs. age
The predicted trend in Figure 5-1 is generally consistent with observations from
the resilient modulus data during the early stages of pavement life. However, it is
different from the data obtained at later stages of pavement life, during which it was
found that the modulus actually decreases with age (Roque et al., 2011). It appears that
oxidative aging alone is not sufficient to account for the change in AC stiffness over time.
The effects of other factors on AC stiffness, such as load-induced damage, moisture-
related damage, and healing potential, need to be considered for more accurate
prediction. When the existing AC stiffness aging model is modified to include these key
factors, the creep rate aging curve will be affected due to the dependence of creep rate
on AC stiffness.
5.2.2 Fracture Energy Limit Aging Sub-Model
The fracture energy limit aging sub-model, also developed as part of the HMA-FM-
E model, is expressed in the following form.
(5-2)
Where, FEi is the initial fracture energy of the HMA and FEmin is the minimum
value of the FE after a sufficiently long aging period tinf. FEmin was estimated based on
1
min )()(k
niif tSFEFEFEtFE

84
experimental data obtained from field cores to be approximately 0.2 kJ/m3, and tinf is
fixed at 50 years. The exponent k1 is an aging parameter determined through field
calibration (Roque et al., 2010), and Sn(t) is the normalized change in stiffness (with
respect to its initial value) at the surface of the AC layer, and is expressed as,
(5-3)
Where, S(t), S0, and Smax were defined when describing Figure 5-1. Figure 5-3
shows that Sn(t) has the same form as Figure 5-1, and varies between zero and one.
Sn(t)
age
Normalized change in stiffness vs. time
1
0
0max
0)()(
SS
StStSn
Sn(t)
age
Normalized change in stiffness vs. time
1
0
0max
0)()(
SS
StStSn
Figure 5-3. Schematic plot for normalized change in AC stiffness vs. age
The predicted trend for the change in FE limit at the pavement surface as a
function of pavement age is presented in Figure 5-4. As can be seen, the FE limit
decreases with pavement age at a decreasing rate. This prediction generally agrees
with field observations from measured FE limit data. However, the effects of load-
induced damage, moisture-related damage, and healing potential on FE limit, which are
not considered in the existing model, could affect the change in FE at later stages of
pavement life (Roque et al., 2011). Therefore, it may be necessary to take these factors
into account to improve the accuracy of the model. It is also noted that initial fracture
0max
0)()(
SS
StStSn
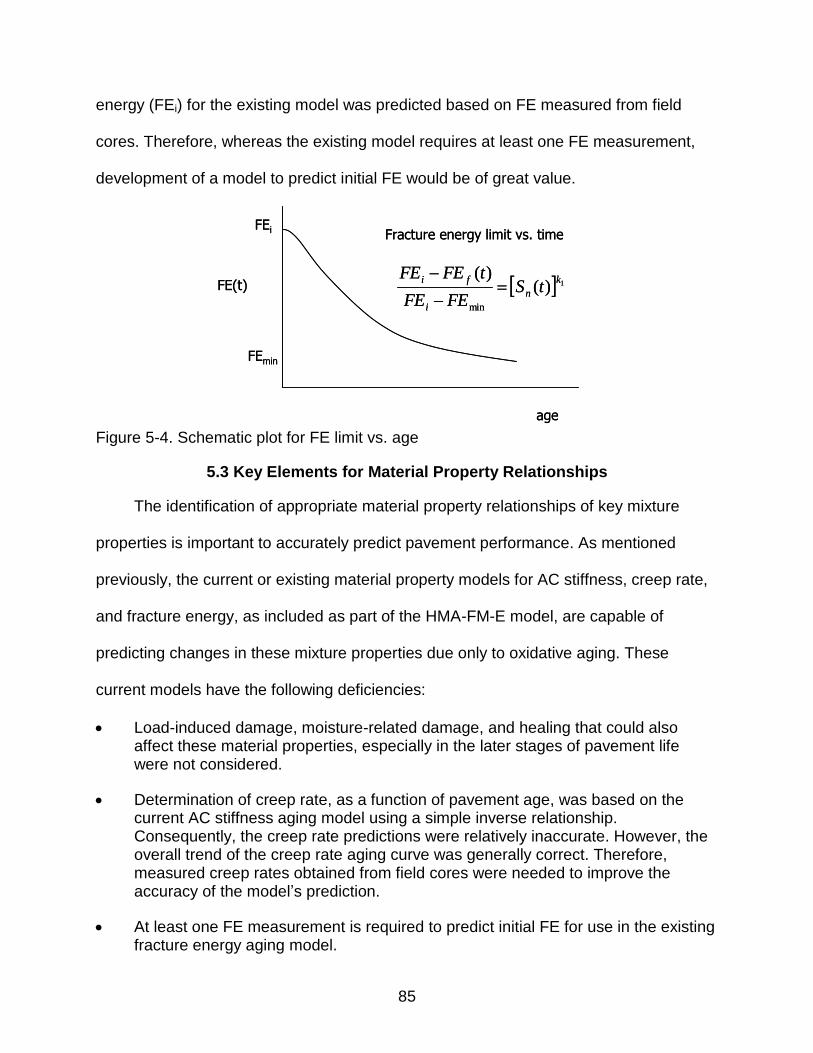
85
energy (FEi) for the existing model was predicted based on FE measured from field
cores. Therefore, whereas the existing model requires at least one FE measurement,
development of a model to predict initial FE would be of great value.
FE(t)
FEi
FEmin
age
Fracture energy limit vs. time
1)()(
min
k
n
i
fitS
FEFE
tFEFE
FE(t)
FEi
FEmin
age
Fracture energy limit vs. time
1)()(
min
k
n
i
fitS
FEFE
tFEFE
Figure 5-4. Schematic plot for FE limit vs. age
5.3 Key Elements for Material Property Relationships
The identification of appropriate material property relationships of key mixture
properties is important to accurately predict pavement performance. As mentioned
previously, the current or existing material property models for AC stiffness, creep rate,
and fracture energy, as included as part of the HMA-FM-E model, are capable of
predicting changes in these mixture properties due only to oxidative aging. These
current models have the following deficiencies:
Load-induced damage, moisture-related damage, and healing that could also affect these material properties, especially in the later stages of pavement life were not considered.
Determination of creep rate, as a function of pavement age, was based on the current AC stiffness aging model using a simple inverse relationship. Consequently, the creep rate predictions were relatively inaccurate. However, the overall trend of the creep rate aging curve was generally correct. Therefore, measured creep rates obtained from field cores were needed to improve the accuracy of the model’s prediction.
At least one FE measurement is required to predict initial FE for use in the existing fracture energy aging model.

86
Therefore, these existing mixture property models can be improved by
incorporating these physical and environmental factors. Also, there is a need to develop
models to predict initial fracture energy and creep rate, so that accurate model
predictions can be achieved without relying on physical measurements from field cores.
As illustrated in Figure 5-5, two of material property relationships were identified
and targeted for improvement and/or for additional development to meet these needs,
and these are described below.
Material property relationship I: This relationship associates or ties mixture gradation characteristics and volumetric properties to initial mixture properties, more specifically, the initial fracture energy and creep rate.
Material property relationship II: This relationship improves the models by changing the mixture properties over time, which takes into account the effects of load-induced damage, moisture-related damage, and mixture healing, in addition to standard oxidative aging.
Figure 5-5. Two material property relationships
5.3.1 DASR-IC Model Parameters
As part of Superpave monitoring project recently completed at the University of
Florida, field performance evaluation of different Superpave mixtures was conducted to
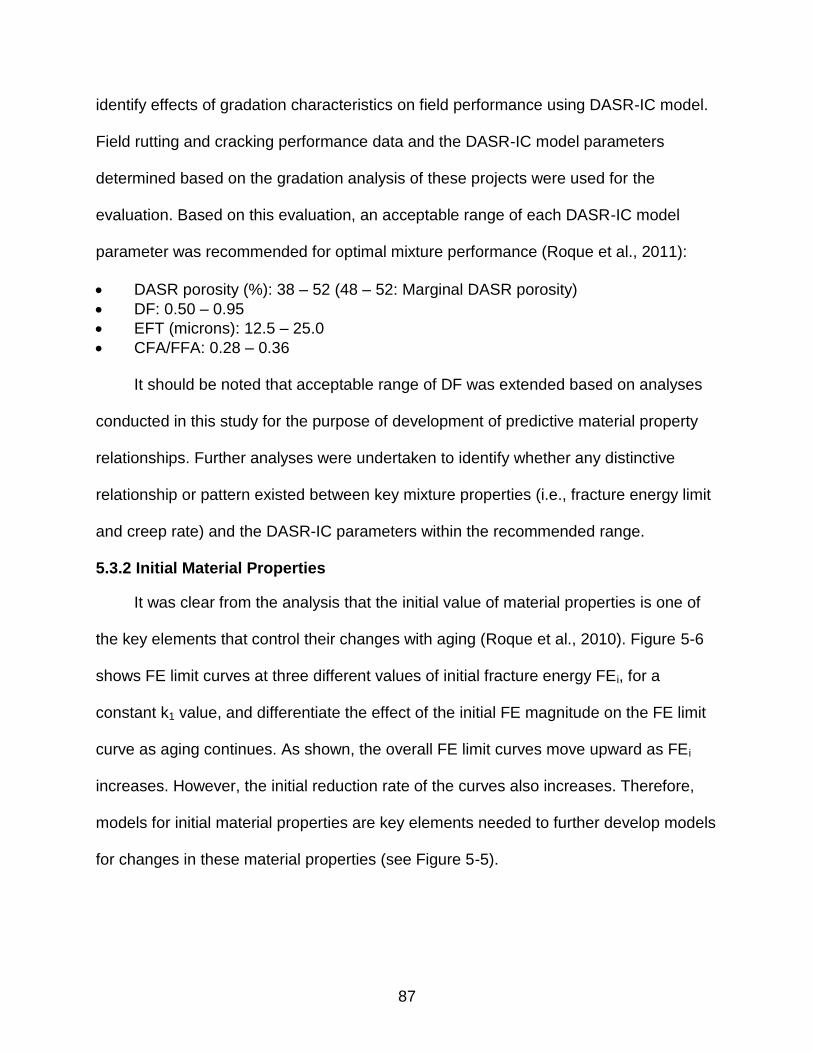
87
identify effects of gradation characteristics on field performance using DASR-IC model.
Field rutting and cracking performance data and the DASR-IC model parameters
determined based on the gradation analysis of these projects were used for the
evaluation. Based on this evaluation, an acceptable range of each DASR-IC model
parameter was recommended for optimal mixture performance (Roque et al., 2011):
DASR porosity (%): 38 – 52 (48 – 52: Marginal DASR porosity)
DF: 0.50 – 0.95
EFT (microns): 12.5 – 25.0
CFA/FFA: 0.28 – 0.36
It should be noted that acceptable range of DF was extended based on analyses
conducted in this study for the purpose of development of predictive material property
relationships. Further analyses were undertaken to identify whether any distinctive
relationship or pattern existed between key mixture properties (i.e., fracture energy limit
and creep rate) and the DASR-IC parameters within the recommended range.
5.3.2 Initial Material Properties
It was clear from the analysis that the initial value of material properties is one of
the key elements that control their changes with aging (Roque et al., 2010). Figure 5-6
shows FE limit curves at three different values of initial fracture energy FEi, for a
constant k1 value, and differentiate the effect of the initial FE magnitude on the FE limit
curve as aging continues. As shown, the overall FE limit curves move upward as FEi
increases. However, the initial reduction rate of the curves also increases. Therefore,
models for initial material properties are key elements needed to further develop models
for changes in these material properties (see Figure 5-5).
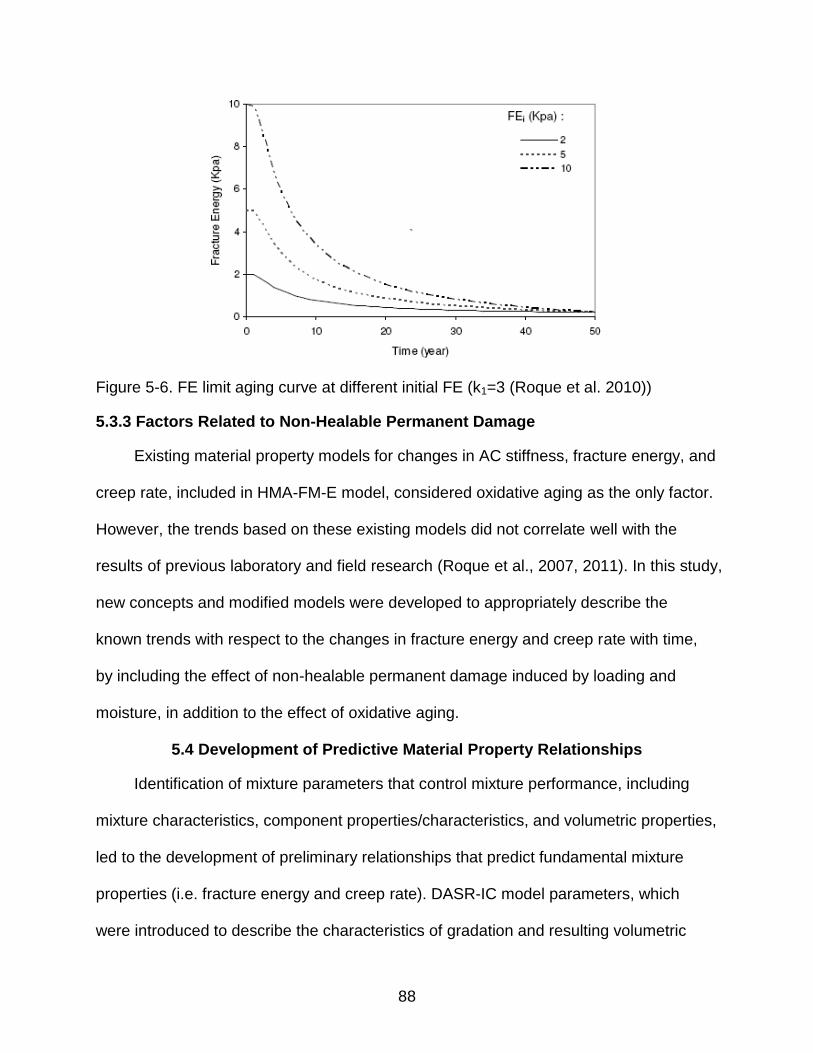
88
Figure 5-6. FE limit aging curve at different initial FE (k1=3 (Roque et al. 2010))
5.3.3 Factors Related to Non-Healable Permanent Damage
Existing material property models for changes in AC stiffness, fracture energy, and
creep rate, included in HMA-FM-E model, considered oxidative aging as the only factor.
However, the trends based on these existing models did not correlate well with the
results of previous laboratory and field research (Roque et al., 2007, 2011). In this study,
new concepts and modified models were developed to appropriately describe the
known trends with respect to the changes in fracture energy and creep rate with time,
by including the effect of non-healable permanent damage induced by loading and
moisture, in addition to the effect of oxidative aging.
5.4 Development of Predictive Material Property Relationships
Identification of mixture parameters that control mixture performance, including
mixture characteristics, component properties/characteristics, and volumetric properties,
led to the development of preliminary relationships that predict fundamental mixture
properties (i.e. fracture energy and creep rate). DASR-IC model parameters, which
were introduced to describe the characteristics of gradation and resulting volumetric
89
properties found to be the most strongly related to rutting and cracking performance of
asphalt mixtures, were used to develop initial property prediction models. In addition,
conceptual relationships were identified to describe changes in these properties over
time (aging). This can serve as the foundation for further development of improved
models to predict mixture properties as a function of age in the field. The verified
relationships will also serve to provide reliable inputs for prediction of service life using
pavement performance prediction models. Figure 5-7 shows the flowchart for
development of predictive material property relationships.
Figure 5-7. Flowchart for development of predictive material property relationships
5.4.1 Relationships for Initial Material Properties
As mentioned before, initial values of material properties are key elements
governing the changes in material properties over time. Therefore, models for initial
material properties are important for accurate prediction of their changes over time and
for accurate prediction of overall pavement performance. Two relationships for initial
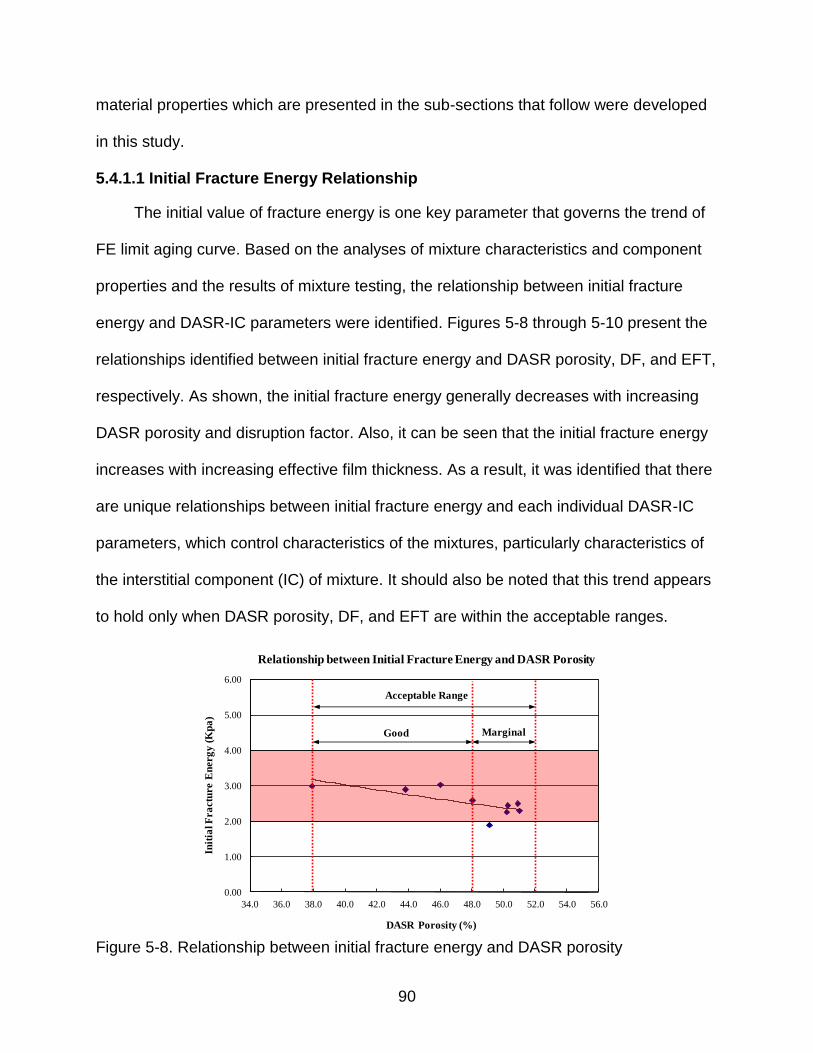
90
material properties which are presented in the sub-sections that follow were developed
in this study.
5.4.1.1 Initial Fracture Energy Relationship
The initial value of fracture energy is one key parameter that governs the trend of
FE limit aging curve. Based on the analyses of mixture characteristics and component
properties and the results of mixture testing, the relationship between initial fracture
energy and DASR-IC parameters were identified. Figures 5-8 through 5-10 present the
relationships identified between initial fracture energy and DASR porosity, DF, and EFT,
respectively. As shown, the initial fracture energy generally decreases with increasing
DASR porosity and disruption factor. Also, it can be seen that the initial fracture energy
increases with increasing effective film thickness. As a result, it was identified that there
are unique relationships between initial fracture energy and each individual DASR-IC
parameters, which control characteristics of the mixtures, particularly characteristics of
the interstitial component (IC) of mixture. It should also be noted that this trend appears
to hold only when DASR porosity, DF, and EFT are within the acceptable ranges.
0.00
1.00
2.00
3.00
4.00
5.00
6.00
34.0 36.0 38.0 40.0 42.0 44.0 46.0 48.0 50.0 52.0 54.0 56.0
Init
ial F
ra
ctu
re E
nerg
y (
Kp
a)
DASR Porosity (%)
Relationship between Initial Fracture Energy and DASR Porosity
Marginal
Acceptable Range
Good
Figure 5-8. Relationship between initial fracture energy and DASR porosity
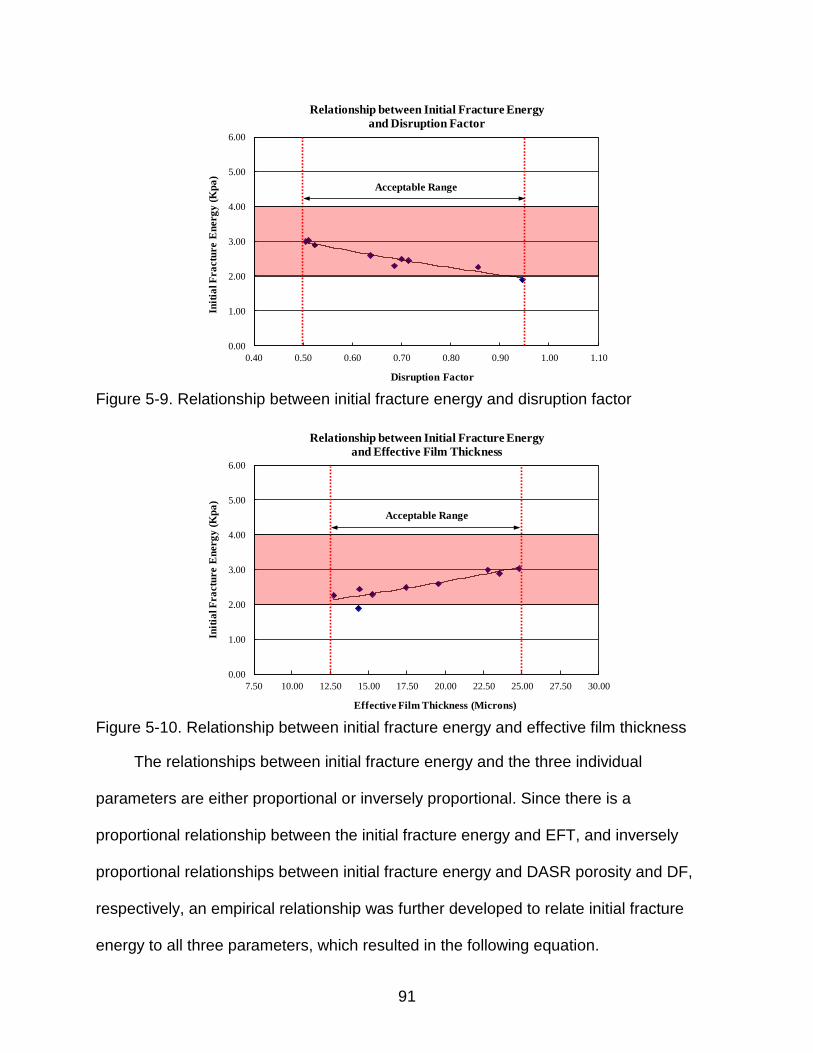
91
0.00
1.00
2.00
3.00
4.00
5.00
6.00
0.40 0.50 0.60 0.70 0.80 0.90 1.00 1.10
Init
ial F
ra
ctu
re E
nerg
y (
Kp
a)
Disruption Factor
Relationship between Initial Fracture Energy
and Disruption Factor
Acceptable Range
Figure 5-9. Relationship between initial fracture energy and disruption factor
0.00
1.00
2.00
3.00
4.00
5.00
6.00
7.50 10.00 12.50 15.00 17.50 20.00 22.50 25.00 27.50 30.00
Init
ial F
ra
ctu
re E
nerg
y (
Kp
a)
Effective Film Thickness (Microns)
Relationship between Initial Fracture Energy
and Effective Film Thickness
Acceptable Range
Figure 5-10. Relationship between initial fracture energy and effective film thickness
The relationships between initial fracture energy and the three individual
parameters are either proportional or inversely proportional. Since there is a
proportional relationship between the initial fracture energy and EFT, and inversely
proportional relationships between initial fracture energy and DASR porosity and DF,
respectively, an empirical relationship was further developed to relate initial fracture
energy to all three parameters, which resulted in the following equation.
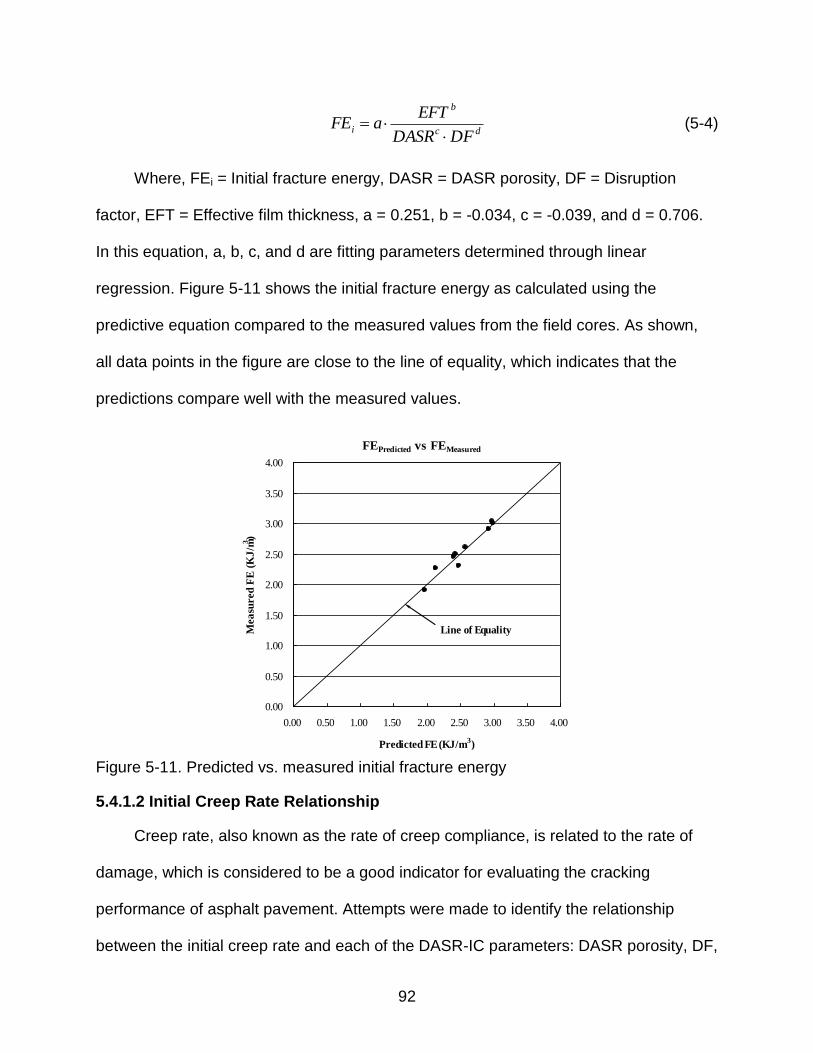
92
(5-4)
Where, FEi = Initial fracture energy, DASR = DASR porosity, DF = Disruption
factor, EFT = Effective film thickness, a = 0.251, b = -0.034, c = -0.039, and d = 0.706.
In this equation, a, b, c, and d are fitting parameters determined through linear
regression. Figure 5-11 shows the initial fracture energy as calculated using the
predictive equation compared to the measured values from the field cores. As shown,
all data points in the figure are close to the line of equality, which indicates that the
predictions compare well with the measured values.
FEPredicted vs FEMeasured
0.00
0.50
1.00
1.50
2.00
2.50
3.00
3.50
4.00
0.00 0.50 1.00 1.50 2.00 2.50 3.00 3.50 4.00
Predicted FE (KJ/m3)
Mea
sured
FE
(K
J/m
3)
Line of Equality
Figure 5-11. Predicted vs. measured initial fracture energy
5.4.1.2 Initial Creep Rate Relationship
Creep rate, also known as the rate of creep compliance, is related to the rate of
damage, which is considered to be a good indicator for evaluating the cracking
performance of asphalt pavement. Attempts were made to identify the relationship
between the initial creep rate and each of the DASR-IC parameters: DASR porosity, DF,
dc
b
iDFDASR
EFTaFE

93
and EFT. However, no distinct relationship or pattern was identified from the analysis. In
other words, there was no relationship between these three parameters and the initial
creep rate (see Figures 5-12 through 5-14). In these figures, “Solid Diamond (♦)”
denotes unmodified mixtures for which all DASR-IC parameters are within the ranges
considered to be acceptable, “Cross (x)” denotes unmodified mixtures for which at least
one of the DASR-IC parameters is not within the ranges considered to be acceptable,
and “Square (□)” denotes polymer-modified mixtures for which at least one of the
DASR-IC parameters is not within the ranges considered to be acceptable.
However, prior research conducted at the University of Florida has shown that
creep rate can be strongly influenced by parameters obtained using the DASR-IC model,
including properties and characteristics of the IC (Kim et al., 2006, Guarin, 2009, and
Roque et al., 2011). Therefore, it was expected that parameters other than those
discussed above could be identified to uniquely define the initial creep rate relationship.
0.00E+00
5.00E-09
1.00E-08
1.50E-08
2.00E-08
2.50E-08
3.00E-08
3.50E-08
30.0 35.0 40.0 45.0 50.0 55.0 60.0 65.0 70.0 75.0
Init
ial C
reep
Ra
te (
1/p
si∙s
ec)
DASR Porosity (%)
Relationship between Initial Creep Rate and
DASR Porosity
Unmodified: Met all DASR-IC criteria
Unmodified: Not all DASR-IC criteria are met
Modified: Not all DASR-IC criteria are met
Figure 5-12. Relationship between initial creep rate and DASR porosity
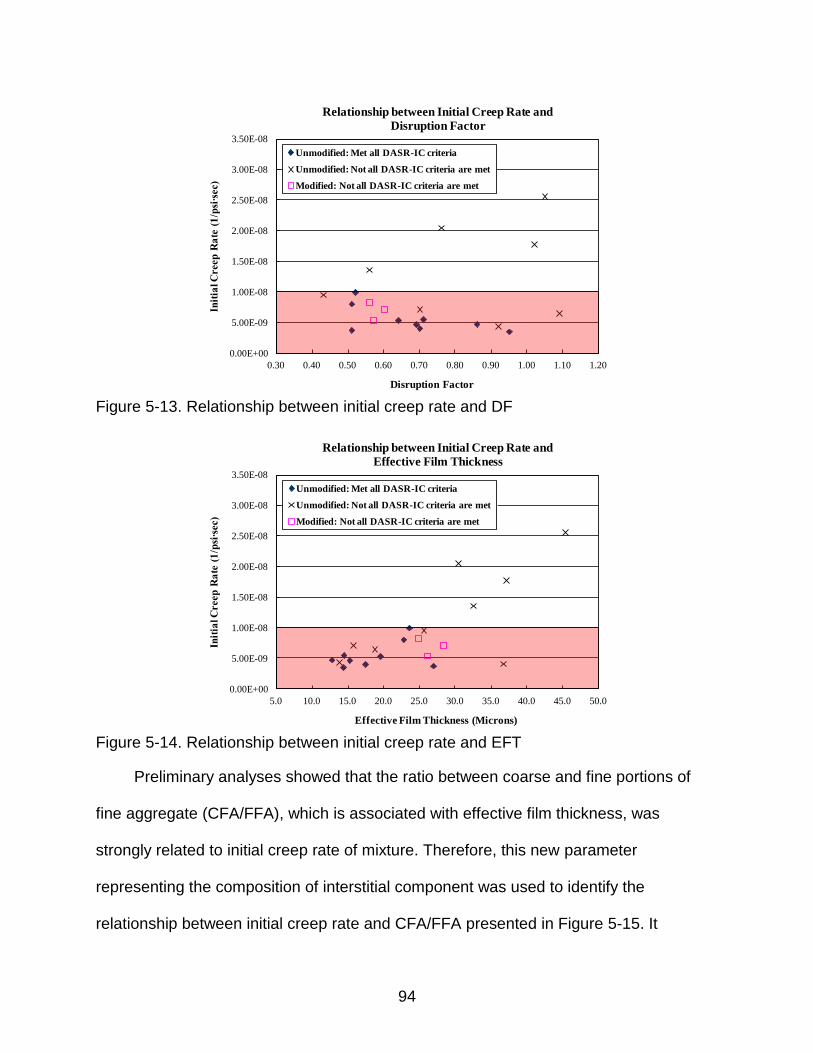
94
0.00E+00
5.00E-09
1.00E-08
1.50E-08
2.00E-08
2.50E-08
3.00E-08
3.50E-08
0.30 0.40 0.50 0.60 0.70 0.80 0.90 1.00 1.10 1.20
Init
ial C
reep
Ra
te (
1/p
si∙s
ec)
Disruption Factor
Relationship between Initial Creep Rate and
Disruption Factor
Unmodified: Met all DASR-IC criteria
Unmodified: Not all DASR-IC criteria are met
Modified: Not all DASR-IC criteria are met
Figure 5-13. Relationship between initial creep rate and DF
0.00E+00
5.00E-09
1.00E-08
1.50E-08
2.00E-08
2.50E-08
3.00E-08
3.50E-08
5.0 10.0 15.0 20.0 25.0 30.0 35.0 40.0 45.0 50.0
Init
ial C
reep
Ra
te (
1/p
si∙s
ec)
Effective Film Thickness (Microns)
Relationship between Initial Creep Rate and
Effective Film Thickness
Unmodified: Met all DASR-IC criteria
Unmodified: Not all DASR-IC criteria are met
Modified: Not all DASR-IC criteria are met
Figure 5-14. Relationship between initial creep rate and EFT
Preliminary analyses showed that the ratio between coarse and fine portions of
fine aggregate (CFA/FFA), which is associated with effective film thickness, was
strongly related to initial creep rate of mixture. Therefore, this new parameter
representing the composition of interstitial component was used to identify the
relationship between initial creep rate and CFA/FFA presented in Figure 5-15. It

95
appears that CFA/FFA is better correlated to initial creep rate than effective film
thickness. This may be explained by the fact that CFA/FFA reflects the effect of particle
interaction within the IC, whereas EFT does not.
0.00E+00
5.00E-09
1.00E-08
1.50E-08
2.00E-08
2.50E-08
3.00E-08
3.50E-08
0.26 0.28 0.30 0.32 0.34 0.36 0.38
Init
ial C
reep
Ra
te (
1/p
si∙s
ec)
CFA/FFA
Relationship between Initial Creep Rate and CFA/FFA
Acceptable Range
Figure 5-15. Relationship between initial creep rate and CFA/FFA
It also can be seen from Figure 5-15 that the initial creep rate generally increases
with increasing CFA/FFA. Similar to the initial fracture energy relationships, it is noted
that this relationship appears to hold only when CFA/FFA are within the acceptable
range.
In addition, it was found that the initial creep rate relationship can be applied to
mixtures with polymer modified binder. As shown in Figure 5-16, the continuous line
represents the initial creep rate relationship for mixtures with unmodified binder, while
the dashed line represents the relationship for mixtures with polymer modified binder. It
appears that polymer modification resulted in lower initial creep rate, even when not all
DASR-IC criteria were met. This observation is consistent with previous findings from

96
research that polymer modification generally helps to reduce the damage rate of asphalt
mixtures (Kim et al., 2003).
0.00E+00
5.00E-09
1.00E-08
1.50E-08
2.00E-08
2.50E-08
3.00E-08
3.50E-08
0.26 0.28 0.30 0.32 0.34 0.36 0.38 0.40 0.42 0.44
Init
ial C
reep
Ra
te (
1/p
si∙s
ec)
CFA/FFA
Relationship between Initial Creep Rate and CFA/FFA
Unmodified: Met all DASR-IC criteria
Modified: Not all DASR-IC criteria are met
Figure 5-16. Effect of polymer modification on relationship between initial creep rate and
CFA/FFA
Additional analyses were conducted to identify whether any clear pattern emerges
between the initial creep rate and any binder property parameters, specifically viscosity,
effective asphalt content, and G*∙sinδ. Figures 5-17 through 5-19 present the
relationships between initial creep rate and each of the parameters evaluated,
respectively.
According to analysis results, it appeared that these binder parameters were not
clearly correlated with initial creep rate. However, it was found that unmodified mixtures
that met all DASR-IC criteria exhibited relatively low initial creep rate as highlighted in
Figures 5-17 through 5-19. Unmodified mixtures that did not meet all DASR-IC criteria
exhibited a broad range of creep rate, indicating that inadequate gradation can result in
high damage rate even when binder properties are satisfactory.
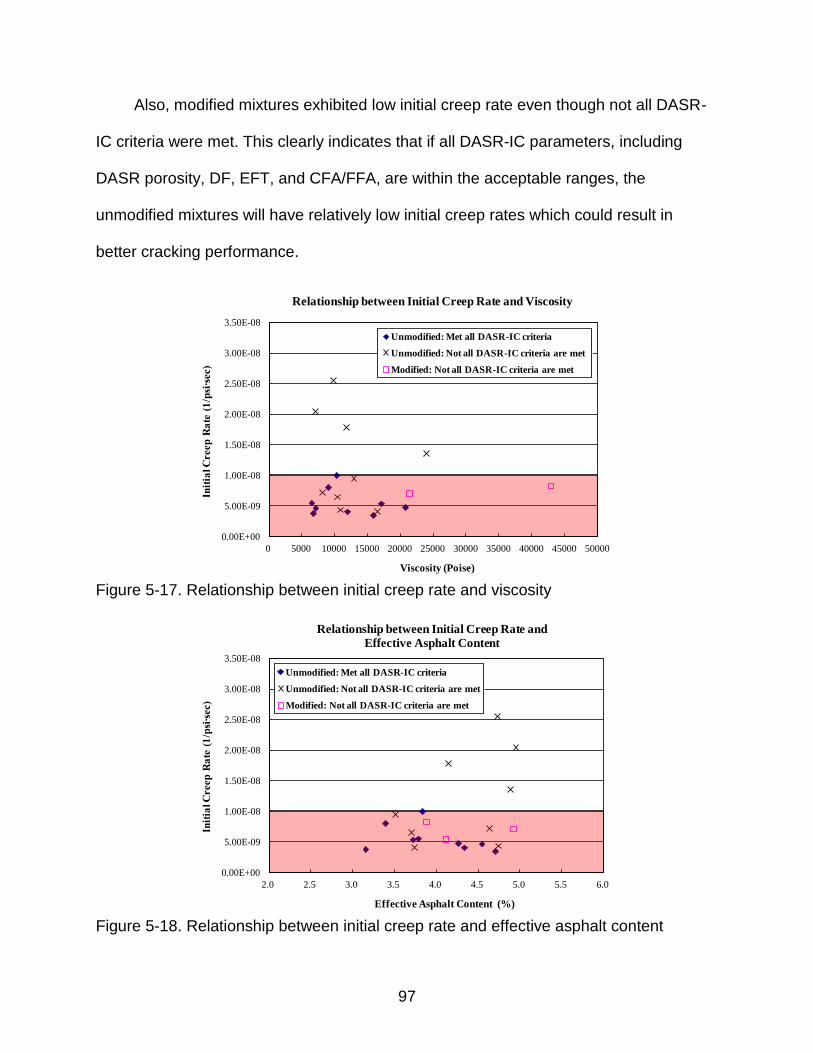
97
Also, modified mixtures exhibited low initial creep rate even though not all DASR-
IC criteria were met. This clearly indicates that if all DASR-IC parameters, including
DASR porosity, DF, EFT, and CFA/FFA, are within the acceptable ranges, the
unmodified mixtures will have relatively low initial creep rates which could result in
better cracking performance.
0.00E+00
5.00E-09
1.00E-08
1.50E-08
2.00E-08
2.50E-08
3.00E-08
3.50E-08
0 5000 10000 15000 20000 25000 30000 35000 40000 45000 50000
Init
ial C
reep
Ra
te (
1/p
si∙s
ec)
Viscosity (Poise)
Relationship between Initial Creep Rate and Viscosity
Unmodified: Met all DASR-IC criteria
Unmodified: Not all DASR-IC criteria are met
Modified: Not all DASR-IC criteria are met
Figure 5-17. Relationship between initial creep rate and viscosity
0.00E+00
5.00E-09
1.00E-08
1.50E-08
2.00E-08
2.50E-08
3.00E-08
3.50E-08
2.0 2.5 3.0 3.5 4.0 4.5 5.0 5.5 6.0
Init
ial C
reep
Ra
te (
1/p
si∙s
ec)
Effective Asphalt Content (%)
Relationship between Initial Creep Rate and
Effective Asphalt Content
Unmodified: Met all DASR-IC criteria
Unmodified: Not all DASR-IC criteria are met
Modified: Not all DASR-IC criteria are met
Figure 5-18. Relationship between initial creep rate and effective asphalt content
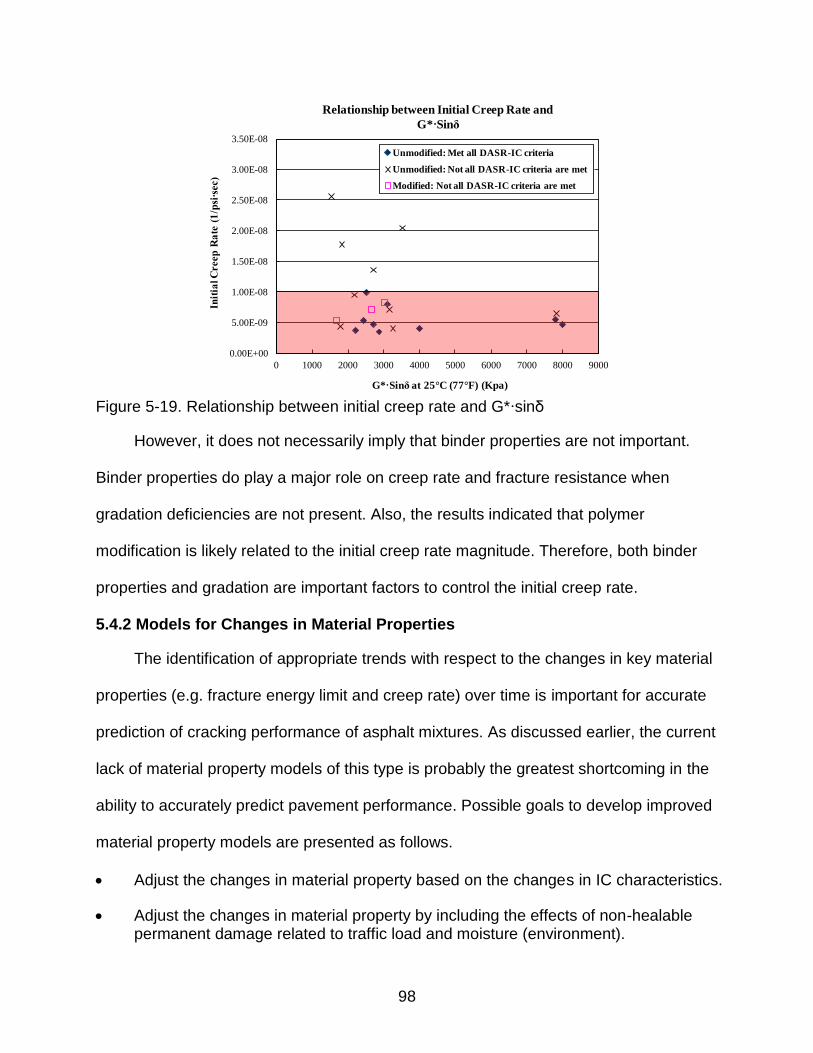
98
0.00E+00
5.00E-09
1.00E-08
1.50E-08
2.00E-08
2.50E-08
3.00E-08
3.50E-08
0 1000 2000 3000 4000 5000 6000 7000 8000 9000
Init
ial C
reep
Ra
te (
1/p
si∙s
ec)
G*∙Sinδ at 25°C (77°F) (Kpa)
Relationship between Initial Creep Rate and
G*∙Sinδ
Unmodified: Met all DASR-IC criteria
Unmodified: Not all DASR-IC criteria are met
Modified: Not all DASR-IC criteria are met
Figure 5-19. Relationship between initial creep rate and G*∙sinδ
However, it does not necessarily imply that binder properties are not important.
Binder properties do play a major role on creep rate and fracture resistance when
gradation deficiencies are not present. Also, the results indicated that polymer
modification is likely related to the initial creep rate magnitude. Therefore, both binder
properties and gradation are important factors to control the initial creep rate.
5.4.2 Models for Changes in Material Properties
The identification of appropriate trends with respect to the changes in key material
properties (e.g. fracture energy limit and creep rate) over time is important for accurate
prediction of cracking performance of asphalt mixtures. As discussed earlier, the current
lack of material property models of this type is probably the greatest shortcoming in the
ability to accurately predict pavement performance. Possible goals to develop improved
material property models are presented as follows.
Adjust the changes in material property based on the changes in IC characteristics.
Adjust the changes in material property by including the effects of non-healable permanent damage related to traffic load and moisture (environment).
99
However, due to the limited data available for this research, this part of the study
was limited to the recommendation of new concepts for modification of the two
candidate models under evaluation, i.e. AC stiffness (creep compliance) aging model
and fracture energy limit aging model.
5.4.2.1 AC Stiffness Model
As mentioned before, the existing model in Figure 5-1 showed that the AC
stiffness is continuously increasing with time. However, this trend does not coincide with
the results of prior laboratory, field, and accelerated pavement testing (APT) research,
which indicated that the stiffness generally reduces with time after a certain age (Roque
et al. 2007, 2011). Therefore, a new concept was proposed and modification of the
existing model was designed to appropriately describe the known trend of this property.
Figure 5-20 describes the proposed modification including the effect of non-healable
permanent damage related to load and moisture on the change in AC stiffness with time.
As shown in Figure 5-20, there is a critical time denoted as td which separates
pavement life into two stages. In the early stage, Stage I, there is no effect of non-
healable permanent damage (related to load and moisture) on changes in AC stiffness.
In Stage I, the trend of change in AC stiffness is mainly controlled by oxidative aging.
This indicates that the healing process is a dominant factor as compared to the damage
process in governing the trend of change in material property in this stage.
Also shown in Figure 5-20, the non-healable permanent damage process takes
control in Stage II. The non-healable permanent damage includes both load-induced
and moisture-related damage, which tends to reduce the AC stiffness after the critical
time. Clearly, determination of td is the first task in finalizing the proposed AC stiffness

100
model. The next challenge is how to quantify the effect of load-induced and moisture-
related damage on AC stiffness after the critical time.
S
agetd
Non-healable load damage
Moisture damage
Starting point of non-healable damage
Stage I Stage II
Figure 5-20. Proposed AC stiffness model
5.4.2.2 Fracture Energy Limit Model
The fracture energy limit aging model developed as part of the NCHRP Project 01-
42A showed that the FE limit generally decreases with aging, and eventually reaches
some minimum value after a sufficiently long time (see Figure 5-4). However, the results
of prior laboratory, field, and APT research did not coincide well with the trend
introduced in the existing model (Roque et al., 2007, 2011). Therefore, modification of
the existing model was designed to reasonably describe the observed trend of this
property.
Figure 5-21 presents the proposed modifications including the effect of the non-
healable permanent damage related to load and moisture on the change in fracture
energy limit with time. Since the fracture energy limit in the existing model was
associated with the AC stiffness in a normalized form (see Equation 5-2), the proposed
modifications for the existing fracture energy limit model (see Figure 5-21 (b)) are
related to the modified AC stiffness model (see Figure 5-21 (a)).

101
As shown in Figure 5-21, pavement life was separated into two stages by the
critical time td: In Stage I when mixture healing potential is high, it was assumed that
there is no permanent damage induced by load and moisture. Therefore, the existing
relationship for surface AC stiffness S(t), which accounts for the change in AC stiffness
due to only oxidative aging, was used for determination of the normalized change in
stiffness Sn(t). As a result, the existing relationship for fracture energy limit can be used
for this part of the model.
However, during Stage II when the time is greater than td, a modified relationship
for surface AC stiffness, termed Sd(t), was required to consider the permanent damage
effect on the change in AC stiffness with time (see Figure 5-21 (a)). As a result, the
normalized change in the modified AC stiffness can be expressed using the following
equation.
(5-5)
Where, Sdn(t) is the normalized change in stiffness Sd(t) defined for Stage II, and
Sd0 and Sdmin are stiffness values when Sd(t) is at t = td and t = 50 years, respectively.
Then, the modified FE limit aging function was introduced for Stage II by relating the
normalized change in FE limit to the normalized change in stiffness Sd(t) by a power of
k2, which is expressed in the following equation.
(5-6)
Where, FEd(t) is the fracture energy limit function defined for Stage II, FEd0 is the
value when FEd(t) is at t = td, k2 is aging parameter for Stage II, FEmin denotes minimum
FE, and Sdn(t) was defined in Equation 5-5.
min0
0 )()(
dd
dddn
SS
tSStS
2)()(
min0
0 k
dn
d
dd tSFEFE
tFEFE

102
It can also be seen from Figure 5-21, due to the incorporation of the permanent
damage effect, the modified fracture energy limit function (Stage II) has a higher rate of
reduction than the existing function, which is closer to the trend of the change in FE
over time actually measured from field cores.
S(t)
age
t > td
Smax
S0
t < td
td
Sdmin
Sd0
Stage I Stage II
min0
0 )()(
dd
dddn
SS
tSStS
1) For t < td (Stage I)
2) For t > td (Stage II)
0max
0)()(
SS
StStSn
Sd(t)
(a) Change in AC stiffness over time
1) For t < td (Stage I)
2) For t > td (Stage II)
FEf(t)
FEi
FEmin
agetd
FEd0t < td t > td
Stage I Stage II
1)()(
min
k
n
i
fitS
FEFE
tFEFE
2)()(
min0
0 k
dn
d
dd tSFEFE
tFEFE
FEd(t)
(b) Change in FE limit over time
Figure 5-21. Proposed FE limit model
In the case of the proposed fracture energy function, it is important to determine
the critical time td, which indicates the point when permanent damage starts affecting
the change in fracture energy with time. Also, the effect of non-healable permanent
103
damage due to load and moisture must be quantified in addition to the effect of
oxidative aging after the critical time.
5.5 Summary
Material property relationships were identified using material properties measured
from field cores over time and assigned DASR-IC model parameters calculated. Unique
relationships were identified between initial mixture properties (i.e. fracture energy and
creep) and DASR-IC parameters. It was found that the relationships for initial fracture
energy and creep rate appeared to work best when all DASR-IC parameters were within
the ranges considered to be acceptable. In addition, based on evaluation of existing
material property aging models, a new concept and modifications were proposed to
improve these models for more accurate prediction of changes in material properties
over time. Due to the limited data available for this study, a full model could not be
developed. Nevertheless, procedures to continue and complete the development of
improved models were recommended for future works.
104
CHAPTER 6 EVALUATION OF DASR-IC CRITERIA USING HMA-FM-E MODEL
6.1 Background
The primary purpose of this chapter is the evaluation of DASR-IC criteria with
regard to their relationships on field mixture performance using performance prediction
model recently developed at the University of Florida, Enhanced HMA Fracture
Mechanics Based Model (HMA-FM-E Model). Performance prediction effort using HMA-
FM-E Model is presented in Section 6.2 through 6.4, including a brief introduction to this
tool, its input module, and prediction results for Superpave projects evaluated. It is
noted that Project 8 has a Portland cement concrete base. Therefore, this section was
not included in this part of study.
6.2 Enhanced HMA Fracture Mechanics Based Model (HMA-FM-E Model)
The HMA-FM-E model was developed by the UF research team as part of the
NCHRP Project 01-42A to predict top-down cracking performance in HMA layers. As
indicated by the name, the model is an enhanced version of the existing HMA-FM
model, which is the result of the continuous efforts of the UF team over the past years
(Zhang et al. 2001, Roque et al. 2002, 2004, Sangpetngam et al. 2003, 2004, Kim et al.
2008). During the course of the NCHRP project, the enhanced performance model was
formed by developing and incorporating into the existing model appropriate sub-models
that account for effects of aging, healing, and transverse thermal stresses on top-down
cracking performance. Furthermore, the enhanced model was calibrated and validated
using data from Florida field sections (Roque et al. 2010).
The enhanced top-down cracking performance model has four major components,
as shown in the general model framework presented in Figure 6-1, including:
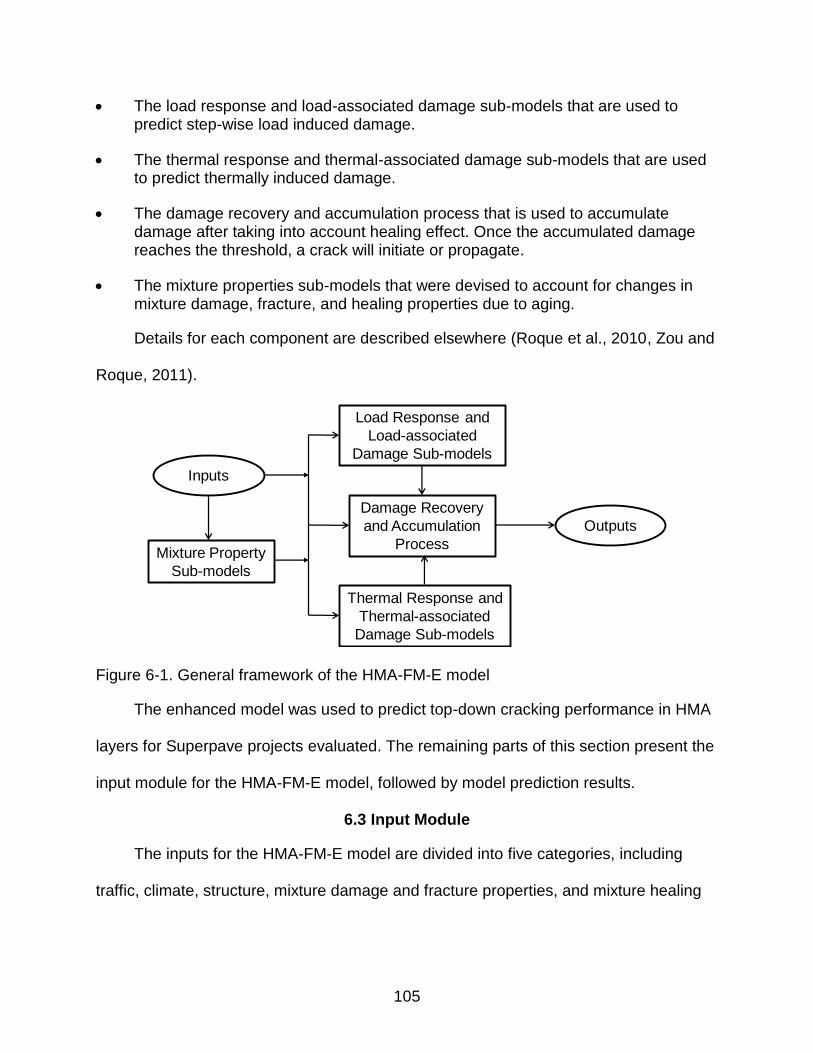
105
The load response and load-associated damage sub-models that are used to predict step-wise load induced damage.
The thermal response and thermal-associated damage sub-models that are used to predict thermally induced damage.
The damage recovery and accumulation process that is used to accumulate damage after taking into account healing effect. Once the accumulated damage reaches the threshold, a crack will initiate or propagate.
The mixture properties sub-models that were devised to account for changes in mixture damage, fracture, and healing properties due to aging.
Details for each component are described elsewhere (Roque et al., 2010, Zou and
Roque, 2011).
Mixture Property
Sub-models
Load Response and
Load-associated
Damage Sub-models
Thermal Response and
Thermal-associated
Damage Sub-models
Damage Recovery
and Accumulation
Process
Inputs
Outputs
Figure 6-1. General framework of the HMA-FM-E model
The enhanced model was used to predict top-down cracking performance in HMA
layers for Superpave projects evaluated. The remaining parts of this section present the
input module for the HMA-FM-E model, followed by model prediction results.
6.3 Input Module
The inputs for the HMA-FM-E model are divided into five categories, including
traffic, climate, structure, mixture damage and fracture properties, and mixture healing
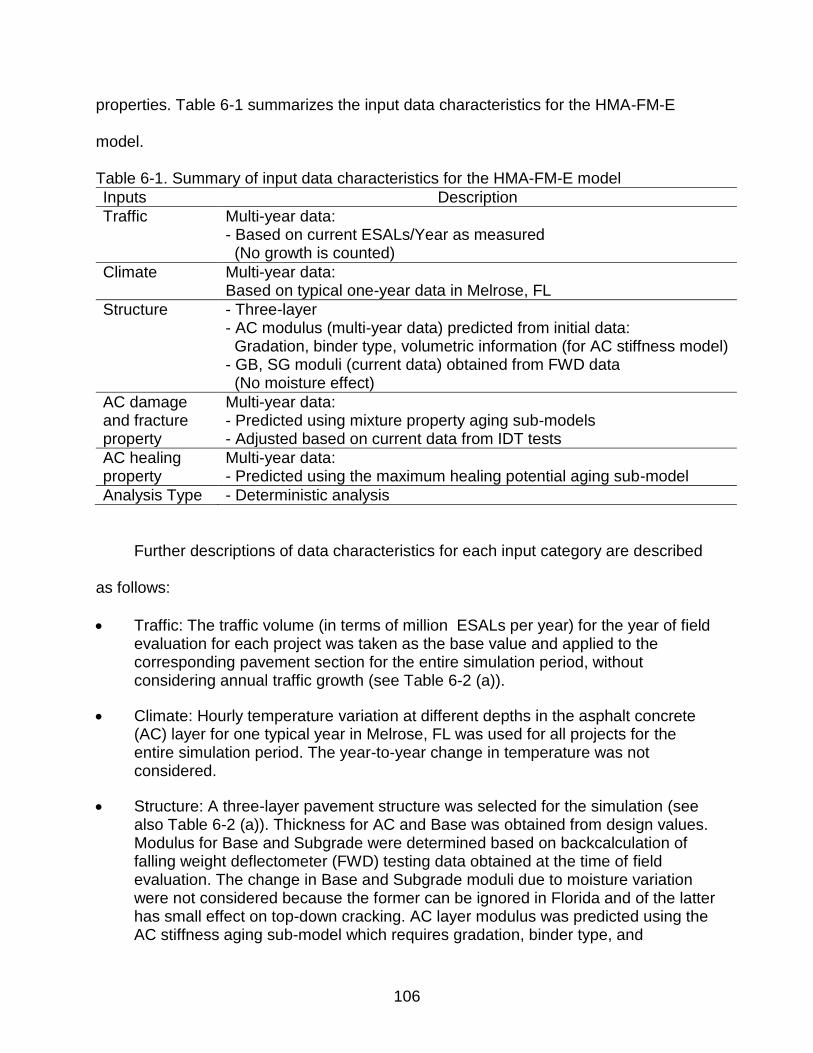
106
properties. Table 6-1 summarizes the input data characteristics for the HMA-FM-E
model.
Table 6-1. Summary of input data characteristics for the HMA-FM-E model
Inputs Description
Traffic Multi-year data: - Based on current ESALs/Year as measured (No growth is counted)
Climate Multi-year data: Based on typical one-year data in Melrose, FL
Structure - Three-layer - AC modulus (multi-year data) predicted from initial data: Gradation, binder type, volumetric information (for AC stiffness model) - GB, SG moduli (current data) obtained from FWD data (No moisture effect)
AC damage and fracture property
Multi-year data: - Predicted using mixture property aging sub-models - Adjusted based on current data from IDT tests
AC healing property
Multi-year data: - Predicted using the maximum healing potential aging sub-model
Analysis Type - Deterministic analysis
Further descriptions of data characteristics for each input category are described
as follows:
Traffic: The traffic volume (in terms of million ESALs per year) for the year of field evaluation for each project was taken as the base value and applied to the corresponding pavement section for the entire simulation period, without considering annual traffic growth (see Table 6-2 (a)).
Climate: Hourly temperature variation at different depths in the asphalt concrete (AC) layer for one typical year in Melrose, FL was used for all projects for the entire simulation period. The year-to-year change in temperature was not considered.
Structure: A three-layer pavement structure was selected for the simulation (see also Table 6-2 (a)). Thickness for AC and Base was obtained from design values. Modulus for Base and Subgrade were determined based on backcalculation of falling weight deflectometer (FWD) testing data obtained at the time of field evaluation. The change in Base and Subgrade moduli due to moisture variation were not considered because the former can be ignored in Florida and of the latter has small effect on top-down cracking. AC layer modulus was predicted using the AC stiffness aging sub-model which requires gradation, binder type, and
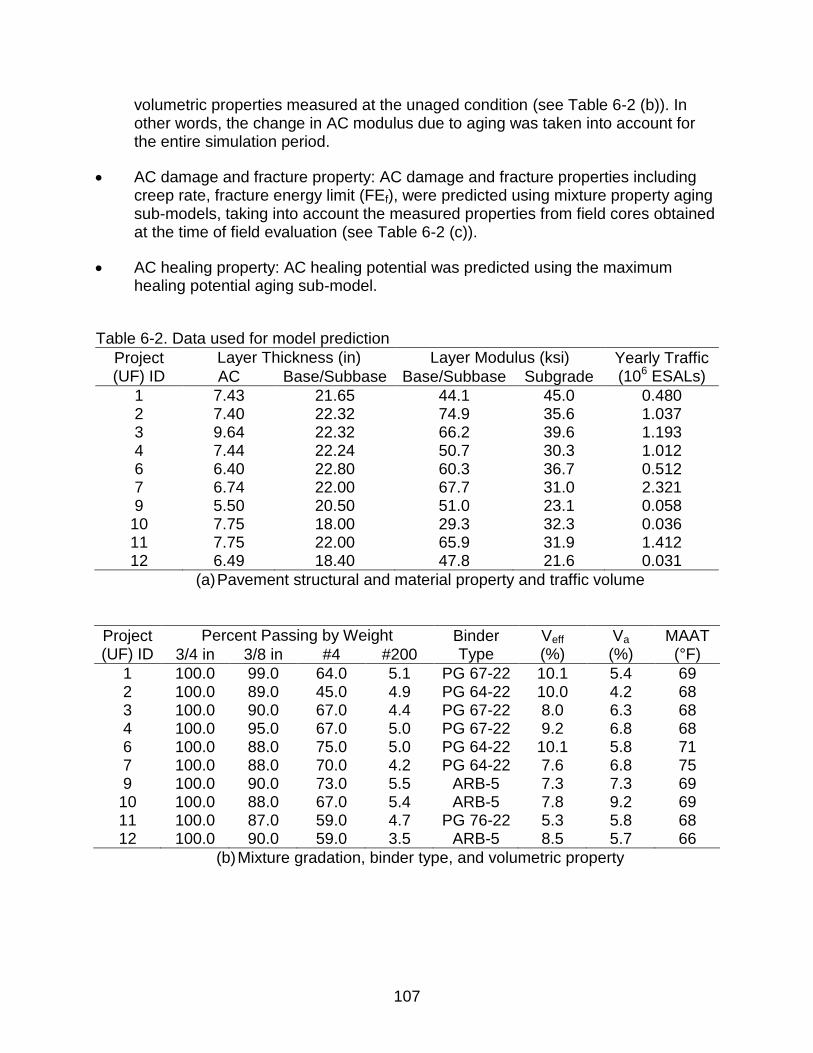
107
volumetric properties measured at the unaged condition (see Table 6-2 (b)). In other words, the change in AC modulus due to aging was taken into account for the entire simulation period.
AC damage and fracture property: AC damage and fracture properties including creep rate, fracture energy limit (FEf), were predicted using mixture property aging sub-models, taking into account the measured properties from field cores obtained at the time of field evaluation (see Table 6-2 (c)).
AC healing property: AC healing potential was predicted using the maximum healing potential aging sub-model.
Table 6-2. Data used for model prediction
Project (UF) ID
Layer Thickness (in) Layer Modulus (ksi) Yearly Traffic (106 ESALs) AC Base/Subbase Base/Subbase Subgrade
1 7.43 21.65 44.1 45.0 0.480 2 7.40 22.32 74.9 35.6 1.037 3 9.64 22.32 66.2 39.6 1.193 4 7.44 22.24 50.7 30.3 1.012 6 6.40 22.80 60.3 36.7 0.512 7 6.74 22.00 67.7 31.0 2.321 9 5.50 20.50 51.0 23.1 0.058 10 7.75 18.00 29.3 32.3 0.036 11 7.75 22.00 65.9 31.9 1.412 12 6.49 18.40 47.8 21.6 0.031
(a) Pavement structural and material property and traffic volume
Project (UF) ID
Percent Passing by Weight Binder Type
Veff (%)
Va (%)
MAAT (°F) 3/4 in 3/8 in #4 #200
1 100.0 99.0 64.0 5.1 PG 67-22 10.1 5.4 69 2 100.0 89.0 45.0 4.9 PG 64-22 10.0 4.2 68 3 100.0 90.0 67.0 4.4 PG 67-22 8.0 6.3 68 4 100.0 95.0 67.0 5.0 PG 67-22 9.2 6.8 68 6 100.0 88.0 75.0 5.0 PG 64-22 10.1 5.8 71 7 100.0 88.0 70.0 4.2 PG 64-22 7.6 6.8 75 9 100.0 90.0 73.0 5.5 ARB-5 7.3 7.3 69 10 100.0 88.0 67.0 5.4 ARB-5 7.8 9.2 69 11 100.0 87.0 59.0 4.7 PG 76-22 5.3 5.8 68 12 100.0 90.0 59.0 3.5 ARB-5 8.5 5.7 66
(b) Mixture gradation, binder type, and volumetric property

108
Project (UF) ID
Age of Cores
(Years)
T=10 °C T=20 °C Master Curve MR
(Gpa) St
(Mpa) FEf
(Kpa) D (103 s) (1/Gpa)
D (103 s) (1/Gpa)
m D1
(1/Gpa)
1 11 12.93 2.38 1.90 1.618 3.906 0.564 0.042 2 11 8.16 1.76 2.97 4.515 19.059 0.720 0.045 3 11 8.92 1.85 1.60 2.475 20.704 0.736 0.026 4 11 7.29 1.39 1.35 2.476 14.355 0.662 0.041 6 11 9.08 1.61 1.13 1.417 5.320 0.495 0.058 7 11 9.46 1.97 1.70 1.343 4.616 0.476 0.071 9 7 9.61 1.39 0.55 0.929 2.631 0.473 0.042
10 7 14.63 2.73 1.33 0.558 2.584 0.563 0.014 11 6 7.59 1.49 1.45 1.857 6.649 0.493 0.083 12 6 12.45 1.92 1.23 1.462 5.266 0.550 0.039
(c) Mixture fracture and damage property
6.4 Model Prediction Results
The predicted relative crack depth (CDr), crack amount (CA), and crack status for
top-down cracking for each Superpave projects evaluated are presented in Table 6-3. It
shows that at the time of field evaluation, two out of the ten sections (Project 3 and 4)
had reached maximum crack amount to failure (CAmax), two (Project 6 and 7) just
started to crack, three (Project 2, 9, and 11) did not but were about to crack, and the
rest (Project 1, 10, and 12) were far from crack initiation.
It can also be seen from Table 6-3 that project sections 3 and 4 had worse
cracking performance in terms of shorter crack initiation time (ti) and higher average
crack growth rate (Gt) than the other sections, while project section 1 had the best
performance. Further discussion of the prediction results, including the increment of top-
down crack amount over time and the relationships between the DASR-IC criteria and
top-down cracking performance for individual projects, will be presented in the section
6.5.

109
Table 6-3. Predicted top-down cracking performance using HMA-FM-E model
Project (UF) ID
Time of Evaluation
(Year)
HMA-FM-E Top-Down Cracking Predictions
CDr (%) CA
(ft/100ft) Predicted
Status CAi
(ft/100ft) ti
(Year) Gt
(ft/year)
1 11 2.2 14.5 U 22.2 16.9 63.7 2 11 2.9 19.2 U 22.3 12.8 100.0 3 11 50.0 330.0 C 17.1 6.9 153.0 4 11 50.0 330.0 C 22.2 5.9 198.8 6 11 10.7 70.5 C 25.8 9.5 101.3 7 11 8.2 54.3 C 24.5 10.0 108.5 9 7 4.1 27.4 U 30.0 7.7 97.7
10 7 1.5 10.1 U 21.3 14.7 66.1 11 6 2.8 18.8 U 21.3 6.8 133.8 12 6 1.5 9.7 U 25.4 15.8 63.6
Note: 1. In HMA-FM-E, CDr was defined as crack depth over AC layer thickness (in %), and CAmax was determined to be 330ft/100ft when CDr is equal to 50 %.
2. CAi is crack amount at crack initiation.
Figure 6-2 represents the predictions development of top-down crack amount over
time. As shown, Projects 3, 4, and 11 exhibited relatively bad cracking performance with
shorter crack initiation time (ti) and higher average crack growth rate (Gt) than rest of the
projects, while Projects 1, 10, and 12 showed good field cracking performance.
0
50
100
150
200
250
300
350
400
0 5 10 15 20
CA
(ft
/10
0ft
)
Age (year)
Sp3
Sp4
Sp11
Top-down Cracking:
(a) Bad performance sections
Project ti (year) Gt (ft/Yr)
3 6.9 153.0
4 5.9 198.8
11 6.8 133.8

110
0
50
100
150
200
250
300
350
400
5 10 15 20 25
CA
(ft
/10
0ft
)
Age (year)
Sp2
Sp6
Sp7
Sp9
Top-down Cracking:
(b) Intermediate performance sections
0
50
100
150
200
250
300
350
400
10 15 20 25 30
CA
(ft
/10
0ft
)
Age (year)
Sp1
Sp10
Sp12
Top-down Cracking:
(c) Good performance sections
Figure 6-2. Predicted crack amount increase over time using HMA-FM-E model
6.5 Relationships between DASR-IC Criteria and Model Prediction Results
Attempts were made to assess preliminary DASR-IC criteria established based on
the comprehensive field performance evaluation of Superpave projects, including DASR
Project ti (year) Gt (ft/Yr)
2 12.8 100.0
6 9.5 101.3
7 10.0 108.5
9 7.7 97.7
Project ti (year) Gt (ft/Yr)
1 16.9 63.7
10 14.7 66.1
12 15.8 63.6

111
porosity, DF, EFT, and CFA/FFA, for consistently enhanced cracking performance. The
predicted top-down cracking performance in terms of crack initiation time (ti) and
average crack growth rate (Gt) were used along with DASR-IC parameters determined
for each Superpave projects. For evaluation, all projects were grouped based on ranges
of crack initiation time (ti) and average crack growth rate (Gt) predicted by HMA-FM-E
model. All project sections were also categorized considering ranges of DASR-IC
parameters preliminarily determined to identify and evaluate the relationship between
DASR-IC criteria and performance model prediction results.
For crack initiation time (ti, year):
Bad performance sections: ti < 7
Intermediate performance sections: 7 ≤ ti < 13
Good performance sections: ti ≥ 13
For average crack growth rate (Gt, ft/year):
Bad performance sections: Gt ≥ 130
Intermediate performance sections: 70 ≤ Gt < 130
Good performance sections: Gt < 70
For DASR-IC criteria:
Mixtures that met all DASR-IC criteria
Mixtures that not all DASR-IC criteria are met
Figures 6-3 (a) and (b) show the relationships between performance model
prediction results, including crack initiation time (ti) and average crack growth rate (Gt),
and the DASR-IC criteria, respectively. According to result shown in Figure 6-3 (a), it
was found that projects that met all DASR-IC criteria exhibited relatively long crack
initiation time (ti) (i.e. good or intermediate ranges of crack initiation time), while projects
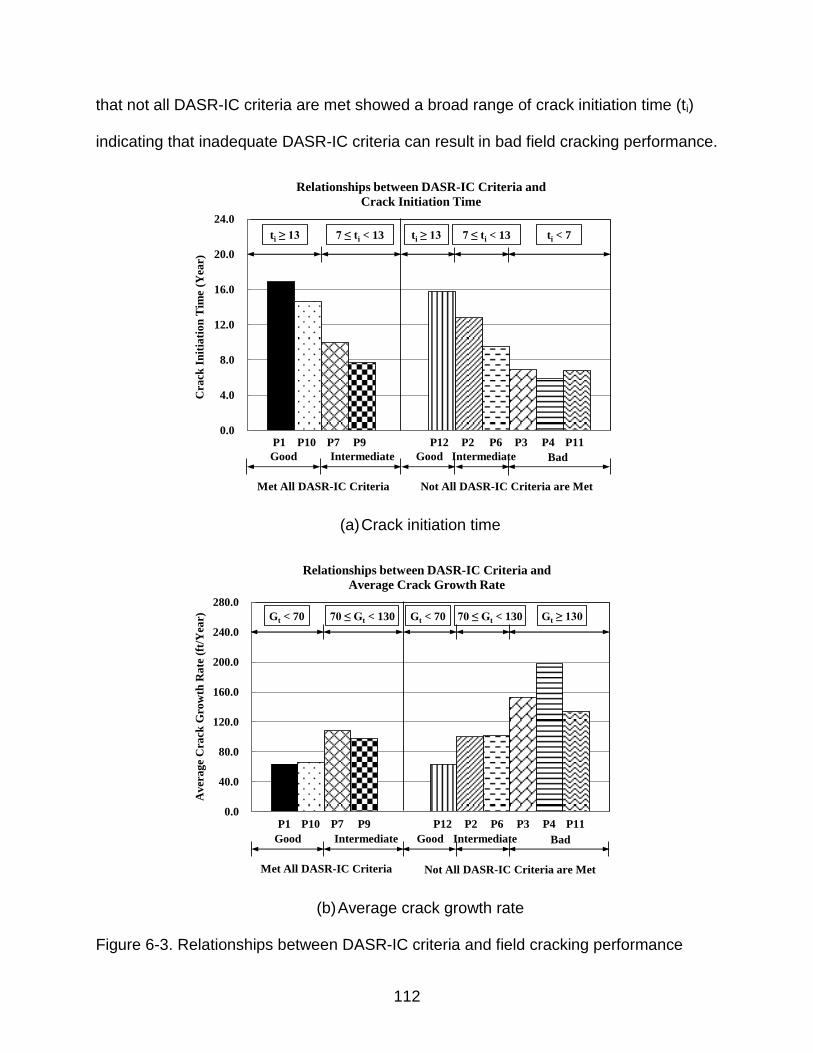
112
that not all DASR-IC criteria are met showed a broad range of crack initiation time (ti)
indicating that inadequate DASR-IC criteria can result in bad field cracking performance.
0.0
4.0
8.0
12.0
16.0
20.0
24.0
Cra
ck I
nit
iati
on
Tim
e (Y
ear)
Relationships between DASR-IC Criteria and
Crack Initiation Time
P1 P10 P7 P9 P12 P2 P6 P3 P4 P11
Met All DASR-IC Criteria Not All DASR-IC Criteria are Met
Good Intermediate BadGood Intermediate
ti ≥ 13 7 ≤ ti < 13ti ≥ 13 7 ≤ ti < 13 ti < 7
(a) Crack initiation time
0.0
40.0
80.0
120.0
160.0
200.0
240.0
280.0
Av
era
ge
Cra
ck G
row
th R
ate
(ft
/Yea
r)
Relationships between DASR-IC Criteria and
Average Crack Growth Rate
Met All DASR-IC Criteria Not All DASR-IC Criteria are Met
P1 P10 P7 P9 P12 P2 P6 P3 P4 P11
Good Intermediate BadGood Intermediate
Gt < 70 70 ≤ Gt < 130Gt < 70 70 ≤ Gt < 130 Gt ≥ 130
(b) Average crack growth rate
Figure 6-3. Relationships between DASR-IC criteria and field cracking performance

113
In addition, result in Figure 6-3 (b) shows that projects that met all DASR-IC
criteria exhibited relatively low average crack growth rate (Gt) (i.e. good or intermediate
ranges of average crack growth rate), while projects that not all DASR-IC criteria are
met showed a wide range of average crack growth rate (Gt) including range considered
as bad performance. These results clearly indicate that if all DASR-IC parameters,
including DASR porosity, DF, EFT, and CFA/FFA, are within the acceptable ranges,
mixtures will have relatively good cracking performance in the field.
6.6 Summary
Preliminary DASR-IC criteria established in this study was evaluated to identify
and verify their relationships on field cracking performance using model prediction
results. Results indicated that acceptable ranges of DASR-IC parameters will result in
consistently enhanced field cracking performance. Therefore, it appeared that the
introduction of DASR-IC criteria as performance-related design parameters to current
mix design guidelines and specifications will lead to better and more consistent field
performance of Superpave mixtures. However, current criteria preliminarily established
need to be further validated and refined using additional field and laboratory data.
114
CHAPTER 7 CLOSURE
7.1 Summary and Findings
This study was conducted to evaluate the effect of mixture component
characteristics (i.e., DASR and IC) on properties and performance of Superpave
mixtures, specializing in the development of a set of implementable gradation and
volumetric criteria, and Hot-Mix Asphalt (HMA) mixture property predictive relationships
based on mixture component characterization. Field performance evaluation for both
rutting and cracking was conducted to identify and verify performance-related criteria
using parameters from DASR-IC mixture gradation model. In addition, an evaluation of
existing material property models was conducted to identify and develop improved
material property relationships for more accurate prediction of cracking performance of
asphalt mixtures. A summary of findings associated with these tasks are presented as
follows:
Mixtures having DASR porosity within the acceptable range clearly exhibited better field rutting performance than mixtures with high DASR porosity. Mixtures with marginal DASR porosity exhibited either good or bad rutting performance in the field.
Mixtures with DF considered to be acceptable generally exhibited better cracking performance in the field than mixtures with the either low or high DF.
DASR porosity, which reflects the characteristics of coarse aggregate structure, is the most dominant parameter to control rutting performance. IC characteristics including DF, EFT, and CFA/FFA could not overcome the problems associated with a mixture with DASR porosity outside the acceptable range.
IC characteristics are more important than DASR porosity criteria to clearly differentiate field cracking performance. It appears that the DF criteria should be considered in conjunction with EFT and CFA/FFA criteria to effectively distinguish the field cracking performance.
Unique relationships were identified between initial fracture energy and three DASR-IC parameters: DASR porosity, DF, and EFT. Initial fracture energy

115
generally decreases with increasing DASR porosity and DF and increases with increasing EFT.
A new parameter, namely the ratio of the coarse portion and fine portion of fine aggregates (CFA/FFA), representing the composition or aggregate structure of the interstitial component of mixture’s gradation, was introduced to develop the relationship to predict initial creep rate.
It was identified that the initial creep rate generally increased with increasing CFA/FFA. The effect of polymer modification helps to reduce the initial creep rate, which is the damage rate of an asphalt mixture.
It was found that the relationships for initial fracture energy and creep rate appeared to work best when all DASR-IC parameters were within the ranges considered to be acceptable.
Existing material property models for AC stiffness, fracture energy, and creep rate considered oxidative aging as the only factor responsible for changes in these properties with time. However, it was found that the trends based on existing models did not correlate well with the results of prior laboratory and field research.
7.2 Conclusions
The following key conclusions were drawn based on the findings and results of this
study:
Mixture gradation characteristics and resulting volumetric properties that effectively characterize the DASR and IC have an important effect on mixture fracture properties as well as on pavement performance in the field. DASR-IC parameters identified were able to appropriately describe the critical aspects of mixture gradation and volumetric properties that play a major role on mixture performance.
Mixtures with acceptable range of DASR-IC parameters clearly exhibited better mixture performance in the field than those with DASR-IC parameters outside ranges identified as acceptable. Thus, the introduction of DASR-IC criteria as performance-related design parameters to current mix design guidelines and specifications will lead to better and more consistent field rutting and cracking performance of Superpave mixtures.
Adequate gradation characteristics will result in more consistent initial mixture properties and provide predictive relationships for mixture fracture properties that will enhance our ability to accurately predict pavement performance.
Inadequate gradation characteristics can result in improper mixture fracture properties even when binder properties are satisfactory. Binder properties do play

116
a major role on creep rate and fracture resistance when gradation deficiencies are not present. In other words, binder properties alone cannot overcome deficiencies in gradation.
Predictive mixture property relationships will help reduce the need for sophisticated laboratory mixture tests, thereby increasing the potential for implementation of these more advanced pavement design systems such as the interim MEPDG recently adopted by AASHTO. The verified relationships will also serve to provide reliable inputs for more accurate prediction of service life using pavement performance prediction models.
Appropriate trends with respect to the changes in fracture energy and creep rate over time were proposed by including the effects of the non-healable permanent damage. The challenges are to quantify these effects in addition to the effect of oxidative aging after the critical time, and to determine the critical time, which indicates the point when permanent damage begins.
7.3 Recommendations and Future Works
Based on extensive evaluations performed in this study, recommendations for
further investigations regarding the effect of mixture component characteristics on
property and performance of Superpave mixtures are summarized below:
Since the preliminary criteria established in this study for consistently enhanced field mixture performance, including DASR porosity, disruption factor (DF), effective film thickness (EFT), and ratio between coarse and fine portion of the fine aggregate in the mixture (CFA/FFA), were only based on limited data from Superpave monitoring project, there is a need to validate and refine the criteria developed with a thorough laboratory study for incorporation into asphalt mix design.
An effective and clear implementable set of gradation and volumetric criteria need to be further established for an enhancement of mix design procedure, which should result in longer lasting asphalt pavements, with the benefit being cost savings and less disruption to the public due to less frequent construction cycles.
Conceptual relationships identified to describe changes in mixture properties over time will serve as the foundation for further development of improved models based on additional field data and laboratory studies using more advanced laboratory conditioning procedures.
Since healing has been determined to be one of the most critical factors that affect cracking performance of asphalt mixtures, further investigations are needed to assess the relationships between DASR-IC criteria developed and healing

117
characteristics of asphalt mixtures using the healing test recently developed in other FDOT research.
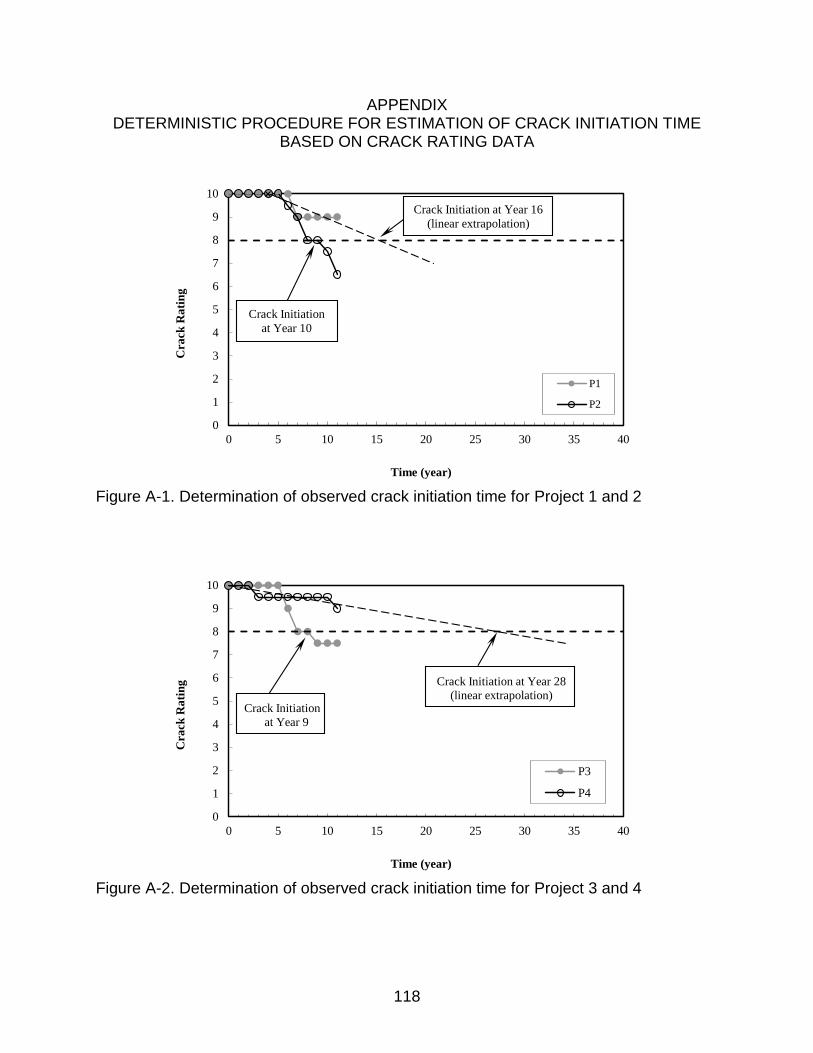
118
APPENDIX DETERMINISTIC PROCEDURE FOR ESTIMATION OF CRACK INITIATION TIME
BASED ON CRACK RATING DATA
0
1
2
3
4
5
6
7
8
9
10
0 5 10 15 20 25 30 35 40
Cra
ck
Ra
tin
g
Time (year)
P1
P2
Crack Initiation
at Year 10
Crack Initiation at Year 16
(linear extrapolation)
Figure A-1. Determination of observed crack initiation time for Project 1 and 2
0
1
2
3
4
5
6
7
8
9
10
0 5 10 15 20 25 30 35 40
Cra
ck
Ra
tin
g
Time (year)
P3
P4
Crack Initiation
at Year 9
Crack Initiation at Year 28
(linear extrapolation)
Figure A-2. Determination of observed crack initiation time for Project 3 and 4

119
0
1
2
3
4
5
6
7
8
9
10
0 5 10 15 20 25 30 35 40
Cra
ck R
ati
ng
Time (year)
P5
P6
Crack Initiation
at Year 11
Crack Initiation
at Year 7
Figure A-3. Determination of observed crack initiation time for Project 5 and 6
0
1
2
3
4
5
6
7
8
9
10
0 5 10 15 20 25 30 35 40
Cra
ck
Ra
tin
g
Time (year)
P7
P8
Crack Initiation
at Year 9
Crack Initiation at Year 18
(linear extrapolation)
Figure A-4. Determination of observed crack initiation time for Project 7 and 8
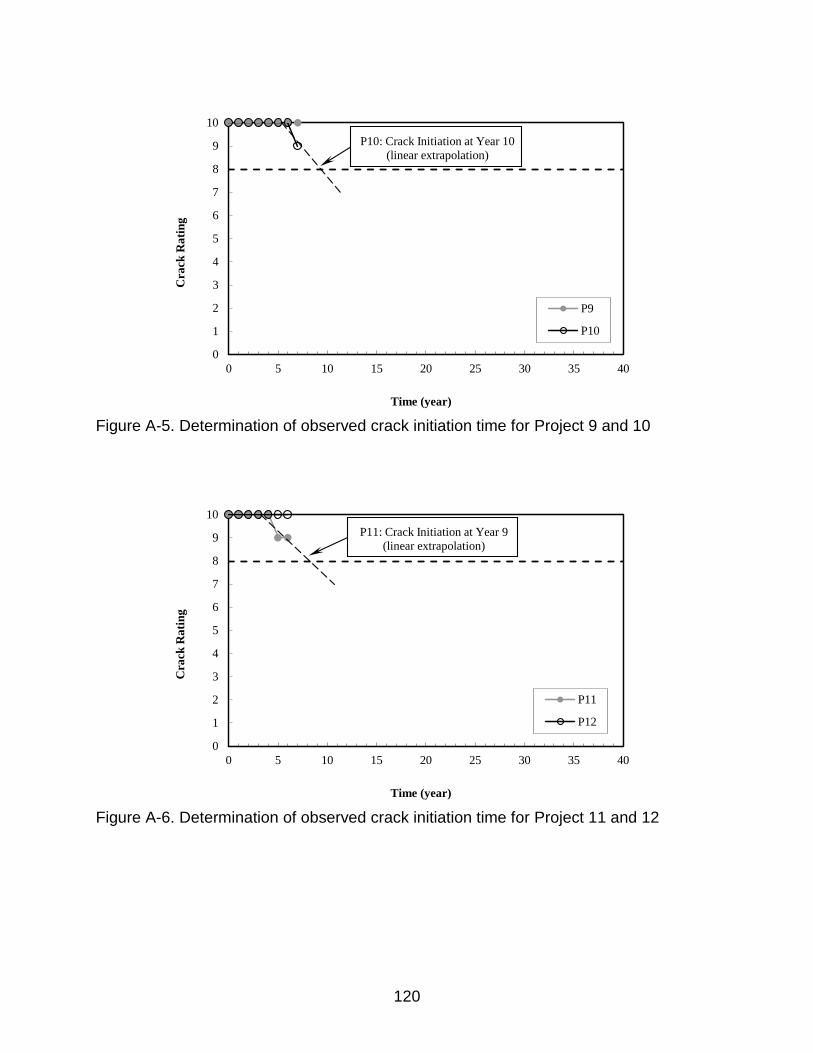
120
0
1
2
3
4
5
6
7
8
9
10
0 5 10 15 20 25 30 35 40
Cra
ck
Ra
tin
g
Time (year)
P9
P10
P10: Crack Initiation at Year 10
(linear extrapolation)
Figure A-5. Determination of observed crack initiation time for Project 9 and 10
0
1
2
3
4
5
6
7
8
9
10
0 5 10 15 20 25 30 35 40
Cra
ck R
ati
ng
Time (year)
P11
P12
P11: Crack Initiation at Year 9
(linear extrapolation)
Figure A-6. Determination of observed crack initiation time for Project 11 and 12

121
LIST OF REFERENCES
AASHTO. Standard Method of Test for Bulk Specific Gravity of Compacted Bituminous Mixtures Using Saturated Surface-Dry Specimens. AASHTO T 166, Washington, D. C., 2001.
AASHTO. Standard Method of Test for Percent Air Voids in Compacted Dense and Open Bituminous Paving Mixtures. AASHTO T 269, Washington, D. C., 2001.
Asphalt Institute. Superpave Mix Design. Superpave Series No.2 (SP-2), Third Edition, Asphalt Institute, Lexington, KY, 2001.
Birgisson, B., Roque, R., and Gale, C. Page. Performance-Based Fracture Criterion for Evaluation of Moisture Susceptibility in Hot-Mix Asphalt. Transportation Research Record: Journal of the Transportation Research Board, No. 1891, 2004, pp. 55-61.
D’Angelo, J., Dongre, R. N. Practical Use of Multiple Stress Creep Recovery Test: Characterization of Stylene-Butadiene-Stylene Dispersion and Other Additives in PMA Binders. Transportation Research Record: Journal of the Transportation Research Board, No. 2126, 2009, pp. 73-82.
D’Angelo, J. New High-Temperature Binder Specification using Multistress Creep and Recovery. Transportation Research E-Circular: Journal of the Transportation Research Board, No E-C147, 2010, pp. 1-13.
Fwa, T. F., and Oh, C. B. Effect of Moisture Content on Measured Properties of Asphalt Mixtures. Transportation Research Record: Journal of the Transportation Research Board, No. 1492, 1995, pp. 61-70.
Guarin, A. Interstitial Component Characterization to Evaluate Asphalt Mixture Performance. Ph.D. Dissertation, University of Florida, Gainesville, FL, 2009.
Kandhal, P. S., and Chakraborty, S. Effect of Asphalt Film Thickness on Short and Long Term Aging of Asphalt Paving Mixtures. Transportation Research Record: Journal of the Transportation Research Board, No 1535, 1996, pp. 83-90.
Kim B., Roque R., and Birgisson B. Effect of Styrene Butadiene Styrene Modifier on Cracking Resistance of Asphalt Mixture. Transportation Research Record: Journal of the Transportation Research Board, No. 1829, 2003, pp. 8-15.
Kim, J., Roque, R., and Birgisson, B. Integration of Thermal Fracture in the HMA Fracture Model. Journal of the Association of Asphalt Paving Technologists, Vol. 77, 2008, pp.631-662.
Kim, S., Roque, R., and Birgisson, B. Identification and Assessment of the Dominant Aggregate Size Range (DASR) of Asphalt Mixture. Journal of the Association of Asphalt Paving Technologists, Vol. 75, 2006, pp. 789-814.
122
Lambe, T. W., and Whitman, R. V. Soil Mechanics. John Wiley & Sons, New York, 1969.
Lottman, R. P. Predicting Moisture-Induced Damage to Asphaltic Concrete: Ten Year Field Evaluation. National Cooperative Highway Research Program Synthesis of Highway Practice 175., Transportation Research Board, Washington, D. C., unpublished manuscript, 1986.
Mirza M. W., and Witczak M. W. Development of Global Aging System for Short and Long Term Aging of Asphalt Cements. Journal of the Association of Asphalt Paving Technologists, Vol. 64, 1995, pp. 393-430.
Nukunya, B., Roque, R., Tia, M., and Birgisson, B. Evaluation of VMA and Other Volumetric Properties as Criteria for the Design and Acceptance of Superpave Mixtures. Journal of the Association of Asphalt Paving Technologists, Vol. 70, 2001, pp. 38-69.
Roque, R., Birgisson, B., Drakos, C. A., and Dietrich, B. Development and Field Evaluation of Energy-Based Criteria for Top-Down Cracking Performance of Hot Mix Asphalt. Journal of the Association of Asphalt Paving Technologists, Vol. 73, 2004, pp. 229-260.
Roque, R., Birgisson, B., Sangpetngam, B., and Zhang, Z. Hot Mix Asphalt Fracture Mechanics: A Fundamental Crack Growth Law for Asphalt mixtures. Journal of the Association of Asphalt Paving Technologists, Vol. 71, 2002, pp.816-827.
Roque, R., Buttlar, W. G., Ruth, B. E., Tia, M., Dickson, S. W., and Reid, B. Evaluation of SHRP Indirect Tension Tester to Mitigate Cracking in Asphalt Pavements and Overlays. Final Report of Florida Department of Transportation, University of Florida, Gainesville, FL, 1997.
Roque, R., Chun, S., Zou, J., Lopp, G., and Villiers, C. Continuation of Superpave Projects Monitoring. Final Report of Florida Department of Transportation, University of Florida, Gainesville, FL, 2011.
Roque R., Guarin A., Wang G., Zou J., and Mork H. Develop Methodologies/Protocols to Assess Cracking Potential of Asphalt Mixtures Using Accelerated Pavement Testing. Final Report of Florida Department of Transportation, University of Florida, Gainesville, FL, 2007.
Roque, R., Zou, J., Kim, Y. R., Baek, C., Thirunavukkarasu, S., Underwood, B. S., and Guddati, M. N. Top-down Cracking of HMA Layers: Models for Initiation and Propagation. NCHRP Web-Only Document 162, National Cooperative Highway Research Program, Transportation Research Board of the National Academies, 2010.
123
Sangpetngam, B., Birgisson, B., and Roque, R. Development of Efficient Crack Growth Simulator Based on Hot-mix Asphalt Fracture Mechanics. Transportation Research Record: Journal of the Transportation Research Board, No. 1832, 2003, pp.105-112.
Sangpetngam, B., Birgisson, B., and Roque, R. Multilayer Boundary-element Method for Evaluating Top-down Cracking in Hot-mix Asphalt Pavements. Transportation Research Record: Journal of the Transportation Research Board, No. 1896, 2004, pp.129-137.
Schmidt, J. and Graf, P. E. The Effect of Water on the Resilient Modulus of Asphalt Treated Mixes. Journal of the Association of Asphalt Paving Technologists. Vol. 41, 1972, pp.118-162.
Sedwick, S. C. “Effect of Asphalt Mixture Properties and Characteristics on Surface-Initiated Longitudinal Wheel Path Cracking,” Master’s Thesis, University of Florida, Gainesville, FL, 1998.
Witczak M. W., and Fonseca O. A. Revised Predictive Model for Dynamic (Complex) Modulus of Asphalt Mixtures. Transportation Research Record: Journal of the Transportation Research Board, No.1540, 1996, pp.15-23.
Zhang, Z., Roque, R., Birgisson, B., and Sangpetngam, B. Identification and Verification of a Suitable Crack Growth Law. Journal of the Association of Asphalt Paving Technologists, Vol. 70, 2001, pp. 206-241.
Zou, J., and Roque, R. Top-Down Cracking: Enhanced Performance Model and Improved Understanding of Mechanisms. Journal of the Association of Asphalt Paving Technologists, Vol. 80, 2011.
124
BIOGRAPHICAL SKETCH
Sanghyun Chun was born in Seoul, South Korea in 1977. He attended Kyunghee
University and received a Bachelor of Engineering degree in civil engineering in 2003.
In the middle of his undergraduate studies, he served as a sergeant in the Republic of
Korean Army from 1998 to 2000. In February 2003, Sanghyun started a Master of
Engineering program in civil engineering at the Kyunghee University. After finishing his
master’s degree, in February 2005, he joined the Chungsuk Engineering Co. Ltd. in
Seoul and he worked as a chief engineer in Road and Airport Division for two years. His
academic pursuit led him to attend the Ph.D. program of pavement and materials group
at the University of Florida in 2008 and worked as a graduate research assistant with
doctoral advisor, Dr. Reynaldo Roque. After completing his Ph.D., he plans to work as
academia, government, agencies, or private companies in civil engineering.