effect of model calibration on streamflow forecast results ali akanda, andrew wood, and dennis...
TRANSCRIPT

Effect of Model Calibration on Streamflow Forecast Results
Ali Akanda, Andrew Wood, and Dennis LettenmaierCivil and Environmental Engineering
University of WashingtonSeattle, WA

Problem
Calibration is always a time-consuming and labor intensive part of modeling process. Automatic calibration routines are available but
still not used widely. Has hampered implementation of models in different operational settings.
• 1970s: ESP method developed in NWS• 2000s: ESP implemented in NWRFC s
Question if operational water supply forecasting is mostly concerned with seasonal
volumes, do we need to calibrate?
Objective see whether bias-correction can achieve same goals as calibration in
forecasting streamflow values

Contents
• Domain
• Calibration
• Forecasts
• Results
• Summary

Domain
• Western U.S.
• Small-Medium
• 1/8th degree
• 9 being used
• Mostly
unimpaired

Calibration
Manual• Visual comparison of
averaged streamflow hydrographs
Base State: NLDAS
Parameters• Ds
• Ds max
• Ws
• binf
• Soil Depth [each layer]

Green - ColoradoDrainage: 468 sq. miles

North Fork FlatheadColumbia Falls, MTDrainage: 1548 sq. miles
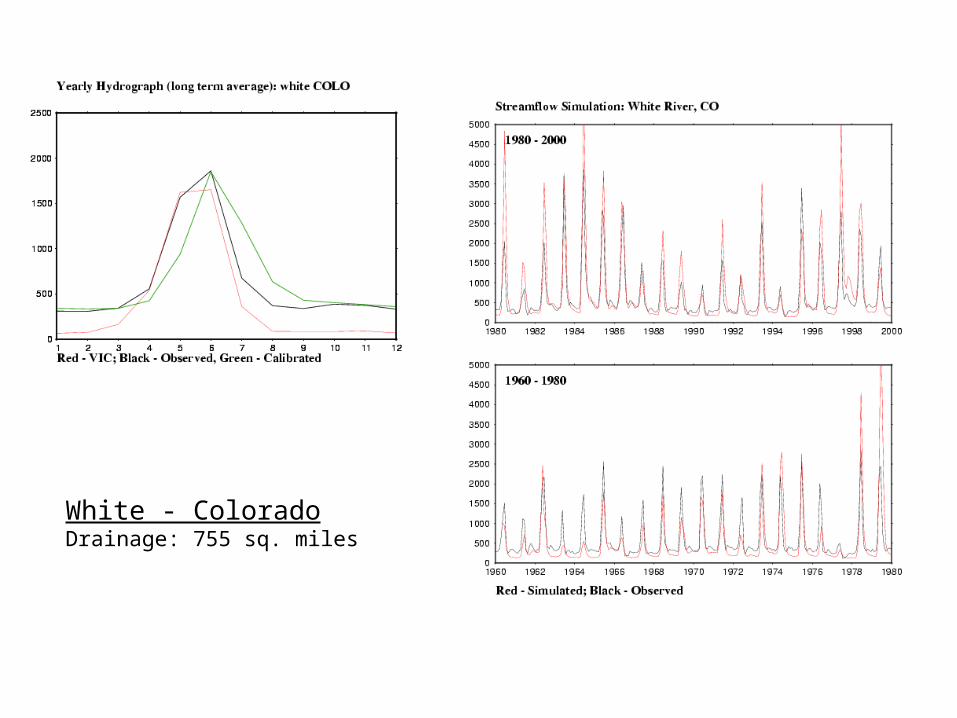
White - ColoradoDrainage: 755 sq. miles

Weber – Great BasinDrainage: 162 sq. miles

West Walker – Great BasinDrainage: 181 sq. miles

Verde – ColoradoDrainage: 5858 sq. miles

Forecasts
• ESP (Ensemble Streamflow Prediction)
• 30 Ensembles for each run (1970-1999)
• Forecasts for 25 different years: 1975-99
• Yearly forecasts run from January 1 / April 1
• Dry season streamflow average values
(April-July and April-September)

Streamflow forecasts – Weber River Basin, UT
April 1 forecasts
April-July Forecasted Raw Flow Values(30 ensemble averages)
0
500
1000
1500
2000
2500
3000
3500
400019
75
1976
1977
1978
1979
1980
1981
1982
1983
1984
1985
1986
1987
1988
1989
1990
1991
1992
1993
1994
1995
1996
1997
1998
1999
Years
Flo
w (
cfs)
Observed
Uncalibrated
Calibrated
April-Sep Forecasted Raw Flow Values(30 ensemble averages)
0
500
1000
1500
2000
2500
3000
3500
4000
4500
1975
1976
1977
1978
1979
1980
1981
1982
1983
1984
1985
1986
1987
1988
1989
1990
1991
1992
1993
1994
1995
1996
1997
1998
1999
Years
Flo
w (
cfs)
Observed
Uncalibrated
Calibrated
April-Sep Calibrated Uncalibrated
MAE 527 753
RMSE 603 811
April-July Calibrated Uncalibrated
MAE 463 606
RMSE 517 659
All error values are in cfs
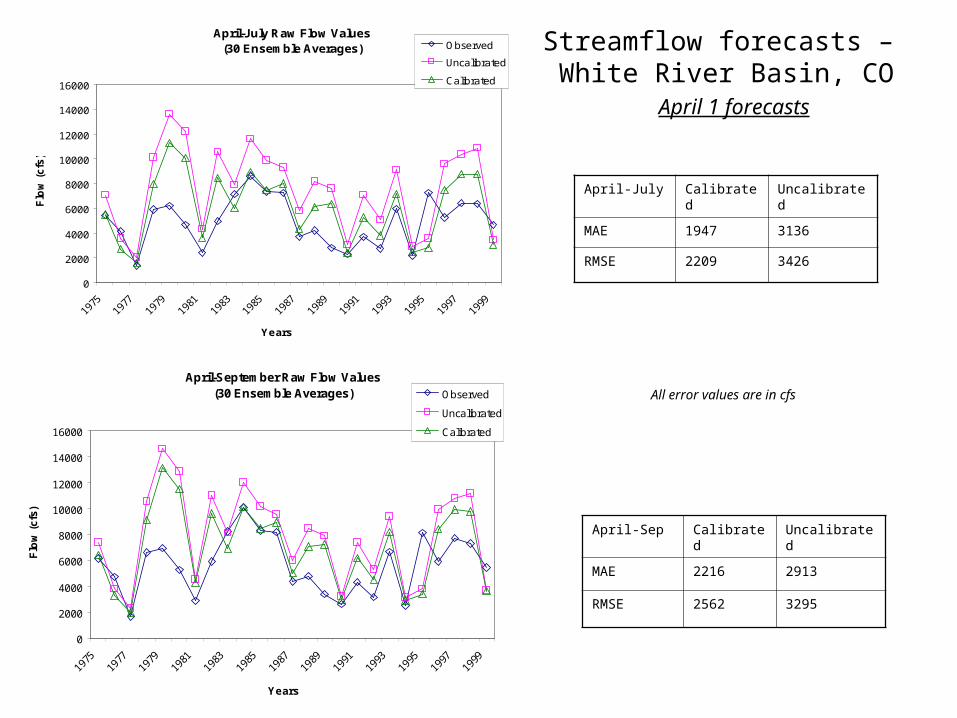
April-July Raw Flow Values(30 Ensemble Averages)
0
2000
4000
6000
8000
10000
12000
14000
16000
Years
Flo
w (
cfs
)Observed
Uncalibrated
Calibrated
Streamflow forecasts – White River Basin, CO
April 1 forecasts
April-Sep Calibrated Uncalibrated
MAE 2216 2913
RMSE 2562 3295
April-July Calibrated Uncalibrated
MAE 1947 3136
RMSE 2209 3426
All error values are in cfs
April-September Raw Flow Values(30 Ensemble Averages)
0
2000
4000
6000
8000
10000
12000
14000
16000
1975
1977
1979
1981
1983
1985
1987
1989
1991
1993
1995
1997
1999
Years
Flo
w (
cfs
)
Observed
Uncalibrated
Calibrated

Streamflow forecasts - North Fork Flathead (NOFOR @ PNW)April-July Flow Values
Jan 1 forecasts
0
5000
10000
15000
20000
25000
30000
35000
40000
1975 1976 1977 1978 1979 1980 1981 1982 1983 1984 1985
Years
Flo
w (
cfs)
Observed
Uncalibrated
Calibrated
April-Sep Flow ValuesJan 1 forecasts
0
5000
10000
15000
20000
25000
30000
35000
40000
1975 1976 1977 1978 1979 1980 1981 1982 1983 1984 1985
Years
Flo
w (
cfs)
Observed
Uncalibrated
Calibrated
April-July Flow ValuesApr 1 forecasts
0
10000
20000
30000
40000
50000
60000
Years
Flo
w (
cfs)
Observed
Uncalibrated
Calibrated
April-Sep Flow ValuesApr 1 forecasts
0
10000
20000
30000
40000
50000
60000
Years
Flo
w (
cfs)
Observed
Uncalibrated
Calibrated

April-July Calibrated Uncalibrated
MAE 5847 7897
RMSE 7073 8522
April-July Calibrated Uncalibrated
MAE 4020 6925
RMSE 4769 7741
April-Sep Calibrated Uncalibrated
MAE 6365 7089
RMSE 7727 8616
April-Sep Calibrated Uncalibrated
MAE 4378 7345
RMSE 5210 8223
Streamflow forecasts - North Fork Flathead (NOFOR @ PNW)
Error Values
Jan 1 Forecasts Apr 1 Forecasts
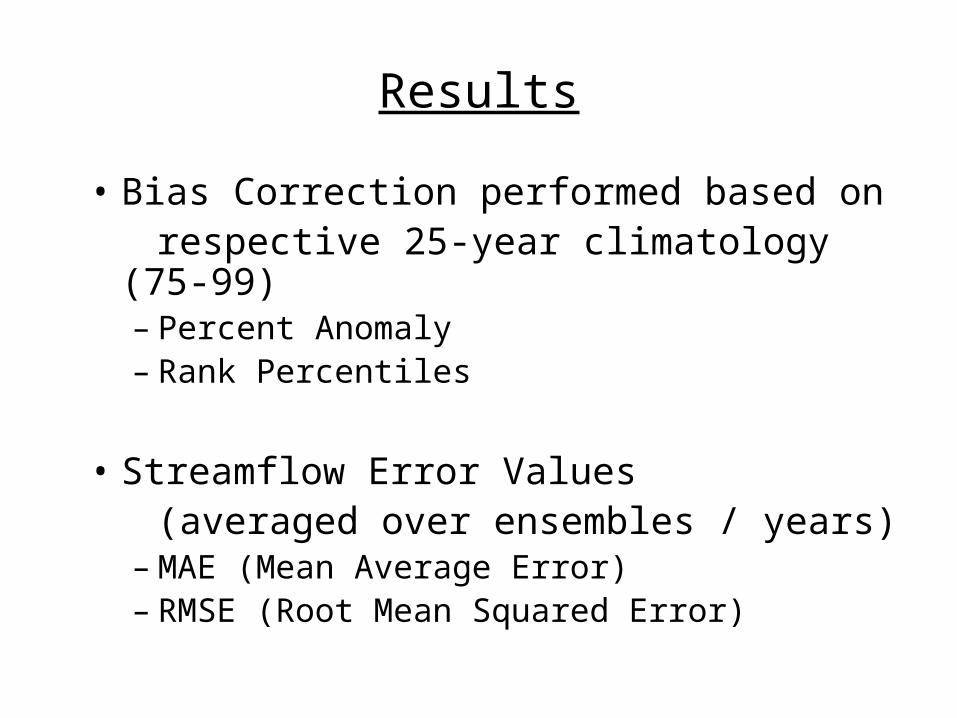
Results
• Bias Correction performed based on respective 25-year climatology (75-99)
– Percent Anomaly– Rank Percentiles
• Streamflow Error Values (averaged over ensembles / years)
– MAE (Mean Average Error)– RMSE (Root Mean Squared Error)

Bias Corrected Streamflow forecasts
Weber River Basin, UT
April 1 forecasts
RMSE Calibrated Uncalibrated
Anomaly 510 518
Percentile 478 504
Uncorrected 517 659
Bias Corrected April-July Flow (based on Anomaly)( w.r.t. 25 year Climatology 1975-1999)
0
500
1000
1500
2000
2500
3000
3500
4000
Years
Flo
w (
cfs)
Uncorrected
Uncalibrated
Calibrated
All error values are in cfs
Bias Corrected April-July Flow (based on Percentile) ( w.r.t. 25 year Climatology 1975-1999)
0
500
1000
1500
2000
2500
3000
3500
4000
Years
Flo
w (
cfs)
Uncorrected
Uncalibrated
Calibrated

Bias Corrected Streamflow forecasts
Weber River Basin, UT
April 1 forecasts
RMSE Calibrated Uncalibrated
Anomaly 568 573
Percentile 578 536
Uncorrected 603 811
Bias Corrected April-Sep Flow (based on Anomaly)( w.r.t. 25 year Climatology 1975-1999)
0
500
1000
1500
2000
2500
3000
3500
4000
4500
Years
Flo
w (
cfs)
Uncorrected
Uncalibrated
Calibrated
All error values are in cfs
Bias Corrected April-Sep Flow (based on Percentile) ( w.r.t. 25 year Climatology 1975-1999)
0
500
1000
1500
2000
2500
3000
3500
4000
4500
Years
Flo
w (
cfs)
Uncorrected
Uncalibrated
Calibrated

Bias Corrected Streamflow forecasts White River Basin, CO
April 1 forecasts
RMSE Calibrated Uncalibrated
Anomaly 1732 1674
Percentile 1530 1548
Uncorrected 2209 3426
Bias-Corrected April-July Flow Valuesanomaly w.r.t. 25 year climatology
0
1000
2000
3000
4000
5000
6000
7000
8000
9000
10000
1975
1977
1979
1981
1983
1985
1987
1989
1991
1993
1995
1997
1999
Years
Flo
w (
cfs
)
Uncorrected
Uncalibrated
Calibrated
All error values are in cfs
Bias-Corrected April-July Flow Values percentile w.r.t. 25 year climatology
0
1000
2000
3000
4000
5000
6000
7000
8000
9000
10000
1975
1977
1979
1981
1983
1985
1987
1989
1991
1993
1995
1997
1999
Years
Flo
w (
cfs
)
Uncorrected
Uncalibrated
Calibrated
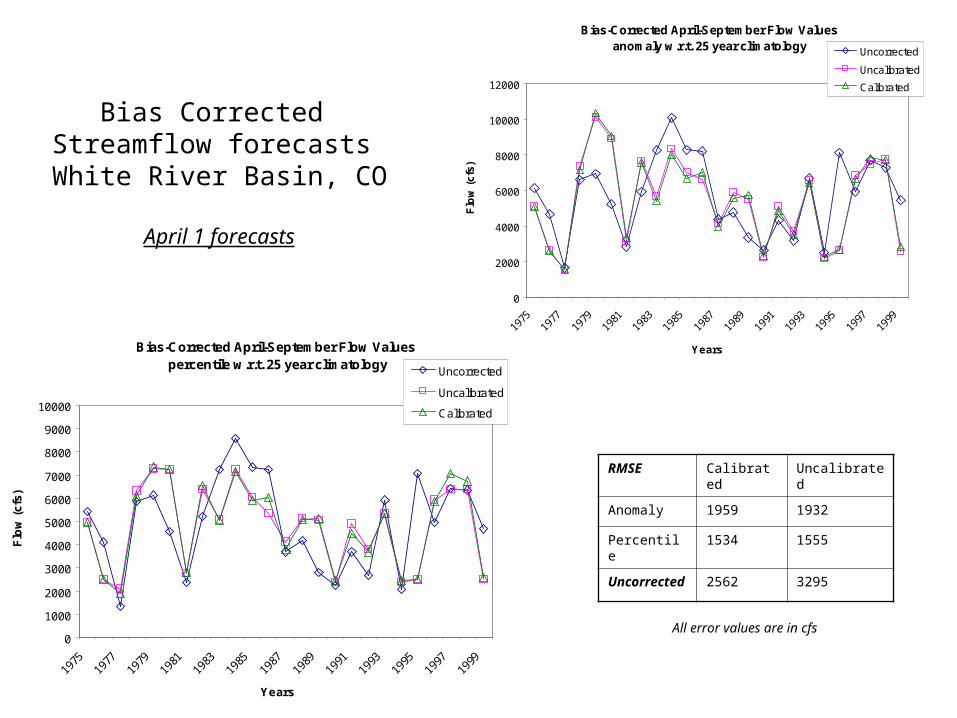
Bias Corrected Streamflow forecasts White River Basin, CO
April 1 forecasts
RMSE Calibrated Uncalibrated
Anomaly 1959 1932
Percentile 1534 1555
Uncorrected 2562 3295
Bias-Corrected April-September Flow Valuesanomaly w.r.t. 25 year climatology
0
2000
4000
6000
8000
10000
12000
1975
1977
1979
1981
1983
1985
1987
1989
1991
1993
1995
1997
1999
Years
Flo
w (
cfs
)
Uncorrected
Uncalibrated
Calibrated
All error values are in cfs
Bias-Corrected April-September Flow Values percentile w.r.t. 25 year climatology
0
1000
2000
3000
4000
5000
6000
7000
8000
9000
10000
1975
1977
1979
1981
1983
1985
1987
1989
1991
1993
1995
1997
1999
Years
Flo
w (
cfs
)
Uncorrected
Uncalibrated
Calibrated

Bias Corrected Streamflow forecasts N Flathead River , MT
April 1 forecasts
RMSE Calibrated Uncalibrated
Anomaly 3766 5656
Percentile 3130 4726
Uncorrected 3765 7594
Bias Corrected April-July Flow Valuespercentile w.r.t. 25 year climatology
0
5000
10000
15000
20000
25000
30000
35000
40000
Years
Flo
w (
cfs)
Uncorrected
Uncalibrated
Calibrated
All error values are in cfs
Bias Corrected April-July Flow Valuesanomaly w.r.t. 25 year climatology
0
5000
10000
15000
20000
25000
30000
35000
40000
45000
50000
Years
Flo
w (
cfs)
Uncorrected
Uncalibrated
Calibrated

Bias Corrected Streamflow forecasts N Flathead River , MT
Apr 1 forecasts
RMSE Calibrated Uncalibrated
Anomaly 4184 7772
Percentile 3192 5114
Uncorrected 4190 8117
Bias Corrected April-September Flow Valuesanomaly w.r.t. 25 year climatology
0
10000
20000
30000
40000
50000
60000
Years
Flo
w (
cfs)
Uncorrected
Uncalibrated
Calibrated
All error values are in cfs
Bias Corrected April-September Flow Valuespercentile w.r.t. 25 year climatology
0
5000
10000
15000
20000
25000
30000
35000
40000
Years
Flo
w (
cfs)
Uncorrected
Uncalibrated
Calibrated

Bias Corrected Streamflow forecasts White River Basin, CO
Jan 1 forecasts
RMSE Calibrated Uncalibrated
Anomaly 1608 1547
Percentile 1533 1496
Uncorrected 1776 2898
Bias-Corrected April-July Flow Valuesanomaly w.r.t. 25 year climatology
0
1000
2000
3000
4000
5000
6000
7000
8000
9000
10000
1975
1977
1979
1981
1983
1985
1987
1989
1991
1993
1995
1997
1999
Years
Flo
w (
cfs
)
Uncorrected
Uncalibrated
Calibrated
All error values are in cfs
Bias-Corrected April-July Flow Values percentile w.r.t. 25 year climatology
0
1000
2000
3000
4000
5000
6000
7000
8000
9000
10000
1975
1977
1979
1981
1983
1985
1987
1989
1991
1993
1995
1997
1999
Years
Flo
w (
cfs
)
Uncorrected
Uncalibrated
Calibrated

Bias Corrected Streamflow forecasts White River Basin, CO
Jan 1 forecasts
RMSE Calibrated Uncalibrated
Anomaly 1689 1652
Percentile 1500 1512
Uncorrected 1963 2600
Bias-Corrected April-September Flow Valuesanomaly w.r.t. 25 year climatology
0
2000
4000
6000
8000
10000
12000
Years
Flo
w (
cfs)
Uncorrected
Uncalibrated
Calibrated
All error values are in cfs
Bias-Corrected April-September Flow Values percentile w.r.t. 25 year climatology
0
1000
2000
3000
4000
5000
6000
7000
8000
9000
10000
Years
Flo
w (
cfs)
Uncorrected
Uncalibrated
Calibrated

Summary• Calibration helps to reduce the error of streamflow forecast results
(expected)
• Difference of Uncalibrated vs Calibrated forecast results greatly reduced
if bias is removed by either method
• Percentile-based bias correction performs better than anomaly-based
bias correction
• Error reduction from bias-correction similar to that achieved by calibration
• Similar trends observed with both January 1 and
April 1 forecasts

Work to be done
• Comparison of forecast results with different initiation dates (Jan/ Apr 1)
• Similar results for calibrated basins
• Study even larger basins (Salmon?)