effect of motion path of downburst on wind induced ... · pdf filewind-induced oscillation of...
TRANSCRIPT

Effect of motion path of downburst on wind-induced oscillation of conductor
* Wenjuan Lou1), Jiawei Wang2), Yong Chen3)
1),2),3)Institute of Structure Engineering, Zhejiang University, Hangzhou 310058, China
ABSTRACT
In recent years, the frequency and duration of supply interruption in electric power
transmission system due to flashover increase yearly in China. Flashover is usually associated with inadequate electric clearance and often takes place in extreme weathers, such as downbursts, typhoons, hurricanes. The present studies focus on the wind-induced oscillation of conductor during the process when a downburst is passing by or across a specific transmission line. Based on a revised analytical model recently developed for stationary downburst and harmonic superposition method, transient three-dimensional wind fields of downbursts were successfully simulated. In the simulations, the downbursts traveled along various motion paths according to the certain initial locations and moving directions assumed in advance. Then, an eight-span section extracted from a practical 500kV ultra-high-voltage transmission line, including 6 suspension spans and 2 dead-end spans, was chosen. After performing a non-linear transient analysis, an extensive study of the suspension strings’ rotation angles was conducted, whereby the electric clearance between the tower and conductors could be examined more directly. The results show that the conductors’ wind-induced responses strongly depend on the motion path of downburst. When it was parallel to the line, the insulator strings’ maximum rotation angles reached their peak values only if the horizontal distance between the path and line is approximately 1.0 jet diameter of the downburst. Furthermore, when it intersected with the line, there were successively a positive and a negative peak resulting from the reverse of the horizontal wind velocity, and the peak values varied seriously with the parameters of downburst, motion paths and length of each span along the studied line section.
1. INTRODUCTION
In the past decades, the ultra-high-voltage(UHV) and extra-high-voltage(EHV)
transmission lines develop rapidly in China on account of their less land occupation and
higher economic benefit. The subsequently farther electricity transmission distance will
1)
Professor 2)
PhD Graduate Student 3)
Associate Professor

lead to a greater risk for the transmission lines to encounter the severe weathers and
complicated terrains. Recently, the frequency of the forced outage due to the
wind-induced flashover, which is mostly associated with the insufficient clearance
between the conductors and tower, increases markedly accounting for a poor
operational reliability of the power supply system(Sun 2003). However, previous studies
usually focused on the selections of wind load calculation methods and optimizations of
the calculation parameters in the design code, e.g. reference wind velocity, span
reduction factor, wind load adjustment factor and so forth(Wang 2008,Jia 2012,Long
2006,Yan 2010,Liu 2009). And seldom research was conducted to take the extreme
weathers into consideration, such as downbursts and tornadoes. Yet the weather
reports and field surveys of the accident areas(Hu 2004) have revealed that microbursts
are extremely likely to be the cause of some flashovers.
Microburst, a downdraft with a damaging area less than 4 km in extent(Fujita
1985) , will produce a fairly high wind speed in several minutes near the ground and is
often accompanied with thunderstorms and rainfalls. It has been proved to be a major
cause of many transmission tower failures around the world(Savory 2001,Hawes
1993,McCarthy 1996,Dempsey 1996). Thereby, many probabilistic models for the
design of transmission tower were proposed(Oliver 2000,Li 2000),as well as many
further studies of the transmission towers’ behaviors during thunderstorm downbursts
(Savory 2001,Kanak 2007,Shehata 2007). Moreover, the finite element analysis was
implied (Shehata 2005) and an intense parametric study was performed numerically
(Shehata 2008). Then with the application of optimization technique, the critical tower
members which are likely to fail during the downburst and the associated configuration
of the downburst could be determined(Shehata 2008). In recent years, the bearing
capacity(Damatty 2012,Mara 2013) and response(Lin 2012)of the tower , as well as the
wind load contribution of the conductors(Aboshosha 2013) under downbursts have
gotten more attentions. Above all, it is worth noting that most of the researches have
noticed the significant contribution of the conductors’ wind load in the design process of
a transmission tower, while the wind-induced oscillation of conductor itself will
somewhat be ignored, which as mentioned above tends to trigger the flashover.
As a typical wind-sensitive structure, the transmission line’s load distribution along
its length direction suffers a remarkable variation due to the time-varying distance
between the studied conductors and storm center in the motion process of downburst.
Accordingly, the motion path of the moving downburst should be a vital factor to obtain
the wind-induced oscillations of a specific multi-span transmission line, especially when
the span lengths are different. Therefore, the current studies will concentrate on the
effect of motion path on the transient responses of the conductors with a precise finite
element model of an eight-span section extracted from a practical 500kV UHV
transmission line.

2. MODELLING OF THE MULTI-SPAN CONDUCTORS
It is stated that catenary is adopted to describe the initial shape of a conductor
span under its own weight. Suppose that the sag length of the conductor span is f , the
span length is L. If f/L<0.1, the initial shape of a conductor under its own weight could
be approximately regarded as a parabola (Sun 2010):
2
2
4 ( ),
8
qLf x L x cy x f
L L H
(1)
where q is the weight of per unit length, H is the horizontal tension of the conductor, c is
the discrepancy in elevation of two ends of a certain conductor span.
Thus, if parameters q, H, c are predefined, the coordinate of each point on a
certain conductor span could be obtained through Eq.(1). Accordingly, a strain line
section, which consists of eight spans, was simulated as a whole due to its mechanics
characteristic, including conductors, 7 suspension insulator strings(SUs) and 2 strain
insulator strings(STs), as shown in Fig.1, as well as the midpoint of the total line
section(which will be discussed later). Thereby, the interactions of all conductor spans
and the effect of variations of span lengths were both considered.
The characteristics of the conductors and insulator strings are illustrated in Tab. 1.
Despite the fact that the studied UHV transmission line employs 4-bundled conductor,
the parameters of conductors performed in Tab. 1 refers to the one sub-conductor. In
the process of modelling, the SUs were modelled using LINK8 element and the
conductors were modelled using LINK10 element, while the STs were seen to be
additional masses attached to relevant conductors in the original formfinding. In the
calculations, the ‘large deformation’ was open to import the geometric nonlinearity.
Fig. 1 Schematic diagram of the studied multi-span line section
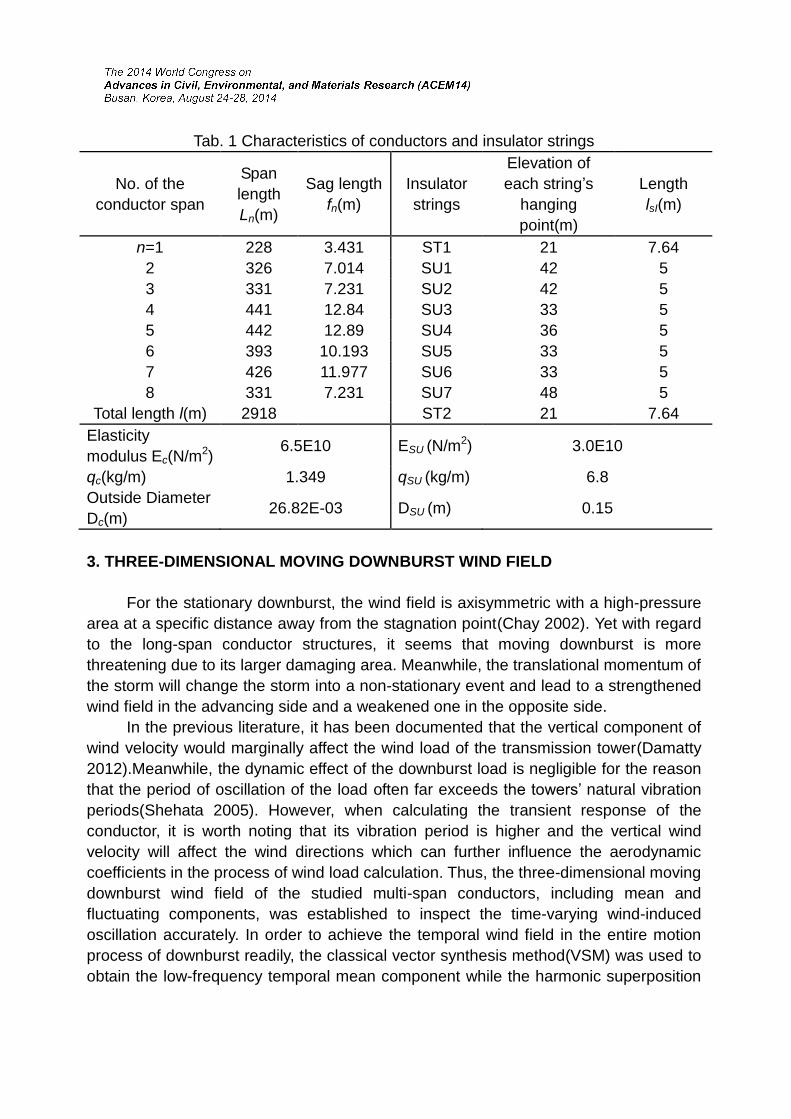
Tab. 1 Characteristics of conductors and insulator strings
No. of the
conductor span
Span
length
Ln(m)
Sag length
fn(m)
Insulator
strings
Elevation of
each string’s
hanging
point(m)
Length
lsI(m)
n=1 228 3.431 ST1 21 7.64
2 326 7.014 SU1 42 5
3 331 7.231 SU2 42 5
4 441 12.84 SU3 33 5
5 442 12.89 SU4 36 5
6 393 10.193 SU5 33 5
7 426 11.977 SU6 33 5
8 331 7.231 SU7 48 5
Total length l(m) 2918 ST2 21 7.64
Elasticity
modulus Ec(N/m2) 6.5E10 ESU (N/m2) 3.0E10
qc(kg/m) 1.349 qSU (kg/m) 6.8
Outside Diameter
Dc(m) 26.82E-03 DSU (m) 0.15
3. THREE-DIMENSIONAL MOVING DOWNBURST WIND FIELD
For the stationary downburst, the wind field is axisymmetric with a high-pressure
area at a specific distance away from the stagnation point(Chay 2002). Yet with regard
to the long-span conductor structures, it seems that moving downburst is more
threatening due to its larger damaging area. Meanwhile, the translational momentum of
the storm will change the storm into a non-stationary event and lead to a strengthened
wind field in the advancing side and a weakened one in the opposite side.
In the previous literature, it has been documented that the vertical component of
wind velocity would marginally affect the wind load of the transmission tower(Damatty
2012).Meanwhile, the dynamic effect of the downburst load is negligible for the reason
that the period of oscillation of the load often far exceeds the towers’ natural vibration
periods(Shehata 2005). However, when calculating the transient response of the
conductor, it is worth noting that its vibration period is higher and the vertical wind
velocity will affect the wind directions which can further influence the aerodynamic
coefficients in the process of wind load calculation. Thus, the three-dimensional moving
downburst wind field of the studied multi-span conductors, including mean and
fluctuating components, was established to inspect the time-varying wind-induced
oscillation accurately. In order to achieve the temporal wind field in the entire motion
process of downburst readily, the classical vector synthesis method(VSM) was used to
obtain the low-frequency temporal mean component while the harmonic superposition
method(HSM) was used to get the high-frequency fluctuating part.
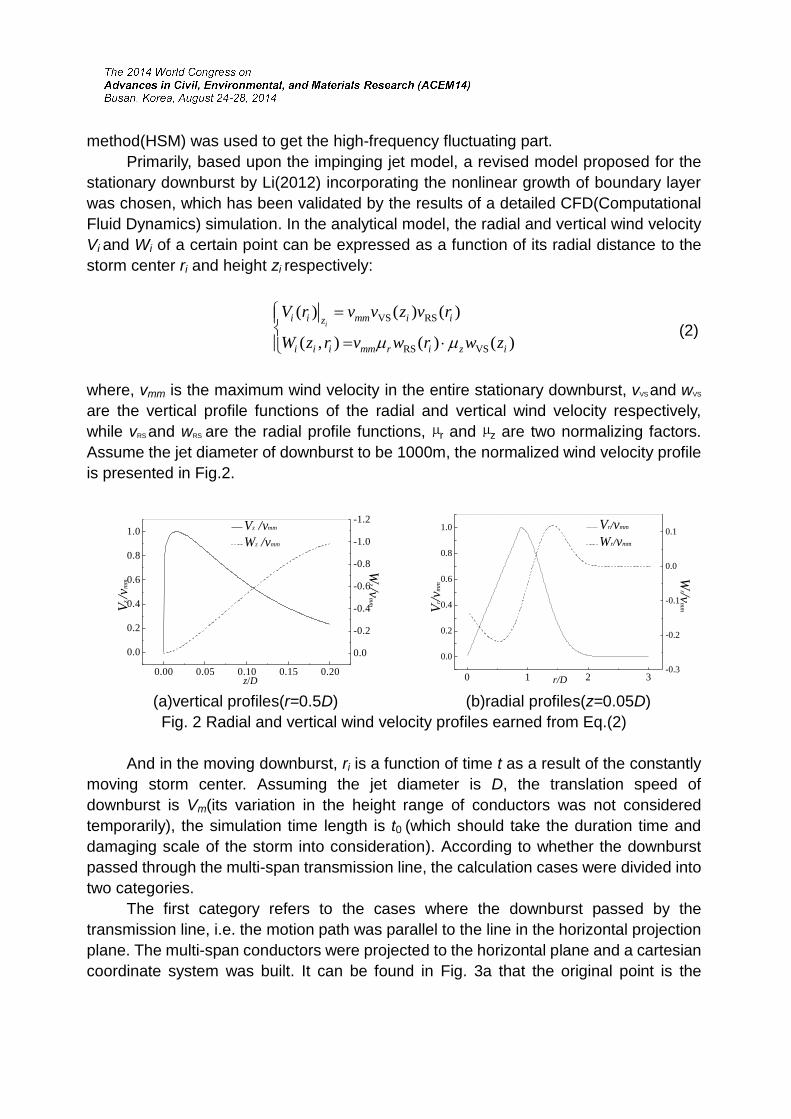
Primarily, based upon the impinging jet model, a revised model proposed for the
stationary downburst by Li(2012) incorporating the nonlinear growth of boundary layer
was chosen, which has been validated by the results of a detailed CFD(Computational
Fluid Dynamics) simulation. In the analytical model, the radial and vertical wind velocity
Vi and Wi of a certain point can be expressed as a function of its radial distance to the
storm center ri and height zi respectively:
VS RS
RS VS
( ) ( ) ( )
( , ) ( ) ( )
ii i mm i iz
i i i mm r i z i
V r v v z v r
W z r v w r w z
(2)
where, vmm is the maximum wind velocity in the entire stationary downburst, vVS and wVS
are the vertical profile functions of the radial and vertical wind velocity respectively,
while vRS and wRS are the radial profile functions, µr and µz are two normalizing factors.
Assume the jet diameter of downburst to be 1000m, the normalized wind velocity profile
is presented in Fig.2.
0.00 0.05 0.10 0.15 0.20
0.0
0.2
0.4
0.6
0.8
1.0
Vz /vmm
Wz /vmm
z/D
Vz /v
mm
0.0
-0.2
-0.4
-0.6
-0.8
-1.0
-1.2
Wz /v
mm
0 1 2 3
0.0
0.2
0.4
0.6
0.8
1.0
Vr/vmm
Wr/vmm
r/D
Vr/vm
m
-0.3
-0.2
-0.1
0.0
0.1
Wr/v
mm
(a)vertical profiles(r=0.5D) (b)radial profiles(z=0.05D)
Fig. 2 Radial and vertical wind velocity profiles earned from Eq.(2)
And in the moving downburst, ri is a function of time t as a result of the constantly
moving storm center. Assuming the jet diameter is D, the translation speed of
downburst is Vm(its variation in the height range of conductors was not considered
temporarily), the simulation time length is t0 (which should take the duration time and
damaging scale of the storm into consideration). According to whether the downburst
passed through the multi-span transmission line, the calculation cases were divided into
two categories.
The first category refers to the cases where the downburst passed by the
transmission line, i.e. the motion path was parallel to the line in the horizontal projection
plane. The multi-span conductors were projected to the horizontal plane and a cartesian
coordinate system was built. It can be found in Fig. 3a that the original point is the

starting end of the entire line section and the y axis is along the direction of conductors.
The time-varying distance between a certain element node Pi and the storm center ri(t)
can be presented as follows:
2 2
0 0 0( ) ( ) , ,2
c
i i m
l Lr t d y y V t x d y
(3)
where d is a critical variable as a representation of the horizontal distance between the
motion path and conductors which will be discussed in the following section, l is the total
length of the multi-span line section, Lc is the calculation length of the motion path of
downburst, x0 and y0 are the initial coordinates of the storm center, yi is the y coordinate
of the certain point Pi on the conductors.
The second category refers to the cases where the motion paths intersect with the
line in the horizontal projection plane. Then, the intersection point (IP) is set to be the
original point and y axis is the same to the definition pronounced above(as described in
Fig. 3b). Similarly, we have
2 2
0 0 00
1 1( ) sin cos ,
2
1 1sin , cos
2 22ci m m i m m m c mr t x V t y y V t L y Lx
(4)
where the newly added parameter αm is the angle between the motion path and transmission line, which will be further discussed, as well as the locations of IP.
(a) paths parallel to the line (b) paths intersect with the line
Fig. 3 Schematic diagrams of the VSM
With the application of VSM, the temporal mean radial wind velocity of each
element node on the conductors Vif (zi,ri(t)) could be earned. As for the fluctuating

component, both the radial and vertical ones could be expressed as the product of a
stationary Gaussian stochastic process and an amplitude modulation function(Chen
2004, Pan 2008):
( , ( )) ( , ( )) ( , )
( , ( )) ( , ( )) ( , )
i i i i i i i i
i i i i i i i i
v z r t a z r t z t
w z r t a z r t z t
(5)
where, ( , ( )) ( ) ( , ( ))i i i i if i ia z r t I z V z r t ,1
6( ) 0.088 (10 / )i iI z z (Chen 2005), ( , )i iz t and ( , )i iz t
can be obtained with HSM in which the normalized power spectrum density(PSD)
model proposed by Kaimal et.al and Panofsky et.al were selected respectively.
4. DOWNBURST WIND LOAD CALCULATION
With the calculations in advance, the final temporal wind velocity of each element
node Uif (zi,ri(t)) and Wif (zi,ri(t)) could be obtained as equations below:
( , ( )) ( , ( )) ( , ( ))
( , ( )) ( , ( )) ( , ( ))
if i i if i i i i i
if i i i i i i i i
U z r t V z r t v z r t
W z r t W z r t w z r t
(6)
As for the calculations of wind-induced oscillations of the long-span conductors,
the along-wind load plays a dominant role in the horizontal plane, which is proportional
to the wind velocity component in the perpendicular direction(i.e. the x direction in Fig.3).
Therefore, according to the quasi-steady assumption, the vertical and horizontal wind
load on a certain element node could be:
2
2
1( , ( ))
2
1( , ( ))
2
zi a zi i ir i i
xi a xi i ir i i
P C AV z r t
P C AV z r t
(7)
where, ρa is the density of air, Ai is the equivalent windward area, Czi and Cxi are the
vertical and horizontal component of the aerodynamic coefficients which were
measured under different wind directions in the wind tunnel, including the drag
coefficient CD and lift coefficient CL(only the results in the angles at a range from 0°~
45° are listed in Tab. 2, while the remaining values could be obtained according to the
symmetry principle due to the conductor’s round cross-section), Vir(zi,ri(t)) is the
instantaneous relative wind speed which has kept the transient motion state of the
conductor itself in perspective,

2 2
( , ( )) ( , ( )) ( ) ( , ( )) ( )ir i i ifx i i ir if i i irV z r t U z r t v t W z r t w t (8)
where Uifx(zi,ri(t)) is the x direction component of Uif (zi,ri(t)) as calculated in Eq.(6), vir(t)
and wir(t) are the motion speeds of the conductor itself in the horizontal and vertical
directions respectively, which can be obtained through the average acceleration
method on the basis of the results of corresponding transient displacements.
Tab. 2 Measured CD and CL under various wind angles
wind angle(°) 0 9 18 27 36 45
CD 0.934 0.990 1.012 1.010 1.009 0.982
CL 0.022 0.011 0.004 -0.009 -0.011 -0.006
5. RESULTS
In this article, according to the total length and height of the multi-span line section,
the calculation parameters D=1250m, vmm=25m/s for the Li’s model, Vm=vmm/3,
t0=1024s. And various calculation cases corresponding to multiple motion paths were
carried out to gain a comprehensive understanding of the conductors’ transient
responses, which could be divided into two categories as mentioned above. For each
case, a transient analysis was performed and then the time-history displacement curves
of every element node along three axis directions could be gained, namely Δxi(t), Δyi(t)
and Δzi(t). Subsequently, the rotation angle of each SU θI(t) was calculated in order to
reflect the clearance between the tower and the conductors more directly and make the
application scope of the conclusions in the current study broader, which can be
calculated as follows:
1
2 2
( )( ) sin
( )
I
I
sI I
x tt
l y t
(9)
where I is a variable as a representative of the No. of SU, lsI is the length of each SU,
ΔxI(t) and ΔyI(t) are the time-history displacements of the hanging point of conductors at
the bottom of SU.
In the former calculation of θI(t) in the boundary layer, ΔxI(t) is a critical indicator to
verify the electric clearance directly while ΔyI(t) is ignored because it is perpendicular to
the swing plane and often believed to be negligible. However, due to the relatively small
damaging area of the moving downburst, the wind load difference between the adjacent
spans will be larger, which may increase the displacement in the y axis direction of SU.
Thus, as shown in Eq.(9), the equivalent length of SUI, i.e. the denominator, was

revised and the SU was projected onto the perpendicular plane of the transmission line,
as simply depicted in Fig. 4.
Fig. 4 Calculation method of the SU’s rotation angle
As mentioned above, due to the randomness of initial locations, motion paths and
durations of moving downbursts, a comprehensive exploration should take sufficient
cases into account. In the following discussion, 28 cases were included to introduce
various relative positions between the transmission line and storms, covering nearly all
typical situations. The effect of motion paths of downbursts will be mainly embodied
through the differences of each SU’s maximum rotation angle θImax in the time domain in
each case. At last, each SU’s peak rotation angle θImm, as concluded from the total 28
cases was presented as well, which is widely used to check the electric clearance in the
design process of the towers in China.
5.1 Motion paths parallel to the line
When the motion paths of downbursts were parallel to the line, i.e. the first
category mentioned above, multiple situations would be taken into account where d(as
performed in Fig. 3a) was set to be 0.6D,0.8D,1.0D and 1.2D, considering the
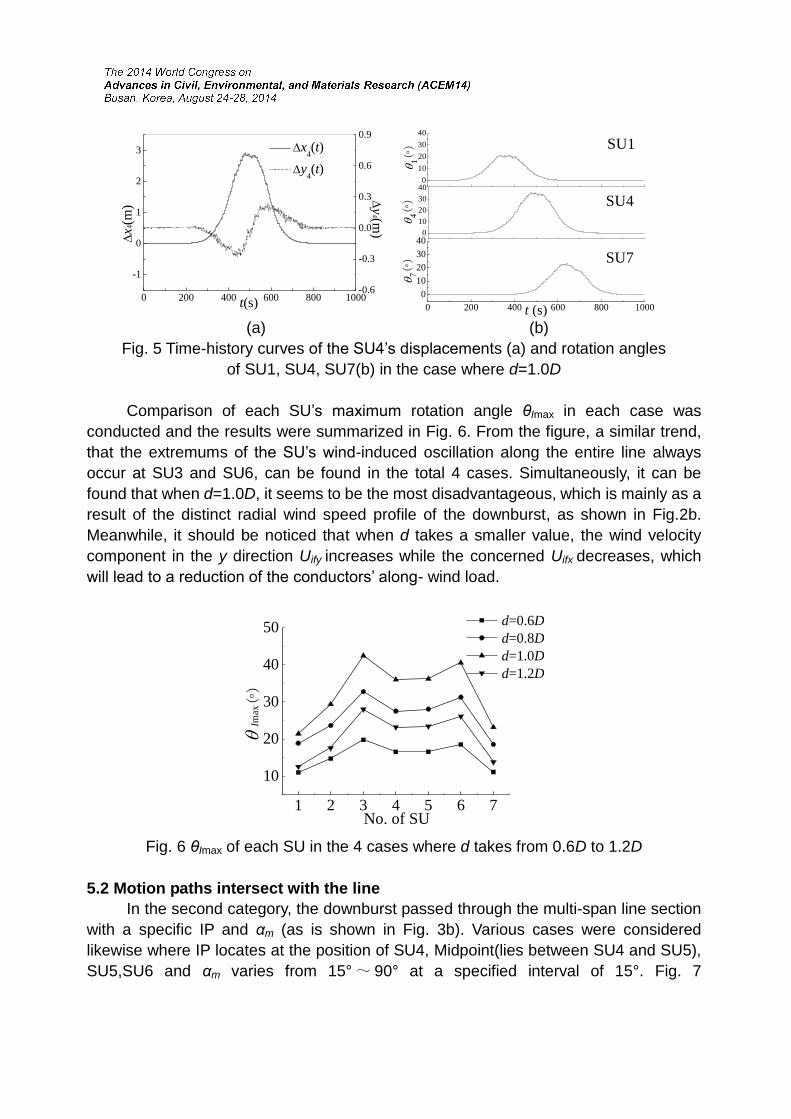
damaging areas of the downbursts. Fig. 5 presents the time-varying displacements of
SU4 in the horizontal plane and the relevant rotation angles in the case where d=1.0D,
which could almost represent the variations in the remaining three cases. As is depicted
in the figure, θI is approximately proportional to ΔxI. In the motion process of the
downburst from one end of the entire line section to the other, each SU’s θI only has a
sharp increase in several minutes and approaches merely zero in the remain time.
Meanwhile, the rotation angles of the SUs get different peaks successively. This
indicates that in these cases the flashover may not occur at the same time and the time
intervals depend on the length of each span and the translation speed of downburst Vm.
0 200 400 600 800 1000
-1
0
1
2
3
x4(t)
y4(t)
t(s)-0.6
-0.3
0.0
0.3
0.6
0.9
x4(m
)
y
4(m)
0
10
20
30
400
10
20
30
40
0 200 400 600 800 1000
0
10
20
30
40
7()
4()
1()
SU7
SU4
SU1
t (s) (a) (b)
Fig. 5 Time-history curves of the SU4’s displacements (a) and rotation angles
of SU1, SU4, SU7(b) in the case where d=1.0D
Comparison of each SU’s maximum rotation angle θImax in each case was
conducted and the results were summarized in Fig. 6. From the figure, a similar trend,
that the extremums of the SU’s wind-induced oscillation along the entire line always
occur at SU3 and SU6, can be found in the total 4 cases. Simultaneously, it can be
found that when d=1.0D, it seems to be the most disadvantageous, which is mainly as a
result of the distinct radial wind speed profile of the downburst, as shown in Fig.2b.
Meanwhile, it should be noticed that when d takes a smaller value, the wind velocity
component in the y direction Uify increases while the concerned Uifx decreases, which
will lead to a reduction of the conductors’ along- wind load.
1 2 3 4 5 6 7
10
20
30
40
50
Im
ax()
No. of SU
d=0.6D
d=0.8D
d=1.0D
d=1.2D
Fig. 6 θImax of each SU in the 4 cases where d takes from 0.6D to 1.2D
5.2 Motion paths intersect with the line
In the second category, the downburst passed through the multi-span line section
with a specific IP and αm (as is shown in Fig. 3b). Various cases were considered
likewise where IP locates at the position of SU4, Midpoint(lies between SU4 and SU5),
SU5,SU6 and αm varies from 15°~ 90° at a specified interval of 15°. Fig. 7

demonstrates a typical temporal displacements of SU4, incorporating Δx4(t) and Δy4(t),
and the corresponding rotation angles of SU1,SU4,SU7 in the case where IP locates at
Midpoint and αm=90°. Obviously, different from the first category, θI here experiences a
greater positive peak and a minor negative one in the motion process of downburst.
This is mainly because when a downburst passes across the line, the direction of radial
wind velocity reverses. And the difference of the peak values is due to the translational
momentum of the moving downburst which will lead to an asymmetric pressure
distribution in the surrounding of the storm center.
In addition, concluding from all the calculation results(including both categories), it
can be found that despite the fact that a larger ΔyI may occur in the first category, ΔyI is
still considerable compared to ΔxI in some cases especially when the considered
adjacent spans differ a lot. And the fluctuating component of wind speed has a slight
contribution to the results which may be induced by the low turbulence intensity
adopted in the current studies or the consideration of the relative motion states of the
conductors. Meanwhile, compared to the results in the boundary layer, the variation
curves here are smoother in the time domain, which can be seen as a long period
change. Yet this is disadvantageous to the flashover because its lengthened duration of
crisis will decrease the success rates of automatic reclose.
0 200 400 600 800 1000-2
-1
0
1
2
3
4
x4(t)
y4(t)
t(s)-0.2
-0.1
0.0
0.1
0.2
0.3
x4
(m)
y
4(m)
-15
0
15
30
45
60-5
0
5
10
15
20
0 200 400 600 800 1000
0
10
20
()
()
()
SU7
SU4
SU1
t (s) (a) (b)
Fig. 7 Time-history curves of the SU4’s displacements (a) and rotation angles of SU1,
SU4, SU7(b) in the case where IP locates at Midpoint and αm=90°
Then from the perspective of the entire line section, the results were numerically
treated in the same way of the first category, and revealed in Fig. 8. It can be found that
in most cases the results of θImax exceed the values mentioned in the first category,
especially in the cases where αm takes a large value, which indeed means a higher risk
for the flashover. And there is a large difference between each motion path and the
other both in the variation trend and the values of θImax. The minimum values range from
0.6° to 8.0°, while the maximums range from approximately 34.1° to 55.5°. From the
results plotted, we can see an overall tendency of increase of each SU’s θImax with an
enhanced αm in a specific range, which is mainly due to the increase of Uifx.

Furthermore, in the cases where αm is small, in the process when IP moves from the
middle to the end of the line, the overall trend of all the 7 SUs’ θImax remain unchanged
with the extremums at SU2 or SU3, while the values gradually increase as αm takes a
larger one; relatively, in the cases where αm is large, the location transformations of IP
will introduce a significant inhomogeneity of the wind pressure distribution along the line
section, and the extremum will move to the side where IP lies.
0
10
20
0
20
40
1 2 3 4 5 6 70
20
40
60
I
max()
I
max()
IPSU4
IPMidpoint
IPSU5
IPSU6
IPSU4
IPMidpoint
IPSU5
IPSU6
m
=30
No. of SU
I
max()
IPSU4
IPMidpoint
IPSU5
IPSU6
m
=15
m
=45
0
20
40
60
0
20
40
60
1 2 3 4 5 6 70
20
40
60
IPSU4
IPMidpoint
IPSU5
IPSU6
IPSU4
IPMidpoint
IPSU5
IPSU6
IPSU4
IPMidpoint
IPSU5
IPSU6
m
=75
No. of SU
m
=60
I
max()
I
max()
I
max()
m
=90
Fig. 8 θImax of SU1~7 in each case where IP locates at various positions
and αm takes from 15°~90°
A further statistical arrangement has been applied to the data. The No. of SU
which is found to be the most dangerous in each certain case is performed in Tab. 3.
Obviously, for the studied line section, SU3 seems to be in the most adverse situation in
a majority of motion paths rather than the SU overlapped with IP, which may be as a
result of the relatively large ratio between the jet diameter D and each span length Li.
Meanwhile, concluding form the results of all the calculation cases mentioned
above considering different motion paths, it is found that except the two SUs on the
ends, all the remaining five SUs suffer a high risk of flashover in some cases.
Furthermore, mostly when the downburst moved directly through the SU with a motion
path perpendicular to the transmission line, it posed a greatest threat to the specific SU.
Actually, in the design process of a specific tower, the peak rotation angle of each SU
θImm is mainly concerned, rather than the motion paths and their corresponding
maximum rotation angles θImax. Thus, in order to simplify the design process, this
specific motion path might be seen as a representative of the various calculation cases
when considering a given SU. With some additional calculations, the results of all SUs’
representative cases were complemented, as listed in Tab.4, as well as the final results
of θImm considering all the calculation cases (including the representative cases).
Obviously, despite the fact that some SUs’ (e.g. SU1,SU4,SU5) results of θImm exceed
the results of θImax of their respective representative cases just a little bit, the
applicability of the representative cases was further proved.

Tab. 3 No. of the SU which suffers the biggest risk of flashover in each motion path
IP
αm (°) SU4 Midpoint SU5 SU6
15 2 2 3 3
30 2 2 2 3
45 3 3 3 3
60 3 3 3 4
75 3 3 3 6
90 3 3 6 6
Tab. 4 Comparison of θImm concluded from all cases with θImax
in the representative cases
No. of SU θImm (°) IP αm (°) θImax in the representative
cases(°)
1 34.79 Midpoint 45 34.52
2 45.80 SU2 90 45.80
3 55.58 SU3 90 55.58
4 49.33 SU6 60 49.22
5 48.72 SU6 60 48.51
6 55.49 SU6 90 55.49
7 35.93 SU7 90 35.93
6. CONCLUSIONS
A comprehensive study has been conducted to investigate the effects of motion
paths on the wind-induced oscillations of the conductors in the moving downburst. The
results show that:
1)when the downburst moved by the conductors , the temporal responses of SUs
reached their peak values successively, and the worst adverse situation occurred when
d=1.0D.
2)when the downburst moved across the conductors, there were a larger positive
peak and a minor negative peak in each time-history curve of the SU’s rotation angles.
The location of the critical SU, which is most disadvantageous in the entire line section,
and the corresponding maximum rotation angle were directly dependent on the length
of each span, the motion path and the adopted parameters of downburst.
3)After introducing the effect of the relative motion state of the conductor itself, the
impact of the fluctuating component was fairly small. Moreover, in the moving
downburst, a longer risk duration of flashover was found, which may lead to a higher
possibility of the forced outage.
4)Due to the uncertainty of the initial location, motion path, occurrence and

duration time of the moving downburst, it should only be considered in some particular
areas. A typical motion path was recommended in the design process of the
transmission line, which can represent the results of all cases in an acceptable range.
In the further study, the accuracy of the VSM which is widely used to obtain the
moving downburst wind field should be validated, as well as the vertical and horizontal
profile of the translation speed of moving downburst and the PSDs selected in the
simulations of both vertical and radial fluctuating wind speed. Accordingly, a more
detailed parametric analysis should be conducted, including the jet diameter, turbulence
intensity, ratio of motion speed and jet velocity et.al.
ACKNOWLEDGEMENT
The research is financial supported by the National Science Foundation of China
(51378468) & Science and Technology Project of State Grid Corporation of China.
REFERENCES
Aboshosha, H. and EI Damatty A. (2013). "Downburst Induced Forces on the
Conductors of Electric Transmission Lines and the Corresponding Vulnerablility of
Towers Failure." CSCE 2013 General Conference 164,1-8.
Chen, L. and Letchford, C.W. (2004). "A deterministic-stochastic hybrid model of
downbursts and its impact on a cantilevered structure." Eng. Struct., Vol.26,619-629.
Chen, L. and Letchford, C.W. (2005). "Simulation of extreme winds from thunderstorm
downbursts." Proceedings of the Tenth Americas Conference on Wind Engineering,
May 31-June 4 2005, Baton Rouge, Louisiana,USA.
Chay, M.T. and Letchford, C.W. (2002), "Pressure distributions on a cube in a simulated
thunderstorm downburst—Part A:stationary downburst observations." J. Wind Eng.
Ind. Aerod, Vol. 90,711-732.
Dempsey, D. and White, H. (1996), "Winds wreak havoc on lines." Transmission and
Distribution World, Vol. 48(6), 32-37.
EI Damatty, A. and Aboshosha, H. (2012), "Capacity of Electrical Transmission towers
under downburst loading." Proceedings of the First Australasia and South-East Asia
Structural Engineering and Construction Conference, Perth, Australia, Nov 28-Dec
2,317-322.
Fujita, T. T. (1985), "Manual of downburst identification for project NIMROD." SMRP
Research Paper 156, University of Chicago,104.
Hawes, H. and Dempsey, D. (1993), "Review of recent Australian transmission line
failures due to high intensity winds." Paper presented at Work-shop on High
Intensity Winds on Transmission Lines, Buenos Aires, Argentina, 19-23.
Hu, Y. (2004), "Study on trip caused by windage yaw of 500kV transmission line." High
Voltage Engine., Vol. 30(8), 9-10.
Jia, B.Y., Geng, J.H., Fang, C.H. et al (2012), "Influence of wind speed and direction on flashover characteristic of composite insulators." High Voltage Engine., Vol. 38(1), 75-81.
Kanak, J., Benko, M., Simon, A. et al (2007), "Case study of the 9 May 2003 windstorm
in southwestern Slovakia." Atmos. Res., Vol.83, 162-175.
Li, C., Li, Q.S., Xiao, .Q. et al (2012). " A revised empirical model and CFD simulations
for 3D axisymmetric steady-state flows of downbursts and impinging jets." J. Wind
Eng. Ind. Aerod.,Vol. 102:48-60.
Li, C.Q. (2000), "A stochastic model of severe thunderstorms for transmission line
design." Probabilist. Eng. Mech., Vol.15, 359-364.
Lin, W.E. , Savory, E., McIntyre, R.P. et al(2012), "The response of an overhead
electrical power transmission line to two types of wind forcing." J. Wind Eng. Ind.
Aerod., Vol.100, 58-69.
Liu, X.H.,Yan, B.,Lin, X.S.,et al (2009), "Numerical simulation of windage yaw of 500kV UHV Transmission lines." Eng. Mech.,Vol. 26(1), 244- 249.
Long, L.H., Hu, Y. Li, J.L. et al (2006), "Study on windage yaw discharge of transmission line." High Voltage Engine., Vol. 32(4), 19-21.
Mara, T.G. and Hong, H.P. (2013), "Effect of wind direction on the response and
capacity surface of a transmission tower." Eng. Struct., Vol.57,493-501.
McCarthy, P. and Melsness, M. (1996), "Severe weather elements associated with September 5,1996 hydro tower failures near Grosse Isle, Manitoba, Canada. " Manitoba Environmental Service Centre, Environment Canada, 21pp.
Oliver, S.E., Moriarty, W.W. and Holmes, J.D. (2000), " A risk model for design of
transmission line systems against thunderstorm downburst winds." Eng. Struct.,
Vol.22, 1173-1179.
Pan, F.,Sun, B.N., Lou, W.J. et al (2008). "Random wind-induced dynamic response of long-span roof to thunderstorm downbursts in the time domain." Acta. Aerodyn. Sin., Vol. 26(1), 119-125.
Savory, E., Parke, G.A.R., Zeinoddini, M., et al (2001), "Modelling of tornado and microburst-induced wind loading and failure of a lattice transmission tower." Eng. Struct., Vol. 23(4), 365-375.
Shahata, A.Y., EI Damatty, A., and Savory, E. (2005), "Finite element modeling of
transmission line under downburst wind loading." Finite Elem. Anal. Des., Vol.
42(1),71-89.
Shehata, A.Y., EI Damatty, A. (2007), "Behaviour of guyed transmission line structures
under downburst wind loading." Wind Struct., Vol.10(3),249-268.
Shehata, A.Y., EI Damatty, A.(2008), "Failure analysis of a transmission tower during a
microburst." Wind Struct., Vol.11(3),193-208.
Shehata, A.Y., Nassef, A.O. and EI Damatty, A. (2008), "A coupled finite
element-optimization technique to determine critical microburst parameters for
transmission towers." Finite Elem. Anal. Des., Vol. 45, 1-12.
Sun, C.B. (2003), Power Transmission Line, Electric Power Press of China, BJ.

Sun, Z.M. (2010). Analysis of Transmission Line Galloping and Research on
Anti-galloping Technology. College of Civil Engineering and Architecture, Zhejiang
university, Hangzhou.
Wang, S.X., Wu, G.N., Fan, J.B., et al (2008), "Study on flashover of suspension Insulator string caused by windage yaw in 500kV transmission lines." Power System Technology,Vol. 32(9), 65-69.
Yan, B., Lin, X.S., Luo, W., et al (2010), "Research on dynamic wind load factors for windage yaw angle of suspension insulator strings." Eng. Mech., Vol.27(1), 221-226.