effect of network detail on traffic assignment results · the term "skeleton network," as...
TRANSCRIPT
THE EFFECT OF NETWORK· DETAIL ON TRAFFIC AS,SIGNHENT RESULTS
by
Gary D. Long Engineering Research Associate
and
Vergil G. Stover Assoc~ate Research Engineer
and Project Supervisor
Research Report Number 60-11
Traffic Assignment Research Study Number 2-8-63-60
Sponsored by The Texas Highway Department
In Cooperation with the U.S. Department of Transportation Federal Highway Adrnin~stration
Bureau of Public Roads
HPR- 1(6)
Texas Transportation Institute Texas A&M University
College Station, Texas
August, 1967


TABL~ OF CONTENTS
s lJ !'-'!J'.1A 1~ y . . . . . . . . . . . . . . . . . . . . . . . . . . . . . . . . . . . . . . . . . . . . . . . . . . . . . . . . . . l
CONCLUSIONS . ...................................................... ~ 2
INTRODUCTION. . ............................................... ... Traffic Assignment Networks .......................... . Zone Size and Network Detail Relationships .......... . Agreement between Traffic Counts and Assigned Volumes Study Outline ...
Objectives. Procedures.
3
4 5 6 7 7 7
CHARACTERISTICS OF THE STUDY AREA AND CODED NETY·VORKS. . . . . . . . . . . . . 9
Normal-Detail Network .. Detailed Network ..... . Intermediate Network .. Summary of Coded Network Travel Costs ........... .
Characteristics.
. 9 ll 13 .15 15
NETWORK ASSIGNf1ENT ............................................... 21
Detailed Network ..... Intermediate Network .. Normal-Detail Network.
ANALYSIS OF ASSIGNMENT RESULTS .............................. Screenline Volumes ..... . Arterial Street Volumes. Individual Link Volumes •. Network Parameters ..... Interzonal Travel Time •. Network Preparation, Analysis, and Computer Costs.
21 23 25
. 26
26 32 38 44 48 56


LIST OF FIGURES
F1gure
l Waco Normal-Detail Network ............. , ............... 10
2 Waco Deta1led Network ................ ,, .......... , ..... 12
3 Waco Intermediate Network ............................. - .14
4 Sample Sect1on of Waco Normal-Detail Network ........... 18
5 Sample Section of Waco Intermediate Network ............ 19
6 Sample Section of Waco Detailed Network ................ 20
7 Screenl1ne Locations . . . . . . . . . . . . . . . . . . . . . . . • . . . . . . . . . . . 27
8 Screenline Volumes, I . . . . . . . . . . . . . . . . . . . . . . . . . . . . . . . . . . 29
9 Screenline Volumes, II . • • . • . . . . . . . . . . . . . . . . • . . . . . . . . . . . 30
10 Screenline Volumes, III .•.......... , ......... · ..... · . - - 31
ll Volume Profile Locations ..................•... , ..... · . - _-; 3
12 Waco Drive Volume Profile ..•..............•........... , 11
13 LaSalle Street Volume Profile . . . . . . . • . . . . . . • . . . . . . . . . . . 35
14 Franklin Avenue Volume Profile ...•.......•.............. 36
15 Washington Avenue Volume Profile ... , .............. ,, ... 37
16 Valley Mills Road Volume Profile .......•......... , ..... 39
17 Bosque Boulevard and 18th Street Volume Profile ........ 40
18 Homan Street and 17th Street Volume Profile••••e•••••• .. 41
19 Profile of Combined Volumes on One-Way Pairs . , ......... 42
20 Volumes on Selected Links - Normal-Detail Network .... -. 4 'i
21 Volumes on Selected Links - Intermediate Network , . , •... 46
22 Volumes on Selected Links - Detailed Network .. 0=:1 ••• oo o o c c 47
23 Relative Frequency Distributions of Interzonal Travel .. Times . . . e • ,.. .. • .. .. ., • ~ • • "' • • • e • • • • • • • • • • ~ • • • • f!l " e 8 e o • • ., ., e 4 eo '!! ~ 4 9
24 Interzonal Travel Time Distribution for Normal-Detail Network Internal Zones ......•........................... 53
25 Percentage of Internal Zone Pairs with Trips in Each Time Increment .. · ........................................ 57
LIST OF TABLES
Table
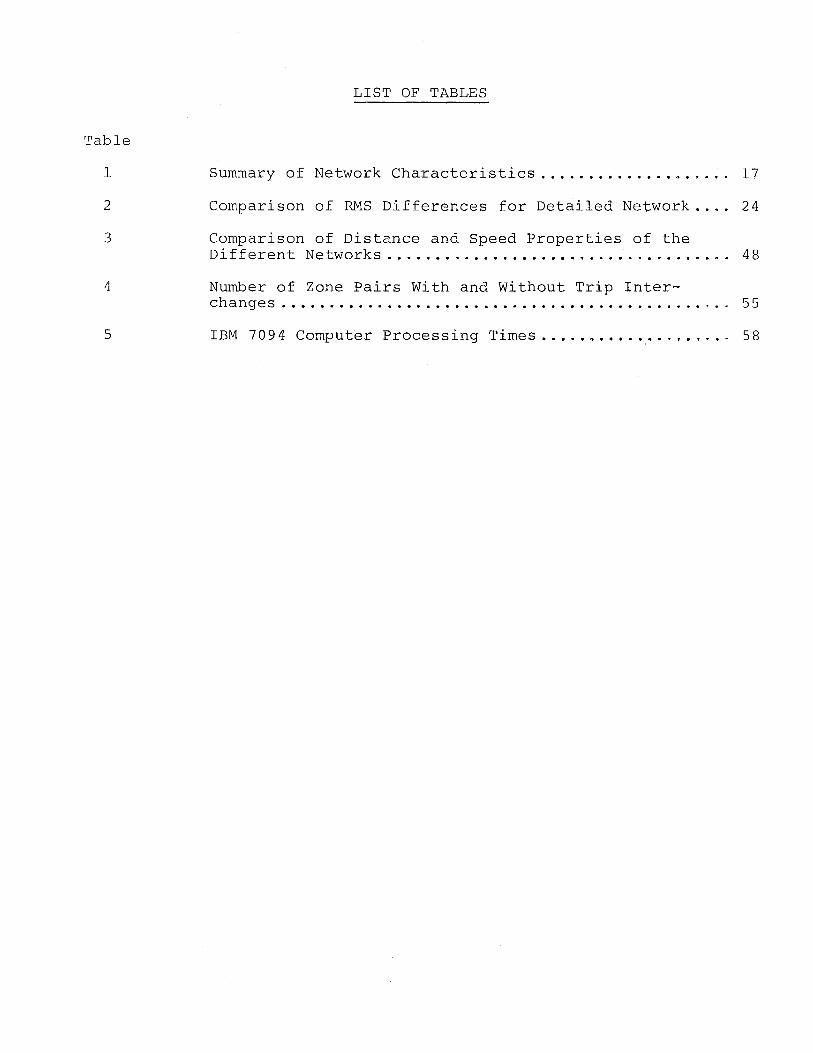
1 Summary of Network Characteristics .................... 17
2 Comparison of RMS Differences for Detailed Network .... 24
3 Comparison of Distance and Speed Properties of the Different Networks .................................... 48
4 Number of Zone Pairs With and Without Trip Inter-changes ............................................. ,.. .. 55
5 IBM 7094 Computer Processing Times .....•..•........... 58

SUMMARY
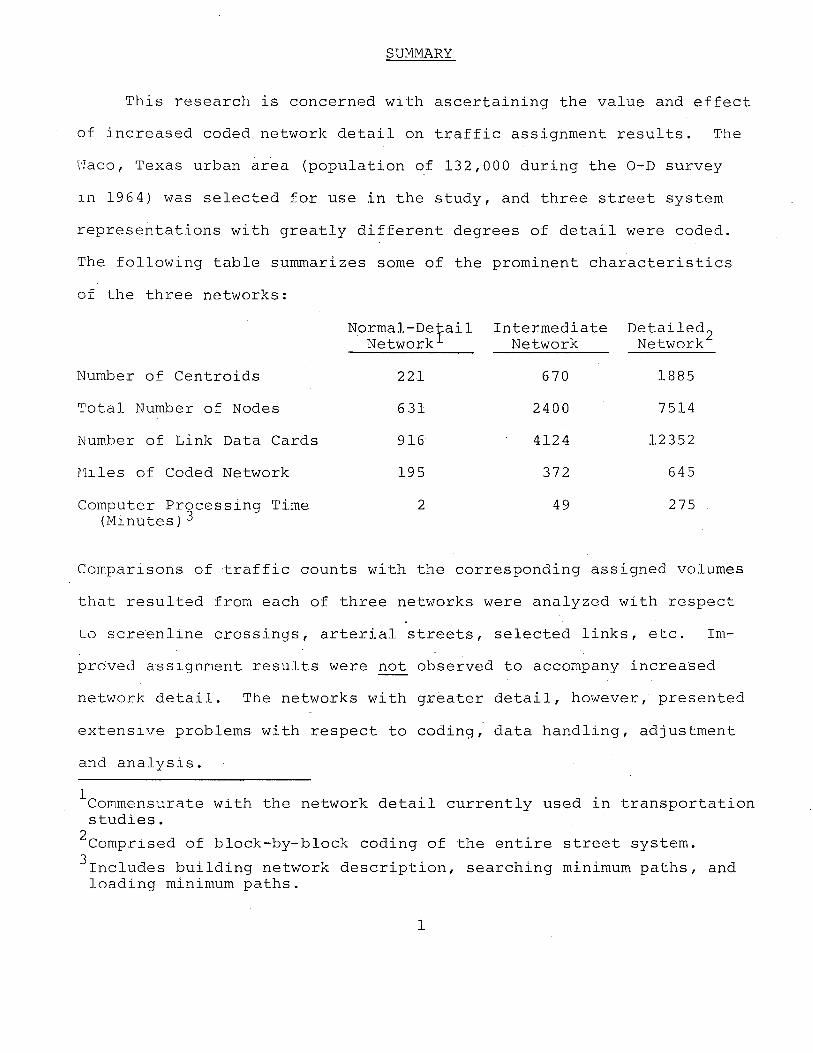
This research is concerned with ascertaining the value and effect
of increased coded network detail on traffic assignment results. The
Naco, Texas urban area (population of 132,000 during the 0-D survey
ln 1964) was selected for use in the study, and three street system
representations with greatly different degrees of detail were coded.
The following table summarizes some of the prominent characteristics
of the three networks:
Number of Centroids
Total Number of Nodes
Number of Link Data Cards
Mlles of Coded Network
Computer Processing Time U1lnutes) 3
Normal-Derail Network
221
631
916
195
2
Intermediate Network
670
2400
4124
372
49
Detailed2 Network
1885
7514
12352
645
275
Comparlsons of traffic counts with the corresponding assigned volumes
that resulted from each of three networks were analyzed with respect
to screenline crossings, arterial streets, selected links, etc. Im-
proved assignment results were not observed to accompany increased
network detail. The networks with greater detail, however, presented
extensive problems with respect to coding; data handling, adjustment
and analysis.
1 Commensurate with the network detail currently used in transportation studies.
2comprised of block-by-block coding of the entire street system. 3 rncludes building network description, searching minimum paths, and loading minimum paths.
l
CONCLUSIONS
The following conclusions are based on the analysis of all-or
nothing assignments to three networks with different degrees of detail
using the trip data from the Waco Urban Transportation Study.
l. It is concluded that the degree of network detail currently
used in urban transportation planning studies is appropriate
with the all-or-nothing assignment. There are no benefits,
but several disadvantages, in the use of increased network
detail.
2. Agreement between assigned link volumes and traffic counts
on arterial and major collector street representations did
not improve with increased network detail.
3. Assigned volumes across screenlines appeared to be virtually
independent of network detail.
4. Coding and data handling problems became more numerous as
network detail was increased.
5. Network analysis and adjustment became extremely difficult
with increased detail. It wa? nearly impossible to antici-
pate the effect o~ link speed changes on assigned volumes
in the detailed network.
6. Assigned volumes on pairs of one-way streets, coded indivi
dually, did not attain satisfactory agreement with traffic
counts regardless of the degree of network detail. Coding a
pair of one-way streets as a single two-way link is recommended.
7. Computer processing time became excessive as degree of network
detail was increased.
2
INTRODUCTION
Computerized traffic assignment techniques have been used £or
several years by transportation engineers and planners to evaluate
alternative urban transportation systems. Until recently, coded net-
works were restricted to 4000 nodes due to program and computer limi-
tations. Since medium sized ur.ban areas contain considerably more
1 than 4,000 street intersections, only skeleton networks could be
used in urban transportation studies. It might be presumed that more
real1stic traffic assignments would result if additional coded network
detail could be used.
This investigation was undertaken to evaluate the effect of the
degree of coded network detail on traffic assignment results using
the all-or-nothing assignment procedure. The study was facilitated
through the recent development of the TEXAS-Large Systems Traffic
Ass1gnment Package which provided the capability of using coded net-
works of up to 16,000 nodes.
The Waco, Texas urban area was selected for use in the investi-
gat1on since trip data were available from a recent origin-destination
·survey 1n which city blocks were coded as individual survey zones.
Th1s perm1tted use of an assignment network containing all existing
streets. Also, the Waco area was considered representative of many
med1um size urban transportation study areas.
Three networks with substantially diff~rent degrees of· detail
1 The term "skeleton network," as used through6ut this discussion, is construed to 1ndicate any assignment network that does not contain block-by-block repres~ntations of an entire urban street system.
3
'.
were used; these are:
1. Normal-detail network - a skelton network of the detail normally used in urban transportation planning studies.
2. Detailed network - a network containing all existing streets at the time of the origin - destination survey.
3. Intermediate network - a netwo~k with detail between the extremes represented by the other two configurations.
TRAFFIC ASSIGNMENT NETWORKS
Freeways and major arterial streets are principally for traffic
movement; conversely, the basic function of local streets is to pro-
vide access to abutting property. Traffic assignment is a technique
for estimating future traffic volumes .which are essential data in the
planning of freeways and arterial streets. The inclusion of local street
representations in assignment networks, however, appears superfluous
since traffic volumes are not the criteria for providing local streets.
These access facilities generally constitute 65-80% of the total urban
street mileage, so their exclusion from the coded network results in
considerable savings through reduced coding effort and computer time.
However, if the addition of local streets in the coded network repre-
sentation sufficiently improves the accuracy of traffic assignment on
the ~ajor links, their inclusion would be warranted.
Conventionally, node maps for traffic assignment are drawn with
freeway and arterial street representations in relative position with
respect to actual ground locations. These are labeled with correspond-
ing street names for convenience in referencing; consequently, the
node maps appear similar to a normal street map and can be misleading.
As a result, assigned volumes are sometimes misinterpreted as pertain-
ing directly to physical street counterparts with the same name. Only
a node map with explicit representations of all street segments could
4

have a direct correspondence between the coded network and physical
street system.
ZONE SIZE AND NETWORK DETAIL RELATIONSHIPS
The city block constitutes an appropriate traffic zone for a de
tailed coded network. Each centroid would be connected to loading
points located roughly midblock on each encompassing street (wherever
physically appropriate). Centroid connectors would then represent
the driveways, alleys, etc. that intersect the street system. With
single city blocks constituting traffic zones, very few intrazonal
trips would be expected. People infrequently drive from one place
in a city block to another location in the same block. Thus, it might
be anticipated that traffic assignments to detailed networks would
rather accurately reflect the actual traffic flow.
A traffic zone configuration of single city blocks is not appli
cable as such for use with skeleton networks. Each zone must be
connected to the assignment network, yet without the provision of local
street representations this task would be quite cumbersome. This
extreme detail in zonal definition would also be inconsistent with
the gross character of a skeleton network. In fact, the realism of
the representation might be reduced since short trips between adjacent
or nearby zones (city blocks) would have to be routed via the major
links. The separation between these zones through the coded network
would then greatly exceed the actual separation on the ground.
Thus, with the coded networks commonly used, several city blocks
are appropriately aggregated to form a single zone. The zone centroid
is connected to the network in a manner consistent with the physical

treet system characteristics Hence, centroid connections to the
ssignment network represent the local streets.
Since some trips would be expected to travel between city blocks
ggregated to a single zone, a number of intrazonal trips could result~
herefore, many of the short trips that would be assigned to local
treet representations in a detailed network would become intrazonal
rips which are not assigned to a skeleton network, Trips between
djacent zones would be assigned to the centroid connectors only.
ther short trips that could use only local streets, however, would
ave to be allocated to the corridor most closely paralleling their
aths. Thus, there is a ''trade-off" between the trips that are assigned
J the major links and the degree of coded network detail. Due to
1ese characteristics, the street representations in skelton networks
~st be recognized as "pseudo streets" in corridors of traffic move-
~nt. These links implicitly represent certain nearby parallel local
:reets in addition to the associated arterial.
AGREEMENT BETWEEN TRAFFIC COUNTS AND ASSIGNED VOLUMES
Since links in a detailed coded network can be considered to repre-
~nt their physical street counterparts, assigned volumes and traffic
Junts should be in close agreemento Agreement between counted and
;signed volumes in skeleton networks might be poorer due to the rela-
onship between network detail and the assigned trips. Other possible
.uses of disparity could be one or a combination of the following:
l, Under-reporting of trips - ''minor" trips are easily overlooked by the respondent,
2o Traffic count error - traffic counts for 24-hour periods are made with automatic counters which may produce some error.
6

3, Sampling deficiencies - dwelling unit samples may not accurately reflect the true zone to zone movements,
4o Traffic circulation - assignments do not account for traffic circulation within commercial areas such as the CBD.
5. Impedance parameters - slight variation of impedance parameters can cause changes in routing of individual trips which may result in sizable variations in assigned volumeso
6" Centroid representations - as a consequence of using a centroid to represent all trip terminals within each zone, all trips interchanging between two zones, are assigned to the same centroid connector rather than distributed among all feasible zone entry points; hence, contiguous links in the coded network may have abrupt changes in assigned volumes due to the centroid connector configuration.
STUDY OUTLINE
Objectives
The objective of this research was to determine the effect and
value of increased detail in coded networks on traffic assignment
resultsc Several measures were considered in the overall evaluation"
The difference between assigned volumes and traffic counts was the
primary basis for comparisono This was examined in conjunction with
screenline crossings, traffic on arterial streets with and without
parallel local facilities, traffic on oneway streets, and overall
•,·c,leme differences on major links o
Computer processing time was used as the principal measure of
the increase in cost with increased network detail. The relative
effort involved in the coding and in the analysis of each network was
also noted as a subjective measurec
Procedures
The procedure followed in this investigation was to prepare the
three networks of different degree of detail and assign the expanded
7
24-hour vehicle trips to each. A directional ali-or-nothing assign
ment was used. However, the nondirectional assigned volumes were
selected in order to maintain compatibility with 24-hour nondir
ectional traffic counts,
Link volumes were compared with traffic counts; where disagree
ment existed, link speeds were adjusted in order to alter the respec
tive link travel time, The networks with the adjusted speeds were
reassigned, and the new output evaluated; the process was repeated
if necessary. This procedure is the same as that followed in practice
for adjusting existing networks, The difference being that normally
only one network, similar to the normal-detail network, would be
employed,
Upon completion of the network assignments, the resulting assigned
volumes were compared" The normal-detail network was considered to
delineate the major traffic corridors; the additional detail included
in the intermediate and detailed network was regarded as consisting
primarily of local streets together with some collector streets. Only
the links common to all three networks were used in the overall link
volume comparisons~ For the purpose of these comparisons the additional
street representations in the intermediate and detailed networks were
regarded as explicitly for the improvement of the assigned volumes to
the major linkso
8
CHARACTERISTICS OF THE STUDY AREA AND CODED NETWORK
The data used in this analysis were compiled by the Waco Urban
Transportation Study. The study area covered 248 square miles, which
included the city of Waco (47 square miles) and seven smaller incor
porated places, According to the origin-destination survey, conducted
during the winter and spring of 1963-64, there were 132,352 persons
residing in 46,740 dwelling units within the boundaries of the study
areac
The study area was subdivided into 2818 survey zones which ranged
in size from a city block, in densely developed areas, to about 1000
acres, in the agricultural and open areas of the undeveloped fringeo
There were 15 external stations on the external cordon at which trips
entering and leaving the area were surveyed. No freeway facilities
were in operation at the time of the survey (1). *
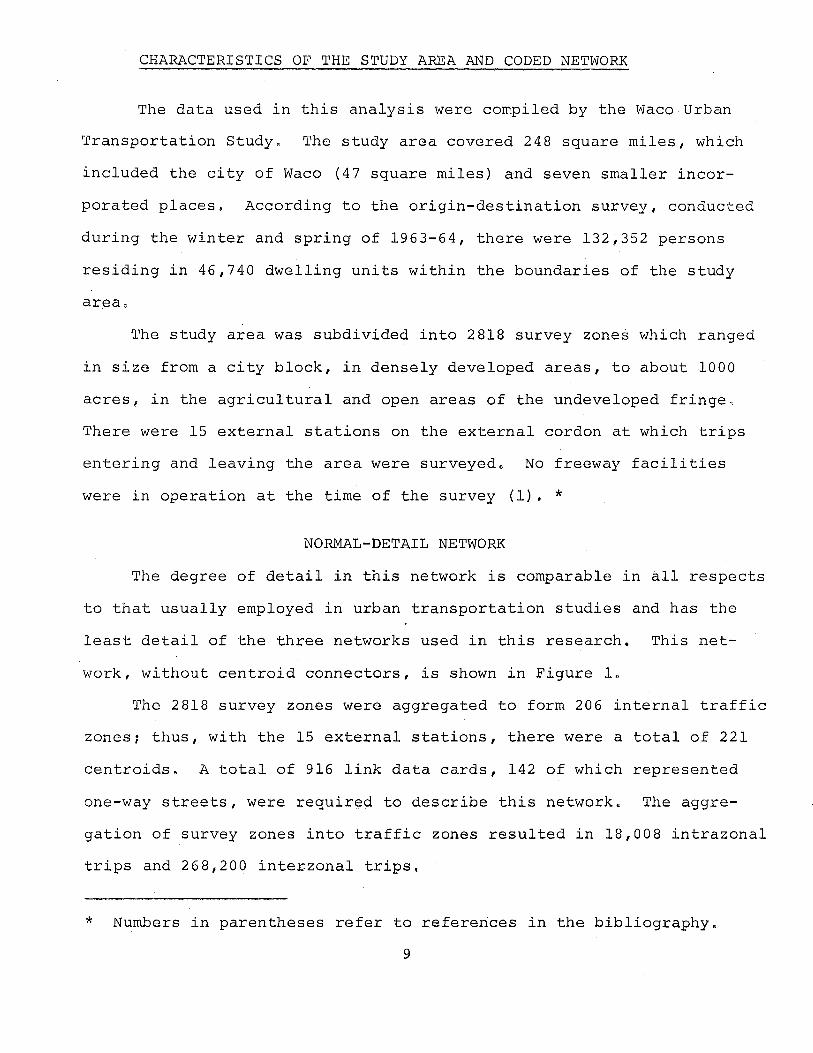
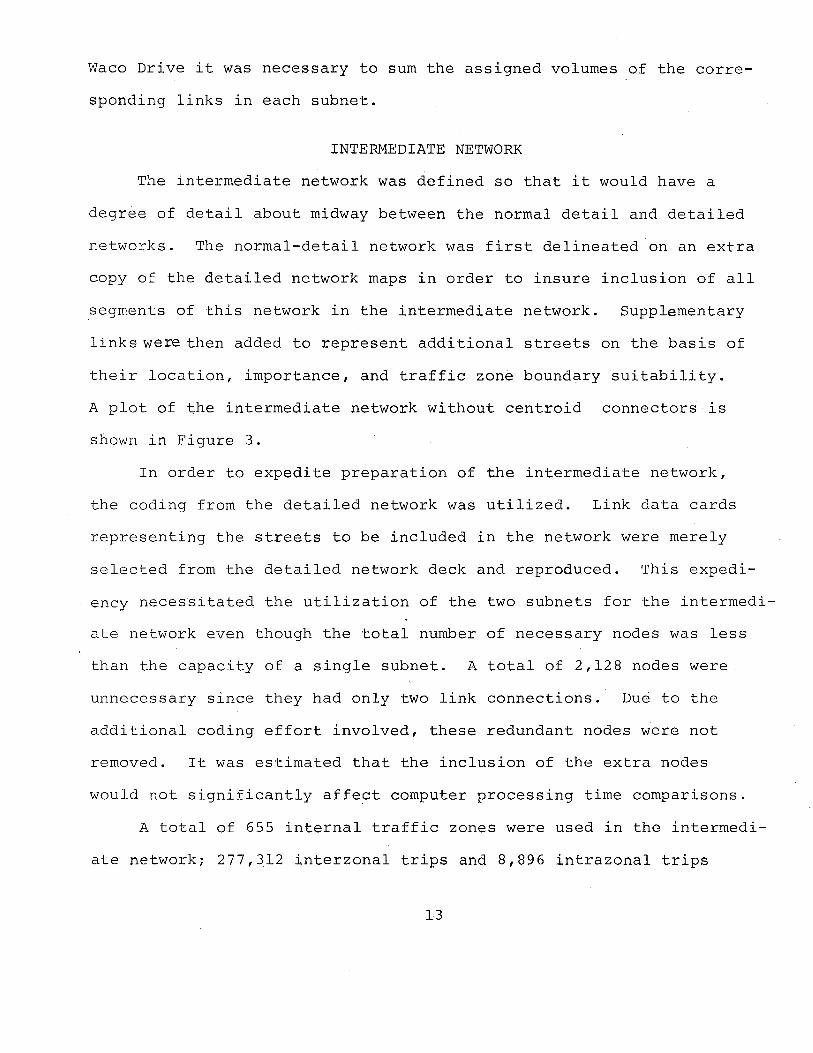
NORMAL-DETAIL NETWORK
The degree of detail in this network is comparable in all respects
to that usually employed in urban transportation studies and has the
least detail of the three networks used in this research. This net
work, without centroid connectors, is shown in Figure 1.
The 2818 survey zones were aggregated to form 206 internal traffic
zones; thus, with the 15 external stations, there were a total of 221
centroids. A total of 916 link data cards, 142 of which represented
one-way streets, were required to describe this network. The aggre
gation of survey zones into traffic zones resulted in 18,008 intrazonal
trips and 268,200 interzonal trips.
* Numbers in parentheses refer to references in the bibliography.
9
J
WACO NORMAL-DETAIL NETWORK
FIGURE 1

DETAILED NETWORK
In defining the detailed network, virtually every existing street
in the study area was included. Coding of this network was done by
the Planning Survey Division of the Texas Highway Department. Because
of the degree of detail, it was necessary to use a node map consist
ing of 20 sheets each of which was 3o5 x 5.5 feet in size. A plot of
the detailed network without the centroid connectors is shown in
Figure 2.
The 2818 survey zones were aggregated to form 1870 internal
traffic zones. Most of the aggregated zones were located in the fringe
where there were very few trip ends; in the developed areas, each
traffic zone corresponded to a survey zone. This aggregation re
sulted in 283,164 interzonal trips and only 3,044 intrazonal trips,
The detailed network contained 5,629 nodes (not including cen
troids), and its description required 12,352 link data cards, 380 of
which represented one-way streets. Because the size of this network
exceeded the maximum for processing it as a unit, it was necessary to
divide the network into two subn~ts. The Brazos River was considered
as a possible partition, but the network section south of the river
appeared to exceed the capacity of a subnet. Therefore, the partition
line was located along Waco Drive as shown in Figure 2.
Only one crossing of the partition line is permitted in order
to reduce computer time in searching the minimum path between two
centroids (2). Therefore, it was necessary to code Waco Drive into
both subnets. In order to obtain the total link volume assigned to
11

@)
~ PARTITION __ _. LINE
;
WACO DETAILED NETWORK
FIGURE 2
Waco Drive it was necessary to sum the assigned volumes of the corre
sponding links in each subnet.
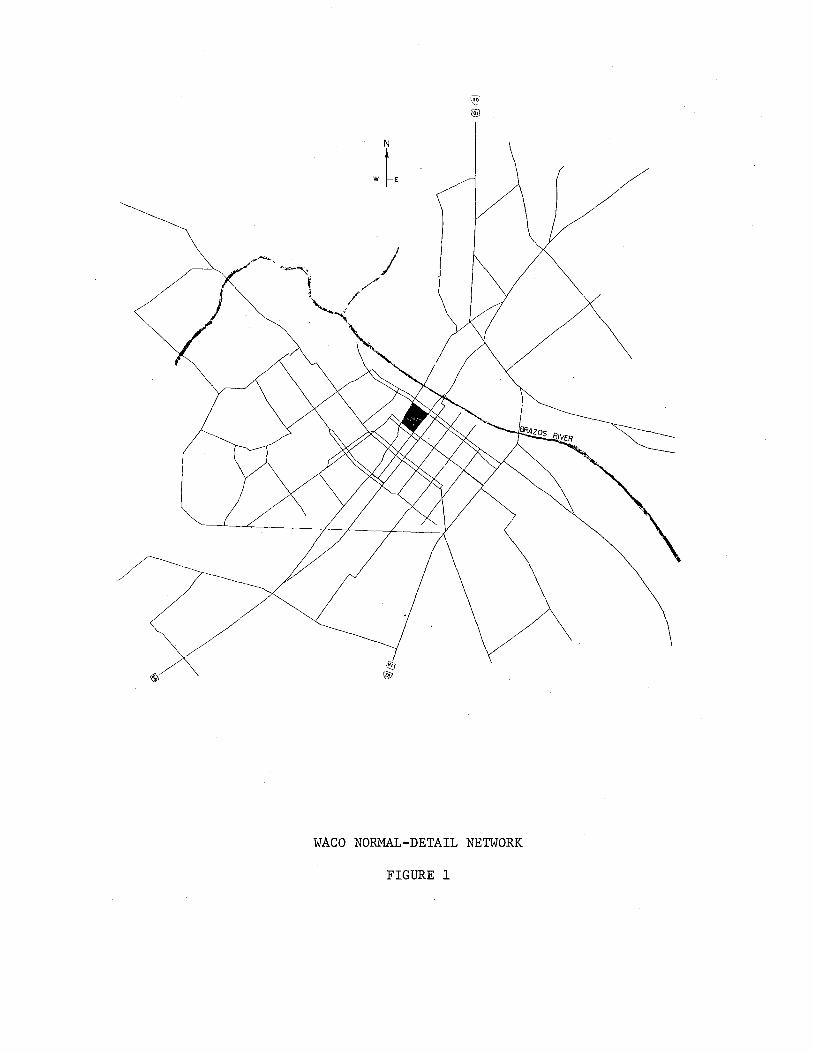
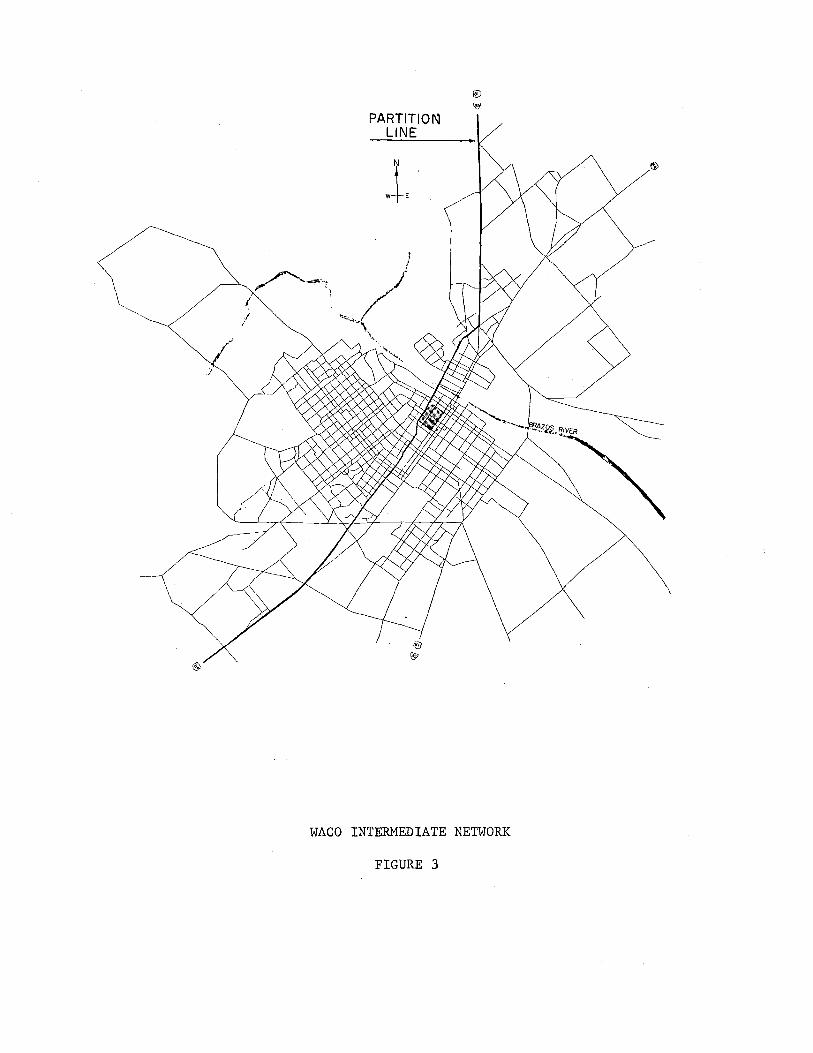
INTERMEDIATE NETWORK
The intermediate network was defined so that it would have a
degree of detail about midway between the normal detail and detailed
networks. The normal-detail network was first delineated on an extra
copy of the detailed network maps in order to insure inclusion of all
segments of this network in the intermediate network. Supplementary
links were then added to represent additional streets on the basis of
their location, importance, and traffic zone boundary suitability.
A plot of the intermediate network without centroid connectors is
shown in Figure 3.
In order to expedite preparation of the intermediate network,
the coding from the detailed network was utilized. Link data cards
representing the streets to be included in the network were merely
selected from the detailed network deck and reproduced. This expedi
ency necessitated the utilization of the two subnets for the intermedi
ate network even though the total number of necessary nodes was less
than the capacity of a single subnet. A total of 2,128 nodes were
unnecessary since they had only two link connections. Due to the
additional coding effort involved, these redundant nodes were not
removed. It was estimated that the inclusion of the extra nodes
would not significantly affect computer processing time comparisons.
A total of 655 internal traffic zones were used in the intermedi
ate network; 277,312 interzonal trips and 8,896 intrazonal trips
L3
:;
I /
/
PARTITIO~ LINE
WACO INTERMEDIATE NETWORK
FIGURE 3
resulted from this zone aggrega~ion. The network contained 1730 effec
tive nodes1
, excluding centroids; 4,124 link data cards, 236 of which
represented one-way streets, were required for the network description.
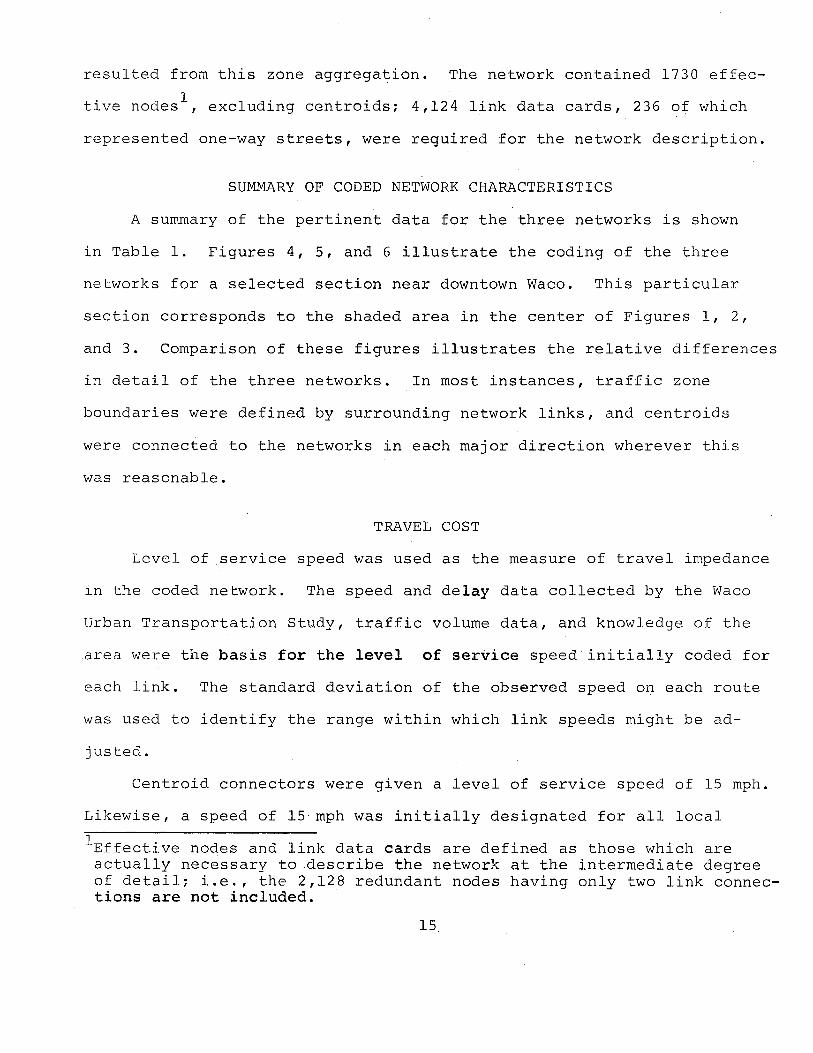
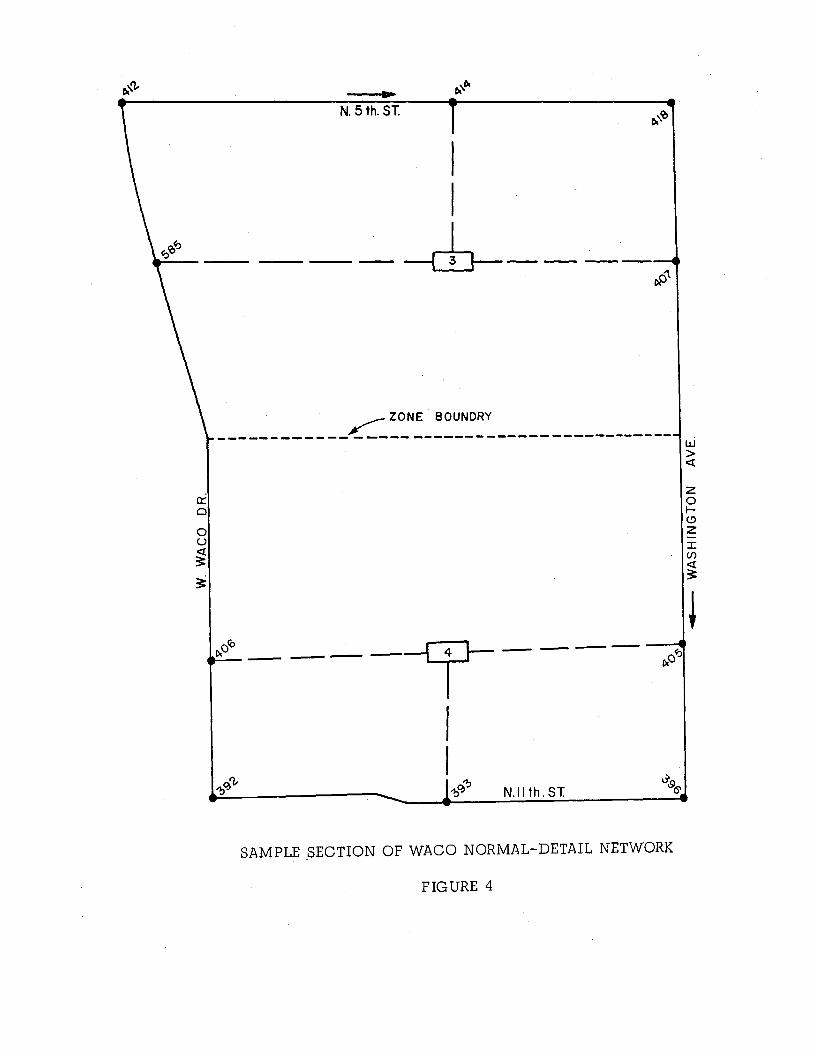
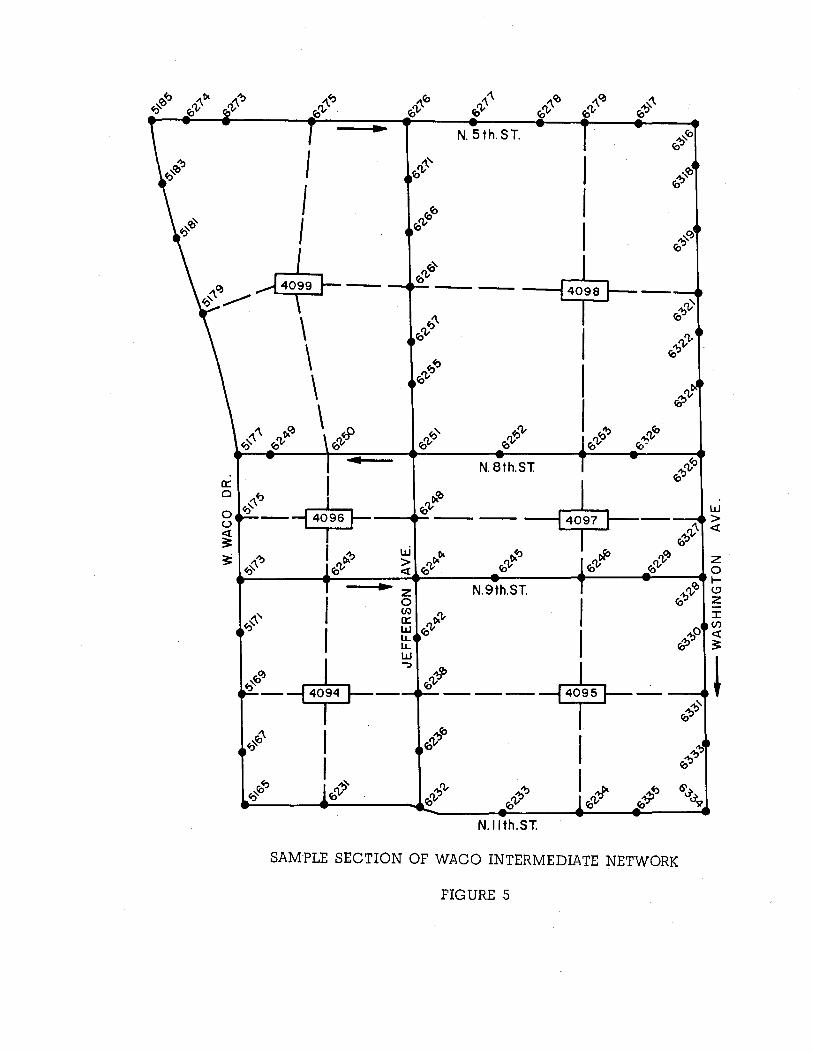
SUMMARY OF CODED NETWORK CHARACTERISTICS
A summary of the pertinent data for the three networks is shown
in Table 1. Figures 4, 5, and 6 illustrate the coding of the three
networks for a selected section near downtown Waco. This particular
section corresponds to the shaded area in the center of Figures 1, 2,
and 3. Comparison of these figures illustrates the relative differences
in detail of the three networks. In most instances, traffic zone
boundaries were defined by surrounding network links, and centroids
were connected to the networks in each major direction wherever this
was reasonable.
TRAVEL COST
Level of service speed was used as the measure of travel impedance
1n the coded network. The speed and delay data collected by the Waco
Urban Transportation Study, traffic volume data, and knowledge of the
.area were the basis for the level of service speed initially coded for
each link. The standard deviation of the observed speed on each route
was used to identify the range within which link speeds might be ad-
justed.
Centroid connectors were given a level of service speed of 15 mph.
Likewise, a speed of 15 mph was initially designated for all local
1Effective nodes and link data cards are defined as those which are actually necessary to .describe the network at the intermediate degree of detail; i.e., the 2,128 redundant nodes having only two link connections are not included.
15

streets in the detailed network. This speed was selected because the
minimum speed on any arterial or collector street was 25 mph, and it
was felt that it was necessary to have a substantially lower level-of
service on local streets in order to prevent overloading these facili
ties and underloading the arterials and collectors.
16

f--' -....]
TABLE 1
SUMMARY OF NETWORK CHARACTERISTICS
Number of Zones (Centroids)
Number of Non-Centroid Nodes
Total Number of Nodes
Total Number of Link Data Cards
Number of One-Way Lin~ Cards (included in the above total)
Number of Intrazonal Trips
Number of Interzonal Trips
Total Number of Trips
Intrazonal Trips
Normal-detail Network
221
410
631
916
142
18,008
268,200
286,208
6.3%
Intermediate Network
670
(3858) 1 1730 2
(4528) 2400
(6252) 4124
(380) 236
8896
277,312
286,208
3.1%
Detailed Network
1,885
5,629
7,514
12,352
380
3,044
283,164
286,208
1.1%
1The numbers in parentheses represent the number of nodes or link data cards ln the intermediate network. Detailed network coding was used.
2These numbers indicate the number of nodes and links necessary to represent the intermediate network at the degree of detail to which it is coded.
.. N. 5th. ST.
I I
-cb---~- ,p1.
,-ZONE BOUNDRY
------------------------------------------
--cp--------- I
I I
9":1 ~ N.ll th. ST.
o<-:> Oi
SAMPLE _SECTION OF WACO NORMAL-DETAIL NETWORK
FIGURE 4
w > <l:
z 0 I-<-' z :r: (/)
<l: ~
~
6-!0'~~ ------1
N.9th.ST.
I I
!0,.,4' ___ +---(':)!0 I !O'J)
N.ll th.ST.
~':> !O'b
~tO !O'b
:":>0 !O'b
:":>' !O'b
:":>"3 !O'b
6'~ II'i?
SAMPLE SECTION OF WACO INTERMEDIATE NETWORK
FIGURE 5
w > <t
z 0 t-(.!)
z I (J)
<t ~
l
.. N.9th. ST.
N. II th. ST.
SAMPLE SECTION OF WACO DETAILED NETWORK
FIGURE 6

NETWORK ASSIGNMENT
DETAILED NETWORK
The initial assignment of the detailed network resulted in con
siderable disagreement between assigned volumes and ground counts,
These discrepancies clearly indicated a need for speed adjustments.
Therefore, it was decided to make a uniform speed change of 2 mph on
each link which deviated from its corresponding ground count by more
than 10 percent; speeds were decreased 2 mph on each link overassigned
and increased 2 mph on each underassigned link. Approximately 2000
link data cards were revised after the first assignment.
After these changes had been made, trips were reassignedo The
result of the second assignment was almost exactly identical to that
of the first, and no significant improvement in agreement with ground
counts was found.
The uniform speed change philosophy was again used in preparation
for the third assignment. In addition, since the river crossings at
La Salle Street and Washington Avenue were considerably underassigned
and the links representing Waco Drive were overassigned, a zero turn
·penalty was used on the third assignment. It was believed that the
turn penalties used in the previous assignments might have forced
trips, which in reality would cross the river at either La Salle or
Washington, to be assigned to Waco Drive.
Several test trees were examined to determine what effect, if
any, resulted from the use of the zero turn penalty. No illogical
routings were found; when the trees with a zero turn penalty were com
pared to trees with a turn penalty, only a few minor differences were
observed a
21
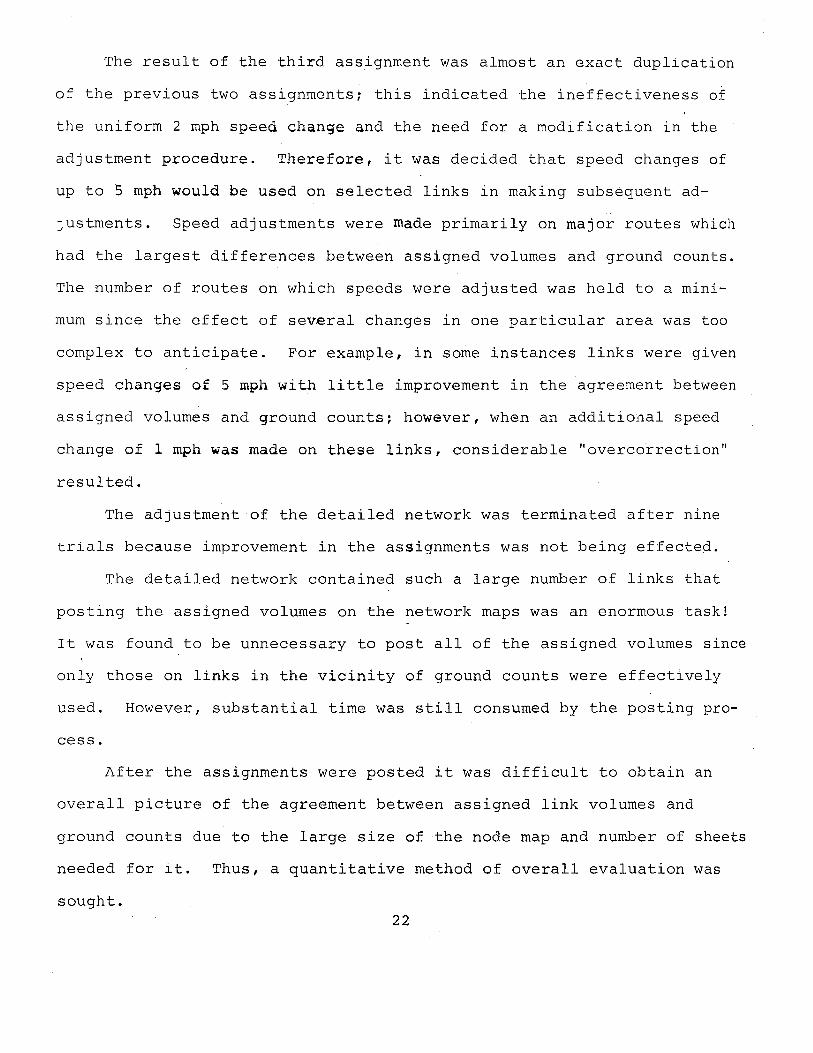
The result of the third assignment was almost an exact duplication
of the previous two assignments; this indicated the ineffectiveness of
the uniform 2 mph speed change and the need for a modification in the
adjustment procedure. Therefore, it was decided that speed changes of
up to 5 mph would be used on selected links in making subsequent ad-
JUstments. Speed adjustments were made primarily on major routes which
had the largest differences between assigned volumes and ground counts.
The number of routes on which speeds were adjusted was held to a mini
mum since the effect of several changes in one particular area was too
complex to anticipate. For example, in some instances links were given
speed changes of 5 mph with little improvement in the agreement between
assigned volumes and ground counts: however, when an additional speed
change of 1 mph was made on these links, considerable "overcorrection"
resulted.
The adjustment of the detailed network was terminated after nine
trials because improvement in the assignments was not being effecteq.
The detailed network contained such a large number of links that
posting the assigned volumes on the network maps was an enormous task!
It was found to be unnecessary to post all of the assigned volumes since
only those on links in the vicinity of ground counts were effectively
used.
cess.
However, substantial time was still consumed by the posting pro-
After the assignments were posted it was difficult to obtain an
overall picture of the agreement between assigned link volumes and
ground counts due to the large size of the node map and number of sheets
needed for it. Thus, a quantitative method of overall evaluation was
sought. 22
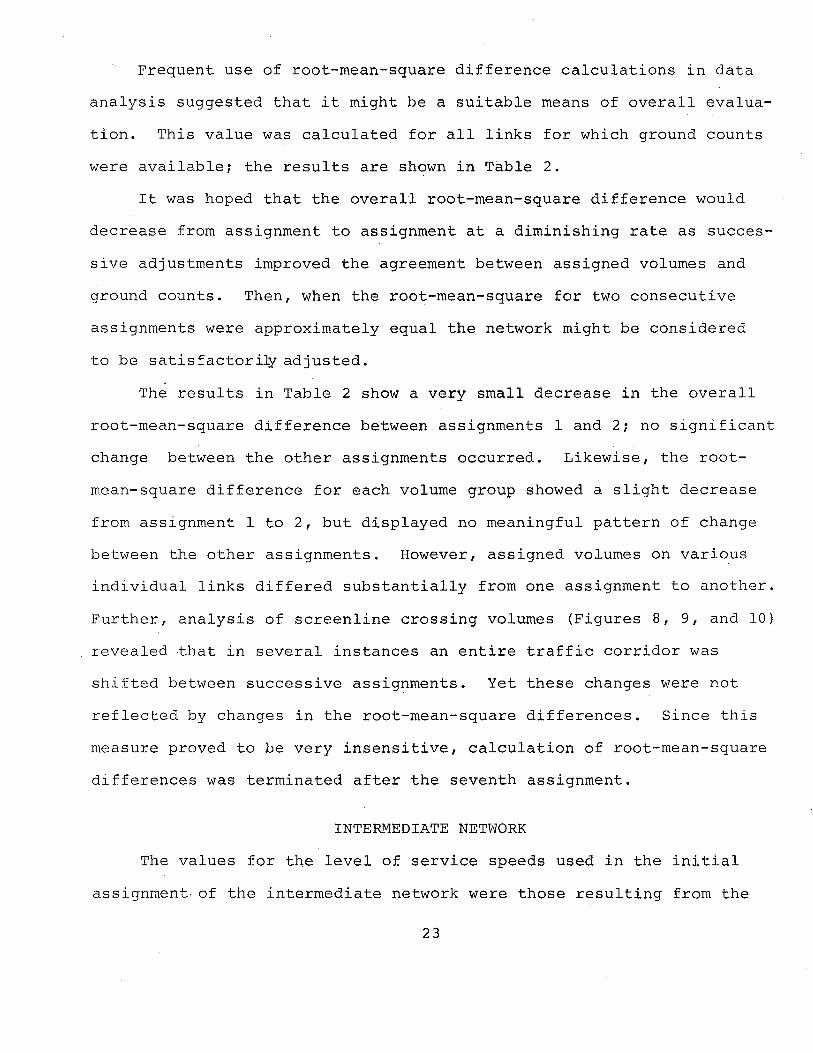
Frequent use of root-mean-square difference calculations in data
analysis suggested that it might be a suitable means of overall evalua
tion. This value was calculated for all links for which ground counts
were available; the results are shown in Table 2.
It was hoped that the overall root-mean-square difference would
decrease from assignment to assignment at a diminishing rate as succes
sive adjustments improved the agreement between assigned volumes and
ground counts. Then, when the root-mean-square for two consecutive
assignments were approximately equal the network might be considered
to be satisfactorily adjusted.
The results in Table 2 show a very small decrease in the overall
root-mean-square difference between assignments 1 and 2; no significant
change between the other assignments occurred. Likewise, the root
mean-square difference for each volume group showed a slight decrease
from assignment 1 to 2, but displayed no meaningful pattern of change
between the other assignments. However, assigned volumes on various
individual links differed substantially from one assignment to another.
Further, analysis of screenline crossing volumes (Figures 8, 9, and 10)
revealed that in several instances an entire traffic corridor was
shifted between successive assignments. Yet these changes were not
reflected by changes in the root-mean-square differences. Since this
measure proved to be very insensitive, calculation of root-mean-square
differences was terminated after the seventh assignment.
INTERMEDIATE NETWORK
The values for the level of service speeds used in the initial
assignment· of the intermediate network were those resulting from the
23

N .p,.
TABLE 2
COMPARISON OF RMS DIFFERENCES FOR DETAILED NETWORK
Ground Count Number of Volume Range Links Asmt 1 Asmt 2 Asmt 3
0-1499 124 768 710 701
1500-4999 188 2056 1879 1811
5opo-9.999 127 3420 2932 2825
10000-14999 30 5059 3319 3424
15000-19999 18 5618 2578 2894
20000 & over 12 5860 5257 4815
overall 499 2866 2281 2225
RMS difference~ J E(Assigned Volu~e-Counted Volume)2
where N = number of links compared
Asmt 4 Asmt 5
672 612
1838 1838
3060 3060
3301 3301
3348 3348
5129 5129
2336 2330
Asmt 6 Asmt 7
732 747
1832 1833
2890 2854
4670 3154
3856 3511
4299 3749
2410 2203

final assignment of the detailed network. The process of assignment
and adjustment of the level of service speed parameter was then fol
lowed in attempting to obtain more reasonable agreement between
assigned volumes and ground counts for the intermediate network.
Five assignments were made to this network.
Since the degree of detail in the intermediate network was only
one-third of that of the detailed network, it was anticipated that
the intermediate network would be much easier to work with. However,
the same difficulties in adjusting the network were encountered. The
effects of speed changes were nearly impossible to predict; this made
it necessary to resort to the procedure of changing speeds on only a
few links in any one area of the network at a time, as was done in
the detailed network adjustments. Also, the same difficulty in attain
ing realistic assigned volumes crossing the river at Waco Drive, La
Salle Street and Washington Avenue was encountered.
NORMAL-DETAIL NETWORK
The normal-detail network pr~sented the least difficulty in
network adjustment. The effects of speed changes were readily anti-
cipated, and as a result only three assignments were necessary in
order to obtain satisfactory agreement of assigned volumes with
ground counts.
25

ANALYSIS OF ASSIGNMENT RESULTS
Several techniques were used to compare the assignments to the
three different doded networks for the Waco Study area. Screenline
volumes were first examined to establish the agreement between traffic
counts and the trlp tables; then, they were analyzed w1th respect to
corridor movements.
The ass1gnment results for selected arter1al streets were con
trasted through the use of profile plots. Due to the difficultles
encountered 1n obtaining agreement between assigned link volumes and
ground counts on one-way streets, plots of representat1ve one-way pairs
were also made. Scatter diagrams of ass1gned and counted volume were
plotted us1ng ind1vidual links for which ground counts were ava1lable.
Additional network parameters were examined in attempting to
explaln the assignment results. These parameters lncluded such mea
sures as total network mileage, average network speed, relat1ve fre
quency d1strlbut1ons of interzonal travel times, as well as some of
the trlp t.'.<Dle propert1es. Consumption of computer t1me was established
as a means of evaluat1ng the relat1ve "cost" of traff1c ass1gnment for
each coded network.
SCREENLINE VOLUMES
The screenlines shown 1n Figure 7 were selected for use 1n analyz
ing corr1dor movements since they were cons1dered to 1ntersect the
maJor corridors of traffic flow. The screenl1nes, of course, are the
same for all three networks.
Adjustment of link speeds on the intermed1ate and normal-detail
networks seems to have had relatively little effect on the assigned
26
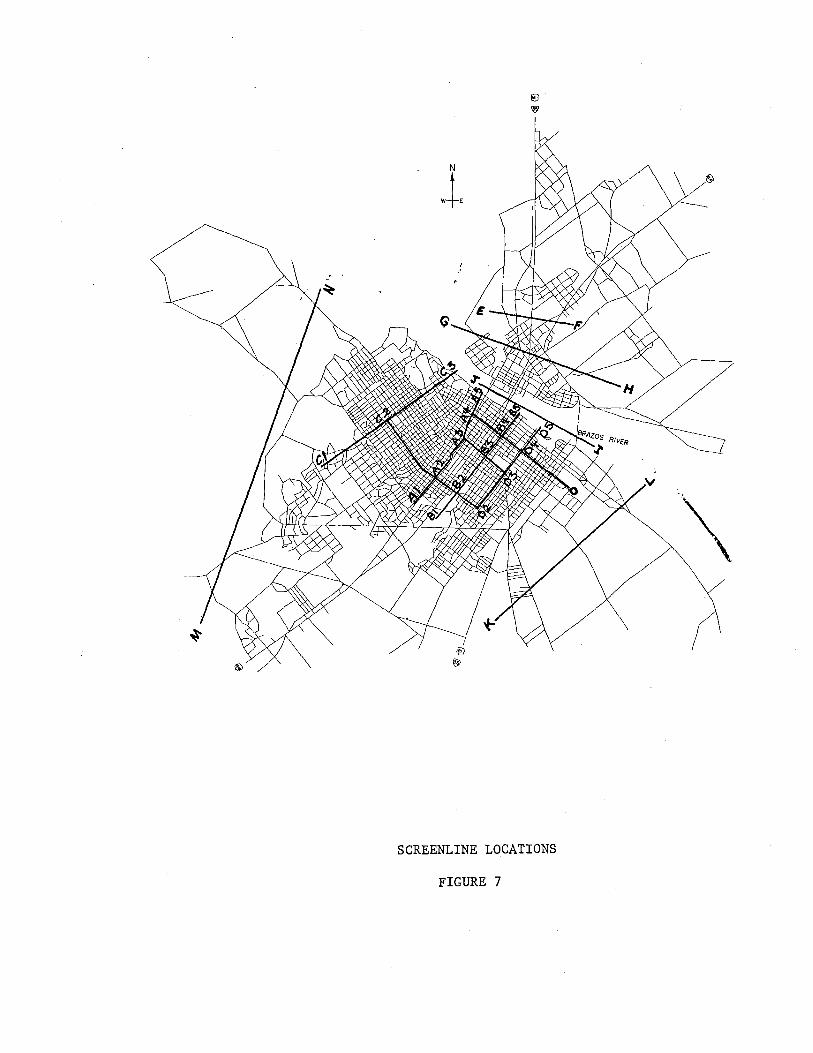
SCREENLINE LOCATIONS
FIGURE 7

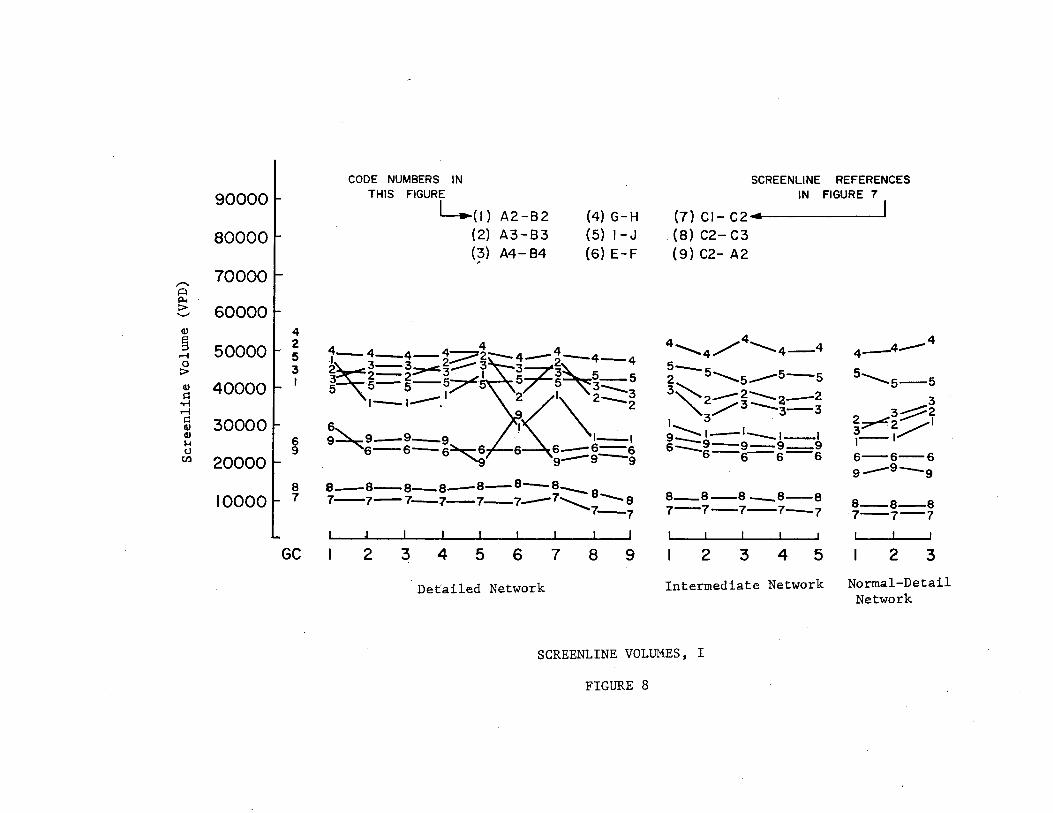
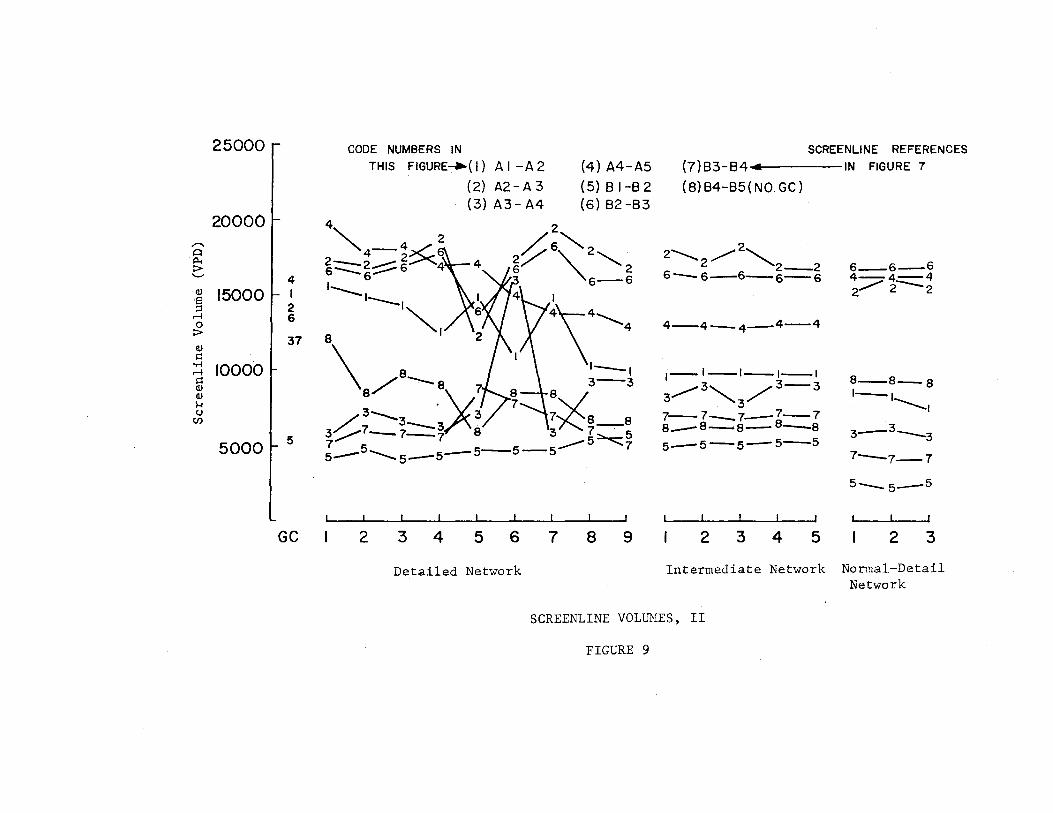
;~e crcssi~g a screenline. A pronounced shifting of traffic
between corridors was observed between some assignments on the
detailed network; this phenomenon was not found in the assignments
to the other networks" This shifting is demonstrated by the pro
nounced change in screenline volume for successive assignments as
shown in Figure 8,9, and 10. An example is the "jump" in the vol-
ume across screenline 3 between assignments 5, 6, and 7 in Figure 9.
The screenline crossing volumes between the first assignments to the
detailed network were reasonably stable, as would be expected since
the uniform speed changes did not result in noticeable changes in
assigned link volumes. The pronounced corridor shifting occurred
in later assignments when the level-of-service speed adjustment
scheme was altered and speed changes of larger magnitude were made
on a limited number of selected links.
All three networks resulted in substantially similar screenline
crossing volumes; this is somewhat surprising in view of the differ
ent network characteristics. Smaller screenline crossing volumes
might be expected on networks with less detail since traffic zones
are larger and fewer interzonal trip.s would be expected, However,
as. was shown in Table 1, the use of the lesser detailed networks
llarger zones) resulted in a very small decrease in the proportion
of interzonal trips, However, it may be noted that the assigned vol-
umes crossing the screenlines are generally lower than the traffic
count volumes. This suggests a possible deficiency in the number of
trips reported in the origin-destination survey. A portion of the
deficiency can be attributed to internal trips made by nonresidents
of the study area after entering the study area; such trips become
registered in traffic counts but are unsurveyed. Certain vehicle
28
,... A P..· ::> .._,
Q)
~ ...-1 0
::> Q)
s:: -M ...-1 s::
Q) Q) ,_. c.J
tl.l
90000
80000
70000
60000
50000
40000
30000
20000
10000
4 2 5 3 I
6 9
8 7
GC
CODE NUMBERS IN THIS FIGURE
L..(l) ( 2)
(~)
A2-82 A3-83 A4-84
(4) G- H (5) I- J (6) E-F
4 4 1-.4-4-42-;::::::::.:~·-2-·-· . ~3-3~ :,......- 3 3-r ~ 23 2-2---3.~1 5 35 5_5 5 s-s-~_...... 2:(1\~:::::::3 r----1~. 2
I 6 I 9 9-9-9 . 1-1 ~6-6-6~6 /'6 6-6==.6 ~~-E 9--9 9
s-B-8-8-s-8-8--a 1 --a 1-7-7-7--7-7--~
. 7-7
2 3 4 5 6 7 8 9
Detailed Network
SCREENUNE REFERENCES IN FIGURE 7
(7) Cl- C2... I . (8) C2- C3 (9) C2- A2
4 4'-......4/"'4-4
5-s-- 5-5 2 ._5_....-3"2 __ 2 __ 2_2 "'/3--3-3 I 3 9.........._1_1 __ 1--1 6:::::::9-9-9--9
5-6-6--6
B---8---8-8--8 7-7-7---7---7
2 3 4 5
4-4--4
5 .........._5--5
3 2~3:::::::::==2 3~2 ./1 ~--I ...........
6-6-6 9--9-9
8--8-8 7-7-7
I I I
2 3
Intermediate Network Normal-Detail Network
SCREENLINE VOLUMES, I
FIGURE 8
,-... A p.. :> '--'
25000
20000
·~ 15000 ::1
.--1 0 :> QJ
s::: ;:: 10000
s::: QJ El)
~ (J
C/)
5000
4 I 2 6
37
5
GC
CODE NUMBERS IN
THIS FIGURE-+(!) AI-A2 (4)A4-A5
(2)A2-A3 (5)81-82 (3) A3- A4 (6) 82-83
2
2~ 6""" 2 ~ 6 2 6-6
I
4'\--4 8 • 2 \ ............
\ /"--· ·-· 8 x1 3-3 3 . 8 3~7.=::37--3 3 7v8 7~ -7 8 ~~-.-8
s--5--5-s-5-5-5--5~~
2 3 4 5 6 7 8 9
Detailed Network
SCREENLINE REFERENCES
(7)83-84 IN FIGURE 7
(8) 84-85( NO. GC)
2 ............... 2/2""-2-2 6-6-6-6-6
4-4---4---4---4
~--1--1-1-1
3 ............. 3""'-3/3-3
7--7-?-7-7 8-8-9-8-9
5-s-s-5-5
2 3 4 5
6--6--6 4--4 2..,.........z==:::::..i
8--s-a 1-1---1
3-3--3
7-7--7
5 __ 5_s
2 3
Intermediate Network Normal-Detail Network
SCREENLINE VOLill1ES, II
FIGURE 9

25000 I
;-.. 2oooo t-0 p.., > "-.;
" 9 ..-I 15000 . 8 0 > 5 <II 2 t::
·r-4 3 ..-I t::
10000 4 <II <II 6 ,... u I tJ)
7 5ooo r
GC
CODE NUMBERS IN THIS FIGURE
l..cn o2-o2 (4) 84-04 (2)03-04 (5) 83-03 (3) 04-05 (6) 82-02
u _ 8---e- 8-8-8-8-8-8
3-3-3---3~3--3-3 ...........
--~~3~ 1-·-1-1-1-~~5~1 3
2 /s ~ 4~s":::::::; 1 5 ___ 5 ___ 7 7 ---7 7 ___ 5 5~7=1---2~ 2-2 ............... 4 7 7 l-~----4 4 2~2 6-L_ ....--
6 __ 6 __
6 __ 6-6-6 :
4 6
2 3 4 5 6 7 8 9
Detailed Network
SCREENUNE REFERENCES IN FIGURE 7
1 (6) 82-02 .. (7) M-N (8) K-L
8-8-8-8-8 8-8-8
~::::::::2=><::_5 5. 2
5-5::=:: 5 =5==-5 6-6-6 6C:::::::::6- 6-6-6 2-2-2-2-2
I 1 I 7 __ 7_7_7_7 3==3--3 3.><,.1:--..,.1 1 I
I 3-3-3-3 1-7==7
4-4'-... 4-4-4 4-4-4
I I I
2 3 4 5 2 3
Intermediate Network Nornal-Detail Network
SCREENLINE VOLUMES, III
FIGURE 10
types (e.g., city owned vehicles) also escape being surveyed but
contribute to traffic counts.
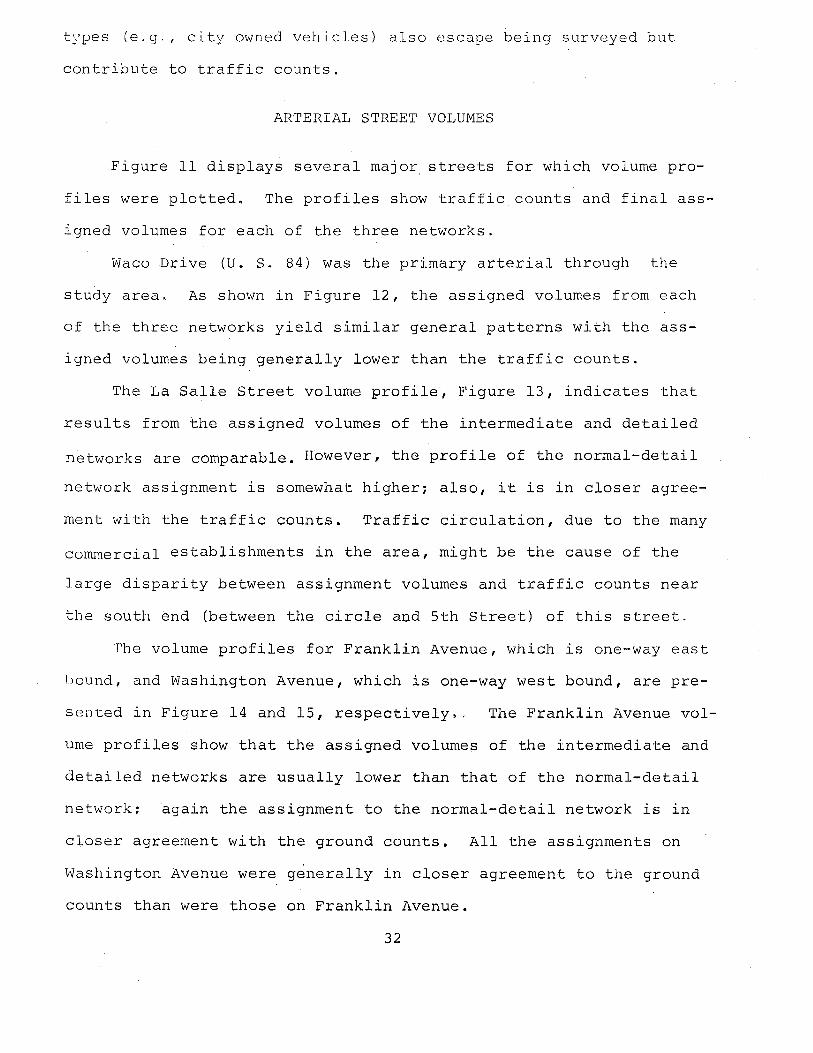
ARTERIAL STREET VOLUMES
Figure 11 displays several major. streets for which volume pro
files were plotted. The profiles show traffic counts and final ass
igned volumes for each of the three networks.
Waco Drive (U. S. 84) was the primary arterial through the
study area, As shown in Figure 12, the assigned volumes from each
of the three networks yield similar general patterns with the ass
igned volumes being generally lower than the traffic counts.
The La Salle Street volume profile, Figure 13, indicates that
results from the assigned volumes of the intermediate and detailed
networks are comparable. However, the profile of the normal-detail
network assignment is somewhat higher; also, it is in closer agree
ment with the traffic counts. Traffic circulation, due to the many
commercial establishments in the area, might be the cause of the
large disparity between assignment volumes and traffic counts near
the south end (between the circle and 5th Street) of this street.
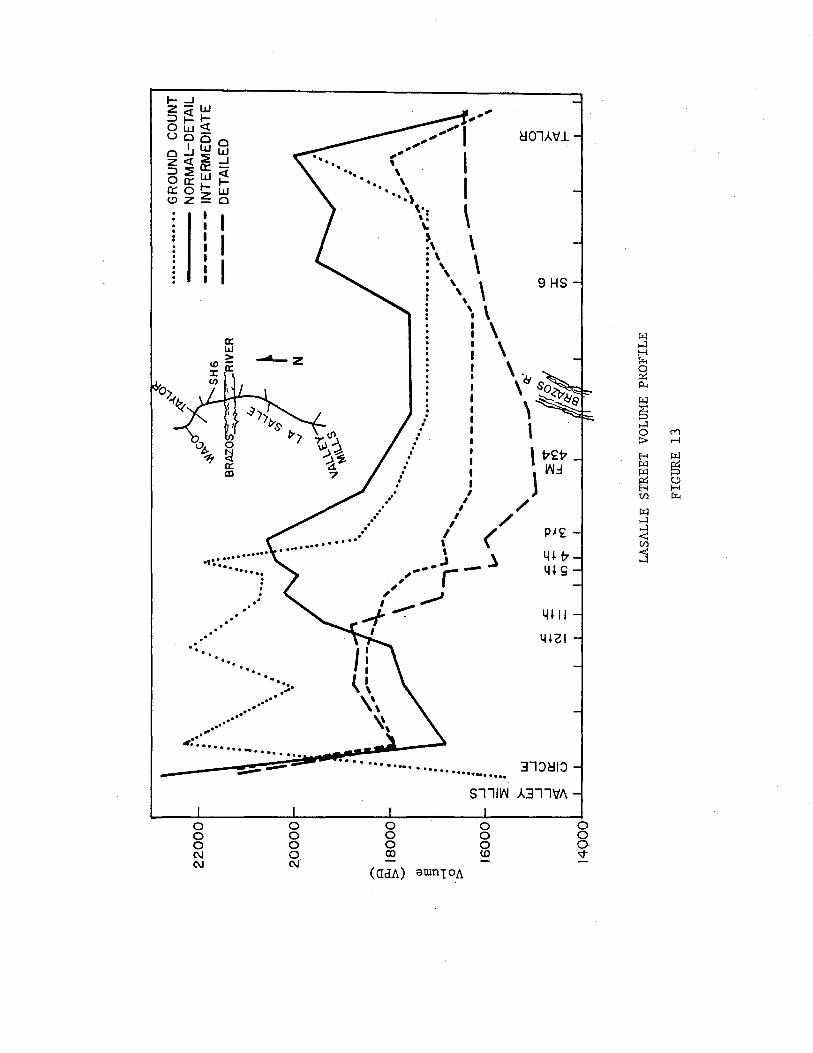
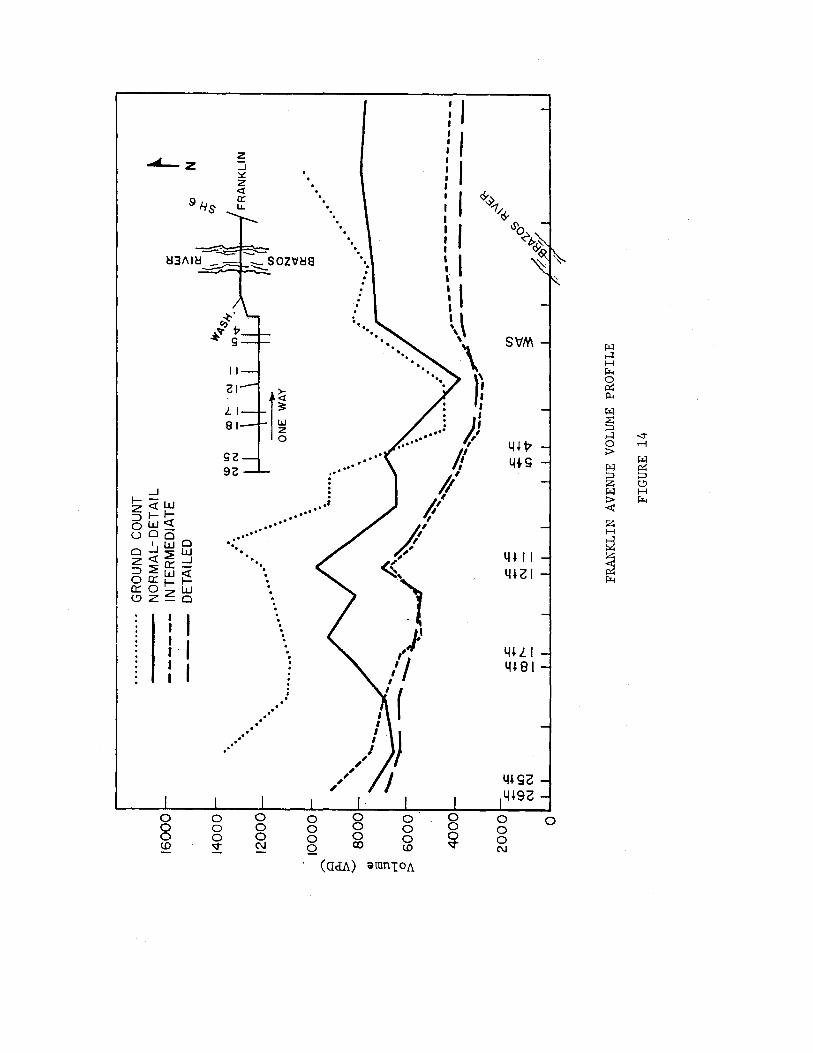
·rhe volume profiles for Franklin Avenue, which is one-way east
bound, and Washington Avenue, which is one-way west bound, are pre
sented in Figure 14 and 15, respectively •. The Franklin Avenue vol
ume profiles show that the assigned volumes of the intermediate and
detailed networks are usually lower than that of the normal-detail
network; again the assignment to the normal-detail network is in
closer agreement with the ground counts. All the assignments on
Washington Avenue were generally in closer agreement to the ground
counts than were those on Franklin Avenue.
32

CODE WACO a US 84
\§! 2 LA SALLE @ 3 FRANKLIN
4 WASHINGTON N 5 18th a BOSQUE
w-~E 6 17th a HOMAN 7 VALLEY MILLS
~-, ...... ,
·I
I
'-·
~ \
·. ~v
:X
VOLUME PROFILE LOCATIONS
FIGURE 11

oo o oo oo oooo o o o GROUND· COUNT NORMAL- DETAIL
27000r J!/ 'cORDON LINE ------- INTERMEDIATE
!'f.\ --- DE TAl LED Oo 01\ooooooooooo
' o. ' · .. . , .... --~,· .. ~
,00 ' 0 21000 r oSJ"'/ .. , I : .·1 • ',0::.0,
• I,- • ~ I '- ' 0-:--' ,,
." ....-._ ~ oo \ I\
oo•.\ I \
CORDON LINE . ~~· •• o-·.. _.- ~~- \ ~,·. I \ -, -... • \ \ ·I '
8 r . (', . -~ , ,.._ ·. ~ 15000 0°000
',, ,., \. tJ ·... 't ........ .·. \ ,~, I -._ ' Ill 0 ,..J - ~-§ •. •
> / \ ~~ • '6 ~ J/\X\1, ... 9000 ••• ; • - \ "r:h
a: LLI >
10 - __] a: 3000._ $
I '
0
~ LL.
WACO DRIVE VOLUME PROFILE
FIGURE 12
Cl 0:::
(f)
0: IJJ > w
:x:o: en
··~·.:··· .......
. . . . . · . · .· . . . .
.. ...
. . ..
.. .. ..
. .
.. ..
. . . . ..
. . .. . ... ... .. .. ..
fll •••••• . . . -....... .
0 0 0 C\J C\J
0 0 0
2·
: \ . \ \
\ \
\\ \ '• \ : \ i \
~OlA'Vl
9 HS
~ \ "&-1 \ so<t; I \ :.,...: <!f&
.. ·· ..... .. ··
. . . . . .•· .
I \
: \ 17£17
; l ~=l ,' /
,' / / ( ' .... .J _l ,,, ... r
:..,.. / --+·
I
. ..... . . . .. . . .. . . . . ........ .. . Slll~ A3ll'VA
0 0 0 0 0 0 Q) (D
(OCL\) <:lUinTOA
0 0 0
"'"
r:Ll ....:! H 1'<-f 0 r:x: p..
r:Ll
?5 ....:! 0 C"')
:> r-1
H r:Ll r:Ll r:x: ~ :::> r:x: c.!l H H C/) 1'<-f
~ ....:! ....:! -«:: C/)
j
"""'-- z
0 0 0 <.0
91-is
0 0 0 ¢
z :::i ::.: z <t a:: LL.
. . .... .....
r: .. .. ..
··. . . . . . . . . .
..
. .
. .
. . . .
. • .
. · .. ··· .. ····
0 0 0 C\J
. .
. ...
·. ·.
... ... . . . . . ·' ..
· . :
. . .
..
0 0 0 0 0 0 Q <.0
(acll\) ~mntol\
0 0 0 C\J
0
r:LI ....:1 H ~ 0 ~ j:l.,
r:LI
~ ....:1 0 :> r.Ll ;:::> z r.Ll :> ~
z H ....:1 ~
~ ~
-.:t ,...f
r:LI ~ ;:::> (!) H ~

~z 4~17
4~ ~
4l II 4~ 2 I
4+ L I 4l 81
4~ ~ 2 4~92
z 0 1-<.? z I (/')
~
J:
0 0 0 0 0 0 0 co
"""" '·~ '· ............. \ I \ ·· .. f \
..... ,~,
4 ~ II LU 21
4~LI 4~ 81
',~4~~2 ~4~92
0 0 0 0 0 0 0 0 0 \.0 ~ C\J
(Gdl\) iH11Tl101\
w ....:l H
""' 0 ~ p...
w ?!5 ....:l 0 ~ lJ")
.-l w 0 w z gg w ~ c.!>
H
""' z 0 H c.!> z H ::r: CJ1
~
0
All of these routes (Waco, La Salle, Franklin, and Washington) are
paralleled by other streets. Therefore, it might be thought that these
links were generally underassigned in the intermediate and detailed
networks due to the fact that traffic was being assigned to parallel
facilities, which were not included in the description of the normal
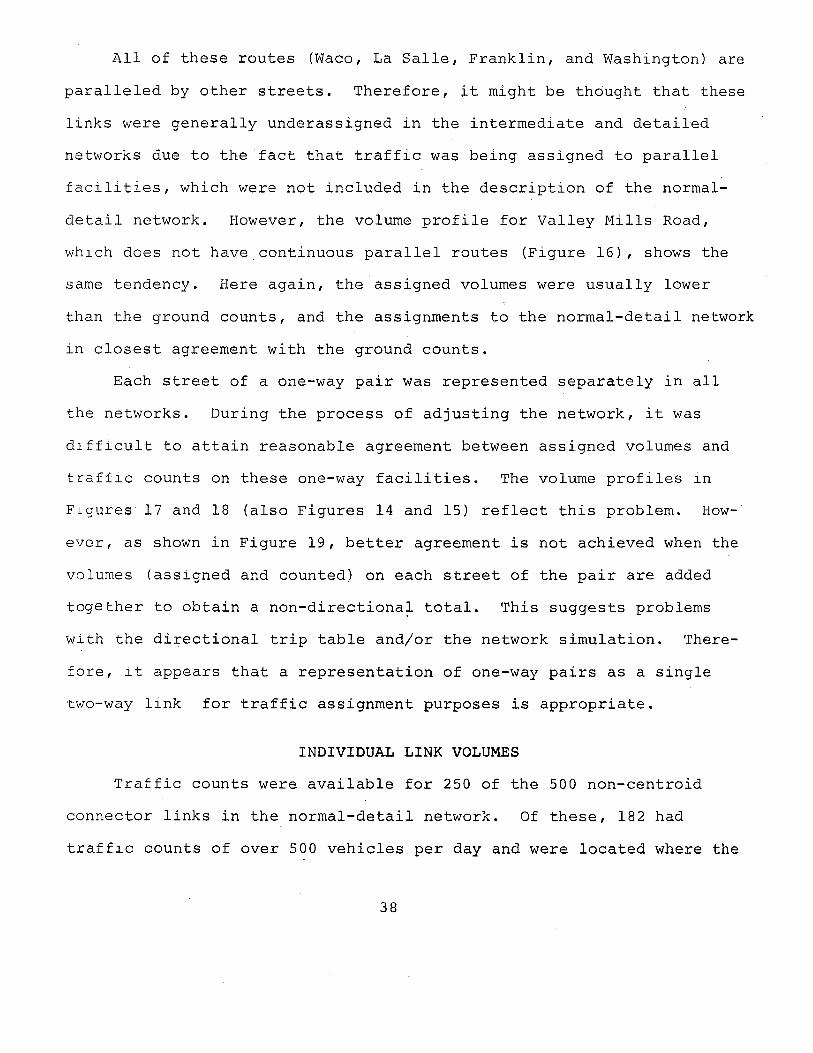
detail network. However, the volume profile for Valley Mills Road,
wh1ch does not have continuous parallel routes (Figure 16), shows the
same tendency. Here again, the assigned volumes were usually lower
than the ground counts, and the assignments to the normal-detail network
in closest agreement with the ground counts.
Each street of a one-way pair was represented separately in all
the networks. During the process of adjusting the network, it was
difficult to attain reasonable agreement between assigned volumes and
traff1c counts on these one-way facilities. The volume profiles in
Flgures 17 and 18 (also Figures 14 and 15) reflect this problem. How
ever, as shown in Figure 19, better agreement is not achieved when the
volumes (ass1gned and counted) on each street of the pair are added
together to obtain a non-directional total. This suggests problems
with the directional trip table and/or the network simulation. There
fore, 1t appears that a representation of one-way pairs as a single
two-way l1nk for traffic assignment purposes is appropriate.
INDIVIDUAL LINK VOLUMES
Traffic counts were available for 250 of the 500 non-centroid
connector links in the normal-detail network. Of these, 182 had
traff1c counts of over 500 vehicles per day and were located where the
38
10000 _...... A
~ '-'
G.l
§ r-1
g. 6000
4000
2000
. . . . . . . .
---. .. . · .. .· ··. .. ·. .. · ..
GROUND COUNT NORMAL- DETAIL INTERMEDIATE DETAILED
.··· ...................... . • •• ••••••••• • ! ••• •• .. ·. .. ... . .. ·.• .·· .. . . . .. .
. . . . /7\, ~-.:-:..:-, , "' ., ... .... .... ,, .,; '\. ' ~ ~ .. ,, .,"', ' .... , ' ' ' / \,/ ~ ',, ....... .....,., ______ _ . . ·..... /..,
~ I ' , ~ N ', ,' ~ ~ , /.
, ....... , "-" ;.a-c- - , ,
~ 0 "' 8 (J ~ ~ "-J
I ~--' . • . . . . . . . . .
(,\tl /~ ( y VALLEY MILLS I ,: . . . . . . . . .
I' I I __ ,
I :w CD I ,::::> CD 0 o~----' (/) (.) 0
I CD
(/) Cl <t 0 a:: ~ w z
z ::J z 1-~ 0 ::r:
0 z 1- (!)
(.) <t 1- w <t a:: ::::> a.. 3: LL Q (/)
0~._~--~~--~--------~~--~--~----~--~~----~~~----~--~
VALLEY MILLS ROAD VOLUME PROFILE
FIGURE 16

,...._ Q p..., :> ........-
al
§ .--4 0 :>
13000 .----------
11000
9000
7000
5000
~ N
0~
" 0 ~0 ,~ C., -~ .LV
~"?'- 0'' ~-.;- ~ ~~ ~"Y- ~ "0 ~
~ e,'-' .;::," "0
0~~ ·II~ ;;;:-:.
~t--4r
<) ¢' ~
tet~
....... ,, I,, 6' I ~ .J.t I --.. -:.~
I ·./
: A-~~ _;..........,-. ,, C - . \\ ·--. ·. '\ .. ,.~ IJ' ' • \ ( J • 11
: • •• ' ' ·lr,1; I • • \ \ ·, \ •
••••••• ••••••• GROUND COUNT NORMAL- DETAIL
------- INTERMEDIATE --- DETAILED
'I .• • : I ,~ . . \ ., \· : ·. \ \ : \~. . . ' . I . : ·. \ '" ,~~--....... , . . v'\j . : ·. ~' v: \ ·. \ 1 ' : ·.:\I ' I . . .. ,, , ~ - , L . '--'-- \ \ .. : . ' ,, .. . ' ... , : ' . . . . . \. ·. . . . ,,, .
: ·. : '-- '~, . . . """-'• . ... .. . ' . . . . . ----j ·,. --
..c. ..c.
<.0 l() C\1 C\J
...... ·
. . . .
z 0:: :::::> 1-
0 £:. (.) - <l: ...... 3:
z 0 1- z (.!)
:::::i z ~
I z >-(/) <l: <l: <l: 0:: _J
3: LL. (.)
3000L_ ________ i_~----~--~~--~---L~~~~~---L~--~~--~--~
BOSQUE BOULEVARD AND 18TH STREET VOLUME PROFILE
FIGURE 17

0 0 0
.. . . .. . . . .... . . . .. , ............... . . . . . .. ··. ··.
:.·:.-~ ~..=:--..:::-;:;.
II I/ /,'
__,.L' A'ltl:>
Nll>IN'It~.;j
(N~n.L) ,...:.=- ••• --~ .·
---~ ·~-~-~-~~~~~~~~~~ ---~----...... -~......._,.1 ••. I
0 0 0 (j)
··....... : \ : I . ' : I
.. . . . . . . : \.,
0 0 0 0 0 0 LO 1'-

t-::::! z~ w ~ w t-Oo ~ NO.L.Lna 0 I 0 0
-lW o<l:~w Z~a::::::! ~a::W<I: Oot-t-a:: zW <.!>Z-0
A~l::>
U)
p::j H
Nll>IN~~~ <11 f:l..t - ~ - ~ I
>LI z 0
z 0
U)
>LI 0'1
~ M
H
~ 0 :>
0 Cl H >LI ~ z H ~
(Nt~n.L) ::<:: 0 u ~ 0
>LI <S-o ~ H
,t?J ~ H 1-'o >..r. ~ x ,>c9 ~ 0
"'o ~> -f.> <_,o p::j f:l..t x ~ > e.., "".> v
/,y..s' <$-..)" 0 ~ vi>.
'It
0 0 0 0 0 0 0 0 0 0 q 0 0 6 lO 6 llf C\J
(Crdi\) atunTOi\
network configurations for the three levels of details were signifi
cantly different. Therefore, the assigned volumes and traffic
counts on these 182 links were used as another basis for determin-
ing the effect of degree of network detail on the results of traffic
assignment.
The root-mean-square difference1 for the final assigned vol-
umes on the 182 links for three possible network comparisons are
as follows:
Intermediate vs. Detailed: RMS difference = 970 vpd
Normal-Detail vs. Detailed: RMS difference = 3010 vpd
Normal-Detail vs. Intermediate: RMS difference = 2830 vpd
From these values it was concluded that, as a whole, a relatively
small difference exists between the intermediate and detailed net-
works, but a fairly large difference exists between the normal-detail
network and the intermediate and detailed networks. This is commen-
surate with findings from the volume profiles.
The RMS difference was also applied to assist in the determina-
tion as to which network showed the best agreement with traffic counts.
~he outcome of this comparison is snown below:
Normal-Detail vs. Traffic Counts: RMS difference= 2520 vpd
Intermediate vs. Traffic Counts: RMS difference = 2360 vpd
Detailed vs. Traffic Counts: RMS difference = 2550 vpd
These values would indicate that little difference exists among
1 For example, in comparing the intermediate and detailed networks
RMS difference= ~(link volume, intermediate- link volumef detailed) 2
182
43

the three networks with respect to agreement between assigned l1nk
volumes and ground counts.
Another way of looking at the RMS difference would be to
assume that each assigned volume for all 182 links deviated from the
corresponding traffic count by a constant percentage. Then, the RJ'vlS
difference of 2360 vpd for the intermediate network would mean that
each assigned link_volume differed by 24.5 percent from ihe corres
ponding traffic count. For the detailed network with a RMS differ
ence of 2550, each link would differ by 26.5 percent.
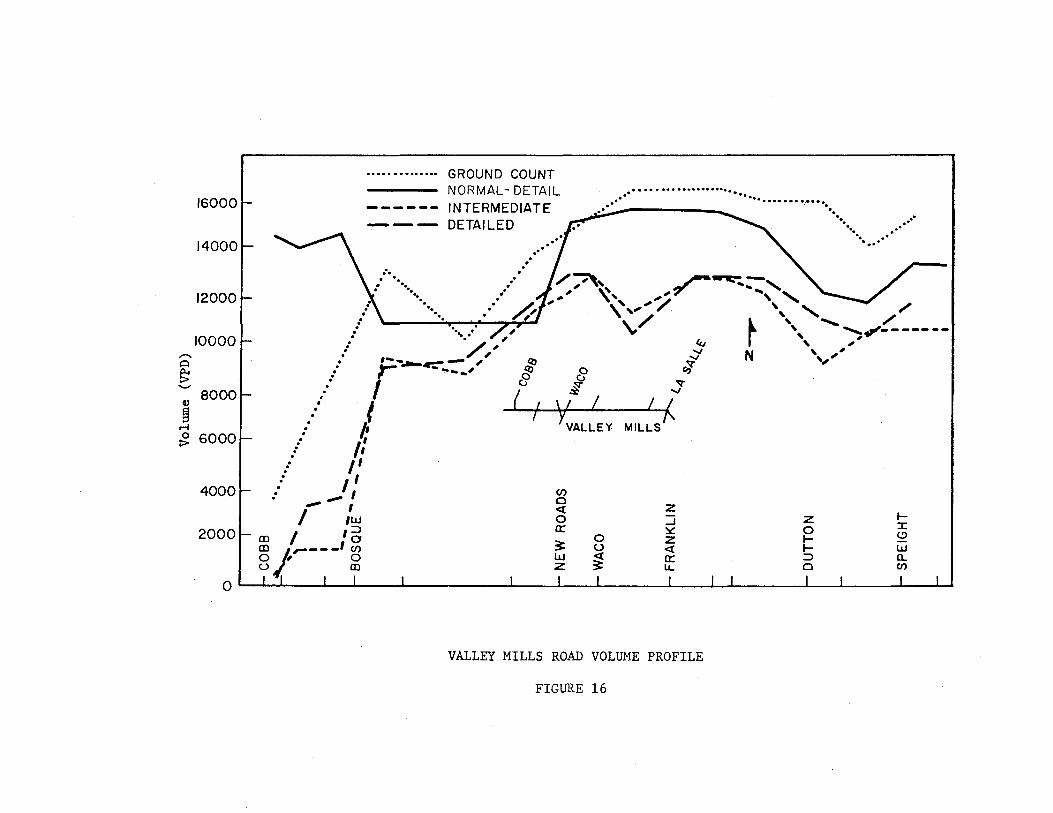
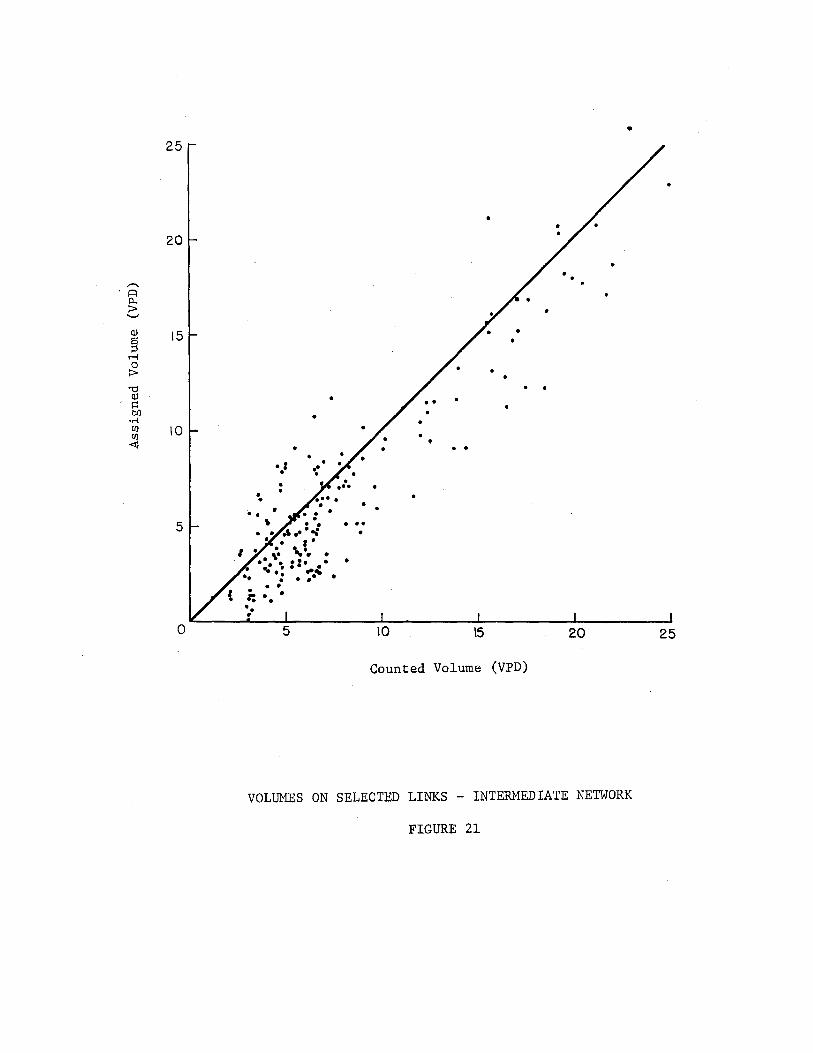
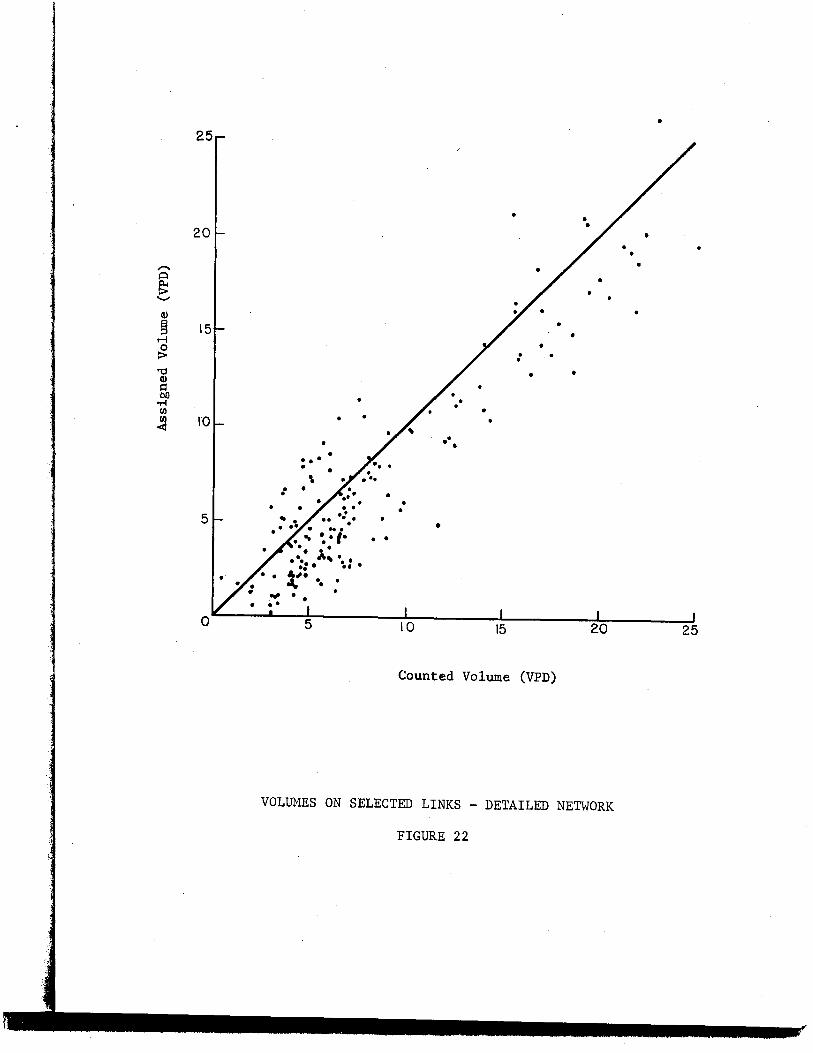
The assigned link volumes were plotted against the traffic
counts for each of the 182 links used in the comparison. The plots
for the normal detail, intermediate, and detailed networks are shown
in Figures 20,21, and 22, respectively. The normal-detail network
has more overassigned links in the high volume range than either
of the other two coded networks. In the middle volume range, the
link volumes for the normal-detail network appear to be reasonably
close to traffic counts, whereas the other networks are slightly
underassigned.
underassigned.
For low volumes, all three networks are generally
In comparing Figures 21 and 22, no significant dif-
ference can be noted between the intermediate and detailed networks.
NETWORK PARAMETERS
Summary information for the three networks with different de
grees of detail are shown in Table 3.
44
• 25
20 • •
• •
"""' • A
~ 15 -
0.1 • 3 •
..-i 0 • :> •
'"0 • 0.1 l=l • 00 10 "1"'1 • • • {/) • {/) • < •
. • •• . ·"·. . .. 5 ,. il •
I .:-• ... •• . : .. : :: •••• . . • .. • :· . .
• .. 0 5 10 15 20 25
Counted Volume (VPD)
VOLUME ON SELECTED LINKS - NORMAL-DETAIL NETWORK
FIGURE 20
25
20
15
10
5
• •
·.: . •
•
. . . . • •
• • • •• . . -'···-: . • • I •
I • \ .. 'I.,.•. • ..... :· . . ... : . ...:. . • • • • •
i: • ••
•
•
•
• •
•
•
. .
:· 0~--~~~5~-------,~0~-------IL5--------~2L0------~25
Counted Volume (VPD)
VOLUMES ON SELECTED LINKS - INTERMEDIATE NETWORK
FIGURE 21
• 25
20
,..... ~
t;! ........
~
~ 15 ..... 0 :> 'tl ~ s:: 00
-M (I)
:a ro
Counted Volume (VPD)
VOLUMES ON SELECTED LINKS - DETAILED NETWORK
FIGURE 22
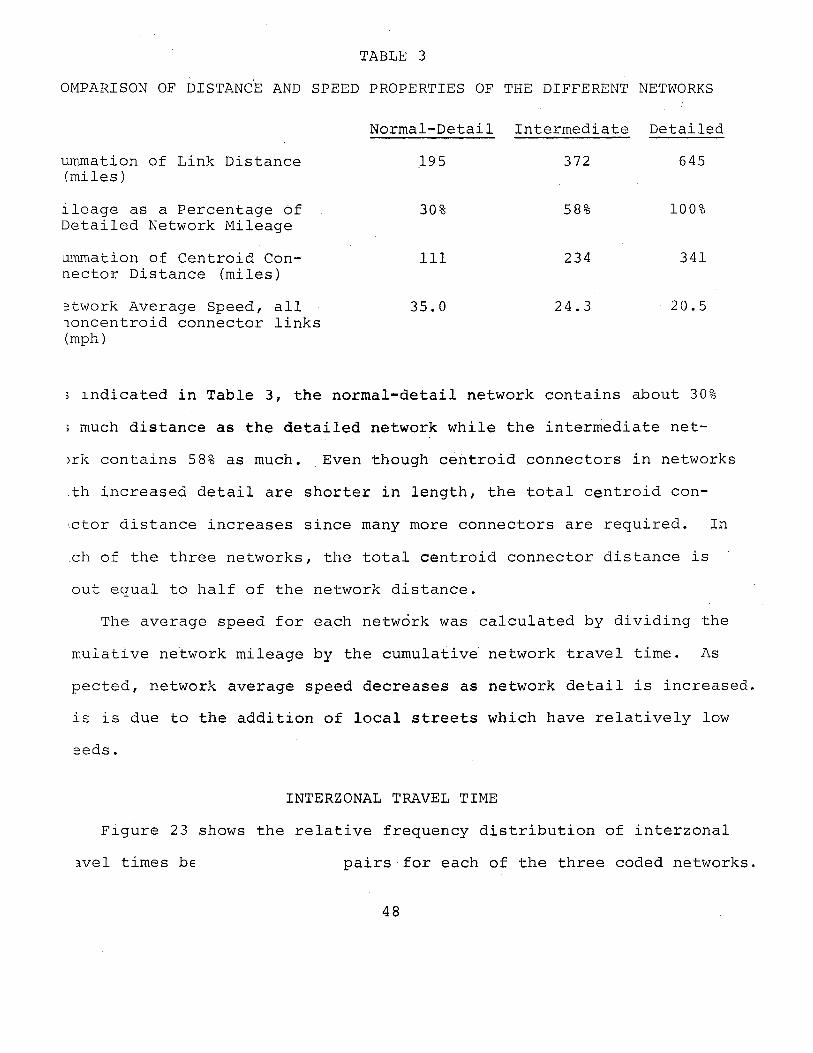
TABLE 3
OMPARISON OF DISTANCE AND SPEED PROPERTIES OF THE DIFFERENT NETWORKS
Normal-Detail Intermediate Detailed
ummation of Link Distance (miles)
ileage as a Percentage of Detailed Network Mileage
ummation of Centroid Connector Distance (miles)
3twork Average Speed, all 1oncentroid connector links (mph)
195
30%
111
35.0
372 645
58% 100%
234 341
24.3 20.5
lndicated in Table 3, the normal-detail network contains about 30%
much distance as the detailed network while the intermediate net-
>rk contains 58% as much. Even though centroid connectors in networks
.th increased detail are shorter in length, the total centroid con-
!Ctor distance increases since many more connectors are required. In
.ch of the three networks, the total centroid connector distance is
out equal to half of the network distance.
The average speed for each network was calculated by dividing the
mulative network mileage by the cumulative network travel time. As
pected, network average speed decreases as network detail is increased.
is is due to the addition of local streets which have relatively low
eeds.
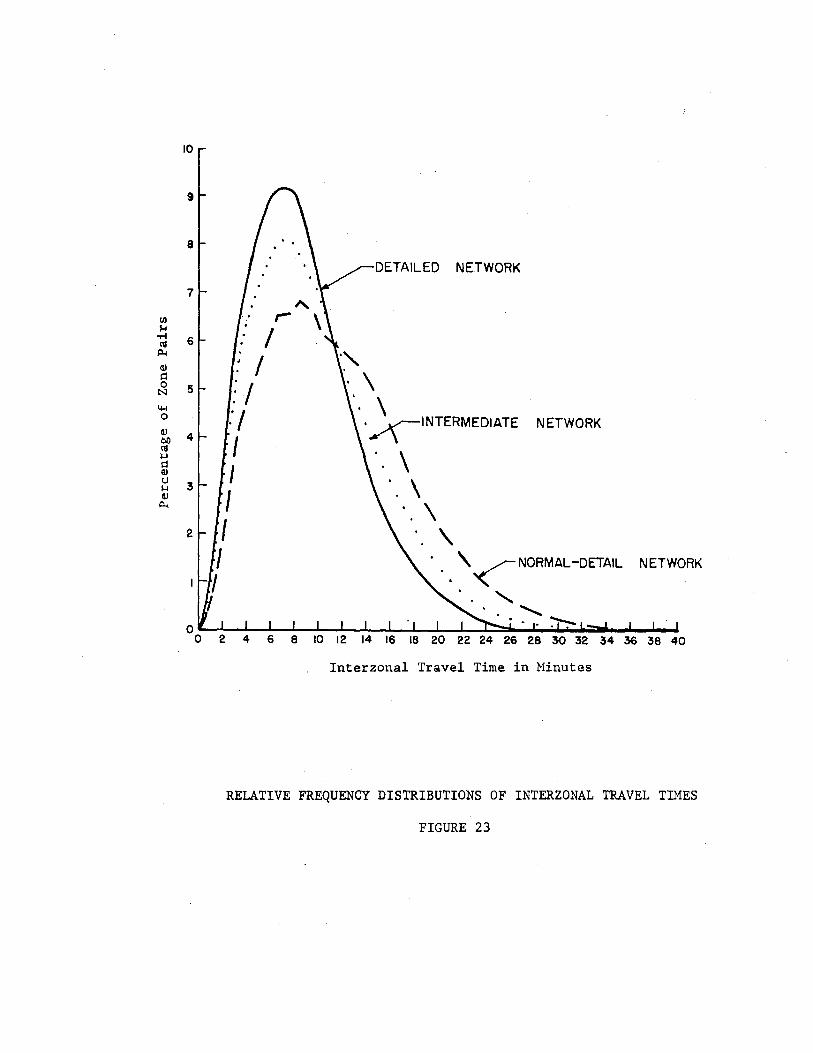
INTERZONAL TRAVEL TIME
Figure 23 shows the relative frequency distribution of interzonal
1vel times be pairs for each of the three coded networks.
48
10
9
8
DETAILED NETWORK
7
11.1 1-4
...-! 6 "' 1=4
<!l J:: 0 5 N
4-l 0
<!l 4 bO
., ·. \ ·. \
• ~INTERMEDIATE NETWORK
~ ~ Q Q) \ ()
3 J.-1 til ·. \
1=4 ·. \ 2 ·.'
. '~NORMAL-DETAIL NETWORK
' '~ 18 20 22 24 26 28 30 32 34 36 38 40
Interzonal Travel Time in Minutes
RELATIVE FREQUENCY DISTRIBUTIONS OF INTERZONAL TRAVEL TIMES
FIGURE 23
The curve for the detailed network is the smoothest; this is to be ex
pected since there are 3,551,340 pairs of zone combinations. There are
only 448,230 pairs of zone combinations in the intermediate network,
and 48,620 in the normal-detail network.
There are several possible causes for the three distributions to
be dissimilar. With the small zones of the detailed network there is
a larger number of zone pairs separated by short travel times than in
the other networks. Therefore, the percentage of zones separated by
short travel times would be expected to decrease with a decrease in
network detail. The magnitude of the effect can be estlmated by consid
erlng the zone relationships in two different networks. For the nor
mal-detail and detailed networks with 206 and 1870 internal zones
respectively, it could be said that, on the average, each zone in the
normal-detail network corresponds to a cluster of about nine (1870~206=
9) zones in the detailed network. Since each of the nine zones is con-
nected to all of the remaining eight; a cluster of nine zones represents
72 (9 x 8 = 72) interzonal paths. For the entire 206 internal zones in
the normal-detail network, there are about 15,000 (206 x 72 = 15,000)
interzonal connections in the detailed network which are eliminated by
zone aggregation with the reduced detail of the normal-detail network.
These 15,000 interzonal paths, which do not exist in the normal-detail
network, represent short spatial separations in the detailed network
and their effect would be concentrated near the origin of the curve
(probably in the interval of from one to three minute separations).
Since local streets are not explicitly represented in the lesser
detail networks, some zone pairs that would be most directly connected
50
via the local street system would have to be routed via a corridor which
would lengthen their time separation. This would have the effect of
increasing the percentage of zone pairs separated by longer travel times
in the intermediate and normal-detail networks.
However, it might be expected that the interzonal travel time fre
quency distributions should be essentially the same for the three dif
ferent networks. As network detail is increased a more direct and there
fore shorter routing between many of the zone pairs is likely to be
prov1ded, but the added links represent local streets which provide a
lower level-of-service. As indicated by the summary of network average
speeds (Table 3), the level-of-service speeds on these facilities were
considerably lower than those on the arterial and major collector streets.
Since the three frequency distributions do not coincide, it must
be concluded that the shorter routings made available through addit1onal
local street representations far outweigh the effect of the slower
speeds on the additional facilities. However, it is possible that the
level-of- service speeds on the local streets were not low enough.
In an attempt to establish ~ measure relating the interzonal tra
vel time frequency distribution curves, the area common to each pair
of curves was determined. Since the curves were plotted as a percen
tage of the total number of zone pair combinations in each network,
the area under each individual curve is 100 percent
The area common to each combination of networks is shown below:
Normal-Detail and Intermediate = 86.2%
Detailed and Intermediate = 82.8%
Normal-Detail and Detailed = 75.5%
51

As expected, the normal-detail and detailed networks showed the
greatest difference; however, the detailed and intermediate net
works did not show the close agreement that would be anticipated
from the previous findings.
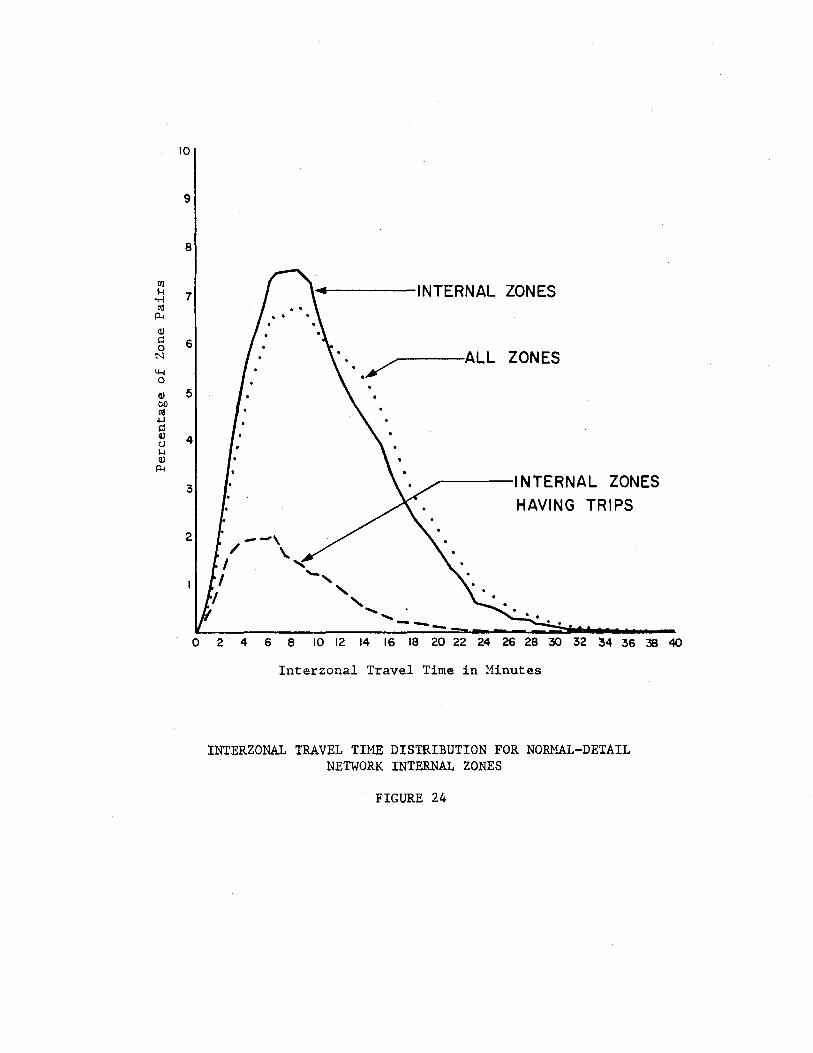
The interzonal travel time distribution was also plotted
using the internal zones only in the normal-detail network. This
was done in order to gain insight into how the distribution behaved
with the exclusion of interchanges between internal zones and exter
nal stations, and between external stations, The external stations
have, on the average, the greatest separation from all other zones.
Therefore, the percentage of long separations would be expected to
decrease with the exclusion of interchanges to and between external
stations as is shown in Figure 24. There were 15 external stations
in all three networks. Hence, it would be expected that the effect
of the external stations would be less pronounced in the interzonal
travel time distributions of the more detailed networks since they
have a significantly larger proportion of internal zones.
Having noted that somewhat diff~rent interzonal travel time
frequency distributions resulted with each of the three networks, an
obvious question is: "Is the trip length frequency distribution de
pendent upon network detail?" Unfortunately, the development of the
computer programs for obtaining the trip length frequency distri
butions had not been completed at the time of this research so the
question could not be answered directly. However, the trip table
for each network was examined to discover the proportion of zone
pairs without trip interchanges.
52
Cll 1-l
-M ell
p..
QJ Q 0
N
4-4 0
!) bO ~ +J Q ~ (.)
1-l QJ
p..
10
9
8
7 INTERNAL ZONES
6 . • •• ~ALL ZONES
5
4
3 INTERNAL ZONES
HAVING TRIPS
0 2 4 6 8 10 12 14 16 18 20 22 24 26 28 30 32 34 36 38 40
Interzonal Travel Time in Minutes
INTERZONAL TRAVEL TIME DISTRIBUTION FOR NORMAL-DETAIL NETWORK INTERNAL ZONES
FIGURE 24

As the number of centroids in a network is increased, the size of
the trip matrix increases as the square of the number of centroids.
The detailed network contained approximately 8.5 times as many cen
troids as the normal-detail network .and had a trip table which was
about 73 times larger. However, the normal-detail network would not
be expected to have trip interchanges between all zone combinations
1n the course of a 24-hour period; an even larger proportion of the
detailed network trip matrix would be expected to contain no trips.
This becomes obvious when it is recalled that there were 286,200 total
trips in the study area as determined by the origin-destination survey.
These 286,200 trips must be distributed between 3,553,000 zone pair
combinations resulting with the 1885 zones in the detailed network.
Due to the discrete nature of trips and the fact that some interchanges
will consist of several trips, many zone pairs obviously cannot have
a trip interchange. As seen in Table 4, about 99% of the total zone
pairs in the detailed network were observed to have no trips. The
actual number of zone pairs with observed trip interchanges is little
more than doubled when comparing the normal-detail network with the
qetailed network.
If exactly one trip interchange existed between every possible
zone pair in each network, the resulting trip length frequency dis
tributions would be identical to the interzonal travel time relative
frequency distributions shown in Figure 23. However, only about one
percent of the zone pairs (36,385 zone pairs as shown in Table 4) of
the detailed network had trip interchanges to contribute to the trip
length frequency distribution.
54
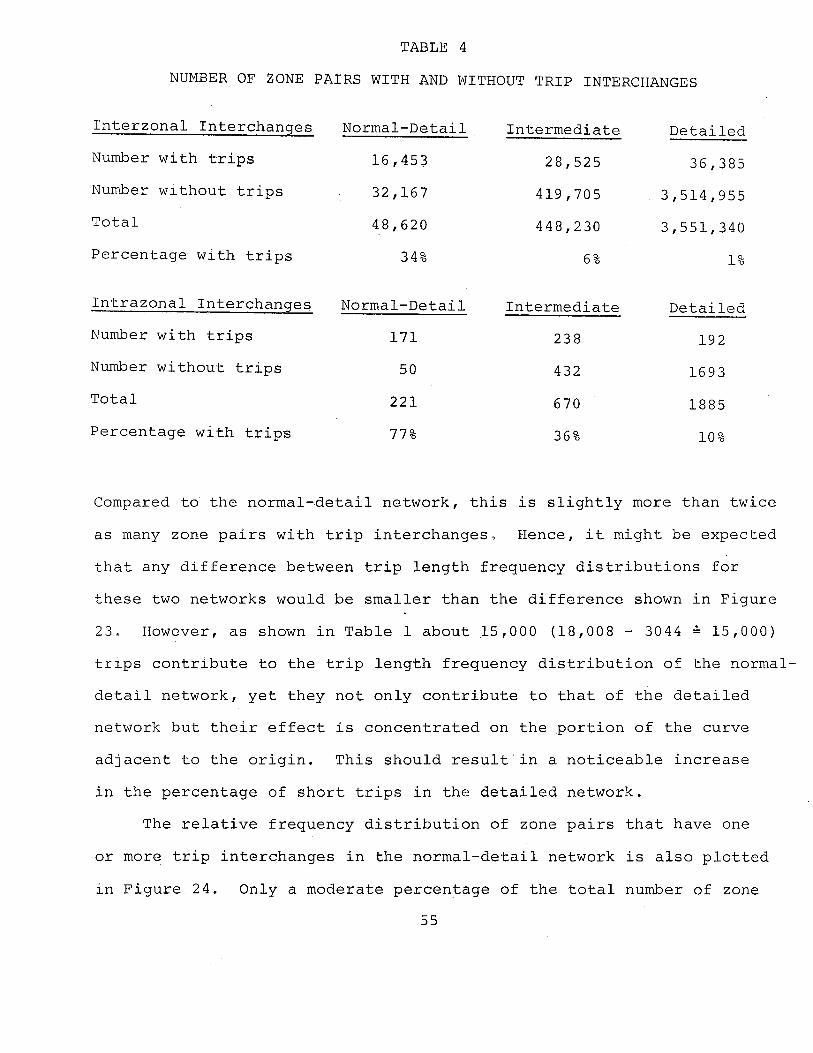
TABLE 4
NUMBER OF ZONE PAIRS WITH AND WITHOUT TRIP INTERCHANGES
Interzonal Interchanges Normal-Detail Intermediate Detailed
Number with trips 16,453 28,525 36,385
Number without trips 32,167 419,705 3,514,955
Total 48,620 448,230 3,551,340
Percentage with trips 34% 6% 1%
Intrazonal Interchanges Normal-Detail Intermediate Detailed
Number with trips 171 238 192
Number without trips 50 432 1693
Total 221 670 1885
Percentage with trips 77% 36% 10%
Compared to the normal-detail network, this is slightly more than twice
as many zone pairs with trip interchanges" Hence, it might be expected
that any difference between trip length frequency distributions for
these two networks would be smaller than the difference shown in Figure
23. However, as shown in Table 1 about 15,000 (18,008 - 3044 ,;, 15,000)
trlps contribute to the trip length frequency distribution of the normal
detail network, yet they not only contribute to that of the detailed
network but their effect is concentrated on the portion of the curve
adjacent to the origin. This should result.in a noticeable increase
in the percentage of short trips in the detailed network.
The relative frequency distribution of zone pairs that have one
or more trip interchanges in the normal-detail network is also plotted
in Figure 24. Only a moderate percentage of the total number of zone
55
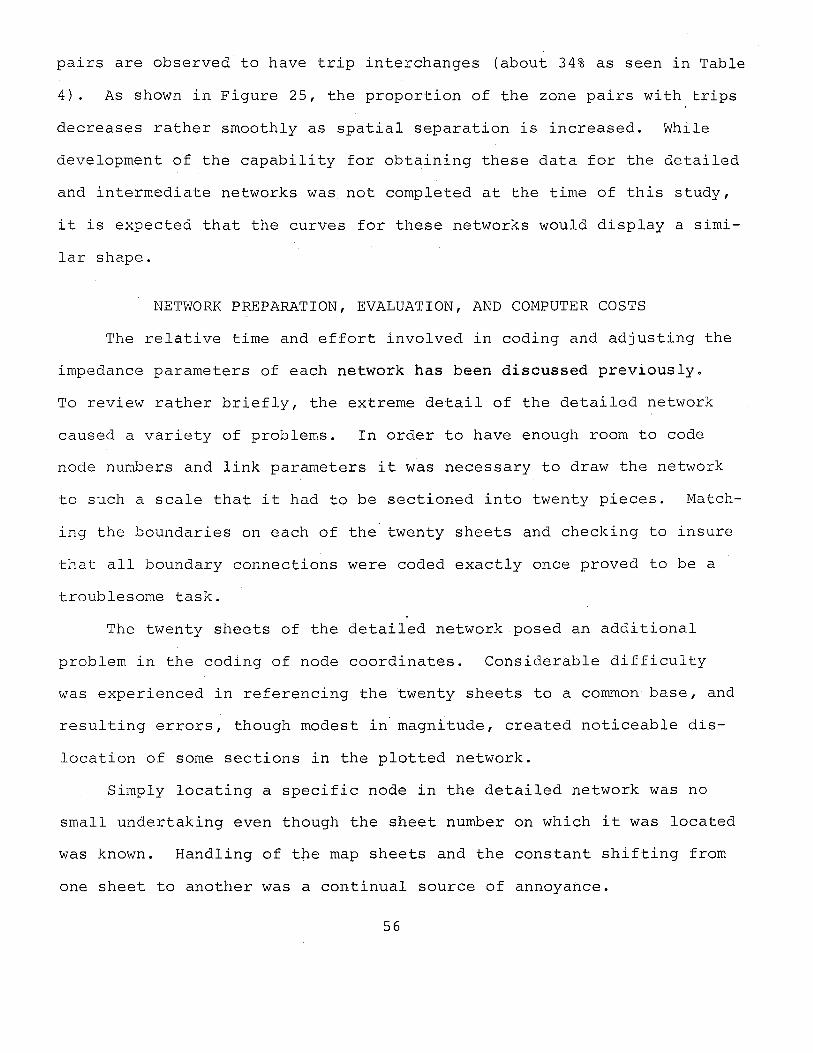
pairs are observed to have trip interchanges (about 34% as seen in Table
4). As shown in Figure 25, the proportion of the zone pairs with trips
decreases rather smoothly as spatial separation is increased. While
development of the capability for obtaining these data for the detailed
and intermediate networks was not completed at the time of this study,
it is expected that the curves for these networks would display a simi
lar shape.
NETWORK PREPARATION, EVALUATION, AND COMPUTER COSTS
The relative time and effort involved in coding and adjusting the
impedance parameters of each network has been discussed previously.
To review rather briefly, the extreme detail of the detailed network
caused a variety of problems. In order to have enough room to code
node numbers and link parameters it was necessary to draw the network
to such a scale that it had to be sectioned into twenty pieces. Match
ing the boundaries on each of the twenty sheets and checking to insure
that all boundary connections were coded exactly once proved to be a
troublesome task.
The twenty sheets of the detailed network posed an additional
problem in the coding of node coordinates. Considerable difficulty
was experienced in referencing the twenty sheets to a common base, and
resulting errors, though modest in magnitude, created noticeable dis
location of some sections in the plotted network.
Simply locating a specific node in the detailed network was no
small undertaking even though the sheet number on which it was located
was known. Handling of tpe map sheets and the constant shifting from
one sheet to another was a continual source of annoyance.
56

50 p.
•r-i ,... H
..c 45 .jJ
•r-i :>:
.jJ 40 !=: QJ (:' QJ ,... cJ 35 !=:
H
QJ
r:: oo •r-l QJ 30 HbO
!=: .CCI! cJ,.C Cll cJ
1'4 ~ 25 !:1-I.J
•r-i Q H
Cll ,... 20 •r-i Cll
P-< QJ Q 15 0
N
4-1 0
QJ 10
bO Cll
-1-J Q QJ 5 cJ ,... IV
P-<
Interzonal Travel Time in Minutes
PERCENTAGE OF ZONE PAIRS WITH TRIPS IN EACH TIME INCREMENT (INTERNAL ZONES OF NORMAL-DETAIL NETWORK)
FIGURE 25

It was very difficult to remember speed changes and assigned vol-
umes; likewise it was hard to obtain an overall estimate of the agree-
ment between assigned volumes and traffic counts. The overall change
in assigned link volumes for successive assignments was nearly impossi-
ble to interpret. Further, in adjusting the network impedance para-
meters (level-of-service speed), it was nearly impossible to antici-
pate the effects of speed changes.
The problems associated with the intermediate network were identi-
cal and nearly of the same magitude as the detailed network. The nor-
mal-detail network, on the other hand, was coded on a single map and was
quite easy to work with. The approximate effects of speed changes were
relatively easy to ascertain. Also, a reasonably good evaluation of
the overall agreement between assigned volumes and traffic counts could
be determined by inspection of the values posted on a map.
As network detail was increased, computer time on the IBM 7094
increased very substantially. Average processing times for the three
baslc programs that were reiterated for each assignment with adjusted
impedance parameters are shown in Table 5.
TABLE 5
IBM 7094 Computer Processing Times
Network Normal-Detail Intermediate Detailed
Build Network Description 0.5 min. 1.8 min. 2.6 min.
Build Trees 0.7 32 246
Load Network 1.8 15 26
Total 2.0 49+ 275+
58

These data show that as network detail was increased, the basic
assignment time increased from two minutes to over 4 l/2 hours. Such
an increase, even though alarming, is to be expected. Assignment for
the detailed network involves processing 73 times as many minimum paths
as the normal-detail network and each minimum path involves considera
bly more links. There is an extensively larger number of alternative
paths from which each minimum path must be selected in the detailed
network. It is concluded that the degree of network detail presently
used in traffic assignment is appropriate. No improvement is obtained
in the assignment results with increased network detail using an all
or-nothing assignment. However, computer processing time, personnel
time, and analysis problems increase substantially~
59

Bibliography
1. "Waco Urban Transportation Plan; Origin-Destination Survey,"· Volume 1, Texas Highway Department, 1964.
2. Stover, V. G. and Blumentritt, C. W., "User's Manual for Texas Large Systems Traffic Assignment Package," Research Report 60-6, Texas Transportation Institute, November 1966.
60