effect of nitric oxide on biofilm formation by escherichia coli of nitric oxide on biofilm formation...
TRANSCRIPT

Effect of nitric oxide on biofilm formationby Escherichia coli
Saiful Islam
Degree project in biology, Master of science (1 year), 2008Examensarbete i biologi 15 hp till magisterexamen, 2008Biology Education Centre and Division of Clinical Microbiology, Department of Microbiology, Tumorand Cell Biology (MTC), Karolinska InstitutetSupervisors: Petra Luthje and Annelie Brauner MD, Ph.D, Professor

SUMMARY Bacterial biofilms are very complex and organized structures that are highly resistant to antibiotics and host defences. Biofilm is medically significant because of its formation on medical implants like catheters. Uropathogenic E. coli (UPEC), the most frequent cause of urinary tract infections, are associated with catheter-related biofilms. In this study, I investigated the effect of nitric oxide (NO), the molecule that is widely used as a signaling molecule in biological system, on biofilm formation. Two nitric oxide donors , Sodium Nitroprusside Dihydrate (SNP) and DETA NONOate (chemical name 1-[N-(2-Aminoethyl)-N-(2-ammonioethyl)amino]diazen-1-ium-1,2-diolate) were tested for effects on biofilm formation. I found that pathogenic E. coli could form biofilms when only curli or both curli and cellulose are present on their outer surface. Curli fibers are adhesive surface fibers expressed by E. coli that bind several host extracellular matrix and were assumed to have a role in pathogenesis. I found that NO had an inhibitory effect on biofilm formation by the strains that expressed both curli and cellulose on their outer surface. NO inhibited biofilm formation by E. coli K-12 bacterial strains carry a flu gene (encoded Antigen43 protein that is mainly involve to form biofilm in these strains) on a plasmid, whereas biofilms formation by control strains (∆flu) was not effected by NO. Strains that expressed P fimbriae had a general ability to form biofilm but biofilm formation was not significantly affected by NO. Biofilm formation was inhibited in all cases by nanomolar and micromolar concentrations of DETA and by nanomolar concentrations of SNP. At millimolar concentration of DETA and micromolar concentration of SNP, biofilm formation by these strains was also inhibited; however, I found that bacterial growth also was effected at this concentration range. Moreover, at nanomolar and micromolar concentration of DETA and at nanomolar concentration of SNP, growth of these strains was not significantly effected. Further studies to be needed to pinpoint the concentration of DETA & SNP that acts against biofilm formation and to possible interaction of NO with other components of immune response before using NO as treatment against biofilm related infectious diseases. Source of picture in cover page: http://en.wikipedia.org/wiki/Escherichia_coli
2
INTRODUCTION Urinary tract infection Urinary tract infections (UTI) are a serious health problem affecting millions of people throughout the world. UTI cause significant medical expenditure amounting to more than a billion dollars each year only in United States. Women are more vulnerable to UTI; 40 to 50% of all women have experienced a urinary tract infection at least once and many women experience recurrent infection. UTI now appear as more common disease for both women and men, especially in the perspective of urinary catheterization (Cegelski et al. 2008). Uropathogenic E.coli (UPEC) are the most common causative agent of UTI. Pathogenic bacteria need to be able to remain at the infection site. Bacteria require specific proteins, called adhesins, to establish a successful interaction between bacteria and host that enable bacterial colonization. Usually all clinical UPEC isolates express type 1 fimbriae, a fibrillar structure that promotes bacterial adhesion to host receptors (Garofalo et al. 2007). As a consequence, UPEC binding to the target uroepithelial cells by type 1 fimbriae causes a bladder infection. This infection initiates a cascade to form a community of bacteria attached to the bladder wall. These organized bacteria cannot be flushed away by the flow of urine. Bacteria can remain attached for many days or weeks to the uroepithelial cells after the acute infection has been eliminated by standard antibiotic treatments. This might result in recurrent infection (Cegelski et al. 2008). An important reason for treatment failure in UTI is the formation of catheter-related biofilm. If the patient keeps a urinary catheter for 30 days or longer, catheter-associated infections will commonly develop (Foxman 2002). UPEC bind to the catheter, replicate very rapidly and form a community, called biofilm, which helps to protect bacteria from the host defences in this community. These organized communities are highly resistant to antibiotics (Mah et al. 2001, Costerton et al. 1999). Biofilms Biofilms can be defined as communities of microorganisms attached to a surface. Differentiation of planktonic cells into a mature complex biofilm causes many phenotypic changes within the bacterial cells that give rise to increased resistance against antibacterial agents (Cegelski et al. 2008). Planktonic bacterial cells first reversibly attach to the solid surface in response to specific environmental cues, such as nutrient availability (O'Toole et al. 2000). The transition from reversible to irreversible attachment occurs through the production of extracellular polymers by the bacteria and/or by specific adhesins located on pili and fimbriae (Van Houdt et al.2005).
3

Figure 1: A model for biofilm formation in Pseudomonas aeruginosa. This picture is taken from the website (http://www.dartmouth.edu/~gotoole/papage.html) of O’Toole lab, Department of Microbiology and Immunology, Dartmouth Medical School, Hanover with permission from the copy-right owner. Biofilm formation depends on the nature of the bacteria species as well as environmental conditions. Biofilm formation is thought to begin when bacteria sense environmental conditions that trigger the transition to life on a surface. Curli and cellulose are two major components in the outer surface of E. coli (Chirwa et al. 2003). The contribution of cellulose in virulence is yet to be confirmed but curli fimbriae (a proteinaceous cell surface structure) have a role in virulence-related features (Sjöbring et al.1994, Herwald et al. 1998). However, a common picture of the role of curli fimbriae in pathogenicity is still elusive, since E. coli does not consistently express curli fimbriae. Cellulose production confers bacterial cell–cell interactions, adhesion to abiotic surfaces (biofilm formation) (Zogaj et al. 2003). E. coli widely expressed cellulose in their outer surface as exopolysaccharide (Zogaj et al. 2003). Type 1 and P fimbriae are two important adhesins found in most pathogenic E. coli and are involved in adhesion of UPEC to cells of the urinary tract and to catheters as well. They have different tip-associated adhesins (Connell et al. 1996, Söderhäll et al. 1997). P fimbriae are most strongly associated with UTI in clinical studies. P fimbriae E. coli contain the PapG adhesin that preferentially binds to globoside, a glycosphingolipid containing acetylated amino sugars and simple hexoses (GalNAcβ3Galα[1-4] GalβGlcβcer) that is abundant in the upper urinary tract of humans (Söderhäll et al. 1997). Type 1 fimbriae carry adhesins that mediate mannose-specific binding to receptors present on the human bladder epithelium by fimH. The role of the E. coli mannose-specific adhesin in virulence has been debated, but it may play a role in urinary tract infection (Connell et al. 1996). The bacterial phase-variable surface-located adhesin antigen 43 (Ag43) is also associated with urovirulence. Ag43 (encoded by the flu gene) is a self-recognizing adhesin that confers characteristic surface properties on host cells, such as auto aggregation and frizzy colony morphology (Hasman et al. 2000). A large amount of Ag43 is expressed during bladder infection by uropathogenic E. coli and participates in biofilm formation by Ag43-Ag43 interaction (Anderson et al. 2003). Ag43 is expressed on the surface of UPEC cells located within intercellular biofilm-like bacterial pods in the bladder epithelium, indicating that it may contribute to survival and persistence during prolonged infection (Anderson et al. 2003) Biofilm formation is medically significant for its widespread involvement in oral microbes on teeth and chronic Pseudomonas aeruginosa infections in the lungs of cystic fibrosis patients (Mah et al. 2001, Whiteley et al. 2001). Biofilms also form on medical implants other than catheters such as pacemakers and hip replacements etc (Cegelski et al. 2008). Therefore, biofilm-based treatment cost is increasing rapidly and it is now beyond billion dollars. It is
4

now a very costly and stressful procedure to replace the infected implant or fight the infection with antibiotics, the only treatment currently available against biofilms. Therefore, to reduce the cost of treatment is one of the major goals of scientist, at least those dealing with infectious medicine. Minimum inhibitory concentration In microbiology, minimum inhibitory concentration (MIC) is the lowest concentration of an antimicrobial agent that required to inhibit visible growth of microorganism in a media after a standard time of incubation. MIC are important in laboratories to confirm resistance of microorganisms to an antimicrobial agent. MIC usually tests the sensitivity of antimicrobial agents in their planktonic phase. MIC values can be determined by a number of standard test procedures. Serial dilutions are made of the antimicrobial agent in bacterial growth media, the most commonly used method. The test organisms are then added to the dilutions of the products, incubated, and scored for growth. Nitric Oxide The first defence against bacterial infection is the innate immune system. NO contributes to this early response by its bactericidal activity (Carlsson et al. 2005). NO is produced in large amounts by macrophages and neutrophils but also by epithelial cells. The generation of NO is due to the activity of an inducible NO synthases (iNOS) expressed by these cells. Many cell types can express iNOS for their function in host defense against microbial and viral pathogens (Bogdan 2001), leading to the formation of NO radicals or ONOO- in the host cell. The nitric oxide (NO) acts as an antibacterial agent (De Groote and Fang, 1995). It has been shown that NO interacts with the superoxide anion and produces the highly reactive peroxynitrite anion [further converted into reactive nitrogen intermediates (RNIs)], which are very potent antimicrobial agents (Frang 1997, Bogdan et al. 2000). RNI are potentially highly reactive molecules that can be produced continuously in the organisms as by-products of respiratory metabolism (Hassett et al. 2002) RNI can damage DNA, lipids, and proteins of the cells when the production of reactive oxygen intermediate (ROI) and/or RNI overwhelms the capacity of the cell to remove such molecules (Barraud et al. 2006). From the several studies it has been shown that low levels of NO induce a transition from biofilm growth to the planktonic growth (Barraud et al. 2006). NO is an effective inhibitor of respiration of bacteria and will bind to the metalloenzymes found in electron transport chains at low mM concentrations (Wink et al. 1998) NO is a highly diffusible molecule that acts as a broad signal molecule in biological system (Beckman et al. 1997). In addition, NO is the main precursor of peroxynitrite (ONOO–) that can interact with proteins, lipids, carbohydrates and DNA. ONOO– can form nitrosoperoxocarbonate by reacting with carbon dioxide, which through oxidation and nitration mechanisms changes the structure and function of these compounds to lead to oxidative damage of tissues (Bloodsworth A. et al. 2000). Aim The aim of my experiments was to see the effect of NO on biofilm formation by different pathogenic E. coli strains. The growth of microorganisms was also observed in presence of similar NO concentration. I also studied the effect of NO on strains that expressed biofilm formation components (Ag43). I found some effect of NO on biofilm formation in pathogenic E. coli strains. Therefore, NO could be used to treat biofilm mediated diseases in future.
5

RESULTS The bacteria carrying curli and/or cellulose and the bacteria carrying P fimbriae and type 1 fimbriae are all derived from the naturally occurring wild type strains. The gene or genes of these strains encoded these structures are chromosomally encoded in their native content. On the other hand, the bacteria that carry a plasmid encoded flu gene express this under the control of arabinose. This makes possible constitutive expression of the flu gene by adding arabinose in the growth medium. Biofilm formation by different bacterial strains Before testing the effect of NO on biofilm formation of the bacterial strains, I checked the general ability of these bacterial strains to form biofilm. All strains of E. coli that were used in my experiments could not form biofims (Figure 2). The strain producing both curli and cellulose and the strain producing only curli formed more biofilm than strains lacking curli. Bacterial strains containing a plasmid carried flu gene as well as ∆flu strain could form biofilm. E. coli DS17 encoding wild type P fimbriae formed more biofilm than strains lacking functional fimbriae or encoding type 1 fimbriae. rl
cu
i+,cellu
lose+
curli
+,cellu
lose-
curli
-,cell
ulose+
curli
-,cell
ulose- flu
flu
Aflu
B flu∆
P fimbria
e
Mutan
t P fim
briae
type 1
fimbria
e
mutant ty
pe 1 fim
briae
0
1
2
3
4
Bacterial strain
OD
at 5
70 n
m
Growth of bacteria in presence of NO Before testing the growth of different strains in the presence concentration (MIC) of NO for these strains needed to be dSNP to determined MIC value but I still found some growth oof this concentration of NO. Though I observed the growth ofcurli and/or cellulose [curli+,cellulose+(#12); curli+,cellulose- (curli-,cellulose- (WE16); ], four different strains of flu gene [fluB (MS1231); ∆flu (MS1199);] and four different strains fimbriae and type 1 fimbriae, here I present only the growgroup (Figure 2). The growth of other strains in the sammolecule in their surface structure) was almost similar (data
Figure 2: Biofilm formationby different bacterial strains.Bacterial cells were grown on amicrotiter plate surface at 37ºCovernight. Biofilm formationwas quantified by crystal violetstaining. The data representmean ± standard error of meanfrom three replicates. In thegraph curli+,cellulose+(#12);curli+,cellulose- (WE1); curli-
,cellulose+ (WE11); curli-,cellulose- (WE16); flu(MS1230); fluA (MS1232);fluB (MS1231); ∆flu (MS1199);P fimbriae (DS17); Mutant pfimbriae (DS17-8); type 1fimbriae (NU14); mutant type 1fimbriae ( NU14-1).
of NO, the minimum inhibitory etermined. I used 102.4 mM of f micoorganisms in the presence four different strains expressing WE1); curli-,cellulose+ (WE11); flu+ (MS1230); fluA (MS1232); of wild or mutated form of P th of one strain represent each e group (containing the same
not shown here). The growth of
6

different strains did not vary significantly in the presence of different lower concentrations, in the micromolar and nanomolar ranges, of DETA and SNP (Figure 3). Above 100 µM DETA or 15 µM SNP, the growth of all bacteria in this study declined. However, no MIC values could be determined. Growth of bacteria containing type 1 fimbriae was different in the presence of SNP. Exceptionally from others, the growth increased with increasing concentration of SNP and then reduced gradually at later concentration.
Control 25 nM 125 nM 250 nM 500 nM 5 µM 15 µM 30 µM0.00
0.25
0.50
0.75
1.00
1.25
1.50curli+,cellulose+fluAP fimbriaeType 1 fimbriae
Concentration of SNP
Rel
ativ
e va
lue
Control 1 nM 10 nM 100 nM 1µM 10 µM 100 µM 1 mM0.0
0.2
0.4
0.6
0.8
1.0
1.2
1.4curli+,cellulose+fluA P fimbriaetype 1 fimbriae
Concentration of DETA
Rel
ativ
e va
lue
a b Figure 3: Growth of different strains in the presence of SNP and DETA. Bacteria were grown in LB with inhibitors as shown below the panels for 24 hours on 8-well strips, starting with 106 colony-forming units (CFU) per ml. Relative numbers of cells were estimated using alarmarBlue, a redox dye that quantifies metabolic reactions, and normalized to the value obtained in cultures lacking inhibitors. (a) Growth in presence of DETA, (b)Growth in presence of SNP. The data represent mean ± standard error of mean from three replicates. In this graph curli+,cellulose+ (#12); fluA (MS1232); P fimbriae (DS17); type 1 fimbriae (NU14). Effect of NO on biofilm formation by strains in the presence of curli and cellulose To determine the effect of NO on biofilm formation by strains expressing curli and/or cellulose on their outer surface, different subinhibitory concentrations of NO donors was used. These concentrations did not effect the growth of the bacteria. On the other hand, I found an effect on biofilm formation (Figure 4a) between 10 nM and 1 µM, significantly arround 100 nM concentration of DETA. It is really hard to pinpoint the cause of the fluctuation of biofilm inhibition below and above 100 nM concentration but I always got the same result for 100 nM concentration of DETA, around 25% inhibition of biofilm formation at this point. In the case of SNP the concentration range to inhibit biofilm formation was between 125 nM and 500 nM and biofilm formation was significantly inhibited arround 250 nM. . It was found that this concentration of NO donor had effect on biofilm formation only when the bacterial strain expressed both curli and cellulose but had no effect when only curli was present (WE1 strain). The other two strains WE11 (curli-,cellulose+) and WE16 (curli-,cellulose-) could not form biofilm (Figure 2). Biofilm formation of both curli+,cellulose+ (#12) and curli+,cellulose- (WE1) strains in absence of DETA and SNP were measured and normalized it to 1 and used as reference value. Therefore, biofilm formation by both bacterial strain in presence of DETA and SNP were then compared with reference value. I presented all figures regarding biofilm formation and effect of NO donor on it in the same way. There were also significant effects on biofilm formation at 1 mM of DETA and 30 µM of SNP but this concentration also affected the growth of the bacteria (Figure 3).
7
Control 25 nM 125 nM 250 nM 500 nM 5 µM 15 µM 30 µM0.00
0.25
0.50
0.75
1.00
1.25
1.50curli+,cellulose+curli+,cellulose-
Concentration of SNP
Rel
ativ
e va
lue
Control 1 nM 10 nM 100 nM 1µM 10 µM 100 µM 1 mM0.00
0.25
0.50
0.75
1.00
1.25
1.50curli+,cellulose+curli+,cellulose-
Concentration of DETA
Rel
ativ
e va
lue
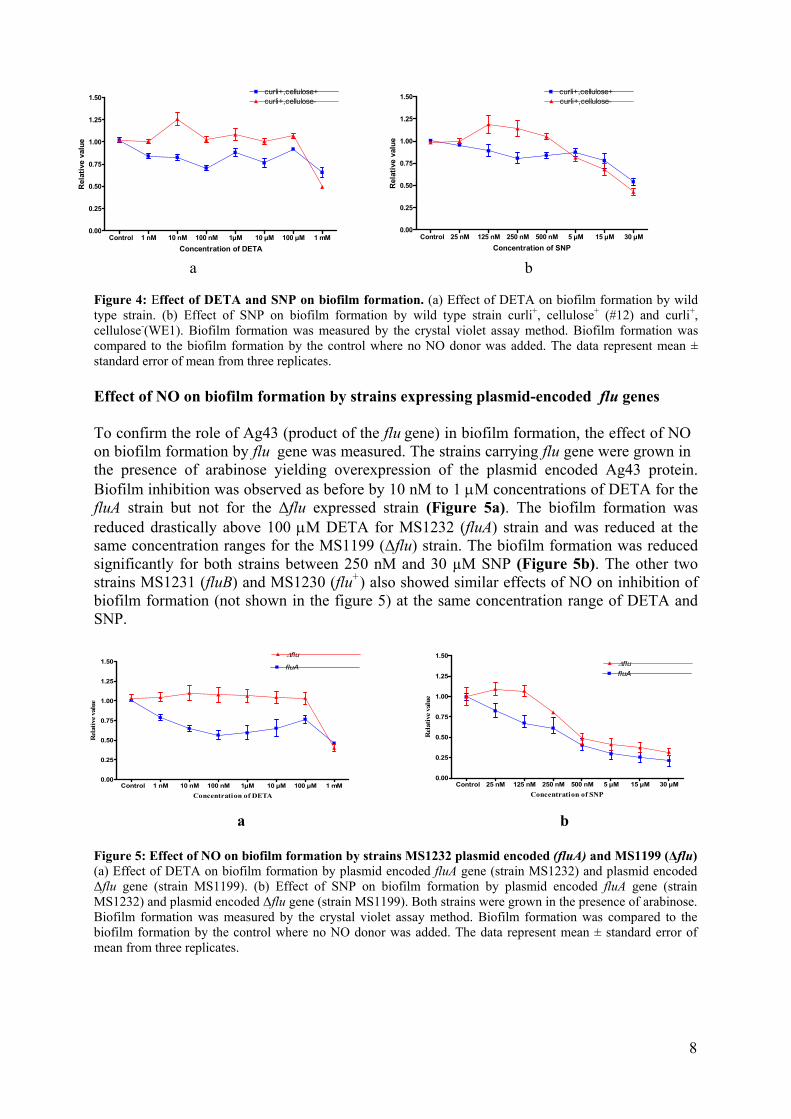
a b Figure 4: Effect of DETA and SNP on biofilm formation. (a) Effect of DETA on biofilm formation by wild type strain. (b) Effect of SNP on biofilm formation by wild type strain curli+, cellulose+ (#12) and curli+, cellulose-(WE1). Biofilm formation was measured by the crystal violet assay method. Biofilm formation was compared to the biofilm formation by the control where no NO donor was added. The data represent mean ± standard error of mean from three replicates. Effect of NO on biofilm formation by strains expressing plasmid-encoded flu genes To confirm the role of Ag43 (product of the flu gene) in biofilm formation, the effect of NO on biofilm formation by flu gene was measured. The strains carrying flu gene were grown in the presence of arabinose yielding overexpression of the plasmid encoded Ag43 protein. Biofilm inhibition was observed as before by 10 nM to 1 µM concentrations of DETA for the fluA strain but not for the ∆flu expressed strain (Figure 5a). The biofilm formation was reduced drastically above 100 µM DETA for MS1232 (fluA) strain and was reduced at the same concentration ranges for the MS1199 (∆flu) strain. The biofilm formation was reduced significantly for both strains between 250 nM and 30 µM SNP (Figure 5b). The other two strains MS1231 (fluB) and MS1230 (flu+) also showed similar effects of NO on inhibition of biofilm formation (not shown in the figure 5) at the same concentration range of DETA and SNP.
1µ
Control 1 nM 10 nM 100 nM M 10 µM 100 µM 1 mM
0.00
0.25
0.50
0.75
1.00
1.25
1.50fluA
∆flu
Concentration of DETA
Rel
ativ
e val
ue
Control 25 nM 125 nM 250 nM 500 nM 5 µM 15 µM 30 µM0.00
0.25
0.50
0.75
1.00
1.25
1.50
fluA∆flu
Concentration of SNP
Rel
ativ
e va
lue
a b Figure 5: Effect of NO on biofilm formation by strains MS1232 plasmid encoded (fluA) and MS1199 (∆flu) (a) Effect of DETA on biofilm formation by plasmid encoded fluA gene (strain MS1232) and plasmid encoded ∆flu gene (strain MS1199). (b) Effect of SNP on biofilm formation by plasmid encoded fluA gene (strain MS1232) and plasmid encoded ∆flu gene (strain MS1199). Both strains were grown in the presence of arabinose. Biofilm formation was measured by the crystal violet assay method. Biofilm formation was compared to the biofilm formation by the control where no NO donor was added. The data represent mean ± standard error of mean from three replicates.
8

Effect on Biofilm formation by strain carrying P fimbriae To show the effect of NO on biofilm formation of the strain carrying P fimbriae, the biofilm formation of both wild type (DS17) and mutant (DS17-8) strains was observed in the presence of DETA (Figure 6a) and SNP (Figure 6b). For strain DS17, the inhibition of biofilm formation was not significant between 1 nM and 10 µM of DETA but biofilm formation was reduced at higher concentration than 10 µM (Figure 6a). The effect of DETA on biofilm formation by DS17 was almost similar with biofilm formation of DS17-8 strain. In presence of SNP, biofilm formation by DS17 was inhibited between 250 nm and 30 µM but the biofilm formation was not inhibited for the mutant strain (DS17-8) at these concentrations (Figure 6b).
Control 25 nM 125 nM 250 nM 500 nM 5 µM 15 µM 30 µM0.00
0.25
0.50
0.75
1.00
1.25
1.50 P fimbriaeMutant P fimbriae
Concentration of SNP
Rel
ativ
e va
lue
Control 1 nM 10 nM 100 nM 1µM 10 µM 100 µM 1 mM0.00
0.25
0.50
0.75
1.00
1.25
1.50 P fimbriaeMutant P fimbriae
Concentration of DETA
Rel
ativ
e va
lue
a b
Figure 6: Efffect of NO on Biofilm formation by wild (DS17) and mutant (DS17-8) type P fimbriated strains. (a) The inhibitory effect of DETA on biofilm formation by P fimbriated bacterial strains. (b) The inhibitory effect of SNP on biofilm formation by P fimbriated bacterial strains. Biofilm formation was measured by the crystal violet assay method. Biofilm formation was compared to the biofilm formation by the control where no NO donor was added. The data were calculated as for previous figures and represent mean ± standard error of mean from three replicates. In this graph P fimbriae (strain DS17) and mutant P fimbriae (strain DS17-8).
9
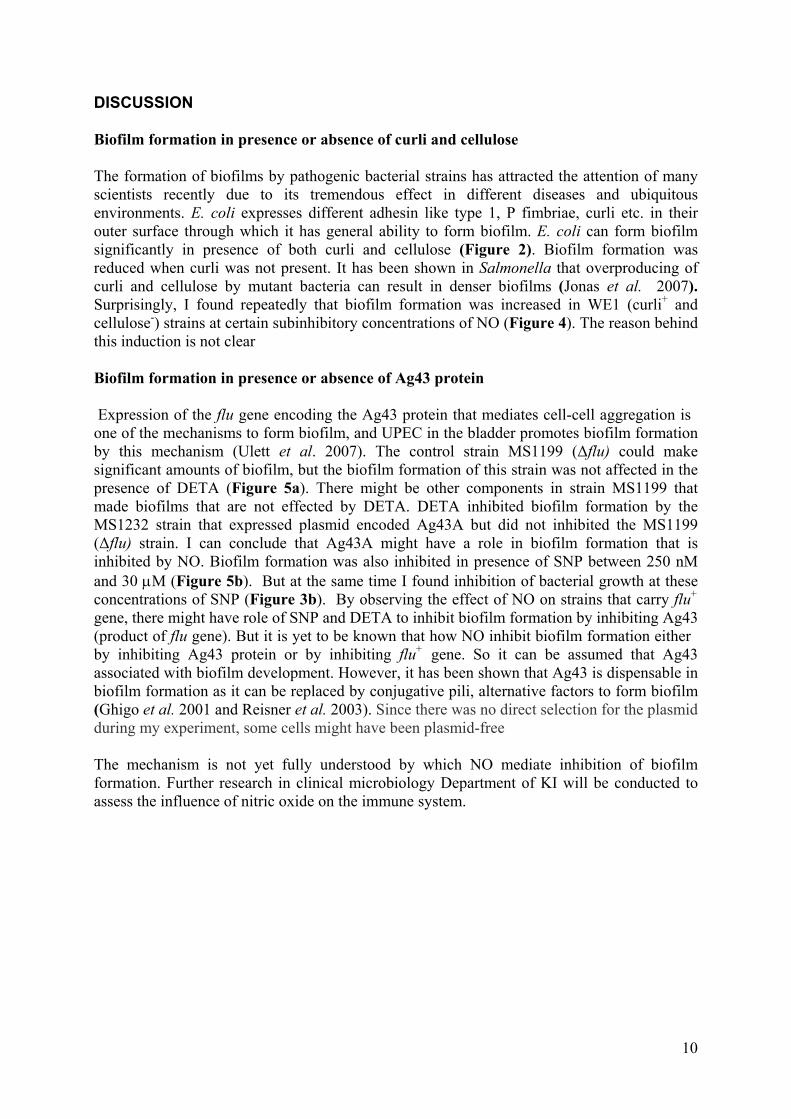
DISCUSSION Biofilm formation in presence or absence of curli and cellulose The formation of biofilms by pathogenic bacterial strains has attracted the attention of many scientists recently due to its tremendous effect in different diseases and ubiquitous environments. E. coli expresses different adhesin like type 1, P fimbriae, curli etc. in their outer surface through which it has general ability to form biofilm. E. coli can form biofilm significantly in presence of both curli and cellulose (Figure 2). Biofilm formation was reduced when curli was not present. It has been shown in Salmonella that overproducing of curli and cellulose by mutant bacteria can result in denser biofilms (Jonas et al. 2007). Surprisingly, I found repeatedly that biofilm formation was increased in WE1 (curli+ and cellulose-) strains at certain subinhibitory concentrations of NO (Figure 4). The reason behind this induction is not clear Biofilm formation in presence or absence of Ag43 protein Expression of the flu gene encoding the Ag43 protein that mediates cell-cell aggregation is one of the mechanisms to form biofilm, and UPEC in the bladder promotes biofilm formation by this mechanism (Ulett et al. 2007). The control strain MS1199 (∆flu) could make significant amounts of biofilm, but the biofilm formation of this strain was not affected in the presence of DETA (Figure 5a). There might be other components in strain MS1199 that made biofilms that are not effected by DETA. DETA inhibited biofilm formation by the MS1232 strain that expressed plasmid encoded Ag43A but did not inhibited the MS1199 (∆flu) strain. I can conclude that Ag43A might have a role in biofilm formation that is inhibited by NO. Biofilm formation was also inhibited in presence of SNP between 250 nM and 30 µM (Figure 5b). But at the same time I found inhibition of bacterial growth at these concentrations of SNP (Figure 3b). By observing the effect of NO on strains that carry flu+ gene, there might have role of SNP and DETA to inhibit biofilm formation by inhibiting Ag43 (product of flu gene). But it is yet to be known that how NO inhibit biofilm formation either by inhibiting Ag43 protein or by inhibiting flu+ gene. So it can be assumed that Ag43 associated with biofilm development. However, it has been shown that Ag43 is dispensable in biofilm formation as it can be replaced by conjugative pili, alternative factors to form biofilm (Ghigo et al. 2001 and Reisner et al. 2003). Since there was no direct selection for the plasmid during my experiment, some cells might have been plasmid-free The mechanism is not yet fully understood by which NO mediate inhibition of biofilm formation. Further research in clinical microbiology Department of KI will be conducted to assess the influence of nitric oxide on the immune system.
10

MATERIALS AND METHODS Bacterial strains and growth conditions Three different uropathogenic E. coli and different mutants of them were used in this study. All wild type strains were clinical isolates. The relevant characteristics of bacterial strains used in this study are listed in Table 1. Table 1: Bacterial strains E. coli Strains Parental strain Relevant characteristics Reference # 12 Wild type Wild type (curli+, cellulose+) Chromek et al. 2006 WE 1 #12 Mutant (curli+, cellulose-) Chromek et al. 2006 WE 11 #12 Mutant (curli-, cellulose+) Chromek et al. 2006 WE 16 #12 Mutant (curli-, cellulose-) Chromek et al. 2006 DS 17 Wild type Wild type (expresses P-fimbriae) Möllby et al. 1997 DS17-8 DS 17 Mutant (lacking functional adhesin) Möllby et al. 1997 NU 14 Wild type Wild type (expresses type 1 fimbriae) Möllby et al. 1997 NU14-1 NU14 Mutant (lacking functional adhesin) Möllby et al. 1997 MS1230 MG1655 pCO2 in OS56*, Ampr Kmr Ulett et al. 2007 MS1231 MG1655 pCO3 in OS56*, Ampr Kmr Ulett et al. 2007 MS1232 MG1655 pCO4 in OS56*, AmprKmr Ulett et al. 2007 MS1199 MG1655 pBAD/MycHisA in OS56* Ulett et al. 2007 *OS56 MG1655 ∆flu Gfp+ Ampr Ulett et al. 2007
Table 2: Plasmids Plasmids Relevant properties Reference pCO2 flu gene from MG1655 in pBADMycHisA-kan, Ampr Kmr Ulett et al. 2007 pCO3 fluB gene (c1273) from CFT073* in pBADMycHisA-kan, Ampr Kmr Ulett et al. 2007 pCO4 fluA gene (c3655) from CFT073* in pBADMycHisA-kan, Ampr Kmr Ulett et al. 2007
* Wild-type UPEC isolate
The MS1230, MS1231 and MS1232 strains carried the flu+, fluA and fluB genes under the araBAD promoter on the plasmids pCO2, pCO3 and pCO4 respectively (Table 2). Bacteria except MS1230, MS1231, MS1232 and MS1199 were grown on blood agar plates (plates were supplied from the clinical microbiology division of Karolinska Hospital) over night. The bacterial strains MS1230, MS1231, MS1232 and MS1199 were grown in 10 ml Luria-Bertani (LB) broth supplemented with 100 mg/L ampicillin and 0.02 % arabinose overnight at 37°C with continuous shaking. All these strains were grown in the presence of arabinose yielding overexpression of the plasmid encoded Ag43 protein and its variants. LB broth was prepared by mixing 10g tryptone, 5g yeast extract, 10g NaCl in ~800mL distilled water and adjusted pH to ~7.3-7.5 and made volume to 1 L, then autoclaved. For biofilm experiments, all bacterial strains except MS1230, MS1231, MS1232 and MS1199 were grown on LB plates without NaCl to promote biofilm formation for 24 hours at 37°C. LB plates were prepared by mixing 10 g Bacto-tryptone, 5g yeast extract and 15 g agarose in ~800mL deionized (DI) H20, adjust pH to 7.5 and made volume to 1L and then autoclaved to sterilized, cool to 55 degree and pour into sterile petridish. Both LB plate and LB medium were prepared by lab assistant.
11
For biofilm experiments, the strains MS1230, MS1231, MS1232 and MS1199 were grown in LB broth without NaCl, supplemented with 100 mg/L ampicillin and 0.02 % arabinose for 24 hours at 37°C without shaking. All bacteria were stored at -70°C.
Nitric oxide donor
DETA NONOate (1-[N-(2-aminoethyl)-N-(2-ammonioethyl)amino]diazen-1-ium-1,2-diolate, Alexis Biochemicals) and Sodium Nitroprusside Dihydrate (SNP, Sigma-Aldrich) stock solutions (2 mM for DETA and 30 µM for SNP) were prepared by dissolving the compound in PBS . PBS was made by dissolving 8 g of NaCl, 0.2 g of KCl, 1.44 g of Na2HPO4, 0.24 g of KH2PO4 in 800ml distilled H2O. Adjusted pH to 7.4 and made volume to 1L with additional distilled H2O, then sterilized by autoclaving. Different dilutions were then prepared in LB. All SNP solutions were protected from light due to their light sensitivity and prepared freshly for each experiment.
Bacterial growth experiment (alamarBlueAssay) The growth of bacteria in the presence of nitric oxide was measured by alamarBlue Assay. Bacterial colonies were resuspended from blood agar plates in PBS and adjusted to OD600 approx. 0.125 (108 colony forming unit/ml). Bacteria were then pelleted by centrifugation at 3500 g for 10 minutes and subsequently resuspended by pipetteing. This bacterial suspension was added to LB containing alamarBlue (1:10) [TREK Diagnostic Systems, Inc., USA ] to a final concentration of 106 CFU/mL. The concentration of SNP (30µM, 15 µM, 5 µM, 500 nM, 250 nM, 125 nM and 25 nM) and DETA NONOate (1 mM, 100 µM, 10 µM, 1 µM, 100 nM, 10 nM and 1 nM) was prepared separately in LB during growth experiment. One hundred microliter of LB broth containing bacteria (106 CFU/mL), alamarBlue (1:10) and SNP or DETA in different concentrations were distributed on 8-well strips (Nunc-Immuno, Denmark). Growth was monitored by measuring the OD at 570 nm at various time points. AlamarBlue consists of an oxidation-reduction (REDOX) indicator that yields a colorimetric change and a fluorescent signal in a response to a metabolic activity. Its reduction by the bacteria, the redox reaction, was measured by absorbance readings 570 nm at various time intervals Minimal inhibitory concentration determination Bacterial colonies were resuspended from blood agar plates in PBS and adjusted to OD600 approx. 0.125 (108 CFU/ml). This bacterial suspension was added to LB broth to a final concentration of 106 CFU/mL. Two hundred microliter of LB broth without salt containing bacteria (106 CFU/mL) and SNP in different concentrations were distributed on 96 well microtiter (Corning Incorporated, USA) plates and incubated statically at 37°C for 24 hours. I used SNP concentration starting from 30 µM to 102.4 mM gradually and observed the growth of bacteria after 24 hours with the naked eye. Measurement of biofilm formation To study biofilm formation in the presence of nitric oxide, bacterial suspension and different concentration of nitric oxide donor were prepared as described as above (final concentration of bacteria 106 CFU/ml). Two hundred microliter of LB broth without salt containing bacteria (106 CFU/mL) and SNP or DETA in different concentrations were distributed on 96 well microtiter plates and incubated statically at 37°C for 24 hours. After 24-h incubation, the
12

medium was gently removed and the microtiter plate wells were washed three times with 200 µl of PBS buffer using a multichannel pipette, and allowed to dry for 15 min. The microtiter plate wells were subsequently stained with 200 µl crystal violet (0.3 % crystal violet in isopropanol ; BENEX Limited, Ireland) for 5 minutes. Unbound excess of stain was removed by washing the wells washed with tap water five times. The crystal violet bound to the exopolysaccharide in the biofilm was solubilized by the addition of 200 µl of ethanol (95%) per well and shaking on a horizontal shaker (500 rpm) for 5 min. The absorbance was measured at 570 nm. In all experiments, absorbance was measured with a plate reader, using the Revealation 4.21 program (Dynex technology, the microtiter company).
13

ACKNOWLEDGEMENTS I would like to express my special gratitude to Annelie Brauner, MD, Ph.D. for giving me chance to work with her group. Her friendly attitude and nice comments during my project work always inspired me to do this research work without any tiring. I also thanks to Petra Luthje, Ph.D who guided me through out my whole project by sharing her research experience and kept me always up to date on my research. I also thank to Karin Carlson whose coordination always reminds the due date of thesis submission that push me to finish the work in time. It would be completely incomplete to finish my acknowledgement without thanking and loving my wife, Tayeba and my one-year daughter, Tuba. When I felt exhausted to work, I refueled by playing with my daughter and watching movie with my wife. I cannot finish my thesis writing without their inspiration. At last I thanks to my God who created me and kept me healthy to complete my thesis work.
14
REFERENCE: Anderson G.G., Palermo J.J., Schilling J.D., Roth R., Heuser J., and Hultgren S.J. 2003. Intracellular bacterial biofilm-like pods in urinary tract infections. Science 301: 105–107. Ashby M.J., Neale J.E., Knott S.J., and Critchley I.A. 1994. Effect of antibiotics on non-growing planktonic cells and biofilms of Escherichia coli. J. Antimicrob. Chemother. 33: 443–452. Barraud N., Hassett D. J., Hwang S., Rice S. A., Kjelleberg S., and Webb J. S. 2006. Involvement of Nitric Oxide in Biofilm Dispersal of Pseudomonas aeruginosa. Journal of Bacteriology. 188: 7344-7353 Beckman J. S., and Koppenol W. H. 1996. Nitric oxide, superoxide, and peroxynitrite: the good, the bad, and ugly. Am. J. Physiol. 271: C1424–C1437. Bloodsworth A., O'Donnell V.B., and Freeman B.A. 2000. Nitric oxide regulation of free radical-and enzyme-mediated lipid and lipoprotein oxidation. Arteriosclerosis, Thrombosis, and Vascular Biology 20: 1707–1715 Bogdan C. 2001. Nitric oxide and the immune response. Nature Immunology 2: 907–916 Bogdan C., Röllinghoff M., and Diefenbach A. 2000. Reactive oxygen and reactive nitrogen intermediates in innate and specific immunity. Curr Opin Immunol 12: 64–76 Carlsson S., Weitzberg E., Wiklund P., and Lundberg JO. 2005. Intravesical nitric oxide delivery for prevention of catheter-associated urinary tract infections. Antimicrob Agents Chemother. 49: 2352-5 Cegelski L., Marshall G.R.,Eldridge G.R. and Hultgren S.J., 2008. The biology and future prospects of antivirulence therapies. Nature Reviews Microbiology 6: 17-27 Chirwa N. T., and Herrington M. B. 2003. CsgD, a regulator of curli and cellulose synthesis, also regulates serine hydroxymethyltransfe-rase synthesis in Escherichia coli K-12. Microbiology 149: 525–535 Chromek M., Slamova Z., Bergman P., Kovacs L., Podracka L., Ehren I., Hokfelt T., Gudmundsson GH., Gallo RL., Agerberth B., and Brauner A. 2006. The antimicrobial peptide cathelicidin protects the urinary tract against invasive bacterial infection. Nature Medicine 12: 636-41 Chromek M. 2006. Urinary tract infection and renal scarring. Ph.D thesis work, the division of clinical microbiology, Department of Microbiology, Tumor and cell biology, Karolinska institute, Stockholm, Sweden Connell H., Agace W., Klemm P., Schembri M., Mårild S., and Svanborg C. 1996. Type 1 fimbrial expression enhances Escherichia coli virulence for the urinary tract. Proc. Natl. Acad. Sci. USA 93: 9827–9832.
15

Costerton J. W., Stewart P. S., and Greenberg E. P. 1999. Bacterial bio- films: a common cause of persistent infections. Science 284: 1318–1322. Costerton J.W., Lewandowski Z., Caldwell D.E., Korber D. R., and Lappin-Scott H.M. 1995. Microbial biofilms. Annual Review Microbiology 49: 711–745. De Groote M. A., and Fang F.C. 1995. NO inhibitions: antimicrobial properties of nitric oxide. Clin Infect Dis 21 (Suppl. 2): S162–S165. Fang F. C. 1997. Mechanisms of nitric oxide-related antimicrobial activity. J Clin Invest. 99: 2818–2825. Foxman B. 2002. Epidemiology of urinary tract infections; incidence, morbidity, and economic costs. Am. J. Med. 113 (Suppl. 1A) : 5S-13S Garofalo C.K., Hooton T.M., Martin S.M., Stamm W.E., Palermo J.J., Gordon J.I., and Hultgren S.J. 2007. Escherichia coli from urine of female patients with urinary tract infections is competent for intracellular bacterial community formation. Infect. Immun. 75 : 52-60 Ghigo J. M. 2001. Natural conjugative plasmids induce bacterial biofilm development. Nature 412:442-445. Hasman H., Schembri M. A., and Klemm P. 2000. Antigen 43 and type 1 fimbriae determine colony morphology of Escherichia coli K-12. J. Bacteriol. 182: 1089-1095 Hassett D. J., Cuppoletti J., Trapnell B., Lymar S. V., Rowe J. J., Yoon S. S., Hilliard G. M., Parvatiyar K., Kamani M. C., Wozniak D. J., Hwang S. H., McDermott T. R., and Ochsner U. A. 2002. Anaerobic metabolism and quorum sensing by Pseudomonas aeruginosa biofilms in chronically infected cystic fibrosis airways: rethinking antibiotic treatment strategies and drug targets. Adv. Drug Delivery Rev. 54: 1425-1443. Herwald H., Morgelin M., Olsen A., Rhen M., Dahlback B., Muller-Esterl W., and Bjorck L. 1998. Activation of the contact-phase system on bacterial surfaces – a clue to serious complications in infectious diseases. Nature Medicine 4: 298–302. Jonas K., Tomenius H., Kader A., Normark S., Römling U., M Belova L. and Melefors Ö.2007. Roles of curli, cellulose and BapA in Salmonella biofilm morphology studied by atomic force microscopy. BMC Microbiology 7: 70 Langermann S., Palaszynski S., Barnhart M., Auguste G., Pinkner J. S., Burlein J., Barren P., Koenig S., Leath S.,Jones C.H. and Hultgren S.J., 1997. Prevention of mucosal Escherichia coli infection by FimH-adhesin-based systemic vaccination. Science 276: 607-611 Mah T.F. and O'Toole G.A. 2001. Mechanisms of biofilm resistance to antimicrobial agents.Trends in Microbiology. 9: 34-39
16
17
Mulvey M.A., Lopez-Boado Y. S., Wilson C.L., Roth R., Parks W.C., Heuser J., and Hultgren S. J. 1998. Induction and evasion of host defenses by type 1-piliated uropathogenic Escherichia coli. Science 282: 1494–1497. O'Toole G., Kaplan H.B., and Kolter R. 2000. Biofilm formation as microbial development. Annu Rev Microbiol. 54:49-79 Poljakovic M., Svensson L., and Persson K. 2005. The influence of uropathogenic Escherichia coli and proinflammatory cytokines on the inducible nitric oxide synthase response in human kidney epithelial cells. J Urol 173: 1000-3 Reisner A., Haagensen J.A.J, Schembri M. A., Zechner E. L., and Molin S. 2003. Development and maturation of Escherichia coli K-12 biofilms. Mol. Microbiol. 48: 933-946. Ulett G.C., Valle J., Beloin C., Sherlock O., Ghigo J. and Schembri M.A., 2007. Functional analysis of antigen 43 in uropathogenic Escherichia coli reveals a role in long-term persistence in the urinary tract. Infect. and Immu. 75: 3233-3244 Sjobring, U., Pohl G., and Olsen A. 1994. Plasminogen, absorbed by Escherichia coli expressing curli or by Salmonella enteritidis expressing thin aggregative fimbriae, can be activated by simultaneously captured tissue-type plasminogen activator (t-PA). Molecular Microbiology 14: 443–452. Söderhäll M., Normark S., Ishikawa K., Karlsson K.A., Teneberg S.,Winberg J., and Möllby R. 1997. Induction of protective immunity after Escherichia coli bladder infection in primates dependence of the globoside-specific P-fimbrial tip adhesin and its cognate receptor. Journal of Clinical investigation 100: 364-372 Van Houdt R., and Michiels C. W. 2005. Role of bacterial cell surface structures in Escherichia coli biofilm formation. Research in Microbiology 156: 626–633 Whiteley M., Bangera M.G., Bumgarner R.E., Parsek M.R., Teitzel G.M., Lory S. and Greenberg E.P.2001. Gene expression in Pseudomonas aeruginosa biofilms. Nature 413 : 860-4 Wink D. A., and Mitchell J. B. 1998. Chemical biology of nitric oxide: insights into regulatory, cytotoxic, and cytoprotective mechanisms of nitric oxide. Free Radic. Biol. Med. 25: 434-456. Zogaj X., Bokranz W., Nimtz M., and Romling U. 2003. Production of cellulose and curli fimbriae by members of the family Enterobacteriaceae isolated from the human gastrointestinal tract. Infect. Immun. 71: 4151–4158.