effect of pasta processing on physicochemical properties
TRANSCRIPT

UNIVERSITY OF MOLISE
EFFECT OF PASTA PROCESSING ON
PHYSICOCHEMICAL PROPERTIES OF BARLEY
BETA-GLUCAN AND PHENOLIC ACIDS
PHD THESIS
in
FOOD BIOTECHNOLOGY (BIOTECNOLOGIA DEGLI ALIMENTI)
XXVI Cycle - AGR 15
Advisor:
Prof. Maria Cristina Messia
Coordinator:
Prof. Emanuele Marconi
Co-Advisor:
Dr. Elsayed M. Abdel-Aal
PhD Student:
Rosanna De Paula
Matr.401673
Campobasso, Italy
March, 2014

Summary
SUMMARY
The increasing interest in the relationship between health and nutrition has steered the
scientific research towards studying the role of specific food components/ingredients
(phytochemicals), which are naturally included in many foods, in the treatment and/or
prevention of ailments.
Cereals are generally suitable vehicles of bioactive substances (phytochemicals) such as
β-glucan and phenolic compounds. Indeed, available literature report that β-glucan and
phenolic compounds have a beneficial role in diet and health. However, the literature
seems to show that processing of grains, such as pasta processing, may affect bioactive
compounds, increasing or decreasing the health-enhancing properties of cereals pro-
ducts.
Based on these remarks, the current PhD research work aims at developing barley pasta
rich in β-glucan as a functional food with the use of waxy barley as a rich source of so-
luble dietary fiber, such as β-glucan, and phenolic acids. The research work includes
three studies:
in the 1st study chemical, molecular and rheological properties of waxy barley
individually and in blend with semolina was investigated;
in the 2nd study impact of processing (extrusion, drying and cooking) on the
concentration and physicochemical properties of the flours and blends, and mo-
lecular characterization of β-glucan, as well as viscosity of the developed pasta
products was evaluated;
in the 3th part of the research antioxidant properties and phenolic acid composi-
tion of the developed pasta products was studied.
The obtained results show that pasta processing may affect β-glucan and phenolic acids.

Summary
This research would make a great contribution to the barley research and assist barley
industry in the development of innovative functional foods.

Riassunto
RIASSUNTO
Il crescente interesse nella correlazione tra alimentazione e salute ha indotto la comunità
scientifica ad un maggior impegno nel campo della ricerca di alcune sostanze dalle ri-
conosciute proprietà salutistiche (phytochemicals), naturalmente presenti in una vasta
gamma di prodotti di interesse agro-alimentare.
I cereali in genere, nonché i prodotti da essi derivati, sono tra gli alimenti più idonei a
veicolare composti bioattivi (phytochemicals) come ad esempio β-glucani e composti
fenolici. Evidenze scientifiche hanno dimostrato, infatti, che β-glucani e acidi fenolici
possono avere importanti effetti fisiologici. Tuttavia, diversi studi riportano che il pro-
cesso produttivo può influenzare positivamente o negativamente la componente bioatti-
va, determinando pertanto cambiamenti nelle proprietà fisiologiche del prodotto finito.
Alla luce di queste considerazioni, l’attività di ricerca di dottorato ha avuto come prin-
cipale finalità la produzione di pasta funzionale a base d’orzo ricca in β-glucani ed è sta-
ta sviluppata in tre sezioni:
valutazione delle proprietà chimiche, molecolari e reologiche di sfarinati di orzo
waxy in miscela e non con semola di frumento duro;
studio dell’impatto dei processi tecnologici sulla concentrazione e caratte-
ristiche molecolari e di solubilità dei β-glucani in paste funzionali;
valutazione della capacità antiossidante e degli acidi fenolici delle paste a base
d’orzo waxy prodotte nell’ambito della sperimentazione.
I risultati ottenuti consentono di affermare che il processo di pastificazione può influen-
zare la componente bioattiva, in particolare β-glucani e acidi fenolici, presente nel pro-
dotto finito. La presente attività di dottorato vuole fornire un contributo al mondo della

Riassunto
ricerca e dell’industria, nonché fornire informazioni per la realizzazione di cibi funzio-
nali a base d’orzo.

Table of Contents
Chapter I - Introduction
Introduction pag. 02
1. Literature Review. pag. 04
1.1 The history of the use of barley pag. 04
1.2 Barley grain pag. 05
1.3 Barley beta-glucan pag. 10
1.3.1 Occurrence and molecular-structural characteristics of β-glucan pag. 10
1.3.2 Physicochemical properties pag. 11
1.3.3 Health benefits of β-glucan pag. 12
1.3.4 Processing impact on β-glucan pag. 13
1.4 Phenolic acids pag. 16
1.4.1 Occurrence and molecular-structural characteristics of
phenolic acids pag. 16
1.4.2 Health benefits of phenolic acids pag. 18
1.4.3 Processing impact on phenolic acids pag. 19
Aims of PhD research activity pag. 23
References pag. 24
Chapter II - Effect of pasta processing on beta-glucan physicochemical properties of barley and
semolina pastas
Abstract pag. 37
2.1. Introduction. pag. 39
2.2 Materials and Methods pag. 42

2.2.1 Materials pag. 42
2.2.2 Pasta preparation pag. 42
2.2.3 Chemical analyses pag. 44
2.2.4 Physicochemical properties of raw materials and pastas pag. 45
2.2.4.1 Pasting properties of flours pag. 45
2.2.4.2 RVA Method for Viscosity Measurement of β-glucan in pasta
pag. 45
2.2.4.3 Viscosity Measurement with a Controlled-Strain Rheometer
pag. 46
2.2.4.4 Characterization of β-Glucan Solubilized at 37°C pag. 46
2.2.5 Statistical analysis pag. 48
2.3 Results and discussion pag. 49
2.3.1 Pasting properties of raw ingredients pag. 49
2.3.2 Physicochemical properties of β-glucan in raw materials and pastas
pag. 54
2.3.3 Relationship between physicochemical properties of β-glucan in pasta
samples pag. 60
2.4 Conclusions pag. 61
References pag. 63
Chapter III - Effect of pasta processing on phenolic acid composition and radical scavenging
capacity of barley and semolina pastas
Abstract pag. 70
3.1. Introduction. pag. 71
3.2 Materials and methods pag. 74

3.2.1 Materials pag. 74
3.2.2 Extraction of free and bound phenolics pag. 74
3.2.3 Analysis of Free and Bound Phenolic Acids by HPLC (High Performance
Liquid Chromatography) pag. 75
3.2.4 Analysis of Total Phenols Content (TPC) in Free and Bound Extracts
pag. 76
3.2.5 DPPH Radical Scavenging Capacity pag. 79
3.2.6 Statistical Analysis pag. 79
3.3 Results and Discussion pag. 80
3.3.1 Effect of processing and cooking on phenolic acids pag. 80
3.3.2 Total Free and Bound Phenols Contents pag. 89
3.3.3 DPPH Radical Scavenging Capacity pag. 92
3.3.4 Contribution of Phenolics to Antioxidant Capacity pag. 94
3.4 Conclusions pag. 97
References pag. 98
Chapter IV - General conclusion
4.1 Overall Conclusions pag. 104
Acknowledgements

CHAPTER I
Introduction

2
Chapter I
Introduction
Whole cereal grains, including barley, and their products are important foods in human
diet mainly because they are rich sources of energy, dietary fiber, vitamins and
minerals. Their consumption has been linked to the prevention of chronic diseases.
Numerous laboratory and clinical studies have demonstrated that consumption of
barley-based products can lower serum cholesterol levels, reduce glucose uptake,
decrease plasma insulin response, control weight through prolonged satiety (Yokoyama
et al., 1997; Cavallero et al., 2002; Wood, 2007) and encourage growth of beneficial
gut microflora (Brennan and Cleary, 2005). These physiological effects of barley are
primarily attributable to the increasing of viscosity in the gastrointestinal tract (Wood,
2007), caused mainly by β-glucan. Previous studies have demonstrated that the
concentration, molecular weight (MW), and structural features of β -glucan influence its
physical properties (viscosity and solubility) (Wood et al., 1994). The physicochemical
characteristics of β-glucan are influenced by many factors such as genotype,
environment, agronomic input, and the interactions of these factors and food processing
methods.
In addition to β-glucan, barley contains many other health-promoting components,
which include phenolic compounds (Hernanz et al., 2001; Adom and Liu, 2002).
Phenolic acids are the dominant group present in free and bound form primarily in the
outer layers of the cereal kernels. Phenolic compounds found in cereals are known for
their beneficial antioxidant, anti-inflammatory, antimutagenic, and anticarcinogenic
properties and overall for the promotion of human health (Kahkonen et al., 1999). They
may act as scavengers of free radicals (Ragaee et al., 2006), chelating agents of pro-
oxidant metals, quenchers of singlet oxygen (Larson, 1988), and inhibitors of human
LDL cholesterol oxidation (Abdel-Aal and Gamel, 2008).

3
Chapter I
Viewing the importance of barley as vehicle minor components with functional
properties, in the last years, food researchers and the food industry has been
investigating the possibility of incorporating barley flours and by-products into various
food products (bread, muffins, pasta, noodles, bars, cookies, etc) (Izydorczyk et al.,
2008; Vitaglione et al., 2008; Verardo et al., 2011). Although significant numbers of
studies illustrate the benefit of consuming barley-rich products, few studies document
the changes to the bioactive compounds of barley-based products that the production
process brings about. In particular, the available literature reveals that food processing
operations can have a negative or positive impact on the molecular weight and solubility
of β-glucan (Tiwari and Cummins, 2009) and levels of phenolic compounds in foods
(Ragaee et al., 2014). This has implications for their bioactive properties and potential
health benefits they can offer. Therefore, cereal recipe and processing should be
carefully chosen to preserve the health properties of foods after processing.

4
Chapter I
1. Literature review
1.1 The history of the use of barley
The beginning of agriculture is dated back to 10,000 years ago in the Pre-Pottery
Neolithic Near East. Barley (Hordeum vulgare L.) is one of the cereal founder crops
and it is believed that first plant domestication took place within the Fertile Crescent
(Lev-Yadun et al., 2000).
Hordeum vulgare L. subsp. spontaneum (wild barley) is said to be the ancestor of
today’s barley. The spread of barley most likely started in present-day Israel, northern
Syria, southern Turkey, eastern Iraq and western Iran. With the movement of
civilizations accompanied by the establishment of trade routes the use and cultivation of
barley reached Europe. Barley was a popular food in ancient Greece and Italy and used
as an ingredient for preparing porridge or unleavened bread. Greeks and Romans such
as Hippocrates or Pliney the Elder, respectively, considered barley as a healthy and
nourishing food and barley gained as well recognition for medical treatments. In the
ancient Rome, gladiators believed that barley could increase strength and stamina and
thus preferred it to other cereals. Barley reached Spain around 5,000 BC and spread
then over today’s Germany and France. Indications of domestication of barley on the
British Isles date back until 3,000 BC and one millennium later, barley was introduced
to Northern Europe. Probably due to the nourishing properties and the ruggedness of the
crop, barley became a major food especially for poor people throughout history
(Newman & Newman, 2005).
In 2009, barley was the twelfth most important agricultural commodity of the world in
terms of production. After maize, wheat and paddy rice it was the fourth most important
cereal crop (FAO, 2011). The annual production was about 152 million tons, of which
the Russian Federation produced around 17.9 million tons followed by France,

5
Chapter I
Germany and Ukraine with 12.9, 12.3 and 11.8 million tons, respectively. In the
European Union, barley still attains distinction as the second cereal crop after wheat.
1.2 Barley grain
Barley belongs to the family Poaceae and the genus Hordeum. The most common form
of barley is Hordeum vulgare. It can be classified as spring or winter types, two-row or
six-row (in two-row barley only the central spikelet is fertile, while in six-row barley
has fertile lateral spikelets also), hulled or hull-less (which relates to the presence or
absence of an outer husk attached to the grain) and malting or feed (which relates to its
end-use). The composition of the grain can be classified as normal, waxy or high
amylose starch types, high lysine, high β-glucan or proanthocyanidin-free. Barleys of
different classes often differ widely in both their physical and compositional
characteristics, and as a result they have different processing properties and end-uses.
Generally wholegrain barley consists of approximately 70% starch, 10-20% protein, 5-
10% β-glucan, 2-3% free lipids and approximately 2.5% minerals (Czuchajowska et al.,
1998; Izydorczyk et al., 2000; Quinde et al., 2004) with total dietary fibre and soluble
dietary being reported to range from 11 to 34% and 3-20% respectively (Fastnaught,
2001) (Table 1.1). Barley composition is influenced by genetics, environmental factors
and can also be influenced by the interaction between the two factors (Aman and
Newman, 1986).
Barley is rich in prolamin storage proteins (hordeins). Barley proteins have a moderate
nutritional quality, and recent studies have shown that there may be a link between
barley proteins and grain hardness (Fox et al., 2007). Barley has been reported to
contain a number of essential amino acids, including threonine, valine, lysine and
arginine. Essential amino acids are amino acids that cannot be made by the body, or
cannot be produced fast enough to meet the body’s demand for them. These amino acids

6
Chapter I
therefore must be supplied by the diet as they play important roles in metabolic
pathways. For example, arginine is involved in the synthesis of urea in the liver, while
lysine is involved in the production of carnitine, which is a substance that transports
fatty acids within cells (Sullivan et al., 2010).
Table 1.1 Composition of hulled and hulless barleys in nonwaxy and waxy genotypes (Newman and
Newman, 2005)
Nonwaxy Waxy
Property Hulled Hulless Hulled Hulless
Protein, % 15.6 16.3 16.1 16.9
Ether extract, % 2.0 2.1 2.3 2.6
Ash, % 2.7 2.1 2.8 2.1
Starch, % 55.9 61.3 51.5 58.5
Soluble carbohydrates, % 2.3 2.9 5.0 5.5
Fiber, %
Total dietary fiber 17.0 13.2 19.6 13.8
Soluble dietary fiber 4.4 4.9 5.9 6.3
Arabinoxylans 6.2 4.4 6.7 4.6
Cellulose 3.8 2.1 4.4 1.9
Klason lignin 2.0 0.9 1.8 0.9
Total β-glucan 4.4 4.7 5.3 6.3
Soluble β-glucan 2.6 2.6 3.2 3.4
Viscosity, cP 2.8 3.1 3.3 4.9
Generally, starch is most abundant in the endosperm fraction of the barley kernel (fig.
1.1), as starch is the major component of flour. Smaller levels of starch are present in
the aleurone, subaleurone and germ tissues (Flores et al., 2005; Izydorczyk et al., 2003).
Studies have been undertaken on the pasting properties of barley starches. Ragaee and
Abdel-Aal (2006) found that wholegrain barley had peak and final viscosities that were
significantly higher than those of hard wheat, but lower than those of soft wheat. The
authors studied the addition of 15% barley wholegrain to both hard and soft wheat,
finding that the addition lead to increases in the peak and final viscosities of the hard

7
Chapter I
wheat formulations, while the addition of barley lead to a decrease in the pasting
attributes of the soft wheat formulations. This suggests that the addition of barley to
hard wheat would be more likely to produce an end-product with increased rates of
starch retrogradation and would therefore have to be taken into account when
formulating a barley-containing product. The authors suggested that barley had the
potential to be included in the development of a healthy food product.
Barley starches generally have a high amylose-to-amylopectin ratio, meaning that there
is a significantly higher proportion of amylose in the starch than amylopectin. Amylose
molecules, because of their linearity, line up more readily than amylopectin molecules
and hence have a more extensive network of hydrogen bonds. More energy will be
required to break these bonds and gelatinise the starch. As a result of this, barley
starches retrograde more readily than wheat starches (van Amelswoort and Westrate,
1992). The amylose content of barley starch can vary however. Waxy barleys generally
have an amylose content of approximately 5%, the most common barley cultivars have
an amylose content of 20-30% whereas high amylose barley can have an amylose
content of up to 45% (Sullivan et al., 2013).
The main non-polar lipid fraction in barley is triacylglycerol, with the other lipids being
made up of steryl esters, diacylglycerol, monoacylglycerol and free fatty acids
(Morrison, 1993) whereas polar lipids consist primarily of phospholipids. Linoleic acid
(50-60%), palmitic (20-30%), oleic (10-15%) and linolenic acid (4-9%) make up the
non-starch lipids found in the barley kernel.
The ash content of barley is usually in the range of 2-3%, with the main minerals
present being phosphorous, potassium and calcium, while chlorine, magnesium sulphur
and sodium are found in smaller amounts (Owen et al., 1977). Minerals were found to
be in their highest concentrations in the embryo, with the lowest concentrations found in

8
Chapter I
the endosperm (Liu et al., 1974). Bhatty (1997) found phosphorous and potassium to be
the minerals with the highest abundance in barley (0.21 and 0.25% respectively).
Calcium (0.02%), sulphur (0.12%), magnesium (0.08%), iron (49.9 mg/kg), zinc (24.4
mg/kg), manganese (13.9 mg/kg) and copper (12 mg/kg) were also detected in the
study.
Figure 1.1 Barley grain with enlarge cross sections (Sullivan et al., 2013)

9
Chapter I
Fibre plays an important role in the digestibility of foods. Several authors have shown
barley to have fibre levels ranging from 11 to 20% (Marconi et al., 2000; Fastnaught,
2001; Virkki et al., 2004). Fibre can be classified as either soluble or insoluble. Soluble
fibre can be defined as “the edible parts of plants or similar carbohydrates resistant to
digestion and absorption in the human small intestine with complete or partial
fermentation in the large intestine” whereas insoluble fibre passes through digestion
without being absorbed and aid bowel function (AACC, 2001). The main constituent of
soluble fibre is β-glucan (MacGregor and Fincher, 1993; Panfili et al., 2008).
Barley was found to be an excellent source of phenolic compounds with antioxidant
properties, such as phenolic acids (Goupy et al., 1999; Ragaee et al., 2006).

10
Chapter I
1.3 Barley beta-glucan
1.3.1 Occurrence and molecular-structural characteristics of β-glucan
β-glucan is the more common name for (1-3, 1-4)- β-D-glucan. β-glucan consists of
homopolymers of D-glucopyranosyl residues, usually linked by two (cellotriose) or
three (cellotetraose) β-(1-4) linkages (~70%) separated by one β-(1-3) linkage (~30%)
(Cui et al., 2000). Barley grain is notable for a high content of β-glucan that ranges from
2.5% to 11.3% (Izydorczyk and Dexter, 2008). In barley endosperm cell walls, β-glucan
account for 75% of the total cell wall polysaccharides, the rest of which are made up of
arabinoxylans, cellulose, glucamannans and proteins. The content of β-glucan in barley
is influenced by both genetic and environmental factors and the interactions between the
two (Andersson et al., 1999). Numerous studies showed that barley genotypes with
anomalous starch composition (waxy or high amylose) have higher content of β-glucan
than those with normal starch. It appears that the waxy starch character and high levels
of β-glucan are usually inherited simultaneously, although the precise nature of the
association between the waxy starch and high levels of β-glucan has not yet been
revealed. The total content of β-glucan in the grain generally increases when barley is
grown in hot and dry conditions (Swanston, 1997) although, the content of β-glucan
may be reduced in response to short periods of very high temperature (Savin et al.,
1997).
The molecular structure of β-glucan was derived by analysing the oligomers obtained
from the digestion of β-glucan using specific enzymes that break the linkages between
the D-glucopyranosyl units. Approximately 90-95% of the oligosaccharides produced
during digestion are trisaccharides (3-O-β-D-cellobiosyl-D-glucose, DP3) and
tetrasaccharides (3-O-β-D-cellotriosyl-D-glucose, DP4), with the remaining 5-10%
made of longer oligosaccharides (≥DP5). The DP3/DP4 ratio is considered to be a

11
Chapter I
fingerprint of the structure of cereal β-glucan. In barley β-glucan, the molar ratio of
DP3/DP4 may range from 2.3-3.4 (Lazaridou et al., 2007).
1.3.2 Physicochemical properties
It is generally accepted that β-glucan can lower plasma cholesterol, improve lipid
metabolism, and reduce glycaemic index. The physiological activity of β-glucan has
been attributed to its physicochemical properties, mostly the increased viscosity in the
upper digestive tract (Izydorczyk and Dexter, 2008).
Viscosity is defined as the proportional relationship between the flow of a fluid and
force directed on the fluid, and calculated as the shear stress (the force applied
tangential to the fluid plane) divided by shear rate (the velocity gradient in a particular
fluid due to applied shear stress) (Dikeman and Fahey, 2006) . The viscosity unit is
millipascal second (mPa.s) or centipoise (cP), where 1 mPa.s is equal to 1 cP. Apparent
viscosity, the most common term used for dietary fiber, is defined as the viscosity of a
non-Newtonian fluid expressed as if it were a Newtonian fluid (Bourne, 2002). It is a
coefficient calculated from empirical data as if the fluid being measured exhibited
Newtonian flow and obeyed Newton’s Law, allowing for a single viscosity reading at
one shear rate (McDonald and others 2001).
The Rapid Visco Analyser (RVA) is used to measure the apparent viscosity of β-glucan
solutions or oat-flour slurries as a function of temperature, time, and stirring speed. It is
a simple, rapid, and reliable measurement, which needs only a small amount of sample
and provides a graphical record of viscosity change with time. The measured viscosity
is reported in centipoise (cP) or Rapid Visco Units (RVU).
In a freshly prepared solution, β-glucan behave as random-coil polysaccharides and
exhibit high-flow viscosity at relatively low concentrations (Wood, 2002). At low

12
Chapter I
concentration (<0.2%), the β-glucan solution behaves as a Newtonian solution, whose
viscosity does not be affected by an increasing shear rate. When the concentration of β-
glucan above 0.2%, the high molecular weight β-glucan molecules start to entangle and
form viscous and pseudoplastic solutions; whereas the low molecular weight β-glucan
can form soft gels at higher concentrations. Wood (2007) reported that the viscosity is
an exponential function of the concentration of dissolved β-glucan and of its molecular
weight.
The molecular weight (MW) values of β-glucan ranged from 0.57 x 10⁶ to 5.9 x 10⁶
(Beer et al., 1997a; Knuckles et al., 1997). The discrepancies in β-glucan MW estimate
might come from genetic and environmental factors as well as from the method used for
extraction (solvent and temperature affect the solubilisation) and purification,
aggregation phenomena (dependent on the structural features and solvent quality) and
depolymerisation events (by endogenous or microbial β-glucanases from contaminating
microorganisms) occurring during the extraction step (Lazaridou and Biliarderis, 2007).
1.3.3 Health benefits of β-glucan
Numerous laboratory and clinical studies have demonstrated that consumption of barley
β-glucan can lower serum cholesterol levels, reduce glucose uptake, decrease insulin
response, and control weight through prolonged satiety in humans (Brennan and Cleary,
2005).
The water-soluble β–glucan can effectively reduce the serum cholesterol levels
associated with a lower risk of coronary health disease and the hypoglycemic effects
(Davidson et al., 1991; Cavallero et al., 2002).
The hypocholesterolemic effect of β-glucan was related to the increasing of intestinal
viscosity caused by β-glucan (Bourdon et al., 1999). The increased viscosity in the

13
Chapter I
gastrointestinal tract may lower the re-absorption of bile acid (BA), leading to an
increased excretion of BA in the feces (Lia et al., 1997). The BAs, as part of the mixed
micelles in the small intestine, are necessary for lipid digestion. Normally, the BAs are
almost completely re-absorbed and transported to the liver through the enterohepatic
circulation by active and passive mechanisms (Hofman, 1994). Increased excretion of
BA stimulates the hepatic synthesis of BA from cholesterol, which removes the
cholesterol from the circulation and eventually lowers the serum cholesterol level
(LaRusso, 1983). The hypoglycemic effects of β-glucan are also attributed to the
viscosity of β-glucan (Wood et al., 1994).
The increasing of viscosity caused by β-glucan slows intestinal transit, and delays
gastric emptying and intestinal absorption of nutrients, such as digestible carbohydrates,
thereby reducing postprandial hyperglycemia and insulin secretion.
These actions, in turn, increase satiety and promote weight loss (Mälkki and Virtanen,
2001; Lazaridou and Biliaderis, 2007).
1.3.4 Processing impact on β-glucan
There has been much speculation and insufficient investigation over the years
concerning the effects of processing on the physicochemical characteristics of β-glucan
incorporated into food products. This speculation has frequently supposed that
processing would be detrimental to bioactivity. Processing seems to affect the molecular
(chemical structure and degree of polymerisation), structural (molecular interactions)
and functional properties (viscosity, water binding capacity and solubility), depending
upon processing methods and conditions.
Table 1.2 summarizes the effect of some of the food processing operations on molecular
weight, solubility and level of β-glucan in processed foods.

14
Chapter I
Wet milling, dry milling, and air classification are processing methods used for
obtaining β-glucan-rich flour. Wikstrom et al. (1994) observed the variation in the
intrinsic viscosity of different milling fractions of oats. Thus, milling can influence the
molecular weight of oats and barley. In a study by Andersson et al. (2004), the structure
of β-glucan was not affected by milling. However, a lower molecular weight for white
flour and lower bran fraction for barley and higher molecular weight for shorts and
whole meal was observed.
Table 1.2 Effect on molecular weight, solubility and level of β-glucan during food processing operationsa
(Tiwari and Cummins, 2009)
Changes in the properties of β-glucan may also arise from shearing damage due to
mechanical processing (Wood et al., 1989), or by excessive heat treatment of food
products. Unfavorable structural changes may also occur during commercial
purification such as the depolymerization of the linear structure (Würsh and Pi-Sunyer,
1997), resulting in decreased molecular weight and reduced viscosity. A survey of
molecular weights in processed foods (Åman et al., 2004) showed a partial
depolymerisation of β-glucan in common oat foods, as macaroni and fresh pasta. In the
foods where the partial depolymerisation occurred, the molecular weight distributions
were frequently wide and bimodal indicating a nonrandom enzymatic hydrolysis.

15
Chapter I
Regand et al. (2009) also found an extensive degradation of β-glucan in foods such as
oat pasta and bread. Degutyte-Fomins et al. (2002) showed that fermentation of oat bran
using rye sourdough starter increased the solubility and the degradation of β-glucan
during mixing and fermentation, probably due to the activity of β-glucanase. However,
the molecular weight of β- glucan may remain unaffected (Lambo et al., 2005). The
controversial results might be due to the different acidity levels obtained (pH 4.0 for oat
bran concentrate and pH 5.2 for oat bran) and the differences in the chemical
composition and enzyme activity of the preferment. Beer et al. (1997b) showed that
baking of muffins increased the extractability but decreased the molecular weight of β-
glucan. In their study, frozen storage decreased the extractability but did not change the
molecular weight of β-glucan. However, Lan-Pidhainy et al. (2007) reported that
repeated freezing and thawing reduced solubility of β-glucan, which in turn affected the
glycemic response. Åman et al. (2004) observed that yeast-leavened bread, muffins, and
other products like porridge and breakfast cereals retained higher molecular weight
when compared with its raw material. Kerckhoffs et al. (2003) also observed
depolymerization during bread production decreased the molecular weight of β-glucan.
Where there was prolonged treatment at lower temperatures and presence of wheat
flour, the β-glucan depolymerization is partially due to the β-glucanases activity of
wheat flour (Andersson et al., 2004; Andersson et al., 2008).
Earlier research has indicated that extrusion cooking also causes fragmentation of food
molecules such as starch and β-glucan. Extrusion-induced fragmentation may influence
the functionality and nutritional quality of these cell wall polysaccharides. Research has
been extended to investigate the effect of extrusion-induced fragmentation on the
molecular characteristics (size and chain length) and functionality of barley β-glucan.
The effect of extrusion cooking on fiber content and composition and on its

16
Chapter I
physicochemical characteristics depends on both the process parameters used
(temperature, pressure, shear forces, screw design) and on the composition of the
ingredients (Tiwari and Cummins, 2009).
However, food processing is also reported to increase the physiological activity of β-
glucan by increasing solubility (cooking, extrusion), although the molecular size of the
polymer may be partly reduced (due to enzymatic hydrolysis, milling, and pumping)
(Robertson et al., 1997; Izydorczyk et al., 2000). Similarly, Johansson et al. (2007)
reported an increasing of extractability in cooked porridges, while Beer et al. (1997b)
found that cooking of porridge did not affect the extractability or the molecular weight
of β-glucan.
1.4 Phenolic acids
1.4.1 Occurrence and molecular-structural characteristics of phenolic acids
Phenolic acids are the most common phenolic coumpounds that naturally occur in
whole-grain cereals, in addition to flavonoids (Gani et al., 2012). Phenolic compounds
may be defined as substances that possess an aromatic ring bearing one or more
hydroxyl (OH) substituents (Duodu et al., 2011). Phenolic acids are derivatives of
benzoic and cinnamic acids. Hydroxybenzoic acid derivatives include p-
hydroxybenzoic, protocatechuic, vanillic, syringic and gallic acids. Hydroxyl cinnamic
acid derivatives include p-coumaric, caffeic, ferulic and sinapic acids. A significant
proportion of these phenolic acids is known to be linked to lignans and arabinoxylans
(Nordkvist et al., 1984). Ferulic acid is highly concentrated in the cell walls of aleurone
layer that is rich in arabinoxylan (Maillard and Berset, 1999).
The phenolic acids reported in cereals occur in both free and insoluble-bound form.
Free phenolic acids are found in outer layer of the pericarp and are extracted using
17
Chapter I
organic solvents. Bound phenolic acids are esterified to cell wall polysaccharides; acid
or base hydrolysis is required to release these bound compounds from the cell matrix
(Dykes and Rooney, 2007). Phenolic acids can be esterified with small molecules such
as alcohols, other phenolic acids, phenols, and alkaloids, among others. Non-starch
polysaccharides such as xylose, and arabinose units may easily esterify with phenolic
acids. Phenolic acids with carboxyl and hydroxyl groups can bind either starch or other
polysaccharides through hydrogen bonds, chelation, or covalent bonds (Yu et al., 2001).
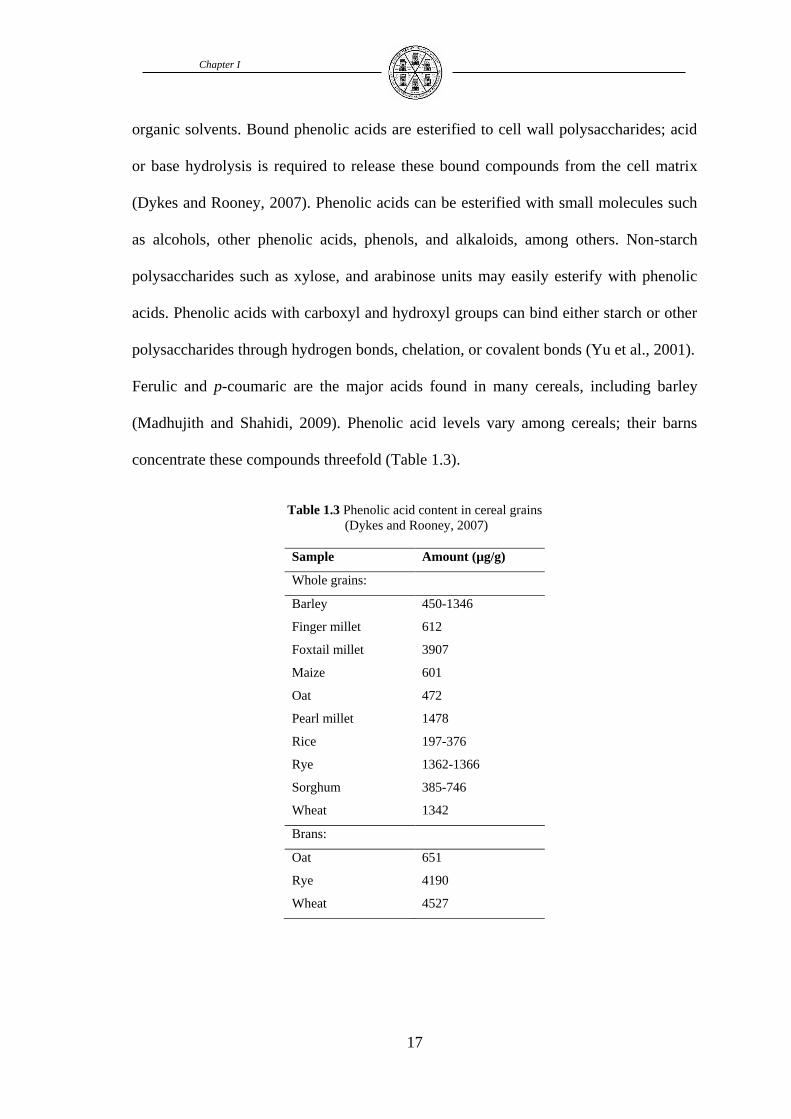
Ferulic and p-coumaric are the major acids found in many cereals, including barley
(Madhujith and Shahidi, 2009). Phenolic acid levels vary among cereals; their barns
concentrate these compounds threefold (Table 1.3).
Table 1.3 Phenolic acid content in cereal grains
(Dykes and Rooney, 2007)
Sample Amount (µg/g)
Whole grains:
Barley 450-1346
Finger millet 612
Foxtail millet 3907
Maize 601
Oat 472
Pearl millet 1478
Rice 197-376
Rye 1362-1366
Sorghum 385-746
Wheat 1342
Brans:
Oat 651
Rye 4190
Wheat 4527

18
Chapter I
1.4.2 Health benefits of phenolic acids
Phenolic compounds, including phenolic acids, in our diet provide health benefits
associated with reduced risk chronic diseases. Phenolic compounds have antioxidant
properties and protect against degenerative diseases like hearth diseases and cancer in
which reactive oxygen species i.e., superoxide anion, hydroxyl radicals and peroxyl
radicals are involved (Rhodes and Price, 1997). It is emerging that polyphenols may
have far more important effect in vivo such as enhancing endothelial function, cellular
signaling and anti-inflammatory properties (Sies et al., 2005; Ramos, 2008). Emerging
research has also suggested that undigested polyphenols associated with dietary fibre
may provide important protection at the intestinal environment level (Vitaglione et al.,
2008). However, whether the protective effect of polyphenols on health is via
antioxidant or other mechanisms, research strongly supports a positive relationship
between polyphenol intake and decreased risk of certain chronic diseases
(Weichselbaum and Buttriss, 2010).
Ferulic and p-coumaric acids, the most common phenolic acids in cereal grains, are
suggested to have antioxidant effect scavenging free radicals (Gani et al., 2012). They
are also able to chelate ions of transition metal thereby reducing the metals’ capacity to
generate free radicals in Fenton reaction (Leibovitz and Mueller, 1993).
Ferulic acid was shown as a chemoprotectant, which was thought to deter the process of
carcinogenesis by inhibiting the formation of N-nitroso-compounds (Kuenzig et al.,
1984). This compound is also able to prevent peroxynitrite-mediated nitration of
tyrosine residues in collagen thus implicating a chemoprotectant role for this antioxidant
in the prevention of tissue injury (Kato et al.,1997).
Coumaric acid also has been suggested to have antitumor activity against human
malignant tumors. Coumaric acid induces cytostasis and inhibits the malignant
19
Chapter I
properties of human tumor cells in vitro. A 50% reduction in the level of cell
proliferation was achieved by concentration ranging from 1-4.5 mmol/L. p-coumaric
acids have also potentially protective effect against heart diseases because of its ability
to decrease the resistance of low density lipoproteins (LDL), cholesterol oxidation, lipid
peroxidation and of apo-protein B100 (Garrait et al., 2006).
1.4.3 Processing impact on phenolic acids
A wide range of food processing methods are used to process cereal grains into a wide
variety of food products. Processing of cereals may enhance or reduce levels of
phenolic compounds in foods and this has implications for their bioactive properties and
potential health benefits they can offer.
In cereal grains phenolic compounds are concentrated in their outer layers (pericarp,
testa or seed coat) (Duodu, 2011). Therefore the decortication and milling process
reduce phenolic content and subsequently, antioxidant activity of the flours produced. In
general, the extent of reduction in phenolic content increases in direct proportion to the
extent of removal of the outer layers of the grain during decortication and refining
process of milling (Duodu, 2011; Ragaee et al., 2014).
Processing of food using heat is the most common method of food processing and
preservation. Apart from the preservation effect, thermal processing can influence other
quality aspects such as sensory, nutritive and phytochemical quality. Heat processing
can take up various forms including cooking, roasting, microwave heating and extrusion
cooking, to mention a few. The severity and mode of the thermal process also has a
bearing on the quality of the food. The literature seems to show that thermal processing
of grains may increase or decrease phenolic content and antioxidant activity. Cheng et
al. (2006) reported increases in phenolic acids such as ferulic, syringic, vanillic and p-

20
Chapter I
coumaric acids in wheat flour upon thermal treatment. It could be that thermal
processing of grains could bring about release of bound phenolics from the breakdown
of cellular components and cell walls. In this regard, increase in antioxidant activity of
thermally-processed sweet corn has been attributed to increase in solubilized ferulic
acid esters and release of bound phenolics from the cell matrix (Dewanto et al., 2002).
Fares et al. (2010) determined the effect of processing semolina into pasta and cooking
on phenolic acids profile and antioxidant properties of pasta samples enriched with
wheat debranning fractions and found both decreases and increases in phenolic content
due to processing. Specifically, there was a decrease of free phenolic acids in control
and wheat bran-enriched samples on processing semolina into pasta, mainly due to a
decrease in p-hydroxybenzoic acid. There was however no change in the bound
phenolic acid fraction. The results contradict those of Khan et al. (2013) who did not
report any decrease in the free phenolic acids during extrusion of pasta made from
durum wheat and sorghum flour.
However, Fares et al. (2010) found that cooking the pasta increased the levels of bound
phenolic acids with generally no variation in free phenolic acid levels. This is somewhat
in contrast with Zielinski et al. (2001) who reported increases in free and bound
phenolic acids after severe hydrothermal processing of some cereal grains. Conversely,
Verardo et al. (2011) reported a phenolic acid degradation in barley spaghetti after
cooking.
According to Fares et al. (2010), during pasta processing, oxygen, water and heat
treatment induce oxidative degradation of antioxidants including phenolics as suggested
by other authors (Borrelli et al., 1999). This may account for the observed decrease in
free phenolics on pasta processing which are considered to be more reactive than bound
phenolics in counteracting the effects of oxygen and heat. On the other hand, during

21
Chapter I
cooking, boiling water can enhance the release of bound phenolics from the food matrix
such as ferulic acid ester-linked to cell walls. This could increase bound phenolics
content and antioxidant activity.
Zielinski et al. (2001) reported the behavior of phenolic compounds present in selected
cereals (wheat, barley, rye, and oat) during extrusion cooking at different temperatures
(120, 160, 200◦C). They found that significant increases in phenolic acids content and
free and bound phenolic acids except for sinapic and caffeic acids were not detected in
the extruded grains. The highest content of free and bound phenolic acids was reported
in rye and oat. The changes in free phenolic acids were more pronounced when
compared to the bound ones. The liberated phenolic acids may contribute to the high
antioxidant potential of extrudates when they are considered as a dietary antioxidant.
Ferulic acid was found as a predominant compound in raw wholegrain as well as in
extruded grain.
Baking could result in an increase in the concentration of phenolic compounds of
wholegrain bread regardless of baking time (10, 20, or 35 minutes). Some studies
reported negligible changes in total phenolics caused by baking (Ragaee et al., 2014).
The effect of baking appeared to be dependent on type of baked product, type of
phenolic acids, recipe and baking conditions (Abdel-Aal and Rabalski, 2013). Moore et
al. (2009) reported enhanced antioxidant properties in whole wheat pizza crust
increasing baking temperature and time, and dough fermentation time. During
fermentation, the metabolic activities of microorganisms which also involves a variety
of enzyme activities have a significant effect on the chemical constituents of the food
including phenolic compounds and their bioactive properties. Such effects may include
binding of phenolos to other plant constituents such as proteins which makes these
phenolos unextractable or degradation of phenolos by microbial enzymes (Duodu,

22
Chapter I
2011). On the other hand, fermentation with Lactobacillus rhamnosus A71 and
Saccharomyces cerevisiae both increased total phenolic content and antioxidant activity
in barley grains (Đorđević et al., 2010).

23
Chapter I
Aims of PhD research activity
This PhD study aimed 1) to develop barley spaghetti rich in β-glucan as a functional
food with the use of waxy barley as a rich source of β-glucan, dietary fiber and
antioxidants; 2) to investigate chemical, molecular and rheological properties of waxy
barley individually and in blends with semolina; 3) to evaluate impact of processing
(extrusion, drying and cooking) on the concentration and physicochemical
characteristics (molecular weight and solubility) of β-glucan, as well as viscosity of the
developed pasta products; 4) to look into antioxidant properties and phenolic acid
composition of the developed pasta products.

24
Chapter I
References
AACC (2001). The definition of dietary fiber. Cereal Foods World, 46, 112-126.
Abdel-Aal, E.-S.M., and Gamel, T.H. (2008). Effects of selected barley cultivars and
their pearling fractions on the inhibition of human LDL oxidation in vitro using a
modified conjugated dienes method. Cereal Chemistry, 85, 730-737.
Abdel-Aal, E.-S.M., and Rabalski, I. (2013). Effect of baking on free and bound
phenolic acids in wholegrain bakery products. Journal of Cereal Science, 57, 312-
318.
Adom, K.K, Liu, R.H. (2002). Antioxidant activity of grains. Journal of Agricultural
and Food Chemistry, 62, 661-666.
Ǻman, P., and Newman, C. W. (1986). Chemical composition of some different
types of barley grown in Montana, USA. Journal of Cereal Science, 4, 133-141.
Åman, P., Rimsten, L., and Andersson R. (2004). Molecular weight distribution of β-
glucan in oat-based foods. Cereal Chemistry, 81, 356-360.
Andersson, A. A. M., Andersson, R., Autio, K., and Ǻman, P. (1999). Chemical
composition and microstructure of two naked wax barleys. Journal of Cereal
Science, 30, 183-191.
Andersson, A.A.M., Armö, E., Grangeon, E., Fredriksson, H., Andersson, R., and
Åman, P. (2004). Molecular weight and structure units of (1→3, 1→4)-β-glucans in
dough and bread made from hull-less barley milling fractions. Journal of Cereal
Science, 40, 195-204.
Andersson, A. A. M., Ruegg, N., and Åman, P. (2008). Molecular weight
distribution and content of water-extractable β-glucan in rye crisp bread. Journal of
Cereal Science, 47, 399-406.

25
Chapter I
Bhatty, R. S. (1997). Milling of regular and waxy starch hull-less barleys for the
production of bran and flour. Cereal Chemistry, 74, 693-699.
Beer, M.U., Wood, P.J., and Weisz J. (1997a). Molecular weight distribution and (1-
3)(1-4)-β-glucan content of consecutive extracts of various oat and barely cultivars.
Cereal Chemistry, 74, 476-480.
Beer, MU., Wood, P.J., Weisz, J., and Fillion, N. (1997b). Effect of cooking and
storage on the amount and molecular weight of (1→3),(1→4)-β-D-glucan extracted
from oat products by an in vitro digestion system. Cereal Chemistry, 74, 705-709.
Borrelli, G. M., Troccoli, A., Di Fonzo, N., and Fares, C. (1999). Durum wheat
lipoxygenase activity and other quality parameters that affect pasta color. Cereal
Chemistry, 76, 335–340.
Bourdon, I., Yokoyama, W., Davis, P., Hudson, C., Backus, R., Richter, D.,
Knuckles, B., and Schneeman, B. O. (1999). Postprandial lipid, glucose, insulin, and
cholecystokinin responses in men fed barley pasta enriched with b-glucan. The
American Journal of Clinical Nutrition, 69, 55-63.
Bourne, M. (2002). Food Texture and Viscosity: Concept and Measurement, 2nd ed.
San Diego, CA: Academic Press.
Brennan, C.S., and Cleary, L.J. (2005). The potential use of (1→3,1→4)-β-D-
glucans as functional food ingredients. Journal of Cereal Science, 42, 1-13.
Cavallero, A., Empilli, S., Brighenti, F., and Stanca, A.M. (2002). High (1-3, 1-4)-
beta glucan barley fractions in bread making and their effects on human glycemic
response. Journal of Cereal Science, 36, 59-66.
26
Chapter I
Cheng, Z., Su, L., Moore, J., Zhou, K., Luther, M., Yin, J. and Yu, L. (2006). Effects
of post harvest treatment and heat stress on availability of wheat antioxidants.
Journal of Agricultural and Food Chemistry, 54, 5623–5629.
Cui, W., Wood, P.J., Blackwell, B., and Nikiforuk, J. (2000). Physicochemical
properties and structural characterization by two-dimensional NMR spectroscopy of
wheat β-D-glucan—Comparison with other cereal β-D-glucans. Carbohydrate
Polymers, 41, 249-258.
Czuchajowska, Z., Klamczynski, A., Paszczynska, B., and Baik, B. K.(1998).
Structure and functionality of barley starches. Cereal Chemistry, 75, 747-754.
Davidson, M. H., Dugan, L. D., Burns, J. H., Bova, J., Story, K., and Drennan, K.B.
(1991). The hypocholesterolemic effects of b-glucan in oatmeal and oat bran: a dose-
controlled study. The Journal of the American Medical Association, 265, 1833-1839.
Degutyte-Fomins, L., Sontag-Strohm, T., and Salovaara, H. (2002). Oat bran
fermentation by rye sourdough. Cereal Chemistry, 79,345-348.
Dewanto, V., Wu, X. and Liu, R. H. (2002). Processed sweet corn has higher
antioxidant activity. Journal of Agricultural and Food Chemistry, 50, 4959-4964.
Dikeman, C. L., and Fahey, G. C. (2006). Viscosity as Related to Dietary Fiber: A
Review. Critical Reviews in Food Science and Nutrition, 46, 649-663.
Ðorđević, T.M., Šiler-Marinković, S.S., and Dimitrijević-Branković, S.I. (2010).
Effect of fermentation on antioxidant properties of some cereals and pseudo cereals.
Food Chemistry, 119, 957–963.
Duodu, K.G. (2011). Effects of processing on antioxidant phenolics of cereal and
legume grains. Pages 31-54. In: Awika, J.M., Piironen, V., Bean, S. (Eds.), Advances

27
Chapter I
in Cereal Science: Implications to Food Processing and Health Promotion. American
Chemical Society, Washington, DC.
Dykes, L. and Rooney, L.W. (2007). Phenolic compounds in cereal grains and their
health benefits. Cereal Food World, 53, 105-111.
FAO (2011). FAOSTAT Production – Crops. Food and Agriculture Organization of
the United Nations, Rome. http://faostat.fao.org/09 August 2011
Fares, C., Platani, C., Baiano, A., Menga, V. (2010). Effect of processing and
cooking on phenolic acid profile and antioxidant capacity of durum wheat pasta
enriched with debranning fractions of wheat. Food Chemistry, 119, 1023-1029.
Fastnaught, C. E. (2001). Barley fibre. Pages 519-542, In S. Cho, and M. Dreher
(Eds.), Handbook of dietary fibre. New York: Marcell Dekker.
Flores, R. A., Hicks, K. B., Eustace, D. W., and Phillips, J. (2005). Highstarch and
high b-glucan fractions milled with experimental mills. Cereal Chemistry, 82, 727-
733.
Fox, G. P., Nguyen, L., Bowman, J., Poulsen, D., Inkerman, A., and Henry, R. J.
(2007). Relationship between hardness genes and quality in barley (Hordeum
vulgare). Journal of the Institute of Brewing, 113, 87-95.
Gani, A., Wani, S.M., Masoodi, F.A., and Gousia, H. (2012). Whole-Grain Cereal
Bioactive Compounds and Their Health Benefits: A Review. Food Processing and
technology, 3, 146-155.
Garrait, G., Jarrige, J.F., Blanquet, S., Beyssac, E., Cardot, J.M., et al. (2006).
Gastrointestinal absorption and urinary excretion of trans-cinnamic and p-coumaric
acids in rats. Journal of Agricultural and Food Chemistry, 54, 2944-2950.

28
Chapter I
Goupy, P., Hugues, M., Boivin, P., and Amiot, M.J. (1999). Antioxidant composition
and activity of barley (Hordeum vulgare) and malt extracts and of isolated phenolic
compounds. Journal of Agricultural and Food Chemistry, 79, 1625-1634.
Hernanz, D., Nunez, V., Sancho, A. I., Faulds, C. B., Williamson, G., Bartolome, B.
and Gomez-Cordove, C. (2001). Hydroxycinnamic acids and ferulic acid
dehydrodimers in barley and processed barley. Journal of Agricultural and Food
Chemistry, 49, 4884-4888.
Hofmann, A. (1994). Intestinal absorption of bile acids and biliary constituents. The
intestinal component of the enterohepatic circulation and the integrated system.
Pages 1845-1865, In Physiology of the Gastrointestinal Tract, 3rd ed.; Johnson, L.
R., Ed.; Raven Press: New York.
Izydorczyk, M.S., and Biliaderis, C.G. (2000). Structural and functional aspects of
cereal arabinoxylans and b-glucans. Pages 361-384, In G. Doxastakis, and V.
Kiosseoglou (Eds.), Novel macromolecules in food systems. Amsterdam: Elsevier.
Izydorczyk, M. S., Jacobs, M., and Dexter, J. E. (2003). Distribution and structural
variation of non-starch polysaccharides in milling fractions of hull-less barley with
variable amylose content. Cereal Chemistry, 80, 645-653.
Izydorczyk M. S., & Dexter J. E. (2008). Barley β-glucans and arabinoxylans:
Molecular structure, physicochemical properties, and uses in food products-a
Review. Food Research International, 41, 850-868.
Johansson, L., Toumainen, P., Anttila, H., Rita, H., and Virkki L. (2007). Effect of
processing on the extractability of oat β-glucan. Food Chemistry, 105, 1439-1445.

29
Chapter I
Kahkonen, M.P., Hopia, A.I., Vuorela, H.J., Rauha, J.-P., Pihlaja, K., Kujala, T.S.,
and Heinonen, M. (1999). Antioxidant activity of plant extracts containing phenolic
compounds. Journal of Agricultural and Food Chemistry, 47, 3954-3962.
Kato, Y., Ogino, Y., Aoki, T., Uchida, K., Kawakishi, S., and Osawa, T. (1997).
Phenolic antioxidants prevent peroxynitrite-derived collagen modification in vitro.
Journal of Agricultural and Food Chemistry, 45, 3004-3009.
Kerckhoffs, D.A.J.M., Hornstra, G., and Mensink, R.P. (2003). Cholesterol lowering
effect of β-glucan from oat bran in mildly hypercholesterolemia subjects may
decrease when β-glucan is incorporated into bread and cookies. American Journal of
Clinical Nutrition, 78, 221-227.
Khan, I., Yousif, A., Johnson, S.K., and Gamlath, S. (2013). Effect of sorghum flour
addition on resistant starch content, phenolic profile and antioxidant capacity of
durum wheat pasta. Food Research International, 54, 578-586.
Knuckles, B.E., Hudson, C.A., Chiu, M.M., and Sayre R.N. (1997). Effect of β-
glucan barely fractions in high-fiber bread and pasta. Cereal Foods World, 42, 94-99.
Kuenzig, W., Chau, J., Holowaschenko, H., Newmark, H., Mergens, W., and
Conney, A. H. (1984). Caffeic and ferulic acid as blockers of nitrosoamine
formation. Carcinogenesis, 5, 309-313.
Lambo, A.M, Öste, R., and Nyman, M.E.G.-L. (2005). Dietary fibre in fermented oat
and barley β-glucan rich concentrates. Food Chemistry, 89, 283-293.
Lan-Pidhainy, X., Brummer, Y., Tosh, S. M., Wolever, T.M.S., and Wood, P.J.
(2007). Reducing β-glucan solubility in oat bran muffins by freeze-thaw treatment
attenuates its hypoglycemic effects. Cereal Chemistry, 84, 512-517.
Larson, R.A. (1988). The antioxidants of higher plants. Phytochemistry, 27, 969-978.

30
Chapter I
LaRusso, N. (1983). The role of bile acids in intestinal absorption of cholesterol,
Pages 183-199, In Bile Acids in Gastroenterology; Barbara, L., Dowling, R.H.,
Hofmann, A.F., Roda, E., Eds.; MTP Press Ltd.: Boston, MA.
Lazaridou A., and Biliaderis C.G. (2007). Molecular aspects of cereal beta-glucan
functionality: physical properties, technological applications and physiological
effects. Journal of Cereal Science, 46, 101-118.
Leibovitz, B.E., and Mueller, J.A. (1993). Bioflavonoids and polyphenols: medical
applications. Journal of Optimal Nutrition, 2, 17-35.
Lev-Yadun, S., Gopher, A., and Abbo, S. (2000). The Cradle of Agriculture, Science,
288, 1602-1603.
Lia, A, Andersson, H., Kekki, N., Juhel, C., Senft, M., and Lairon, D. (1997).
Postprandial lipemia in relation to sterol and fat excretion in ileostomy subjects given
oat-bran and wheat test meals. American Journal of Clinical Nutrition, 66, 357-365.
Liu, S., Stampfer, M. J., Hu, F. B., Giovannucci, E., Rimm, E., Manson, J. E., et al.
(1999). Wholegrain consumption and risk of coronary heart disease: results from the
nurses’ health study. American Journal of Clinical Nutrition, 70, 412-419.
MacGregor, A. W., and Fincher, G. B. (1993). Carbohydrates of the barley grain,
Pages 73-130, In A. W. MacGregor, & R. S. Bhatty (Eds.), Barley: Chemistry and
technology. St Paul, MN: American Association of Cereal Chemistry.
Madhujith, T. and Shahidi, F. (2009). Antioxidant potential of barley as affected by
alkaline hydrolysis and release of insoluble-bound phenolics. Food Chemistry, 117,
615-620.
31
Chapter I
Maillard, M.N., and Berset, C. (1999). Evolution of antioxidant activity during
kilning: Role of insoluble-bound phenolic acids of barley and malt. Journal of
Agricultural and Food Chemistry, 43, 1789-1793.
Mälkki, Y., and Virtaten, E. (2001). Oat fibre: production, composition, physico-
chemical properties, physiological effects, safety, and food applications. Pages 497-
517 In: CHO, S. S. and Dreher, M. (Eds), Handbook of Dietary fiber. New York:
Marcel Dekker, Inc.
Marconi, E., Graziano, M., and Cubadda, R. (2000). Composition and utilization of
barley pearling by products for making functional pasta rich in dietary fibre and b-
glucans. Cereal Chemistry, 77, 133-139.
McDonald, D.E., Pethick, D.W., Mullan, B.P., and Hampson, D.J. (2001). Increasing
viscosity of the intestinal contents alters small intestinal structure and intestinal
growth, and stimulates proliferation of enterotoxigenic Escherichia coli in newly-
weaned pigs. British Journal of Nutrition, 86, 487-498.
Moore, J., Luther, M., Cheng, Z. and Yu, L. (2009). Effects of baking conditions,
dough fermentation, and bran particle size on antioxidant properties of whole wheat
pizza crusts. Journal of Agricultural and Food Chemistry, 57, 832–839.
Morrison,W. R. (1993). Barley lipids. Pages 199-246 In A.W. MacGregor, and R. S.
Bhatty (Eds.), Barley: Chemistry and technology. St. Paul, MN: American
Association of Cereal Chemistry.
Newman, C.W., and Newman, R.K. (2005). Hulless barley for food and feed.
Pages167-200 in: Specialty grains for food and feed. St Paul, MN: American
Association of Cereal Chemistry.

32
Chapter I
Nordkvist, E., Salomonsson, A.-C., and Åman, P. (1984). Distribution of insoluble
bound phenolic acids in barley grain. Journal of the Science of Food and Agriculture,
35, 657-661.
Owen, B. D., Sosulski, D., Wu, K. K., and Farmer, J. J. (1977). Variation in mineral
content in Saskatchewan feed grains. Canadian Journal of Animal Science, 57, 679-
687.
Panfili, G., Fratianni, A., Di Criscio, T., and Marconi, E. (2008). Tocol and b-glucan
levels in barley varieties and in pearling by-products. Food Chemistry, 107, 84-91.
Quinde, Z., Ullrich, S. E., and Baik, B. K. (2004). Genotypic variation in colour and
discolouration potential of barley-based food products. Cereal Chemistry, 81, 752-
758.
Ragaee S., and Abdel-Aal, E.M. (2006). Pasting properties of starch and protein in
selected cereals and quality of their food products. Food Chemistry, 95, 9-18.
Ragaee, S., Seetharaman, K., and Abdel-Aal, E-S.M. (2014). Impact of milling and
thermal processing on phenolic compounds in cereal grains. Critical Reviews in
Food Science and Nutrition, 54, 837-849.
Ramos, S. (2008). Cancer chemoprevention and chemotherapy: dietary polyphenols
and signalling pathways. Molecular Nutrition and Food Research, 52, 507-526.
Regand, A., Tosh, S.M., Wolever, T.M.S., and Wood, P.J. (2009). Physicochemical
properties of β-glucan in differently processed oat foods influence glycemic
response. Journal of Agricultural and Food Chemistry, 57, 8831-8838.
Rhodes, M.J. and Price, K.R. (1997). Identification and analysis of plant phenolic
antioxidants. European Journal of Cancer Prevention, 6, 518-521.
33
Chapter I
Robertson, J.A., Majasak-Newman, G., Ring, S.G., and Selvendran, R.R. (1997).
Solubilisation of mixed linkage (1→3),(1→4)- β-D-glucan from barley: effects of
cooking and digestion. Journal of Cereal Science, 25, 275-283.
Savin, R., Stone, P. J., Nicolas, M. E., and Wardlaw, I. F. (1997). Grain growth and
malting quality of barley. 1. Effects of heat stress and moderately high temperature.
Australian Journal of Agricultural Research, 48, 615-624.
Sies, H., Schewe, T., Heiss, C., and Kelm, M. (2005). Cocoa polyphenols and
inflammatory mediators. American Journal of Clinical Nutrition, 81, 304S-312S.
Sullivan, P., O’Flaherty, J., Brunton, N., Gee, V. L., Arendt, E., and Gallagher, E.
(2010). Chemical composition and microstructure of milled barley fractions.
European Food Research and Technology, 230, 579-595.
Sullivan, P., Elke Arendt, E., and Gallagher, E. (2013). The increasing use of barley
and barley by-products in the production of healthier baked goods. Trends in Food
Science and Technology, 29, 124-134.
Swanston, J.S. (1997). Waxy Starch Barley Genotypes with Reduced β-Glucan
Contents. Cereal Chemistry, 74, 452-455.
Thompson, L.U. (1994) Antioxidants and hormone-mediated health benefits of
whole grains. Critical Reviews in Food Science and Nutrition, 34, 473-497.
Tiwari, U. and Cummins, E. (2009). Factors influencing β-glucan levels and
molecular weight in cereal-based products. A review. Cereal Chemistry, 86, 290-
301.
van Amelswoort, J. M. M., and Westrate, J. A. (1992). Amylose-amylopectin ratio in
a meal affects postprandial variables in male volunteers. American Journal of
Clinical Nutrition, 55, 712-718.

34
Chapter I
Verardo, V., Gòmez-Caravaca, A.M., Messia, M.C., Marconi, E. and Caboni, M.F.
(2011). Development of functional spaghetti enriched in bioactive compounds using
barley coarse fraction obtained by air classification. Journal of Agricultural and
Food Chemistry, 59, 9127-9134.
Virkki, L., Johansson, L., Ylinen, M., Manau, S., and Ekholm, P. (2004). Structural
characterization of water-insoluble non-starchypolysaccharides of oats and barley.
Carbohydrate Polymers, 59, 357-366.
Vitaglione, P., Napolitano, A., and Foliano, V. (2008). Cereal dietary fiber, a natural
functional ingredient to deliver phenolic compounds in the gut. Trends in Food
Science and Technology, 19, 451-461.
Weichselbaum, E, and Buttriss, J.L. (2010). Polyphenols in the diet. Nutrition
Bulletin, 35, 157-164.
Wikstrom, K., Lindahl, L., Andersson, R., and Westerlund, E. (1994). Rheological
studies of water-soluble (1→3),(1→4)-β-D-glucans from milling fractions of oat.
Journal of Food Science, 59, 1077-1080.
Wood, P.J., Weisz, J., Fedec, P., and Burrows, V.D. (1989). Large-scale preparation
and properties of oat fractions enriched in (1→3),(1→4) β-D-glucan. Cereal
Chemistry, 66, 97-103.
Wood, P.J., Braaten, T.J., Scott, F.W., Riedel K.D., Wolynetz M.S., and Collins,
M.W. (1994). Effect of dose and modification of viscous properties of oat gum on
plasma glucose and insulin following an oral glucose load. British Journal of
Nutrition, 72, 731-743.

35
Chapter I
Wood, P.J. (2002). Relationships between solution properties of cereal β-glucans and
physiological effects: a review. Trends in Food Science and Technology, 13, 313-
320.
Wood, P.J. (2007). Cereal beta-glucans in diet and health. Journal of Cereal Science,
46, 230-238.
Würsh, P., and Pi-Sunyer, F.X. (1997). The role of viscous soluble fiber in the
metabolic control of diabetes. A review with special emphasis on cereals rich in β-
glucan. Diabetes Care, 20, 1774-1780.
Yokoyama, W.H., Hudson, C.A., Knuckles, B.E., Chiu, M.C.M., Sayre R.N.,
Turnlund J.R., and Schneemam B.O. (1997). Effect of barley β-glucan in durum
wheat pasta on human glycemic response. Cereal Chemistry, 74, 293-296.
Yu, J., Vasnathan, T., and Temelli, F. (2001). Analysis of phenolics acids in barley
by high performance liquid chromatography. Journal of Agricultural and Food
Chemistry, 49, 4352-4358.
Zielinski, H., Kozlowska, H., and Lewczuk, B. (2001). Bioactive compounds in the
cereal grains before and after hydrothermal processing. Innovative Food Science and
Emerging Technologies, 2, 159-169.

CHAPTER II
Effect of pasta processing on beta-glucan physicochemical
properties of barley and semolina pastas

37
Chapter II
Abstract
Nutritional studies into beta-glucan have shown a link between its regular consumption and
a number of health benefits, including a decrease in the risk of chronic heart disease by
lowering blood cholesterol and an increased insulin response in diabetics. Functional and
nutritional properties of β-glucan are correlated with their concentration, molecular weight,
and structure. Various food processing techniques can have a negative or positive impact
on the level and molecular weight of β-glucan in the end product. Viewing the importance
of β-glucan, waxy barley flour rich in β-glucan (10%, d.b) was used to produce barley func-
tional spaghetti, which was compared to semolina spaghetti. The impact of processing (ex-
trusion, drying and cooking) on physicochemical properties of barley blends, and pastas as
well as molecular characterization of β-glucan, were investigated. The barley spaghetti
reached the Food and Drug Administration (FDA) and European Food Safety Authority
(EFSA) requirements of β-glucan content (0.75-1.0g/serving), which could allow these pas-
tas to warrant the health claims “may reduce the risk of heart disease” and “contributes to
the maintenance of normal blood cholesterol levels”, respectively. Pasta processing did not
significantly affect the amount of β-glucan, but it impacted the β-glucan physicochemical
properties in the end products. In all pastas, extrusion and drying were detrimental to the β-
glucan properties, while cooking significantly increased the extractability and molecular
weight of β-glucan, and in turn the viscosity, which is associated with physiological effec-
tiveness. Cooked pastas containing 30% of barley flour (w/w) showed the lowest value of
β-glucan content, but the highest value of viscosity between barley pastas, indicating that
viscosity cannot be explained by β-glucan content only. In general, replacing wheat semo-

38
Chapter II
lina with barley flour rich in β-glucan (even if moderate amounts), it will be able to produce
barley pastas which have enhanced β-glucan properties and related health benefits.

39
Chapter II
2.1 Introduction
Whole cereal grains, including barley, are an excellent source of bioactive substances (phy-
tochemicals) such as healthy dietary fiber, particularly β-glucan. Consequently, they are
gaining renewed interest as an ingredient for the production of functional foods, such as
pasta, bakery products, flakes, snacks, etc., which are common components of human diet.
The mixed linkage (1-3, 1-4)-β-D-glucan, commonly referred to as β-glucan, is classified as
a soluble dietary fiber (AACC, 2001) and is a major component of the cell walls of barley
and oat endosperm. The β-glucan content of cereals ranges mostly from about 5-11% in
barley and 3-7% in oats (Skendi et al., 2003), to 2% in rye (Ragaee et al., 2001) and <0.5%
in wheat grains (Beresford and Stone, 1983). Although consumption of rye has beneficial
effects, barley and oats are the primary sources of β-glucan in the human diet, but their lev-
els can vary dramatically between varieties.
β-glucan has been found to be effective in attenuating postprandial blood glucose and insu-
lin, and in lowering blood lipids, especially serum total and LDL-cholesterol (Wood, 2002;
Cavallero et al., 2002; Yokoyama et al., 1998). The documented relationship between con-
sumption of foods rich in soluble fiber, especially β-glucan, and reducing the risk of heart
disease led to the first health claim for a specific food by the Food and Drug Administration
(FDA, 1997). In particular, the physiological role of β-glucan in reducing glycemic re-
sponses has been mostly associated with its capacity to increase viscosity in solution at low
concentration in the upper digestive tract, a property of soluble high molecular weight pol-
ysaccharides (Wood et al., 1994; Dikeman and Fahey, 2006). The viscosity of β-glucan de-
pends on its concentration and molecular weight, which in turn are dependent on its ex-
tractability and solubility (Tosh et al., 2008). Molecular weight and solubility of β-glucan

40
Chapter II
are affected by genotype, environment, agronomic input, and the interactions of these fac-
tors and food processing methods (Tiwari and Cummins, 2009). Available literature (Buck-
eridge et al., 2004; Tiwari and Cummins, 2009) reveals that the level of β-glucan in a fin-
ished product (e.g. bread, cake, muffins) depends upon several factors in the production
chain, whereas food processing operations are mainly affecting molecular weight and solu-
bility of β-glucan (Wood et al., 1989; Izydorczyk et al., 2000; Regand et al., 2009).
There has been much speculation and insufficient investigation over the years concerning
the effects of processing on the physicochemical characteristics of β-glucan incorporated
into food products. This speculation has frequently supposed that processing would be det-
rimental to bioactivity. Thus, processing may affect the molecular (chemical structure and
degree of polymerisation), structural (molecular interactions) and functional properties
(viscosity, water binding capacity and solubility) which, in turn, could affect the sensory,
physiological and ultimately the health benefits of β-glucan. Changes in the properties of β-
glucan may arise from shearing damage due to mechanical processing (Wood et al., 1989),
or by excessive heat treatment of food products.
The current study aimed at developing barley pasta rich in β-glucan able to satisfy the FDA
(0.75 g of β-glucan per serving, 2006) and EFSA (≥ 1g of β-glucan per quantified portion,
2011) health claim requirements. Pastas were made from waxy barley as a rich source of
soluble dietary fiber, individually and in blends with semolina. A preliminary study of the
pasting properties of barley and semolina flour blends was carried out in order to under-
stand the contribution of β-glucan to viscosity of raw materials and end products. The
health benefits are controlled by the solubility and molecular weight of β-glucan, that in
turn affect the final viscosity of the product in the gut (Wood et al. 1994). Thus, the impact

41
Chapter II
of processing (extrusion, drying and cooking) on the concentration and physicochemical
properties of the flours and blends, and molecular characterization of β-glucan, as well as
viscosity of the developed pasta products was evaluated.

42
Chapter II
2.2 Materials and Methods
2.2.1 Materials
The two-rowed, hulless, waxy barley cultivar (CDC Fibar) was selected based on its high
β-glucan content (Gray et al., 2009) and obtained from the University of Saskatchewan
(Saskatoon, Saskatchewan, Canada). The 6 six-rowed, hulled, normal barley (Celebrity)
was provided by a Canadian supplier.
The samples for investigation were provided in 25 kg and a 6 kg representative sample of
each cultivar was obtained from the original seed bags. Commercial durum wheat semoli-
na, xanthan gum (El Peto Products), annato food colour (Calico), sea salt (Life stream)
were bought from a local store in Guelph (ON, Canada).
CDC Fibar grain was ground using a cyclone Sample Mill (UDY Corp., Fort Collins,
CO,USA) equipped with a 0.5 mm screen. The barley flour and semolina were refrigerated
until pasta preparation.
Microbial α-amylase thermostable (for TDF and Starch Assay; 100ml; 3.000 U/ml; 45
U/mg) and pancreatin from porcine pancreas was purchased (P7545, activity equiv. 8×
USP) from Megazyme International (Ireland) and Sigma-Aldrich (Canada), respectively.
2.2.2 Pasta preparation
Barley flour (CDC Fibar) was blended with different amounts of semolina (100, 50, 30 g
barley flour/100g of semolina) subsequently referred to as 100% barley flour, 30% barley
flour, 50% barley flour. Durum wheat semolina pasta (100% semolina) was made as a con-
trol. Salt, xanthan gum and annatto solution were added to flours to improve flavor, texture
43
Chapter II
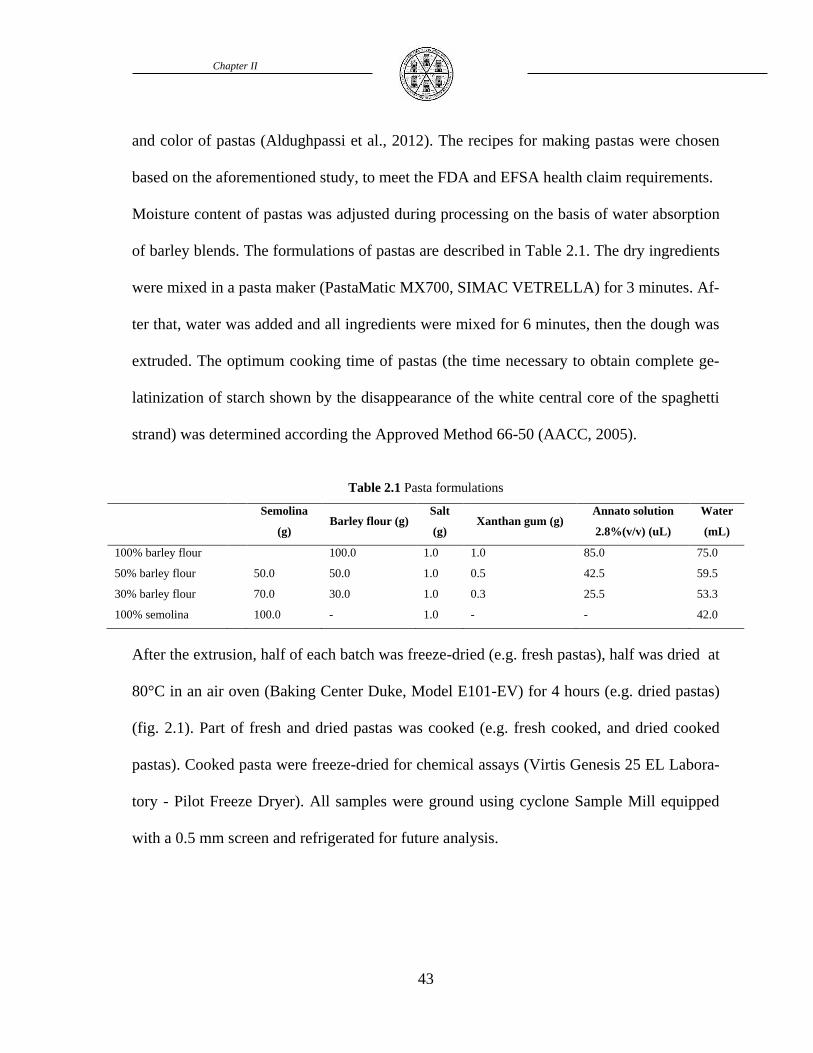
and color of pastas (Aldughpassi et al., 2012). The recipes for making pastas were chosen
based on the aforementioned study, to meet the FDA and EFSA health claim requirements.
Moisture content of pastas was adjusted during processing on the basis of water absorption
of barley blends. The formulations of pastas are described in Table 2.1. The dry ingredients
were mixed in a pasta maker (PastaMatic MX700, SIMAC VETRELLA) for 3 minutes. Af-
ter that, water was added and all ingredients were mixed for 6 minutes, then the dough was
extruded. The optimum cooking time of pastas (the time necessary to obtain complete ge-
latinization of starch shown by the disappearance of the white central core of the spaghetti
strand) was determined according the Approved Method 66-50 (AACC, 2005).
Table 2.1 Pasta formulations
After the extrusion, half of each batch was freeze-dried (e.g. fresh pastas), half was dried at
80°C in an air oven (Baking Center Duke, Model E101-EV) for 4 hours (e.g. dried pastas)
(fig. 2.1). Part of fresh and dried pastas was cooked (e.g. fresh cooked, and dried cooked
pastas). Cooked pasta were freeze-dried for chemical assays (Virtis Genesis 25 EL Labora-
tory - Pilot Freeze Dryer). All samples were ground using cyclone Sample Mill equipped
with a 0.5 mm screen and refrigerated for future analysis.
Semolina
(g) Barley flour (g)
Salt
(g) Xanthan gum (g)
Annato solution
2.8%(v/v) (uL)
Water
(mL)
100% barley flour 100.0 1.0 1.0 85.0 75.0
50% barley flour 50.0 50.0 1.0 0.5 42.5 59.5
30% barley flour 70.0 30.0 1.0 0.3 25.5 53.3
100% semolina 100.0 - 1.0 - - 42.0

44
Chapter II
Figure 2.1 Developed pasta products
2.2.3 Chemical analyses
Moisture content of raw ingredients and pastas was determined according the standard
methods as outlined in the AACCI Method 44-15 (AACCI 2010). Total β-glucan content of
samples was determined using the AACCI Method 32-23 (AACCI 2010). For this method,
β-glucan is hydrolyzed to D-glucose with lichenase and β-glucosidase.

45
Chapter II
2.2.4 Physicochemical properties of raw materials and pastas
2.2.4.1 Pasting properties of flours
Pasting properties of barley flour, semolina and their blends were measured on a Rapid
Visco Analyser (RVA-4) (AACC, 2005), using the RVA General Pasting Method (Newport
Scientific Pty. Ltd., Warriewood, Australia). A sample of 3.5 g of flour (14% moisture ba-
sis) was transferred into a canister and approximately 25 ± 0.1 ml distilled water was added
(corrected based on 14% moisture basis). The slurry was heated to 50°C and stirred at 160
ppm for 10 s for thorough dispersion. The slurry was held at 50°C for up to 1 min, and then
heated to 95°C over 7.3 min and held at 95°C for 5 min, and finally cooled to 50°C over 7.7
min. The pasting temperature (the temperature where viscosity first increases by at least 25
cP over a 20 s period), peak time (the time at which peak viscosity occurred), peak viscosi-
ty (the maximum hot paste viscosity, PV), holding strength or trough viscosity (the trough
at the minimum hot paste viscosity, TV), final viscosity (the viscosity at the end of test af-
ter cooling to 50°C and holding at this temperature, FV), breakdown (peak viscosity-
holding strength or trough viscosity, BD) and setback (final viscosity-holding strength, SB)
were calculated from the pasting curve, using Thermocline version 2.2 software Newport
Scientific Pty. Ltd. (Warriewood, Australia). All RVA experiments were run in duplicate
and the coefficient of variation of viscosity properties was less than 10% at any value.
2.2.4.2 RVA Method for Viscosity Measurement of β-glucan in pasta
To produce slurries, an amount of milled sample containing 1.0% β-glucan amount was
weighed into an RVA canister. A volume of 20 mM sodium phosphate buffer (pH 6.9) con-
taining 10 mM NaCl, equal to 25 mL minus the moisture present in the sample, was added

46
Chapter II
to the RVA canister. All the digestive enzymes were added to the canister at the beginning
of the run in the following amounts: 100 μL of thermostable microbial amylase and 600 μL
of pancreatin (0.5 mg/mL in sodium phosphate buffer, pH 6.9), as used in the in vitro di-
gestion protocol (Gamel et al., 2012). The RVA (RVA-4, Newport Scientific, Warriewood,
Australia) equipped with Thermocline software version 2.2 for Windows was held constant
at 37°C, and mixing speed was set at 480 rpm for 10 sec followed by 2 hr at 160 rpm. Vis-
cosity was recorded every 8 sec, and the final viscosity was noted at the end of 2 hr, when a
plateau of the final segment of viscosity curve was achieved. Viscosity of samples was
measured at 37°C for 2 h to mimic human body temperature.
2.2.4.3 Viscosity Measurement with a Controlled-Strain Rheometer
The viscosity of pasta sample extracts (after centrifugation at 8,000 × g for 10 min) was
measured with a controlled-strain rheometer (ARES, TA Instruments, New Castle, DE). Up
and down shear ramps were conducted over a shear rate range of 0.1–400 sec–1 at 37°C
with a cone-and-plate geometry (angle of 0.04 radians, diameter of 50 mm). Apparent vis-
cosity was recorded at the shear rate of 30 sec–1 on the down cycle, primarily for consisten-
cy with earlier publications.
Gamel et al. (2012) reported highly significant Pearson correlation between the RVA meth-
od and a specific in vitro extraction protocol for barley, especially at a 1% β-glucan level.
2.2.4.4 Characterization of β-Glucan Solubilized at 37°C
The peak molecular weight (Mp) of β-glucan was determined using high-performance size-
exclusion chromatography (HPSEC) with postcolumn calcofluor addition as described by

47
Chapter II
Wood et al. (1991) but using two columns (300 x 7.5 mm) in series of Shodex OHpak
KB806 M (J. M. Science Inc., Grand Island, NY) and Waters Ultrahydrogel (Waters, Mil-
ford, MA). The columns were maintained at 40°C and eluted with 0.1M tris buffer at
1mL/min using a Shimadzu 10ATVP pump. A Perkin- Elmer ISS 100 autosampler and in-
jector were used with an injection volume of 100 μL. Postcolumn, the eluant was mixed 1:1
with 20 mg/L of calcofluor in 0.1 M tris buffer (pH 8.0) using a Waters model 590 Pump.
The fluorescence was measured using an RF-10AXL fluorescence detector (excitation, 360
nm; emission, 540 nm). β-Glucan molecular weight (MW) of the standards was determined
essentially as described also by Wang et al. (2003).
To determine the solubility of the β-glucan at 37°C, the concentration in the extract (ce) was
determined using flow injection analysis (FIALab Instruments, Bellevue, WA) essentially
as described by Jørgensen (1988). A standard curve was prepared by solubilizing pure β-
glucan (Megazyme International) in water (1 mg/mL) at 90°C for 2 h and diluting to con-
centrations from10 to 100 μg/mL. The extracts were diluted with water to give β-glucan
concentrations in the same range. The standards and extracts were mixed 1:1 with 50 mg/L
Calcofluor solution (in 0.1M Tris-HCl, pH 8.0) in the FIA, and the fluorescence intensity
was measured (excitation, 360 nm; emission, 450 nm). The percent extractable (solubil-
ized) β-glucan was calculated from the two values (% soluble β-glucan = soluble β-
glucan/total β-glucan x 100). Triplicate measurements were made on each of the superna-
tants.

48
Chapter II
2.2.5 Statistical analysis
All analyses were carried out in duplicate or triplicate, and the data were reported as means
± standard deviation (SD). The data were subjected to least significant difference (LSD)
tests and principal component analysis (PCA) with PASW 18 (SPSS, Chicago, IL) to iden-
tify relationships between barley pastas and processing. Differences were considered to be
significant when P < 0.05.

49
Chapter II
2.3 Results and discussion
2.3.1 Pasting properties of raw ingredients
The contribution of β-glucan to pasting was demonstrated by the significant decrease of ap-
parent viscosity after enzymatic degradation of β-glucan with lichenase (Wood, 2007).
Based on these remarks, a preliminary study of the pasting properties as measured by a
Rapid Visco Analyzer (RVA) was performed to investigate the flours individually and in
blends with potential higher health benefits. Moreover, the contribution of xanthan gum
and gluten to pasting properties was evaluated.
Table 2.2 and fig. 2.2 show the RVA pasting properties of normal and waxy barley flours,
and semolina individually and in blends, with and without addition of xanthan gum and
gluten. The shape of the pasting curve differed depending on type of cereal flours and for-
mulations. In particular, the cereal samples tested showed different behaviour during heat-
ing, holding and cooling cycles in excess of water. Semolina, waxy and normal barley flour
had only one peak viscosity (PV) at different pasting temperatures and peak times, while
waxy barley flour in blend with semolina had double peak viscosities. The PV provides an
indication of the viscous load. Waxy and normal barley had higher peak viscosities (3579
cP and 3585 cP, respectively) compared to that of semolina (1493cP). This might be due to
the lower quantity of free water during the heating, partially induced by β-glucan. The im-
portant effect of β-glucan component on the pasting properties of barley has been reported
(Glennie-Holmes, 1995), because it would greatly compete for water during pasting. Be-
sides β-glucan, other molecules (such as starch, proteins, lipids, and arabinoxylans) and
their interactions are responsible for changes of peak viscosity. The amylose content ap-
pears to play a critical role in determining pasting properties using RVA (Gupta et al.,

50
Chapter II
2009). At lower amylose content, the structure of starch gel is easily disrupted by heating.
Amylose suppresses swelling and maintains the integrity of swollen starch granules (Her-
mansson and Svergmark, 1996). Since starch swelling is mainly a property of amylopectin
(Tester and Morrison, 1990), waxy starch swells rapidly and swollen granules degrade at
lower temperature, indicating that waxy starch rapidly develops viscosity. This could ex-
plain the lower pasting temperature and shorter peak time of whole waxy barley (55°C and
5.7 min) than normal barley (76°C and 9.4 min) and semolina (85°C and 8.8 min), which
had a higher amylose content. When 1% of xanthan gum was added to waxy barley flour,
the highest PV was obtained (more than 5% of gluten was added).
The double-peak viscosities of all flour blends showed up at pasting time and temperature
of amylopectin (first peak) and amylose (second peak). Our results were consistent with
those of literature (Gupta et al., 2009; Hatcher et al., 2005). The association between amyl-
ose and amylopectin molecules in mixed flour was different from that of individual starch-
es, which induced specific chain interactions (between molecules, starch granules, swollen
granules, and granules fragments) during heating, and each starch gelatinized independently
of the other, thus providing double-peak viscosities (Gupta et al., 2009).
During the holding period of the viscosity test, the material slurries are subjected to high
temperature and mechanical share stress with further disrupt in starch granules in the
grains, resulting in amylose leaching out and alignment (Ragaee and Abdel-Aal, 2006).
This period is commonly associated with a breakdown (BD) in viscosity. High values of
breakdown are associated with high peak viscosities, which in turn, are related to the degree
of swelling the starch granules during heating. More starch granules with a high swelling
capacity result in a higher peak viscosity, such as in the waxy barley flour, which had a
51
Chapter II
higher peak viscosity and breakdown than normal barley and semolina. The BD is related
to the ability of starches to withstand heating at high temperatures.
During the cooling, re-association between starch molecules, especially amylose, will result
in the formation of a gel structure and, therefore, viscosity will increase to a final viscosity
(FV). This phase is commonly described as the setback region and is related to retrograda-
tion and reordering of starch molecules. The low setback values indicate low rate of starch
retrogradation and syneresis. For semolina, waxy and non-waxy barley flours final viscosi-
ty was 2460 cP, 2114 cP, and 3852 cP, while setback values were 1397 cP, 1028 cP, and
2271 cP, respectively. This suggests that starch with lower amylose content (waxy barley)
decreased the amount of leached out amylose, suppressing viscosity during cooling. The
PV, BD and FV values of semolina control were similar to those found by Güler et al.
(2002), showing the consistence of our results.
The results of RVA pasting properties indicated that the addition of xanthan gum (1%) to
waxy barley flour increases the peak viscosity and, thus, the potential human health bene-
fits. Additionally, pasting properties could help to determine the replacement level of semo-
lina with waxy barley flour in order to obtain the desired pasting properties of end products.

52
Table 2.2 Average RVA pasting properties of semolina, waxy and non-waxy whole barley flours, and their formulations with and without xanthan gum (1%) and
gluten (5%)
Samples
Pasting
temperature
(°C)
Peak visc. 1
(cP)
Peak 1
time
(min)
Peak visc. 2
(cP)
Peak 2
time
(min)
Trough viscosity
(cP)
Breakdown
viscosity
(cP)
Final Visc.
(cP)
Setback
viscosity
(cP)
Semolina 85 1493 8.8 1063 430 2461 1398
Celebrity barley (non-waxy) 76 - - 3585 9.4 1581 2004 3853 2272
CDC Fibar barley (waxy) 55 3580 5.7 - - 1086 2494 2114 1028
Celebrity+Semolina (50/50) 83 - - 2520 9.3 1303 1218 3091 1789
CDC Fibar+Semolina (50/50) 63 1296 5.4 1627 8.9 1112 515 1849 737
CDC Fibar+Semolina (30/70) 66 550 5.4 1492 8.9 770 722 1727 957
CDC Fibar+Semolina (20/80) 68 306 5.4 1499 9.1 891 608 2007 1117
CDC Fibar+Semolina (10/90) 85 172 5.3 1560 9.1 1002 558 2264 1267
CDC Fibar + gluten (5%) 58 3314 5.7 - - 1014 2300 1937 923
CDC Fibar + Xanthan gum (1%) 50 3932 5.7 - - 1136 2796 2252 1116

53
Figure 2.2 RVA pasting curves of semolina, waxy and non-waxy whole barley flours, and their formulations with and without xanthan gum (1%) and Gluten
(5%)

54
Chapter II
2.3.2 Physicochemical properties of β-glucan in raw materials and pastas
The concentrations of β-glucan in the raw materials (barley flour and semolina, and
their blends) and corresponding pastas are givens in Table 2.3. Barley flour individually
accounted for much higher β-glucan content (9.9% d.b.) than both barley flour/semolina
blends and semolina, being in good accordance with data of literature (Izydorczyk and
Dexter, 2008; Beresford and Stone, 1983). It has been reported that hulless barley con-
tains much higher β-glucan than either wheat or hulled barley (Bhatty, 1999). Moreover,
waxy hulless barley has been described to contain approximately 7 or 8% β-glucan,
whereas regular hulless barley comprises significantly less (4.6%) (Gao et al., 2009)
which are in good accordance with data obtained for barley flours.
Analysis of variance (ANOVA), used to determine effects of pasta processing (mixing,
extrusion and drying) and cooking on total β-glucan content in pasta samples, showed
that β-glucan concentrations did not change during processing (P<0.05) (Table 2.3), in
accordance with Marconi et al. (2000). Although high total β-glucan is indicative of
high dietary fiber content in barley, it is important to recognize the soluble component
of β-glucan that is responsible for the beneficial ability of β-glucan to lower serum cho-
lesterol and blood glucose levels (Wood et al., 1994; Yokoyama et al., 1997). In fact,
the physiological functions of cereal β-glucan are associated with viscosity, which in
turn corresponds to the amount and molecular weight of β-glucan solubilized in the in-
testine (Wood et al., 2000; Tosh et al., 2010). Based on this remark, β-glucan viscosity
was measured by RVA (pasta slurry viscosity) and controlled-strain rheometer (extract
viscosity), of samples digested into RVA canister (Table 2.3). Solubility and molecular
weight of β-glucan extracted from raw materials and pastas are also presented in Table
2.3.

55
Chapter II
Barley flour individually had the highest value of β-glucan viscosity as measured by
RVA and rheometer, and peak molecular weight (Mp). Conversely, semolina showed
the lowest values of all physicochemical properties investigated. The obtained value of
β-glucan solubility in barley flour alone was similar to those found by Izydorczyk et al.
(2000) in whole flour of hulless waxy barley cultivars.
Extrusion and drying processing significantly influenced viscosity, solubility and Mp of
β-glucan, which were lower in all uncooked pastas than the original flours (Table 2.3
and fig. 2.3). Reduction in Mp and solubility of β-glucan could be attributed to the extru-
sion processing and the presence of β-glucanase in the wheat flour used to make pasta.
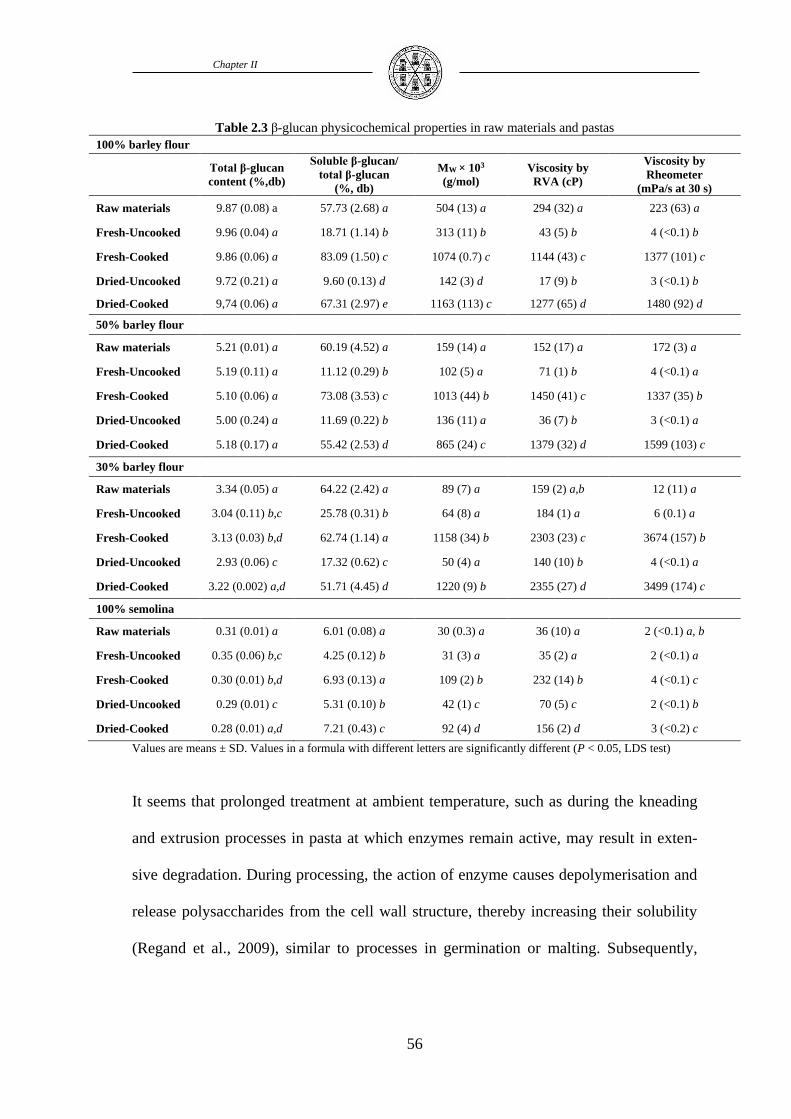
56
Chapter II
Table 2.3 β-glucan physicochemical properties in raw materials and pastas
100% barley flour
Total β-glucan
content (%,db)
Soluble β-glucan/
total β-glucan
(%, db)
MW × 103
(g/mol)
Viscosity by
RVA (cP)
Viscosity by
Rheometer
(mPa/s at 30 s)
Raw materials 9.87 (0.08) a 57.73 (2.68) a 504 (13) a 294 (32) a 223 (63) a
Fresh-Uncooked 9.96 (0.04) a 18.71 (1.14) b 313 (11) b 43 (5) b 4 (<0.1) b
Fresh-Cooked 9.86 (0.06) a 83.09 (1.50) c 1074 (0.7) c 1144 (43) c 1377 (101) c
Dried-Uncooked 9.72 (0.21) a 9.60 (0.13) d 142 (3) d 17 (9) b 3 (<0.1) b
Dried-Cooked 9,74 (0.06) a 67.31 (2.97) e 1163 (113) c 1277 (65) d 1480 (92) d
50% barley flour
Raw materials 5.21 (0.01) a 60.19 (4.52) a 159 (14) a 152 (17) a 172 (3) a
Fresh-Uncooked 5.19 (0.11) a 11.12 (0.29) b 102 (5) a 71 (1) b 4 (<0.1) a
Fresh-Cooked 5.10 (0.06) a 73.08 (3.53) c 1013 (44) b 1450 (41) c 1337 (35) b
Dried-Uncooked 5.00 (0.24) a 11.69 (0.22) b 136 (11) a 36 (7) b 3 (<0.1) a
Dried-Cooked 5.18 (0.17) a 55.42 (2.53) d 865 (24) c 1379 (32) d 1599 (103) c
30% barley flour
Raw materials 3.34 (0.05) a 64.22 (2.42) a 89 (7) a 159 (2) a,b 12 (11) a
Fresh-Uncooked 3.04 (0.11) b,c 25.78 (0.31) b 64 (8) a 184 (1) a 6 (0.1) a
Fresh-Cooked 3.13 (0.03) b,d 62.74 (1.14) a 1158 (34) b 2303 (23) c 3674 (157) b
Dried-Uncooked 2.93 (0.06) c 17.32 (0.62) c 50 (4) a 140 (10) b 4 (<0.1) a
Dried-Cooked 3.22 (0.002) a,d 51.71 (4.45) d 1220 (9) b 2355 (27) d 3499 (174) c
100% semolina
Raw materials 0.31 (0.01) a 6.01 (0.08) a 30 (0.3) a 36 (10) a 2 (<0.1) a, b
Fresh-Uncooked 0.35 (0.06) b,c 4.25 (0.12) b 31 (3) a 35 (2) a 2 (<0.1) a
Fresh-Cooked 0.30 (0.01) b,d 6.93 (0.13) a 109 (2) b 232 (14) b 4 (<0.1) c
Dried-Uncooked 0.29 (0.01) c 5.31 (0.10) b 42 (1) c 70 (5) c 2 (<0.1) b
Dried-Cooked 0.28 (0.01) a,d 7.21 (0.43) c 92 (4) d 156 (2) d 3 (<0.2) c
Values are means ± SD. Values in a formula with different letters are significantly different (P < 0.05, LDS test)
It seems that prolonged treatment at ambient temperature, such as during the kneading
and extrusion processes in pasta at which enzymes remain active, may result in exten-
sive degradation. During processing, the action of enzyme causes depolymerisation and
release polysaccharides from the cell wall structure, thereby increasing their solubility
(Regand et al., 2009), similar to processes in germination or malting. Subsequently,

57
Chapter II
however, the increased mobility might lead to self-association and formation of insolu-
ble β-glucan aggregates, lowering solubility values (Tosh et al., 2008).

58
Chapter II
Figure 2.3 β-glucan viscosity as measured by RVA (A) and controlled-strain rheometer (B), solubility
(C) and molecular weight (D) of fresh and dried, uncooked and cooked, pastas made from 100 barley
flour (blue colour), 50/50 barley flour/semolina blend (red colour), 30/70 barley flour/semolina blend (or-
ange colour), and 100 semolina (green colour)
The decrease of the amount of soluble β-glucan after drying process was in accord to
what reported by Johansson et al. (2007). Moreover, Beer et al. (1997) reported that
during drying process water is repelled from the polysaccharide structure, decreasing

59
Chapter II
the amount of soluble β-glucan. It possibly reflected changes in molecular weight and
crystallinity.
On the other hand, at least where the cooking is concerned, processing significantly in-
creased the extractability and Mp of β-glucan, and in turn the viscosity, which is associ-
ated with physiological effectiveness (Table 2.3 and fig. 2.3). Thus, cooked barley-
containing pastas could be expected to increase the viscosity in the upper gut and reduce
serum cholesterol levels to a greater extent as compared to semolina pasta.
The increase in extractability could be attributed to the dismantling of β-glucan from the
other cellular components, as the β-glucan is found in the cell wall of grains with cellu-
lose and other noncellulosic polysaccharides and heating releases it from the matrix.
Similarly, assessing the susceptibility of β-glucan in barley to disruption, and their re-
lease as soluble β-glucan during cooking, Robertson et al. (1997) found that the cooking
increased the extractability of polysaccharides from barley and the susceptibility of β-
glucan to solubilisation by proteolysis because of the close association between β-
glucan and protein in the cell wall. The denaturation of protein during cooking in-
creased the availability of protein to proteases. Johansson et al. (2007) also reported a
significant increase in β-glucan solubility upon cooking, probably due to enzyme activi-
ty in wheat flour towards the β-glucan polysaccharide.
The high Mp values of β-glucan in cooked samples suggested the disruption of the cova-
lent and non-covalent bonds between β-glucan and other cell wall components, releas-
ing and solubilizing the initially insoluble β-glucan (Izydorczyk et al., 2000).
Since the viscosity is a function of molecular weight and concentration of β-glucan, the
highest viscosity of cooked pastas could be explained by the highest values of solubility
and molecular weight of these samples. Above all, it is interesting to note that cooked
pastas made from 30% barley flour had very high values of viscosity, while they had the

60
Chapter II
lowest β-glucan content. As Izydorczyk et al. (2000) found, viscosity development pro-
files cannot be explained by β-glucan content only, but extractability and molecular
weight had a significant effect on viscosity.
Conversely, semolina pastas had very low viscosity because of the low solubility (from
4.3% to 7.2%) and low molecular weight (from 16,000 to 60,000 g/mol) of β-glucan.
Regand et al. (2009) found similar results of solubility (6.7%) and molecular weight
(33,000 g/mol) in dried wheat pasta.
2.3.3 Relationship between physicochemical properties of β-glucan in pasta samples
Principal component analysis (PCA) was applied to pooled data of barley-containing
pastas in order to detect the most causes of variability. The PCA of pasta samples re-
sults in two principal components that account for 99% of the total variability. In the
figure 2.4, the first principal component explains 78% of the total variability, and could
be considered as representative of type of processing because cooked and uncooked
pastas have been placed on the positive and negative side of the horizontal axis, respec-
tively. Viscosities as measured by RVA and controlled-strain rheometer, solubility and
molecular weight are placed close together on the positive side of the horizontal axis,
indicating that they are positively correlated with each other.
The second principal component explains 21% of the total variability and could be con-
sidered as representative of the type of formulation. In fact, pastas made from barley
flour alone are clustered on the positive side of PC2, pastas made from 50/50 barley
flour/semolina blend are placed in the middle and pastas made from 30/70 barley
flour/semolina blend are located on the negative side of PC2. Moreover, total β-glucan
content is placed on the positive side of PC2, indicating a positive correlation between
type of formulation and total β-glucan content.

61
Chapter II
Figure 2.4 Principal component analysis. Loading plot of barley-containing pastas as function of the first
two principal components
2.4 Conclusions
The barley spaghetti showed an increase of β-glucan in the range of 2.8-9.9%, propor-
tionally at the barley flour replacement. This content meets the FDA and EFSA re-
quirements, which could allow these pastas to deserve the health claims “may reduce
the risk of heart disease” and “contributes to the maintenance of normal blood choles-
terol levels”, respectively.
Processing (extrusion, drying and cooking) differently impacted β-glucan physicochem-
ical properties of the flours and blends, as well as the developed pasta products. The to-
tal β-glucan content did not vary, while viscosity, solubility and molecular weight were
affected by processing,

62
Chapter II
Indeed, extrusion and drying affect β-glucan physicochemical properties in all formula.
Conversely, cooking significantly increased the extractability and Mp of β-glucan, and
in turn the viscosity, which is associated with physiological effectiveness. Cooked pas-
tas containing only 30% of barley flour showed the lowest value of β-glucan content,
but the highest value of viscosity between barley pastas, indicating that viscosity cannot
be explained by β-glucan content only.
63
Chapter II
References
AACC, 2001. The definition of dietary fiber. Cereal Foods World, 46, 112-126.
AACC (2005). The American Association of Cereal Chemistry. Approved Methods
of AACC. Method 66-50, 76-21. 10th edn. St. Paul, Minn.
AACCI (2010). The American Association of Cereal Chemistry. Approved Methods
of AACC. Method 32-23, 44-15. 11th edn. St. Paul, Minn.
Aldughpassi, A., Abdel-Aal, E.S.M., and Wolever, T.M.S. (2012). Barley cultivar,
kernel composition, and processing affect the glycemic index. The Journal of Nutri-
tion, 142, 1666-1671.
Beer, M U., Wood, P. J., Weisz, J., and Fillion, N. (1997). Effect of cooking and
storage on the amount and molecular weight of (1→3),(1→4)-β-D-glucan extracted
from oat products by an in vitro digestion system. Cereal Chemistry, 74, 705-709.
Beresford, G., and Stone, B.A. (1983). (1-3), (1-4)-β-D-glucan content of triticum
grains. Journal of Cereal Science, 1, 111-114.
Bhatty, R.S. (1999). The potential of hull-less barley: review. Cereal Chemistry, 76,
589-599.
Buckeridge, S.W., Rayon, C., Urbanowicz, B., Tiné, S.A.M., and Carpita, C.N.
(2004). Mixed linkage (1→3),(1→4)-β-D-glucan of grasses. Cereal Chemistry, 81,
115-127.
Cavallero, A., Empilli, S., Brighenti, F., and Stanca, A.M. (2002). High (1-3, 1-4)-
beta glucan barley fractions in bread making and their effects on human glycemic re-
sponse. Journal of Cereal Science, 36, 59-66.
Dikeman, C.L., and Fahey, G.C. (2006). Viscosity as related to dietary fiber: a re-
view. Critical Reviews in Food Science and Nutrition, 46, 649-663.

64
Chapter II
EFSA Panel on Dietetic Products, Nutrition and Allergies (NDA) (2011). Scientific
Opinion on the substantiation of health claims related to beta-glucans from oats and
barley and maintenance of normal blood LDL-cholesterol concentrations (ID 1236,
1299), increase in satiety leading to a reduction in energy intake (ID 851, 852), re-
duction of post-prandial glycaemic responses (ID 821, 824), and “digestive function”
(ID 850) pursuant to Article 13(1) of Regulation (EC) No 1924/2006. EFSA Journal,
9, 2207-2227.
FDA (1997). 21 CFR Part 101. Food labeling, health claims: soluble dietary fiber
from certain foods and coronary heart disease. Federal Register, 62, 3584-3601.
FDA (2006). Food labeling: Health claims, soluble dietary fiber from certain foods
and coronary heart disease. Federal Register, 71, 29248-29250.
Gamel, T.H., Abdel-Aal, E.S.M., Peter, W.J., Ames, N.P., and Tosh, S.M. (2012).
Application of the Rapid Visco Analyzer (RVA) as an effective rheological tool for
measurement of β-Glucan viscosity. Cereal Chemistry, 89, 52-58.
Gao, J., Vasanthan, T., and Hoover, R. (2009). Isolation and characterization of high-
purity starch isolated from regular, waxy, and high-amyloses hulless barley grains.
Cereal Chemistry, 86, 157-163.
Glennie-Holmes, M. (1995). Studies on barley and malt with the rapid viscoanalyser:
[I] the effect of variations in physical and chemical parameters. Journal of the Insti-
tute of Brewing, 101, 11-18.
Gray, D., Abdel-Aal, E.S.M., Seetharaman K., and Kakuda, Y. (2009). Differences
in carbohydrate composition and digestion in vitro selected barley cultivars as influ-
enced by pearling and cooking. Cereal Chemistry, 86, 669-678.

65
Chapter II
Güler, S., Köksel, H., and Ng, P.K.W. (2002). Effects of industrial pasta drying tem-
peratures on starch properties and pasta quality. Food Research International, 35,
421-427.
Gupta, M., Bawa, A.S., and Semwal, A.D. (2009). Morphological, thermal, pasting,
and rheological properties of barley starch and their blends. International Journal of
Food Properties, 12, 587-604.
Hatcher, D.W., Lagasse, S., Dexter, J.E., Rossnagel, B., and Izydorczyk, M. (2005).
Quality characteristics of yellow alkaline noodles enriched with hull-less barley
flour. Cereal Chemistry, 82, 60-69.
Hermansson, A.M., and Svergmark, K. (1996). Developments in the understanding
of starch functionality. Trends in Food Science and Technology, 7, 345-353.
Johansson, L., Toumainen, P., Anttila, H., Rita, H., and Virkki, L. (2007). Effect of
processing on the extractability of oat β-glucan. Food Chemistry, 105, 1439-1445.
Jorgensen, K.G. (1988). Quantification of high molecular weight (1-3)(1-4)-beta-D-
glucan using calcofluor complex-formation and flow injection analysis. 1. Analytical
principle and its standardization. Carlsberg Research Communications, 53, 287–296.
Izydorczyk, M.S., Storsley, J., Labossiere, D., MacGregor, A.W., and Rossnagel,
B.G. (2000). Variation in total and soluble β-glucan content in hull-less barley: Ef-
fects of thermal, physical, and enzymic treatments. Journal of Agricultural and Food
Chemistry, 48, 982-989.
Izydorczyk, M. S., and Dexter, J. E. (2008). Barley β-glucans and arabinoxylans:
Molecular structure, physicochemical properties, and uses in food products-a Re-
view. Food Research International, 41, 850-868.

66
Chapter II
Marconi, E., Graziano, M., and Cubadda, R. (2000). Composition and utilization of
barley pearling by-products for making functional pastas rich in dietary fiber and β-
glucans. Cereal Chemistry, 77, 133-139
Ragaee, S., Campbell, G.L., Scoles, G.J., McLeod, J.G., and Tyler, R.T. (2001).
Studies on rye (Secale cereale L.) Lines exhibiting a range of extract viscosities. 1.
Composition, molecular weight distribution of water extracts, and biochemical char-
acteristics of purified water-extractable arabinoxylan. Journal of Agricultural and
Food Chemistry, 49, 2437-3325.
Ragaee S., and Abdel-Aal, E.M. (2006). Pasting properties of starch and protein in
selected cereals and quality of their food products. Food Chemistry, 95, 9-18.
Regand, A., Tosh, S.M., Wolever, T.M.S., and Wood, P.J. (2009). Physicochemical
properties of β-glucan in differently processed oat foods influence glycemic re-
sponse. Journal of Agricultural and Food Chemistry, 57, 8831-8838.
Robertson, J.A., Majasak-Newman, G., Ring, S.G., and Selvendran, R.R. (1997).
Solubilisation of mixed linkage (1→3),(1→4)- β-D-glucan from barley: effects of
cooking and digestion. Journal of Cereal Science, 25, 275-283.
Skendi, A., Biliaderis, C.G., Lazaridou, A., and Izydorczyk, M.S. (2003). Structure
and rheological properties of water soluble β-glucans from oat cultivars of Avena sa-
tiva and Avena bysantina. Journal of Cereal Science, 38, 15-31.
Tester, R.F., and Morrison, W.R. (1990). Swelling and gelatinization of cereal
starches. 1. Effects of amylopectin, amylase and lipids. Cereal Chemistry, 67, 551-
557.
Tiwari, U., and Cummins, E. (2009). Factors influencing β-glucan levels and molec-
ular weight in cereal-based products. Cereal Chemistry, 86, 290-301.

67
Chapter II
Tosh, S., Brummer, Y., Wolever, T., and Wood, P. (2008). Glycemic response to oat
bran muffins treated to vary the molecular weight of the beta-glucan. Cereal Chemi-
stry, 85, 211-217.
Tosh, S.M., Brummer, Y., Miller, S.S., Regand, A., Defelice, C., Duss, R., Wolever,
T.M.S., and Wood, P.J. (2010). Processing affects the physicochemical properties of
β-glucan in oat bran cereal. Journal of Agricultural and Food Chemistry, 58, 7723-
7730.
Verardo, V., Gomez-Caravaca, A.M., Messia, M.C., Marconi, E., and Caboni, M.F.
(2011). Development of functional spaghetti enriched in bioactive compounds using
barley coarse fraction obtained by air classification. Journal of Agricultural and
Food Chemistry, 59, 9127-9134.
Yokoyama, W.H., Hudson, C.A., Knuckles, B.E., Chiu, M.C.M., Sayre R.N., Turn-
lund J.R., and Schneemam B.O. (1997). Effect of barley β-glucan in durum wheat
pasta on human glycemic response. Cereal Chemistry, 74, 293-296.
Yokoyama, W.H., Knuckles, B.E., Stafford, A., and Inglett, G.E. (1998). Raw and
processed oat ingredients lower plasma cholesterol in the hamster. Journal of Food
Science, 63, 713-715.
Wang, Q., Woo, P.J., Huang, X., and Cui, W. (2003). Preparation and characteriza-
tion of molecular weight standards of low polydispersity from oat and barley (1-3)(1-
4)-beta-D-glucan. Food Hydrocollohydes, 17, 845–853.
Wolever, T.M.S. (2006). Glycaemic index and desease. In: The Glycaemic Index: A
physiological Classification of Dietary Carbohydrate. CABI: UK, pp- 164-174.
68
Chapter II
Wood, P.J., Weisz, J., Fedec, P., and Burrows, V.D. (1989). Large-scale preparation
and properties of oat fractions enriched in (1→3),(1→4) β-D-glucan. Cereal Chemi-
stry, 66, 97-103.
Wood, P.J., Weisz, J., and Mahn, W. (1991). Molecular characterization of cereal, β-
glucans. II. Sixe-exclusion chromatography for comparison of molecular weight. Ce-
real Chemistry, 68, 530-536.
Wood, P.J., Braaten, T.J., Scott, F.W., Riedel, K.D., Wolynetz, M.S., and Collins,
M.W. (1994). Effect of dose and modification of viscous properties of oat gum on
plasma glucose and insulin following an oral glucose load. British Journal of Nutri-
tion, 72, 731-743.
Wood, P.J., Beer, M.U., and Butler, G. (2000). Evaluation of role of concentration
and molecular weight of oat β-glucan in determining effect of viscosity on plasma
glucose and insulin following an oral glucose load. British Journal of Nutrition, 84,
19-23.
Wood, P.J. (2002). Relationships between solution properties of cereal β-glucans and
physiological effects: a review. Trends in Food Science and Technology, 13, 313-
320.
Wood, P.J. (2007). Cereal beta-glucans in diet and health. Journal of Cereal Science,
46, 230-238.

CHAPTER III
Effect of pasta processing on phenolic acid composition and
radical scavenging capacity of barley and semolina pastas

70
Chapter III
Abstract
Whole grains, including barley, are rich in a wide range of compounds with known health
benefits. Barley grain is an excellent source of healthy dietary fiber, particularly β-glucan, and
other bioactive constituents such as tocols, B complex vitamins, minerals, and phenolic com-
pounds, and consequently, it is gaining renewed interest as an ingredient for the production of
functional foods. Phenolic acids are the main phenolic compounds in barley that could con-
tribute to health benefits of barley foods. In the current study waxy barley flour rich in β-
glucan was used to produce 3 barley spaghetti functional products to study impact of pasta-
making and drying process on phenolic acid composition and scavenging capacity of free rad-
icals. The content of individual phenolic acids, total phenols and radical scavenging capacity
in raw ingredients, fresh and dried spaghetti, and in uncooked and cooked spaghetti were
evaluated and compared with semolina spaghetti. The addition of barley flour into pasta at in-
corporation levels of 30, 50 and 100% effectively increased phenolic acid and total phenols.
Pasta processing did not significantly affect the total phenols content and free radical scaveng-
ing capacity, but a significant reduction in total phenolic acids content measured by HPLC
was found. Drying resulted in an increase in phenolic acids, compared to corresponding fresh-
uncooked pasta. Cooking did not greatly affect total phenolic acids, more leading to conserv-
ing free and bound phenolic compounds.

71
Chapter III
3.1 Introduction
Demand for functional foods that offer therapeutic and disease-prevention is globally increas-
ing. In this regard, barley represents an opportunity because it contains high levels of β-
glucan, dietary fiber (Gray et al., 2009) and phenolic compounds (Madhujith and Shahidi,
2009). Phenolic compounds are naturally occurring phytonutrients that possess one or more
aromatic rings with one or more hydroxyl groups. In barley, there are several classes of com-
pounds that have a phenolic structure, such as benzoic and cinnamic acid derivatives, proan-
thocyanidins, quinones, flavonols, chalcones, flavones, flavanones and amino phenolic com-
pounds (Goupy et al., 1999; Hernanz et al., 2001; Adom and Liu, 2002; Abdel-Aal et al.,
2006).
Currently interest in phenolic and other secondary metabolites is rising because of their poten-
tial protective roles in human health. They are known for their ability to inhibit oxidation of
methyl linoleate (Kahkonen et al., 1999), to scavenge free radicals (Abdel-Aal et al., 2012), to
inhibit oxidation of human LDL cholesterol (Abdel-Aal and Gamel, 2008) and to impede sin-
glet oxygen or chelate pro-oxidant metals (Larson, 1988). Phenolic acids are the main phenol-
ic compounds in cereal grains, such as barley and wheat. They are present in free and bound
form primarily in the outer layers of the cereal kernels. Phenolic acids are derivatives of ben-
zoic acid (p-hydroxybenzoic, protocatechuic, vanillic, syringic and gallic acids) and cinnamic
acid (p-coumaric, caffeic, and ferulic acids) (fig. 3.1). Ferulic acid and its dehydrodimer de-
rivatives are the major phenolic compounds in cereals present mainly in bound form, which is
ester-linked to the cell wall in the outer layers of the grain kernels (Hernanz et al., 2001; Ma-
nach et al., 2004). Polyphenols, including phenolic acids, could play significant roles in hu-
man nutrition and health due to their anti-inflammatory antioxidant, and anticarcinogenic ef-
fects (Sies et al., 2005; Kahkonen et al., 1999).

72
Chapter III
Figure 3.1 Chemical structures of common phenolic acids in cereals (Ragaee et al., 2014)
Content and bioavailability of phenolic acids could be altered during processing. Processing
of cereals may positively or negatively affect the content of phenolic compounds which pos-
sibly impacts their bioactive properties and health benefits (Duodu, 2011). In particular, the
literature seems to show that pasta production and cooking may increase or decrease phenolic
acids content and its antioxidant activity (Fares et al., 2010; Verardo et al., 2011). The occur-
rence of phenolic acids in free or bound form would affect their behaviour during processing
and eventually their bioavailability for absorption and subsequent physiological effects. In
this regard, to achieve the maximum benefits from a food it is critical to understand its com-

73
Chapter III
position of nutrient and bioactive components as well as the effects of food formula, food
processing and cooking on the composition and bioavailability of these beneficial compo-
nents.
Based on these remarks, this study was designed to investigate effects of formulation, pasta-
making (e.g. extrusion and drying), and cooking on individual phenolic acids in fresh, dried
and cooked barley spaghetti. Barley spaghetti was made from high β-glucan barley alone or in
blends with semolina and compared with 100% semolina spaghetti.
74
Chapter III
3.2 Materials and methods
3.2.1 Materials
Description of grains, ingredients and end products was provided in chapter I. Barley grain
samples were milled with a UDY cyclone sample mill equipped with a 0.5 mm screen (UDY,
Fort Collins, CO). The Folin-Ciocalteu reagent, 2,2-diphenyl-1-picrylhydrazyl (DPPH) and
the HPLC-grade phenolic acids, including gallic, protocatechuic, p-hydroxybenzoic, gentisic,
3-hydroxybenzoic, vanillic, caffeic, syringic, p-coumaric, ferulic, sinapinic, and o-coumaric
acids were purchased from Sigma-Aldrich Canada (Oakville, ON).
3.2.2 Extraction of free and bound phenolics
The free phenolic acids were extracted from 0.5 g of the whole grain flour twice on an IKA
shaker VXB (IKA Works, Wilmington, NC) with 80% methanol. The extraction was carried
out under nitrogen for 30 min. The tube contents were centrifuged at 10,000 × g for 20 min.
The extracts were pooled together and evaporated under vacuum at 40°C using a rotary evap-
orator to remove methanol and concentrated to approximately 2 mL; then, they were diluted
to 4 ml with water and acidified to pH 2 with 2M HCl. The free acidified extract was centri-
fuged at 10,000 × g for 15 min and transferred into a clean separatory funnel. The free acidic
supernatant was extracted three times with 10 mL of ethyl ether and ethyl acetate in a 1:1 ratio
(v/v) on an IKA shaker for 10 min each and then centrifuged. The organic phase was collect-
ed, passed through anhydrous sodium sulfate, and dried under a stream of nitrogen. The resi-
due was redissolved in 1.5 mL of Nanopure water. Prior to HPLC analysis, the free phenolic
extracts were filtered through a 0.45 μm Acrodisc syringe filter (PN4484, Pall, Port Washing-
ton, NY).
The residual pellet obtained after extraction of free phenolic acids was immediately processed
for the analysis of bound phenolic acids. First the pellet was washed with 15 mL of hexane,

75
Chapter III
and then it was centrifuged at 10,000 × g for 10 min. The supernatant was discarded. Five
milliliters of 2M NaOH was added to the pellet, and then the contents were purged with nitro-
gen and mixed on an IKA stirring plate for 1 hr at 70°C. After hot extraction, the mixture was
cooled, acidified to pH 2 with 2M HCl, and centrifuged at 10,000 × g for 15 min. The acidic
supernatant was transferred into a clean separatory funnel. The pellet was washed with 10 mL
of Nanopure water and then centrifuged at 10,000 × g for 15 min. The water supernatant was
combined with the acidic supernatant, and the mixture was extracted three times with 10 mL
of ethyl ether and ethyl acetate in a 1:1 ratio (v/v) on an IKA shaker for 10 min each and then
centrifuged. The organic phase was collected, passed through anhydrous sodium sulfate, and
dried under a stream of nitrogen. The residue was redissolved in 5 mL of Nanopure water and
then filtered through a 0.45 μm Acrodisc syringe filter (PN4484, Pall) and stored in a freezer
prior to HPLC analysis.
3.2.3 Analysis of Free and Bound Phenolic Acids by HPLC (High Performance Liquid Chro-
matography)
Phenolic acids in barley extracts were separated and quantified by HPLC equipped with a
G1311A quaternary pump, G1329A temperature-controlled injector, G1316A temperature-
controlled column thermostat, G1322A degasser, G1315B photodiode array detector (DAD),
and ChemStation Rev.B.02.01-SR2 data acquisition system with the capability of conducting
isoabsorbance plot and 3D graphic analyses (Agilent Technologies Canada, Mississauga,
ON). A 25 cm × 4.6 mm i.d., 5 μm Supelcosil column LC-18 (58298, Supelco, Bellefonte,
PA) was employed for the separation of phenolic compounds. A mixture of 12 authentic phe-
nolic acid standards including gallic, protocatechuic, p-hydroxybenzoic, gentisic, 3-
hydroxybenzoic, vanillic, caffeic, syringic, p-coumaric, ferulic, sinapinic, and o-coumaric ac-
ids was used for calibration, identification, and quantification. For separation of phenolic ac-

76
Chapter III
ids, a gradient system was applied starting with 100% of 6% formic acid and 0% of acidified
acetonitrile. The gradient was gradually changed over 35 min to 82% of 6% formic acid and
18% acidified acetonitrile and then held for next 5 min. After that, 2 min was allowed to re-
turn to the starting conditions. The total run time was 42 min. Separated phenolic acids were
monitored at five different wavelengths (260, 275, 300, 380, and 330 nm) to enhance accura-
cy of phenolic acid quantification. In other words, protocatechuic, p-hydroxybenzoic, and va-
nillic acids were quantified at 260 nm; syringic acid at 275 nm; p-coumaric acid at 300 nm;
and caffeic, ferulic, and sinapinic acids at 380 nm. The identity of phenolic acids was con-
firmed by the isoabsorbance plot analysis. Typical HPLC chromatogram depicting separation
of phenolic acids from standard mixture is presented in figure 3.2. The chromatogram was ob-
tained at 275 nm, at which all 12 phenolic acids showed reasonable response except for gen-
tisic acid. Gentisic acid appeared clearly at 330 nm, but other phenolic acids had low respons-
es. In the current study, each phenolic acid was quantified at its maximum absorption wave-
length to enhance the method’s accuracy (Abdel-Aal et al., 2012).
3.2.4 Analysis of Total Phenols Content (TPC) in Free and Bound Extracts
Total phenols content in free and bound phenol extracts was measured based on the Folin–
Ciocalteu method described by Kaluza et al. (1980), with ferulic acid, the main phenolic in
barley, used as a standard for calibration and quantification. The reaction mixture contained
250 μL of sample extract, 250 μL of diluted Folin–Ciocalteu reagent, and 500 μL of saturated
sodium carbonate solution. The mixture was brought up to a volume of 5 mL with distilled
water. The contents were mixed and kept in darkness for 30 min and then centrifuged at
10,000 × g for 10 min, and then the absorbance was read at 725 nm. A series of ferulic acid
standard solutions were prepared at 0–347 μg/mL and read at 725 nm against a reagent blank.

77
Chapter III
The concentrations showed a linear relationship against absorbance, having a determination
coefficient (R2) of 0.999 and generating the following regression equation:
y = 54.968x + 0.0297
where x is the concentration of ferulic acid (μg/mL) and y is the absorbance at 725 nm.
The results of total phenols content are expressed as milligrams of ferulic acid equivalents per
kilogram of sample. In this study total phenols content in free and bound extracts of barley are
referred to as total free phenols and total bound phenols.

78
Chapter III
Figure 3.2 HPLC chromatograms showing separation of phenolic acids in standard mixture at 260 nm (A), at
275 nm (B), at 300 nm (C), at 380 nm (D), and at 330 nm (E). 1 = gallic acid; 2 = protocatechuic acid; 3 = ben-
zoic acid; 4 = gentisic acid; 5 = 3-hydroxybenzoic acid; 6 = vanillic acid; 7 = caffeic acid; 8 = syringic acid; 9 =
p-coumaric acid; 10 = ferulic acid; 11 = o-coumaric acid; and 12 = sinapinic acid

79
Chapter III
3.2.5 DPPH Radical Scavenging Capacity
The free radical scavenging capacity of free and bound barley extracts was determined using
the stable radical DPPH (2,2-diphenyl-1-picrylhydrazyl), as outlined earlier (Abdel-Aal et al.,
2008). The antioxidant reaction was initiated by transferring 1 mL of sample extracts into a
test tube containing 4 mL of 80% methanol and 1 mL of freshly prepared 1mM DPPH solu-
tion. The final concentration of DPPH in the reaction mixture was 167μM. The reaction was
monitored by reading absorbance at 517 nm for 20 min at 1 min intervals. A blank reagent
was used to study stability of the DPPH radical over the test time. The absorbance measured
at 10 min was used for the calculation of micromolar units of DPPH radical scavenged by bar-
ley extracts. The kinetics of the antioxidant reaction in the presence of phenolic extracts were
also determined over a 20 min period and compared with butylated hydroxytoluene (BHT) as
an antioxidant reference. The antioxidant capacity of the samples was reported as percentage
relative depletion (RD) of DPPH using the following equation:
% RD of DPPH = C of controlt = 0 min − C of sample t = 10 min
C of controlt = 0 min × 100
where C is the concentration of DPPH (μM).
3.2.6 Statistical Analysis
All analyses were carried out in triplicate, and the data were reported as means ± standard de-
viation (SD). Analysis of variance and least significant difference (LSD) tests were conducted
with PASW 20 (SPSS, Chicago, IL) in order to identify differences among means, while a
Pearson correlation test was conducted to determine the correlations among means. Statistical
significance was declared at P < 0.05.

80
Chapter III
3.3 Results and Discussion
3.3.1 Effect of processing and cooking on phenolic acids
Phenolic acids are the main phenolic compounds in barley and wheat (Abdel-Aal et al., 2012;
Zielìnski et al., 2011; Adom and Liu, 2002) and they occur primarily in ester form linked to
insoluble polysaccharides. Free and bound phenolic acids were assessed in barley and semoli-
na flours, uncooked and cooked pastas to determine if loss of specific polyphenols or change
in their profile occurred during pasta processing (extrusion, drying) and cooking. Tables 3.1
and 3.2 show average concentrations of the major phenolic acids found in the free and bound
extracts of raw materials and pastas. According to several reports, the widespread phenolic ac-
ids in barley and wheat are gallic, protocatechuic, p-hydroxybenzoic, gentisic, chlorogenic,
vanillic, caffeic, syringic, p-coumaric, ferulic, sinapinic and trans-cinnamic acids (Abdel-Aal
et al. 2012; Wu et al., 1999; Irakli et al., 2012).
In the current study, ferulic acid was the major phenolic acid found in the free and bound
phenolic extracts in all the investigated pasta samples. Ferulic acid could be a health-
promoting component as a chemoprotectant, which was thought to deter the process of car-
cinogenesis by inhibiting the formation of N-nitroso-compounds (Kuenzig et al., 1984). This
compound is also able to prevent peroxynitrite-mediated nitration of tyrosine residues in col-
lagen thus implicating a chemoprotectant role for this antioxidant in the prevention of tissue
injury (Kato et al., 1997). Other phenolic acids were found in the raw ingredients and end
products at measurable amounts where p-hydroxybenzoic, vanillic, caffeic and p-coumaric ac-
ids were present in the free extracts (Table 3.1) and protocatechiuc, p-hydroxybenzoic, vanil-
lic, caffeic, syringic, p-coumaric and sinapinic acids were found in the bound extracts (Table
3.2). A typical chromatogram of free and bound phenolic acids of tested samples is presented
in figure 3.3. Except for p-hydroxybenzoic and vanillic acids, which were mainly in free form
in semolina and pasta made from it, the other phenolic acids were prevalent in bound form.

81
Chapter III
The amount and type of free and bound phenolic acids were in a fair agreement with those re-
ported by Mattila et al. (2005) in durum wheat semolina and by Abdel-Aal et al. (2012) in yel-
low whole barley flour.
Inclusion of whole barley flour into pasta formulations resulted in an increase of the phenolic
content. The highest content of free and bound forms of phenolic acids was in barley flour
(13.9 µg/g and 654.0 µg/g, respectively). Semolina showed comparable free phenolic acid
content to that in the 30% barley flour in blend with semolina, mainly due to the recovery of
p-hydroxybenzoic acid. However, semolina possessed the lowest bound phenolic acid content
(202.2 µg/g) among all the flour samples. Since phenolic acids are concentrated in the outer
layers of wheat (Lilyana-Pathirana and Shahidi, 2007), the low total phenolic acids content is
expected in semolina, a product derived from the endosperm.
Compared to the other pasta formulations, pastas made from 100% barley flour had the high-
est levels of free and bound phenolic acids, a finding that is not unexpected given the higher
levels of free and bound phenolic acid content of the corresponding raw material. Likewise
the free phenolic acids in semolina and 30% barley flour blend were close, semolina pasta
showed comparable free phenolic acid content to pasta containing 30% barley flour. As ex-
pected the order of bound phenolic acids was pasta made from 100% barley flour > 50% bar-
ley flour >30% barley flour > semolina.
The pasta-making process (mixing and extrusion) decreased the free phenolic acids in all
fresh and uncooked pasta formulations. The observed variation in the free phenolic acid con-
tent was mainly due to a decrease in ferulic, caffeic and slightly p-hydroxybenzoic acid (Table
3.3). Free vanillic and p-coumaric acid were not significantly affected by processing. Con-
versely, the bound fraction did not change, except for pasta control (Table 3.3). The results
from the present study were in agreement with those of Fares et al. (2010) who reported a de-
crease in the free phenolic acids during pasta processing, attributed to a reduction in p-

82
Chapter III
hydroxybenzoic acid. It is well documented that during pasta processing the presence of oxy-
gen, water and heat treatment induces the oxidative degradation of antioxidants (carotenoids
pigments, polyphenols) (Borrelli et al., 1999; Fares et al., 2008).

83
Chapter III
Table 3.1. Composition of phenolic acids and total phenolic acids content (TPAC, sum) in free extracts of raw
materials and uncooked and cooked spaghetti (mg/kg, dry basis, means ±SD)
p-HBA VA CA p-CA FA TPAC
100% barley flour
Raw materials n.d 3.1 (0.16) a 1.9 (0.15) a 1.9 (0.07) a,c 6.5 (0.08) a 13.9 (0.46) a
Fresh-Uncooked n.d. 3.2 (0.29) a 0.9 (0.02) b 1.6 (0.02) b 5.3 (0,14) b 11.5 (0.47) b
Fresh-Cooked n.d 3.7 (0.27) a n.d 2.0 (0.15) a,c 4.4 (0.15) c 10.7 (0.57) b
Dried-Uncooked n.d 3.7 (0.27) a 0.9 (0.01) b 1.8 (0.03) b,c 6.0 (0.37) d 13.1 (0.68) a
Dried-Cooked n.d 3.6 (0.20) a n.d 1.7 (0.08) b,c 5.3 (0.03) b 10.9 (0.31) b
50% barley flour
Raw materials n.d 2.7 (0.05) a,b,c 1.3 (0.09) a 1.3 (0.01) a 5.4 (0.19) a 10.7 (0.34) a
Fresh-Uncooked n.d. 2.8 (0.07) b 0.8 (0.01) b 1.3 (0.01) a 4.2 (0.06) b 9.1 (0.15) b
Fresh-Cooked n.d 2.8 (0.07) b n.d 1.3 (0.02) a 4.2 (0.03) b 8.3 (0.12) c
Dried-Uncooked n.d 2.5 (0.01) c 0.8 (0.01) b 1.4 (0.04) a 4.9 (0.04) c 9.6 (0.10) d
Dried-Cooked n.d 2.7 (0.14) b n.d 1.3 (0.04) a 4.9 (0.02) c 8.9 (0.20) b,c
30% barley flour
Raw materials n.d 2.4 (0.04) a,c n.d. 1.1 (0.01) a,b 4.9 (0.10) a 8.4 (0.15) a
Fresh-Uncooked n.d. 2.4 (0.17) a,b n.d 1.2 (0.09) b 4.2 (0.05) b 7.8 (0.31) b
Fresh-Cooked n.d 2.4 (0.17) a,b n.d 1.0 (0.05) c 4.1 (0.03) c 7.5 (0.25) c
Dried-Uncooked n.d 2.2 (0.10) b n.d 1.3 (0.03) b 4.5 (0.05) d 8.0 (0.18) b
Dried-Cooked n.d 2.5 (0.06) c n.d 1.0 (0.01) a,c 4.3 (0.03) b 7.8 (0.10) b
100% semolina
Raw materials 1.6 (0.04) a 2.0 (0.10) a n.d 1.0 (0.07) a 3.8 (0.03) a 8.4 (0.24) a
Fresh-Uncooked 1.5 (0.1) b 2.0 (0.09) a n.d 0.8 (0.04) a 3.6 (0.09) b 7.9 (0.32) b
Fresh-Cooked 1.5 (0.03) b 2.0 (0.09) a n.d 0.8 (0.03) a 3.5 (0.01) c 7.8 (0.16) b
Dried-Uncooked 2.9 (0.01) c 1.9 (0.16) a n.d 0.9 (0.05) a 4.0 (0.01) a 9.7 (0.23) c
Dried-Cooked 2.6 (0.11) d 2.1 (0.04) a n.d 0.8 (0.05) a 3.8 (0.01) a 9.3 (0.21) c
Values in a formula with different letters are significantly different (p<0.05, LDS test). p-HBA = p-hydroxybenzoic acid; VA
= vanillic acid; CA = caffeic acid; p-CA = p-coumaric acid; FA = ferulic acid; TPAC = total phenolic acid content.

84
Table 3.2. Composition of phenolic acids and total phenolic acids content (TPAC, sum) in bound extracts of raw materials and uncooked and cooked spaghetti (mg/kg, dry
basis, means ±SD)
PRCA p-HBA VA CA SRA p-CA FA SA TPCA
100% barley flour
Raw materials 4.9 (0.41) a 18.7 (1.58) a 27.5 (4.23) a,c 14.6 (1.21) a 22.6 (0.14) a 61.7 (1.58) a 520.7 (49,29) a,b 23.3 (1.99) a 694.0 (60.43) a
Fresh-Uncooked 4.8 (0.17) a 18.8 (0.54) a 27.9 (0.74) a 14.8 (0.94) a 28.1 (1.66) b,c 61.5 (1.65) a 537.8 (45.40) a 25.9 (2.50) a,b 719.6 (53.71) a
Fresh-Cooked 4.8 (0.10) a 19.4 (0.89) a 26.9 (1.62) a 11.1 (1.09) a,b 24.7 (1.24) a,b 60.7 (1.52) a 445.2 (49.81) a,b 27.6 (2.72) b 620.4 (58.99) a,b
Dried-Uncooked 9,1 (0.48) b 23.9 (1.46) b 30.9 (1.64) b 9.9 (0.46) b,c 30.8 (0.94) c 61.0 (2.84) a 467.1 (52.27) a,b 29.8 (2.45) c 662.5 (62.54) a,b
Dried-Cooked 7,5 (0.17) c 20.5 (1.61) a 24.8 (0.89) c 9.3 (0.36) c 25.4 (2.11) a,b 58.4 (1.47) a 404.3 (43.46) b 20.8 (0.61) d 571.0 (50.68) b
50% barley flour
Raw materials 2.5 (0.06) a 16.1 (0,13) a 21.0 (0.40) a,b 9.6 (0.15) a 21.6 (0.79) a 33.6 (0.71) a,b 315.9 (41.75) a,b 18.5 (0.44) a 438.8 (44.43) a,b
Fresh-Uncooked 2.6 (0.19) a 16.1 (0.45) a 20.1 (0.73) a 10.0 (1.04) a 21.3 (1.33) a 34.8 (1.36) a 259.4 (5.17) a 18.7 (2.74) a 383.0 (13.01) a
Fresh-Cooked 2.8 (0.24) a 16.4 (0.32) a 20.3 (1.37) a n.d. 20.0 (0.90) a 32.4 (0.04) b 306.4 (12.34) a 18.2 (0.74) a 416.5 (15.95) a
Dried-Uncooked 5.0 (0.11) b 18.7 (1.94) b 23.3 (2.97) b 9.8 (0.05) a 23.3 (2.01) a 33.7 (0.29) a,b 295.4 (13.01) a 18.8 (0.17) a 428.0 (20.55) a,b
Dried-Cooked 4.6 (0.34) b 17.9 (0.13) b 21.4 (0.73) a,b n.d. 21.6 (1.03) a 33.4 (1.28) a,b 369.3 (18.74) b 19.0 (1.08) a 487.2 (23.33) b
30% barley flour
Raw materials n.d. 15.3 (0,13) a 19.8 (0,02) a n.d. 21.2 (0.71) a,b 22.8 (0.72) a 252.2 (4.29) a,b 17.0 (0.49) a 348.3 (6.36) a,d
Fresh-Uncooked n.d. 14.8 (0.85) a 19.6 (1.94) a n.d. 20.8 (1.24) b 24.4 (1.40) a 242.3 (5.88) a 17.9 (1,35) a,c 339.8 (12.66) a
Fresh-Cooked n.d. n.d n.d n.d. n.d 23.5 (1.87) a 257.3 (9.98) a,c 16.2 (0.85) b 327.0 (12.70) a
Dried-Uncooked n.d. 17.5 (0.33) b 20.9 (0.05) b n.d. 21.7 (0.14) b 23.4 (0.13) a 287.8 (24.39) b,c 18.6 (1.74) c 389.9 (26.78) c
Dried-Cooked n.d. 16.0 (1.26) a 20.5 (0.30) b n.d. 19.2 (0.21) c 22.5 (0.81) a 289.5 (18.74) c 18.1 (1.43) c 385.8 (22.75) c,d
100% semolina
Raw materials n.d. n.d. n.d. n.d. n.d. 10.9 (0.70) a 174.2 (4.06) a,b,c 17.1 (0.48) a 202.2 (5.24) a
Fresh-Uncooked n.d. n.d. n.d. n.d. n.d. 9.6 (0.41) b 161.1 (5.11) a n.d. 170.7 (5.52) b
Fresh-Cooked n.d. n.d. n.d. n.d. n.d. 12.1 (0.37) c 168.9 (3.43) a,b n.d. 181.0 (3.80) b
Dried-Uncooked n.d. n.d. n.d. n.d. n.d. 11.1 (0.09) a,c 178.4 (1.08) b,c 15.3 (0.27) b 204.8 (1.44) a
Dried-Cooked n.d. n.d. n.d. n.d. n.d. 10.6 (0.36) a,b 185.9 (9.38) c 14.7 (1.09) b 211.2 (10.83) a
Means in a formula with different letters are significantly different (p<0.05, LDS test). PRCA = protocatechuic acid; p-HBA = p-hydroxybenzoic acid; VA = vanillic acid; CA = caffeic acid;
SRA = syringic acid; p-CA = p-coumaric acid; FA = ferulic acid; SA = sinapinic acid; TPAC = bound total phenolic acid content.

85
Table 3.3 Changes in free and bound phenolic acids during the pasta making process in uncooked and cooked spaghetti compared to corresponding raw flours (+ = % increase
and − = % decrease)
100% barley flour 50% barley flour 30% barley flour 100% semolina
Fr-Un Fr-Co Dr-Un Dr-Co Fr-Un Fr-Co Dr-Un Dr-Co Fr-Un Fr-Co Dr-Un Dr-Co Fr-Un Fr-Co Dr-Un Dr-Co
Free Phenolic acids
p-HBA -6.3 -6.3 81.3 62.5
CA -52.6 -52.6 -38.5 -38.5
FA -18.5 -32.3 -7.7 -18.5 -22.2 -22.2 -10.3 -16.8 -14.3 -16.3 -8.2 -12.2 -5.3 -7.9 5.3 0.0
TPAC -17.3 -23.0 -5.8 -21.6 -15.0 -22.4 -10.3 -16.8 -7.1 -10.7 -4.8 -7.1 -6.0 -7.1 15.5 10.7
Bound Phenolic acids
PRCA -2.0 -2.0 85.7 53.1 4.0 12.0 100.0 84.0
p-HBA 0.5 3.7 27.8 9.6 1.9 16.1 11.2 -3.3 14.4 4.6
VA 1.5 -2.2 12.4 -9.8 -1.0 5.6 2.4
SRA -1.9 2.4 -9.4
SA 11.2 18.5 27.9 -10.7 -10.5 -14.0
TPAC -15.6 -10.5 1.3 4.5
Fr-Un = fresh and uncooked; Fr-Co = fresh and cooked; Dr-Un = dried and uncooked; Dr-Co = dried and cooked; PRCA = protocatechuic acid; p-HBA = p-hydroxybenzoic acid; VA = vanillic
acid; CA = caffeic acid; SRA = syringic acid; FA = ferulic acid; SA = sinapinic acid; TPAC = total phenolic acid content.

86
Chapter III
Figure 3.3. Typical HPLC chromatograms (at 275nm) showing separation of phenolic acids in standard
mixture (A), in free (B) and bound (C) extracts. 1 = gallic acid; 2 = protocatechuic acid; 3 = p-
hydroxybenzoic acid; 4 = gentisic acid; 5 = 3-hydroxybenzoic acid; 6 = vanillic acid; 7 = caffeic acid; 8 =
syringic acid; 9 = p-coumaric acid; 10 = ferulic acid; 11 = o-coumaric acid; and 12 = sinapinic acid.

87
Chapter III
The observed reduction in the content of phenolic acids during pasta processing may be
due to the combined impact of the addition of water and oxygen, and the temperature
rise during extrusion and kneading. In our study the loss was observed mainly in the
free fraction of phenolic acids, which is more reactive in counterbalancing the action of
oxygen and heat.
Drying process differently affected individual phenolic compounds in the free and
bound fractions, and thus, the total phenolic acid content. In our study, the composition
and content of phenolic acids in dried and uncooked semolina pasta were of the same
magnitude of those reported by Mattila et al. (2005). Free vanillic, caffeic and p-
coumaric acids did not significantly change, while p-hydroxybenzoic and ferulic acids
of the free extracts showed higher values compared to the corresponding fresh-
uncooked pasta. Regarding the bound fraction, drying process did not significantly af-
fect some of the bound phenolic acids detected, such as caffeic, syringic, p-coumaric,
ferulic and sinapinic acids, but it increased protocatechiuc, p-hydroxybenzoic and vanil-
lic content in the bound extracts of dried-uncooked 100%, 50% and 30% barley flour-
containing pastas. In general, it is interesting to note that where the increase was con-
cerned, the value of total phenolic acids in free and bound extracts of dried-uncooked
pasta increased, with respect to the corresponding uncooked pasta (Table 3.3). It seems
that the effect of drying on free and bound phenolic acids could be due to the nature of
phenolic compounds. The bound phenolic compounds ester-linked to cell walls (not
measurable before drying) could be released by pasta matrix during drying, increasing
both bound and free phenolic fractions. Therefore, drying temperature could enhance
the extraction of phenolic compounds from the food matrix and thereby increase the
amount of them during the subsequent chemical extraction.

88
Chapter III
Conflicted results have been reported with regard to the effect of pasta-making process
(mixing, extrusion, and drying) on free and bound phenolic acids in pasta. Verardo et al.
(2011) found that the main effect of pasta processing was a decrease of free and bound
phenolic acids. Similarly, Fares et al. (2010) observed a decrease in free phenolic con-
tent of durum wheat pasta enriched with bran fractions of wheat, but the bound phenol-
ics did not change. On the other hand, the results from the study of Khan et al. (2013)
contradict those of the two mentioned studies; the pasta processing did not change the
free and bound phenolic acid content of fettuccine made by replacing durum wheat
semolina with red or white sorghum flour. The discrepancy between the mentioned
studies could be explained by different conditions applied by the authors. Similarly, the
process applied in the current research could produce different effects from the litera-
ture. The severity and mode of thermal process could also have a bearing on the phenols
in the food (Duodu, 2011). Moreover, the effect of each processing step of flour into
pasta should be taken into account to understand effects of pasta-making and drying on
phenolic compounds.
Cooking led to slight changes in free and bound phenolic acids compared to the equiva-
lent uncooked pasta. These data confirmed the results of Mattila et al. (2005), who
demonstrated that, on dry basis, the contents of phenolic acids in wheat flours and cor-
responding products made from these flours (bread and pasta) were found to be similar.
On the other hand, Verardo et al. (2011) reported a strong decrease of free and bound
phenolic acids of pasta after cooking. This effect could be laid to the solubility of phe-
nolic compounds in the cooking water. Fares et al. (2010) and Khan et al. (2013) also
found decrease in the free phenolic acid content, but increase in the bound fraction of
nonconventional pasta. They suggested that boiling can enhance the extractability of
bound phenolic acids from the food matrix during cooking and hence can increase their
89
Chapter III
recovery. Unlike bound phenolic acids, free phenolic acids are not physically trapped in
protein network (Naczk et al., 2011; Prigent et al., 2009), therefore the cooking process
could have resulted in leaching of these compounds into the cooking water.
3.3.2 Total Free and Bound Phenols Contents
Table 3.4 reports on the total free and bound phenols contents of the flours and pastas as
determined by the Folin–Ciocalteu assay. This assay determines the total amount of re-
ducing substances by measuring the change in color when metal oxides are reduced by
phenolic antioxidants and other reducing substances may present in the extract. This
method would also serve as an indication of antioxidant capacity for free or bound sub-
stances present in the extracts. Although its low accuracy is well known, the Folin-
Ciocalteu assay has been widely applied for the analysis of phenolic compounds in
grains, so it could be useful to compare data on the current samples with those present
in the literature. The disagreeing results of the literature could be explained by the dif-
ference of extraction method, solvent type, and grain variety. In the present study, the
total phenols content was expressed as ferulic acid equivalent, since it is the predomi-
nant phenolic acid in barley flour and semolina.
Formulation containing 100% barley flour had higher free and bound phenolics content
(235.9 mg/kg and 1590.2 mg/kg, respectively) than the other formulations. Total free
and bound phenolics content broadly ranged among samples. The total free phenolic
content ranged from 235.9 mg/kg in 100% barley flour to 19.9 mg/kg in semolina. As
expected, total bound phenolic content contributed the highest portion of total phenolic
compounds in the all flours, ranging from 1590.2 mg/kg in 100% barley flour to 342.4
mg/kg in semolina. The values are in a fair agreement with those reported by Irakli et al.
90
Chapter III
(2012) and Fares et al. (2010), concerning whole barley flour and semolina, respective-
ly.
Compared to the control pasta, all barley pastas had higher free and bound total phenol-
ic content. The total phenolic content of the uncooked and equivalent cooked pastas
were very close to the that in the raw materials, denoting that pasta-processing (extru-
sion, drying and cooking) did not significantly affect the total phenolic content of free
and bound extracts.
In barley flour individually and in blend with semolina, and in all barley pastas, the free
and bound phenolic contents as assessed by Folin-Ciocalteu method were nearly 20
times and 2 times, respectively, higher than those measured by HPLC-DAD analysis. A
major reason for this difference is the lack of specificity of the Folin-Ciocalteu reagent
to phenolic acids that did not represent the profile of the total phenolic compounds. In-
deed, the literature reports that other phenolic and reducing compounds found in barley
might contribute to the total content of phenols (Bonoli et al., 2004; Verardo et al.,
2011). On the other hand, HPLC-DAD values of semolina and control pastas were close
to those obtained with the Folin-Ciocalteu method, denoting that phenolic acids repre-
sent the majority of phenolic compounds.

91
Chapter III
Table 3.4 Total phenols content of free and bound extracts of raw materials and corresponding pasta
TPCf
(mg/kg on d.b)
TPCb
(mg/kg on d.b)
100% barley flour
Raw materials 235.9 (21.30) a 1590.2 (50.09) a
Fresh-Uncooked 205.7 (12.21) a,b 1436.31 (59.45) b
Fresh-Cooked 180.8 (0.82) b,c 1436.69 (15.64) b
Dried-Uncooked 197.2 (17.90) b,c 1533.54 (20.75) a,b
Dried-Cooked 166.1 (1.21) c 1637.45 (44.53) a
50% barley flour
Raw materials 113.6 (3.71) a 1031.7 (54.99) a
Fresh-Uncooked 113.9 (10.44) a 909.1 (54.92) b,c
Fresh-Cooked 97.7 (2.24) a 995.1 (14.54) a,b
Dried-Uncooked 107.7 (0.24) a 882.4 (11.02) c
Dried-Cooked 104.8 (7.15) a 958.4 (34.78) a,b,c
30% barley flour
Raw materials 88.8 (8.31) a,b 808.0 (26.45) a
Fresh-Uncooked 74.1 (5.90) b 735.9 (21.59) a
Fresh-Cooked 75.8 (6.55) b 758.3 (55.11) a
Dried-Uncooked 91.1 (5.47) a,b 811.7 (25.50) a
Dried-Cooked 101.1 (9.23) a 789.0 (62.59) a
100% semolina
Raw materials 19.9 (1.80) a 342.4 (16.95) a
Fresh-Uncooked 17.9 (1.20) a,b 370.1(4.43) a,b
Fresh-Cooked 13.2 (0.44) c 397.4 (22.60) b
Dried-Uncooked 15.6 (0.97) b,c 442.9 (7.97) b,c
Dried-Cooked 13.5 (0.25) c 462.4 (32.8) c
Values are means ±SD. Means in a formula with different letters are significantly
different (p<0.05, LDS test).
TPCf = total phenolic content of free extract. TPCb = total phenolic content of bound extract.

92
Chapter III
3.3.3 DPPH Radical Scavenging Capacity
The DPPH free radical scavenging capacity of the flours and, uncooked and cooked
pastas is presented in Table 3.5. The DPPH assay measures the ability of an antioxidant
to reduce the stable deep-purple DPPH radical, and the reduction in color is monitored
over a given time. The color intensity of DPPH radicals with no antioxidant or sample
extracts was stable over the test time with an average absorbance of 1.763 (fig. 3.3). The
antioxidant extracts from samples tested in this study exhibited different reaction kinet-
ics curves compared with the BHT antioxidant standard (75ppm). The free and bound
extracts of barley flour individually showed a sharp drop in DPPH colour intensity, in-
dicating high antioxidant activity in quenching DPPH radicals during the first 10
minutes, followed by a gradual logarithmic decline. In the presence of BHT, however,
the color intensity of DPPH gradually reduced over time following a logarithmic de-
cline. The different kinetics curve of the free and bound extracts of semolina indicated
their low radical scavenging capacity.
The free and bound extracts of barley flour individually had the highest percentage of
depleted DPPH radical (70.0 and 60.4%, respectively) (Table 3.5). On the other hand,
free and bound phenolic extracts of semolina showed the lowest DPPH depletion per-
centage (10.5% and 26.3 %, respectively). Similar results were found by Abdel-Aal et
al. (2012) in bound extracts of yellow whole barley samples. In general, free and bound
phenolic extracts of barley flour individually and in blend with semolina had higher an-
tioxidant capacity as determined by DPPH assay than those of semolina. Similar to total
phenolic content, pasta processing (extrusion, drying and cooking) did not significantly
affect the antioxidant capacity of both free and bound phenolic extracts of all uncooked
and cooked pastas, independently from the formulation.

93
Chapter III
Table 3.5 Scavenging capacity of DPPH free radical (% relative depletion) of raw materials
and corresponding pasta
Free Phenolic
Extract
Bound Phenolic
Extract
100% barley flour
Raw materials 60.4 (0.28) a,b 70.0 (1.28) a
Fresh-Uncooked 55.1(1,92) a 65.8 (1.93) a
Fresh-Cooked 55.7(0.94) a 65.5 (6.14) a
Dried-Uncooked 62.9 (5.63) b 75.4 (3.48) a
Dried-Cooked 61.4 (3.30) b 67.5 (5.49) a
50% barley flour
Raw materials 38.4 (1.98) a 49.1 (1.63) a
Fresh-Uncooked 37.9 (0.04) a 46.7 (1.21) a
Fresh-Cooked 36.7 (2.04) a 50.7 (3.82) c
Dried-Uncooked 36.0 (0.25) a 63.8 (1.24) b
Dried-Cooked 37.8 (1.61) a 58.5 (5.47) b,c
30% barley flour
Raw materials 26.2 (1.40) a 37.2 (0.96) a
Fresh-Uncooked 22.2 (2.26) a 39.1 (0.06) a,c
Fresh-Cooked 25.6 (0.77) a 48.5 (1.24) b
Dried-Uncooked 24.9 (2.30) a 43.3 (0.34) b,c
Dried-Cooked 26.0 (2.59) a 45.8 (4.36) b
100% semolina
Raw materials 10.5 (3.03) a,b 26.3 (0.44) a
Fresh-Uncooked 12.2 (1.71) a,b 27.9 (2.50) a
Fresh-Cooked 7.5 (1.53) b 26.8 (1.29) a
Dried-Uncooked 11.3 (3.42) a,b 29.8 (0.40) a
Dried-Cooked 16.2 (5.14) a 28.0 (2.76) a
Means in a formula with the same letter within a formulation are not significantly different at P<
0.05. DPPH = 2,2-diphenyl-1-picrylhydrazyl

94
Chapter III
Figure 3.3 Kinetics of 2,2-diphenyl-1-picrylhydrazyl radical with free (FP) and bound phenolic (BP) ex-
tracts of barley flour (B) and semolina (S), and butylated hydroxytoluene (BHT).
3.3.4 Contribution of Phenolics to Antioxidant Capacity
All data on total free phenols, total bound phenols, free phenolic acids, bound phenolic
acids, and DPPH scavenging capacity were subjected to Pearson correlation analysis to
determine the relationship between phenolic compounds and their contribution to anti-
oxidant capacity of the investigated samples (Tables 3.6 and 3.7). In all extracts, ferulic
acid was the predominant phenolic acid and exhibited the significantly strongest corre-
lation with total phenolic acids content (TPAC) and total phenols content (TPC).
Total phenols content (Folin-Ciocalteu method) gave strong positive correlations with
total phenolic acids content (HPLC-DAD measurement) for both free and bound ex-
tracts, suggesting that phenolic acids made considerable contributions to phenolic com-
pounds content in the tested samples under the experimental conditions.
Except for p-hydroxybenzoic acid, all phenolic acids were positively correlated with to-
tal phenolic acids content and total phenols content, indicating that they are the main

95
Chapter III
phenolic compounds in the free extracts. In addition, negative correlations between free
p-hydroxybenzoic and all other free phenolic compounds were found in this study.
In the bound fraction, all phenolic acids were significantly correlated, particularly feru-
lic and p-coumaric acids showed the strongest correlations and were prevailing in the
bound phenolic acids. Overall, p-coumaric and ferulic acids were found to have a high
correlation with the total bound phenols content and the total amount of phenolic acids
determined by HPLC. This strong correlation confirmed the prevalence of ferulic and p-
coumaric acids in the bound extracts.
The antioxidant capacity, measured as the DPPH radical scavenging capacity, showed
significant correlations with total phenolic content (r = 0.965) suggesting that phenolic
compounds in the samples examined may be able to fight free radicals formed in the
human body. In addition, significant correlations were also found between the phenolic
acids (except for free p-hydroxybenzoic acid) in free and bound extracts, and DPPH
radical scavenging capacity, indicating the role of examined phenolic acids in inhibiting
free radicals.

96
Chapter III
Table 3.6 Correlation coefficients between free phenolic acids, total phenolic content, total phenolic acids
content and DPPH scavenging capacity
**indicates at P = 0.05; n=20. TPC = total phenols content (determined by Folin-Ciocalteu assay); p-HBA= p-
hydroxybenzoic acid; VA = vanillic acid; CA = caffeic acid; p-CA = p-coumaric acid; FA = ferulic acid; TPCA =
total phenolic acids content (determined by HPLC-DAD method); DPPH = % relative depletion of 2,2-diphenyl-1-
picrylhydrazyl.
Table 3.7 Correlation coefficients between bound phenolic acids, total phenolic content, total phenolic
acids content and DPPH scavenging capacity
TPC PA p-HBA VA CA SRA p-CA FA SA TPCA DPPH
TPC
0,863*
*
0,827*
*
0,858*
*
0,802*
*
0,824*
*
0,923*
*
0,948*
*
0,775*
*
0,967*
*
0,938*
*
PA
0,723*
*
0,727*
*
0,754*
*
0,708*
*
0,784*
*
0,610*
*
0,657*
*
0,833*
*
0,902*
*
p-HBA
0,992*
*
0,612*
*
0,993*
*
0,693*
*
0,781*
*
0,739*
*
0,842*
*
0,830*
*
VA
0,671*
*
0,993*
*
0,754*
*
0,831*
*
0,763*
*
0,884*
*
0,848*
*
CA
0,634*
*
0,842*
*
0,794*
*
0,608*
*
0,808*
*
0,778*
*
SRA
0,711*
*
0,786*
*
0,746*
*
0,847*
*
0,815*
*
p-CA
0,935*
*
0,748*
*
0,935*
*
0,859*
*
FA
0,781*
*
0,992*
*
0,923*
*
SA
0,817*
*
0,772*
*
TPCA
0,948*
*
**indicates at P = 0.05; n=20. TPC = total phenols content (determined by Folin-Ciocalteu assay); PA = protocate-
chuic acid; p-HBA= p-hydroxybenzoic acid; VA = vanillic acid; CA = caffeic acid; SRA = syringic acid; p-CA = p-
coumaric acid; FA = ferulic acid; SA = sinapinic acid; TPCA = total phenolic acids content (determined by HPLC-
DAD method); DPPH = % relative depletion of 2,2-diphenyl-1-picrylhydrazyl.
TPC p-HBA VA CA p-CA FA TPAC DPPH
TPC -0.711** 0.900** 0.641** 0,936** 0,864** 0,787** 0,965**
p-HBA -0.624** -0.328 -0.630** -0.564** -0.192 -0.665**
VA 0.402 0.916** 0.697** 0.715** 0.962**
CA 0.534** 0.762** 0.767** 0.569**
p-CA 0.779** 0.779** 0.945**
FA 0.844** 0.836**
TPAC 0,797**

97
Chapter III
3.4 Conclusions
In general, total and individual phenolic acids strongly correlated and contributed to the
free radical scavenging capacity of pastas. The addition of barley flour into pasta at all
incorporation levels effectively increased the phenolic acid content and total phenols
content, showing antioxidant potential and increasing the possible benefits in diet to
help prevention of chronic diseases related to oxidative stress.
Pasta processing did not significantly affect the total phenols content and free radical
scavenging capacity, but it led to vary phenolic acids content of pastas. The significant
reduction in total phenolic content after extrusion might be due to oxidizing reactions
trigged by water, oxygen and heat. Interesting drying of pasta resulted in improved phe-
nolic acids, compared to corresponding fresh-uncooked pasta. Cooking did not greatly
affect the total phenolic acids, more leading to conserving free and bound phenolic
compounds. Based on this, different processing technologies have been found to pro-
duce various effects, and thus the choice of cereal formula and technological process is
crucial in preserving phenolic acids and their anticipated health-enhancing properties.

98
Chapter III
References
Abdel-Aal, E.-S.M., Young, J.C., and Rabalski, I. (2006). Anthocyanin composition
in blak, blue,m pink, purple, and red cereal grains. Journal of Agricultural and Food
Chemistry, 54, 4696-4704.
Abdel-Aal, E.-S.M., and Gamel, T.H. (2008). Effects of selected barley cultivars and
their pearling fractions on the inhibition of human LDL oxidation in vitro using a
modified conjugated dienes method. Cereal Chemistry, 85, 730-737.
Abdel-Aal, E.-S.M., Choo, T.-M., Dhillon, S., and Rabalski, I. (2012). Free and
bound phenolic acids and total phenolic in black, blue, and yellow barley and their
contribution to free radical scavenging capacity. Cereal Chemistry, 89, 198-204.
Adom, K.K, and Liu, R.H. (2002). Antioxidant activity of grains. Journal of Agricul-
tural and Food Chemistry, 62, 661-666.
Bonoli, M., Marconi, E., and Caboni, M.F. (2004). Free and bound phenolic com-
pounds in barley (Hordeum vulgare L.) flours: evalutation of the extraction capabil-
ity of different solvent mixtures and pressurized liquid methods by micellar electoki-
netic chromatography and spectrophotometry. Journal of Chromatography, 1057, 1-
12.
Borrelli, G.M., Troccoli, A., Di Fonzo, N., and Fares, C. (1999). Durum wheat
lipoxygenase activity and other quality parameters that affect pasta colour. Cereal
Chemistry, 76, 335-340.
Duodu, K.G. (2011). Effects of processing on antioxidant phenolics of cereal and
legume grains. Pages 31-54 In: Awika, J.M., Piironen, V., Bean, S. (Eds.), Advances
in Cereal Science: Implications to Food Processing and Health Promotion. American
Chemical Society, Washington, DC.

99
Chapter III
Fares, C., Codianni, P., Nigro, F., Platani, C., Scazzina, F., and Pellegrini, N. (2008).
Processing and cooking effects on chemical nutritional and functional properties of
pasta obtained from selected emmer genotypes. Journal of the Science of Food and
Agriculture, 88, 2435–2444.
Fares, C., Platani, C., Baiano, A., and Menga, V. (2010). Effect of processing and
cooking on phenolic acid profile and antioxidant capacity of durum wheat pasta en-
riched with debranning fractions of wheat. Food Chemistry, 119, 1023-1029.
Goupy, P., Hugues, M., Boivin, P., and Amiot, M.J. (1999). Antioxidant composition
and activity of barley (Hordeum vulgare) and malt extracts and of isolated phenolic
compounds. Journal of Agricultural and Food Chemistry, 79, 1625-1634.
Gray, D., Abdel-Aal, E.-S. M., Seetharaman, K., and Kakuda, Y. (2009).Differences
in carbohydrate composition and digestion in vitro of selected barley cultivars as in-
fluenced by pearling and cooking. Cereal Chemistry, 86, 669-678.
Hernanz, D., Nunez, V., Sancho, A. I., Faulds, C. B., Williamson, G., Bartolome, B.
and Gomez-Cordove, C. (2001). Hydroxycinnamic acids and ferulic acid dehydro-
dimers in barley and processed barley. Journal of Agricultural and Food Chemistry,
49, 4884-4888.
Irakli, M.N., Samanidou, V.F., Biliaderis, C.G., and Papadoyannis, I.N. (2012). De-
velopment and validation of an HPLC-method for determination of free and bound
phenolic acids in cereals after solid-phase extraction. Food Chemistry, 134, 1624-
1632.
Kahkonen, M.P., Hopia, A.I., Vuorela, H.J., Rauha, J.-P., Pihlaja, K., Kujala, T.S.,
and Heinonen, M. (1999). Antioxidant activity of plant extracts containing phenolic
compounds. Journal of Agricultural and Food Chemistry, 47, 3954-3962.

100
Chapter III
Kaluka, W.Z., McGrath, R.M., Roberts, T.C., and Schroder H. (1980). Separation of
phenolics of Sorghum bicolor (L.) Moench grain. Journal of Agricultural and Food
Chemistry, 28, 1191-1196.
Kato ,Y., Ogino , Y., Aoki, T., Uchida, K., Kawakishi, S., and Osawa, T. (1997).
Phenolic antioxidants prevent peroxynitrite-derived collagen modification in vitro.
Journal of Agricultural and Food Chemistry, 45, 3004-3009.
Khan, I., Yousif, A., Johnson, S.K., and Gamlath, S. (2013). Effect of sorghum flour
addition on resistant starch content, phenolic profile and antioxidant capacity of du-
rum wheat pasta. Food Research International, 54, 578-586,
Kuenzig, W., Chau, J., Holowaschenko, H., Newmark, H., Mergens, W., and Con-
ney, A.H. (1984). Caffeic and ferulic acid as blockers of nitrosoamine formation.
Carcinogenesis, 5, 309-313.
Larson, R.A. (1988). The antioxidants of higher plants. Phytochemistry, 27, 969-978.
Lilyana-Pathirana, C.M., and Shahidi, F. (2007). Antioxidant and free radical scav-
enging activities of whole wheat and milling fractions. Food Chemistry, 101, 1151-
1157.
Madhujith, T. and Shahidi, F. (2009). Antioxidant potential of barley as affected by
alkaline hydrolysis and release of insoluble-bound phenolics. Food Chemistry, 117,
615-620.
Manach, C., Scalbert, A., Morand, C., Rémésy, C. and Jiménez, L. (2004). Polyphe-
nols: Food sources and bioavailability. American Journal of Clinical Nutrition, 79,
727-747.

101
Chapter III
Mattila, P., Pihlava, J.-M., and Hellstrom, J. (2005). Contents of phenolic acids, al-
kyl- and alkenyòresorcinols, and avenanthramides in commercial grain produtcs.
Journal of Agricultural and Food Chemistry, 53, 8290-8295.
Naczk, M., Towsend, M., Zadernowski, R., and Shahidi, F. (2011). Protein-binding
and antioxidant potential of phenolics of mangosteen fruit (Garcinia mangostana).
Food Chemistry, 128, 292-298.
Prigent, S.V.E., Voragen, A.G.J., van Koningsveld, G.A., Baron, A., Renard,
C.M.G.C., and Gruppen, H. (2009). Interactions between globular proteins and pro-
cyanidins of different degrees of polymerization. Journal of Dairy Science, 92, 5843-
5853.
Ragaee, S., Seetharaman, K., and Abdel-Aal, E-S.M. (2014). Impact of milling and
thermal processing on phenolic compounds in cereal grains. Critical Reviews in
Food Science and Nutrition, 54, 837-849.
Sies, H., Schewe, T., Heiss, C., and Kelm, M. (2005). Cocoa polyphenols and in-
flam-matory mediators. American Journal of Clinical Nutrition, 81, 304S-312S.
Verardo, V., Gòmez-Caravaca, A.M., Messia, M.C., Marconi, E. and Caboni, M.F.
(2011). Development of functional spaghetti enriched in bioactive compounds using
barley coarse fraction obtained by air classification. Journal of Agricultural and
Food Chemistry, 59, 9127-9134.
Wu, H., Haig, T., Pratley, J., Lemerle, D. and An, M. (1999). Simultaneous determi-
nation of phenolic acids and 2,4-dihydroxy-7-methoxy-3-one in wheat (Triticum aes-
tivum L.) by gas chromatography-tandem mass spectrometry. Journal of Chromato-
graphy Applied, 864, 315–321.

102
Chapter III
Zielinski, H., Kozlowska, H., and Lewczuk, B. (2001). Bioactive compounds in the
cereal grains before and after hydrothermal processing. Innovative Food Science and
Emerging Technologies, 2, 159-169.

CHAPTER IV
General Conclusions

104
Chapter IV
4.1 Overall Conclusions
The demonstrated link between the intake of whole grains and various health benefits
has heightened consumer awareness of good nutrition and increased interest in
functional foods. Although whole cereal grains contain many health-promoting
components (phytochemicals or phytonutrients) such as β-glucan and phenolic
compounds, food processing could increase or reduce them. This has implications for
their bioactive properties and potential health benefits they can offer.
Therefore, cereal recipe and processing should be carefully chosen to preserve the
health properties of foods after processing.
The aim of this study was to develop functional pasta (spaghetti), a common food in the
world. Spaghetti were produced from waxy barley as a rich source of healthy dietary
fiber, in particular β-glucan, and other bioactive constituents, such as phenolic acids.
Most of phenolic substances are mainly concentrated in the outer layer of cereal grains,
and thus whole barley was considered as the best solution to reduce the loss of bioactive
compounds and to increase the potential health benefits of spaghetti. Then we evaluated
the impact of processing on some health-promoting components of spaghetti.
For the developed barley spaghetti the health claims “may reduce the risk of heart
disease” (FDA, 2006) and “contributes to the maintenance of normal blood cholesterol
levels” (EFSA, 2011) could be adopted, based on the required β-glucan content (chapter
2). The total content of β-glucan did not change in barley pasta compared to the
corresponding raw materials, indicating that pasta processing did not have any influence
on β-glucan levels. Conversely, pasta processing affected the physicochemical
properties of β-glucan that are associated with physiological effectiveness. In particular,
extrusion and drying negatively affect solubility and molecular weight, and in turn
viscosity of β-glucan in all pasta formula, while cooking significantly increased them.

105
Chapter IV
Thus, cooked pasta made from barley seems to be healthier than that made from
semolina alone. The viscosity of barley spaghetti was not related to β-glucan content as
the highest viscosity was found in barley spaghetti containing the lowest β-glucan. This
illustrates the importance of evaluating the extractability and molecular-structural
characteristics of β-glucan, and not just their concentration for potential health benefits
in foods.
In addition to β-glucan, whole barley is considered a good source of phenolic acids,
known for their beneficial antioxidant properties and overall for the promotion of
human health. So in the next stage of research (Chapter 3), the contribution of total and
individual phenolic acid to antioxidant properties of barley spaghetti was evaluated. In
general, total and individual phenolic acids strongly correlated and contributed to the
free radical scavenging capacity of pastas. The addition of barley flour into regular
pasta at all incorporation levels effectively increased the phenolic acid content and total
phenols content, showing antioxidant potential and increasing the possible benefits in
diet to help prevention of chronic diseases related to oxidative stress.
Pasta processing did not significantly affect total phenols content (measured by Folin-
Ciocalteu method) and free radical scavenging capacity, but it caused changes in the
content of individual phenolic acids content (measured by HPLC method) of pastas.
After extrusion total phenolic acids content decreased, while drying of pasta resulted in
improved phenolic acids, compared to corresponding fresh-uncooked pasta. Cooking
did not greatly affect the total phenolic acids, more leading to conserving free and
bound phenolic compounds.
These results would be useful in the development of barley-based functional pastas with
improved health benefits. In the development of barley lines with high level of β-glucan
special care should be given to its molecular structure and impact of processing such as

106
Chapter IV
mixing, extrusion, cooking, etc. Therefore, food manufactures should pay attention not
only to the potential physiological properties of raw barleys, through evaluating the
initial phytochemicals content such as β-glucan and phenolic acids, but also evaluate the
possible changes of these bioactive compounds during processing.

Acknowledgements
I would like thank Prof. Marconi; he gave me the opportunity to work at University of
Molise, improving my scientific knowledge.
Special thanks go out to my advisor, Dr. Cristina Messia, for teaching me everything I
know at University of Molise. I would not have been able to get this far without her
advice and help. Thanks her for helping me think rationally.
I would like to express my deepest gratitude and special thank you to my co-advisor,
Dr. Abdel-Aal, for his excellent guidance patience, and providing me with an excellent
atmosphere for doing research at Agriculture and Agri-Food Centre. My “Canadian”
experience helped me to improve my thinking, writing, and communication skills.
My sincerest thanks and regards to Iwona Rabalski for her scientific and human
support. Thank you for training me during the time spent at AAFC; the analyses learnt
at AAFC was immensely applicable and beneficial to my work at the university. Cheers
to her for being a great reliable person to whom I could always talk about my problems
and excitements.
I also wish to thank all my friends in the Food Technology Lab for making my time at
University a great learning and fun experience.
And last but not least, I wish to express my sincere gratitude to my “old” and “new”
families for their continuous love and their supports in my decisions. Without whom I
could not have made it here.