effect of postural adjustment methods on mesh quality
TRANSCRIPT

Abstract The purpose of this study was to conduct a series of human body model (HBM) simulations to evaluate quantitative metrics to determine solver- and model-neutral best practices for HBM posture adjustment. The Total Human Model for Safety (THUMS) v.4.1 was repositioned using Oasys PRIMER from its baseline posture to four distinct postures based on published volunteer and naturalistic driving data. For each posture, nine simulations were conducted on equivalent computational hardware by applying three different mass scaling levels and three different postural adjustment times. A subsequent 50 ms relaxation time was employed once postural adjustment was complete. Simulation runtime, element quality deviation from baseline, contact penetrations, proximity to target posture, and kinetic energy were extracted. Based on results, this study recommends the following best practices: a postural adjustment time of 100 ms; a mass scaling of 1.5x; and relaxation times of 20−30 ms. These best practices are recommended as general guidelines for HBM postural adjustment.
Keywords Finite Element, Distortion, Mass Scaling, Best Practices, Virtual Testing.
I. INTRODUCTION
In recent years, finite element (FE) human body models (HBMs) have become widely used tools in the biomechanics literature due to their ever-increasing biofidelity and the ability to cost- and time-efficiently test an extensive range of possibilities compared to physical testing using anthropometric test devices (ATD) and post mortem human subjects (PMHS) [1,2]. HBMs are even being used in consumer information rating, with the European New Car Assessment Programme (Euro NCAP) assessment of deployable systems, particularly the active bonnet, for pedestrian protection [3,4]. Future autonomous vehicles have been imagined to make possible unconventional vehicle interiors and passenger postures, and the use of FE HBMs may enable the research of crash protection in these designs. Despite the relative ease of repositioning HBMs to an extensive range of postures, there is minimal information available regarding the standardization of HBM postural adjustment. Ando et al. [5] demonstrated that variations in HBM initial posture led to changes to rib fracture injury prediction and pelvic engagement. Hwang et al. [6] found that HBM response in side impacts was more sensitive to changes in HBM geometry and posture than material properties. With HBMs possibly contributing to future vehicle safety assessment, it is helpful to establish quantitatively supported best practices to standardize HBM postural adjustment.
HBM postural adjustment and positioning can be divided into three main categories. Kinematic joint repositioning through nodal location is common in ATD FE models and was introduced into a simplified HBM by Schwartz et al. [7]. This method is quick, simple and effective, but is only applicable to kinematic joints and is incompatible with HBMs implementing complex, biofidelic joints. Morphing-based approaches, such as the PIPER positioning tool, which uses a light physics engine to reposition, have been introduced and offer much promise, but often involve substantial mesh repair and require model verification by a CAE engineer, reducing their
C. Costa (e-mail: [email protected]; tel: 757-218-0526) is a MD/PhD Student, J. M. Caffrey is a PhD Student, B. W. von Kleeck is aresearch engineer, A. A. Weaver is an Associate Professor of Biomedical Engineering, F.-C. Hsu is a Professor of Biostatistics and DataScience, and F. S. Gayzik is an Associate Professor of Biomedical Engineering at the Wake Forest School of Medicine in Winston-Salem,North Carolina. J. J. Hallman is a Principal Engineer at Toyota Motor North America. S. Akima is a Mechanical Engineer at Toyota MotorCorporation.
Effect of Postural Adjustment Methods on Mesh Quality and Simulation Time of Human Body Models
Casey Costa, Juliette M. Caffrey, B. Wade von Kleeck III, Ashley A. Weaver, Jason J. Hallman, Satoshi Akima, Fang-Chi Hsu, F. Scott Gayzik
IRC-21-54 IRCOBI conference 2021
490

efficiency [8]. Morphing-based approaches are also useful for modeling various morphologies and have been applied to common HBMs [9]. Simulation-based methods of repositioning, which are the de facto industry standard, offer practical and ready-to-use means of repositioning that can achieve a massive range of postures without substantial geometric distortion. The objective of this study was to conduct a series of simulation-based HBM postural adjustments to evaluate quantitative metrics in order to determine best practices for HBM postural adjustment. These practices sought to be both solver- and model-neutral so they could be applied to any HBM in any FE solver.
II. METHODS
The Total Human Model for Safety (THUMS) v4.1 HBM was simulated from its baseline (“out-of-box”) posture to four final postures while adjusting the mass scaling and postural adjustment time (PAT), or time required to complete postural adjustment. All postures were simulated in the driver seat of a National Crash Analysis Center (NCAC) full-scale vehicle model using Oasys PRIMER v17.0 (Oasys Ltd, London, United Kingdom). Once the final posture was achieved, a 50 ms relaxation time (RT) was included, during which quantitative metrics were extracted in 10 ms increments. It should be noted that positions of the HBM within the vehicle interior were approximate, and final settling was outside the objectives of the current study. However, the postures were selected to be realistic and representative of current and future seating postures.
Vehicle Model All postural adjustment simulations were conducted in the seat of a full-scale FE NCAC vehicle model. This model was selected due to its widespread use in biomechanics literature and the availability of extensive validation data [10-12]. The foam material properties of the seat cushion were validated using drop-ball test data from Patalak et al. [13] (Appendix A). The full-scale vehicle model (i.e. the seat was not isolated) was used for all simulations to mimic typical end users. The steering wheel was adjusted to its mid-angle position based on New Car Assessment Program (NCAP) test procedure. The seatback angle was also positioned to the same position as in the crash test. If necessary, minor adjustments were made to the seatback angle, seat track position and seat height to obtain an adequate fit of the HBM into the driver compartment for each posture.
Postures Each final posture was directly or indirectly generated from volunteer and naturalistic driver and passenger data. There were three primary goals when selecting the final postures: (1) they should be realistic; (2) they should capture a range of postures; and (3) they should challenge the robustness of the THUMS model by simulating extreme adjustments. The four selected postures are given in Fig. 1. Additional information for each posture is provided in Appendix B.
Fig. 1. Final postures selected for positioning. From left-to-right: Nominal Driver, Reclined Passenger, Upright Passenger, and Relaxed Passenger.
The first posture is titled the Nominal Driver and was selected to test a commonly simulated posture in crash
biomechanics. It was created using regression models from Reed et al. [14], which predicted driver posture based on stature, ratio of sitting height to stature, seat height, steering wheel to right ball-of-foot horizontal distance, and seat cushion angle, using posture data of 34 men and 34 women in an adjustable driver seat [15]. A seat height of 270 mm and steering wheel to ball-of-foot distance of 550 mm were used to calculate the body segment angles for the HBM. These values were selected because they were the median values used in Reed et al. [15]. A
IRC-21-54 IRCOBI conference 2021
491
seat cushion angle of 11° was selected, which was the lower of the two angles tested in [15]. The baseline height of the THUMS model was used for stature. Using the regression models, knee angle, pelvis angle, abdomen angle, thorax angle and neck angle were calculated. Once each segment was adjusted to the proper position in PRIMER, the hips were extended so that the hip-to-ball-of-foot distance was equal to the predicted distance from [14]. The lower extremities were kept symmetric. The H-Point location was estimated from regression models in [14] using the H-Point-to-striker horizontal and vertical distances from a comparable New Car Assessment Program (NCAP) frontal barrier crash test (test number: 5677). Lastly, the hands were moved to the 10 o’clock and 2 o’clock steering-wheel positions and pronated appropriately.
The second posture is titled the Reclined Passenger and was selected to investigate a posture that is speculated to become more common in future automated vehicles and to test the robustness of the THUMS model during a large torso adjustment. This posture was created using regression models from Reed et al. [16], which predicted occupant posture using stature, body mass index (BMI), ratio of sitting height to stature, seatback angle, and presence of a seatback headrest. The morphological dimensions of the THUMS model were used with the most extreme recline angle tested in the study (53°) to calculate the H-point location relative to the vehicle H-point, pelvis angle, lumbar angle, thorax angle, neck angle, head angle, thigh angle, and lower leg angle. The hips were then extended until the heels were contacting the floor. The arm positions were approximated from photos of volunteers in the study since no regression models were available for them.
The third posture is titled the Upright Passenger and was selected to perform posture adjustments that had not been covered by the Nominal Driver and Reclined Passenger postures, such as knee flexion and shoulder abduction. The pelvis angle, lumbar angle, thorax angle, neck angle and head angle were determined using volunteer data from [16] (seatback angle of 23°), and the extremities were positioned using naturalistic driver [17] and passenger [18] data. The lower extremities were positioned so that the knees were flexed with the soles of the feet flat on the ground. The lower extremity positions were determined visually from naturalistic photos. The left upper extremity was extended and abducted until the forearm rested on the left front door armrest. The right arm was then positioned symmetrically to the left arm.
The fourth posture is titled the Relaxed Passenger and was selected to test a posture that was asymmetric and unconventional. Additionally, it challenged the robustness of the THUMS model by producing an extreme lower extremity position. This posture was primarily based on conceptual images, but the upper extremity positions were directly informed by naturalistic driver and passenger data [17,18].
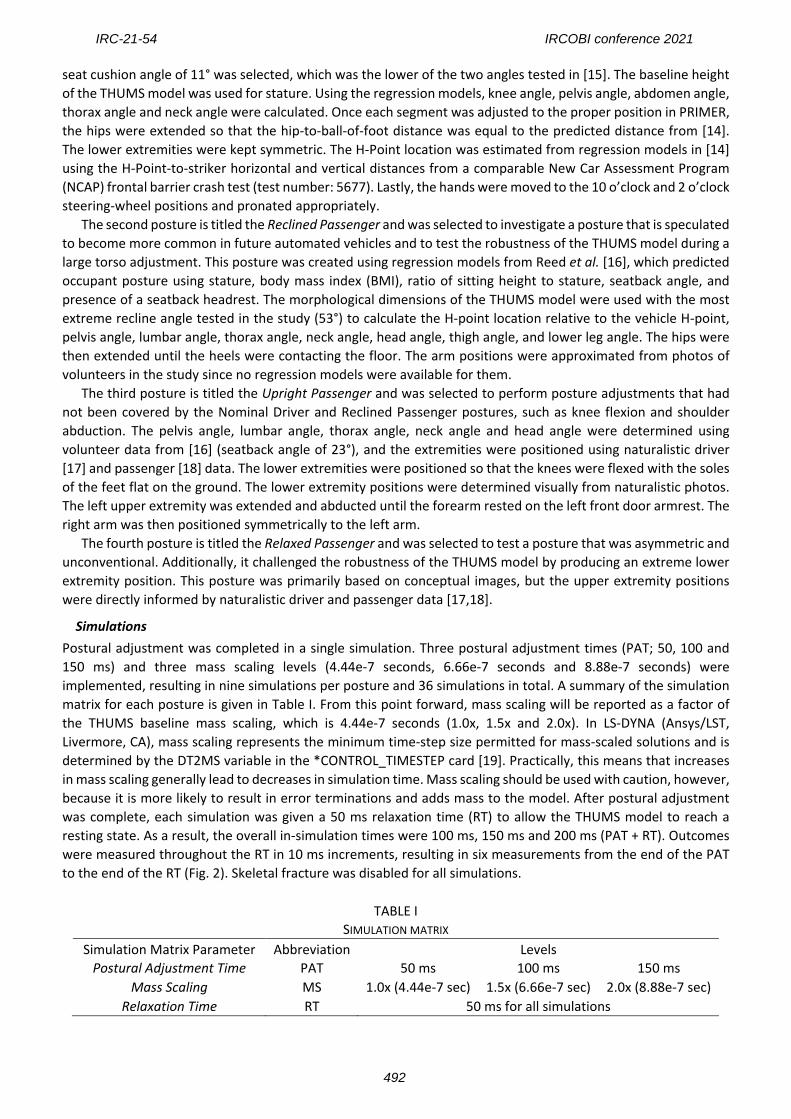
Simulations Postural adjustment was completed in a single simulation. Three postural adjustment times (PAT; 50, 100 and 150 ms) and three mass scaling levels (4.44e-7 seconds, 6.66e-7 seconds and 8.88e-7 seconds) were implemented, resulting in nine simulations per posture and 36 simulations in total. A summary of the simulation matrix for each posture is given in Table I. From this point forward, mass scaling will be reported as a factor of the THUMS baseline mass scaling, which is 4.44e-7 seconds (1.0x, 1.5x and 2.0x). In LS-DYNA (Ansys/LST, Livermore, CA), mass scaling represents the minimum time-step size permitted for mass-scaled solutions and is determined by the DT2MS variable in the *CONTROL_TIMESTEP card [19]. Practically, this means that increases in mass scaling generally lead to decreases in simulation time. Mass scaling should be used with caution, however, because it is more likely to result in error terminations and adds mass to the model. After postural adjustment was complete, each simulation was given a 50 ms relaxation time (RT) to allow the THUMS model to reach a resting state. As a result, the overall in-simulation times were 100 ms, 150 ms and 200 ms (PAT + RT). Outcomes were measured throughout the RT in 10 ms increments, resulting in six measurements from the end of the PAT to the end of the RT (Fig. 2). Skeletal fracture was disabled for all simulations.
TABLE I
SIMULATION MATRIX Simulation Matrix Parameter Abbreviation Levels
Postural Adjustment Time PAT 50 ms 100 ms 150 ms Mass Scaling MS 1.0x (4.44e-7 sec) 1.5x (6.66e-7 sec) 2.0x (8.88e-7 sec)
Relaxation Time RT 50 ms for all simulations
IRC-21-54 IRCOBI conference 2021
492
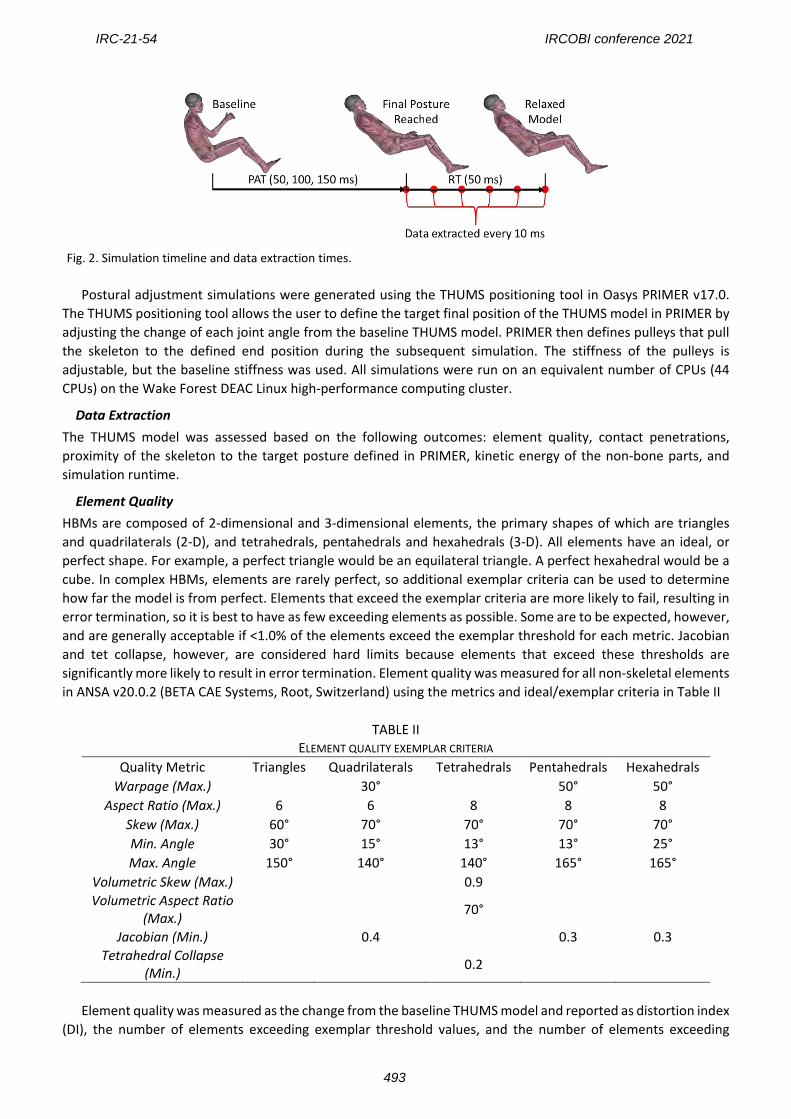
Fig. 2. Simulation timeline and data extraction times.
Postural adjustment simulations were generated using the THUMS positioning tool in Oasys PRIMER v17.0.
The THUMS positioning tool allows the user to define the target final position of the THUMS model in PRIMER by adjusting the change of each joint angle from the baseline THUMS model. PRIMER then defines pulleys that pull the skeleton to the defined end position during the subsequent simulation. The stiffness of the pulleys is adjustable, but the baseline stiffness was used. All simulations were run on an equivalent number of CPUs (44 CPUs) on the Wake Forest DEAC Linux high-performance computing cluster.
Data Extraction The THUMS model was assessed based on the following outcomes: element quality, contact penetrations, proximity of the skeleton to the target posture defined in PRIMER, kinetic energy of the non-bone parts, and simulation runtime.
Element Quality HBMs are composed of 2-dimensional and 3-dimensional elements, the primary shapes of which are triangles and quadrilaterals (2-D), and tetrahedrals, pentahedrals and hexahedrals (3-D). All elements have an ideal, or perfect shape. For example, a perfect triangle would be an equilateral triangle. A perfect hexahedral would be a cube. In complex HBMs, elements are rarely perfect, so additional exemplar criteria can be used to determine how far the model is from perfect. Elements that exceed the exemplar criteria are more likely to fail, resulting in error termination, so it is best to have as few exceeding elements as possible. Some are to be expected, however, and are generally acceptable if <1.0% of the elements exceed the exemplar threshold for each metric. Jacobian and tet collapse, however, are considered hard limits because elements that exceed these thresholds are significantly more likely to result in error termination. Element quality was measured for all non-skeletal elements in ANSA v20.0.2 (BETA CAE Systems, Root, Switzerland) using the metrics and ideal/exemplar criteria in Table II
TABLE II
ELEMENT QUALITY EXEMPLAR CRITERIA Quality Metric Triangles Quadrilaterals Tetrahedrals Pentahedrals Hexahedrals
Warpage (Max.) 30° 50° 50° Aspect Ratio (Max.) 6 6 8 8 8
Skew (Max.) 60° 70° 70° 70° 70° Min. Angle 30° 15° 13° 13° 25° Max. Angle 150° 140° 140° 165° 165°
Volumetric Skew (Max.) 0.9
Volumetric Aspect Ratio (Max.)
70°
Jacobian (Min.) 0.4 0.3 0.3 Tetrahedral Collapse
(Min.) 0.2
Element quality was measured as the change from the baseline THUMS model and reported as distortion index
(DI), the number of elements exceeding exemplar threshold values, and the number of elements exceeding
IRC-21-54 IRCOBI conference 2021
493
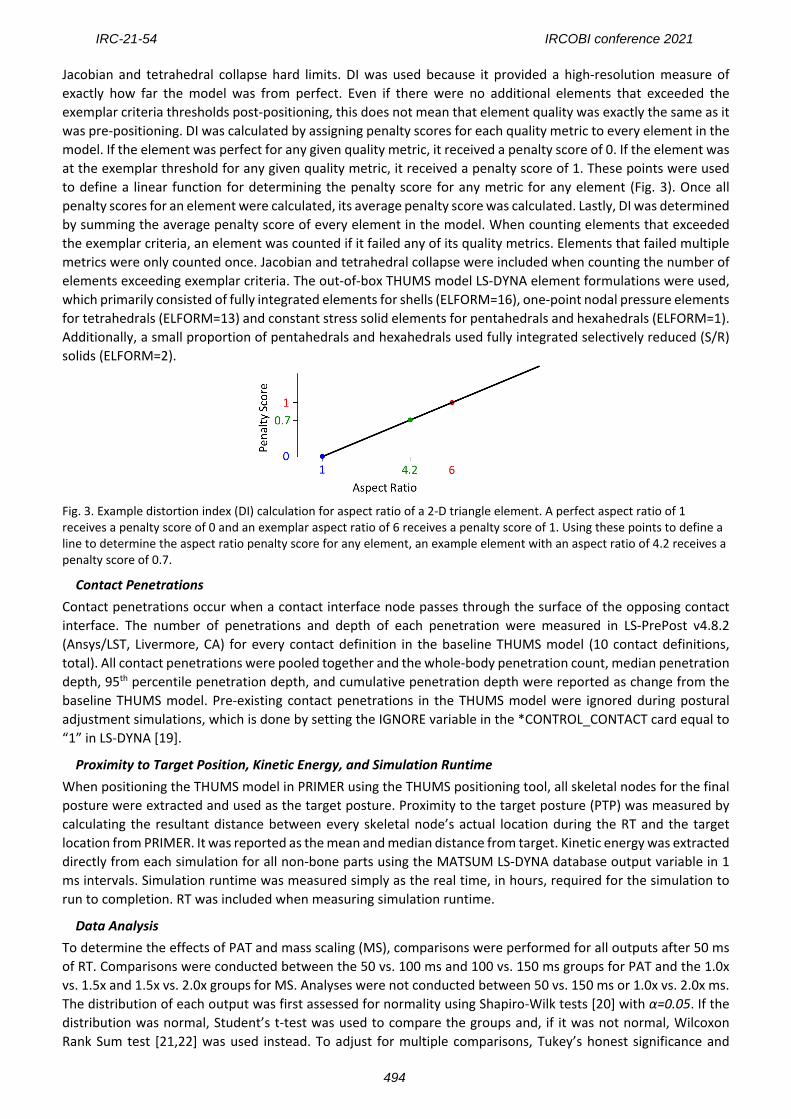
Jacobian and tetrahedral collapse hard limits. DI was used because it provided a high-resolution measure of exactly how far the model was from perfect. Even if there were no additional elements that exceeded the exemplar criteria thresholds post-positioning, this does not mean that element quality was exactly the same as it was pre-positioning. DI was calculated by assigning penalty scores for each quality metric to every element in the model. If the element was perfect for any given quality metric, it received a penalty score of 0. If the element was at the exemplar threshold for any given quality metric, it received a penalty score of 1. These points were used to define a linear function for determining the penalty score for any metric for any element (Fig. 3). Once all penalty scores for an element were calculated, its average penalty score was calculated. Lastly, DI was determined by summing the average penalty score of every element in the model. When counting elements that exceeded the exemplar criteria, an element was counted if it failed any of its quality metrics. Elements that failed multiple metrics were only counted once. Jacobian and tetrahedral collapse were included when counting the number of elements exceeding exemplar criteria. The out-of-box THUMS model LS-DYNA element formulations were used, which primarily consisted of fully integrated elements for shells (ELFORM=16), one-point nodal pressure elements for tetrahedrals (ELFORM=13) and constant stress solid elements for pentahedrals and hexahedrals (ELFORM=1). Additionally, a small proportion of pentahedrals and hexahedrals used fully integrated selectively reduced (S/R) solids (ELFORM=2).
Fig. 3. Example distortion index (DI) calculation for aspect ratio of a 2-D triangle element. A perfect aspect ratio of 1 receives a penalty score of 0 and an exemplar aspect ratio of 6 receives a penalty score of 1. Using these points to define a line to determine the aspect ratio penalty score for any element, an example element with an aspect ratio of 4.2 receives a penalty score of 0.7.
Contact Penetrations Contact penetrations occur when a contact interface node passes through the surface of the opposing contact interface. The number of penetrations and depth of each penetration were measured in LS-PrePost v4.8.2 (Ansys/LST, Livermore, CA) for every contact definition in the baseline THUMS model (10 contact definitions, total). All contact penetrations were pooled together and the whole-body penetration count, median penetration depth, 95th percentile penetration depth, and cumulative penetration depth were reported as change from the baseline THUMS model. Pre-existing contact penetrations in the THUMS model were ignored during postural adjustment simulations, which is done by setting the IGNORE variable in the *CONTROL_CONTACT card equal to “1” in LS-DYNA [19].
Proximity to Target Position, Kinetic Energy, and Simulation Runtime When positioning the THUMS model in PRIMER using the THUMS positioning tool, all skeletal nodes for the final posture were extracted and used as the target posture. Proximity to the target posture (PTP) was measured by calculating the resultant distance between every skeletal node’s actual location during the RT and the target location from PRIMER. It was reported as the mean and median distance from target. Kinetic energy was extracted directly from each simulation for all non-bone parts using the MATSUM LS-DYNA database output variable in 1 ms intervals. Simulation runtime was measured simply as the real time, in hours, required for the simulation to run to completion. RT was included when measuring simulation runtime.
Data Analysis To determine the effects of PAT and mass scaling (MS), comparisons were performed for all outputs after 50 ms of RT. Comparisons were conducted between the 50 vs. 100 ms and 100 vs. 150 ms groups for PAT and the 1.0x vs. 1.5x and 1.5x vs. 2.0x groups for MS. Analyses were not conducted between 50 vs. 150 ms or 1.0x vs. 2.0x ms. The distribution of each output was first assessed for normality using Shapiro-Wilk tests [20] with α=0.05. If the distribution was normal, Student’s t-test was used to compare the groups and, if it was not normal, Wilcoxon Rank Sum test [21,22] was used instead. To adjust for multiple comparisons, Tukey’s honest significance and
IRC-21-54 IRCOBI conference 2021
494
Steel-Dwass tests [23] were used to determine statistical significance for comparisons of parametric and nonparametric data, respectively, and α=0.05 was used to determine statistical significance.
III. RESULTS
All simulations terminated normally, with one exception, which was remedied as follows. Out of the 36 simulations, only the 50 ms PAT and 2.0x MS simulation for the Reclined Passenger resulted in error termination, which was the result of elements experiencing negative volumes. The negative volumes occurred in the brain tissue around 20 ms into the RT. The Reclined Passenger posture experienced a significant amount of translational motion of the head, leading to inertial effects in the brain during deceleration. In order to obtain a working simulation, the skull and brain contents were made rigid to avoid negative volumes. No other parts were made rigid. This was a reasonable measure for the purposes of the study because the final postures are not dependent upon the mechanical response of the brain tissue. Additionally, brain motion is undesirable for a postural adjustment simulation, so it is conceivable that end-users could implement a similar measure for similar reasons.
Results of the 36 simulations were expressed as 3-dimensional bar charts (Figs 4−8). Each bar chart shows the desired quality metric from the end of the PAT (and start of the RT) to the end of the RT in 10 ms increments. Each block of nine bars at every 10 ms increment represents the nine different simulation configurations of PAT and MS. Each bar represents the average value across all four postures for the desired metric.
Effects of Postural Adjustment Time (PAT) and Mass Scaling (MS) The distributions for penetration count, mean penetration depth, median penetration depth, and 95th percentile penetration depth were normal (p>0.05 for Shapiro-Wilk test). The distributions for DI, number of elements exceeding exemplar criteria, number of elements exceeding hard limits, cumulative penetration distance, mean PTP, median PTP, and simulation runtime were not normal (p<0.05 for Shapiro-Wilk test). Comparisons between PAT and MS groups are summarized in Table III
TABLE III
SUMMARY OF GROUP COMPARISONS FOR EACH INCREMENTAL CHANGE IN POSTURAL ADJUSTMENT TIME AND MASS SCALING. ABBREVIATIONS: PAT=POSTURAL ADJUSTMENT TIME, MS=MASS SCALING
Change in PAT (ms) Change in MS 50100 p 100150 p 1.0x1.5x p 1.5x2.0x p
Element Quality Distortion Index++ -1492 <0.01* -219 <0.01* +55 0.95 +16 1.00
Exceeding Exemplar++ -158 <0.01* -5 0.93 +16 0.83 -1 0.99 Exceeding Hard Limits++ -18 <0.01* +2 0.94 +2 0.66 +2 0.68
Contact Penetrations Count+ +1266 <0.01* +832 <0.01* +415 0.55 +381 0.61
Mean Depth (mm)+ -0.017 <0.01* -0.008 <0.01* +0.001 0.99 +0.002 0.93 Cumulative Depth (mm)++ +69.2 0.16 +51.5 0.30 +76.4 0.03* +72.9 0.02*
Median Depth (mm)+ -0.007 <0.01* -0.004 <0.01* +0.001 0.95 +0.001 0.92 95th Percentile Depth (mm)+ -0.031 <0.01* -0.014 <0.01* -0.0001 1.00 +0.002 0.97
Proximity to Target Mean Distance (mm)++ -0.025 0.61 -0.0004 1.00 -0.006 0.95 -0.004 0.96
Median Distance (mm)++ -0.030 0.08 +0.007 0.75 -0.005 0.78 -0.006 0.78
Simulation Time (hours)++ +3.79 0.04* +5.03 0.01* -5.21 0.09 -2.89 0.23 +Tukey honest significance used to calculate p-values; ++Steel-Dwass used to calculate p-values. DI decreased as PAT increased (e.g. element quality improved), but was unaffected by MS (Fig. 4). Additionally,
as PAT increased, shorter RTs were required before DI levelled-out. These trends are especially visible for 50 ms PAT, which showed a large increase from baseline DI at 0 ms RT and a rapid decrease during the RT. Even after 50 ms of relaxation, however, there was a statistically significant decrease in DI for every increase in PAT, though the decrease was considerably more pronounced when increasing from 50 ms to 100 ms (DI decreased by 1492, p<0.01) than from 100 ms to 150 ms (DI decreased by 219, p<0.01). Similar trends were observed for the number
IRC-21-54 IRCOBI conference 2021
495

of elements that exceed exemplar criteria when increasing PAT from 50 ms to 100 ms (decreased by 158 elements, p<0.01). However, after 50 ms of relaxation, increasing PAT from 100 ms to 150 ms did not significantly decrease the number of exceeding elements (decreased by 5 elements, p=0.93). The number of elements exceeding hard Jacobian and tetrahedral collapse limits also decreased significantly when increasing PAT from 50 ms to 100 ms (decreased by 18 elements, p<0.01), but showed a slight increase when increasing from 100 to 150 ms PAT, though it was not statistically significant (increased by 2 elements, p=0.94).
Fig. 4. Average distortion index (DI) change from baseline across all postures throughout the relaxation time (RT). Lower DI indicates improved element quality.
The number of contact penetrations generally increased as the length of the simulation increased (Fig. 5). This
applied to both PAT and RT. As PAT increased, the number of penetrations increased significantly (increased by 1,266 penetrations from 50 ms to 100 ms, p<0.01, and 832 penetrations from 100 ms to 150 ms, p<0.01). It is important to note, however, that the mean, median and 95th percentile penetration depths decreased as the simulation length increased (Fig. 6), meaning that they became lower compared to the baseline THUMS model. This, in combination with the increasing penetration count, indicates the development of very small penetrations over time, resulting in a leftward shift in the distribution of the penetration depths. Cumulative penetration depth increased significantly as MS increased (increased by 76.4 mm from 1.0x to 1.5x, p=0.03, increased by 72.9 mm from 1.5x to 2.0x, p=0.02), but was not significantly affected by PAT or RT (Fig. 7).
Fig. 5. Average change from baseline number of contact penetrations across all postures throughout the relaxation time (RT).
Fig. 6. Average decrease from baseline mean contact penetration depth across all postures throughout the relaxation time (RT).
IRC-21-54 IRCOBI conference 2021
496

Fig. 7. Average change from baseline cumulative contact penetration depth across all postures throughout the relaxation time (RT).
After 50 ms of RT, mean PTP was unaffected by PAT (Fig. 8). Additionally, mean PTP was completely unaffected
by MS. The same was true for median PTP, with one exception. Median PTP decreased by 0.03 mm as PAT increased from 50 ms to 100 ms (p=0.08). Though this difference was not quite statistically significant, it is still important because it signifies that the PTP distribution, similar to that of contact penetrations, shifts leftward as PAT increases. In other words, the number of smaller distances grows more than the number of larger distances.
Fig. 8. Mean distance of each node from its target position.
As expected, simulation runtime increased significantly as PAT increased (increased by 3.79 hours from 50 ms
to 100 ms, p=0.04; increased by 5.03 hours from 100 ms to 150 ms, p=0.01). Simulation runtime decreased as MS increased, but it was not statistically significant (decreased by 5.21 hours when increasing from 1.0x to 1.5x, p=0.09, decreased by 2.89 hours when increasing from 1.5x to 2.0x, p=0.23). Though the decrease in runtime of 5.21 hours from 1.0x to 1.5x was not statistically significant, it was still practically significant. When looking at the individual postures (Fig. 9), increasing MS from 1.5x to 2.0x decreased simulation time in most cases, but there were some cases in which the change was very slight and some in which simulation runtime increased for equal PATs (e.g. Reclined Passenger when PAT=50 ms).
IRC-21-54 IRCOBI conference 2021
497

Fig. 9. Simulation runtime for each posture. Relaxation time was included when calculating the runtime.
Effects of Relaxation Time (RT) As RT progressed, penetration count and cumulative penetration depth both tended to increase (Figs 7 and 11). Exceptions were observed for 50 ms of PAT, which initially showed a decrease in count and cumulative depth, followed by a steady increase. This was likely the result of rapid movement of the tissues and the skeleton decelerating. Mean, median and 95th percentile penetration depth decreased as RT progressed, indicating the development of smaller penetrations (Fig. 6). DI, mean PTP, median PTP and kinetic energy displayed behaviour similar to that of exponential decay, with sharp decreases immediately after reaching the final posture followed by a gradually decreasing slope (Figs 4, 8, and 10). These outputs were fitted to exponential decay curves to determine the optimal RT, which is expanded upon in the Discussion section, below. Number of elements exceeding exemplar values and number of elements exceeding hard limits tended to decrease as RT progressed, but no consistently strong trends were apparent.
Fig. 10. Average kinetic energy across all postures throughout the relaxation time (RT). Abbreviations: PAT, postural adjustment time; MS, mass scaling.
IV. DISCUSSION
Optimal Postural Adjustment Time (PAT) and Mass Scaling (MS) Longer PAT generally resulted in better element quality, more contact penetrations, decreases to mean, median and 95th percentile penetration depth (e.g. smaller penetration depths), decreases in median PTP, and longer simulation runtimes. Even after 50 ms of RT, PATs of 50 ms generated higher DI, number of elements exceeding exemplar criteria, and number of elements exceeding hard limits compared to 100 ms PAT. However, when increasing from 100 ms to 150 ms PAT, only DI decreased significantly, while the number of elements exceeding
IRC-21-54 IRCOBI conference 2021
498
exemplar criteria and hard limits did not. Additionally, the reduction in DI when increasing PAT from 100 ms to 150 ms was much smaller than from 50 ms to 100 ms. This indicates that postural adjustment times above 100 ms may actually be counterproductive because they will unnecessarily increase the runtime and number of penetrations in the model while only marginally improving element quality. There is also a chance it may increase the number of elements that exceed hard limits, but this is uncertain and requires more investigation.
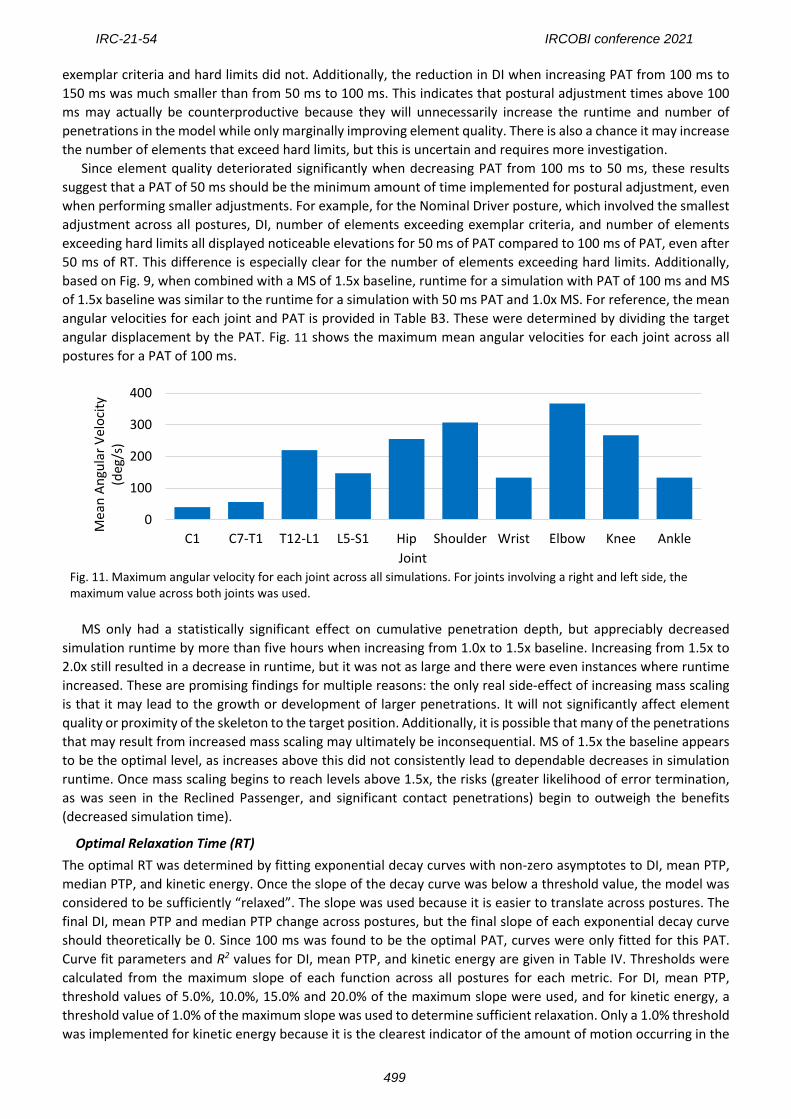
Since element quality deteriorated significantly when decreasing PAT from 100 ms to 50 ms, these results suggest that a PAT of 50 ms should be the minimum amount of time implemented for postural adjustment, even when performing smaller adjustments. For example, for the Nominal Driver posture, which involved the smallest adjustment across all postures, DI, number of elements exceeding exemplar criteria, and number of elements exceeding hard limits all displayed noticeable elevations for 50 ms of PAT compared to 100 ms of PAT, even after 50 ms of RT. This difference is especially clear for the number of elements exceeding hard limits. Additionally, based on Fig. 9, when combined with a MS of 1.5x baseline, runtime for a simulation with PAT of 100 ms and MS of 1.5x baseline was similar to the runtime for a simulation with 50 ms PAT and 1.0x MS. For reference, the mean angular velocities for each joint and PAT is provided in Table B3. These were determined by dividing the target angular displacement by the PAT. Fig. 11 shows the maximum mean angular velocities for each joint across all postures for a PAT of 100 ms.
Fig. 11. Maximum angular velocity for each joint across all simulations. For joints involving a right and left side, the maximum value across both joints was used.
MS only had a statistically significant effect on cumulative penetration depth, but appreciably decreased
simulation runtime by more than five hours when increasing from 1.0x to 1.5x baseline. Increasing from 1.5x to 2.0x still resulted in a decrease in runtime, but it was not as large and there were even instances where runtime increased. These are promising findings for multiple reasons: the only real side-effect of increasing mass scaling is that it may lead to the growth or development of larger penetrations. It will not significantly affect element quality or proximity of the skeleton to the target position. Additionally, it is possible that many of the penetrations that may result from increased mass scaling may ultimately be inconsequential. MS of 1.5x the baseline appears to be the optimal level, as increases above this did not consistently lead to dependable decreases in simulation runtime. Once mass scaling begins to reach levels above 1.5x, the risks (greater likelihood of error termination, as was seen in the Reclined Passenger, and significant contact penetrations) begin to outweigh the benefits (decreased simulation time).
Optimal Relaxation Time (RT) The optimal RT was determined by fitting exponential decay curves with non-zero asymptotes to DI, mean PTP, median PTP, and kinetic energy. Once the slope of the decay curve was below a threshold value, the model was considered to be sufficiently “relaxed”. The slope was used because it is easier to translate across postures. The final DI, mean PTP and median PTP change across postures, but the final slope of each exponential decay curve should theoretically be 0. Since 100 ms was found to be the optimal PAT, curves were only fitted for this PAT. Curve fit parameters and R2 values for DI, mean PTP, and kinetic energy are given in Table IV. Thresholds were calculated from the maximum slope of each function across all postures for each metric. For DI, mean PTP, threshold values of 5.0%, 10.0%, 15.0% and 20.0% of the maximum slope were used, and for kinetic energy, a threshold value of 1.0% of the maximum slope was used to determine sufficient relaxation. Only a 1.0% threshold was implemented for kinetic energy because it is the clearest indicator of the amount of motion occurring in the
0
100
200
300
400
C1 C7-T1 T12-L1 L5-S1 Hip Shoulder Wrist Elbow Knee Ankle
Mea
n An
gula
r Vel
ocity
(d
eg/s
)
Joint
IRC-21-54 IRCOBI conference 2021
499
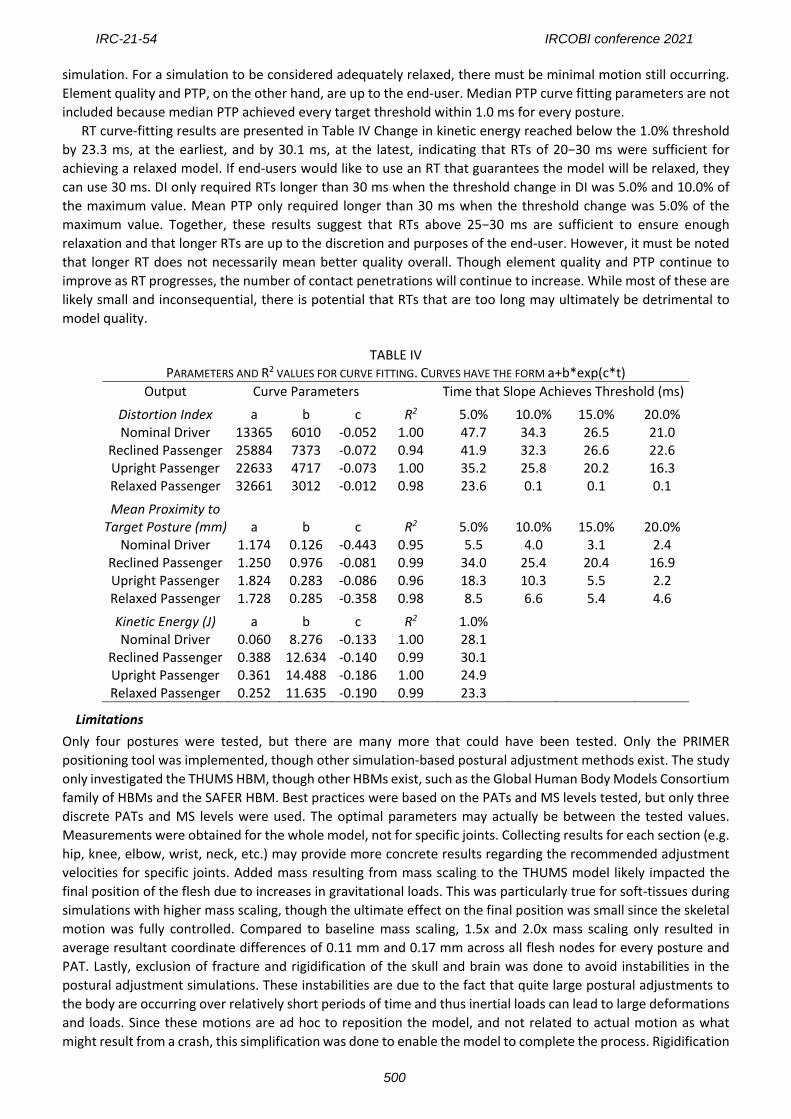
simulation. For a simulation to be considered adequately relaxed, there must be minimal motion still occurring. Element quality and PTP, on the other hand, are up to the end-user. Median PTP curve fitting parameters are not included because median PTP achieved every target threshold within 1.0 ms for every posture.
RT curve-fitting results are presented in Table IV Change in kinetic energy reached below the 1.0% threshold by 23.3 ms, at the earliest, and by 30.1 ms, at the latest, indicating that RTs of 20−30 ms were sufficient for achieving a relaxed model. If end-users would like to use an RT that guarantees the model will be relaxed, they can use 30 ms. DI only required RTs longer than 30 ms when the threshold change in DI was 5.0% and 10.0% of the maximum value. Mean PTP only required longer than 30 ms when the threshold change was 5.0% of the maximum value. Together, these results suggest that RTs above 25−30 ms are sufficient to ensure enough relaxation and that longer RTs are up to the discretion and purposes of the end-user. However, it must be noted that longer RT does not necessarily mean better quality overall. Though element quality and PTP continue to improve as RT progresses, the number of contact penetrations will continue to increase. While most of these are likely small and inconsequential, there is potential that RTs that are too long may ultimately be detrimental to model quality.
TABLE IV
PARAMETERS AND R2 VALUES FOR CURVE FITTING. CURVES HAVE THE FORM a+b*exp(c*t) Output Curve Parameters
R2
Time that Slope Achieves Threshold (ms)
Distortion Index a b c 5.0% 10.0% 15.0% 20.0% Nominal Driver 13365 6010 -0.052 1.00 47.7 34.3 26.5 21.0
Reclined Passenger 25884 7373 -0.072 0.94 41.9 32.3 26.6 22.6 Upright Passenger 22633 4717 -0.073 1.00 35.2 25.8 20.2 16.3 Relaxed Passenger 32661 3012 -0.012 0.98 23.6 0.1 0.1 0.1
Mean Proximity to Target Posture (mm) a b c R2 5.0% 10.0% 15.0% 20.0%
Nominal Driver 1.174 0.126 -0.443 0.95 5.5 4.0 3.1 2.4 Reclined Passenger 1.250 0.976 -0.081 0.99 34.0 25.4 20.4 16.9 Upright Passenger 1.824 0.283 -0.086 0.96 18.3 10.3 5.5 2.2 Relaxed Passenger 1.728 0.285 -0.358 0.98 8.5 6.6 5.4 4.6
Kinetic Energy (J) a b c R2 1.0%
Nominal Driver 0.060 8.276 -0.133 1.00 28.1 Reclined Passenger 0.388 12.634 -0.140 0.99 30.1 Upright Passenger 0.361 14.488 -0.186 1.00 24.9 Relaxed Passenger 0.252 11.635 -0.190 0.99 23.3
Limitations Only four postures were tested, but there are many more that could have been tested. Only the PRIMER positioning tool was implemented, though other simulation-based postural adjustment methods exist. The study only investigated the THUMS HBM, though other HBMs exist, such as the Global Human Body Models Consortium family of HBMs and the SAFER HBM. Best practices were based on the PATs and MS levels tested, but only three discrete PATs and MS levels were used. The optimal parameters may actually be between the tested values. Measurements were obtained for the whole model, not for specific joints. Collecting results for each section (e.g. hip, knee, elbow, wrist, neck, etc.) may provide more concrete results regarding the recommended adjustment velocities for specific joints. Added mass resulting from mass scaling to the THUMS model likely impacted the final position of the flesh due to increases in gravitational loads. This was particularly true for soft-tissues during simulations with higher mass scaling, though the ultimate effect on the final position was small since the skeletal motion was fully controlled. Compared to baseline mass scaling, 1.5x and 2.0x mass scaling only resulted in average resultant coordinate differences of 0.11 mm and 0.17 mm across all flesh nodes for every posture and PAT. Lastly, exclusion of fracture and rigidification of the skull and brain was done to avoid instabilities in the postural adjustment simulations. These instabilities are due to the fact that quite large postural adjustments to the body are occurring over relatively short periods of time and thus inertial loads can lead to large deformations and loads. Since these motions are ad hoc to reposition the model, and not related to actual motion as what might result from a crash, this simplification was done to enable the model to complete the process. Rigidification
IRC-21-54 IRCOBI conference 2021
500

affected only a small amount of the total elements in the model (12%) and therefore should not greatly impact element quality measures. The same simplification was used in all simulations thereby not diminishing relative comparison and selection of best practices. Furthermore, due to the method of prescribed motion, these changes could not affect the final posture.
V. CONCLUSIONS
The purpose of this study was to determine best practices for postural adjustment of HBMs through simulation practices. The following conclusions are based on the results and analysis of the study.
• The THUMS v4.1 was adjusted to four distinct realistic postures while adjusting the postural adjustment time and mass scaling.
• A mass scaling of 1.5x baseline was optimal for decreasing simulation runtime and maintaining element quality and proximity to the target posture.
• Postural adjustment times of 50 ms resulted in poorer element quality compared to 100 ms and 150 ms, even for smaller adjustments. Postural adjustment times of 150 ms offered minimal benefit compared to 100 ms.
• When using a postural adjustment time of 100 ms, mean joint angular velocities ranged widely depending on the body location but up to 367 deg/s in the elbows (in the Reclined Passenger).
• When using a postural adjustment time of 100 ms, relaxation times of 20−30 ms were generally sufficient for preserving element quality and proximity to the target posture.
In summary, mass scaling of 1.5x baseline, postural adjustment time of 100 ms, and 30 ms of relaxation time
is optimal for the simulation test matrix examined in this study across four HBM postural adjustments. These recommendations are aimed at being both model- and solver-neutral and may be used as general rules for HBM repositioning.
VI. ACKNOWLEDGEMENTS
The Wake Forest University team gratefully acknowledge the support of the Toyota Collaborative Safety Research Center and Toyota Motor Corporation. This work was facilitated and improved through our regular collaboration with Mitsutoshi Masuda, Shigeki Hyashi, Yoshiki Takahiri, Haruthosi Motojima and Takeshi Yamamoto.
VII. REFERENCES
[1] Iwamoto, M., Kisanuki, Y., et al. (2002) Development of a Finite Element Model of the Total Human Model for Safety (THuMS) and Application to Injury Reconstruction. Proceedings of the 2002 International Research Council on Biomechanics of Injury, 2002. Munich, Germany
[2] Gayzik, F.S., Moreno, D.P., Vavalle, N.A., Rhyne, A.C., and Stitzel, J.D. (2012) Development of a full human body finite element model for blunt injury prediction utilizing a multi-modality medical imaging protocol. Proceedings of the 12th International LS-DYNA Users Conference, 2012. Detroit, MI
[3] EuroNCAP. (2017) Pedestrian Testing Protocol. European New Car Assessment Programme. [4] Klug, C., Feist, F., et al. (2017) Development of a Procedure to Compare Kinematics of Human Body Models
for Pedestrian Simulations. Proceedings of the 2017 International Research Council on Biomechanics of Injury, 2017. Antwerp, Belgium
[5] Ando, T., Kitagawa, Y., and Eggers, A. (2019) Influence of Posture Adjustment Methods for Human Body Models on Injury Prediction. Proceedings of the 2019 International Research Council on Biomechanics of Injury, 2019. Florence, Italy
[6] Hwang, E., Hu, J., et al. (2016) Development, Evaluation, and Sensitivity Analysis of Parametric Finite Element Whole-Body Human Models in Side Impacts. Stapp Car Crash J, 60: p.473-508.
[7] Schwartz, D., Guleyupoglu, B., Koya, B., Stitzel, J.D., and Gayzik, F.S. (2015) Development of a Computationally Efficient Full Human Body Finite Element Model. Traffic Inj Prev, 16(sup1): p.S49-S56.
[8] "PIPER Project" Internet http://www.piper-project.eu/doc. [9] Desai, C., Sharma, G., et al. (2012) A Generic Positioning Tool for Human Body FE Models. Proceedings of the
2012 International Research Council on Biomechanics of Injury, 2012. Dublin, Ireland
IRC-21-54 IRCOBI conference 2021
501
[10] Marzougui, D., Opiela, K., and Kan, S. (2011) Development & Validation of a Finite Element Model for the 2010 Toyota Yaris Passenger Sedan. George Washington University: Washington, DC.
[11] Marzougui, D., Samaha, R.R., Cui, C., and Kan, S. (2012) Extended Validation of the Finite Element Model for the 2010 Toyota Yaris Passenger Sedan. George Washington University: Washington, DC.
[12] Reichert, R., Park, C.-K., and Morgan, R.M. (2014) Development of integrated vehicle-occupant model for crashworthiness safety analysis. National Crash Analysis Center: Washington, DC.
[13] Patalak, J., Davis, M., Gaewsky, J., Stitzel, J., and Harper, M. (2018) Influence of Driver Position and Seat Design on Thoracolumbar Loading During Frontal Impacts. SAE International, (SAE Technical Paper 2018-01-0544).
[14] Reed, M.P., Manary, M.A., Flannagan, C.A.C., and Schneider, L. (2002) A Statistical Method for Predicting Automobile Driving Posture. Human Factors, 44(4): p.557-568.
[15] Reed, M.P., Manary, M.A., Flannagan, C.A.C., and Schneider, L.W. (2000) Effects of Vehicle Interior Geometry and Anthropometric Variables on Automobile Driving Posture. Human Factors, 42(4): p.541-552.
[16] Reed, M.P., Ebert, S.M., and Jones, M.L.H. (2019) Posture and belt fit in reclined passenger seats. Traffic Injury Prevention, 20(sup1): p.S38-S42.
[17] Reed, M.P. and Ebert, S.M. (2016) Upper-Extremity Postures and Activities in Naturalistic Driving. University of Michigan Transportation Research Institute.
[18] Reed, M.P., Ebert, S.M., Jones, M.L.H., and Hallman, J.J. (2020) Prevalence of non-nominal seat positions and postures among front-seat passengers. Traffic Inj Prev: p.1-6.
[19] LSTC. (2018) LS-Dyna Keyword User's Manual. Livermore Software Technology Corporation: Livermore, CA. [20] Shapiro, S.S. and Wilk, M.B. (1965) An analysis of variance test for normality (complete samples).
Biometrika, 52(3/4): p.591-611. [21] LaMorte, W.W. "Mann Whitney U Test (Wilcoxon Rank Sum Test)" Internet
https://sphweb.bumc.bu.edu/otlt/mph-modules/bs/bs704_nonparametric/bs704_nonparametric4.html.
[22] Rosner, B., (2016) "Fundamentals of Biostatistics 8th Edition". Boston: Cengage Learning. [23] NCSS. "Nonparametric Analysis in NCSS" Internet https://www.ncss.com/software/ncss/nonparametric-
analysis-in-ncss/.
IRC-21-54 IRCOBI conference 2021
502
VIII. APPENDIX A. NCAC VEHICLE SEAT FOAM VALIDATION
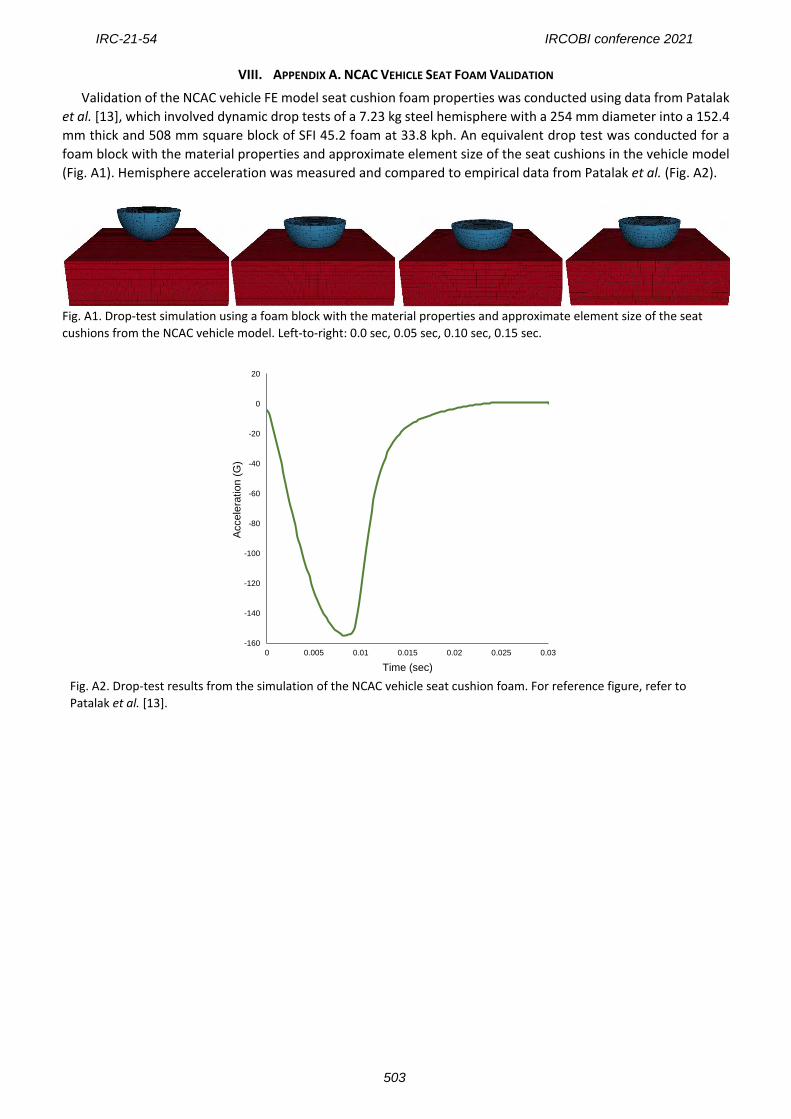
Validation of the NCAC vehicle FE model seat cushion foam properties was conducted using data from Patalak et al. [13], which involved dynamic drop tests of a 7.23 kg steel hemisphere with a 254 mm diameter into a 152.4 mm thick and 508 mm square block of SFI 45.2 foam at 33.8 kph. An equivalent drop test was conducted for a foam block with the material properties and approximate element size of the seat cushions in the vehicle model (Fig. A1). Hemisphere acceleration was measured and compared to empirical data from Patalak et al. (Fig. A2).
Fig. A1. Drop-test simulation using a foam block with the material properties and approximate element size of the seat cushions from the NCAC vehicle model. Left-to-right: 0.0 sec, 0.05 sec, 0.10 sec, 0.15 sec.
Fig. A2. Drop-test results from the simulation of the NCAC vehicle seat cushion foam. For reference figure, refer to Patalak et al. [13].
-160
-140
-120
-100
-80
-60
-40
-20
0
20
0 0.005 0.01 0.015 0.02 0.025 0.03
Acce
lera
tion
(G)
Time (sec)
IRC-21-54 IRCOBI conference 2021
503

IX. APPENDIX B. DETAILED POSTURE MEASUREMENTS
The PRIMER positioning tool functions by defining a new set of joint nodes and coordinate systems that are used to reference the motions of the joints. These nodes and coordinate systems are not native to the out-of-box THUMS model. To accommodate all methods of simulation-based repositioning, not just PRIMER, the THUMS nodes closest to each coordinate system’s origin node from the PRIMER positioning tool were determined and used for reference. These nodes were then used as the origin to create adjusted coordinate systems that can be used without PRIMER. Coordinate systems were created using the *DEFINE_COORDINATE_NODES card in LS-DYNA, which defines a coordinate system using the locations of three nodes: the origin, a node along the X-axis, and a node in the XY plane (this can also be a node along the Y-axis). Table I gives the node used as the origin for each joint, the node used to determine the direction of the X-axis, and the node used to determine the location of the Y-axis. These coordinate systems are used as the reference values for defining the angles in Table B2. The orientation of each coordinate system is equivalent to those in PRIMER. The origins of the hip coordinate systems were used for the H-point.
IRC-21-54 IRCOBI conference 2021
504

TABLE B1 THUMS NODES DESIGNATED AS JOINT NODES AND COORDINATES OF THE NODES USED FOR THE CORRESPONDING JOINT
COORDINATE SYSTEMS
Joint Origin Node Axis Location Nodal Coordinates (mm)
X Y Z
L5-S1 89071098 Origin -2.6 0.0 0.5 X-Axis 7.4 0.0 0.5 Y-Axis -2.6 10.0 0.5
T12-L1 89071703 Origin 96.5 0.0 143.2 X-Axis 106.5 0.0 143.2 Y-Axis 96.5 10.0 143.2
C7-T1 89000708 Origin 95.9 0.0 403.3 X-Axis 105.9 0.0 403.3 Y-Axis 95.9 10.0 403.3
C1 89077127 Origin 111.6 0.0 523.2 X-Axis 121.6 0.0 523.2 Y-Axis 111.6 10.0 523.2
R Hip 81104707 Origin -100.5 90.7 -59.4 X-Axis -90.5 90.7 -59.4 Y-Axis -100.5 100.7 -59.4
R Knee 81075426 Origin -503.0 144.3 94.6 X-Axis -493.8 142.8 90.9 Y-Axis -502.1 154.1 92.9
R Ankle 81013428 Origin -809.5 97.8 -227.2 X-Axis -799.5 97.7 -227.2 Y-Axis -809.3 107.8 -227.9
L Hip 82104707 Origin -100.5 -90.7 -59.4 X-Axis -90.5 -90.7 -59.4 Y-Axis -100.5 -80.7 -59.4
L Knee 82075426 Origin -503.0 -144.3 94.6 X-Axis -493.8 -142.8 90.9 Y-Axis -503.9 -134.5 96.3
L Ankle 82013428 Origin -809.5 -97.8 -227.2 X-Axis -799.5 -97.7 -227.2 Y-Axis -809.6 -87.8 -226.5
R Shoulder 85006051 Origin 87.1 175.2 327.8 X-Axis 97.1 175.2 327.8 Y-Axis 87.1 185.2 327.8
R Elbow 85004632 Origin -142.2 211.8 159.5 X-Axis -135.8 215.2 152.7 Y-Axis -143.1 221.1 163.3
R Wrist 85001430 Origin -309.8 157.4 342.9 X-Axis -303.4 160.7 336.0 Y-Axis -310.7 166.6 346.6
L Shoulder 86006051 Origin 87.1 -175.2 327.8 X-Axis 97.1 -175.2 327.8 Y-Axis 87.1 -165.2 327.8
L Elbow 86004632 Origin -142.2 -211.8 159.5 X-Axis -135.8 -215.2 152.7 Y-Axis -141.3 -202.6 155.8
L Wrist 86001430 Origin -309.8 -157.4 342.9 X-Axis -303.4 -160.7 336.0 Y-Axis -308.9 -148.1 339.2
IRC-21-54 IRCOBI conference 2021
505

TABLE B2 PRIMER POSITIONING TOOL H-POINT ADJUSTMENTS AND JOINT ANGLE DISPLACEMENTS FOR EACH POSTURE. TRANSLATION AND
ROTATION ABOUT THE H-POINT MOVES THE ENTIRE THUMS MODEL Nominal Driver Reclined Passenger Upright Passenger Relaxed Passenger
H-Point X Y Z X Y Z X Y Z X Y Z Translation (mm) 53.8 0.0 -66.1 30.0 0.0 -60.0 45.0 0.0 -73.0 19.1 0.0 -28.6
Rotation (deg) 0.0 14.7 0.0 0.0 9.7 0.0 0.0 1.6 0.0 0.0 3.2 0.0
Joint Angle (degrees)
X Y Z X Y Z X Y Z X Y Z L5-S1 0.0 -6.4 0.0 0.0 0.8 0.0 0.0 -22.0 0.0 -1.3 -6.1 -4.2
T12-L1 0.0 0.4 0.0 0.0 27.1 0.0 0.0 33.0 0.0 -1.3 -0.2 -4.0 C7-T1 0.0 -2.2 0.0 0.0 -6.6 0.0 0.0 -8.4 0.0 0.0 2.4 0.0
C1-Occ 0.0 6.0 0.0 0.0 0.0 0.0 0.0 -4.6 0.0 15.0 -5.9 42.0 R Hip 0.0 -4.8 0.0 0.0 -19.0 0.0 0.0 0.0 -8.0 -62.3 38.3 12.9
R Knee 0.0 5.4 0.0 0.0 4.8 0.0 0.0 -31.9 0.0 0.0 -40.0 0.0 R Ankle 0.0 -1.4 0.0 0.0 -20.0 0.0 6.0 -16.0 2.0 -0.8 -3.1 -15.0
L Hip 0.0 -4.8 0.0 0.0 -19.0 0.0 0.0 0.0 8.0 -10.5 -7.8 15.1 L Knee 0.0 5.4 0.0 0.0 4.8 0.0 0.0 -31.9 0.0 0.0 -26.0 0.0 L Ankle 0.0 -1.4 0.0 0.0 -20.0 0.0 -6.0 -16.0 -2.0 1.3 -14.0 -14.0
R Shoulder -11.0 14.0 0.0 17.9 -46.0 32.0 18.6 -37.2 -25.7 35.6 -29.9 -2.2 R Elbow 0.0 -25.0 0.0 0.0 -55.0 0.0 0.0 -20.0 0.0 0.0 -23.0 0.0 R Wrist 25.0 -8.0 0.0 -13.2 15.2 -41.8 0.0 20.0 0.0 30.0 -20.0 20.0
L Shoulder 11.0 14.0 0.0 -17.9 -46.0 -32.0 -18.6 -37.2 25.7 1.6 1.8 40.0 L Elbow 0.0 -25.0 0.0 0.0 -55.0 0.0 0.0 -20.0 0.0 0.0 0.0 0.0 L Wrist -25.0 -8.0 0.0 13.2 15.2 41.8 0.0 20.0 0.0 91.8 15.2 -20.0
TABLE B3
MEAN JOINT ANGULAR VELOCITY (IN DEG/S) FOR EACH POSTURE AND EACH POSTURAL ADJUSTMENT TIME
Nominal Driver Reclined
Passenger Upright
Passenger Relaxed
Passenger PAT (ms) 50 100 150 50 100 150 50 100 150 50 100 150
L5-S1 64 43 32 8 5 4 220 147 110 61 41 31 T12-L1 4 3 2 271 181 135 330 220 165 2 2 1 C7-T1 22 15 11 66 44 33 84 56 42 24 16 12
C1 60 40 30 0 0 0 46 30 23 59 39 30 R Hip 48 32 24 190 126 95 80 53 40 383 255 192
R Knee 54 36 27 48 32 24 319 213 160 400 267 200 R Ankle 14 9 7 200 133 100 160 107 80 31 20 15
L Hip 48 32 24 190 126 95 0 0 0 78 52 39 L Knee 54 36 27 48 32 24 319 213 160 260 173 130 L Ankle 14 9 7 200 133 100 160 107 80 140 93 70
R Shoulder 140 93 70 460 307 230 372 248 186 299 200 150 R Elbow 250 167 125 550 367 275 200 133 100 230 153 115 R Wrist 80 53 40 152 101 76 200 133 100 200 133 100
L Shoulder 140 93 70 460 306 230 372 248 186 18 12 9 L Elbow 250 167 125 550 367 275 200 133 100 0 0 0 L Wrist 80 53 40 152 101 76 200 133 100 152 101 76
IRC-21-54 IRCOBI conference 2021
506
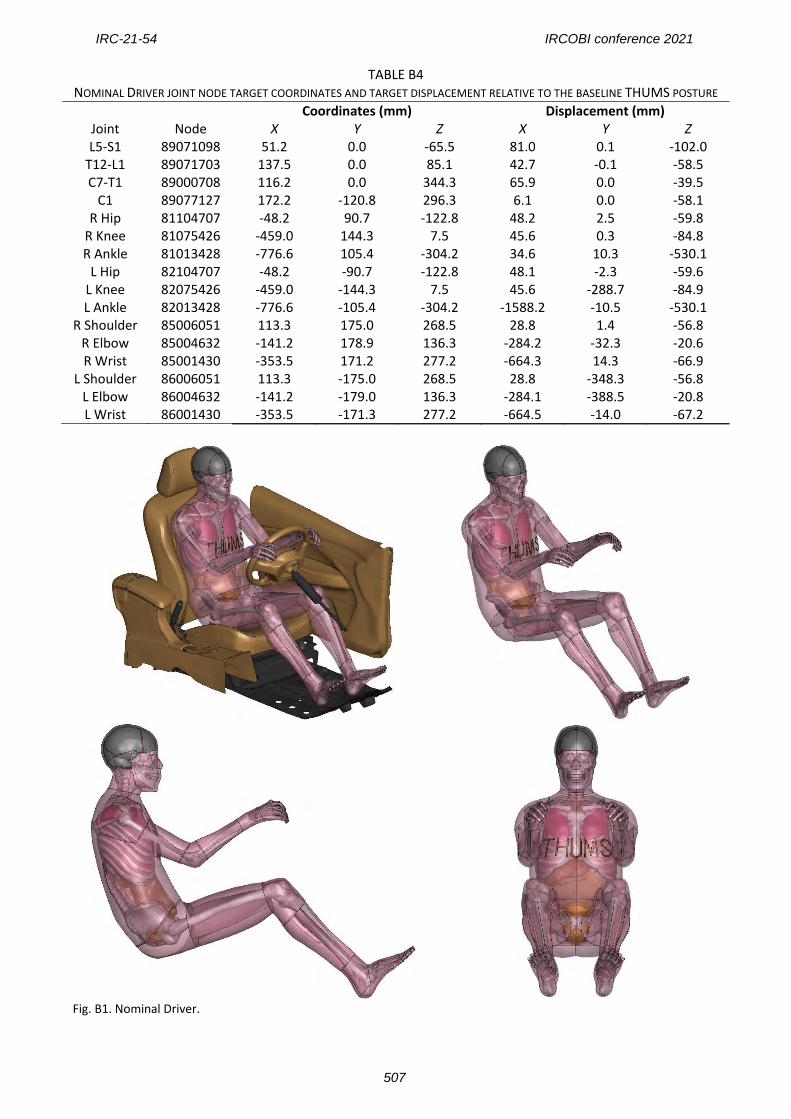
TABLE B4 NOMINAL DRIVER JOINT NODE TARGET COORDINATES AND TARGET DISPLACEMENT RELATIVE TO THE BASELINE THUMS POSTURE
Joint Node Coordinates (mm) Displacement (mm)
X Y Z X Y Z L5-S1 89071098 51.2 0.0 -65.5 81.0 0.1 -102.0
T12-L1 89071703 137.5 0.0 85.1 42.7 -0.1 -58.5 C7-T1 89000708 116.2 0.0 344.3 65.9 0.0 -39.5
C1 89077127 172.2 -120.8 296.3 6.1 0.0 -58.1 R Hip 81104707 -48.2 90.7 -122.8 48.2 2.5 -59.8
R Knee 81075426 -459.0 144.3 7.5 45.6 0.3 -84.8 R Ankle 81013428 -776.6 105.4 -304.2 34.6 10.3 -530.1
L Hip 82104707 -48.2 -90.7 -122.8 48.1 -2.3 -59.6 L Knee 82075426 -459.0 -144.3 7.5 45.6 -288.7 -84.9 L Ankle 82013428 -776.6 -105.4 -304.2 -1588.2 -10.5 -530.1
R Shoulder 85006051 113.3 175.0 268.5 28.8 1.4 -56.8 R Elbow 85004632 -141.2 178.9 136.3 -284.2 -32.3 -20.6 R Wrist 85001430 -353.5 171.2 277.2 -664.3 14.3 -66.9
L Shoulder 86006051 113.3 -175.0 268.5 28.8 -348.3 -56.8 L Elbow 86004632 -141.2 -179.0 136.3 -284.1 -388.5 -20.8 L Wrist 86001430 -353.5 -171.3 277.2 -664.5 -14.0 -67.2
Fig. B1. Nominal Driver.
IRC-21-54 IRCOBI conference 2021
507

TABLE B5 RECLINED PASSENGER JOINT NODE TARGET COORDINATES AND TARGET DISPLACEMENT RELATIVE TO THE BASELINE THUMS POSTURE
Joint Node Coordinates (mm) Displacement (mm)
X Y Z X Y Z L5-S1 89071098 27.5 0.0 -59.1 51.2 -0.1 -102.3
T12-L1 89071703 152.1 0.0 61.1 57.3 -1.0 -83.1 C7-T1 89000708 315.8 0.0 263.2 245.4 0.0 -154.6
C1 89077127 393.6 0.0 355.8 251.2 0.1 -167.4 R Hip 81104707 -79.3 90.7 -101.1 21.2 2.4 -37.9
R Knee 81075426 -501.3 144.3 -13.6 8.1 0.5 -105.9 R Ankle 81013428 -781.8 104.7 -358.2 28.7 8.9 -583.9
L Hip 82104707 -79.3 -90.7 -101.1 21.1 -2.2 -37.7 L Knee 82075426 -501.3 -144.3 -13.6 8.0 -288.8 -105.9 L Ankle 82013428 -781.8 -104.7 -358.2 -1593.4 -9.7 -584.2
R Shoulder 85006051 260.7 174.4 209.7 160.0 0.6 -119.0 R Elbow 85004632 21.3 220.1 58.5 -139.2 11.1 -98.9 R Wrist 85001430 -218.7 153.3 6.5 -543.5 -5.4 -332.7
L Shoulder 86006051 260.7 -174.4 209.7 160.0 -347.3 -118.8 L Elbow 86004632 21.4 -220.0 58.5 -139.5 -431.5 -98.5 L Wrist 86001430 -218.7 -153.3 6.5 -543.5 6.2 -333.7
Fig. B2. Reclined Passenger.
IRC-21-54 IRCOBI conference 2021
508
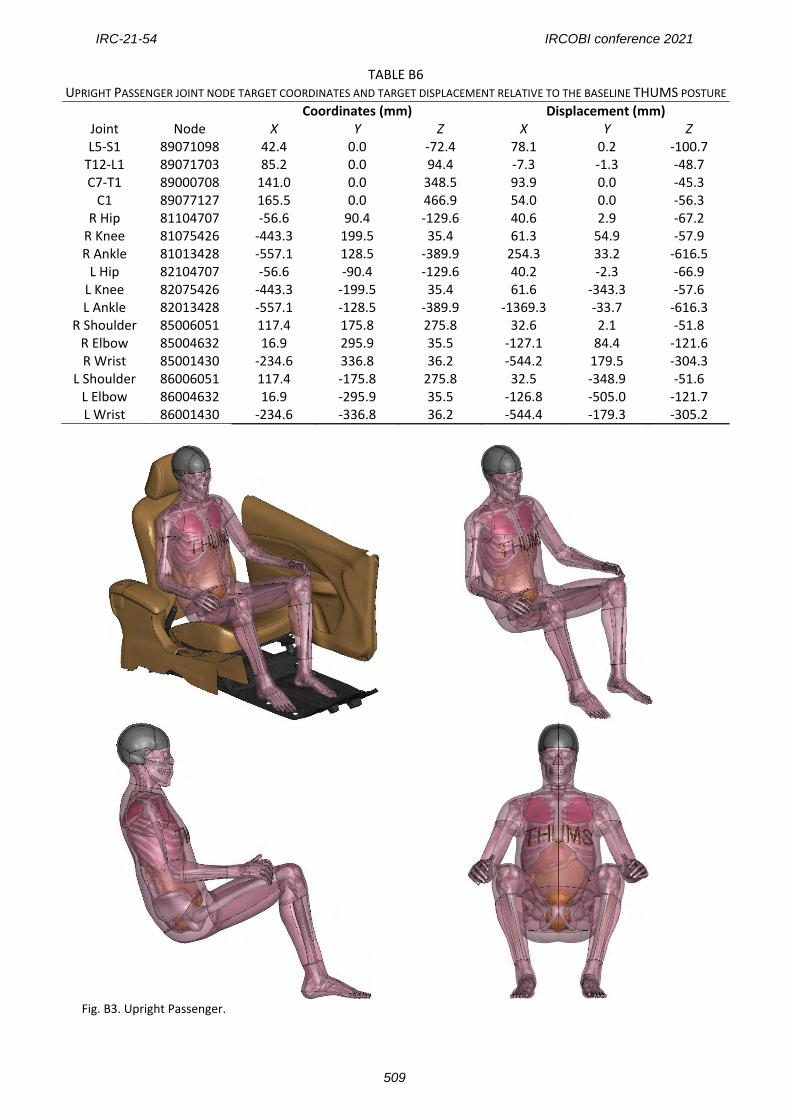
TABLE B6 UPRIGHT PASSENGER JOINT NODE TARGET COORDINATES AND TARGET DISPLACEMENT RELATIVE TO THE BASELINE THUMS POSTURE
Joint Node Coordinates (mm) Displacement (mm)
X Y Z X Y Z L5-S1 89071098 42.4 0.0 -72.4 78.1 0.2 -100.7
T12-L1 89071703 85.2 0.0 94.4 -7.3 -1.3 -48.7 C7-T1 89000708 141.0 0.0 348.5 93.9 0.0 -45.3
C1 89077127 165.5 0.0 466.9 54.0 0.0 -56.3 R Hip 81104707 -56.6 90.4 -129.6 40.6 2.9 -67.2
R Knee 81075426 -443.3 199.5 35.4 61.3 54.9 -57.9 R Ankle 81013428 -557.1 128.5 -389.9 254.3 33.2 -616.5
L Hip 82104707 -56.6 -90.4 -129.6 40.2 -2.3 -66.9 L Knee 82075426 -443.3 -199.5 35.4 61.6 -343.3 -57.6 L Ankle 82013428 -557.1 -128.5 -389.9 -1369.3 -33.7 -616.3
R Shoulder 85006051 117.4 175.8 275.8 32.6 2.1 -51.8 R Elbow 85004632 16.9 295.9 35.5 -127.1 84.4 -121.6 R Wrist 85001430 -234.6 336.8 36.2 -544.2 179.5 -304.3
L Shoulder 86006051 117.4 -175.8 275.8 32.5 -348.9 -51.6 L Elbow 86004632 16.9 -295.9 35.5 -126.8 -505.0 -121.7 L Wrist 86001430 -234.6 -336.8 36.2 -544.4 -179.3 -305.2
Fig. B3. Upright Passenger.
IRC-21-54 IRCOBI conference 2021
509

TABLE B7 RELAXED PASSENGER JOINT NODE TARGET COORDINATES AND TARGET DISPLACEMENT RELATIVE TO THE BASELINE THUMS POSTURE
Joint Node Coordinates (mm) Displacement (mm)
X Y Z X Y Z L5-S1 89071098 16.5 0.0 -28.0 45.4 -2.5 -65.4
T12-L1 89071703 108.8 -9.9 118.8 14.1 -9.8 -24.9C7-T1 89000708 107.7 24.3 376.6 55.7 6.4 -11.3
C1 89077127 126.3 31.3 495.9 14.9 31.7 -27.6R Hip 81104707 -87.4 89.0 -86.0 12.6 0.3 -20.3
R Knee 81075426 -401.0 179.2 200.7 103.4 34.1 107.9R Ankle 81013428 -404.7 -259.9 123.6 404.0 -355.2 -102.1
L Hip 82104707 -83.8 -90.0 -81.4 12.5 -3.6 -18.4L Knee 82075426 -476.8 -223.6 46.4 27.5 -367.5 -46.0L Ankle 82013428 -576.0 -242.8 -388.8 -1386.8 -147.0 -614.8
R Shoulder 85006051 172.2 176.4 280.8 87.6 1.2 -45.9R Elbow 85004632 103.7 324.4 44.9 -40.1 113.3 -112.6R Wrist 85001430 -145.1 343.2 -11.6 -452.7 184.4 -358.7
L Shoulder 86006051 28.7 -141.6 322.1 -57.0 -312.3 -3.5L Elbow 86004632 -188.1 -256.1 173.3 -331.9 -464.9 16.4L Wrist 86001430 -359.7 -226.4 359.0 -671.2 -75.4 17.6
Fig. B4. Relaxed Passenger.
IRC-21-54 IRCOBI conference 2021
510