effect of reinforcement and pre-stressing …etd.lib.metu.edu.tr/upload/12614872/index.pdf ·...
TRANSCRIPT
EFFECT OF REINFORCEMENT AND PRE-STRESSING FORCE ON ASR
EXPANSION
A THESIS SUBMITTED TO
THE GRADUATE SCHOOL OF NATURAL AND APPLIED SCIENCES
OF
MIDDLE EAST TECHNICAL UNIVERSITY
BY
ORHAN MUSAOĞLU
IN PARTIAL FULFILLMENT OF THE REQUIREMENTS
FOR
THE DEGREE OF MASTER OF SCIENCE
IN
CIVIL ENGINEERING
SEPTEMBER 2012
Approval of the thesis:
EFFECT OF REINFORCEMENT AND PRE-STRESSING FORCE ON ASR
EXPANSION
submitted by ORHAN MUSAOĞLU in partial fulfillment of the requirements for
the degree of Master of Science in Civil Engineering Department, Middle East
Technical University by,
Prof. Dr. Canan Özgen _____________________
Dean, Graduate School of Natural and Applied Sciences
Prof. Dr. Güney Özcebe _____________________
Head of Department, Civil Engineering
Assoc.Prof. Dr. Lutfullah Turanlı _____________________
Supervisor, Civil Engineering Dept., METU
Assoc.Prof. Dr. Afşin Sarıtaş _____________________
Co-Supervisor, Civil Engineering Dept., METU
Examining Committee Members:
Prof. Dr. Mustafa Tokyay __________________
Civil Engineering Dept., METU
Assoc. Prof. Dr. Lutfullah Turanlı __________________
Civil Engineering Dept., METU
Assoc.Prof. Dr. Afşin Sarıtaş __________________
Civil Engineering Dept., METU
Asst. Prof. Dr. Sinan Turhan Erdoğan __________________
Civil Engineering Dept., METU
Dr. Fatih Bektaş __________________
Dept. of Civil, Const & Enve. Eng., Iowa State Universty
Date: 12.09.2012
iii
I hereby declare that all information in this document has been obtained and
presented in accordance with academic rules and ethical conduct. I also declare
that, as required by these rules and conduct, I have fully cited and referenced
all material and results that are not original to this work.
Name, Last Name : ORHAN MUSAOĞLU
Signature :
iv
ABSTRACT
EFFECT OF REINFORCEMENT AND PRE-STRESSING FORCE ON ASR
EXPANSION
Musaoğlu, Orhan
M.Sc., Department of Civil Engineering
Supervisor : Assoc. Prof. Dr. Lütfullah Turanlı
Co-Supervisor: Assoc. Prof. Dr. Afşin Sarıtaş
August 2012, 111 pages
Alkali Silica Reaction in concrete is a chemical deterioration process occurring
between alkalis in cement paste and reactive aggregates. ASR increases expansion
and cracking as well as other durability problems such as freezing and thawing. It is
most probable that concrete structure will collapse unless mechanical, mineral, or
chemical preventive measures are taken against ASR or this problem is realized and
solved in the design stage of the concrete structure or later on.
Rather than ordinary preventive measures in which mineral admixtures are used,
mechanical ones were investigated in this study. In the experiment done by using the
accelerated mortar bar method, reinforced concrete specimens on which pre-stressing
force was applied were examined. The effects of reinforcement ratio and pre-
stressing force on ASR based expansion and cracking were studied. Expansion and
cracking developments in time were followed, and the connection between these
phenomena and the energy produced by ASR was made. By applying the same
mechanical preventive measures on the specimens prepared by using different
reactive aggregates, the effectiveness of these methods with respect to the degree of
v
ASR was investigated. Also, the methods in question were compared with traditional
preventive measures (fly ash).
The investigation results show that reinforcement and pre-stressing force play a
significant role in diminishing the effects of ASR.
Keywords: Alkali-Silica Reaction, Reinforced Concrete Specimen, Pre-stressed
Concrete, Mechanical Preventive Measures, Energy of ASR
vi
ÖZ
DONATININ VE ÖNGERME KUVVETİNİN ASR GENLEŞMESİ
ÜZERİNDEKİ ETKİSİ
Musaoğlu, Orhan
Yüksek Lisans, İnşaat Mühendisliği Bölümü
Tez Yöneticisi : Doç.Dr. Lutfullah Turanlı
Ortak Tez Yöneticisi: Doç.Dr. Afşin Sarıtaş
Ağustos 2012, 111 sayfa
Betonda Alkali Silika Reaksiyonu, çimento hamurundaki alkaliler ve reaktif
agregalar arasında meydana gelen kimyasal bir bozunmadır. ASR genleşme ve
çatlama gibi problemlerin yanı sıra donma ve çözülme gibi diğer dayanıklılık
sorunlarını da arttırmaktadır. Betonarme yapının tasarım safhasında ya da ilerleyen
zamanlarda ASR’ ye karşı mekanik, mineral ve kimyasal tedbirler alınmaz veya bu
problem fark edilip çözülmez ise yapının yıkılması olasıdır.
Bu çalışmada uçucu kül kullanılarak yapılan alışılmış tedbirlerden ziyade mekanik
önlemler araştırılmıştır. Hızlandırılmış harç çubuğu metodu kullanılarak yapılan
deneyde öngermeli ve betonarme kirişler incelenmiştir. Donatı oranı ve öngermenin
ASR kaynaklı genleşme ve çatlama üzerindeki etkileri tetkik edilmiştir. Zaman
içinde genleşme ve çatlama gelişimi takip edilmiş ve bu olayların ASR’nin ürettiği
enerji ile bağlantısı kurulmuştur. Farklı reaktif agregalar kullanılarak hazırlanan
numunelere de aynı önleyici mekanik tedbirler uygulanarak bu yöntemlerin ASR’nin
derecesine göre etkisi araştırılmıştır. Ayrıca söz konusu yöntemler geleneksel
önleyici tedbirlerle (uçucu kül) de karşılaştırılmıştır.
vii
Araştırma sonuçlarına gore donatı kullanımının ve öngermenin alkali-silika
reaksiyonunun etkilerini azaltmakta büyük rol oynadığı tespit edilmiştir.
Anahtar Kelimeler: Alkali-Silika Reaksiyonu, Betonarme Numune, Öngermeli
Beton, Önleyici Mekanik Tedbirler, ASR Enerjisi
viii
To My Father,
Prof. Dr. Mehman Musaoğlu
ix
ACKNOWLEDGMENTS
I would like to express sincere gratitude to my supervisor Assoc. Prof. Dr. Lutfullah
Turanlı for his continuous supervision, suggestions, and guidance to complete this
master thesis.
I am also very grateful to my co-supervisor Assoc. Prof. Dr. Afşin Sarıtaş for his
suggestions, comments and valuable discussions during the period of this study.
Of course, I would also like to thank my parents Prof. Dr. Mehman Musaoğlu and
Ruziye Musaoğlu, and my brother Anar Musayev for their endless support, and
being my motivation to work.
I am especially thankful to Burhan Aleessa Alam and Cuma Yıldırım for their
technical support.
My special thanks are for my dear girlfriend Gül Bıyıkoğlu for not only helping me
in this study, but also for backing me all the time with all the problems I have faced
during the period of my master thesis. Big help with her great English knowledge in
the preparation of this thesis will never be forgotten. Without her motivation and all
kinds of support, this study would not have been completed.
x
TABLE OF CONTENTS
ABSTRACT ................................................................................................................ iv
ÖZ ............................................................................................................................... vi
ACKNOWLEDGMENTS .......................................................................................... ix
TABLE OF CONTENTS ............................................................................................. x
LIST OF TABLES .................................................................................................... xiv
LIST OF FIGURES ................................................................................................... xv
LIST OF ABBREVIATIONS ................................................................................. xviii
CHAPTERS
INTRODUCTION ....................................................................................................... 1
1.1 General .............................................................................................................. 1
1.2 Objectives and Scope of the Investigation ........................................................ 2
1. THEORY OF ALKALI – AGGREGATE REACTION .......................................... 4
2.1 General ............................................................................................................... 4
2.2 Types of Alkali-Aggregate Reaction .................................................................. 4
2.2.1 Alkali – Carbonate Reaction ........................................................................ 5
2.2.2 Alkali – Silicate Reaction ............................................................................ 6
2.2.3 Alkali – Silica Reaction ............................................................................... 6
2.3 Factors That Affect Alkali-Silica Reaction Expansion ...................................... 9
2.3.1 Nature of Reactive Material ......................................................................... 9
2.3.2 Amount of Reactive Material .................................................................... 11
2.3.4 Alkali Content in Concrete Mix................................................................. 13
2.3.5 Moisture Effect .......................................................................................... 15
2.3.6 Temperature Effect .................................................................................... 17
xi
2.4 Deleterious Effects of Alkali – Silica Reaction ................................................ 18
2.4.1 Cracks ........................................................................................................ 18
2.4.2 Expansion................................................................................................... 22
2.4.3 Gel Exudation and Color Change .............................................................. 22
2.4.4 Surface Spall or ‘Pop-out’ ......................................................................... 23
2.5 Test Methods for Determination of Alkali-Silica Reaction ............................. 23
2.5.1 Petrographic Examination of Aggregates .................................................. 23
2.5.2 Chemical Methods Applied to Aggregates ................................................ 24
2.5.3 Mortar Bar Methods................................................................................... 24
2.5.4 Concrete Prism Method ............................................................................. 25
2.5.5 Autoclave Methods .................................................................................... 26
2.6 Prevention of Alkali-Silica Reaction ................................................................ 27
2.6.1 Avoidance of Reactive Aggregate ............................................................. 27
2.6.2 Limitation of Alkalis in Concrete .............................................................. 27
2.6.3 Avoidance of Moisture .............................................................................. 28
2.6.4 Use of Supplementary Cementing Materials (SCMs) ............................... 28
2.6.5 Use of Chemical Additives ........................................................................ 29
2. THEORY OF PRESTRESSED CONCRETE ....................................................... 30
3.1 General ............................................................................................................. 30
3.2 Methods of Pre-stressing .................................................................................. 31
3.2.1 Pre-tensioning ............................................................................................ 31
3.2.2 Post-tensioning........................................................................................... 31
3.3 Basic Concepts of Prestressing ......................................................................... 32
3.4 Partial Loss of Prestress ................................................................................... 35
3.4.1 Initial Losses .............................................................................................. 36
xii
3.4.2 Time Dependent Losses ............................................................................. 38
3. REVIEW OF RESEARCH ON MECHANICAL PREVENTIVE MEASURES
AGAINST ALKALI – SILICA REACTION ............................................................ 41
4.1 General ............................................................................................................. 41
4.2 Effects of Restraint Conditions on ASR ........................................................... 41
4.3 Effects of Reinforcements on Mechanical Properties of ASR Affected
Concrete Structures. ............................................................................................... 53
4.4 ASR in Prestressed Concrete ............................................................................... 54
4.5 Use of Steel Microfibers to Mitigate Alkali-Silica Expansion ......................... 55
4. EXPERIMENTAL STUDY ................................................................................... 59
5.1 General ............................................................................................................. 59
5.2 The Apparatuses Used ...................................................................................... 60
5.2.1 Mold ........................................................................................................... 60
5.2.2 Pre-stressing Method ................................................................................. 61
5.2.3 Other Equipment ....................................................................................... 62
5.3 Materials ........................................................................................................... 64
5.3.1 Cement ....................................................................................................... 64
5.3.2 Aggregates ................................................................................................. 65
5.3.3 Water .......................................................................................................... 66
5.3.5 Steel Wires ................................................................................................. 66
5.3.5 Mineral Admixtures. .................................................................................. 69
5.4 Investigation Method ........................................................................................ 70
5.5 Calculation of Pre-stressing Load. ................................................................... 72
5.6 The ACI 318-02 Code Limits ........................................................................... 75
5. RESULTS AND DISCUSSION ............................................................................ 76
6.1. General ............................................................................................................ 76
xiii
6.2 Expansion Results ............................................................................................ 77
6.3 Discussion of Results ....................................................................................... 83
6.3.1 Discussion of Expansions .......................................................................... 83
6.3.2 Discussion of Cracks and Other Physical Changes ................................... 91
6.4 Energy Concept ................................................................................................ 95
6. CONCLUSIONS .................................................................................................. 101
7. RECOMMENDATIONS ..................................................................................... 103
REFERENCES ........................................................................................................ 105

xiv
LIST OF TABLES
Table 2.1 Reactive minerals ..................................................................................... 10
Table 3.1 Values of KSH for Post-Tensioned members ............................................ 40
Table 4.1: Beam details [Multon, Seignol, & Toutlemonde, 2005] ........................ 48
Table 4.2 The value of β [Mohammed et.al. 2004] ............................................... 52
Table 5.1: Chemical compositions and physical properties of the cement [Bolu
Çimento,2009] ............................................................................................................ 64
Table 5.2: Physical properties of aggregates............................................................ 65
Table 5.3: Mechanical properties of wires ................................................................. 67
Table 5.4: Physical properties and chemical composition of fly ash [Uzal et al. 2007].
.................................................................................................................................... 70
Table 5.5: Grading requirements according to ASTM C1260 ................................. 71
Table 6.1: Average expansions of specimens .......................................................... 83
Table 6.2: Finding the area under the curve which is given in Figure 6.24 ............. 98
Table 6.3: Finding the area under the curve which is given in Figure 6.25 ............. 99
xv
LIST OF FIGURES
Figure 2.1 Photomicrograph of a thin section [ Page & Page, 2007 ]. ..................... 7
Figure 2.2 The unreinforced concrete bar that is exposed to alkali-silica reaction. ... 7
Figure 2.3 Effect of rock types on ASR expansion [Blanks & Kennedy, 1955]. ...... 9
Figure 2.4 The Opal percentage in aggregate versus expansion graph (pessimum
proportion) [Woods, 1968]......................................................................................... 11
Figure 2.5 Size effect of reactive material on expansion [Woods, 1968] ................ 13
Figure 2.6 Cement alkali content effect of specimen on expansion [Woods, 1968]. 14
Figure 2.7 Expansion graph of concrete which is subjected to alkali-silica reaction
depending on relative humidity [Neville, 1990] ........................................................ 16
Figure 2.8 Change of percent of alkalis reacted under different temperatures
[Swamy, 1992] ........................................................................................................... 18
Figure 2.9 Reinforced concrete bar exposed to ASR ............................................... 19
Figure 2.10 Illustration of the unreinforced concrete prism [Blight & Alexander,
2011]. ......................................................................................................................... 20
Figure 2.11 Expansion-age graph of the concrete samples including reactive
aggregates [Page & Page, 2007] ................................................................................ 26
Figure 2.12 Expansion graphs that consist different amount of silica fume. .......... 29
Figure 3.1 Prestressed beam [Nawy, 2003] ............................................................. 34
Figure 3.2 Tendon types in prestressed beam [Nawy, 2003] ................................... 35
Figure 4.1 Expansions of samples due to ASR under uniaxial loads [Cyrille &
Karen, 2012]. .............................................................................................................. 43
Figure 4.2 Axial versus radial imposed strains under different loads due to ASR
under uniaxial loads [Stephen & François, 2006]. ..................................................... 44
Figure 4.3 Volume expansions of samples [Cyrille & Karen, 2012]. ...................... 44
Figure 4.4: Experimental equipment which measures ASR expansive pressure
[Berra, Faggiani, Mangialardi, & Paolini, 2010]. ...................................................... 45
xvi
Figure 4.5 Relationship between compressive stress and ASR expansion [Berra,
et.al 2010]. .................................................................................................................. 46
Figure 4.6 Strain versus time graph of ASR affected beams [Multon, Seignol, &
Toutlemonde, 2005] .................................................................................................. 48
Figure 4.7 Restraint conditions [Mohammed, et al., 2004] ................................... 49
Figure 4.8 Longitudinal Surface Strain [Mohammed, et al., 2004] ....................... 50
Figure 4.9 Lateral Surface Strain [Mohammed, et al., 2004] ............................... 50
Figure 4.10 Prestress – longitudinal strain relationship [Kobayashi, et al.,1988] . 55
Figure 5.1: Mold ...................................................................................................... 61
Figure 5.2: End plates and anchorages.....................................................................61
Figure 5.3: Inner side of end plate .......................................................................... 61
Figure 5.4: Pre-stressing method ............................................................................. 62
Figure 5.5: Aparatus for measurement of length.......................................................63
Figure 5.6 : Sieve machine.........................................................................................63
Figure 5.7: The standard mini mixer .......................................................................... 63
Figure 5.8: Steel Wire with 60 kg capacity................................................................66
Figure 5.9: Tension test .............................................................................................. 66
Figure 5.10: Stress – Strain graph of Wire 60 KG ................................................... 68
Figure 5.11: Stress – Strain graph of Wire 40 KG ................................................... 68
Figure 5.12: Stress – Strain graph of Wire 20 KG ................................................... 69
Figure 5.13: System to determine friction loss. ....................................................... 72
Figure 6.1: Graph of unreinforced specimens .......................................................... 77
Figure 6.2: Graph of specimens reinforced with Wire 20 KG ................................ 78
Figure 6.3: Graph of specimens reinforced with Wire 40 KG ................................ 78
Figure 6.4: Graph of specimens reinforced with Wire 60 KG ................................ 79
Figure 6.5: Graph of specimens reinforced with Wire 40 KG and PS force was
applied ........................................................................................................................ 79
Figure 6.6: Graph of specimens reinforced with Wire 60 KG and PS force was
applied ........................................................................................................................ 80
Figure 6.7: Graph of unreinforced specimens made with Natural River Sand ........ 80

xvii
Figure 6.8 Graph specimens made with Natural River Sand and PS force was
applied to Wire 60 KG. .............................................................................................. 81
Figure 6.9: Graph of SCM applied specimens made with Perlite and Crushed
Limestone ................................................................................................................... 81
Figure 6.10: Graph of specimen that was reinforced with Wire 40 KG and cured for
7 days. ........................................................................................................................ 82
Figure 6.11: Graph of specimens made with Wire 40 KG and cured for 7 days and
1 day. .......................................................................................................................... 84
Figure 6.12: Specimens which were made with Perlite and Crushed Limestone and
reinforced in different condition ................................................................................ 86
Figure 6.13: Comparison graph of prestressed specimens with non-prestressed ones
.................................................................................................................................... 88
Figure 6.14. Comparison graph of reinforced and PS force applied specimens made
with different type of aggregates................................................................................ 89
Figure 6.15: Comparison graph of mechanical preventive measure with mineral
admixture preventive measure ................................................................................... 90
Figure 6.16: Photo of unreinforced specimen on the first day (UNR) ..................... 92
Figure 6.17: Photo of unreinforced specimen at the end of 30 days (UNR) ............ 92
Figure 6.18: Photo of specimen at the end of 30 days which was reinforced with
Wire 20 KG ................................................................................................................ 92
Figure 6.19: Photo of specimen at the end of 30 days which was reinforced with
Wire 40 KG ................................................................................................................ 93
Figure 6.20: Photo of specimen at the end of 30 days which was reinforced with
Wire 40 KG and PS force was applied....................................................................... 93
Figure 6.21: Photo of specimen at the end of 30 days which was reinforced with
Wire 60 KG and PS force was applied....................................................................... 93
Figure 6.22: Photo of specimen which was reinforced with Wire 60 KG, (a) Day 18
(b) Day 21 (c) Day 30 ................................................................................................ 94
Figure 6.23: Force-displacement diagram of specimen with Wire 60 KG .............. 97
Figure 6.24: Force-displacement diagram of specimen with Wire 40 KG .............. 97
xviii
LIST OF ABBREVIATIONS
ASR :Alkali – Silica Reaction
ACR :Alkali-Carbonate Reaction
RH :Relative Humidity
SCM :Supplementary Cementing Material
PS :Pre-stressing
PC :Pre-stressed Concrete
ES :Elastic Shortening
AL :Anchorage –Seating Loss
SR :Steel Stress Relaxation
CL :Creep Loss
SL :Shrinkage Loss
SF :Silica Fume
MSF :Steel Microfibers
1
CHAPTER I
INTRODUCTION
1.1 General
Concrete is one of the most important materials used by humanity from ancient
Roman times to the world of today. It builds the basis of our modern society, and
thanks to concrete, we have made great progress in contemporary architecture,
urbanism, water and sewage treatment system, and transportation. The word meaning
of concrete is ‘to grow together’ and it has Latin origin [Mindess, 1981; Skalny,
1989].
It is estimated that the annual consumption of concrete is about 7.9 billion m3. [U.S.
Geological Survey, 2003] Having advantages such as being cast, economical,
durable, fire resistant, water resistant, energy efficient, and on-site fabrication leads
concrete to be used very commonly [Mindess, 1981].
The problems of the material with such a common usage should be managed
effectively. Deterioration problems stemming from various reasons are the problems
that concrete will encounter in time, and they cause collapses even in adequately
designed structures (Mehta & Monteiro, 1999). The reasons of deterioration are
physical (e.g. freezing and thawing, wetting and drying, temperature chances, wear
and abrasion), chemical (e.g., leaching and efflorescence, sulfate attack, alkali-
aggregate reaction, acids and alkalis attack, corrosion of materials), and mechanical
(e.g., abrasion) [Neville & Brooks 1987; Mindess, 1981].
Generally, the durability of a structure is its resistance against internal and external
attacks. Concrete must be durable against deterioration. In December, 1962, ACI
2
Committee 201 defined durability as “Its resistance to deteriorating influences which
may through inadvertence or ignorance reside in the concrete itself, or which are
inherent in the environment to which it is exposed” [Woods, 1968].
One of the chemical deterioration types is alkali-aggregate reaction. There are 3
kinds of AAR as alkali-silica reaction, alkali-carbonate reaction, and alkali-silicate
reaction [Swamy, 1992]. In ASR, gel is formed as a result of the chemical reaction
between alkali in cement and silica in aggregate, and this gel swells by absorbing
water. The swelled gel deteriorates the concrete by causing cracks in it. These cracks
enhance other durability problems, too, such as freezing and thawing.
There are several chemical, mineral (use of supplementary cementing material), and
mechanical preventive measures which avoid the occurrence of the ASR or limit the
expansion. A lot of investigations on the use of mineral admixture have been made in
order to overcome this durability problem named as ‘concrete cancer’. However,
there is not enough research about chemical and mechanical preventive measures.
1.2 Objectives and Scope of the Investigation
It is known that the use of mineral admixtures such as pozzolanic and cementitious
materials overcomes the ASR problem. In this experiment, ways of preventing the
problem of ASR mechanically without changing the materials used in concrete
formation were investigated. In order to compare the test results with traditional
preventive measures, specimens prepared with using fly ash (20 % low calcium fly
ash in cement by mass) were tested.
The first objective of this study was to investigate the effectiveness of the use of
reinforcements in concrete structures against ASR expansion. Another main
objective was to identify whether ASR based expansion would be prevented by
applying prestressing force on concrete members and to investigate to what extend
that method was effective if prevention had occurred.
3
When the formation mechanism of ASR based cracks is examined, it can be
observed that the gel swells and the force formed as a result of this swelling leads to
cracks by exceeding the tension strength of concrete. The prevention of crack
formation and expansion by increasing concrete’s tension strength was investigated
in this study. As is known, if pre-stressing force is applied on the reinforcements of
concrete member, the developments of tension force on steel and compressive force
on concrete occur; and the tensile strength of concrete increases due to this
compression. There are very few research in this topic.
In the experiment, wires with 60 kg, 40 kg, and 20 kg capacities were used as
reinforcement, and the dimensions of specimens were in accordance with ASTM
C490 (5x5x287 cm). Pre-stressing force was applied to each wire by hanging 10 kg
load on the two ends of the wire.
The accelerated mortar bar method (ASTM C1260) was used in the experiment to
determine the effectiveness of mechanical preventive measures. One day curing was
applied after the preparation of specimens by using wires and the application of PS
force. Bars were immersed in 1 N NaOH solution after one day curing and their
length change was measured every 3 days in 30 day-period.
Specimens were photographed during every measurement session in order to observe
the development of cracks in the experiment.
Introduction of this thesis is in chapter 1. Theoretical considerations of alkali-
aggregate reaction and pre-stressed concrete are in chapter 2 and chapter 3
respectively. Chapter 4 includes review research on mechanical preventive measures
against ASR. While chapter 5 includes experimental study, chapter 6 contains results
and discussion. Last chapters 7 and 8 contain conclusions and recommendations
respectively.
4
CHAPTER II
THEORY OF ALKALI – AGGREGATE REACTION
2.1 General
Alkali – aggregate reaction in concrete is a chemical reaction between alkalis in
cement paste and reactive forms of silica in aggregates. This chemical reaction needs
water to produce gel and after gel is formed, it swells with the absorption of
moisture. The development of reaction takes between 5 and 12 years and it leads to
excessive expansion and cracking in concrete if a suitable prevention method is not
applied [Swamy, 1992; Popovics, 1992].
Only a few years after their construction (during 1920s and 1930s), many concrete
structures in California, USA started to develop severe cracking, which leaded to
failures. Reasons of cracks were unknown because standards of construction were
acceptable and the quality of building materials was normal. Thomas Stanton of the
California State Division of Highways was the first scientist who identified the cause
of these cracks in 1940 by demonstrating the existence of alkali – aggregate reaction.
After Stanton’s work, Blanks and Meissner in 1941 explained that expansive forces
led to cracks which were formed by ASR product. A great number of studies in this
issue have been carried out since 1940s, and although some parts left uncertain, a
huge pile of knowledge has been developed [Swamy, 1992; Page & Page, 2007].
2.2 Types of Alkali-Aggregate Reaction
Alkali-aggregate reaction is generally a chemical reaction between alkalis in cement
and certain constituents of some aggregates. However, there are three types of AAR
5
which are different from each other in that each reaction type uses different reactive
components of aggregates. These types are alkali-carbonate reaction, alkali-silicate
reaction and alkali-silica reaction [Page & Page, 2007].
2.2.1 Alkali – Carbonate Reaction
Alkali – carbonate reaction was first introduced by Swenson in 1957 in Kingston,
Ontario. He described this phenomenon by examining concrete pavements. Concrete
pavement sections which are closed joints showed excessive expansion, and within 6
months of placing, deep cracks were observed approximately hexagonal areas 50-100
mm across in the slabs [Swamy, 1992].
Although the cause of ACR is not properly understood, the most common
mechanism is suggested by Gillott. Unlike ASR, gel is not produced in alkali –
carbonate reaction. After alkali hydroxide reaction takes place, it leads to expansion
of coarse aggregate particles. Reaction occurs in clay matrix with dolomite crystals.
As described in the equation below, alkali reacts with dolomite and this reaction
results in breakdown of dolomite into brucite, calcite and alkali carbonate.
Dedolomitization of dolomite opens channels and allows moisture absorption. With
increasing moisture content, swelling occurs and this causes expansion and cracks.
Extensive cracks are observed in ACR, and the expansion depends on micro –
texture and nature of the minerals [Swamy, 1992; Blight & Alexander, 2011].
Alkali + Dolomite – Calcite + Brucite + Alkali cabonate
2(Na/K)OH + CaMg(CO3)2 – CaCO3 + Mg(OH)2 + (Na/K)2CO3
Different from ASR, alkali – carbonate reaction is not widespread, and it has been
dealt with only in a few isolated locations worldwide. Thus, little research has been
done on this issue. There are no recognized measures for controlling ACR. The only
suggestion for avoiding ACR is not using reactive materials in the concrete [Blight &
Alexander, 2011].
6
2.2.2 Alkali – Silicate Reaction
Another group of AAR is alkali-silicate reaction which has been reported in 1973 in
Nova Scotia by Gillot and Ducan [Popovics, 1992].
Alkali – silicate reaction occurs in alkali-rich concretes which contain phyllite,
argillite and greywacke rock types in the aggregate. These rock types contain
significant amount of silicate minerals. This reaction is generally slow and
complicated. Alkali – silicate reaction leads to expansion of silicate minerals, and
with the expansion of these particles, ‘dry’ aluminosilicate surfaces in the
microcrystalline portion of these rocks absorbs water and this water absorption
causes internal stress that brings about the disruption of the concrete. Expansion of
concrete is directly influenced by the amount of microcrystalline material and the
porosity [Swamy, 1992; Blight & Alexander, 2011].
Finely divided silica in the rocks causes alkali – silica reaction and this phenomenon
occurs simultaneously when alkali – silicate reaction takes place; so it is debatable to
identify alkali – silicate reaction in concrete [Blight & Alexander, 2011].
2.2.3 Alkali – Silica Reaction
Alkali – silica reaction is the most common form of AAR. Unlike other alkali –
aggregate reactions, a lot of researches have been done about this topic. ASR
involves reactions between silica in certain aggregates which is thermodynamically
unstable and alkali hydroxides in the pore solution of concrete. [Page & Page, 2007].
Volcanic glasses, cristobalite, tridymite, and opal contain alkali – reactive forms of
silica. [Blight & Alexander, 2011]. The production of this reaction is hydrophilic
alkali silica gel and it differs ASR from other alkali –aggregate reactions. Alkali –
silica gel swells by absorbing water. Swelling leads to expansive pressure up to 11
MPa [Bektaş, 2002], which is the cause of cracks in concrete. Cracks occur when
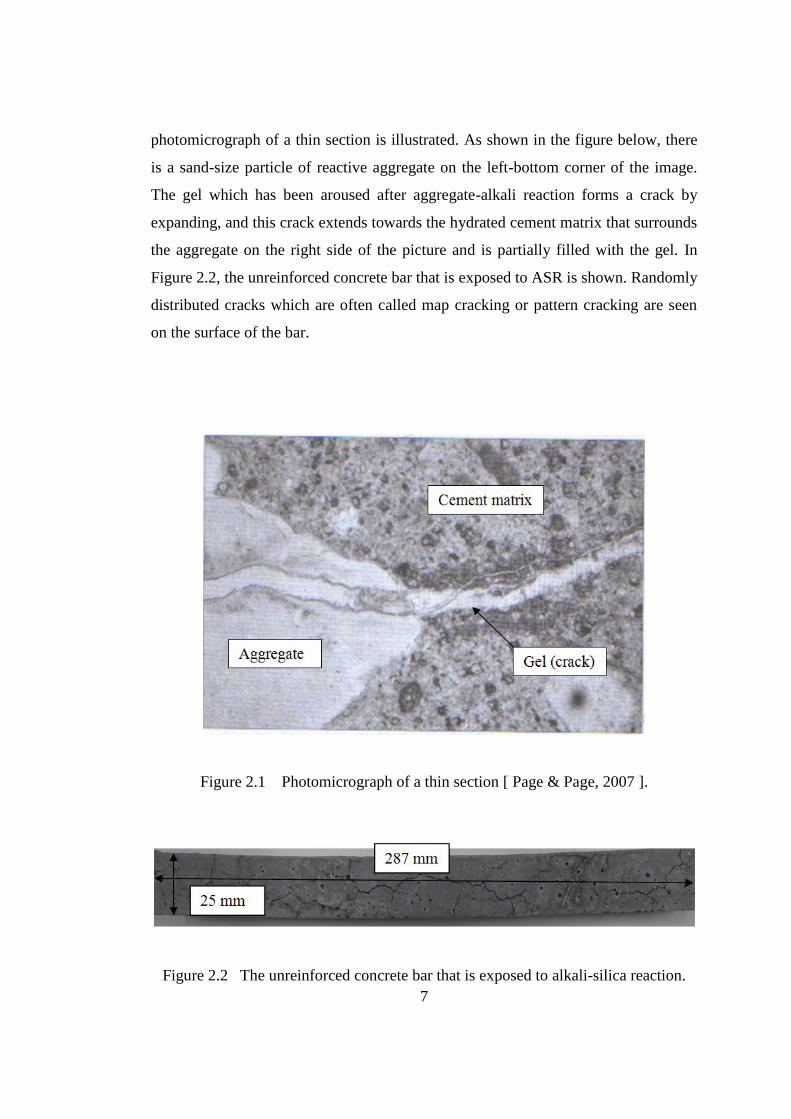
internal stress exceeds the tension strength of cement paste. In Figure 2.1,
7
photomicrograph of a thin section is illustrated. As shown in the figure below, there
is a sand-size particle of reactive aggregate on the left-bottom corner of the image.
The gel which has been aroused after aggregate-alkali reaction forms a crack by
expanding, and this crack extends towards the hydrated cement matrix that surrounds
the aggregate on the right side of the picture and is partially filled with the gel. In
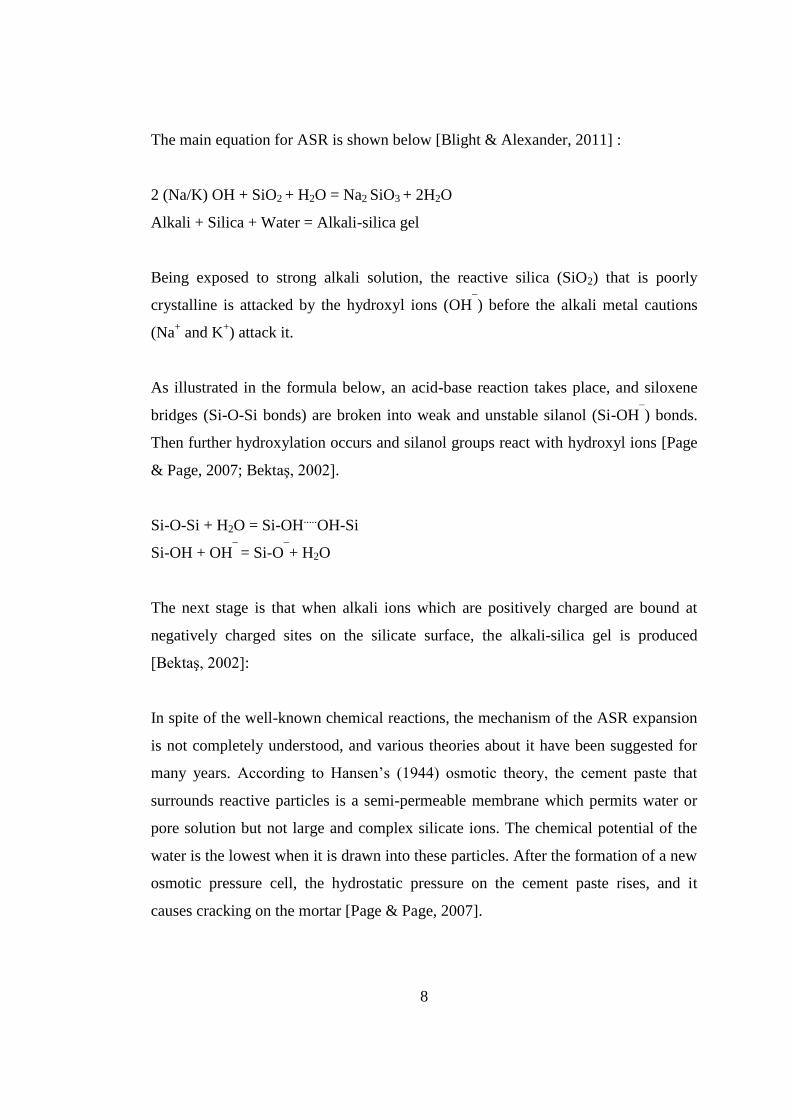
Figure 2.2, the unreinforced concrete bar that is exposed to ASR is shown. Randomly
distributed cracks which are often called map cracking or pattern cracking are seen
on the surface of the bar.
Figure 2.1 Photomicrograph of a thin section [ Page & Page, 2007 ].
Figure 2.2 The unreinforced concrete bar that is exposed to alkali-silica reaction.
8
The main equation for ASR is shown below [Blight & Alexander, 2011] :
2 (Na/K) OH + SiO2 + H2O = Na2 SiO3 + 2H2O
Alkali + Silica + Water = Alkali-silica gel
Being exposed to strong alkali solution, the reactive silica (SiO2) that is poorly
crystalline is attacked by the hydroxyl ions (OH¯) before the alkali metal cautions
(Na+ and K
+) attack it.
As illustrated in the formula below, an acid-base reaction takes place, and siloxene
bridges (Si-O-Si bonds) are broken into weak and unstable silanol (Si-OH¯) bonds.
Then further hydroxylation occurs and silanol groups react with hydroxyl ions [Page
& Page, 2007; Bektaş, 2002].
Si-O-Si + H2O = Si-OH.....
OH-Si
Si-OH + OH¯
= Si-O¯+ H2O
The next stage is that when alkali ions which are positively charged are bound at
negatively charged sites on the silicate surface, the alkali-silica gel is produced
[Bektaş, 2002]:
In spite of the well-known chemical reactions, the mechanism of the ASR expansion
is not completely understood, and various theories about it have been suggested for
many years. According to Hansen’s (1944) osmotic theory, the cement paste that
surrounds reactive particles is a semi-permeable membrane which permits water or
pore solution but not large and complex silicate ions. The chemical potential of the
water is the lowest when it is drawn into these particles. After the formation of a new
osmotic pressure cell, the hydrostatic pressure on the cement paste rises, and it
causes cracking on the mortar [Page & Page, 2007].
9
2.3 Factors That Affect Alkali-Silica Reaction Expansion
Alkali-silica reaction is very complex and there are six main factors that govern
ASR. These factors are mentioned below:
2.3.1 Nature of Reactive Material
Many rock types are used as aggregates in concrete and there is reactive silica in
most of them, which is the essential requirement for ASR to occur. Most rocks are
composed of more than one mineral component except pure limestone and
dolomites. Even the existence of 2% reactive components in total in these minerals
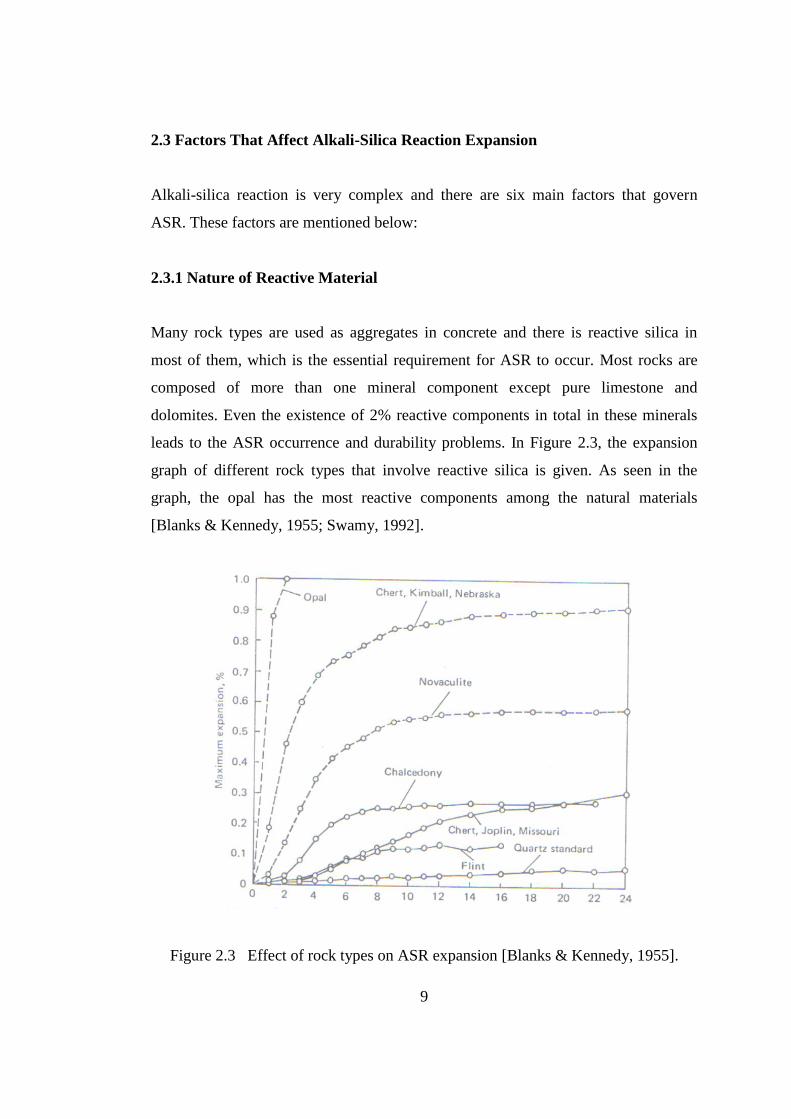
leads to the ASR occurrence and durability problems. In Figure 2.3, the expansion
graph of different rock types that involve reactive silica is given. As seen in the
graph, the opal has the most reactive components among the natural materials
[Blanks & Kennedy, 1955; Swamy, 1992].
Figure 2.3 Effect of rock types on ASR expansion [Blanks & Kennedy, 1955].
10
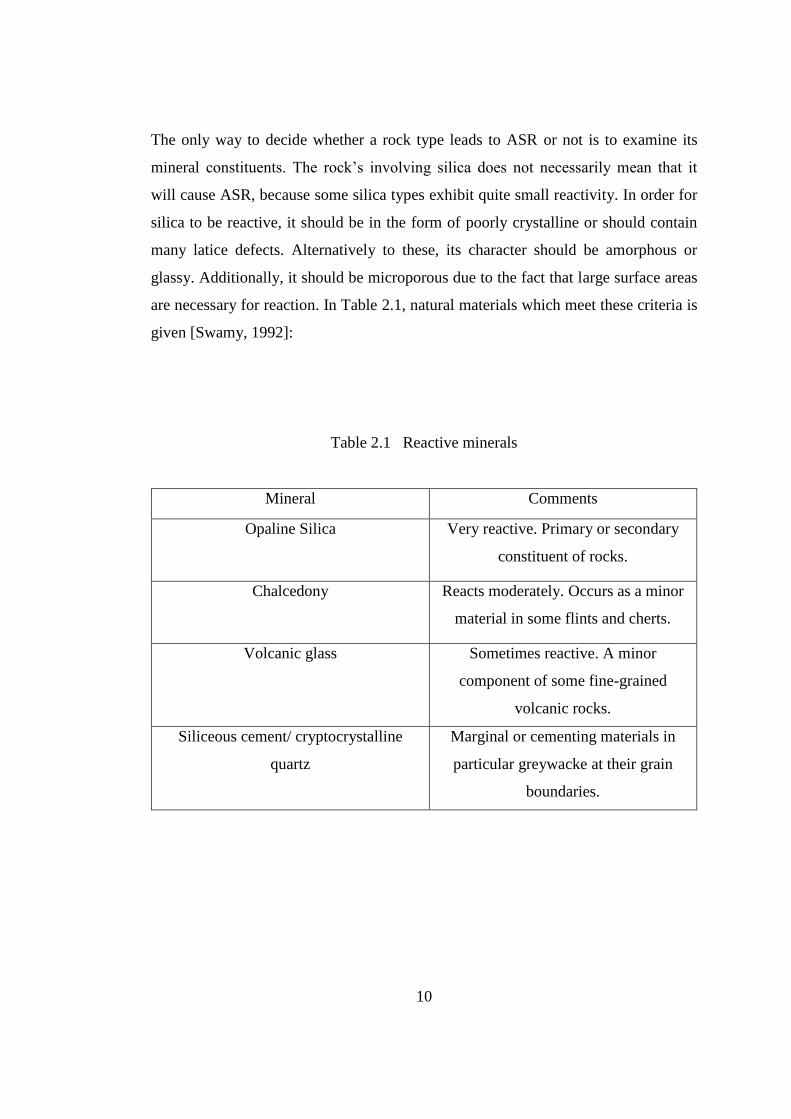
The only way to decide whether a rock type leads to ASR or not is to examine its
mineral constituents. The rock’s involving silica does not necessarily mean that it
will cause ASR, because some silica types exhibit quite small reactivity. In order for
silica to be reactive, it should be in the form of poorly crystalline or should contain
many latice defects. Alternatively to these, its character should be amorphous or
glassy. Additionally, it should be microporous due to the fact that large surface areas
are necessary for reaction. In Table 2.1, natural materials which meet these criteria is
given [Swamy, 1992]:
Table 2.1 Reactive minerals
Mineral Comments
Opaline Silica Very reactive. Primary or secondary
constituent of rocks.
Chalcedony Reacts moderately. Occurs as a minor
material in some flints and cherts.
Volcanic glass Sometimes reactive. A minor
component of some fine-grained
volcanic rocks.
Siliceous cement/ cryptocrystalline
quartz
Marginal or cementing materials in
particular greywacke at their grain
boundaries.
11
2.3.2 Amount of Reactive Material
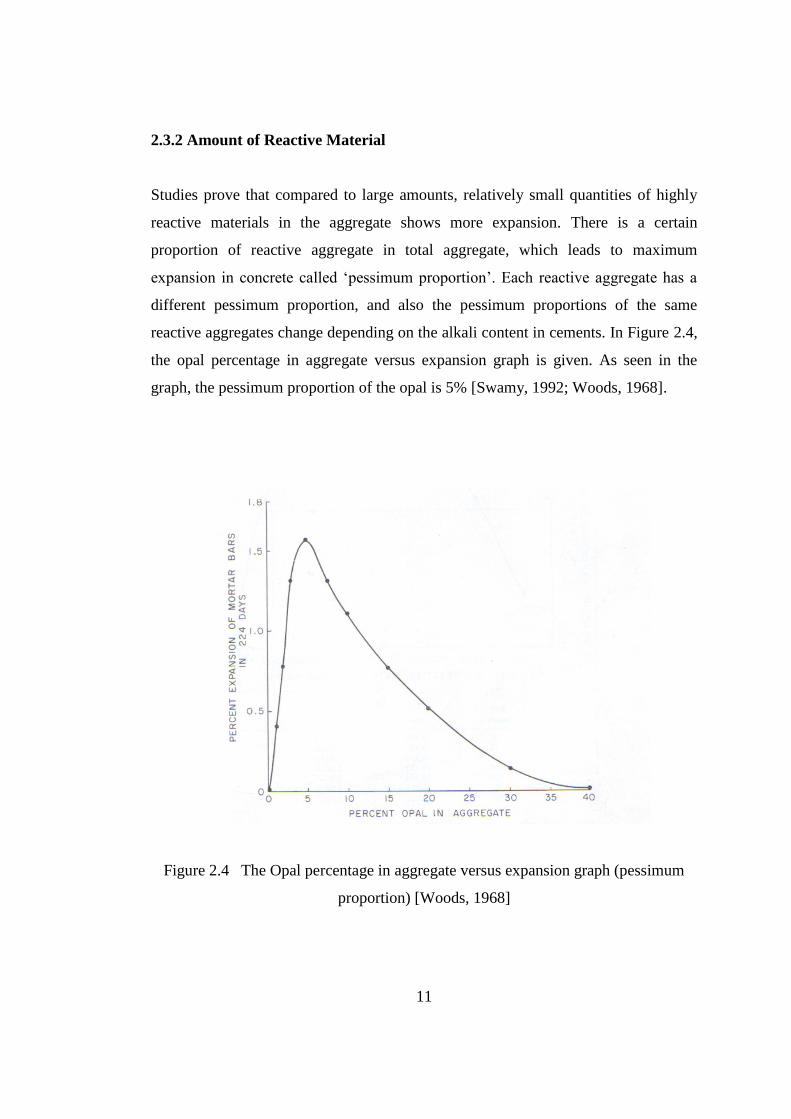
Studies prove that compared to large amounts, relatively small quantities of highly
reactive materials in the aggregate shows more expansion. There is a certain
proportion of reactive aggregate in total aggregate, which leads to maximum
expansion in concrete called ‘pessimum proportion’. Each reactive aggregate has a
different pessimum proportion, and also the pessimum proportions of the same
reactive aggregates change depending on the alkali content in cements. In Figure 2.4,
the opal percentage in aggregate versus expansion graph is given. As seen in the
graph, the pessimum proportion of the opal is 5% [Swamy, 1992; Woods, 1968].
Figure 2.4 The Opal percentage in aggregate versus expansion graph (pessimum
proportion) [Woods, 1968]
12
2.3.3 Particle Size of Reactive Material
There are not many researches about the effect of the particle size of reactive
materials on ASR. Even though it is obvious that aggregate size greatly influences
alkali – silica reaction, there is no consensus on this issue. Whereas Diamond has
claimed that a decrease in the particle size of the reactive material down to 20 μm
leads to an increase in rate of expansion, Mindess has suggested that maximum
expansion occurs with intermediate particle sizes [Popovics, 1992; Mindess &
Young, 1981].
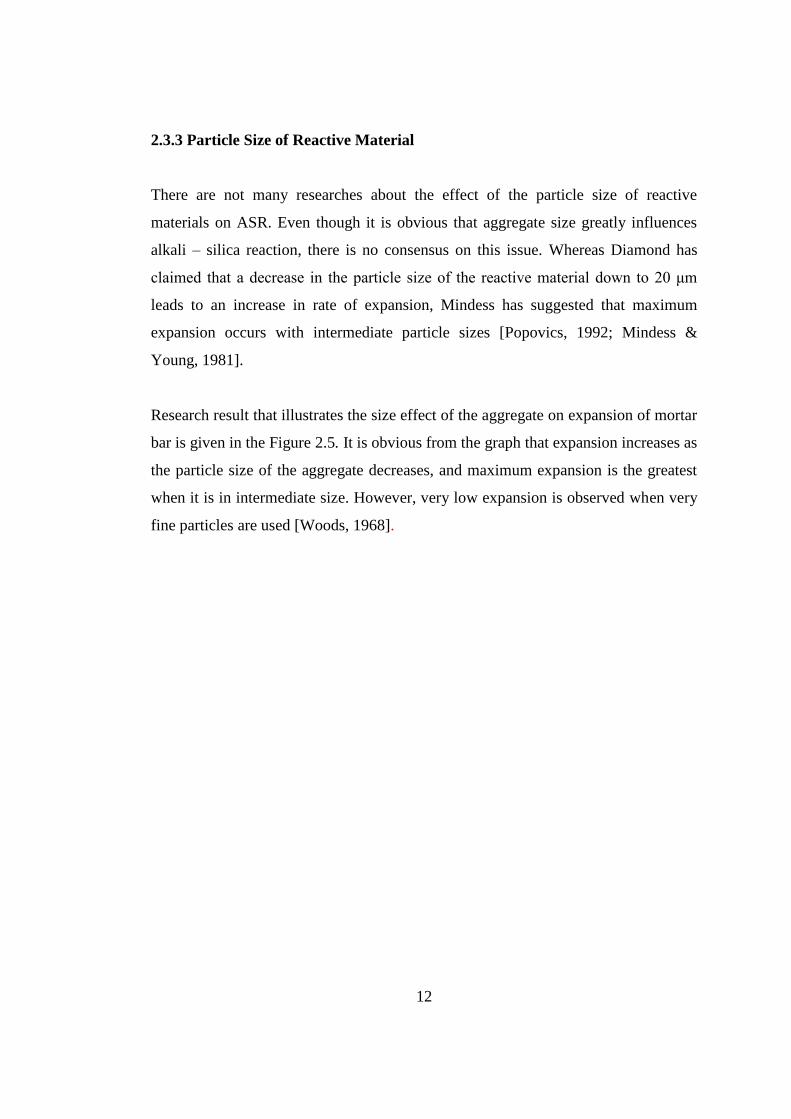
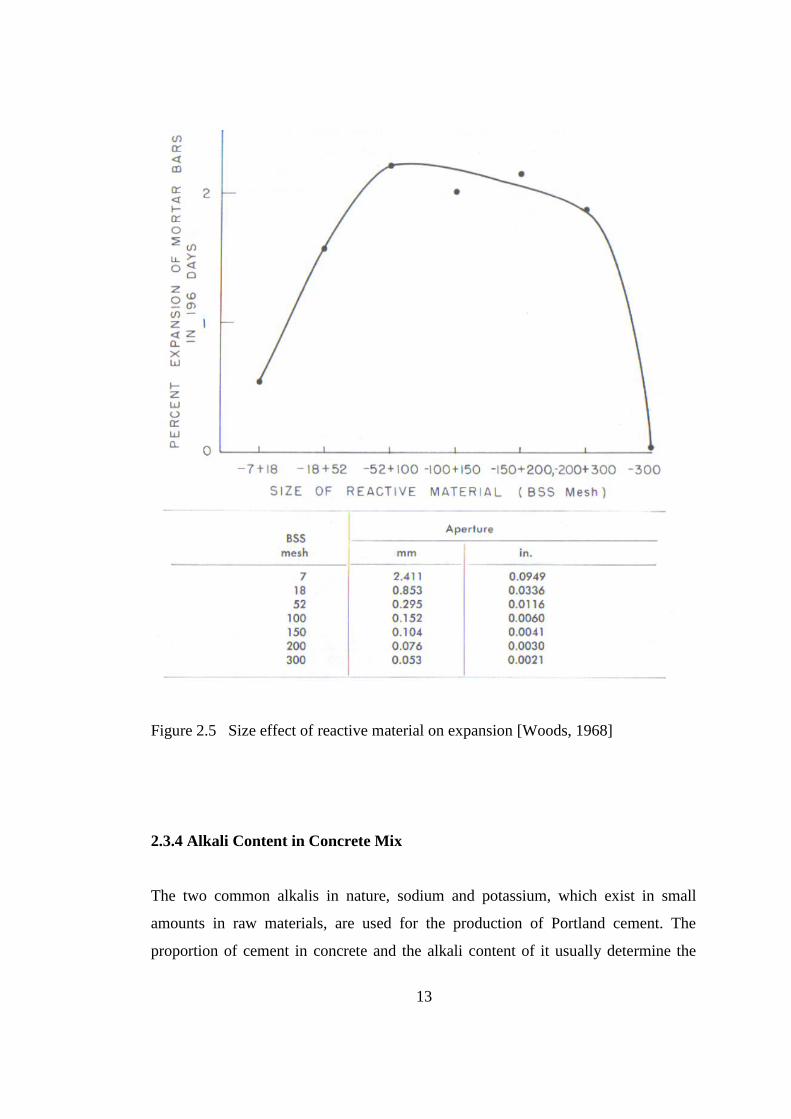
Research result that illustrates the size effect of the aggregate on expansion of mortar
bar is given in the Figure 2.5. It is obvious from the graph that expansion increases as
the particle size of the aggregate decreases, and maximum expansion is the greatest
when it is in intermediate size. However, very low expansion is observed when very
fine particles are used [Woods, 1968].
13
Figure 2.5 Size effect of reactive material on expansion [Woods, 1968]
2.3.4 Alkali Content in Concrete Mix
The two common alkalis in nature, sodium and potassium, which exist in small
amounts in raw materials, are used for the production of Portland cement. The
proportion of cement in concrete and the alkali content of it usually determine the
14
quantity of the alkali in ASR. Alkali exists on the surface of clinker grains and in the
structure of the clinker materials of the Portland cement in the amount of 0.5 – 1.3 %
[Lea, 1970; Swamy, 1992].
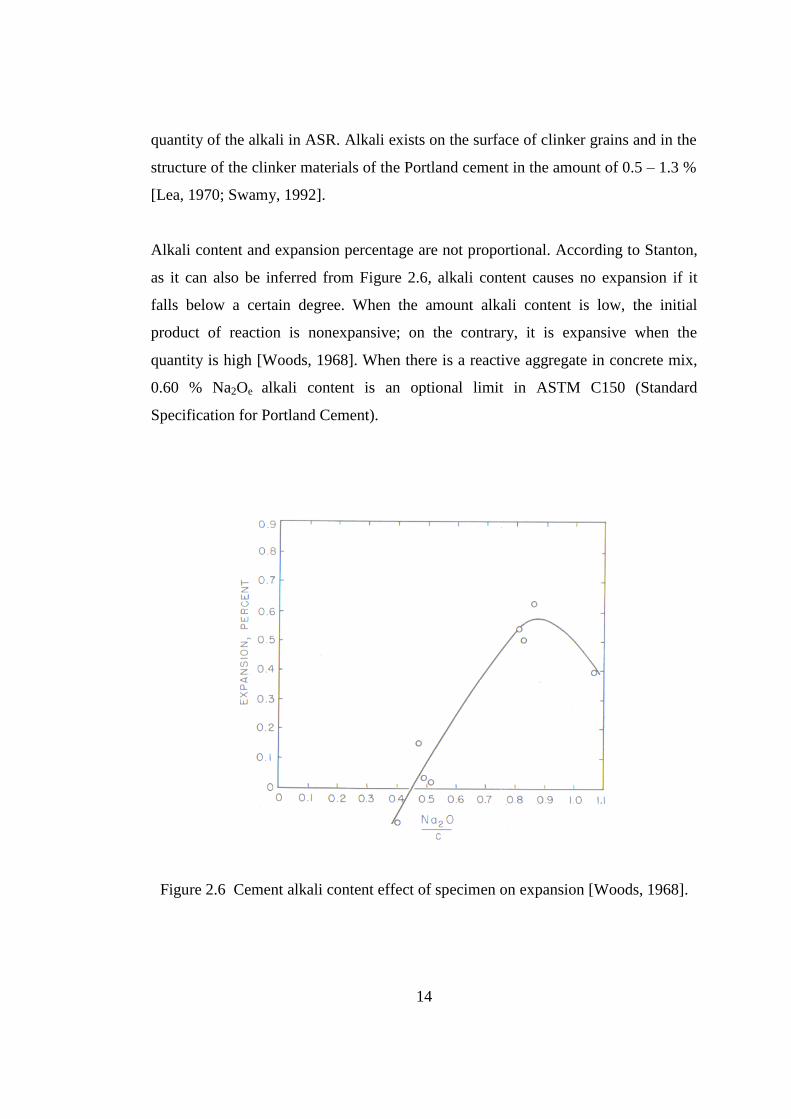
Alkali content and expansion percentage are not proportional. According to Stanton,
as it can also be inferred from Figure 2.6, alkali content causes no expansion if it
falls below a certain degree. When the amount alkali content is low, the initial
product of reaction is nonexpansive; on the contrary, it is expansive when the
quantity is high [Woods, 1968]. When there is a reactive aggregate in concrete mix,
0.60 % Na2Oe alkali content is an optional limit in ASTM C150 (Standard
Specification for Portland Cement).
Figure 2.6 Cement alkali content effect of specimen on expansion [Woods, 1968].
15
Aggregates which are normally not reactive induce a deleterious reaction when there
is an alkali content in high amount. The alkalis that are going to be in reaction exist
not only in cements, but also in aggregates in concrete mix, Suplementary Cementing
Materials (SCM), and external sources as well [Page & Page, 2007].
Some researches show that alkalis may leach out into pore solution from aggregates
and increase alkali content of concrete mix depending on mineralogical content and
particle size of aggregates [Erlin & Stark, 1990]. According to Slark and Bhatty
(1986), in certain circumstances, some aggregates may include alkali, which is the
10% of the alkali amount that Portland cement has [Page & Page, 2007].
Suplementary Cementing Materials (SCM) that are used in cement may contain
significant quantity of alkalis. SCMs such as fly ash, silica fume, slag, and pozzolans
can include more alkalis than the Portland cement does [Monteiro, K., Sposito, dos
Santos, & Andrate, 1997; Page & Page, 2007].
The alkalis that would contribute to ASR also occur in external sources such as
seawater, deicing salts, and groundwater. Samples are tested via this principle in
ASTM C 1260 (Standart Test Method for Potential Alkali Reactivity of Aggregate
[Mortar – Bar Method]).
In addition to the factors above, the third component of the concrete mix, water, may
also affect the amount of alkali. The alkalis in the water increase the quantity of
alkalis in pore solution [Neville, 1990].
2.3.5 Moisture Effect
Many studies and observations prove that when concrete structures that occur ASR
are exposed to moisture, cracks and damages are more than in those structures which
do not have much exposure to moisture. The difference of surface damage between
16
the weather side and the lee side of a structure that undergoes ASR can be realized
easily [Swamy, 1992].
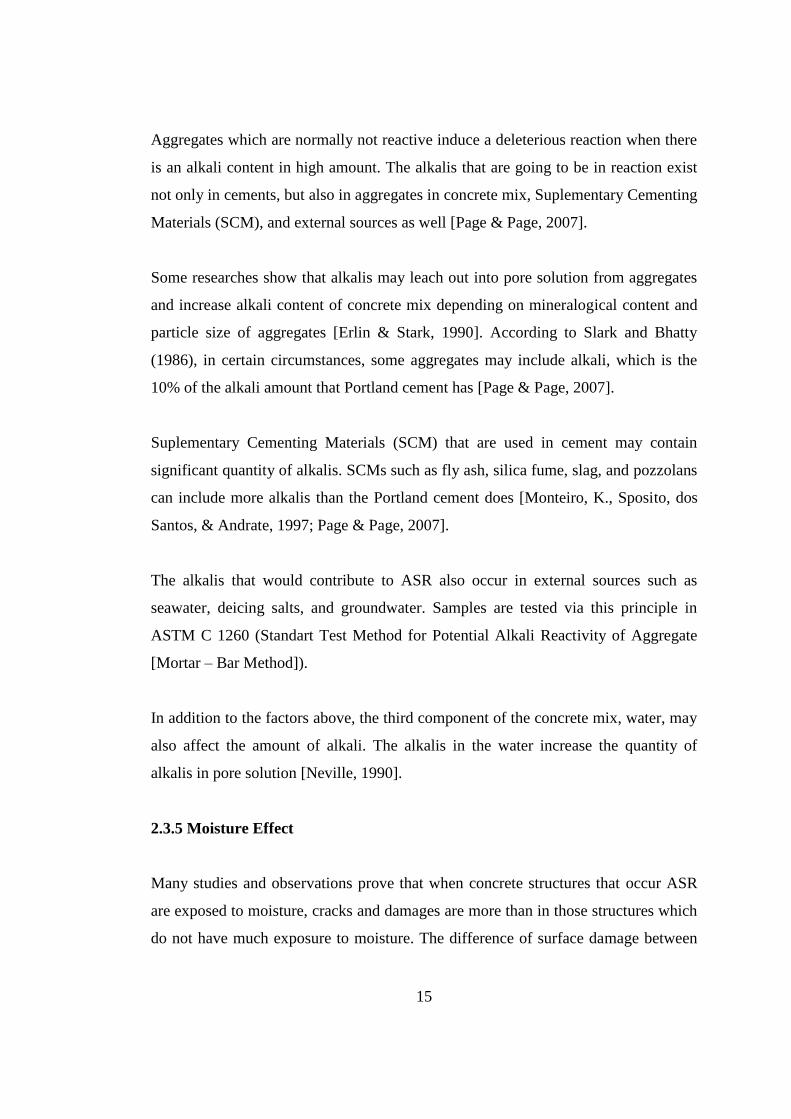
Water has got two functions in deleterious ASR. First, as every chemical reaction
does, ASR needs water in order to proceed. Water is the only way of moving alkali
cations and hydroxil ions which are necessary for the reaction to begin. Secondly, as
it is mentioned before, the gel that is formed as a result of the chemical reaction
needs enough water to exert pressure by swelling. Only small amount of water is
adequate for the reaction to proceed. However, 85% RH is necessary in order for
ASR to have a deleterious effect on concrete. As clearly seen in Figure 2.7, RH has a
serious effect on the expansion that is formed because of ASR. The expansion
becomes negligible when the internal RH is below 75% [Neville, 1990; Swamy,
1992].
Figure 2.7 Expansion graph of concrete which is subjected to alkali-silica reaction
depending on relative humidity [Neville, 1990]
17
2.3.6 Temperature Effect
As all chemical reactions, ASR accelerates via temperature rise. Gel develops on
highly reactive materials like opal in a few days if they are steeped in alkali
solutions. On the other hand, gel develops on the surface of the same materials only
in 24 hours if they are kept in same conditions –with a temperature increase of 50º C,
for instance. Temperature effect both accelerates the reaction as moisture effect does,
and increases water absorption in gel; because high temperature increases the
solubility of silica, which leads to rapid reaction whereas under low temperature, the
migration of ions slows down, which is the cause of delayed expansion [Swamy,
1992].
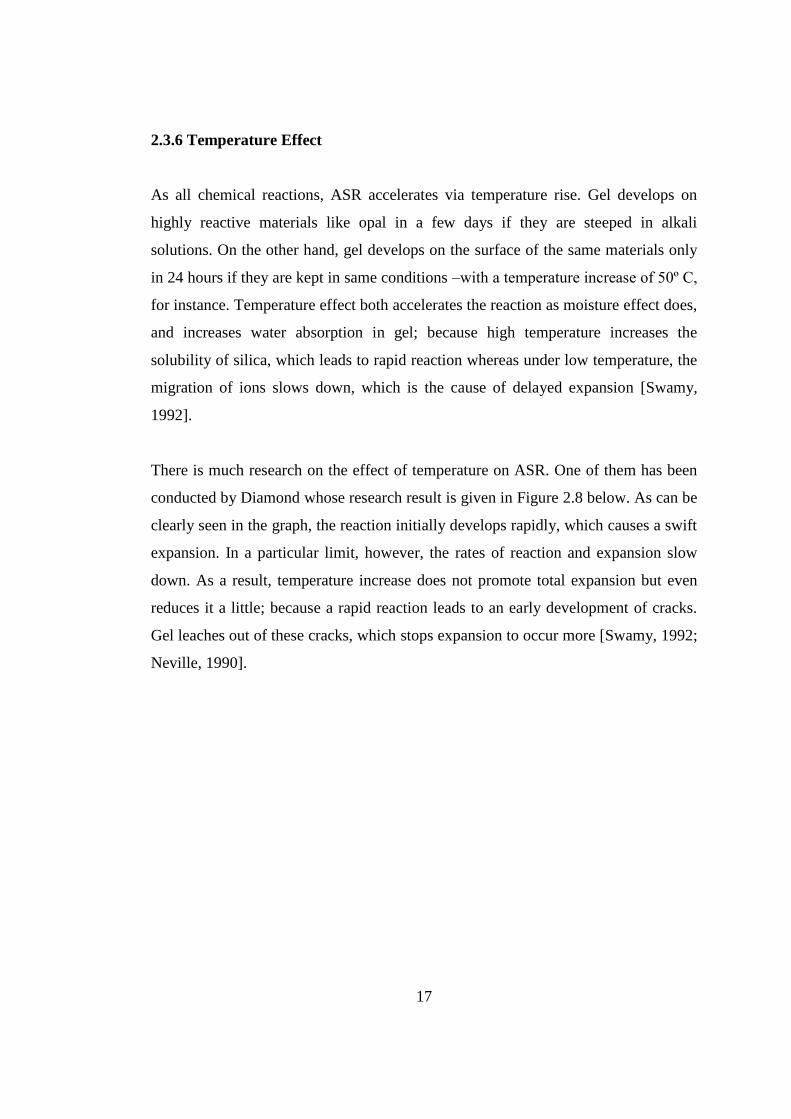
There is much research on the effect of temperature on ASR. One of them has been
conducted by Diamond whose research result is given in Figure 2.8 below. As can be
clearly seen in the graph, the reaction initially develops rapidly, which causes a swift
expansion. In a particular limit, however, the rates of reaction and expansion slow
down. As a result, temperature increase does not promote total expansion but even
reduces it a little; because a rapid reaction leads to an early development of cracks.
Gel leaches out of these cracks, which stops expansion to occur more [Swamy, 1992;
Neville, 1990].
18
Figure 2.8 Change of percent of alkalis reacted under different temperatures
[Swamy, 1992]
2.4 Deleterious Effects of Alkali – Silica Reaction
There are some effects of ASR in concrete and at least one of them occurs in
concrete structure which is affected by this chemical reaction [M.A & Fournier,
1993]. These effects are cracking, expansion, gel exudation and pop-outs. However,
the cause of these features cannot be only ASR. There may be other possible causes.
In order to identify ASR affected structure, careful inspection and investigation
should be carried out [Swamy, 1992].
2.4.1 Cracks
Cracks in surface of concrete structure which are usually called map cracking or
pattern cracking are the common field observations related to ASR. If there is no
19
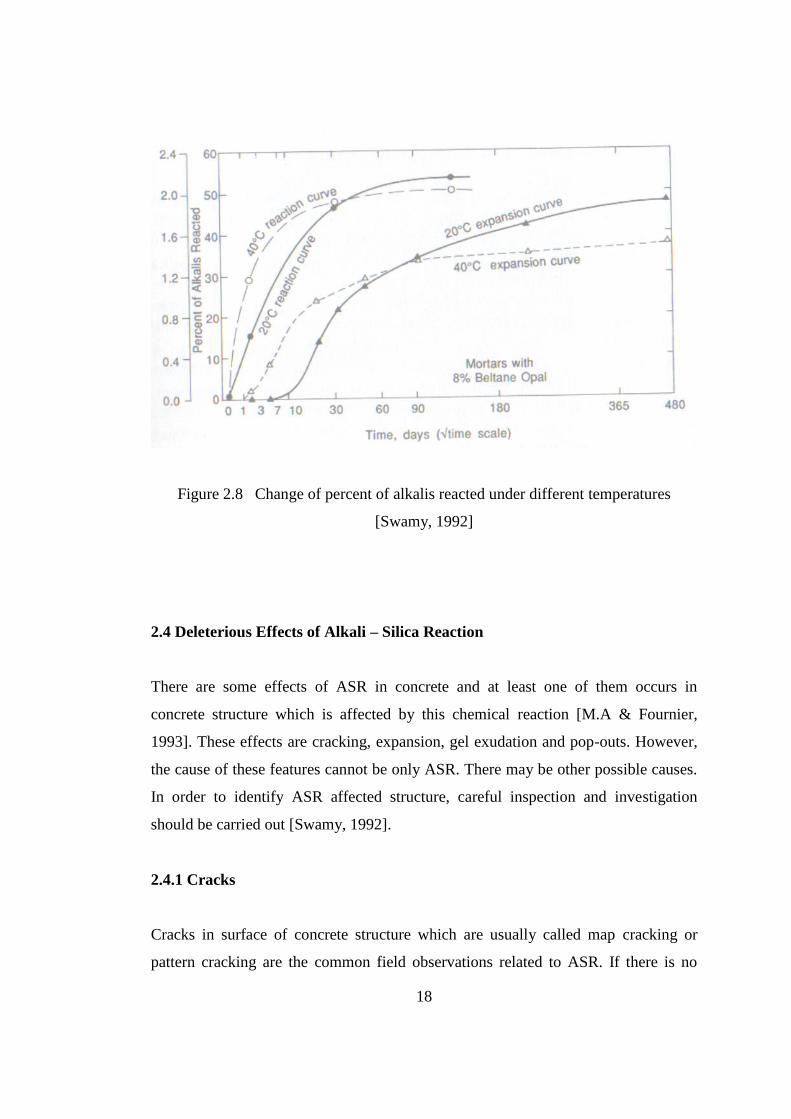
directional stress applied to concrete element, cracks will be developed as a map
cracking which is shown in Figure 2.2. However, in order for the cracks to be
identified correctly, restrained condition and reinforcements should be taken into
consideration. For instance, if ASR occurs at a bridge support column, the cracks on
it will be vertical because the bridge load restrains vertical expansion. As can be seen
in Figure 2.9, the condition of the reinforcements affects the cracks dramatically, and
these cracks develop in parallel with the reinforcements [Swamy, 1992 ; Popovics,
1992 ; Çullu, Subaşı, & Bolat, 2010].
Figure 2.9 Reinforced concrete bar exposed to ASR
Cracking may also lead to different durability problems that are very hazardous for
concrete structures. Water leaches into the inner side through the cracks, and causes
freezing and thawing. It also induces the corrosion of reinforcements.
The Process of Cracking - In Figure 2.2, the illustration of the unreinforced
concrete bar that is exposed to alkali-silica reaction is given. It can be observed from
the photo that transverse cracks are deeper than longitudinal ones. The cause of this
phenomenon is explained below [Blight & Alexander, 2011].
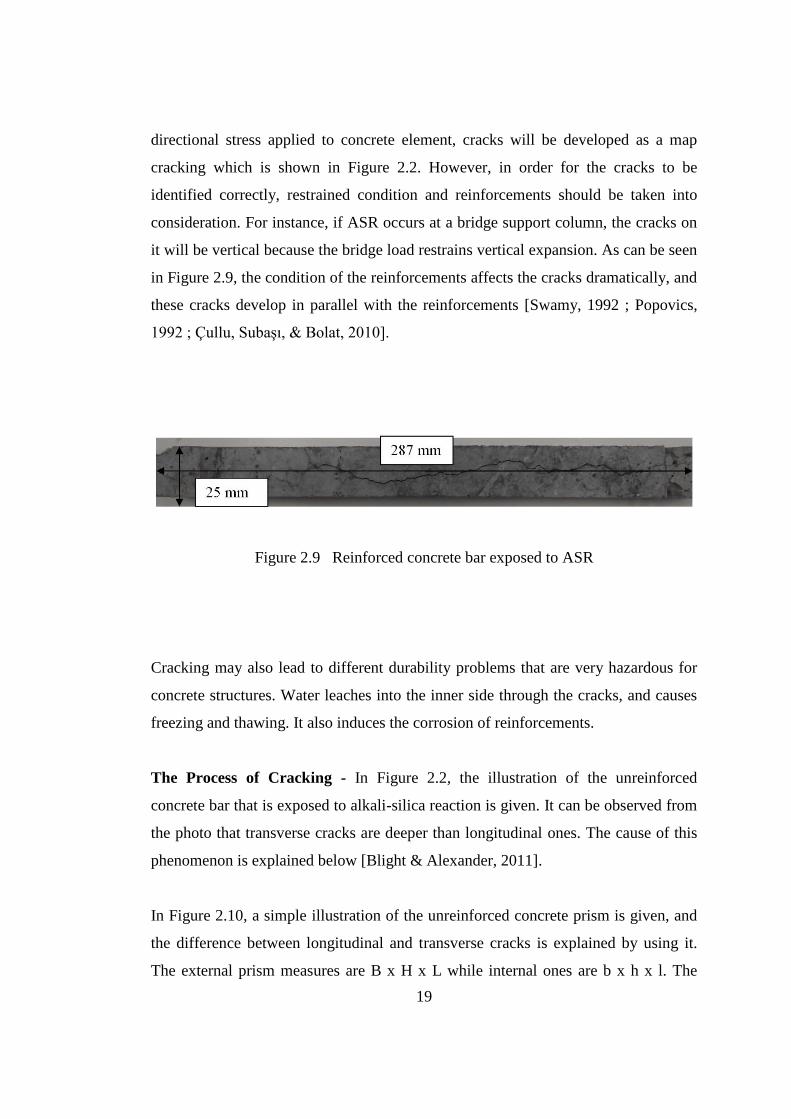
In Figure 2.10, a simple illustration of the unreinforced concrete prism is given, and
the difference between longitudinal and transverse cracks is explained by using it.
The external prism measures are B x H x L while internal ones are b x h x l. The
20
external prism is called covercrete and internal prism is called heartcrete. Because of
ambient factors, drying occurs in the covercrete, and heartcrete remains unaffected.
Drying in the covercrete leads to tendency of shrinkage in it relative to heartcrete.
Thus, compressive stress will be set up in heartcrete and there will be a development
of tensile stress in covercrete. Uniform compressive (σc) and tensile (σt) stress are
developed in heartcrete and covercrete, which are the effects of Compressive (C) and
Tensile (T) forces [Blight & Alexander, 2011].
Figure 2.10 Illustration of the unreinforced concrete prism [Blight & Alexander,
2011].
Compressive forces in Heartcrete are,
Longitudinally: CL = bhσcl
Transversely: CT = bLσcT or CT = hLσcT
Tensile forces in Covercrete are,
Longitudinally: TL = (BH – bh) σtL
21
Transversely: TT = (B – b) L σtT or TT = (H – h) L σtT
(These two values are the same)
Balance of C and T:
bhσcl = (BH – bh) σtL
bLσcT = (B – b) L σtT or hLσcT = (H – h) L σtT
In case of square prism, B = H and b = h, and
Longitudinally:
σtL/σcl = b2/(B
2 – b
2)
If b = 9/10B
σtL/σcl = 4.26
If b = 4/5B
σtL/σcl = 1.78
Transversely:
σtT/σcT = b/(B – b) = h/(H – h)
If b = 9/10B
σtT/σcT = 9
If b = 4/5B
σtT/σcT = 4
When the ration of σt/σc increases, the probability of the occurrence of cracking also
increases. As we can see from the calculations above, longitudinal cracks are more
likely to occur in square prisms. After gel absorbs water or uses the pore water that
the concrete already has, the heartcrete of concrete expands and the tension force
develops in covercrete, leading to tension cracks. This is the same idea with the
shrinkage example explained above. Consequently, longitudinal cracks are deeper
than transverse cracks in ASR affected beams theoretically. However, there are many
other effects that infuse cracks like reinforcement and restrains [Blight & Alexander,
2011].

22
2.4.2 Expansion
The expansion of the concrete structure is one of the most important problems
stemmed from ASR. Expansion causes dimensional misalignments, and this may
result in the failure of structure. It also leads to the fracture of the steel stirrups in
concrete structures. It has been considered in recent years that there is a correlation
between the tension failure of especially cold worked hard tensile links and the
concrete structures that are exposed to ASR. As is known, these cold worked
materials are not ductile enough, and when their bend radius is small, the excessive
amount of strain that resulted from expansion causes the tension failure of steel. The
damage in the stirrups in the concrete structure is a serious structural problem [Blight
& Alexander, 2011; Swamy, 1992].
2.4.3 Gel Exudation and Color Change
Alkali-silica gel exudes from cracks during ASR. When this gel that accumulates on
the surface of the concrete structure is fresh, it becomes brownish or transparent and
has resinous texture. When there is dehydration, on the other hand, it becomes white.
The gel is usually likened to the calcium carbonate deposit and mixed up with it.
Because of this, a chemical analysis should be done on this gel. As a result of the
leaching of calcium hydroxide from cement paste, these calcium carbonates deposit
[Çullu, Subaşı, & Bolat, 2010; Swamy, 1992].
There may be a loss of color or/and coloration on the surface of concrete because of
the reaction. It is known that the blackened areas or the dark color that are formed at
the same time with map cracking are stemmed from ASR [Çullu, Subaşı, & Bolat,
2010].
23
2.4.4 Surface Spall or ‘Pop-out’
Another problem in concrete structure, which is resulted from ASR, is the
development of elliptical or circular spalls from the surface of concrete structure.
Like the other problems mentioned above, ASR may not be the only reason of the
formation of the surface spall, namely ‘pop-out’. The only way to determine whether
it is formed by ASR or other factors is to identify the particular mechanism of the
phenomenon. The aggregates that are close to the surface of concrete lead to the
development of excessive pressure via constituting gel as a result of ASR, and to the
formation of the spalls. These circular pop-outs with the diameter of 25-50 mm are
the problem of ASR that needs to be prevented even though they do not cause any
problems except surface roughness [Çullu, Subaşı, & Bolat, 2010; Swamy, 1992].
2.5 Test Methods for Determination of Alkali-Silica Reaction
As is known, ASR causes hazardous durability problems which may be resulted from
failure in concrete structures. In order to prevent this, it is important to use materials
that would not be exposed to ASR. Hence, various test methods for the determination
of alkali-silica reactivity have been developed. These methods determine the
reactivity by using either only aggregates or all of the concrete mix. Test methods
must simulate the field conditions and be simple, rapid, and reliable at the same time.
Test methods that are applied by increasing conditions such as alkali concentration,
temperature, humidity, pressure, and specific area are explained below [Swamy,
1992; Berude M.A & Fournier, 1993].
2.5.1 Petrographic Examination of Aggregates
Petrographic examination of aggregates, which is made by a petrographer, is the first
step in identifying the potential of an aggregate for AAR. The technical committee
‘RILEM’ has recommended its methodology [Page & Page, 2007].
24
Petrographic examination is one of the direct evaluations of the aggregates, and a
polarizing microscope is used to identify reactive constituents. However, one cannot
decide whether there will be a durability problem related to ASR in concrete by only
using the petrographic examination; other test methods should be applied, too.
ASTM C295 is a guide for this method [Swamy, 1992].
2.5.2 Chemical Methods Applied to Aggregates
ASTM C289 is a chemical method, and it is one of the most common direct tests that
are applied to aggregates to determine their reactivity. In this test, 150-300 µm
aggregate particles are stored in LN NaOH at 80 ºC for 24 hours. Then, reduction in
the alkalinity of the solution and the dissolved silica are determined. By using these
results, the reactivity of aggregates is identified and classified as ‘innocuous’,
‘potentially deleterious’, and ‘deleterious’. Nevertheless, ASTM C289 test method is
not successful in measuring the aggregates that react slowly [Swamy, 1992].
Gel Pat Test (UK), Chemical Shrinkage Method (Denmark), Dissolution Test
(Germany), and Osmotic Cell Test (USA) are some of the other chemical methods
[Berude & Fournier, 1992].
2.5.3 Mortar Bar Methods
Different from direct tests, Mortar Bar method gives information about the effects of
the use of reactive aggregates in concrete. The amount of cement in concrete mix or
the quantity of alkali in cement may be boosted in order to increase the rate of
reaction. To increase it even more, the prisms that are prepared for the test are stored
in conditions with increased temperature and humidity. Under this treatment, the
development of cracks and the dimensional change are observed [Swamy, 1992].
In American ASTM C227 Mortar Bar Method, a prism having a dimension of
25×25×285 mm is stored at 38ºC and 100% RH for 6 months. Length change is
25
measured periodically in this commonly-used test method. The expansion limits are
0.05% for 3 months and 0.10% for 6 months [Swamy, 1992; Berude M.A &
Fournier, 1993].
On the other hand, obtaining results in much shorter time is needed sometimes. With
the accelerated Mortar Bar Method ASTM C1260, only in 14 days, it is possible to
get results from the mortar bar that is immersed in 1m NaOH solution and stored in
80ºC. If the expansion of the mortar bar is below 0.10% at the end of 14 days, the
material is accepted as innocuous. Even though ASTM C1260 whose test condition
is very aggressive is used quite commonly, other methods such as Australian RTA
T363, RILEM A-TC 106-2, and Canadian CSA A23.2-25A are also available
[Bektaş, 2002; Page & Page, 2007].
2.5.4 Concrete Prism Method
Concrete Prism Method has the same principle as Mortar Bar Method, and gives
information about the expansion in concrete and the reactivity of aggregates. It is a
method based on measuring the lengths of prisms in different dimensions
periodically by storing them in 100% RH and high temperature. Its results are quite
reliable; it gives correct results especially in samples in which supplementary
cementing materials are used. However, it may be regarded as disadvantageous as
the experiment lasts rather long [Çullu, Subaşı, & Bolat, 2010; Page & Page, 2007].
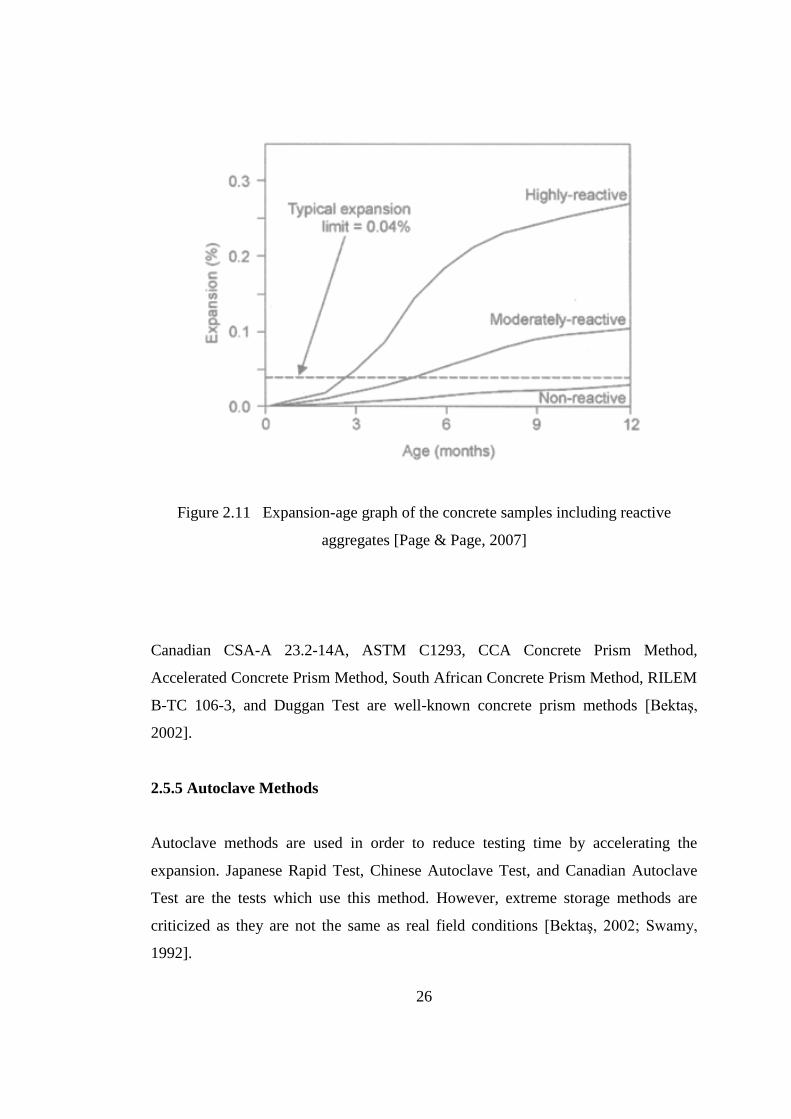
In Figure 2.11, the expansion-age graph of the concrete samples including reactive
aggregates, which is determined by Concrete Prism Method is given. It is accepted
that in case of the prisms which are identified as highly-reactive, moderate reactive,
and non-reactive show expansion below 0.04%, there will not be any durability
problems stemmed from AAR [Page & Page, 2007; Swamy, 1992].
26
Figure 2.11 Expansion-age graph of the concrete samples including reactive
aggregates [Page & Page, 2007]
Canadian CSA-A 23.2-14A, ASTM C1293, CCA Concrete Prism Method,
Accelerated Concrete Prism Method, South African Concrete Prism Method, RILEM
B-TC 106-3, and Duggan Test are well-known concrete prism methods [Bektaş,
2002].
2.5.5 Autoclave Methods
Autoclave methods are used in order to reduce testing time by accelerating the
expansion. Japanese Rapid Test, Chinese Autoclave Test, and Canadian Autoclave
Test are the tests which use this method. However, extreme storage methods are
criticized as they are not the same as real field conditions [Bektaş, 2002; Swamy,
1992].
27
2.6 Prevention of Alkali-Silica Reaction
The most known five methods in literature that are used for preventing ASR
expansion are stated below:
2.6.1 Avoidance of Reactive Aggregate
Even though it seems that not using reactive aggregate in concrete is a good solution,
it is not practical or economical. To decide whether the aggregate that is going to be
used is reactive or not, some tests such as Petrographic Examination, Quick
Chemical Test, and Mortar Bar Test should be performed. We cannot be completely
sure whether test results will be exactly the same as field results due to the fact that
the ASR expansion has got a lot of parameters which are related or unrelated to each
other [Swamy, 1994].
If the aggregate that will be used is not much reactive, we may obtain good results by
changing 25-30% of the aggregate with the limestone or other non-restrictive
aggregates [Mehta & Monteiro, 1999].
2.6.2 Limitation of Alkalis in Concrete
The second way to prevent ASR is to keep the alkali rate in concrete in a very low
level. The way of keeping it in the low level, on the other hand, is the use of low
alkali cement. 20-year experiences in America indicate that if the amount of alkali in
cement is below 0.60 (Na2O) percent, the deteriorative expansion stemmed from
ASR can be prevented. Nonetheless, this rate changes depending on the type,
amount, and particle size of the aggregate used in concrete [Woods, 1968].
Limiting only the amount of alkali in cement may not always be adequate, it will also
be necessary to limit the amount of alkali in concrete in this case. For instance, the
use of sea water or alkaline soil water in concrete mix must be avoided. Practically,

28
the quantity of alkali arisen from all sources in concrete should be below 3.0 kg/m3
[Mehta & Monteiro, 1999; Neville, 2000].
2.6.3 Avoidance of Moisture
Although this method is too unrealistic, the internal RH’s being below 80% prevents
expansion considerably. If it is even below 70%, expansion becomes negligible
[Swamy, 1992].
2.6.4 Use of Supplementary Cementing Materials (SCMs)
The use of SCM is one of the most common preventive measures for preventing
deleterious ASR, and SCMs are added in cement in different amounts. Fly ash, silica
fume, calcined clay, granulated blast furnace slag, volcanic glass, rice husk ash, and
natural pozzolans are some of the most commonly-used SCMs. Using which SCM in
which rate depends on nature of SCM, nature of the reactive aggregate, alkali content
in concrete, and exposure conditions of concrete [Page & Page, 2007].
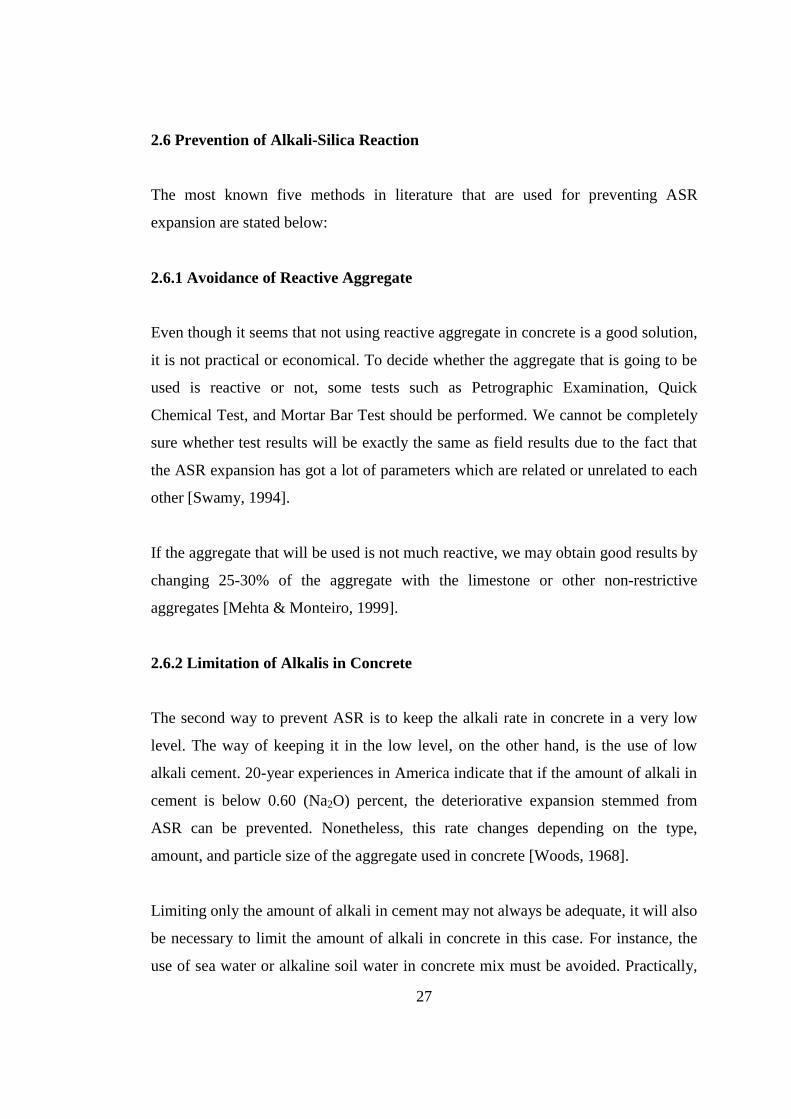
Silica fume is one of the well-known SCM used for mitigation of ASR expansion.
Expansive behavior of mortar bar which consist reactive aggregate and different
amounts of silica fume in cement is shown in Figure 2.12 [Bektaş, Turanlı, &
Monteiro, 2005].
29
Figure 2.12 Expansion graphs that consist different amount of silica fume.
2.6.5 Use of Chemical Additives
Especially lithium-based compounds are used as chemical additives to prevent
deleterious effects of ASR. Whereas this method is not clear enough, the use of
particularly lithium nitrate (LiNO3) has given significant results. It is a common idea
that the expansion characteristic of ASR may undergo a change via lithium
compounds [Page & Page, 2007; Mindess & Young, 1981].
30
CHAPTER III
THEORY OF PRESTRESSED CONCRETE
3.1 General
According to Evans & Bennett (1958), “The pre-stressing of a structural member
may be defined as the creation of an initial stress, of opposite sign to the stress
produced by the working load, in order to increase the working load without
increasing the actual maximum stresses in the member.” (p.3)
The tensile stress of concrete is low while its compressive strength is high. Its tensile
strength is approximately 10 percent of its compressive strength. This condition may
be explained with the ‘piece of chalk’ example. Because concrete has the same
properties as piece of chalk, it can be broken by bending or be pulled apart; but it is
quite hard to crush it [Nawy, 2003; Henry & Peter, 1966]. At early stages of the
loading, flexural cracks develop due to the low tensile capacity of concrete. In order
to prevent such kind of cracks, eccentric or concentric forces are applied at the
longitudinal direction of the structural element. This force is called ‘prestressing
force’, and it eliminates or considerably reduces the tensile stresses at concrete.
Therefore, it increases bending, and torsional and shear capacities of the concrete
element [Nawy, 2003].
The principle of pre-stressing (PS) has been completely understood since 1910.
Nevertheless, the first application of this principle in construction dates back to 1888.
These first applications were not successful enough due to the fact that the nature of
creep in concrete was not comprehended and that the materials which were used
were poor quality. French engineer Freyssinet was the first person that understood
31
the nature of creep in concrete and also in prestressed concrete in 1930s. He also
reliazed that it was necessary to use good materials such as high-tensile steel and
high-quality concrete [Libby, 1971].
3.2 Methods of Pre-stressing
PS stress is the permanent stress which is mostly obtained by stranded cables,
tensioned steel wires, or bars that create compressive force in concrete. There are two
main methods explained below [Abeles & Turner, 1962].
3.2.1 Pre-tensioning
Pre-tensioning is the method in which PS steel is tensioned firstly, and then concrete
is placed. In this method, which is only applied to steel, the concrete is expected to
attain the necessary strength at the beginning; then the tension at the anchorages is
released. This phenomenon is the transfer of PS force to concrete, and the full
transfer occurs over a certain ‘transmission length’. The cross-sectional profile,
diameter, and the surface condition of steel influence the transmission length. The
strength of concrete is also one of the factors which affect the transmission length.
The superiority of the pre-tensioning method over other methods is its being a
reliable and excellent bond between concrete and tensioned steel. Another advantage
of it is that, because it is applied in factories, sufficient observation may be achieved,
and concrete curing can be done properly [Abeles & Turner, 1962].
3.2.2 Post-tensioning
As can be understood from its name, concrete is hardened at first, and then steel is
tensioned in post-tensioning method. Before steel becomes tensioned, there should
be no bond between concrete and steel, and the contact between them should be as
little as possible [Abeles & Turner, 1962].
32
When compared to pre-tensioning, post-tensioning can be considered as
disadvantegous in terms of the reduction in total tensioning force because of the
friction between concrete and steel. Moreover, anchorage seating loss occurs, as well
[Abeles & Turner, 1962; Nawy, 2003].
Steel is named as ‘grouted’ if there is grout at the space between steel and concrete
whereas it is called ‘ungrouted’ if there is no grout there. The purpose of using grout
is to create a bond between steel and concrete. This bond helps the structure to be
more durable, and anchorages can be removed if it is strong enough [Abeles &
Turner, 1962].
3.3 Basic Concepts of Prestressing
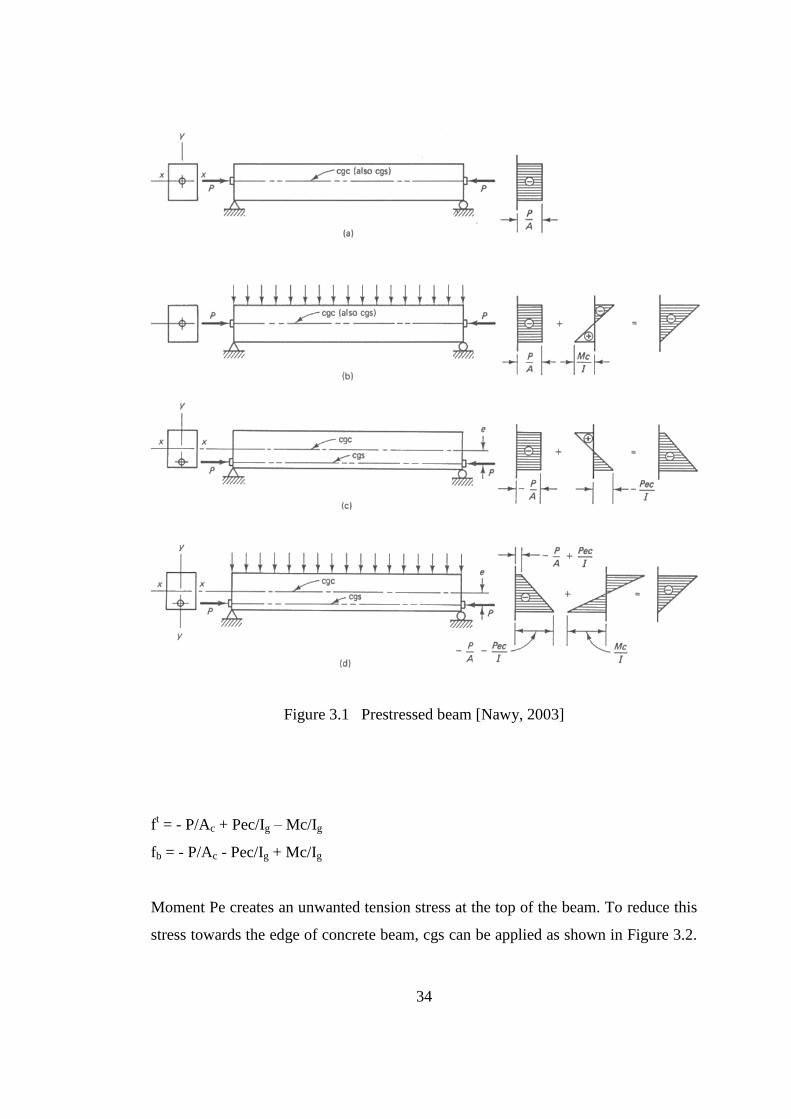
As can be simply seen in Figure 3.1 (a), PS can be explained with concentric PS
force (P) which is applied to simple supported beam that has got a rectangular cross
section. The σc (compressive stress) on the cross section of the beam is uniform and
its intensity is calculated in the formula below.
σc = - P/Ac
In the formula ‘Ac = b x h’, where Ac is the cross sectional area, ‘b’ is the width and
‘h’ is the total depth. While minus sign refers to compression, plus sign is used for
tension.
When the external loads are applied to the beam as shown in Figure 3.1 (b), the stress
(σ) becomes:
σt = - P/Ac – Mc/Ig
σb = - P/Ac + Mc/Ig
where;
33
σt = stress at the top
σb = stress at the bottom
c = ½ h
Ig = bh3/12 (moment of inertia)
As can be understood from the formula above, PS compressive stress (P/A) has a
stress which has the opposite direction with the tensile flexural stress (Mc/I). As a
result, this opposite stress eliminates the tensile flexural stress totally or reduces it
below code limits [Nawy, 2003].
In Figure 3.1 (a), the concentric (cgc) PS load increases the tensile capacity of the
beam. However, this capacity can be increased more efficiently with the same load if
it is placed eccentrically below the cgc. Placing the load P at ecentricity from the
center of the beam creates a moment Pe and this moment reduces the tensile flexural
stress Mc/I as it can be understood from the formulas below and Figure 3.1 (c) (d)
[Nawy, 2003].
34
Figure 3.1 Prestressed beam [Nawy, 2003]
ft = - P/Ac + Pec/Ig – Mc/Ig
fb = - P/Ac - Pec/Ig + Mc/Ig
Moment Pe creates an unwanted tension stress at the top of the beam. To reduce this
stress towards the edge of concrete beam, cgs can be applied as shown in Figure 3.2.
35
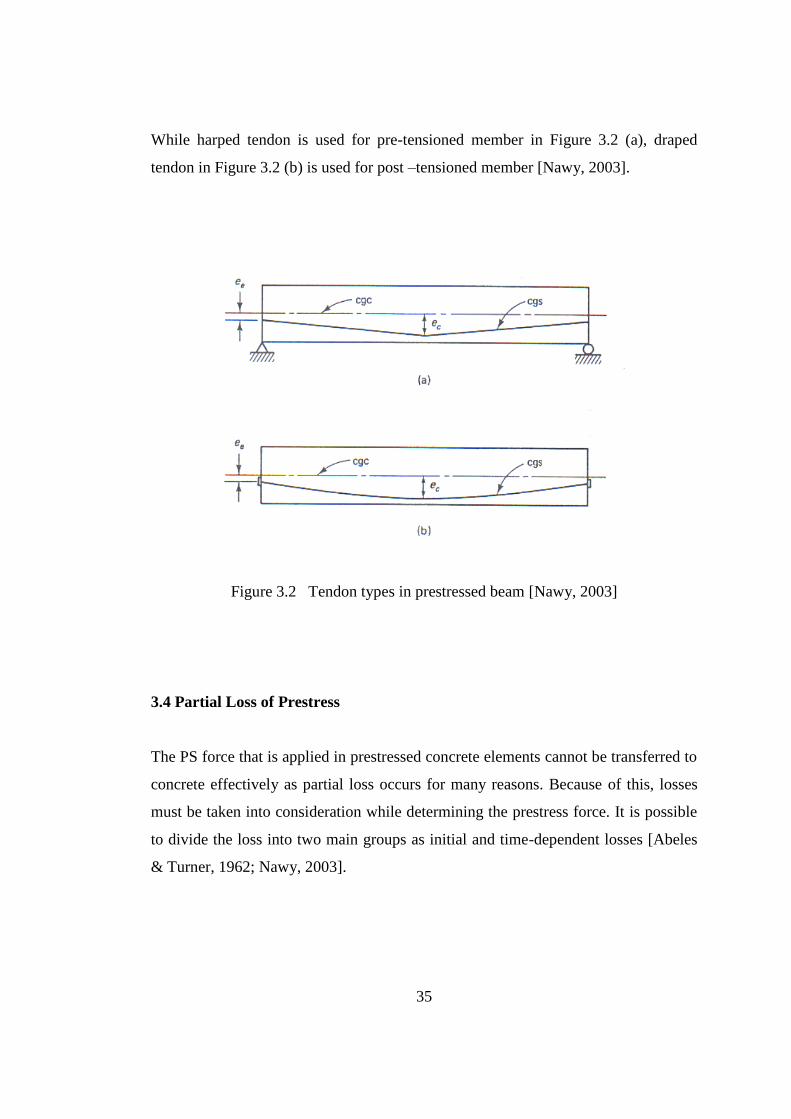
While harped tendon is used for pre-tensioned member in Figure 3.2 (a), draped
tendon in Figure 3.2 (b) is used for post –tensioned member [Nawy, 2003].
Figure 3.2 Tendon types in prestressed beam [Nawy, 2003]
3.4 Partial Loss of Prestress
The PS force that is applied in prestressed concrete elements cannot be transferred to
concrete effectively as partial loss occurs for many reasons. Because of this, losses
must be taken into consideration while determining the prestress force. It is possible
to divide the loss into two main groups as initial and time-dependent losses [Abeles
& Turner, 1962; Nawy, 2003].
36
3.4.1 Initial Losses
Initial losses are the immediate elastic losses that happen during the construction or
fabrication process. The types of the initial loss are given below [Nawy, 2003].
Elastic Shortening (ES): While the elastic shortening occurs in pretensioned
(precast) concrete element during the transfer, it happens at sequential jacking in
post-tensioned members. If all tendons were jacked simultaneously in post-tensioned
elements, ES would be zero [Nawy, 2003].
The ES in pre-tension member is explained with formulas below:
ES = ΔES/L
ES = fc/Ec = P/AcEc
where;
ΔES: Elastic shortening in concrete
L: Length of member
ES: Strain due to ES
fc: compressive stress due to PS force
P: PS force
Ac: Cross sectional area of concrete
Ec: Elastic modulus of concrete
Since there is a same ES in concrete and steel,
ΔfpES = Es x ES = EsP/AcEc = n x P/Ac = nfc
n = Es/Ec
where;
ΔfpES = ES in steel.
Es: elasticity modulus of steel
n: ES constant
Consequently; ΔES = n x P/Ac [Nawy, 2003].
37
Anchorage –Seating Losses (AL): It occurs in the anchors during the transfer of
jacking force to the anchorage seating of wedges. Depending on anchorage system,
ΔA (slip) occurs and AL becomes;
ΔfpA = (ΔA/L) x Eps
ΔA: Slip in anchorage system
Eps: Elasticity modulus of tendon.
Friction Losses (FL): Friction loss occurs as a result of the friction between the
surrounding concrete and the tendons in post-tensioning concrete members. There
are two types of FL as curvature effect and wobble effect [Nawy, 2003].
Magnitude of curvature effect is a function of the tendon form. FL depends on total
angle ( ) of deviation between given point and jack. As can be seen from Figure 3.2
(b), it changes from edge to midspan. Curvature effect can be expressed through the
formula below [Evans & Bennett, 1958].
P = P0 x e-u
P : Tension in cable
P0: Tension in jacking (applied stress)
u: Coefficient of friction (curvature effect)
: Angle of deviation
Another type of FL is wobble effect and it occurs because of local deviations in the
alignment. Such kind of losses stems from the improper sheaths or placements of
ducts, and can be explained with the formula below: [Nawy, 2003; Evans & Bennett,
1958].
P = P0 x e-kl
k: Coefficient of friction (wobble effect)
L: L = x R (R:radius of tendon)
38
3.4.2 Time Dependent Losses
Time dependent losses continue presumably for five years after the application of the
initial PS force. These losses are described below: [Nawy, 2003]
Steel Stress Relaxation (SR): Stress relaxation occurs in steel due to the ratio of
initial prestress to the strength of steel. The constant elongation of tendons occurs in
time in post-tensioned and pre-tensioned members [Nawy, 2003;Evans & Bennett,
1958].
The ACI 318-02 code limits are given below:
fp = 0.94 fpy
fp = 0.80 fpu
Ppi = 0.74 fpu (in post-tensioned 0.70 fpu)
fp: Tendon stress
fpy: Yield strength
fpu: Ultimate strength
Ppi: Stress imeddiately after prestress is transferred
SR can be determined with the formula below:
ΔfpR = fp ((log[t])/10) (fp/fpy – 0.55) (for fp/fpy > 0.55)
Where;
ΔfpR : SR loss
t: time with hours
Creep Loss (CL): It is known that creep occurs in concrete under sustained load.
Hence, concrete undergoes deformation under PS force and it leads to reduction in
PS force. Creep loss occurs both in pre-tensioned and post-tensioned members
[Nawy, 2003; Abeles & Turner, 1962].
Creep loss can be defined with the formula below:
39
Δfp(cl) = Ct (Eps/Ec) fcs
Ct = t0.60
/(10+t060
) Cu
Cu = cu/ ES
Where;
Δfp(cl): Creep Loss
fcs: Stress in concrete (at centroid of concrete)
cu: Elastic strain
ES: Creep strain
t: time (in days)
Shrinkage Loss (SL): It is known that concrete undergoes a shrinkage; and mixture
proportions, cement type, aggregate type, curing time, volume to size ratio of
member, environmental conditions affect its rate . Shrinkage leads to the shortening
of the concrete member, which causes the loss of prestress [Nawy, 2003; Evans &
Bennett, 1958]. Losses of PS can be calculated by using formula below and Table 1.
Δfp(SH) = 8.2 x 10⁻⁶
KSH EPS (1 – 0.06 V/S) (100 – RH)
EPS : Elasticity modulus of steel
V/S: Volume-Surface ratio
RH: Relative humidity
In post-tensioned concrete member, PS loss will be less relatively to the pre-
tensioned one. The reason is that its shrinkage rate will be much in early days
whereas it will be little afterwards; and shrinkage will have occurred by the time
force is applied to the post-tensioned member. The KSH value in the formula is
related to this, and it is taken as 1 for pre-tensioned member while Table 3.1 is used
for the post-tensioned one [Nawy, 2003].
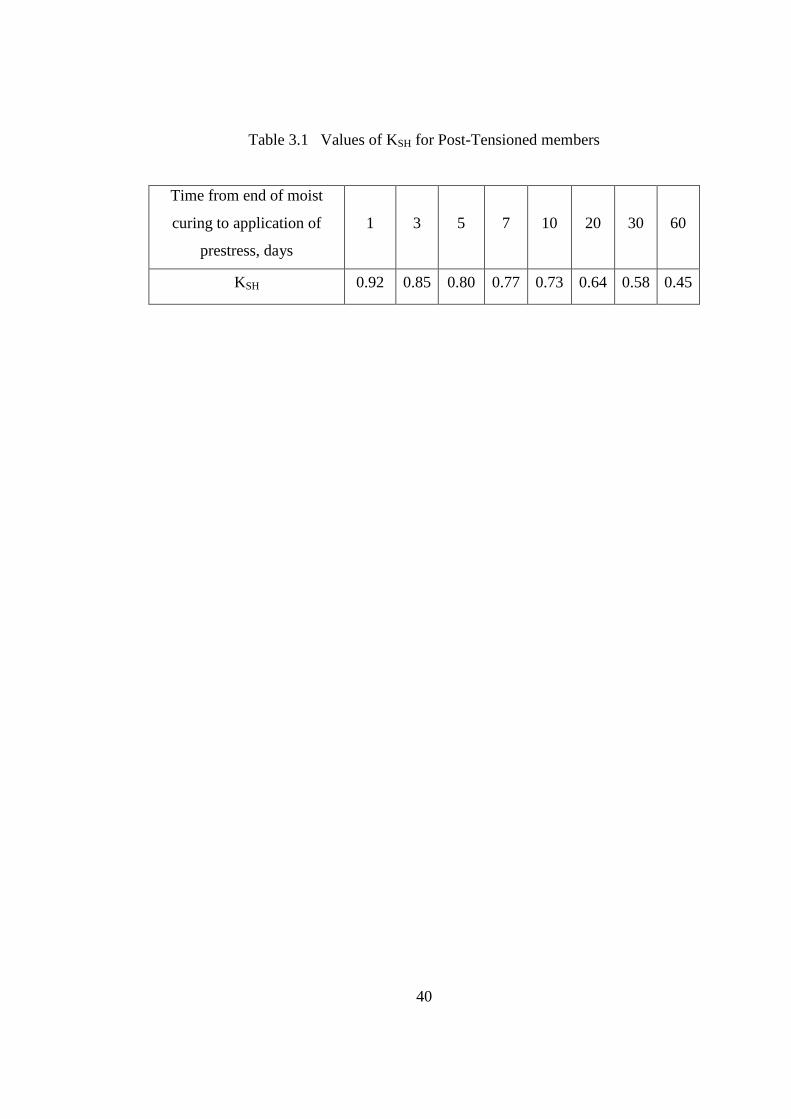
40
Table 3.1 Values of KSH for Post-Tensioned members
Time from end of moist
curing to application of
prestress, days
1 3 5 7 10 20 30 60
KSH 0.92 0.85 0.80 0.77 0.73 0.64 0.58 0.45
41
CHAPTER IV
REVIEW OF RESEARCH ON MECHANICAL PREVENTIVE MEASURES
AGAINST ALKALI – SILICA REACTION
4.1 General
The first method that comes to mind related to preventive measures against ASR is to
add mineral admixture into the cement, namely the usage of supplementary
cementing materials. On the other hand, use of chemical additives and mechanical
preventive measures are also available. Many researches about the mechanical
approach and the effects of restrained conditions on ASR expansion have been
carried out especially in last decade.
4.2 Effects of Restraint Conditions on ASR
Temperature, relative humidity and stress state are the external parameters that affect
ASR-based damage and expansion in concrete structure. Even though there are fewer
studies about stress state than the others, many experiments show that there is a
decrease in ASR expansion along the compressed direction [Multon, et.al 2004;
Cyrille & Karen, 2012].
In Figure 4.1 (a) and Figure 4.1 (b), the longitudinal and lateral expansion graphs of
the cylinders (height 335 mm, diameter 160 mm) that are under uniaxial compressive
stress are given. Cylinders were loaded constantly by hydraulic pressure with the
loads 0, 5, 10 and 20 MPa. Creep and elastic deformations that are formed as a result
of the load effect have been removed in the graphics. As can be understood from the
graphs, the longitudinal expansion in compressive stress direction decreases
42
dramatically as the load increases, and has significant value under only 5 MPa.
Lateral expansion is reduced under uniaxial compressive load at first, and then is
raised under further increase. It can be seen in Figure 4.1 (b) graph that while the
expansion of the samples under 5 and 10 MPa occurring up to 200 days is less than
the one of the free sample, the expansion of the sample under 20 MPa is more, which
is called ‘redistribution of expansion’. It can be verified from the same graph that the
lateral expansion is accelerated by the load [Cyrille & Karen, 2012]. The results of a
similar study are given in Figure 4.2. This graph shows the effect of the applied load
on axial and radial strains [Stephen & François, 2006].
If the cylinder mentioned above is reinforced and instead of compressive stress,
tensile stress is applied to it, expansion increases further [Jones & Clark, 1996].
Some researchers claim that ASR-based volume increase becomes more as the load
increases; and the results obtained with the equation below are given in graphics in
Figure 4.3 [Cyrille & Karen, 2012]. However, there are also some researches which
show that the ASR-based expansion remains the same in every condition. It is
asserted that there is ‘expansion transfer’ from the direction in which compressive
stress is much towards the one where it is less. Also, the total expansion is claimed to
be constant [Stephen & François, 2006].
Rv = (l0 + Δl) x (r0 + Δr)2 / l0 x r0
2
Where,
Rv: Relative volume
l and l0: The longitudinal sensor length and respectively initial length.
r and r0: The lateral sensor length and respectively initial length.
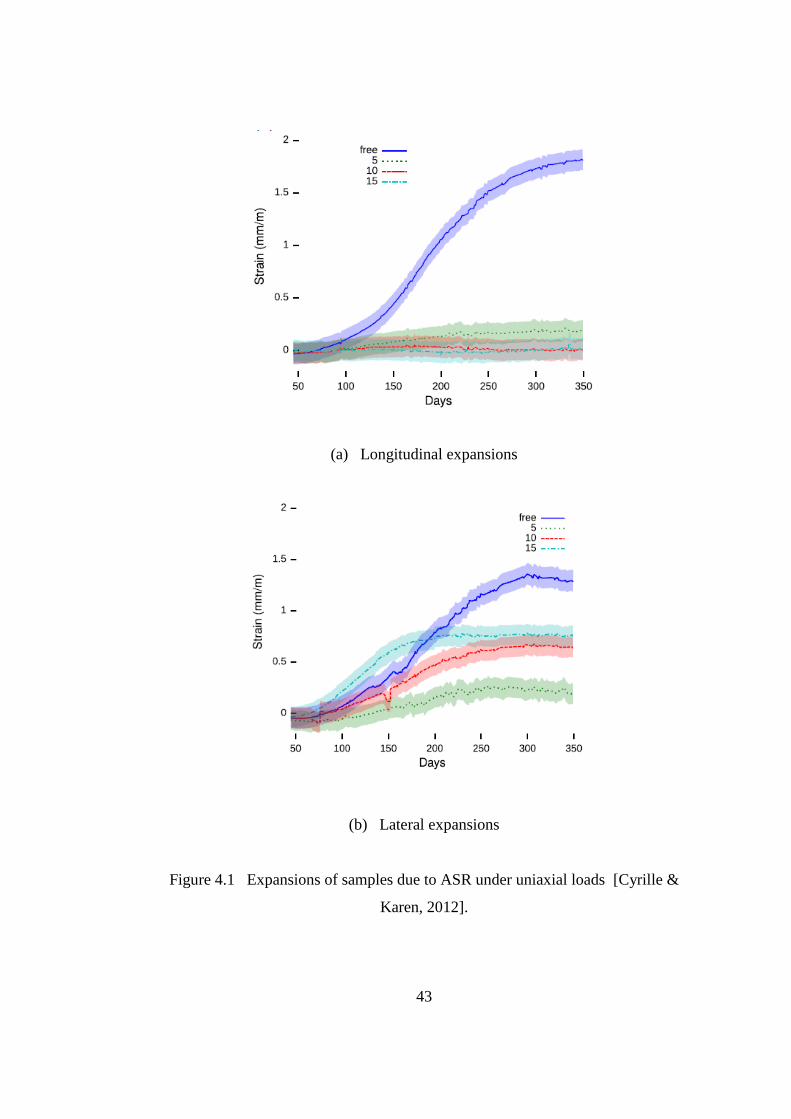
43
(a) Longitudinal expansions
(b) Lateral expansions
Figure 4.1 Expansions of samples due to ASR under uniaxial loads [Cyrille &
Karen, 2012].
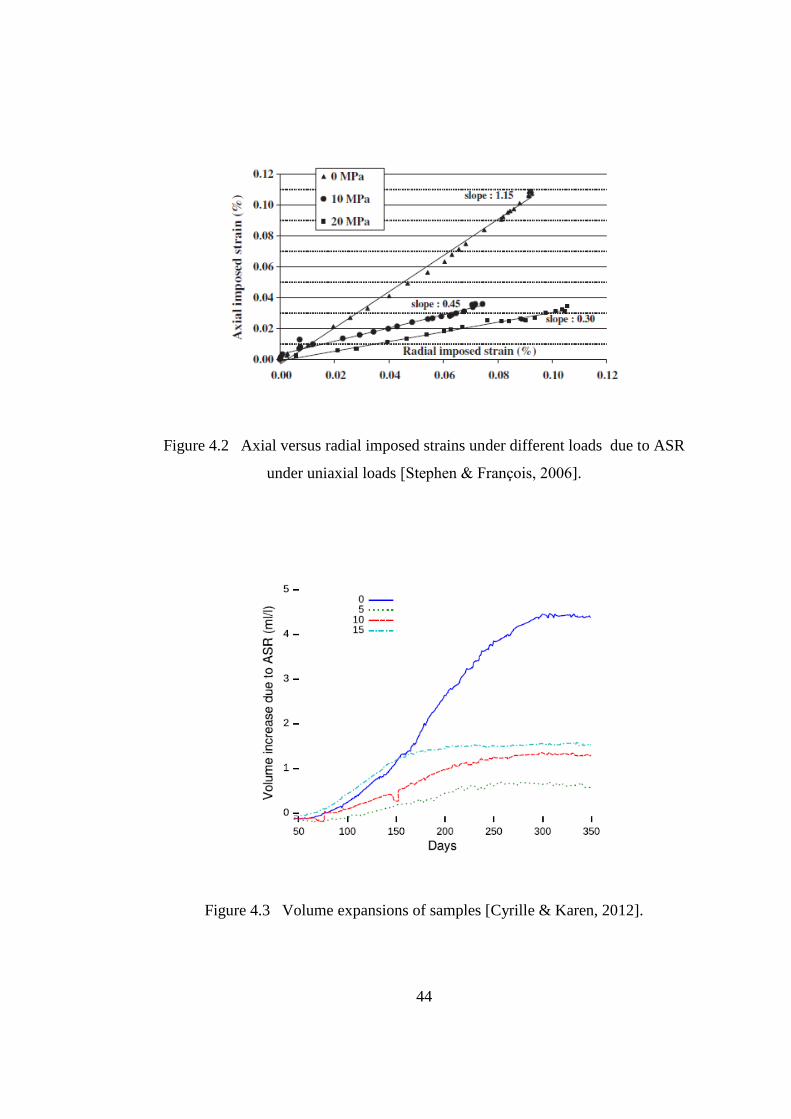
44
Figure 4.2 Axial versus radial imposed strains under different loads due to ASR
under uniaxial loads [Stephen & François, 2006].
Figure 4.3 Volume expansions of samples [Cyrille & Karen, 2012].

45
In recent years, many studies have been carried out on the equipment which
measures how much stress the ASR-based expansion produces [Binal, 2007; Berra,
Faggiani, Mangialardi, & Paolini, 2010]. The schematic diagram of one of these
apparatuses which can continuously monitor the ASR expansive pressure on the
concrete specimen by using the storage acquisition system is given in Figure 4.4. The
equation and graph given in Figure 4.5 are derived by means of this equipment. In
this equation which was derived by Charlwood, ASR is the restrained ASR strain at
time t, 0
ASR is the unrestrained one at the same time, σlc is the compressive stress
below which ASR is equal to unrestrained strain and constant, K is the slope of the
line which defines the logarithm of stress versus strain [Charlwood, Solymar, &
Curtis, 1992].
Figure 4.4: Experimental equipment which measures ASR expansive pressure
[Berra, Faggiani, Mangialardi, & Paolini, 2010].
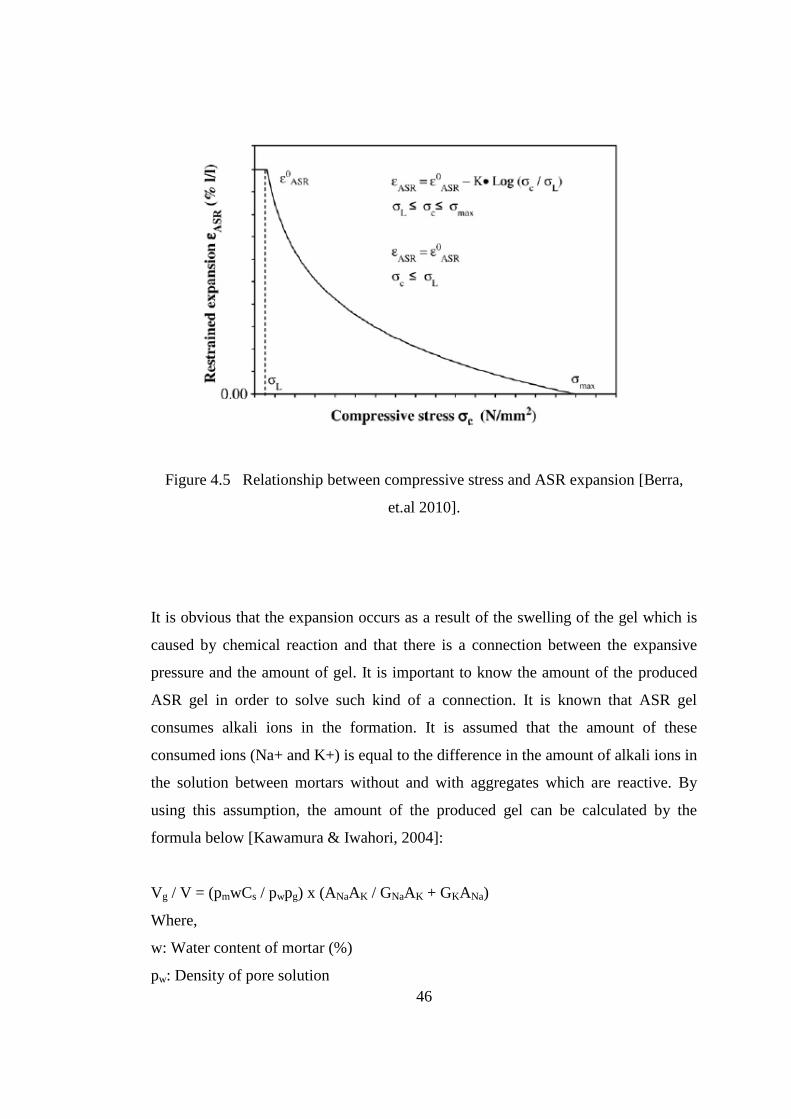
46
Figure 4.5 Relationship between compressive stress and ASR expansion [Berra,
et.al 2010].
It is obvious that the expansion occurs as a result of the swelling of the gel which is
caused by chemical reaction and that there is a connection between the expansive
pressure and the amount of gel. It is important to know the amount of the produced
ASR gel in order to solve such kind of a connection. It is known that ASR gel
consumes alkali ions in the formation. It is assumed that the amount of these
consumed ions (Na+ and K+) is equal to the difference in the amount of alkali ions in
the solution between mortars without and with aggregates which are reactive. By
using this assumption, the amount of the produced gel can be calculated by the
formula below [Kawamura & Iwahori, 2004]:
Vg / V = (pmwCs / pwpg) x (ANaAK / GNaAK + GKANa)
Where,
w: Water content of mortar (%)
pw: Density of pore solution
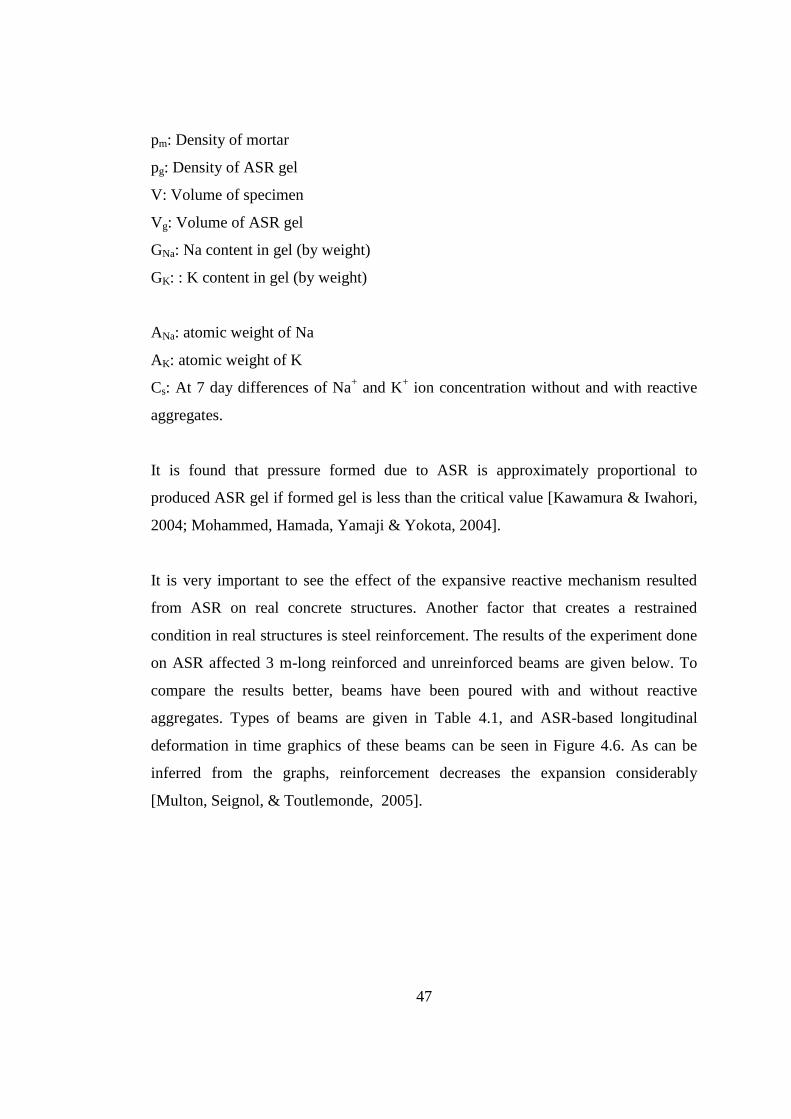
47
pm: Density of mortar
pg: Density of ASR gel
V: Volume of specimen
Vg: Volume of ASR gel
GNa: Na content in gel (by weight)
GK: : K content in gel (by weight)
ANa: atomic weight of Na
AK: atomic weight of K
Cs: At 7 day differences of Na+ and K
+ ion concentration without and with reactive
aggregates.
It is found that pressure formed due to ASR is approximately proportional to
produced ASR gel if formed gel is less than the critical value [Kawamura & Iwahori,
2004; Mohammed, Hamada, Yamaji & Yokota, 2004].
It is very important to see the effect of the expansive reactive mechanism resulted
from ASR on real concrete structures. Another factor that creates a restrained
condition in real structures is steel reinforcement. The results of the experiment done
on ASR affected 3 m-long reinforced and unreinforced beams are given below. To
compare the results better, beams have been poured with and without reactive
aggregates. Types of beams are given in Table 4.1, and ASR-based longitudinal
deformation in time graphics of these beams can be seen in Figure 4.6. As can be
inferred from the graphs, reinforcement decreases the expansion considerably
[Multon, Seignol, & Toutlemonde, 2005].
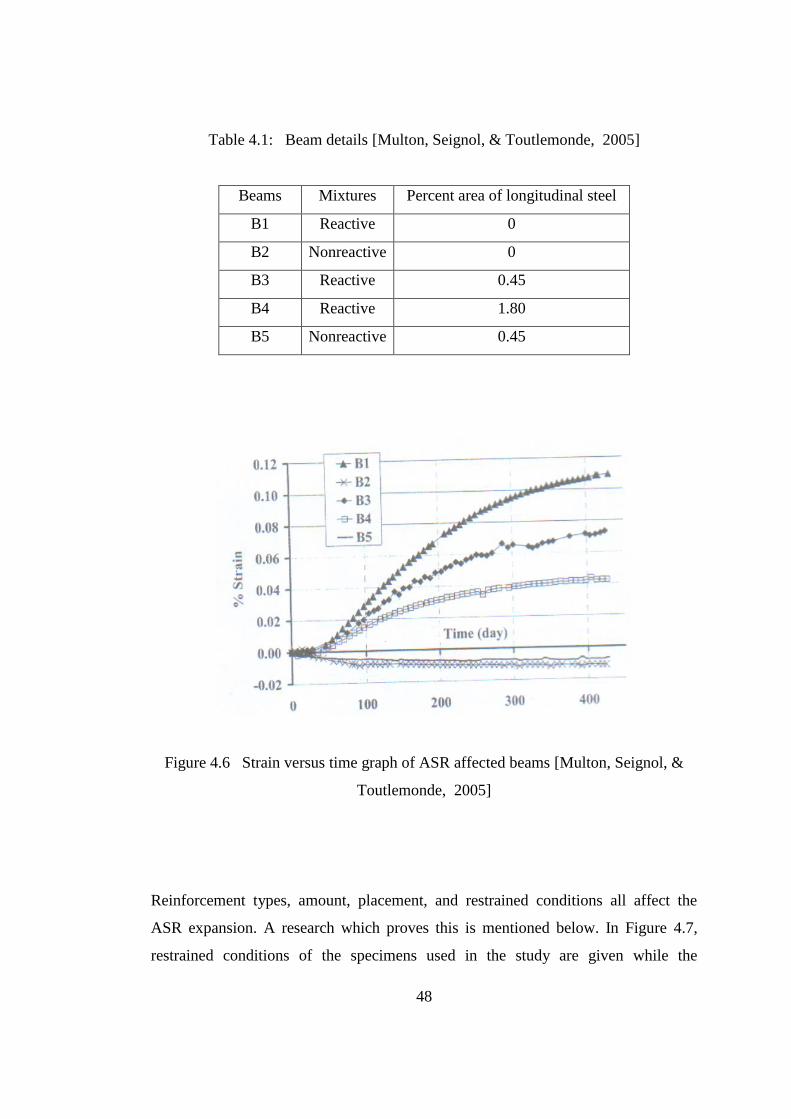
48
Table 4.1: Beam details [Multon, Seignol, & Toutlemonde, 2005]
Beams Mixtures Percent area of longitudinal steel
B1 Reactive 0
B2 Nonreactive 0
B3 Reactive 0.45
B4 Reactive 1.80
B5 Nonreactive 0.45
Figure 4.6 Strain versus time graph of ASR affected beams [Multon, Seignol, &
Toutlemonde, 2005]
Reinforcement types, amount, placement, and restrained conditions all affect the
ASR expansion. A research which proves this is mentioned below. In Figure 4.7,
restrained conditions of the specimens used in the study are given while the
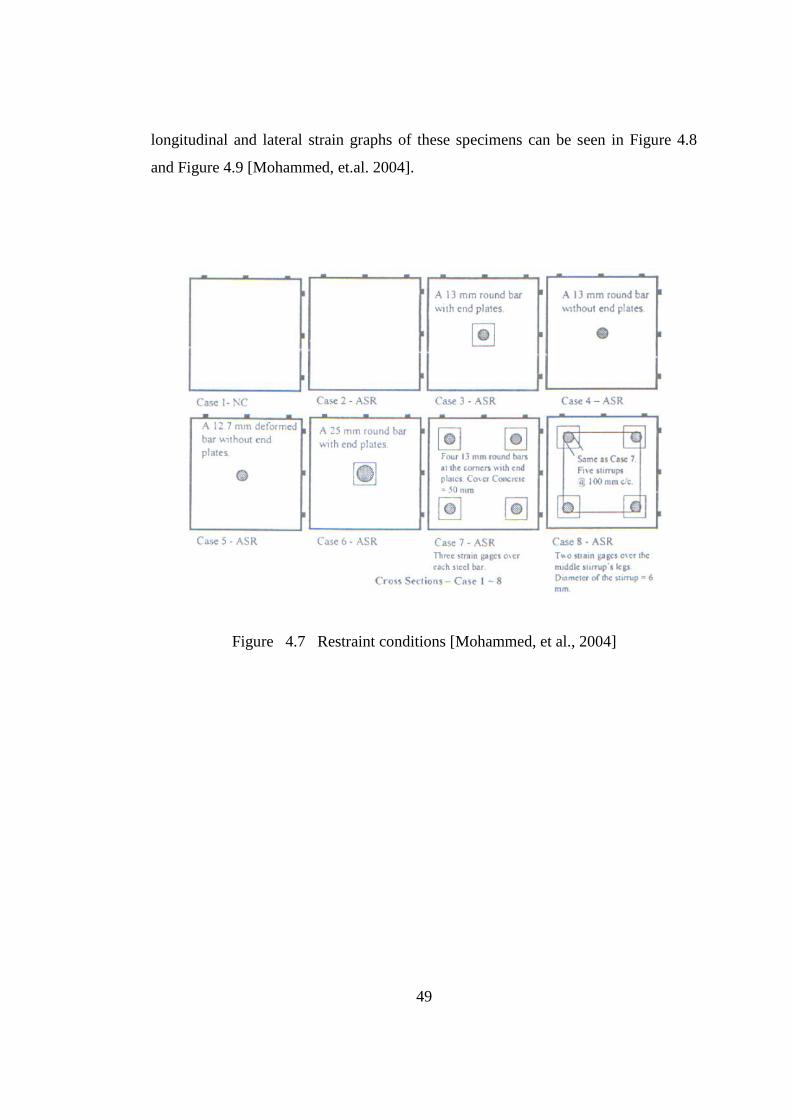
49
longitudinal and lateral strain graphs of these specimens can be seen in Figure 4.8
and Figure 4.9 [Mohammed, et.al. 2004].
Figure 4.7 Restraint conditions [Mohammed, et al., 2004]
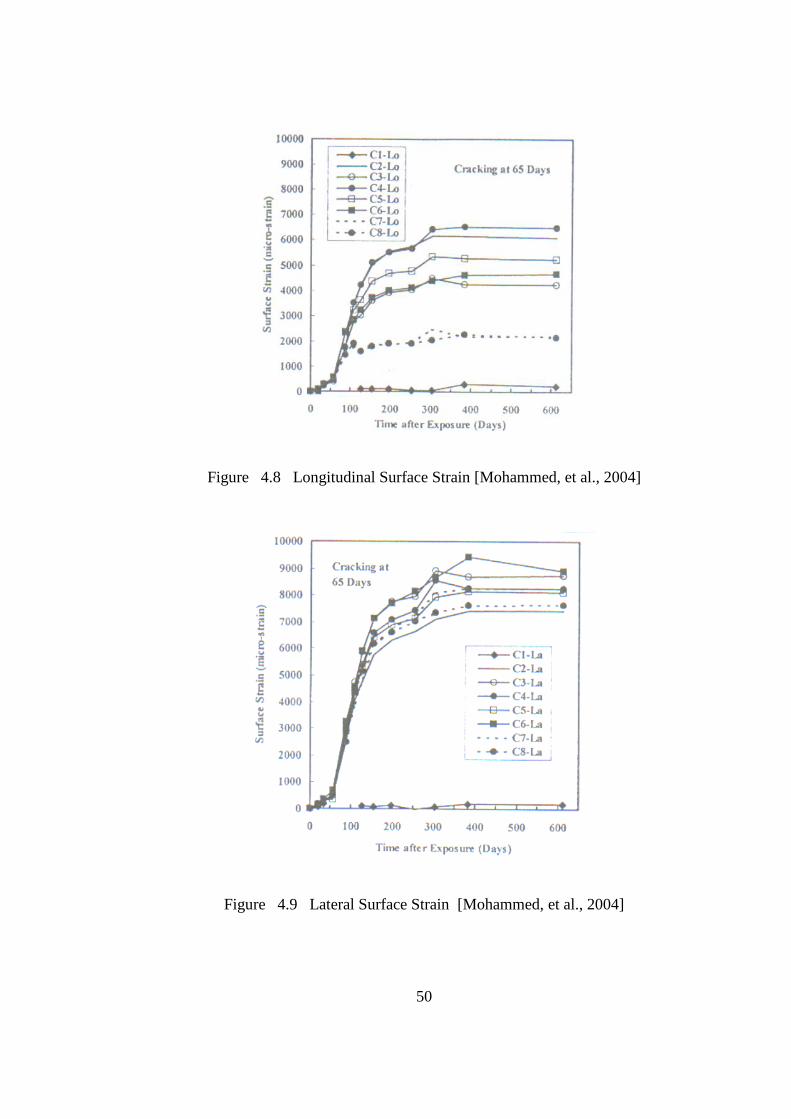
50
Figure 4.8 Longitudinal Surface Strain [Mohammed, et al., 2004]
Figure 4.9 Lateral Surface Strain [Mohammed, et al., 2004]

51
In the study by [Mohammed et al.,2004], there are both longitudinal and lateral strain
gages on the surface of every specimen, and reinforcements have strain gages on the
surface as well. The results of the cases are given below:
Case 1: Control specimen
Case 2: Significant amount of longitudinal and lateral strains in the same ratio is
observed.
Case 3: A great difference between the longitudinal and lateral strains of the concrete
surface after the specimen has cracked is observed.
Case 4: Even though some strain is initially observed in the bar, there is a dramatic
decrease afterwards due to the bar is round and it does not have an end plate; and
concrete expands freely as in Case 2. For this reason, the surface expansion is the
same as in Case 2.
Case 5: The lateral to longitudinal surface strain ratio and the strain over the steel bar
are less when compared to Case 3, and much in comparison with Case 4.The reason
is formation of a restrained condition by the deformed bar.
Case 6: There is not a significant difference between Case 3 and Case 6 in terms of
surface expansion. Because the steel area of Case 6 is more, and there is low
restrained condition relatively to this area, the steel strain of Case 6 is two times less
than the one of Case 3.
Case 7: Even though the steel areas of Case 6 and Case 7 are equal, there is a great
difference between their longitudinal surface strains. It is obvious that the position of
steel bar is important, and it is more efficient when nearer to the surface. It can be
inferred that the expansion is local as the bars in both Case 3 and Case 7 have the
same steel strain.
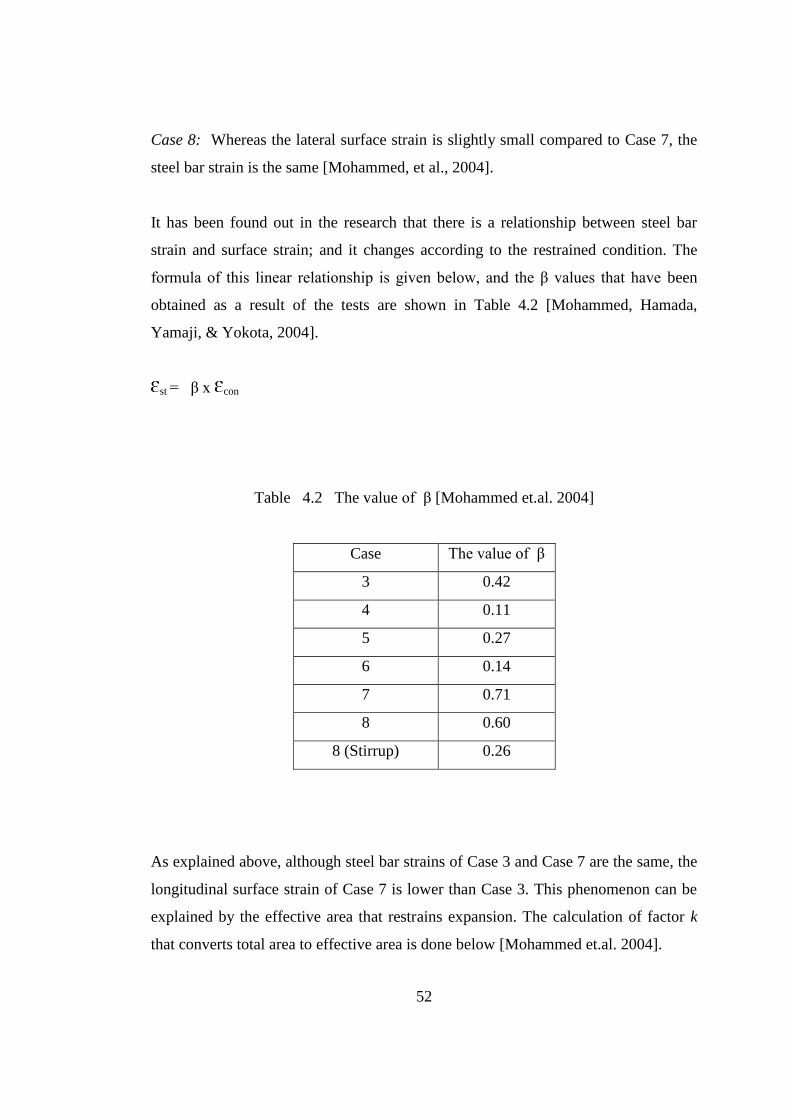
52
Case 8: Whereas the lateral surface strain is slightly small compared to Case 7, the
steel bar strain is the same [Mohammed, et al., 2004].
It has been found out in the research that there is a relationship between steel bar
strain and surface strain; and it changes according to the restrained condition. The
formula of this linear relationship is given below, and the β values that have been
obtained as a result of the tests are shown in Table 4.2 [Mohammed, Hamada,
Yamaji, & Yokota, 2004].
st = β x con
Table 4.2 The value of β [Mohammed et.al. 2004]
Case The value of β
3 0.42
4 0.11
5 0.27
6 0.14
7 0.71
8 0.60
8 (Stirrup) 0.26
As explained above, although steel bar strains of Case 3 and Case 7 are the same, the
longitudinal surface strain of Case 7 is lower than Case 3. This phenomenon can be
explained by the effective area that restrains expansion. The calculation of factor k
that converts total area to effective area is done below [Mohammed et.al. 2004].
53
Fc = kAcEc( f - r)
Fs = AsEs s
Fc = Fs
k = (As/Ac) x (Es/Ec) x [ s/( f - r)]
where,
k: Area convert factor
Ac: Concrete area
As: Steel area
Ec: Elastic modulus of concrete
Es: Elastic modulus of steel
Fc: Developed compressive force in concrete
Fs: Developed tension force in steel
f: Strain of free expansion of concrete
r: Strain of restrained expansion in concrete
4.3 Effects of Reinforcement on Mechanical Properties of ASR Affected
Concrete Structures.
A lot of tests have been done on mechanical properties ASR affected concrete
[Swamy & Al-Asali, 1990; Koyanagi, et al., 1986]. The tests on ASR affected plain
and reinforced concretes show that Young’s modulus of specimen decreases due to
ASR. At the same time, similar results are obtained when the splitting tensile test is
applied on the specimens that are made of the same material. The tensile strength
results of these beams are quite interesting. Two different plain beams which are
made of the same materials and are exposed to the same environment may show
different ultimate loads and load-deflection graph results. The reason is the failure’s
being on ASR-based transversal cracks. Therefore, the splitting tensile test is not a
suitable way of testing the tensile strength of ASR affected structures [Multon et al.,
2004].
54
The same research indicates that ASR does not affect the strength of the reinforced
beam, and classical calculation methods to determine the strength can be applied to
ASR affected structures [Multon et al., 2004].
4.4 ASR in Prestressed Concrete
Although there has been little research about the effects of ASR on prestressed
concrete structures, it has been found out via examining some ASR damaged
structures that it damages this kind of structures and leads to losses in their mechanic
properties [Koichi, 1988].
The tests done on prestressed concrete (PC) indicate that the flexural capacity of the
beam decreases 10% while the decrease rate is 20% for its shear capacity. [Clayton,
et al.,1990; Kobayashi, et al.,1988].
The result of a test done on the PC beam is given in Figure 4.10. The beam is
prestressed by the bars having two different diameters, and as can be understood
from the graph, the longitudinal expansion decreases as the prestress force increases.
The results of the same test show that the load-deflection graphs of the beams with or
without exposure to ASR are the same [Kobayashi et.al, 1988].
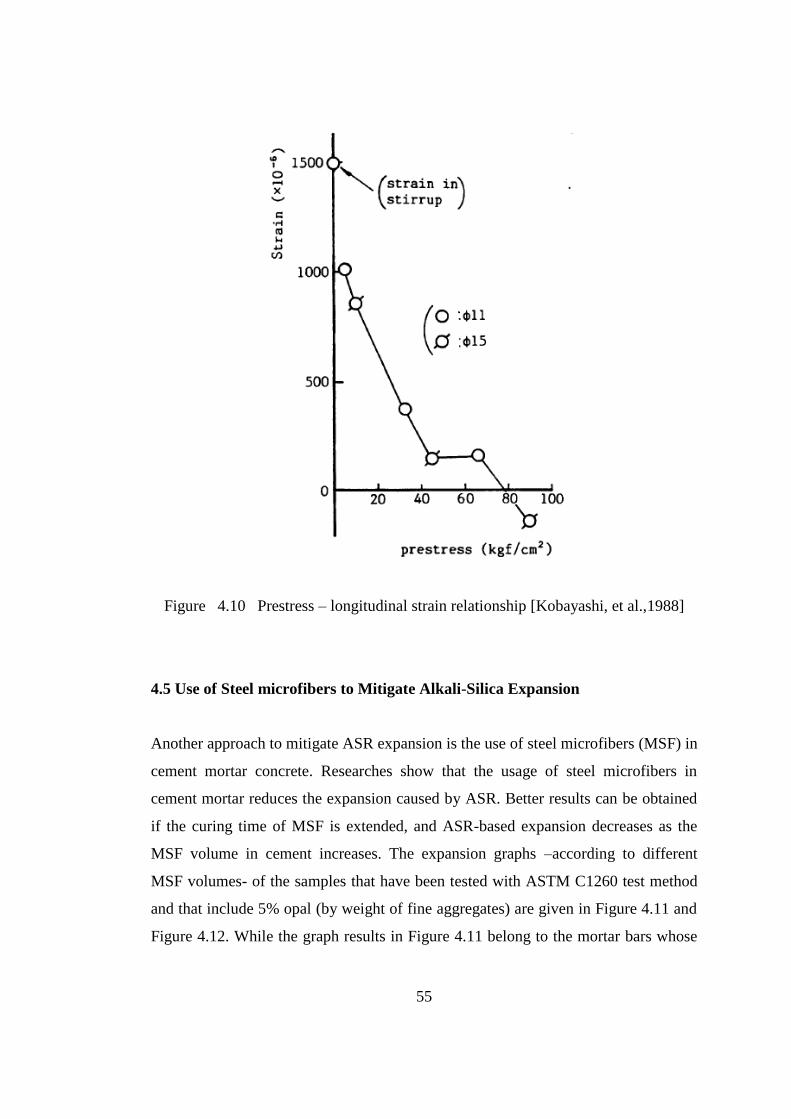
55
Figure 4.10 Prestress – longitudinal strain relationship [Kobayashi, et al.,1988]
4.5 Use of Steel microfibers to Mitigate Alkali-Silica Expansion
Another approach to mitigate ASR expansion is the use of steel microfibers (MSF) in
cement mortar concrete. Researches show that the usage of steel microfibers in
cement mortar reduces the expansion caused by ASR. Better results can be obtained
if the curing time of MSF is extended, and ASR-based expansion decreases as the
MSF volume in cement increases. The expansion graphs –according to different
MSF volumes- of the samples that have been tested with ASTM C1260 test method
and that include 5% opal (by weight of fine aggregates) are given in Figure 4.11 and
Figure 4.12. While the graph results in Figure 4.11 belong to the mortar bars whose
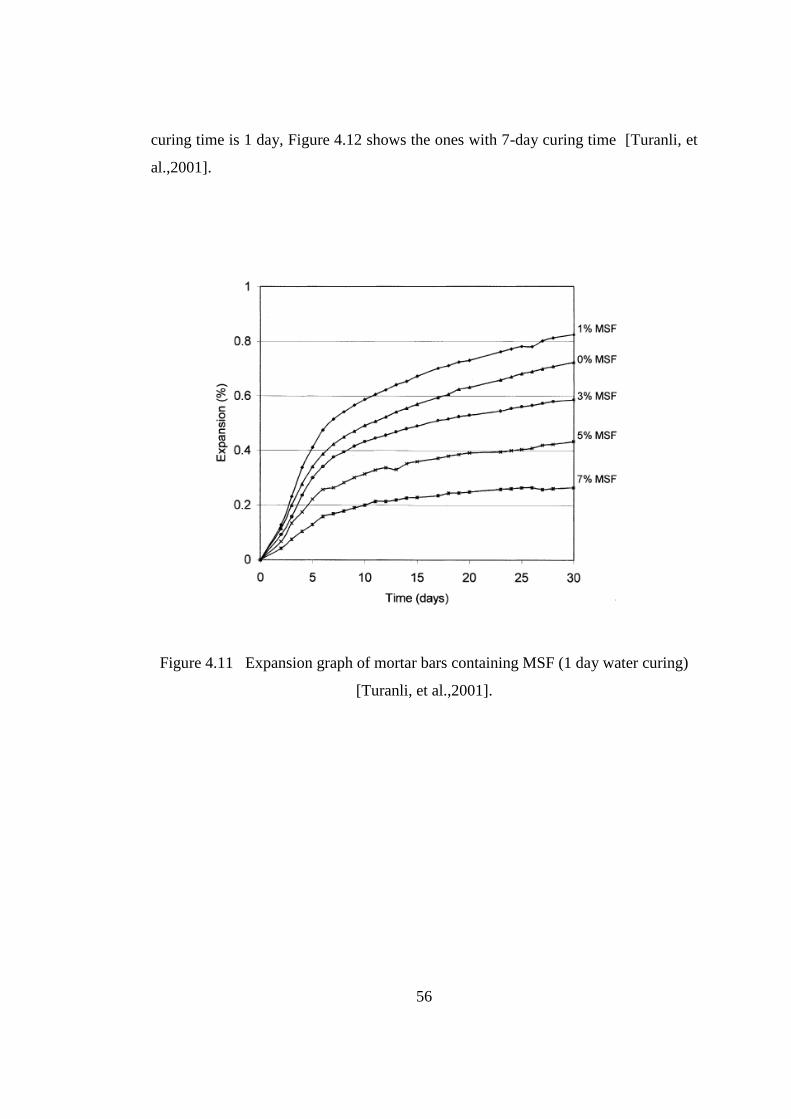
56
curing time is 1 day, Figure 4.12 shows the ones with 7-day curing time [Turanli, et
al.,2001].
Figure 4.11 Expansion graph of mortar bars containing MSF (1 day water curing)
[Turanli, et al.,2001].
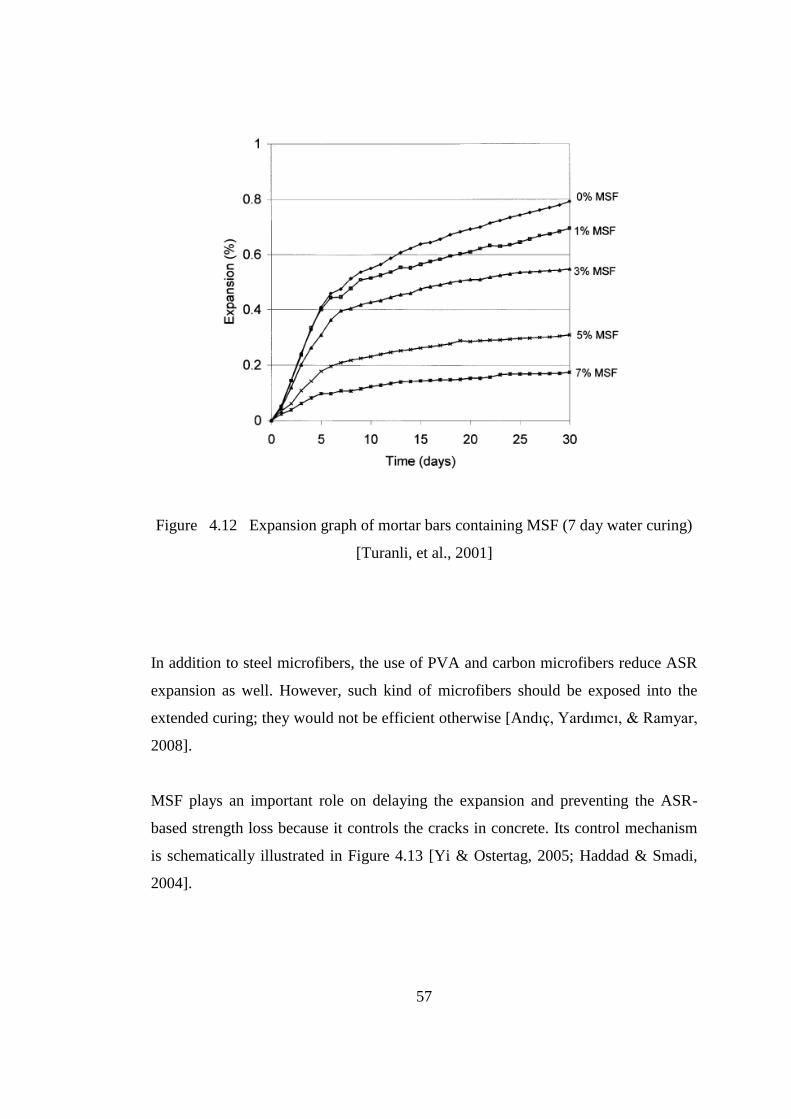
57
Figure 4.12 Expansion graph of mortar bars containing MSF (7 day water curing)
[Turanli, et al., 2001]
In addition to steel microfibers, the use of PVA and carbon microfibers reduce ASR
expansion as well. However, such kind of microfibers should be exposed into the
extended curing; they would not be efficient otherwise [Andıç, Yardımcı, & Ramyar,
2008].
MSF plays an important role on delaying the expansion and preventing the ASR-
based strength loss because it controls the cracks in concrete. Its control mechanism
is schematically illustrated in Figure 4.13 [Yi & Ostertag, 2005; Haddad & Smadi,
2004].
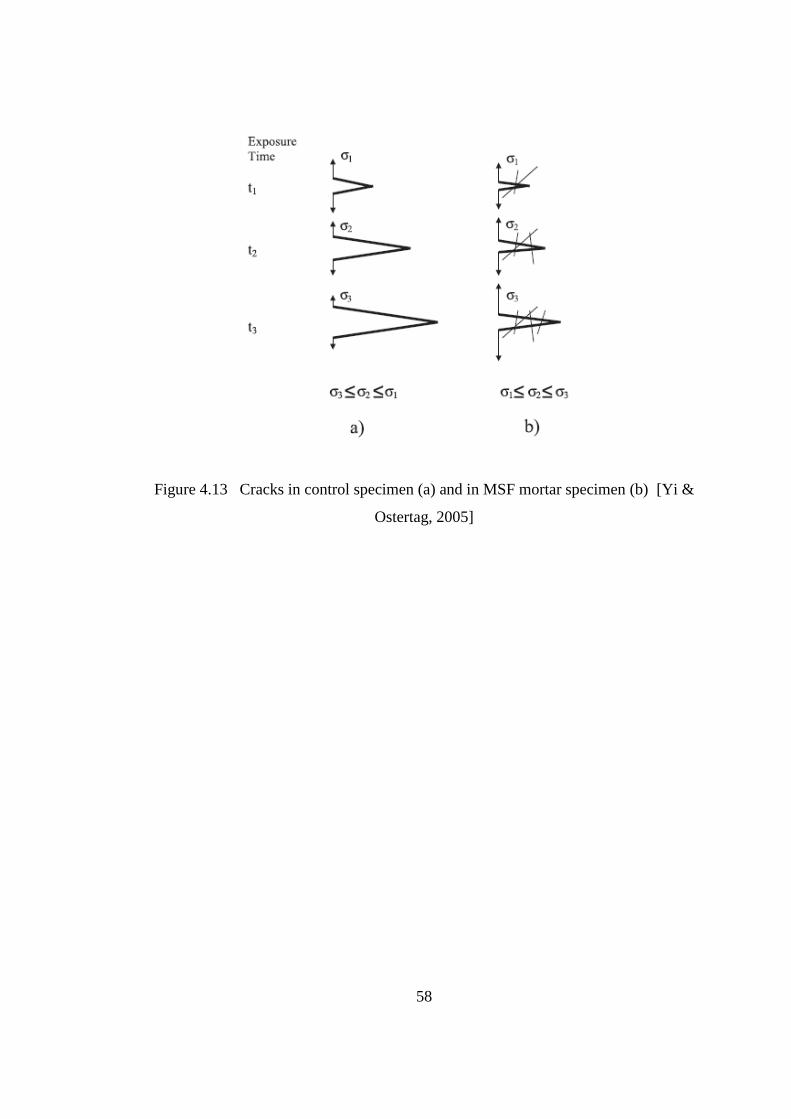
58
Figure 4.13 Cracks in control specimen (a) and in MSF mortar specimen (b) [Yi &
Ostertag, 2005]
59
CHAPTER V
EXPERIMENTAL STUDY
5.1 General
The study presented in this thesis was intended to evaluate the effects of restrained
conditions on specimens which were exposed to ASR. Restrained conditions were
prestressed round bars with end plates and unprestressed ones. All the tests were
performed at the Materials of Construction Laboratory of Middle East Technical
University.
In this investigation, along with 10 different ones, 28 specimens in total were tested.
It is possible to divide them into 4 groups in general as given below:
1. Three different types of specimens were made with the usage of wires with
20, 40, and 60 kg tension capacities functioning as reinforcement which were
all prepared by using perlite and limestone. Three samples of each kind were
prepared, and the average of the results is taken. In this way, the effect of
wires with different capacities on ASR expansion was researched. So as to
examine the interfacial bond between reinforcement and concrete, in addition
to the samples mentioned above, a specimen that had been prepared with
wires in 40kg tension capacity was tested by raising its curing period from 1
day to 7 days. Also, 3 control specimens that were unreinforced and made of
the same material were tested.
2. 20 kg pre-stressing (PS) force was applied on each wire of the two different
specimen types -with 40 kg and 60 kg capacities- that were prepared as the
60
first group. Again, 3 samples of each kind were made; and it was investigated
whether the PS force would prevent ASR-based expansion or not.
3. 3 specimens that were prepared by using less reactive natural river sand were
reinforced by wires with 60 kg capacity, and 20 kg force was applied to each
of those wires. 3 control specimens made of that kind of aggregate were
tested in this group, too. The same PS force on specimens having different
expansion capacities was investigated in this study.
4. In order to make comparison with the supplementary cementing material
(SCM) usage which is a traditional ASR preventive measure, 3 specimens
having the same aggregate types and ratios as the ones in the first group were
prepared and tested. 20% low calcium fly ash was used in the cement of
those specimens.
5.2 The Apparatuses Used
5.2.1 Mold
A mold was prepared as seen in Figure 5.1 to make two specimens. It is the same
mold as the one used in ASTM C490, and to apply pre-stressing force on wires, 4
holes (2 mm diameter) on both sides of the apparatus which would enable the wires
to get out of the mold were made. In order to leave enough place for gage stun, end
plates were stiffened 24.5 mm apart from gage stud holders as seen in the picture. In
this case, the inner part which was exposed to restrained condition became 230 mm.
Anchorages seem closer in Figure 5.2 Steel nut with 5 mm diameter (inner diameter
4 mm) was used as anchorages, and the wire was passed through the nut after
wrapping around it. As seen in Figure 5.2, the wire on the left part of the picture with
0.60 mm diameter was wound around the nut four times whereas on the right, the
wire of 1 mm was wrapped only once. The steel end plates in 25x25 mm2
dimension
have the thickness of 2 mm, and both faces of them are rough to provide a better
bond with concrete. Plates were also fixed from inner sides to make them remain stiff
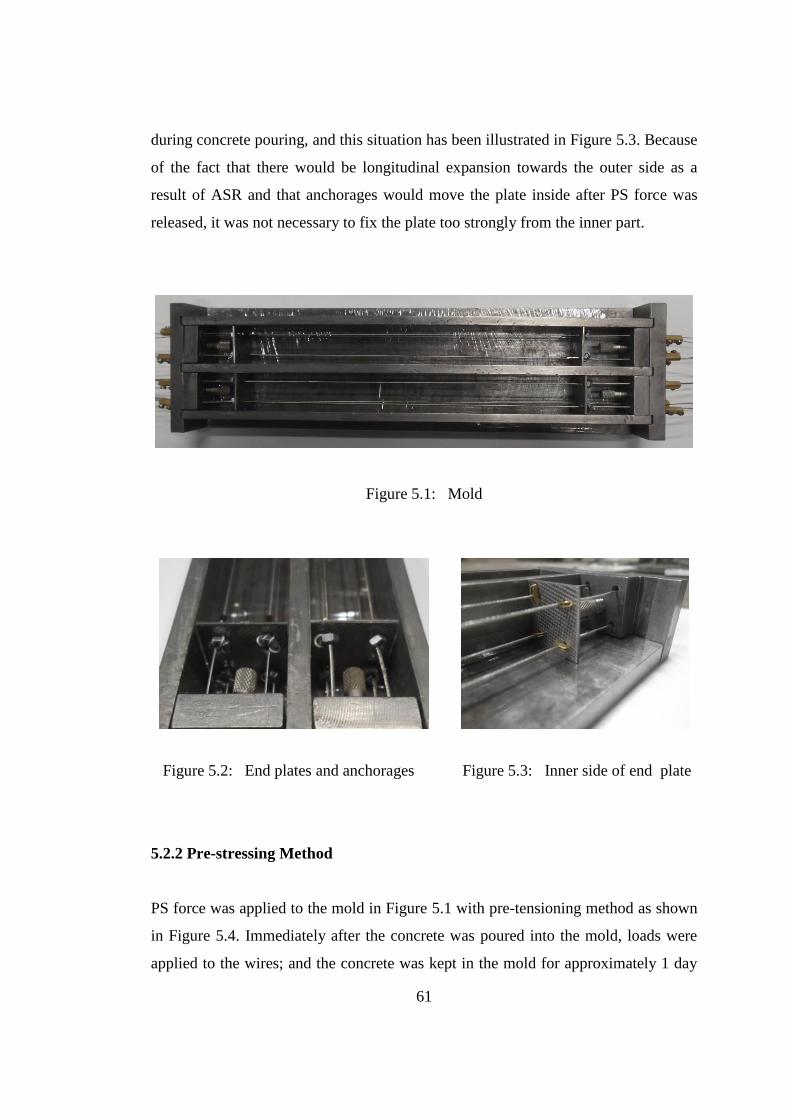
61
during concrete pouring, and this situation has been illustrated in Figure 5.3. Because
of the fact that there would be longitudinal expansion towards the outer side as a
result of ASR and that anchorages would move the plate inside after PS force was
released, it was not necessary to fix the plate too strongly from the inner part.
Figure 5.1: Mold
Figure 5.2: End plates and anchorages Figure 5.3: Inner side of end plate
5.2.2 Pre-stressing Method
PS force was applied to the mold in Figure 5.1 with pre-tensioning method as shown
in Figure 5.4. Immediately after the concrete was poured into the mold, loads were
applied to the wires; and the concrete was kept in the mold for approximately 1 day
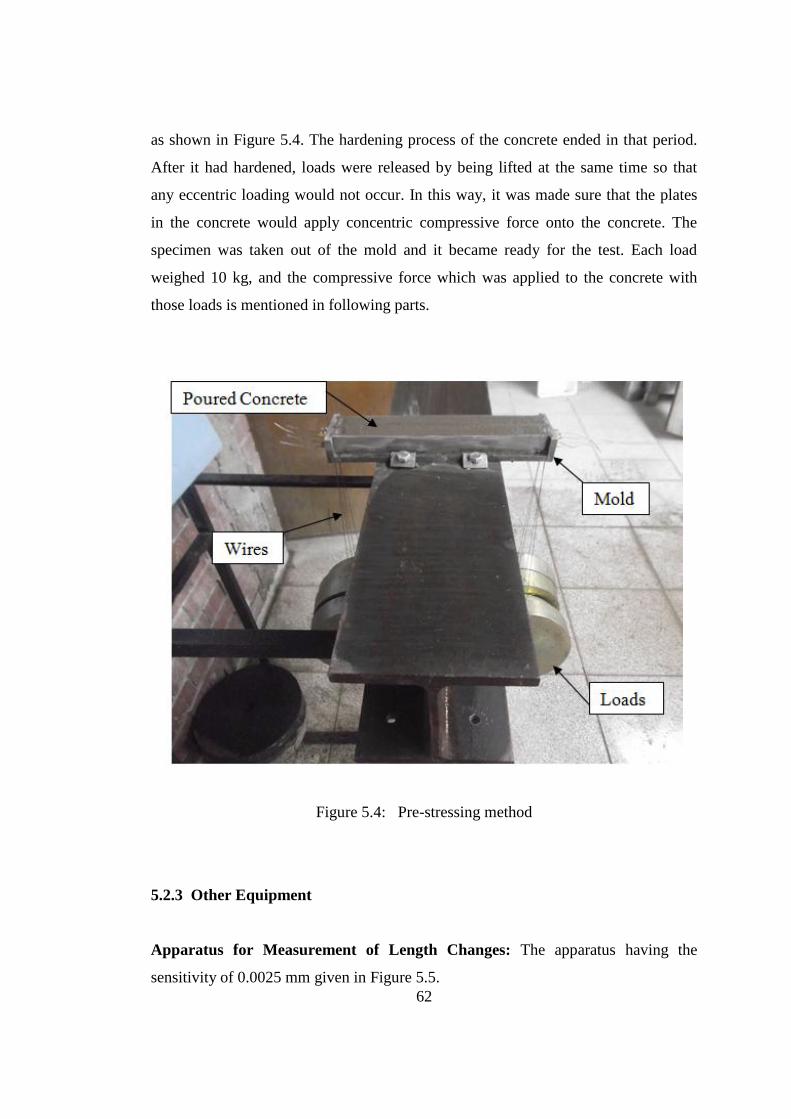
62
as shown in Figure 5.4. The hardening process of the concrete ended in that period.
After it had hardened, loads were released by being lifted at the same time so that
any eccentric loading would not occur. In this way, it was made sure that the plates
in the concrete would apply concentric compressive force onto the concrete. The
specimen was taken out of the mold and it became ready for the test. Each load
weighed 10 kg, and the compressive force which was applied to the concrete with
those loads is mentioned in following parts.
Figure 5.4: Pre-stressing method
5.2.3 Other Equipment
Apparatus for Measurement of Length Changes: The apparatus having the
sensitivity of 0.0025 mm given in Figure 5.5.
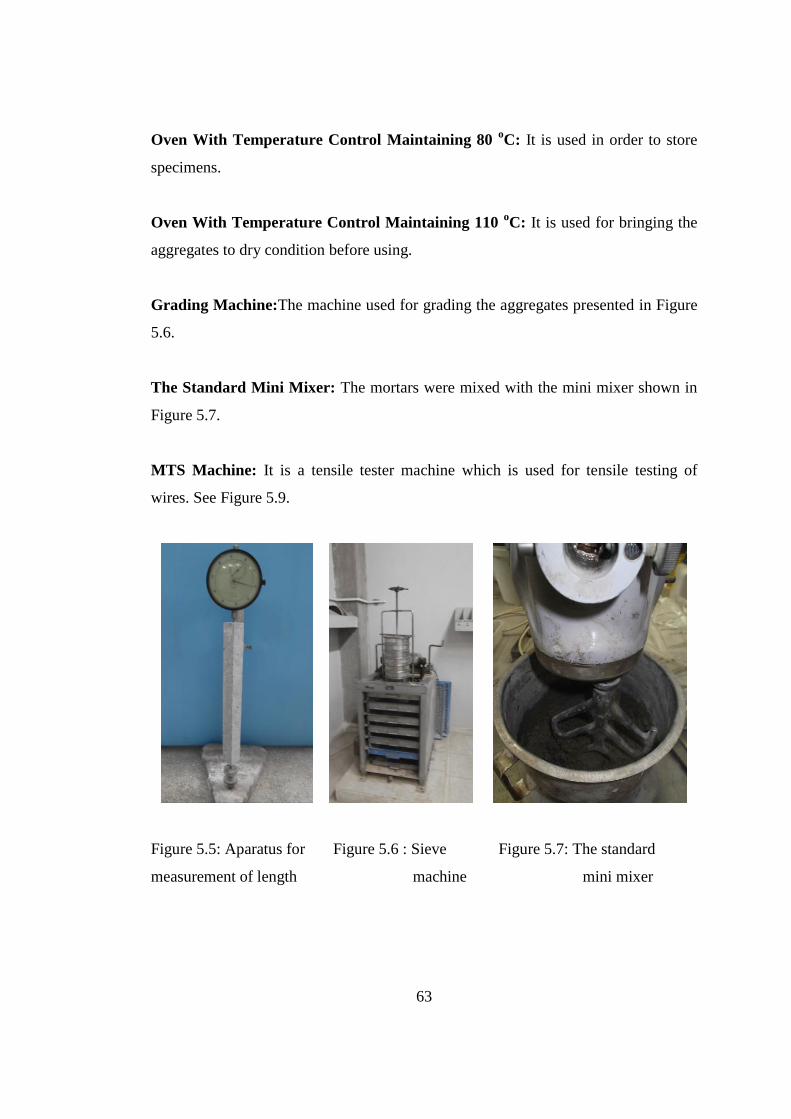
63
Oven With Temperature Control Maintaining 80 oC: It is used in order to store
specimens.
Oven With Temperature Control Maintaining 110 oC: It is used for bringing the
aggregates to dry condition before using.
Grading Machine:The machine used for grading the aggregates presented in Figure
5.6.
The Standard Mini Mixer: The mortars were mixed with the mini mixer shown in
Figure 5.7.
MTS Machine: It is a tensile tester machine which is used for tensile testing of
wires. See Figure 5.9.
Figure 5.5: Aparatus for Figure 5.6 : Sieve Figure 5.7: The standard
measurement of length machine mini mixer
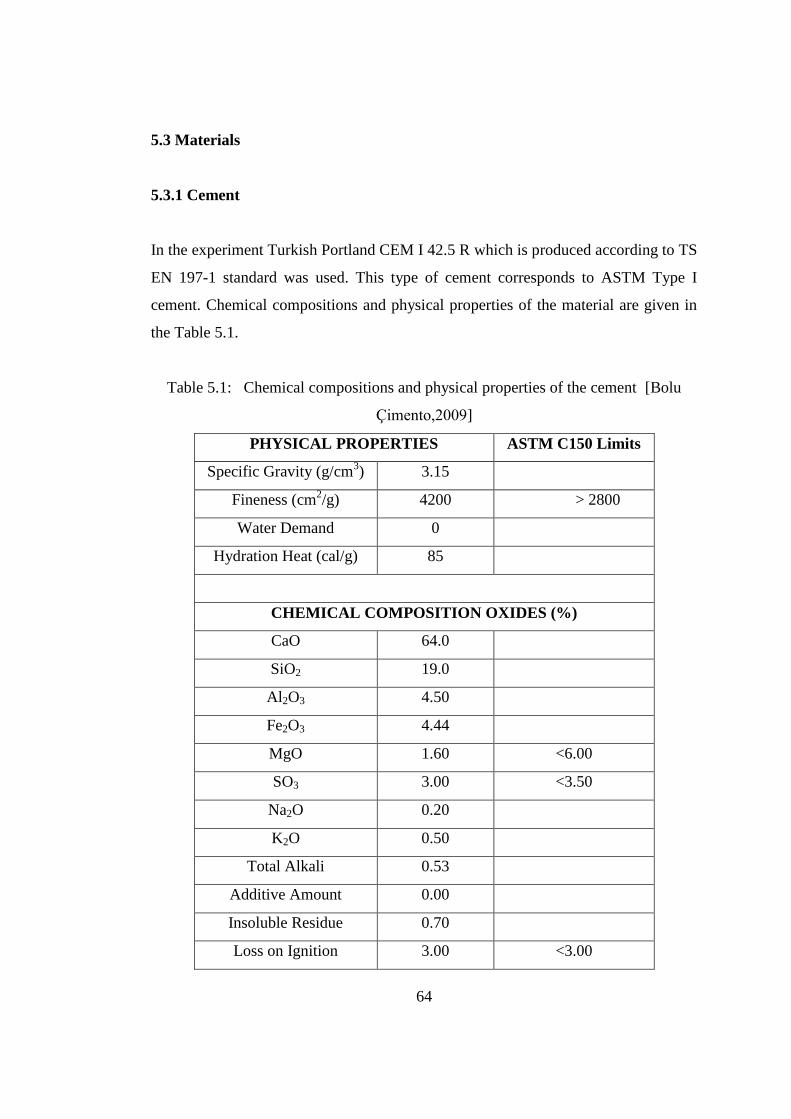
64
5.3 Materials
5.3.1 Cement
In the experiment Turkish Portland CEM I 42.5 R which is produced according to TS
EN 197-1 standard was used. This type of cement corresponds to ASTM Type I
cement. Chemical compositions and physical properties of the material are given in
the Table 5.1.
Table 5.1: Chemical compositions and physical properties of the cement [Bolu
Çimento,2009]
PHYSICAL PROPERTIES ASTM C150 Limits
Specific Gravity (g/cm3) 3.15
Fineness (cm2/g) 4200 > 2800
Water Demand 0
Hydration Heat (cal/g) 85
CHEMICAL COMPOSITION OXIDES (%)
CaO 64.0
SiO2 19.0
Al2O3 4.50
Fe2O3 4.44
MgO 1.60 <6.00
SO3 3.00 <3.50
Na2O 0.20
K2O 0.50
Total Alkali 0.53
Additive Amount 0.00
Insoluble Residue 0.70
Loss on Ignition 3.00 <3.00
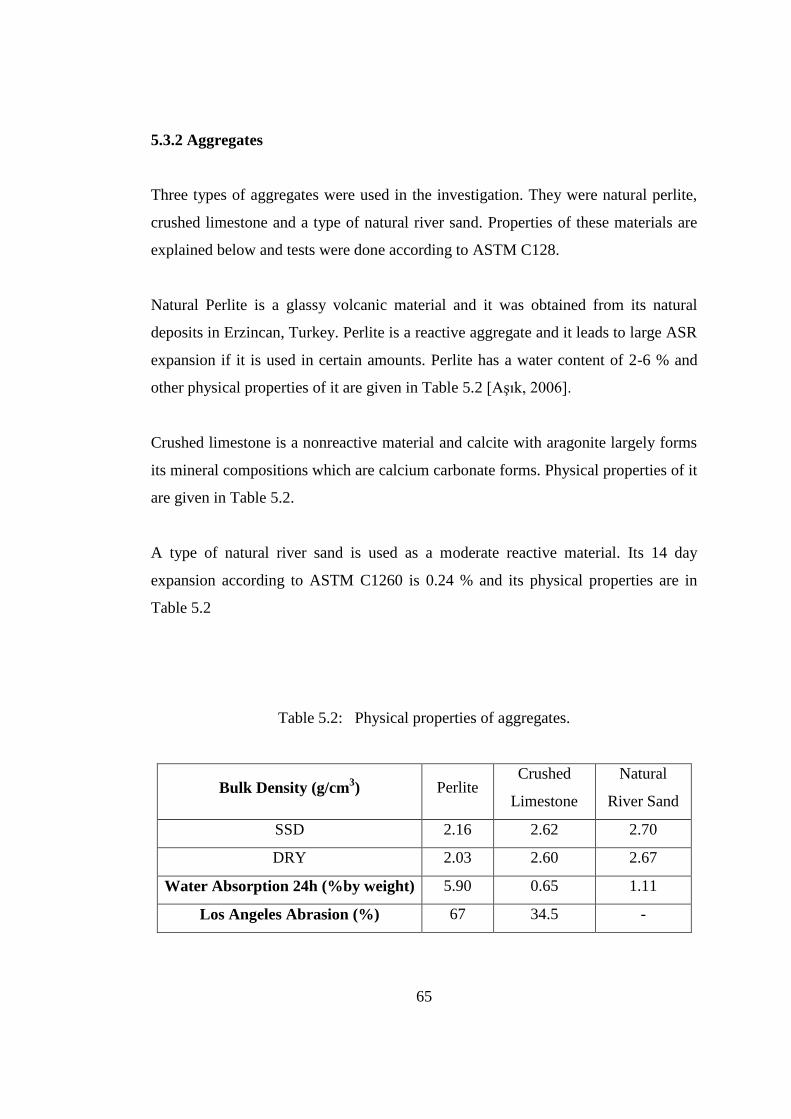
65
5.3.2 Aggregates
Three types of aggregates were used in the investigation. They were natural perlite,
crushed limestone and a type of natural river sand. Properties of these materials are
explained below and tests were done according to ASTM C128.
Natural Perlite is a glassy volcanic material and it was obtained from its natural
deposits in Erzincan, Turkey. Perlite is a reactive aggregate and it leads to large ASR
expansion if it is used in certain amounts. Perlite has a water content of 2-6 % and
other physical properties of it are given in Table 5.2 [Aşık, 2006].
Crushed limestone is a nonreactive material and calcite with aragonite largely forms
its mineral compositions which are calcium carbonate forms. Physical properties of it
are given in Table 5.2.
A type of natural river sand is used as a moderate reactive material. Its 14 day
expansion according to ASTM C1260 is 0.24 % and its physical properties are in
Table 5.2
Table 5.2: Physical properties of aggregates.
Bulk Density (g/cm3) Perlite
Crushed
Limestone
Natural
River Sand
SSD 2.16 2.62 2.70
DRY 2.03 2.60 2.67
Water Absorption 24h (%by weight) 5.90 0.65 1.11
Los Angeles Abrasion (%) 67 34.5 -
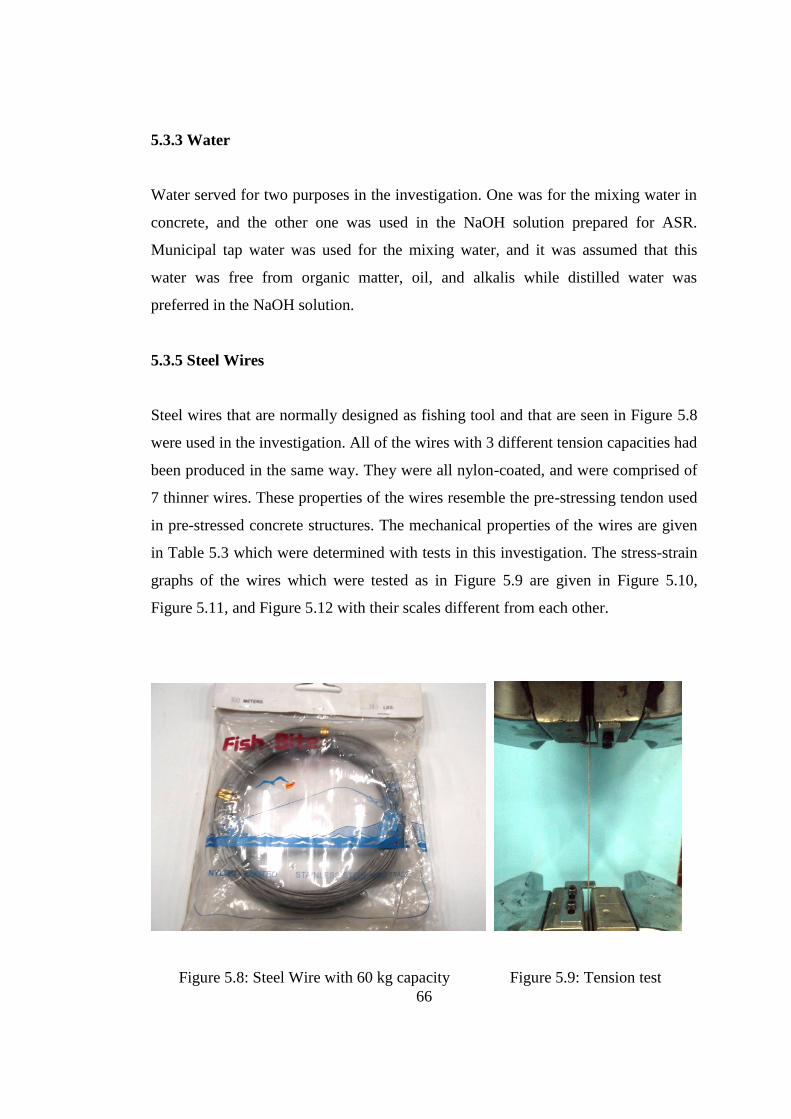
66
5.3.3 Water
Water served for two purposes in the investigation. One was for the mixing water in
concrete, and the other one was used in the NaOH solution prepared for ASR.
Municipal tap water was used for the mixing water, and it was assumed that this
water was free from organic matter, oil, and alkalis while distilled water was
preferred in the NaOH solution.
5.3.5 Steel Wires
Steel wires that are normally designed as fishing tool and that are seen in Figure 5.8
were used in the investigation. All of the wires with 3 different tension capacities had
been produced in the same way. They were all nylon-coated, and were comprised of
7 thinner wires. These properties of the wires resemble the pre-stressing tendon used
in pre-stressed concrete structures. The mechanical properties of the wires are given
in Table 5.3 which were determined with tests in this investigation. The stress-strain
graphs of the wires which were tested as in Figure 5.9 are given in Figure 5.10,
Figure 5.11, and Figure 5.12 with their scales different from each other.
Figure 5.8: Steel Wire with 60 kg capacity Figure 5.9: Tension test

67
Table 5.3: Mechanical properties of wires
As can be seen in Table 5.3, the elasticity modulies of the materials are quite small
relative to the steel. The reason is that materials were considered as unique while
their mechanic properties were being investigated. In other words, elasticity moduli
are the average value of both the nylon coat on the top of and 7 thin steels inside the
wires. The breaking and ultimate strengths of the materials were the same, so
necking was not observed. Although this property aided brittle materials, the strains
of the wires used in the investigation were large enough, and they behaved as ductile
materials in this respect. As also can be seen in stress-strain graphs, it is difficult to
determine the yield strength of the materials. Therefore, these properties of the
materials were found with 0.2 % offset method.
Name Diameter
D (mm)
Elasticity
Modulus Ew
(mm/mm)
Yield Strength
fy (MPa)
Ultimate Strength
fu (MPa)
Wire 60 KG 1.00 33888 285 630
Wire 40 KG 0.80 43921 224 470
Wire 20 KG 0.60 47753 255 351

68
Figure 5.10: Stress – Strain graph of Wire 60 KG.
Figure 5.11: Stress – Strain graph of Wire 40 KG.
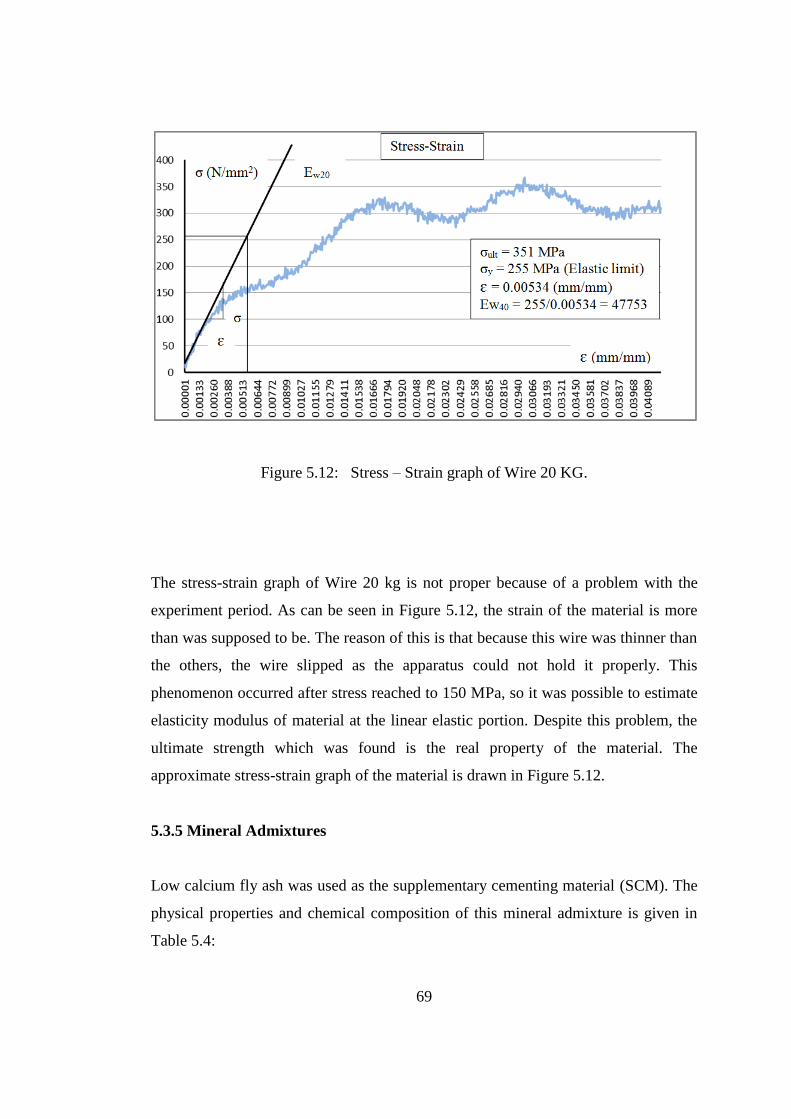
69
Figure 5.12: Stress – Strain graph of Wire 20 KG.
The stress-strain graph of Wire 20 kg is not proper because of a problem with the
experiment period. As can be seen in Figure 5.12, the strain of the material is more
than was supposed to be. The reason of this is that because this wire was thinner than
the others, the wire slipped as the apparatus could not hold it properly. This
phenomenon occurred after stress reached to 150 MPa, so it was possible to estimate
elasticity modulus of material at the linear elastic portion. Despite this problem, the
ultimate strength which was found is the real property of the material. The
approximate stress-strain graph of the material is drawn in Figure 5.12.
5.3.5 Mineral Admixtures
Low calcium fly ash was used as the supplementary cementing material (SCM). The
physical properties and chemical composition of this mineral admixture is given in
Table 5.4:
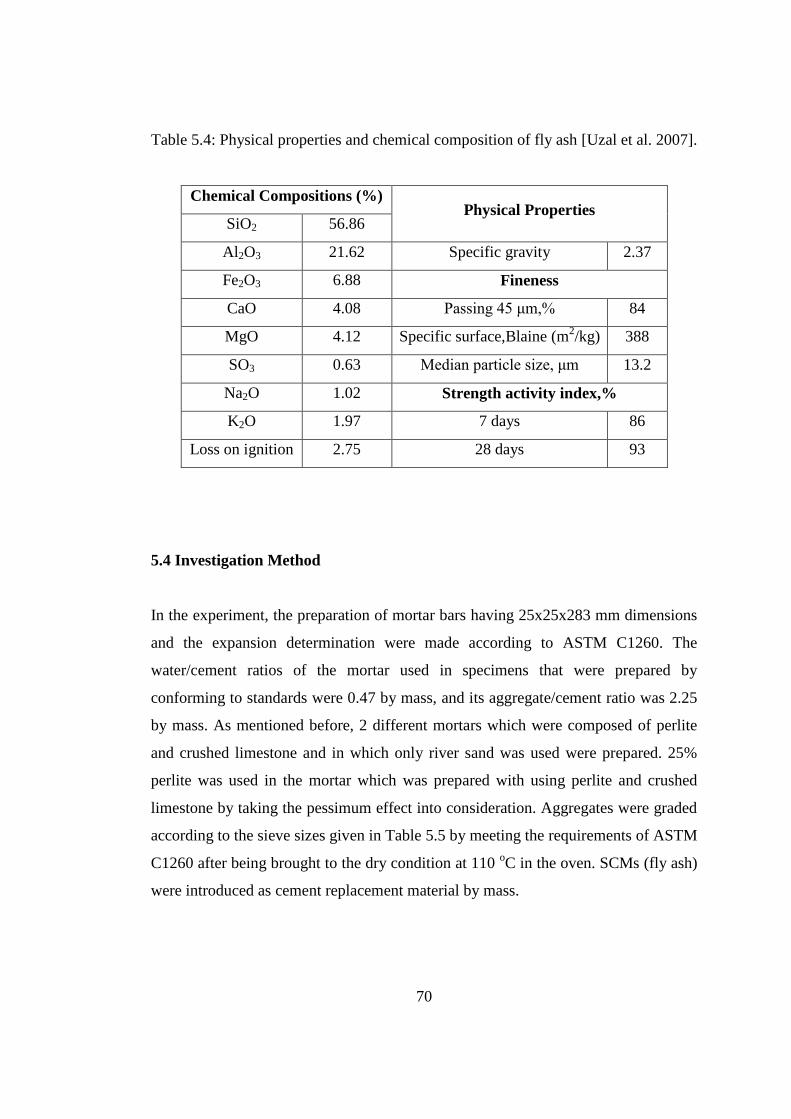
70
Table 5.4: Physical properties and chemical composition of fly ash [Uzal et al. 2007].
Chemical Compositions (%) Physical Properties
SiO2 56.86
Al2O3 21.62 Specific gravity 2.37
Fe2O3 6.88 Fineness
CaO 4.08 Passing 45 μm,% 84
MgO 4.12 Specific surface,Blaine (m2/kg) 388
SO3 0.63 Median particle size, μm 13.2
Na2O 1.02 Strength activity index,%
K2O 1.97 7 days 86
Loss on ignition 2.75 28 days 93
5.4 Investigation Method
In the experiment, the preparation of mortar bars having 25x25x283 mm dimensions
and the expansion determination were made according to ASTM C1260. The
water/cement ratios of the mortar used in specimens that were prepared by
conforming to standards were 0.47 by mass, and its aggregate/cement ratio was 2.25
by mass. As mentioned before, 2 different mortars which were composed of perlite
and crushed limestone and in which only river sand was used were prepared. 25%
perlite was used in the mortar which was prepared with using perlite and crushed
limestone by taking the pessimum effect into consideration. Aggregates were graded
according to the sieve sizes given in Table 5.5 by meeting the requirements of ASTM
C1260 after being brought to the dry condition at 110 oC in the oven. SCMs (fly ash)
were introduced as cement replacement material by mass.
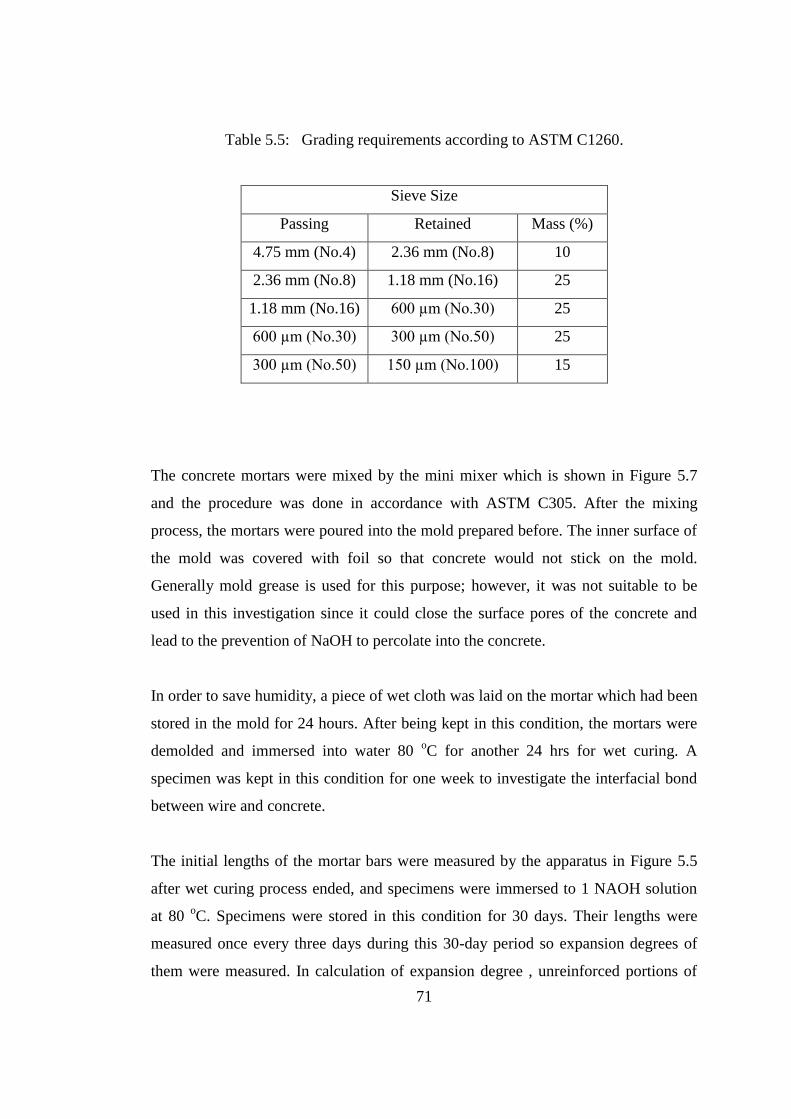
71
Table 5.5: Grading requirements according to ASTM C1260.
Sieve Size
Passing Retained Mass (%)
4.75 mm (No.4) 2.36 mm (No.8) 10
2.36 mm (No.8) 1.18 mm (No.16) 25
1.18 mm (No.16) 600 µm (No.30) 25
600 µm (No.30) 300 µm (No.50) 25
300 µm (No.50) 150 µm (No.100) 15
The concrete mortars were mixed by the mini mixer which is shown in Figure 5.7
and the procedure was done in accordance with ASTM C305. After the mixing
process, the mortars were poured into the mold prepared before. The inner surface of
the mold was covered with foil so that concrete would not stick on the mold.
Generally mold grease is used for this purpose; however, it was not suitable to be
used in this investigation since it could close the surface pores of the concrete and
lead to the prevention of NaOH to percolate into the concrete.
In order to save humidity, a piece of wet cloth was laid on the mortar which had been
stored in the mold for 24 hours. After being kept in this condition, the mortars were
demolded and immersed into water 80 oC for another 24 hrs for wet curing. A
specimen was kept in this condition for one week to investigate the interfacial bond
between wire and concrete.
The initial lengths of the mortar bars were measured by the apparatus in Figure 5.5
after wet curing process ended, and specimens were immersed to 1 NAOH solution
at 80 oC. Specimens were stored in this condition for 30 days. Their lengths were
measured once every three days during this 30-day period so expansion degrees of
them were measured. In calculation of expansion degree , unreinforced portions of
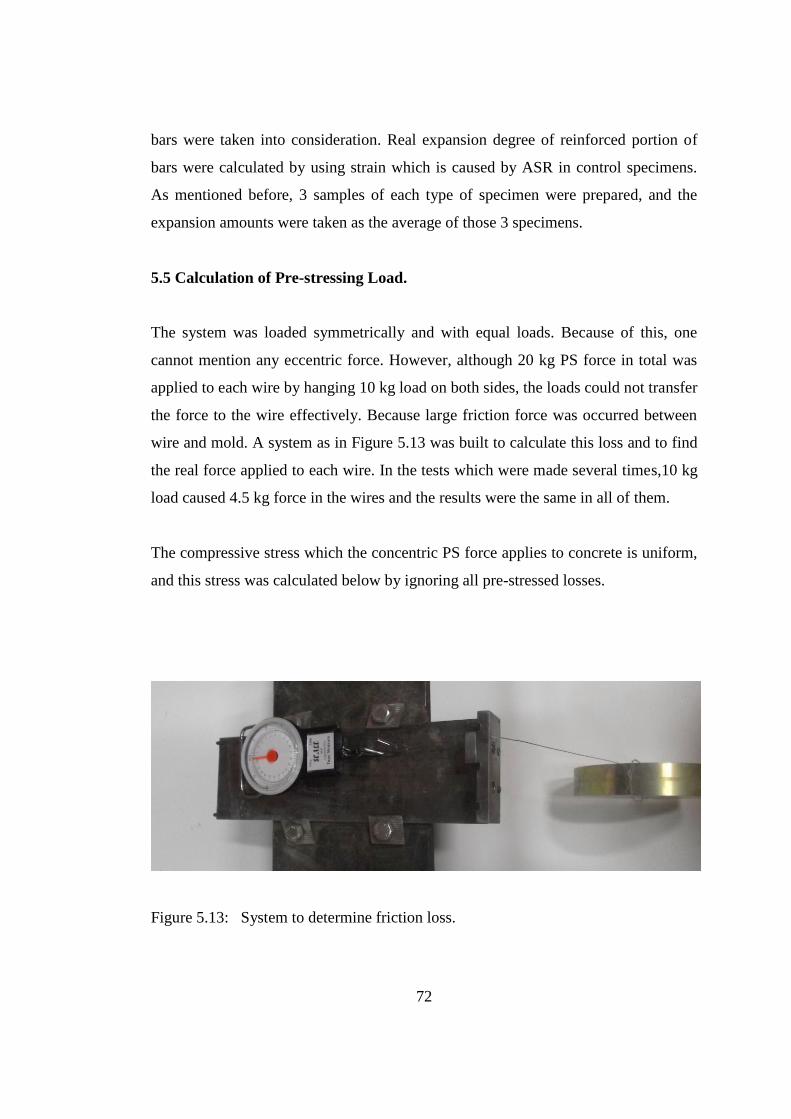
72
bars were taken into consideration. Real expansion degree of reinforced portion of
bars were calculated by using strain which is caused by ASR in control specimens.
As mentioned before, 3 samples of each type of specimen were prepared, and the
expansion amounts were taken as the average of those 3 specimens.
5.5 Calculation of Pre-stressing Load.
The system was loaded symmetrically and with equal loads. Because of this, one
cannot mention any eccentric force. However, although 20 kg PS force in total was
applied to each wire by hanging 10 kg load on both sides, the loads could not transfer
the force to the wire effectively. Because large friction force was occurred between
wire and mold. A system as in Figure 5.13 was built to calculate this loss and to find
the real force applied to each wire. In the tests which were made several times,10 kg
load caused 4.5 kg force in the wires and the results were the same in all of them.
The compressive stress which the concentric PS force applies to concrete is uniform,
and this stress was calculated below by ignoring all pre-stressed losses.
Figure 5.13: System to determine friction loss.
73
σc = P/Ac
Ac = b x h
where,
σc: Uniform compressive stress on concrete
P: Applied total force
Ac: Cross sectional area of concrete
b: width of concrete
h: depth of concrete
P = 4.5 x 8 x 9.81 = 353.16 N
Ac = 25 x 25 = 625 mm2
σc = 353.16/625 = 0.565 MPa
Pre-stressing losses: As is known, initial and time dependent losses occur in pre-
stressed concrete. This topic has been explained in details in the section Theory of
Pre-stressed Concrete.
Initial losses are elastic shortening (ES), anchorage loss (AL), and friction loss (FL).
As ES occurs in pre-tensioning systems, it is calculated below. Both AL and FL
occur in post-tensioning members.
Time-dependent losses are steel relaxation loss (SR), creep loss (CL), and shrinkage
loss (SL). Even though all time dependent losses occur in both pre-tensioned and
post-tensioned members, there was only SR in this investigation. The investigation
did not last as long as the members would be exposed to CL. SL was already out of
question as the concrete members were immersed into water.
When calculating ES loss, the elastic modulus at one day after concrete was poured
was used because PS force was applied at that time.
Ultimate strength of Wire 40 KG : fu40 = 470 MPa
Yield strength of Wire 40 KG : fy40 = 224 MPa
74
Elasticty modulus of Wire 40 KG: Ew40 = 43921
Ultimate strength of Wire 60 KG : fu60 = 630 MPa
Yield strength of Wire 60 KG : fy60 = 285 MPa
Elasticty modulus of Wire 60 KG: Ew60 = 33888
1 day strength of concrete: fc1 = 12 MPa
Elasticity modulus of 1 day concrete: Ec1 = 4700 (fc1)0.5
= 4700 (12)0.5
= 16281
ES Loss:
σES = n x P/Ac
n = Es/Ec
σES = (43921/16281) x 353.16/625 = 1.52 MPa (Negligible)
SR Loss:
fp = Pw/As
σSR = fp x [(log t )/10] x [(fp/fy)-0.55]
where,
Pw: Applied force in each wire
As: Area of each steel
σSR: SR loss in each wire
fp: Applied stress in each wire
fy: Yield strength of wire
t : Time with hours
Applied stress at Wire 40 KG:
Pw = 4.5 x 2 x 9.81 = 88.29 N
As40 = 0.8 mm2
fp40 = 88.29/0.8 = 110.36 MPa
Applied stress at Wire 60 KG:
Pw = 4.5 x 2 x 9.81 = 88.29 N
As60 = 1.0 mm2
75
fp60 = 88.29/1.0 = 88.29 MPa
SR Loss at Wire 40 KG and at Wire 60 KG were both negligible, because fp/fy in
both wires was smaller than 0.55.
Consequently, there were only SR loss and ES loss in this system; and neither of
them was taken into consideration while calculating the compressive force on
concrete as they were negligible.
5.6 The ACI 318-02 Code Limits
There are some ACI 318-02 Code Limits that restrict the force application to
reinforcements depending on material properties. These limits are given below:
fp ≤ 0.94 fy
fp ≤ 0.80 fu
fy40 = 224 MPa => 0.94 x 224 = 210.56 MPa
fu40 = 470 MPa => 0.80 x 470 = 376.00 MPa
fy60 = 285 MPa => 0.94 x 285 = 267.90 MPa
fu60 = 630 MPa => 0.80 x 630 = 504.00 MPa
fp40 = 110.36 OK
fp60 = 88.29 OK
σc < 0.60 fc1
fc1 = 12 MPa => 0.60 x 12 = 7.2 MPa
σc = 0.565 MPa < 7.2 MPa OK
76
CHAPTER VI
RESULTS AND DISCUSSION
6.1. General
In this study, the effect of reinforcements which have different capacities and
elasticity moduli on ASR expansion and whether PS force prevents ASR expansion
or not were investigated. The results were given in graphs in this part, and the
notations below were used in those graphs. As mentioned before, all the wires were
pre-stressed with only one type of load. Each wire had 20 kg force on it, but only 9
kg of this load created stress on the wire as mentioned in previous chapter.
Specimens In Which Perlite And Crushed Limestone Were Used
UNR: Unreinforced control specimen
20 KG: Specimen reinforced with Wire 20 KG
40 KG: Specimen reinforced with Wire 40 KG
40 KG (7 DAY): Specimen reinforced with Wire 40 KG and 7-day curing applied.
60 KG: Specimen reinforced with Wire 60 KG
P 40 KG: Specimen reinforced with Wire 40 KG and pre-stressing force was
applied.
P 60 KG: Specimen reinforced with Wire 60 KG and pre-stressing force was
applied.
Specimens In Which Natural River Sand Was Used
N-UNR: Unreinforced control specimen
N-P 60 KG: Specimen reinforced with Wire 60 KG and pre-stressing force was
applied.
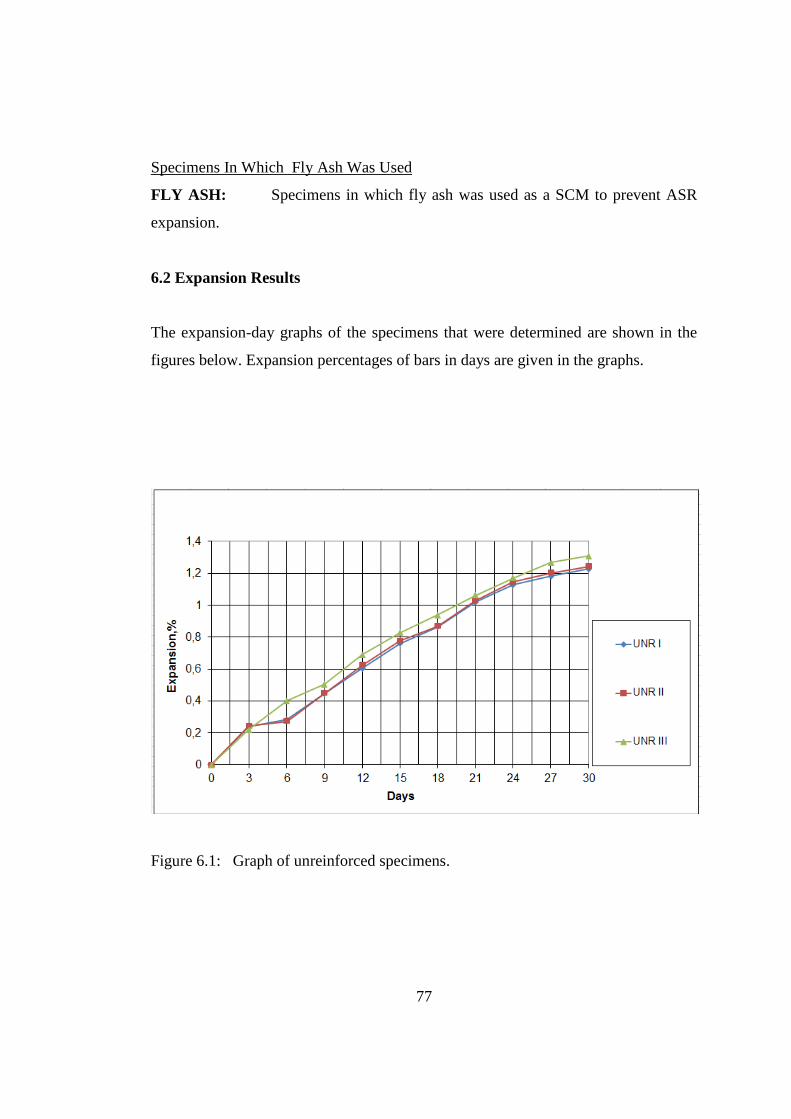
77
Specimens In Which Fly Ash Was Used
FLY ASH: Specimens in which fly ash was used as a SCM to prevent ASR
expansion.
6.2 Expansion Results
The expansion-day graphs of the specimens that were determined are shown in the
figures below. Expansion percentages of bars in days are given in the graphs.
Figure 6.1: Graph of unreinforced specimens.

78
Figure 6.2: Graph of specimens reinforced with Wire 20 KG.
Figure 6.3: Graph of specimens reinforced with Wire 40 KG.
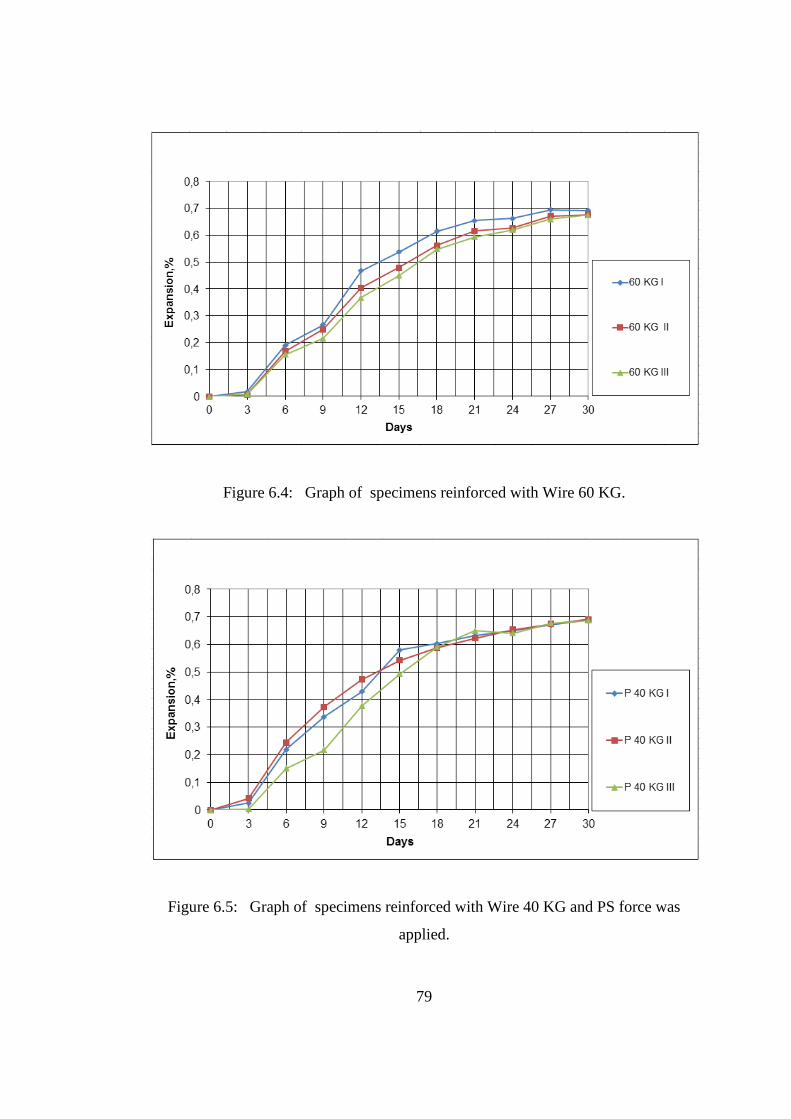
79
Figure 6.4: Graph of specimens reinforced with Wire 60 KG.
Figure 6.5: Graph of specimens reinforced with Wire 40 KG and PS force was
applied.
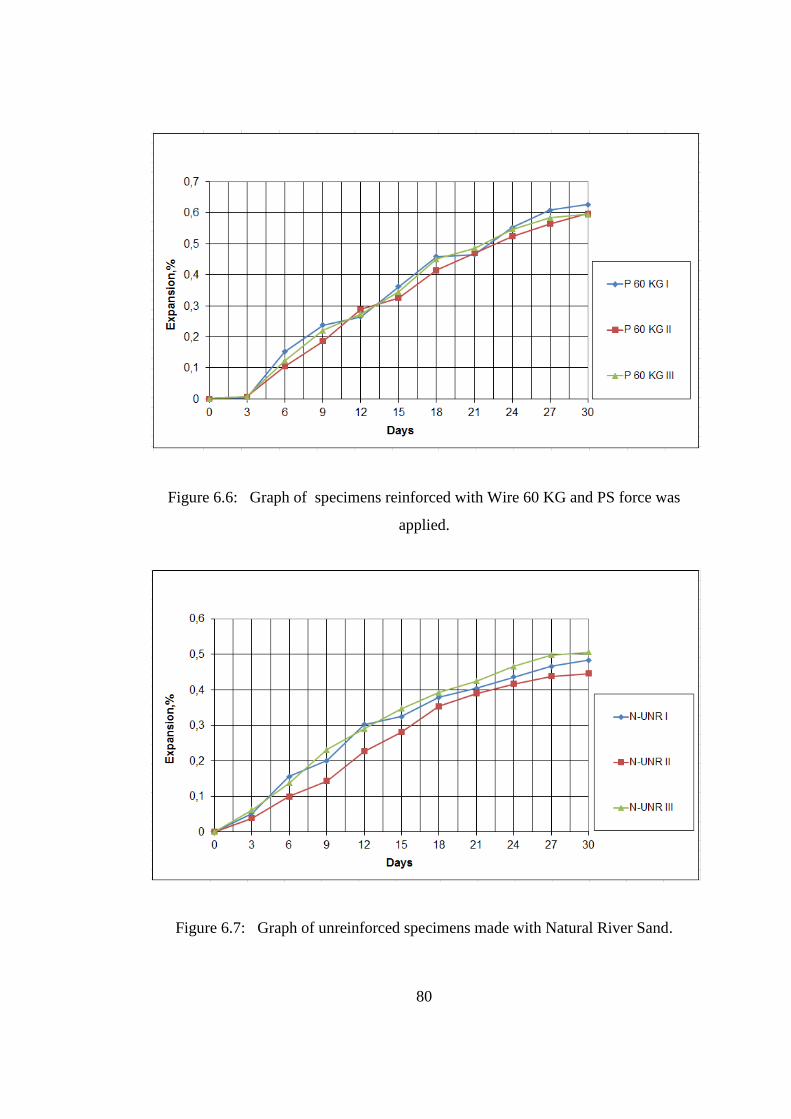
80
Figure 6.6: Graph of specimens reinforced with Wire 60 KG and PS force was
applied.
Figure 6.7: Graph of unreinforced specimens made with Natural River Sand.
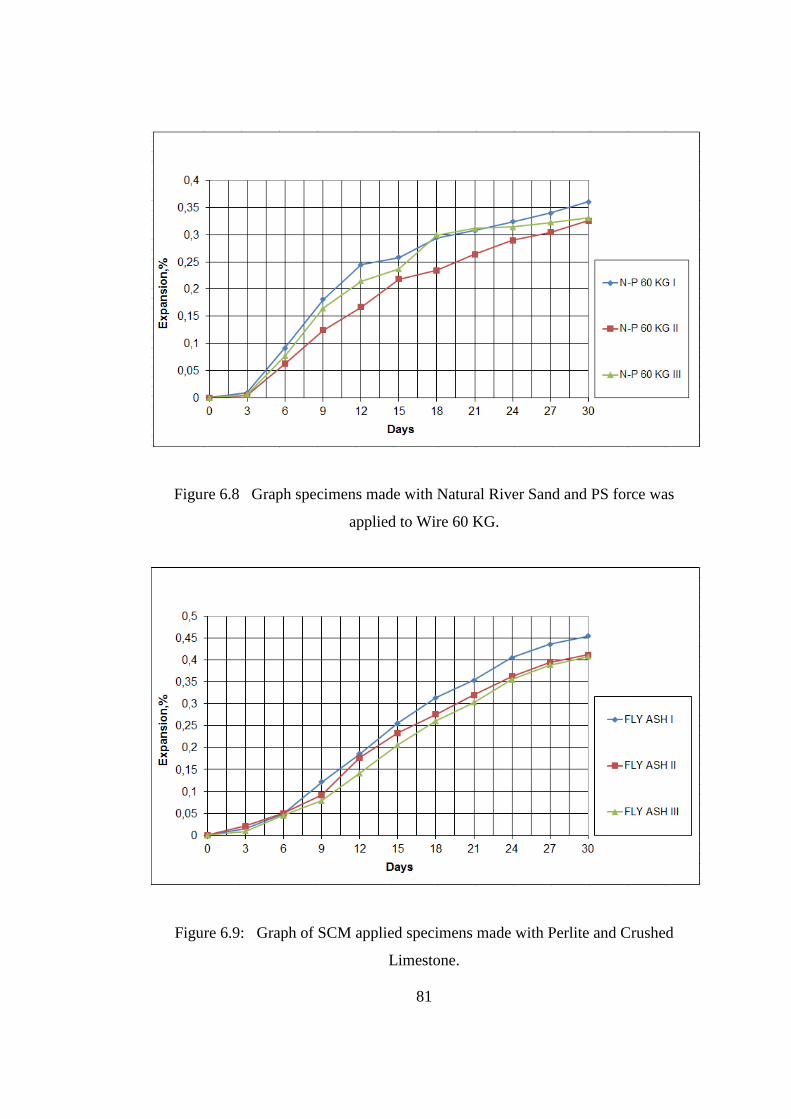
81
Figure 6.8 Graph specimens made with Natural River Sand and PS force was
applied to Wire 60 KG.
Figure 6.9: Graph of SCM applied specimens made with Perlite and Crushed
Limestone.
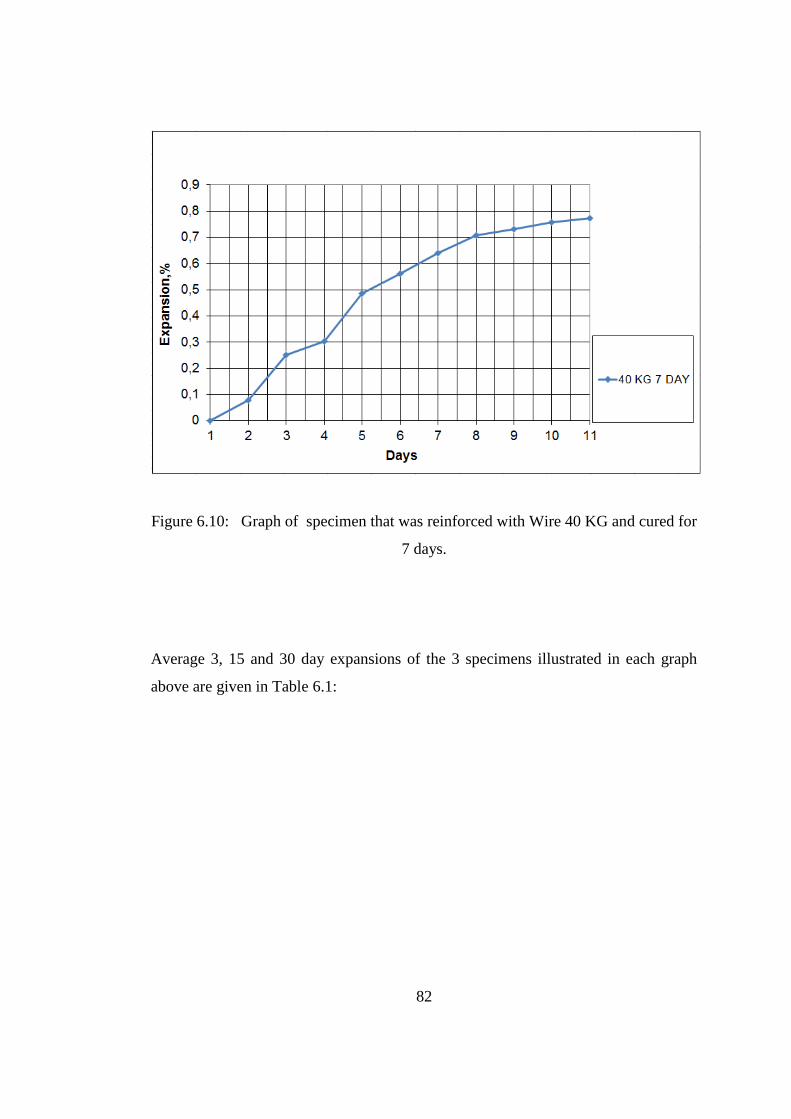
82
Figure 6.10: Graph of specimen that was reinforced with Wire 40 KG and cured for
7 days.
Average 3, 15 and 30 day expansions of the 3 specimens illustrated in each graph
above are given in Table 6.1:

83
Table 6.1: Average expansions of specimens.
Name 3 Day (%) 15 Day (%) 30 Day (%)
UNR 0.23 0.79 1.26
20 KG 0.09 0.61 0.93
40 KG 0.07 0.57 0.78
40 KG (7 DAY) 0.08 0.56 0.77
60 KG 0.01 0.50 0.68
P 40 KG 0.02 0.54 0.69
P 60 KG 0.005 0.34 0.61
N-UNR 0.05 0.32 0.48
N-P 60 KG 0.006 0.24 0.34
FLY ASH 0.02 0.23 0.43
6.3 Discussion of Results
6.3.1 Discussion of Expansions
In Figure 6.11, the expansion graph of the two bars that were made with perlite and
crushed limestone and were reinforced with 40 kg capacity wires are given. In order
to investigate whether there was an interfacial bond between wire and concrete, and
to determine the effect of this bond on the expansion, the curing period of a mortar
bar with the same properties was increased from 1 day to seven days. Appropriately
to ASTM C 1260, wet curing was applied at 80 oC. As can be understood from the
graph, the expansions of the two bars were the same, so there was no interfacial bond
between concrete and wire. The reason of the absence of the interfacial bond might
be the nylon coat on the wire.

84
Figure 6.11: Graph of specimens made with Wire 40 KG and cured for 7 days and
1 day.
The expansion-day graph of the bars that were made with the same materials (25 %
Perlite and 75 % Crushed Limestone), had different reinforcements, and on which PS
force was applied was given in Figure 6.12.
The same 0.565 MPa compressive stress was applied to all specimens as a PS force.
PS force had a large effect on the first days of expansion. It was observed at the end
of the first 3 days that the expansion was only 0.005 % in the specimen reinforced
with Wire 60 KG and on which PS force was applied, and it was 0.02 % in the
specimen reinforced with Wire 40 KG and which PS force was applied on. This
value was 0.23 % in the unreinforced one. The expansions of the reinforced
specimens on the first days were generally very little. Even the specimen that was
reinforced with the lowest reinforcement (Wire 20 KG) has 61 % less expansion than
the control specimen.

85
As can be deduced from the expansions at the end of 30 days, the expansion
decreases of each specimen reinforced with Wire 20 KG, Wire 40 KG, and Wire 60
KG were 26 %, 38 %, and 46 % respectively. This shows that expansion in
specimens decreases as reinforcement increases. However, this decrease amount gets
smaller. A similar result was obtained in the expansion amounts at the end of 15
days.
As expected, the highest expansion decrease was observed in the specimen prepared
by using 60 kg capacity wire and on which PS force was applied. The expansion
amount in the specimen was decreased from 1.26 % to 0.61 % by applying only
0.565 MPa compressive force. In comparison with unreinforced cement, 52 % less
expansion was achieved. This value was 57 % in 15 day expansion. When the fact
that 1-day compressive stress of concrete was 12 MPa is taken into consideration,
much more compressive force than 0.565 MPa can be applied and higher expansion
decrease can be achieved.
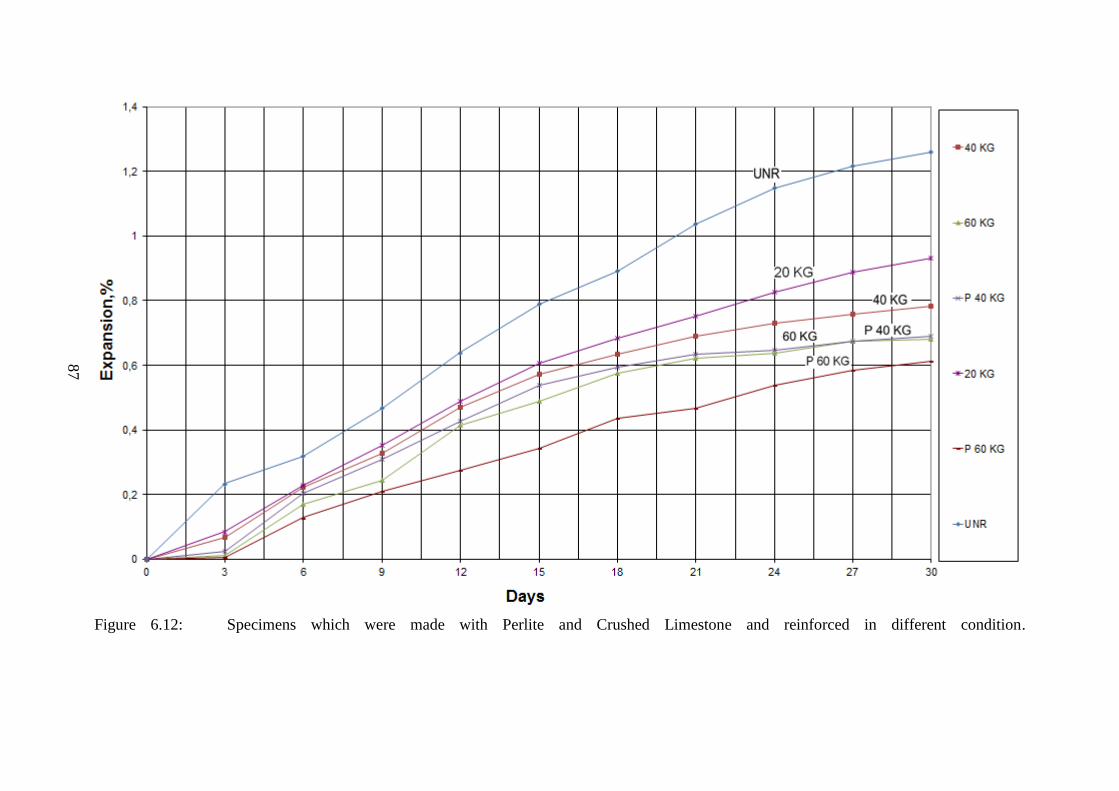
86
Figure 6.12: Specimens which were made with Perlite and Crushed Limestone and reinforced in different condition.
87
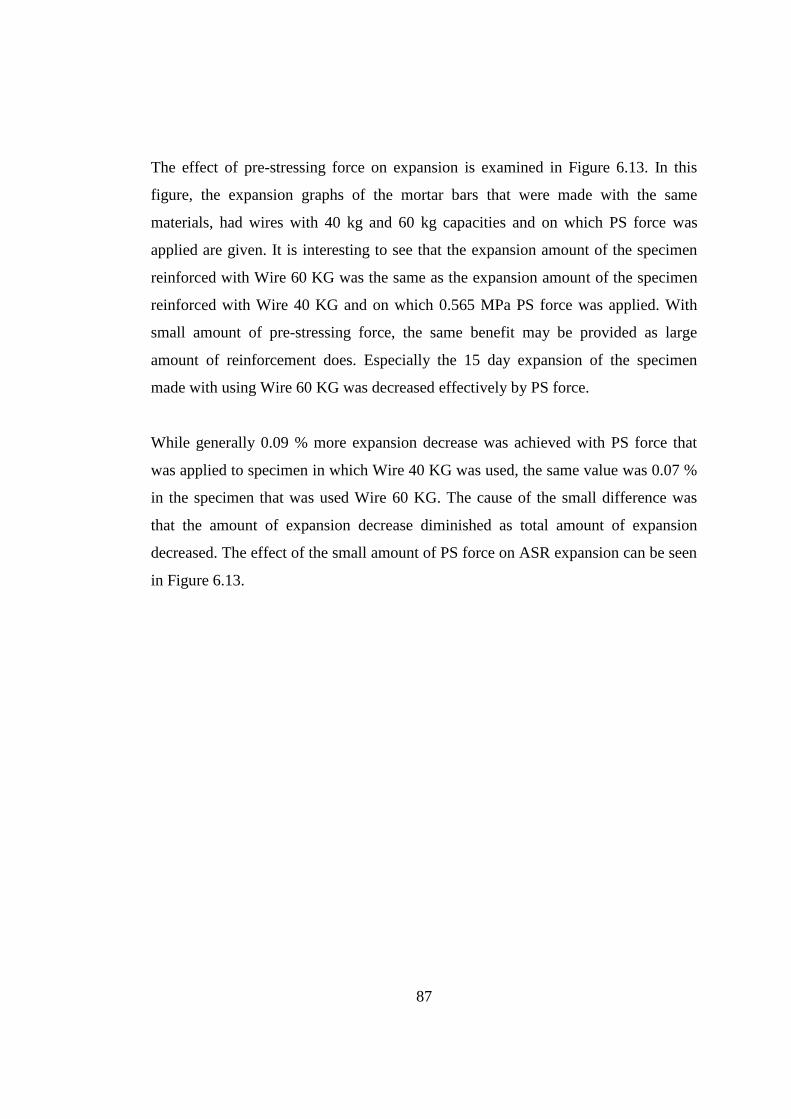
87
87
The effect of pre-stressing force on expansion is examined in Figure 6.13. In this
figure, the expansion graphs of the mortar bars that were made with the same
materials, had wires with 40 kg and 60 kg capacities and on which PS force was
applied are given. It is interesting to see that the expansion amount of the specimen
reinforced with Wire 60 KG was the same as the expansion amount of the specimen
reinforced with Wire 40 KG and on which 0.565 MPa PS force was applied. With
small amount of pre-stressing force, the same benefit may be provided as large
amount of reinforcement does. Especially the 15 day expansion of the specimen
made with using Wire 60 KG was decreased effectively by PS force.
While generally 0.09 % more expansion decrease was achieved with PS force that
was applied to specimen in which Wire 40 KG was used, the same value was 0.07 %
in the specimen that was used Wire 60 KG. The cause of the small difference was
that the amount of expansion decrease diminished as total amount of expansion
decreased. The effect of the small amount of PS force on ASR expansion can be seen
in Figure 6.13.
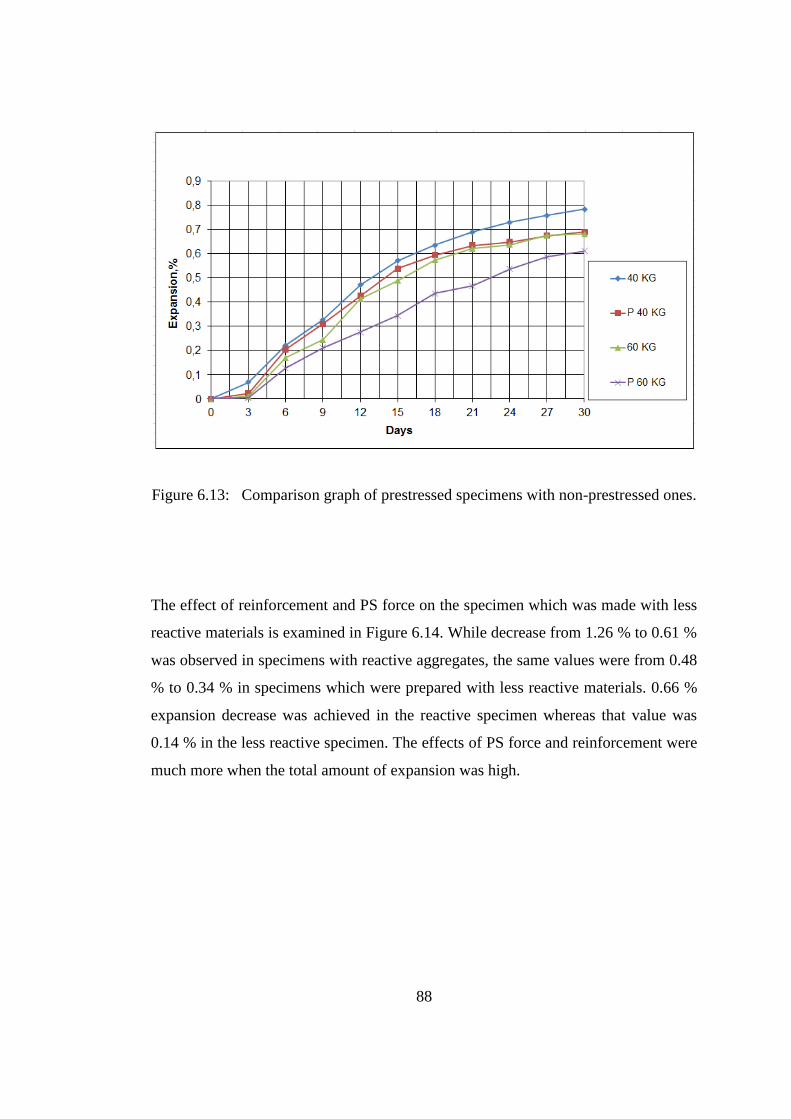
88
88
Figure 6.13: Comparison graph of prestressed specimens with non-prestressed ones.
The effect of reinforcement and PS force on the specimen which was made with less
reactive materials is examined in Figure 6.14. While decrease from 1.26 % to 0.61 %
was observed in specimens with reactive aggregates, the same values were from 0.48
% to 0.34 % in specimens which were prepared with less reactive materials. 0.66 %
expansion decrease was achieved in the reactive specimen whereas that value was
0.14 % in the less reactive specimen. The effects of PS force and reinforcement were
much more when the total amount of expansion was high.
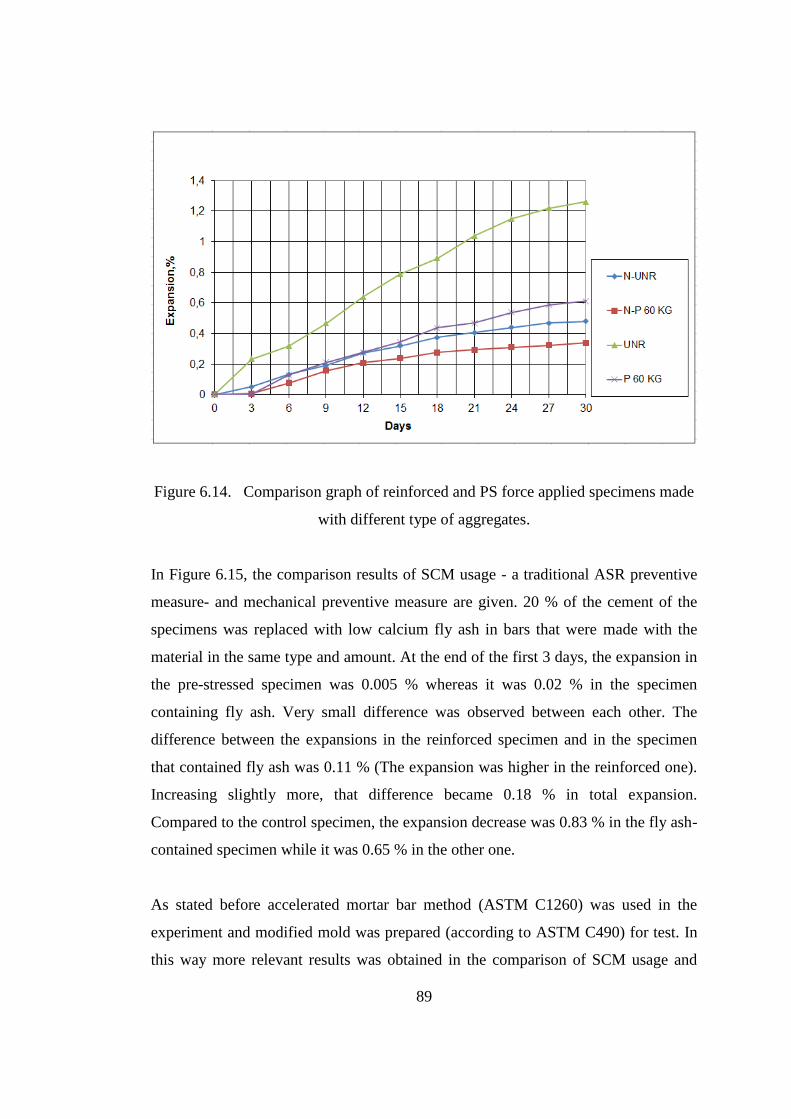
89
89
Figure 6.14. Comparison graph of reinforced and PS force applied specimens made
with different type of aggregates.
In Figure 6.15, the comparison results of SCM usage - a traditional ASR preventive
measure- and mechanical preventive measure are given. 20 % of the cement of the
specimens was replaced with low calcium fly ash in bars that were made with the
material in the same type and amount. At the end of the first 3 days, the expansion in
the pre-stressed specimen was 0.005 % whereas it was 0.02 % in the specimen
containing fly ash. Very small difference was observed between each other. The
difference between the expansions in the reinforced specimen and in the specimen
that contained fly ash was 0.11 % (The expansion was higher in the reinforced one).
Increasing slightly more, that difference became 0.18 % in total expansion.
Compared to the control specimen, the expansion decrease was 0.83 % in the fly ash-
contained specimen while it was 0.65 % in the other one.
As stated before accelerated mortar bar method (ASTM C1260) was used in the
experiment and modified mold was prepared (according to ASTM C490) for test. In
this way more relevant results was obtained in the comparison of SCM usage and
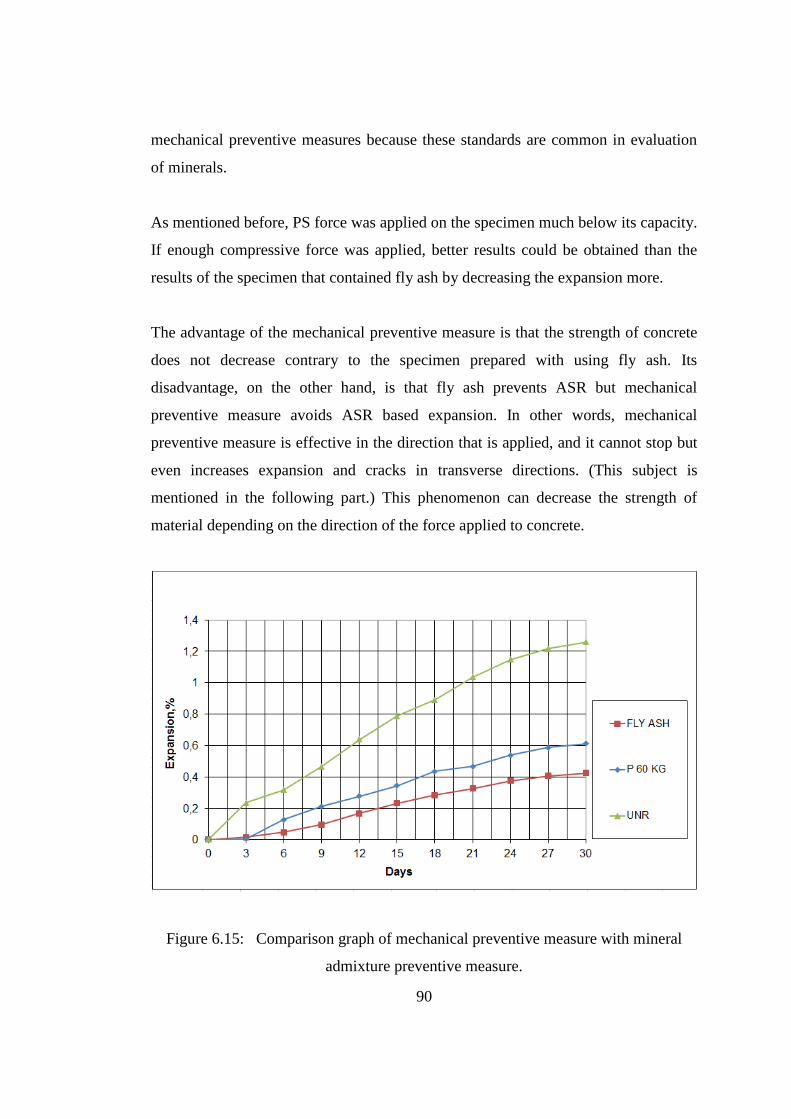
90
90
mechanical preventive measures because these standards are common in evaluation
of minerals.
As mentioned before, PS force was applied on the specimen much below its capacity.
If enough compressive force was applied, better results could be obtained than the
results of the specimen that contained fly ash by decreasing the expansion more.
The advantage of the mechanical preventive measure is that the strength of concrete
does not decrease contrary to the specimen prepared with using fly ash. Its
disadvantage, on the other hand, is that fly ash prevents ASR but mechanical
preventive measure avoids ASR based expansion. In other words, mechanical
preventive measure is effective in the direction that is applied, and it cannot stop but
even increases expansion and cracks in transverse directions. (This subject is
mentioned in the following part.) This phenomenon can decrease the strength of
material depending on the direction of the force applied to concrete.
Figure 6.15: Comparison graph of mechanical preventive measure with mineral
admixture preventive measure.
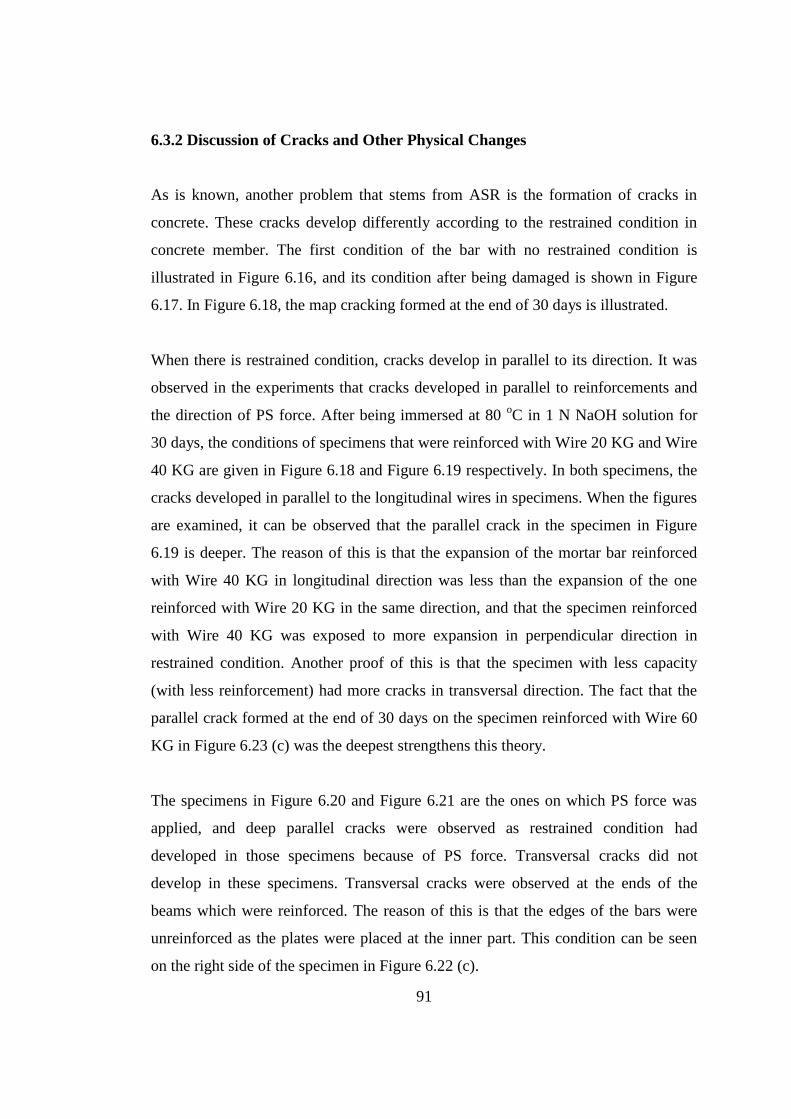
91
91
6.3.2 Discussion of Cracks and Other Physical Changes
As is known, another problem that stems from ASR is the formation of cracks in
concrete. These cracks develop differently according to the restrained condition in
concrete member. The first condition of the bar with no restrained condition is
illustrated in Figure 6.16, and its condition after being damaged is shown in Figure
6.17. In Figure 6.18, the map cracking formed at the end of 30 days is illustrated.
When there is restrained condition, cracks develop in parallel to its direction. It was
observed in the experiments that cracks developed in parallel to reinforcements and
the direction of PS force. After being immersed at 80 oC in 1 N NaOH solution for
30 days, the conditions of specimens that were reinforced with Wire 20 KG and Wire
40 KG are given in Figure 6.18 and Figure 6.19 respectively. In both specimens, the
cracks developed in parallel to the longitudinal wires in specimens. When the figures
are examined, it can be observed that the parallel crack in the specimen in Figure
6.19 is deeper. The reason of this is that the expansion of the mortar bar reinforced
with Wire 40 KG in longitudinal direction was less than the expansion of the one
reinforced with Wire 20 KG in the same direction, and that the specimen reinforced
with Wire 40 KG was exposed to more expansion in perpendicular direction in
restrained condition. Another proof of this is that the specimen with less capacity
(with less reinforcement) had more cracks in transversal direction. The fact that the
parallel crack formed at the end of 30 days on the specimen reinforced with Wire 60
KG in Figure 6.23 (c) was the deepest strengthens this theory.
The specimens in Figure 6.20 and Figure 6.21 are the ones on which PS force was
applied, and deep parallel cracks were observed as restrained condition had
developed in those specimens because of PS force. Transversal cracks did not
develop in these specimens. Transversal cracks were observed at the ends of the
beams which were reinforced. The reason of this is that the edges of the bars were
unreinforced as the plates were placed at the inner part. This condition can be seen
on the right side of the specimen in Figure 6.22 (c).

92
Figure 6.16: Photo of unreinforced specimen on the first day (UNR).
Figure 6.17: Photo of unreinforced specimen at the end of 30 days (UNR).
Figure 6.18: Photo of specimen at the end of 30 days which was reinforced with Wire 20 KG.
93

93
Figure 6.19: Photo of specimen at the end of 30 days which was reinforced with Wire 40 KG.
Figure 6.20: Photo of specimen at the end of 30 days which was reinforced with Wire 40 KG and PS force was applied.
Figure 6.21: Photo of specimen at the end of 30 days which was reinforced with Wire 60 KG and PS force was applied.
94
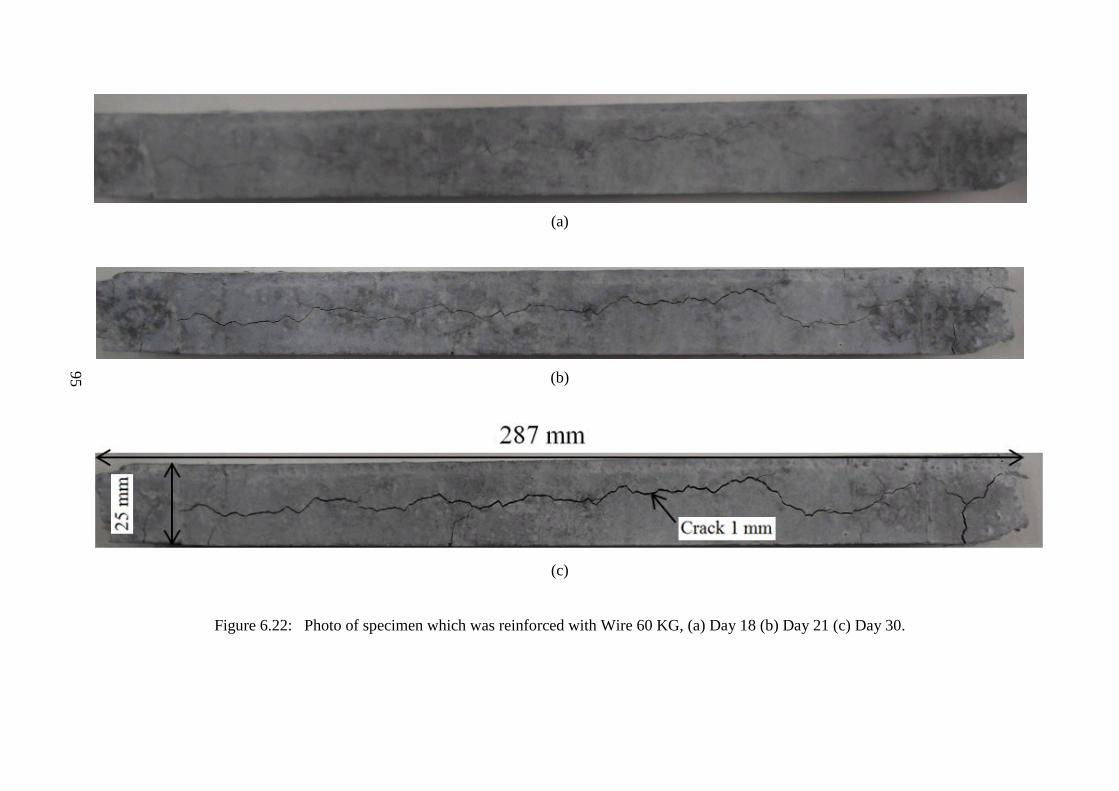
94
(a)
(b)
(c)
Figure 6.22: Photo of specimen which was reinforced with Wire 60 KG, (a) Day 18 (b) Day 21 (c) Day 30.
95
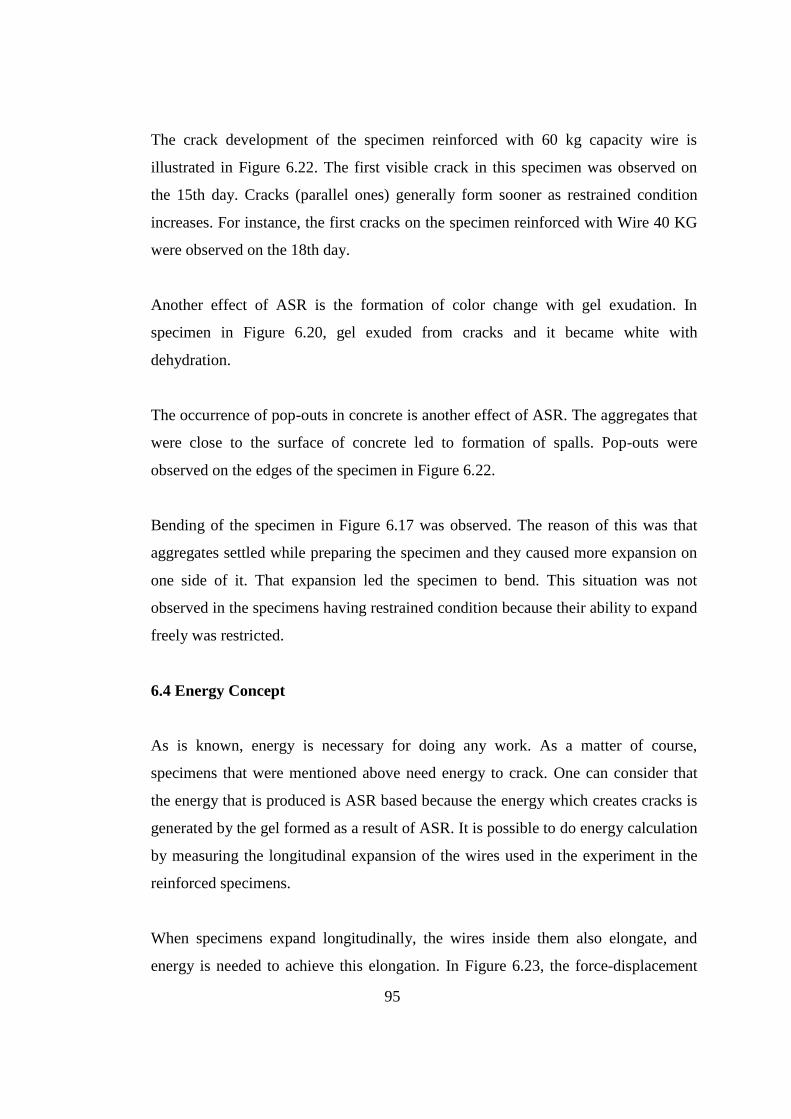
95
95
The crack development of the specimen reinforced with 60 kg capacity wire is
illustrated in Figure 6.22. The first visible crack in this specimen was observed on
the 15th day. Cracks (parallel ones) generally form sooner as restrained condition
increases. For instance, the first cracks on the specimen reinforced with Wire 40 KG
were observed on the 18th day.
Another effect of ASR is the formation of color change with gel exudation. In
specimen in Figure 6.20, gel exuded from cracks and it became white with
dehydration.
The occurrence of pop-outs in concrete is another effect of ASR. The aggregates that
were close to the surface of concrete led to formation of spalls. Pop-outs were
observed on the edges of the specimen in Figure 6.22.
Bending of the specimen in Figure 6.17 was observed. The reason of this was that
aggregates settled while preparing the specimen and they caused more expansion on
one side of it. That expansion led the specimen to bend. This situation was not
observed in the specimens having restrained condition because their ability to expand
freely was restricted.
6.4 Energy Concept
As is known, energy is necessary for doing any work. As a matter of course,
specimens that were mentioned above need energy to crack. One can consider that
the energy that is produced is ASR based because the energy which creates cracks is
generated by the gel formed as a result of ASR. It is possible to do energy calculation
by measuring the longitudinal expansion of the wires used in the experiment in the
reinforced specimens.
When specimens expand longitudinally, the wires inside them also elongate, and
energy is needed to achieve this elongation. In Figure 6.23, the force-displacement

96
96
graph of the wire with 60 kg capacity which was obtained with the test was given,
and the energy necessary for the elongation achieved at the end of 30 days, which
belongs the wire with 53 mm length used in the experiment, was calculated. The
same graph for the specimen with Wire 40 KG is given in Figure 6.24, and the wire
used in the experiment was 51 mm. Trapezoidal method was used in order to
calculate the area under force-displacement curve, and the calculation results are
given in Table 6.2 and Table 6.3. Energy calculations are shown below.
For specimen with Wire 60 KG;
D60 = l x D / 100 = 53 x 0.68152 / 100 = 0.36121 mm
F60 = 253.77 N
E60 = F x d = 42.78 mJ (area under curve)
ET
60 = (L / l) x E = (230/53) x 42.78 = 185.64 mJ
There are 4 wires in specimen, so total energy is: 4 x 185.65 = 742.60 mJ
For specimen with Wire 40 KG;
D40 = l x D / 100 = 51 x 0.68152 / 100 = 0.40 mm
F40 = 243.52 N
E40 = F x d = 54.00 mJ (area under curve)
ET
40 = (L / l) x E = (230/51) x 54.00 = 243.53 mJ
There are 4 wires in specimen, so total energy is: 4 x 243.53 = 974.12 mJ
l (mm): Length of wire which was tested
L (mm): Length of wire in specimen
D (%): Elongation of wire in specimen at the end of 30 days
d (mm): Corresponding elongation in wire which is tested
F (N): Force needed to elongate wire up to length d
E (mJ): Energy needed to elongate wire up to length d
ET (mJ): Energy needed to elongate wire in specimen
97
97
Figure 6.23: Force-displacement diagram of specimen with Wire 60 KG.
Figure 6.24: Force-displacement diagram of specimen with Wire 40 KG.
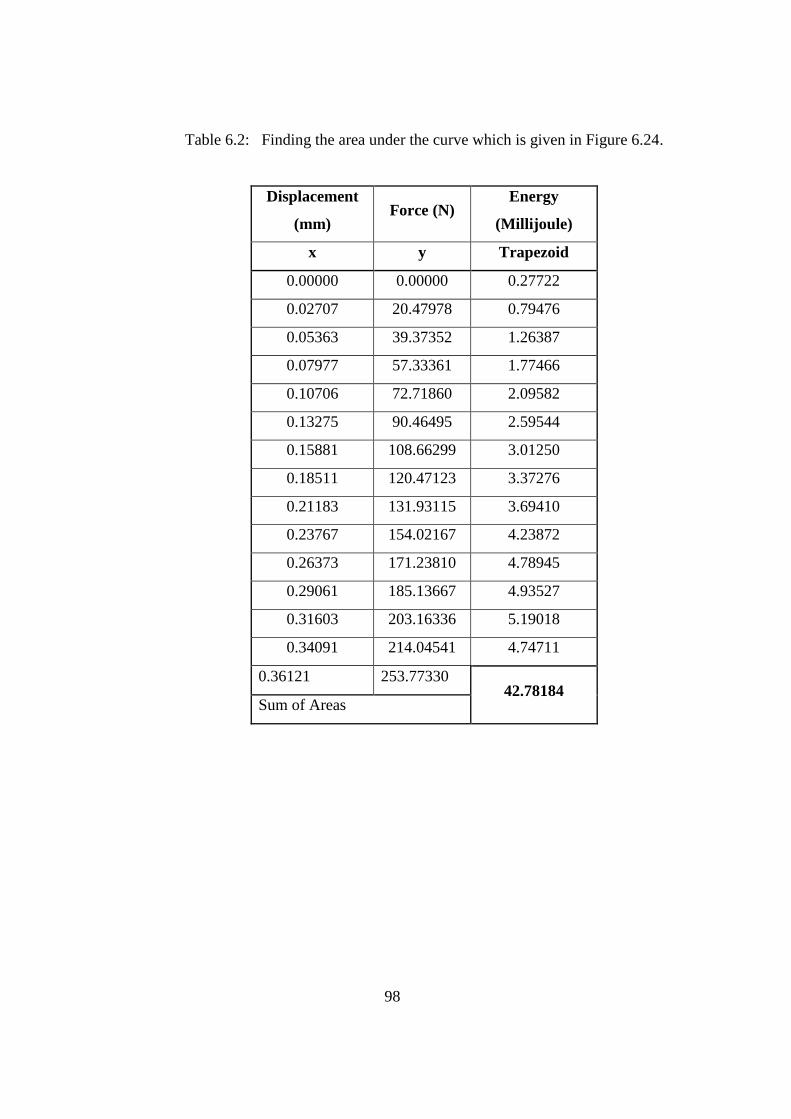
98
98
Table 6.2: Finding the area under the curve which is given in Figure 6.24.
Displacement
(mm) Force (N)
Energy
(Millijoule)
x y Trapezoid
0.00000 0.00000 0.27722
0.02707 20.47978 0.79476
0.05363 39.37352 1.26387
0.07977 57.33361 1.77466
0.10706 72.71860 2.09582
0.13275 90.46495 2.59544
0.15881 108.66299 3.01250
0.18511 120.47123 3.37276
0.21183 131.93115 3.69410
0.23767 154.02167 4.23872
0.26373 171.23810 4.78945
0.29061 185.13667 4.93527
0.31603 203.16336 5.19018
0.34091 214.04541 4.74711
0.36121 253.77330 42.78184
Sum of Areas
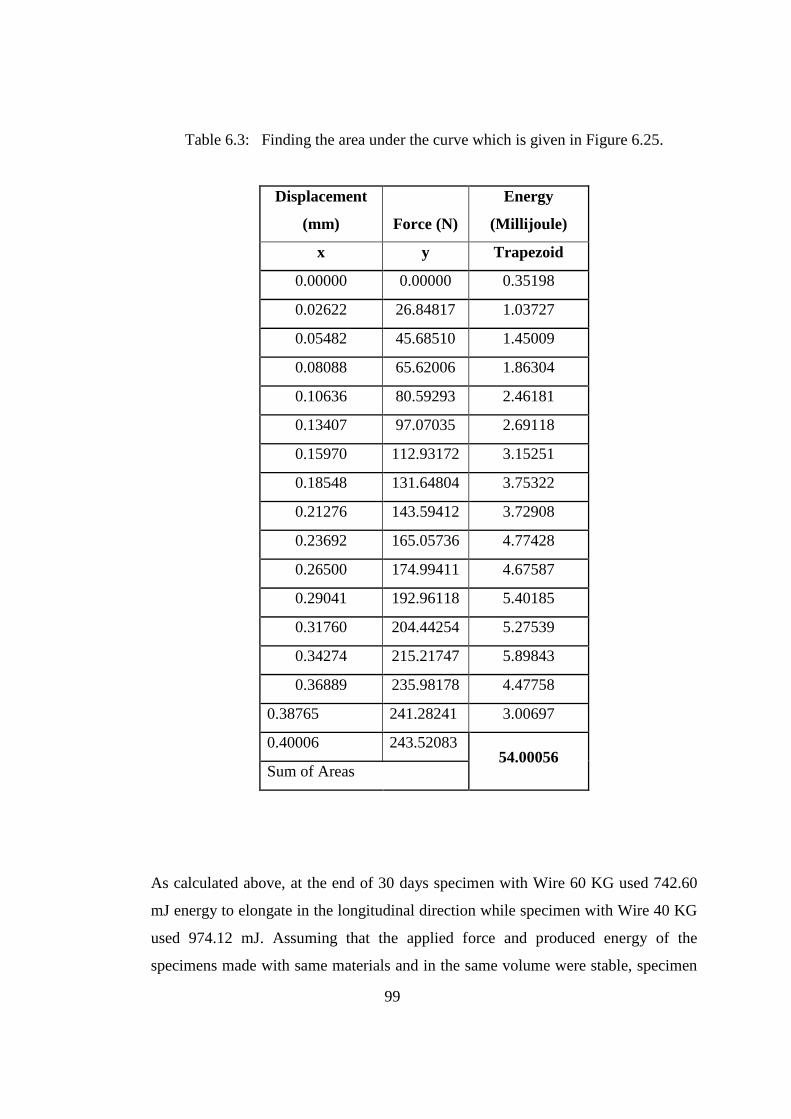
99
99
Table 6.3: Finding the area under the curve which is given in Figure 6.25.
Displacement
(mm) Force (N)
Energy
(Millijoule)
x y Trapezoid
0.00000 0.00000 0.35198
0.02622 26.84817 1.03727
0.05482 45.68510 1.45009
0.08088 65.62006 1.86304
0.10636 80.59293 2.46181
0.13407 97.07035 2.69118
0.15970 112.93172 3.15251
0.18548 131.64804 3.75322
0.21276 143.59412 3.72908
0.23692 165.05736 4.77428
0.26500 174.99411 4.67587
0.29041 192.96118 5.40185
0.31760 204.44254 5.27539
0.34274 215.21747 5.89843
0.36889 235.98178 4.47758
0.38765 241.28241 3.00697
0.40006 243.52083 54.00056
Sum of Areas
As calculated above, at the end of 30 days specimen with Wire 60 KG used 742.60
mJ energy to elongate in the longitudinal direction while specimen with Wire 40 KG
used 974.12 mJ. Assuming that the applied force and produced energy of the
specimens made with same materials and in the same volume were stable, specimen
100
100
with Wire 60 KG used more energy in transverse direction. As mentioned before, the
longitudinal cracks of the specimens reinforced with 60 kg capacity wires were
deeper than the ones of the specimens reinforced with 40 kg capacity wires. This is a
proof of the theory that the specimen with Wire 60 KG used more energy in
transverse direction.
101
101
CHAPTER VII
CONCLUSIONS
In this study, mechanical preventive measures such as reinforcements and pre-
stressing force against effects of ASR were investigated. Beams in 2.5x2.5x287 cm
dimension reinforced with three different wires with 20 kg, 40 kg, and 60 kg
capacities were tested. 0.565 MPa pre-stressing force was applied on each wire in the
experiment. Tests were done according to ASTM C1260 and the following
conclusions could be drawn from this experimental study.
1. The ASR based expansions of the reinforced specimens decreased in the
direction they were restricted. As reinforcement ratio increased, expansion
decreased with the decreasing ratio.
2. When PS force was applied on the beams in longitudinal direction, expansion
decreased in that direction. With small amount of force large expansion
decrease could be achieved. By applying 0.565 MPa force on the specimen
whose wire diameter was 0.8 mm, the same expansion decrease in the
specimen with 1 mm wire diameter was obtained. Taking the fact that
concrete’s 1 day strength was 12 MPa into consideration, expansion can be
decreased by applying more PS force. In order to prevent ASR based
expansion in concrete, PS force can be increased instead of boosting the
reinforcement ratio. Generally, the effect of the applied PS force diminishes
as the expansion decreases.
3. There was no interfacial bond between wire and concrete probably because of
the presence of the nylon coat on the wire.
102
102
4. Both reinforcement and PS force has great effect on initial ASR expansion.
The specimen reinforced with Wire 60 KG and on which PS force was
applied showed only 0.005 % expansion at the end of the first three days.
5. Reinforcements and PS force provided further decrease in specimens that
contained more reactive aggregate and caused large expansion than in the
ones showing less expansion.
6. The expansion decrease amount of the specimen on which reinforcement and
PS force (P 60 KG) was applied was 21 % less than the one of the
unreinforced specimen in which SCM (20 % low calcium fly ash) was used.
This value decreases as PS force is increased.
7. Use of modified mold which is according to ASTM C490 and perform test
according to ASTM C1260 was new approach in testing mechanical
preventive measures (reinforcement and PS force) against ASR. Also it was
appropriate to use those standards in comparing SCM usage and mechanical
preventive measures.
8. The cracks in specimens showed that in bars on which reinforcement and PS
force were applied, cracks had developed in longitudinal direction in parallel
to restrict condition. As reinforcement ratio and PS force increased,
longitudinal cracks became deeper whereas transverse ones got smaller. No
transverse crack was observed on certain restricted condition. The formation
period of longitudinal cracks diminished as reinforcement ratio and PS force
increased.
9. The cracks in specimens are formed by the work done by ASR gel, namely
the energy it produces. Taking into consideration the fact that the energy
produced by the specimen which has the same material and volume is stable,
it is possible to calculate this energy according to restricted condition.

103
103
CHAPTER VIII
RECOMMENDATIONS
Alkali-silica reaction is one of the most important problems of the world’s
construction industry. Even though the ways of preventing ASR by using SCM
material has been investigated a lot, there is no enough research about mechanical
preventive measures such as applying PS force or using reinforcements and steel
microfibers. As is known, deleterious effects of ASR emerge several years after
concrete structures are constructed. By using especially mechanical preventive
measures, deleterious ASR effects in these structures can be minimized.
Considering the results obtained from this experimental study, some
recommendations for further researches are given below.
1. In this study mortar bars had only longitudinal reinforcement. The bars which
have longitudinal reinforcements along with stirrups should be tested by
being exposed to ASR as in this experiment. In this manner, it can be
examined whether there is a change in longitudinal direction, and more
importantly, the way how the crack pattern will develop can be investigated.
2. Only one type of PS force was applied in this experiment. The effect of
prestressing force on ASR expansion can be investigated further by applying
different loads on bars. Expansion may be decreased to a great extent
especially by applying more loads.
3. In this experiment, restricted condition was applied in only one direction.
Further research can be done by preparing cube specimens, reinforcing them
104
104
in three directions, and applying PS force. It may be researched that whether
ASR based expansion can be prevented by applying adequate force. Crack
development of the specimens during their condition of being reinforced in
two or three directions can be observed.
4. The specimens (same materials) can be made in different dimensions with
being reinforced in three directions. By measuring volume change of these
specimens energy production of each specimen can be can be calculated. In
this way, the relationship between volume and expansion energy can be
investigated.
5. With the method mentioned in item 4 above, specimens can be prepared by
using different reactive materials that have the same volume. The expansion
potentials of reactive materials may be measured in this manner.
6. An unreinforced specimen in certain dimensions can be prepared. After this
specimen is exposed to ASR, holes can be drilled through the inner part in
order to pass the wires through. After prestressing (post-tensioning) the wires,
the specimen can be put back to the environment it is exposed to ASR. In this
way, the possibility of using post tension method in structures exposed to
ASR may be investigated.
105
105
REFERENCES
ASTM C128, Standard Test Method for Density,Relative Density (Specific gravity),
and Absorption of Fine Aggregate, Annual Book of ASTM Standards, 2007.
ASTM C150 ,Standard Specification for Portland Cement, Annual Book of ASTM
Standards, 2009.
ASTM C 1260,Standard Test Method for Potential Alkali Reactivity of Aggregate
(Mortar – Bar Method), Annual Book of ASTM Standards, 2007.
ASTM C490,Standard Practice for use of Apparatus for the Determination of Length
Change of Hardened Cement paste, Mortar, and Concrete, Annual Book of ASTM
Standards, 2007.
ASTM C305,Standard Practice for Mechanical Mixing of Hydraulic Cement Pastes
and Mortars of Plastic Consistency, Annual Book of ASTM Standards, 2007.
Abeles, P., & Turner, F. (1962). Prestressed Concrete Designer's Handbook.
London: Concrete Publications Limited.
Andiç, Ö., Yardımcı, M., & Ramyar, K. (2008). Performance of
carbon,polyvinylalcohol and steel based microfibers on alkali-silica reaction
expansion. Construction and Building Materials 22, 1527-1531.
Aşık, M. (2006). The Performance of Structural Lightweight Aggregate Concrete
With Natural Perlite Aggregate. Middle East Technical University, Ankara,
Turkey .
106
106
Bektaş, F., Turanlı, L., & Monteiro, P. (2005). Use of perlite powder to suppress the
alkali–silica reaction. Cement and Concrete Research 35, 2014-2017.
Bektaş, F. (2002). Ms Thesis. Preventive Measures Against Alkali-Silica Reaction.
Middle East Technical University, Ankara, Turkey.
Berra, M., Faggiani, G., Mangialardi, T., & Paolini, A. (2010). Influence of stress
restraint on the expansive behaviour of concrete affected by alkali-silica
reaction. Cement and Concrete Research 40, 1403-1409.
Berube M.A, & Fournier. (1993). Canadian Experience with Testing for Alkali-
Aggregate reactivity in Concrete. Cement and Concrete Composites 15, 27-
47.
Berube, M., & Fournier, B. (1992). Accelerated Test Methods for Alkali-Aggregate
Reactivity. V. Malhotra içinde, Advances in Concrete Technology (p. 583-
627). CANMET.
Binal, A. (2007). Investigation of mixing ratio and restraint condition effects on
alkali-silica gel pressure in mortar by using a uniaxial alkali-silica gel
pressure measuring device (ASGPM-D). Construction and Building
Materials 21, 1218-1228.
Blanks, R., & Kennedy, H. (1955). The Technology of Cement and Concrete. New
York: John Wiley & Sons.
Blight, G. E., & Alexander, M. G. (2011). Alkali-Aggregate Reaction and Structural
Damage to Concrete. Leiden, Netherlands: CRC Press.
Charlwood, R., Solymar, S., & Curtis, D. (1992). A review of alkali-aggregate
reactions in hydroelectric plants and dams. Proceedings of the International
107
107
Conference on Alkali-Aggregate Reactions in Hydroelectric Plants and
Dams, (pp. 1-29). New Brunswik.
Clayton, N., Currie, R., & Moss, R. (1990). The effects of alkali-silica reaction on
the strength of prestressed concrete beams. The structural Engineer,Volume
68, 287-292.
Cyrille, F., & Karen, L. (2012). Effects of uniaxial stress on alkali-silica reaction
induced expansion of concrete. Cement and Concrete Research 42, 567-576.
Çullu, M., Subaşı, S., & Bolat, H. (2010). Concrete Cancer - Alkali Silika Reaction.
New World Sciences Academy.
Erlin, B., & Stark, D. (1990). Petrography Applied to Concrete Aggregates, ASTM
STP 1061. In O. Batic, & J. Sota, Contribution of Alkalis by Aggregates to
Alkali-Aggregate Reaction in Concrete (pp. 159-168). Philadelphia:
Evans, R., & Bennett, E. (1958). Pre-Stressed Concrete. New York: John Wiley &
Sons INC.
Haddad, R., & Smadi, M. (2004). Role of fibers in controlling unrestrained
expansion and arresting cracking in Portland cement concrete undergoing
alkali-silica reaction. Cement and Concrete Research 34, 103-108.
Henry, J., & Peter, R. (1966). The Design of Prestressed Concrete. Sidney: Angus
and Robertson ltd.
Jones, A., & Clark, L. (1996). The effects of restraint on ASR expansion of
reinforced concrete. Magazine of Concrete Research 48, 1-13.
108
108
Kawamura, M., & Iwahori, K. (2004). ASR gel composition and expansive pressure
in mortars under restraint. Cement and Concrete Composites 26, 47-56.
Kobayashi, K., Inoue, S., Yamasaki, T., & Nakano, K.-i. (1988). Alkali aggregate
reaction in prestressed concrete beams. The International Journal of Cement
Composites and Lightweight Concrete,Volume 10, 233-240.
Koichi, O. (1988). Damaged concrete structures in japan due to alkali silica reaction.
The International Journal of Cement Composites and lightweight
Concrete,Volume 10,Number 4, 247-257.
Koyanagi, W., Rokugo, K., & Ishida, H. (1986). Failure behavior of reinforced
concrete beams deteriorated by Alkali-Silica Reaction. Proc. of the 7 th
ICAAR, (p. 141-145). Ottawa.
Lea, F. (1970). The Chemistry of Cement and Concrete (Third Edition b.). Glasgow:
Edward Arnold (Publishers) Ldt.
Libby, J. (1971). Modern Prestressed Concrete. San Diego: Van Nostrand Reinhold.
Mehta, P., & Monteiro, M. (1999). Concrete:Microstructure,Properties,Materials.
Indian Concrete Institute.
Mindess, S., & Young, J. F. (1981). Concrete. New Jersey: Prentice Hall.
Mohammed, T., Hamada, H., Yamaji, T., & Yokota, H. (2004). ASR Expansion of
Concrete Beams With Various Restrained Conditions - 612 Days of
Acclereated Marine Exposure. Proceedings of the 12th International
Confference on Alkali-Aggregate Reaction in Concrete, (pp. 1169-1180).
Beijing.
109
109
Monteiro, P., K., W., Sposito, G., dos Santos, M., & Andrate, W. (1997). Influence
of Mineral Admixtures on the Alkali-Aggregate Reaction. Cement and
Concrete Research 27, 1899 - 1909.
Multon, S., Dubroca, S., Seignol, J.-F., & Toutlemonde, F. (2004). Flexular Strength
of Beams Affected by ASR. Procceedings of the 12th International
Conference on Alkali-Aggregate Reaction in Concrete, (p. 1181-1190).
Beijing.
Multon, S., Leclainche, G., Bourdarot, E., & Toutlemonde, F. (2004). Alkali-Silica
Reaction in Speciments Under Multi-Axial Mechanical Stresses. Seoul:
CONSEC'04.
Multon, S., Seignol, J., & Toutlemonde, F. (2005). Structural behavior o Concrete
Beams Affected by Alkali-Silica Reaction. ACI Material Journal, March-
April , 67-75.
Nawy, E. (2003). Prestressed Concrete: A Fundamental Approach. New Jersey:
Pearson Education,Inc.
Neville, A. (1990). Properties of Concrete (Third Edition ). New York: Longman
Scientific and Technical.
Neville, A. (2000). Properties of Concrete,First Indian reprint. Pearson Education
Asia Ptc.Ltd.
Neville, A., & Brooks, J. (1987). Concrete Technology. Harlow, Essex: Longman
Scientific & Technical.
Page, C. L., & Page, M. M. (2007). Durability of concrete and cement composites.
Cambridge, UK: Woodhead Publishing Limited.
110
110
Popovics, S. (1992). Concrete Materials: Properties, Specifications and Testing.
New Jersey, USA: Noyes Publications.
Skalny, J. P. (1989). Materials Science of Concrete I. Westerville: The American
Ceramic Society, Inc.
Stephen, M., & François, T. (2006). Effect of applied stresses on alkali-silica
reaction-induced expansions. Cement and Concrete Research 36, 912-920.
Swamy, R. (1994). Alkali-Aggregate Reaction - The Bogeyman of Concrete. M. at
Mohan, Concrete Technology Past,Present,and Future (p. 105-124). Detroit:
American Concrete Institute.
Swamy, R. N. (1992). The Alkali-Silica Reaction in Concrete. Glasgow and London,
UK: Blackie and Son ltd.
Swamy, R., & Al-Asali, M. (1990). Alkali-Silica Reaction in reinforced concrete
beams. ACI Material Journal, 38-46.
Turanli, L., Shomglin, K., Ostertag, C., & Monteiro, P. (2001). Reduction in alkali-
silica expansion due to steel microfibers. Cement and Concrete Research 31,
825-827.
Uzal, B., Turanli, L., & Mehta, P. (2007). High-Volume Natural Pozzolan Concrete
for Structural Applications. ACI Material Journal,September, 535-538.
U.S. Geological Survey. (2009). Mineral Commodity Summaries, U.S. Geological
Survey,USA;
111
111
Woods, H. (1968). Durability of Concrete Construction . Michigan: American
Concrete Institute .
Yi, C., & Ostertag, C. (2005). Mechanical approach in mitigating alkali-silica
reaction. Cement and Concrete Research 35, 67-75.