effect of salt and citric acid on electrical conductivities and ohmic heating of viscous liquids
TRANSCRIPT

EFFECT OF SALT AND CITRIC ACID ON ELECTRICAL CONDUCTIVITIES AND OHMIC HEATING OF VISCOUS
LIQUIDS
MICHELE MARCOTTE and MAHER TRIGUI
Food Research and Development Centre Agriculture and Agri-Food Canada
3600 Casavant Blvd West St. Hyacinthe, Quebec, Canada, J2S 8E3
AND
HOSAHALLI SWAMY RAMASWAMY'
Department of Food Science and Agricultural Chemistry Macdonald Campus of McGiN University
21, I I I Lakeshore, Sainte-Anne-de-Bellevue Quebec, Canada, H9V 3 V9
Accepted for Publication March 30,2000
ABSTRACT
Four hydrocolloid solutions (starch, 4.3%; carrageenan, I . 7%; xanthan, 2%; pectin, 2.5%) were prepared in water with varying amounts of NaCl(O.25, 0.5, 0.75 and 1%). Hydrocolloid concentrations were adiusted to result in an apparent viscosity of 0.2 Pas at 20C and 300 s-'. A voltage of I50 V was applied in a static ohmic heating cell to study the effect of hydrocolloid and salt on electrical conductivity (EC) and temperature profile at their RH. The pH levels were modified by citric acid addition and the combined effect of hydrocolloid, salt and citric acid was investigated. At low salt concentration, carrageenan and xanthan had shortest heating times and highest ECs. This was followed by pectin. Starch was the least effective, having slowest heating rates and lowest ECs. At I % concentration, the salt effect overcame that of hydrocolloid giving similar temperature proj2es and ECs. The effect of citric acid addition was present but negligible.
'To whom correspondence should be addressed. Phone: 1-514-398-7919; Fax: 1-514-398-7977; E-mail: [email protected]
Journal of Food Processing and Preservation 24 (2000) 389-406. All Rights Reserved. "Copyright 2000 by Food & Nutrition Press, Inc.. Trumbull, Connecticut. 389

3 90 M. MARCOTTE, M. TRIGUI and H.S. RAMASWAMY
INTRODUCTION
Food formulations requiring hydrocolloids usually undergo a heat treatment to obtain a shelf-stable product. Since these products are highly viscous, fouling problems often occur while using conventional thermal processing equipments. Ohmic heating has been foreseen as an alternative technology to provide the desired high-temperature short-time process in order to reduce the incidence of fouling. The heat treatment varies with pH (e.g. higher heat treatment will generally be required for low acid foods and the inverse applies for high acid foods). It has also been stated that acids could increase the ionic content which render the food electrically more conductive (Skudder and Biss 1987) thereby increasing the efficiency of the ohrmc heating process. The relationship between acidity or pH on electrical conductivity has not been documented in the literature, although it is very important because it will influence the ohmic heating treatment time. Only Palaniappan and Sastry (1991b) reported values for h i t juices (i.e. low pH and low viscosity fluids).
Another important factor is the salt concentration in food formulations. It has been shown that the efficiency of ohmic heating increases with salt concentration because it changes the electrical resistance that determines the heating rate (de Alwis and Fryer 1992). Palaniappan and Sastry ( 199 1 a) soaked potato pieces in salt solutions at different concentrations and reported that as the concentration of salt absorption increased, the electrical conductivity values also increased along with temperature rise and the resulting heating rates. The salt concentration in immersion solutions never exceeded 0.8%. The relationship of o-T was found to be linear. Wang and Sastry (1993) investigated the effect of salt diffusion into potato tissue as a pretreatment for ohrmc heating. Electrical conductivity profiles were found to follow the salt concentration profile. A stronger relationship between the electrical conductivity and the salt concentration was found when the amount of salt exceeded 0.01 g/cm’ in the tissue. Use of high concentration brine resulted in nonlinear a-T profiles during ohmic heating and quadratic models were obtained. The salt content of fish food emulsions (e.g. surimi) on electrical conductivity was included by Yongsawatdigul et al. (1995) as an important parameter in their model for electrical conductivity as influenced by composition and temperature. The level of NaCl was found to significantly affect electrical conductivity values in frozen seafood during ohmic thawing, the treatment being more efficient at higher concentrations of salt (Luzuriaga and Balaban 1996). Kim et al. (1 996) reported that the effect of salt on electrical conductivity of viscous fluids, which are normally used as carrier liquids in conventional aseptic processing and ohmic heating, had not been widely studied. The same authors also reported that the salt content of the sauce or gravy of a typical particulate food (e.g. beef stew) is usually between 0.6-1%.
SALT AND ACID EFFECT ON OHMIC HEATING OF LIQUIDS 391
The objective of this work was to study the effect of salt concentration (0.25, 0.50,0.75 and 1.0) and citric acid addition (normal and modified pH) on electrical conductivities and ohmic heating behavior of selected hydrocolloids in water.
MATERIALS AND METHODS
Type and Concentration of Hydrocolloids
Four hydrocolloids were chosen: carrageenan (Grinsted Carrageenan, CL2 10, Danisco Ingredients Canada, Rexdale, ON, Canada), xanthan (Rhodigel, lot # 9635001, Rhone-Poulenc Food Ingredients, Fort Washington, PA), pectin (Grinsted Pectin, RS400 lot # 701 J547, Danisco Ingredients Canada, Rexdale, ON), starch (Thermo-flo starch, NFPA 0934 lot # LF5919, National Starch and Chemical Corp., Bridgewater, NJ).
Dry hydrocolloid powders were weighed and thoroughly mixed with the appropriate amount of salt (NaCl) for final concentrations (0.25,0.5,0.75 and 1%) before being incorporated into hot water at 80C. The dry mixture of salthydrocolloid was added slowly in small quantities to the hot water, mixed with a hand blender and heated on a hot plate until it reached 1OOC. These samples were poured into 500 mL glass jars, cooled and stored for further analyses. The whole procedure was repeated twice. The solutions obtained were at their normal pH [e.g. carrageenan, @H: 8.8); starch, (pH: 8.8), xanthan, (pH: 6.3) and pectin, (pH: 3.5)] that was measured.
Further to the above preparation procedure, citric acid was added to the mixture of dry hydrocolloidsalt in order to modify the pH of hydrocolloid solutions. These solutions were identified as modified pH solutions. For carrageenan and starch, the pH was adjusted to 6.5-6.8 as is normally used for low acid foods. For xanthan and pectin, the modified pH was around 2.8 to represent acidic conditions prevalent in fruit products.
Rheological Measurement
The apparent viscosity of each hydrocolloid solution was determined using a rotational viscometer (Rotovisco, Model RV20, Haake Mess-Tech&, Karlsruhe, Germany) equipped with an M5 OSC measuring head and a MV2 rotor. Samples were loaded into the cylindrical cup and allowed to equilibrate at 20C for 20 min in a water bath. A computer controlled program (Rheocontroller, RC20 module, Haake Mess-Technik, Karlsruhe, Germany), in the rotational mode, was used to shear samples at a linear rate from 0 to 300 s-' in 3 min. Silicone oil standards (Cannon Instrument Company, State College, PA) were used to calibrate the rheometer. Shear stress-shear rate data were gathered as rheograms. Apparent viscosities were calculated at 300 s - I in Pas for each hydrocolloid type and

392 M. MARCOTTE, M. TFUGUI and H.S. RAMASWAMY
concentration as a ratio of the experimental shear stress over the constant shear rate of 300 s-I. Experiments were carried out in triplicate. The appropriate concentration for each hydrocolloid was determined to obtain the same apparent viscosity at 20C at a shear rate of 300 s-’ i.e. 0.2 Pas. The fmal concentration of each hydrocolloid was found to be 1.7% for carrageenan, 2.5% for pectin, 4.3% for starch and 2% for Xanthan.
Electrical Conductivity, Temperature Profiles and Heating Rates
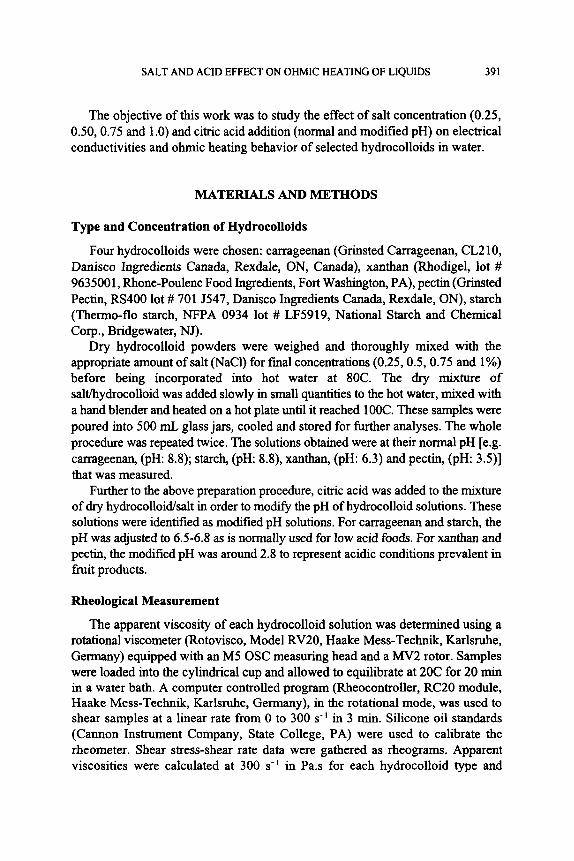
Electrical conductivity measurements and temperature profiles data gathering of test samples were carried out in a static ohmic heating cell, schematically shown in Fig. 1. Briefly, a 400 mL sample of hydrocolloid solution was introduced into the cell which consisted of a glass cylinder of 2.48 cm diameter and 20.69 cm length. Two titanium electrodes were located at extremities of the cylinder. A constant voltage of 150 V was applied with a maximum allowable current of 5 A. Four type-T Teflon coated thermocouples were fitted to the glass cylinder for solution temperature measurement. One thermocouple was placed close to the electrode, one at the center of the cylinder and two placed at mid-point between the center and the electrode in opposite directions. Voltage, current and temperature were recorded at specific time intervals using a datalogger (Model Hydra 2625A, John Fluke MFG Co., Inc., Everett, WA) connected to a computer, over a temperature range of 20-8OC. The electrical conductivity (a) was calculated from the resistance (R=V/I) of the sample and the geometry of the cell (L/A, ratio of length between electrodes to cross-sectional surface area of electrodes) as described in Marcotte et al. (1998).
Experimental heating rates were obtained by calculating slopes of the curve of temperature against time, giving values of dT/dt directly at different processing times. First derivatives (dT/dt) at given times (t) were computed using a commercial software package (TableCurve2D, Version 4, SPSS Inc., Chicago, IL).
Data Analysis
A statistical analysis system computer program (SAS Institute Inc., Cary, NC) was first used to test for the statistical significance of the main effects (i.e. hydrocolloid type, salt content (SC), acid content (AC) taken as pH and the temperature (T)) on the electrical conductivity. For each hydrocolloid type, an analysis of variance was also performed to identify significant factors (e.g. T, SC, AC) on electrical conductivity and heating rate. The model also included the interaction effects. For each hydrocolloid type, a regression model on electrical conductivity and heating rate was established including second order polynomial terms (T’, SC’, AC’) if significant. A plot of residuals was evaluated to ensure that the assumption of constant variance and normality was satisfied.
SALT AND ACID EFFECT ON OHMIC HEATING OF LIQUIDS 393
1 VARIABLE AUTOTRANSFORMER 2 TRANSFORMER 120/240 0.75KVA 3 CURRENT TRANSDUCER 4 VOLTAGE TRANSDUCER 5 THERMOSTAT FOR AIR COOLER 6 PNEUMATIC VALVE FOR AIR COOLER
( b )
FIG. 1. (a) SCHEMATIC OF THE STATIC OHMIC HEATING CELL (b) DETAILS OF THE ELECTRICAL CIRCUIT

394 M. MARCOTTE, M. TRIGUI and H.S. RAMASWAMY
RESULTS AND DISCUSSION
Temperature Profiles
Temperature profiles for four hydrocolloids at normal pH as influenced by salt concentration, processed at 150V with varying current up to 5 A, are presented in Fig. 2. Temperature profiles of starch (4.3%), carrageenan (1.7%), pectin (2.5%) and xanthan (2%) at normal pH and four levels of salt (0.25,0.5,0.75 and 1%) are shown at a comparable viscosity of 0.2 Pa.s at 20C and 300 s-'. Regardless of the type of hydrocolloid, as the concentration of salt increased, the profiles became steeper. The lower the salt concentration, the more the time required to reach 80C. Heating rates were observed to increase with temperature as a result of increasing electrical conductivity analogically as in Sastry and Palaniappan ( 1992). Less than 900 s were required for all products to increase their temperature to 80C.
Heating profiles of the different hydrocolloids at a comparable viscosity (i.e. 0.2 Pa.s at 20C and 300 s-') and selected salt concentrations were compared in Fig. 3. Similar heating patterns were observed for all products. At low salt concentration (0.25%), carrageenan and xanthan heated faster than pectin and starch. Starch had the slowest heating behavior. Temperature profiles became very similar as the concentration of salt was increased for all products indicating a greater effect of the salt. As the concentration was increased, the salt addition effect dominated the temperature profiles, presumably as a result of increased electrical conductivity.
It has to be pointed out that the hump observed for carrageenan at 0.25% for the temperature profile in the region of 50C was due to an occurrence of voltage fluctuation (5 V) in one replicate only. The problem did not occur because of a possible phase transition.
A comparison of temperature profiles for carrageenan, xanthan, pectin and starch at normal and modified pH is presented in Fig. 4. Profiles for modified pH products were slightly sharper than the ones for normal pH, which can be explained by the addition of the weakly charged citric acid. However, the addition of citic acid did not have a major effect when compared to the salt content and the hydrocolloid type effects.
Heating rates for all hydrocolloid types were determined as a function of temperature and are shown in Fig. 5. Heating rates were found to increase linearly as a function of the temperature. For starch (4.3%) and pectin (2.5%), they varied from O.O5C/s (0.25% salt and 2OC) to 0.35-0.45C/s (1% salt and 80C), respectively. At 20C, steeper rates (0.1Cls) were observed for xanthan (2%) and carrageenan (1.7%) at 0.25% salt (a low concentration). Heating rates at 1% salt and 80C were the highest (0.65C/s) for carrageenan (1.7%). Another factor that will strongly affect heating rates is the field gradient (7.24 V/cm) that was considered to be low but typical to static ohmic heating systems. Similar heating rates were reported for viscous solutions at 8 V/cm with similar electrical conductivities (de Alwis et al.

1.00%
0.75%
0.50%
0.2
5%
1
00
Sta
rch
4.3
%
Ca
rra
ge
en
an
1.7
%
0'
I 0
15
0
300
45
0
600
750
900
Tim
e (
s)
100
1 00%
0 75
% 0.50%
0.2
5%
U
Pe
cti
n 2
.5%
0
15
0
300
45
0
600
750
90
0
Tim
e (
5)
0 -
I I
0
150
300
450
600
750
900
Tim
e (s)
100
80
w 2 e 2
60
Q)
40
s I-
20 0
1.0
0%
0.75%
0.5
0%
0 2
5%
Xa
nth
an
2.0
0%
0
150
300
45
0
600
75
0
900
Tim
e (
5)
c
W
VI
FIG
. 2. E
FFEC
T O
F SA
LT
CO
NC
ENTR
ATI
ON
(0.2
5,0.
5,0.
75 A
ND
1%
) O
N TE
MPE
RA
TUR
E PR
OFI
LES
OF
FOU
R H
YD
RO
CO
LLO
ID T
YPE
S (P
ECTI
N 2
.5%
, XA
NTH
AN
2.0
%. S
TAR
CH
4.3
% A
ND
CA
RR
AG
EE
NA
N 1.
7%) A
T N
OR
MA
L pH
W

100
0.25
% s
alt
Car
X
an
Pe
c
04
0 150
300
45
0
600
75
0
900
Tim
e(s)
120
0.75
% s
alt
100
e 80
s 1 6o
40
20
t
Xa
n
.. Sta
Pec
0'
I 0
150
300
45
0
600
75
0
900
Tim
e(s)
120
Car
X
an
0.50
% s
alt
0'
150
300
450
600
750
900
0 T
ime(
s)
10
0
1.00
% s
alt
1
150
300
450
600
750
900
0 T
ime@
)
FIG
, 3. E
FFEC
T O
F H
YD
RO
CO
LLO
ID T
YPE
S (S
TAR
CH
, 4.3
%; C
AR
RA
GEE
NA
N, 1
.7%
; PEC
TIN
, 2.5
% A
ND
XA
NTH
AN
, 2%
) ON
TEM
PER
ATU
RE
PRO
FILE
S A
T N
OR
MA
L pH
AT
0.25
,0.5
,0.7
5 A
ND
1% S
ALT
CO
NC
ENTR
ATI
ON

120
, I
100
1
Car
rag
een
an 1
.7%
7
Sta
rch
4.3
%
1 >
0’
I 0
150
300
450
600
750
900
Tim
e(s
)
100 80
f 60
E E 5 g
40
20
c
0
I i ! I
25%
i i
Pec
tin
2.5
%
0 150
300
450
600
750
900
Tim
e(s
)
No
rmal
pH
10
0 ,
1
Tim
e(s
) n
p!
a
10
0
80
2 60
e 8 40
20
c
1
P - * 5
0
IJ
1 4 E
Xan
lhan
2 0%
.a
150
300
450
600
750
900
2 0
Tim
e(s
) F!
Mo
dif
ied
pH
FIG
. 4. E
FFEC
T O
F C
ITR
IC A
CID
AD
DIT
ION
ON
TEM
PER
ATU
RE
PRO
FILE
S A
T N
OR
MA
L A
ND
MO
DIF
IED
pH
FO
R ST
AR
CH
4.3%
, C
AR
RA
GEE
NA
N 1
.7%
. PEC
TIN
2.5
% A
ND
XA
NTH
AN
2.0
%
W
\o 4

0.7
1- c*..-
3 0
.6
0.5
\ e m E
0.4
0.3
- - .- %
0
.2 -
: 0.1
-
Gra
iCh
4.3
%
10
0%
/
_.-
- 0 0
75
%
50
%
_..
- --
- ..
*-
_---
- --
--
02
5%
1 I
0'
I
0 20
4
0
60
8
0
10
0
Te
mp
era
ture
("C
)
0 .7
P
ec
tin
2.5
%
3 - 0
.6
- 0.
5 -
2 0.
4 -
10
0%
E g
0.3
-
%
0.2
-
0.1
- 0.
0
.- 9)
0.7
0.6
9 0.
5
B 0.
4 E
0.3
- m - .- - 2 0
.2
I
0.1
0.7
- X
anth
an 2
.0%
m 1
00
%
- 0.
6
__
_.-
- 0
75
%
1 /
_.-
--
05
0%
9 - 0.5
5 0
.2
= 0.
1
d 0.
4 E a
0.3
_.-
- _-
---
.- 0
25
%
_.-
- _---
--
0
Car
rag
een
an 1
.7%
07
5%
I
_..
.--
0'
I
0 20
40
6
0
80
10
0
Tem
per
atu
re (
"C
)
FIG
. 5. H
EATI
NG
RAT
ES O
F FO
UR
HY
DR
OC
OLL
OID
TY
PES
(STA
RC
H 4
.3%
, CA
RR
AG
EEN
AN
1.7
%, P
ECTI
N 2
.5%
AN
D X
AN
THA
N 2
%) IN
SOLU
TIO
NS A
T 0
.25,
0.5,
0.75
AN
D 1
% S
AL
T C
ON
CEN
TRA
TIO
N

SALT AND ACID EFFECT ON OHMIC HEATING OF LIQUIDS 399
1989). Heating rates, that were obtained, can be considered small. To a certain extent, they were increased by a factor of 4 by increasing the salt concentration from 0.25 to 1% at 20C. At 80C, the effect of the salt concentration on heating rates was more important, as heating rates were increased 5 times.
Electrical Conductivity
Electrical conductivity versus temperature for four hydrocolloids at a comparable viscosity level (0.2 Pas at 20C and 300s-I) are compared in Fig. 6. Electrical conductivity increased linearly with temperature as reported by several authors (Palaniappan and Sastry 199 1 a, b; Yongsawatdigul ef al. 1995). As the salt concentration increased, so did the electrical conductivity. The effect was more pronounced at high temperatures. This particular pattern was observed for all hydrocolloid solutions.
However, starch had the lowest electrical conductivity over the entire temperature range at 0.25,0.50 and 0.75% concentration. Electrical conductivity profiles for pectin were slightly higher than that for starch. Xanthan and carrageenan had similar electrical conductivity profiles.
Values of electrical conductivities for 4.3% starch with salt addition, at 0.25 and 0.5% at 20C, were found to be 0.5 and 1 S/m, respectively. These were similar to those reported by Kim et al. (1996) for 5.5% starch with a similar salt concentration of 0.2%, 0.55% being 0.34 and 1.3 S/m, respectively at 19C. They also reported electrical conductivities of 5.5% starch solutions at 2% salt as 4.3 S/m. According to Kim et al. (1 996), the salt content of a typical gravy used for a beef stew is 0.6- 1 .O%. At 1%, the level is sufficient to overcome the differences in hydrocolloid types upon ohrmc heating but this would not be the case for fruit based products in which increasing the concentration of salt at to 1% would be objectionable to the taste.
Fryer et al. (1993) used three solutions of CMC at low viscosity (0.018 Pas), medium viscosity (0.064 Pas) and high viscosity (0.8 Pas) having a similar standardized initial electrical conductivity of 0.95 S/m at 20C in their study of heat generation and convection effects in ohmic heating. Results obtained under static ohmic heating for solutions showed a linear temperature dependence with almost identical temperature coefficients of electrical conductivity. From our results, in order to obtain 0.95 S/m at 20C, an addition of salt greater that 1% would be necessary. Results have shown that as the concentration of salt is increased to 1%, electrical conductivities and ohmic heating rates are more influenced by the salt addition and less by the hydrocolloid type.
The effect of added citric acid on electrical conductivities at normal and modified pH for different hydrocolloids revealed that there was little difference (results not shown). The effect of citric acid addition both for electrical conductivity and heating profiles was also found to be small. Citric acid is an

0.25
% s
alt
Ca
r X
l"
I
0 20
40
60
80
10
0
Tem
per
atu
re (
'C)
7
0.75
% s
alt
Ca
r
0'
0 20
4
0
60
80
10
0
Tem
pera
ture
('C
)
-7
0
.50
% s
alt
5.6
I
0 20
40
60
80
10
0 T
emp
erat
ure
('C
)
.00
% s
alt
C
ar
Xan
0 2
0
40
60
8
0
100
Tem
per
atu
re (
'C)
FIG
. 6. E
FFEC
T O
F FO
UR
HYD
ROCO
LLO
ID T
YPE
S (S
TAR
CH
4.3
%, C
AR
RA
GEE
NA
N 1
.7%
, PEC
TIN
2.5
% A
ND
XA
NTH
AN
2%
) ON
EL
ECTR
ICAL
CO
ND
UC
TIV
ITIE
S AT
0.25
,0.5
,0.7
5 AN
D 1
% S
ALT
CO
NC
ENTR
ATI
ON

SALT AND ACID EFFECT ON OHMIC HEATING OF LIQUIDS 40 1
organic acid that is not strongly dissociated. Even though large pH differences were determined, it was not sufficient to show major differences in electrical conductivities and heating profiles.
At low salt concentration (0.25%), carrageenan and xanthan solutions heated at the same rate (Fig. 3) which was also confirmed by their similar values of electrical conductivity (Fig. 6). The rate of heating of pectin was slower and that of starch followed next. The magnitude of electrical conductivity values and heating profiles were largely influenced by the hydrocolloid type at low salt concentration, which may be related to the chemical structure and composition of these hydrocolloids. Palaniappan and Sastry (1991b) indicated that the nature of ions and the ionic movement of liquid samples affect electrical conductivities. Carrageenans are acidic hydrocolloids always accompanied with counter ions. The structure of xanthan renders this hydrocolloid anionic. These charged compounds could explain their better efficiency upon ohmic heating at low salt concentration. Most starches are usually a combination of amylose and amylopectin in different proportions. It is usually a neutral polysaccharide, which could explain it being the poorest performer upon o h c heating. Pectin is a polymeric carbohydrate composed of a chain of galacturonic acid units that are partially esterified as methyl esters. Therefore, it will be less charged than xanthan and carrageenan but more so than starch. The structure of these hydrocolloids can explain the specific o h c heating behavior at low salt concentration.
As the salt concentration was increased to 0.5, 0.75 and 1%, the hydrocolloid effect is reduced resulting in similar heating electrical conductivity profiles for all hydrocolloid solutions. Yongsawatdigul et al. (1995) reported a similar trend on the effect of salt on surimi paste during ohmic heating. As the concentration of salt was increased from 1 to 4%, electrical conductivity profiles versus temperature were sharper. Similar values of electrical conductivities, to ours, were observed for their surimi paste at 1% salt concentration and 75% moisture content. At 20C, the electrical conductivity was 1 S/m and at 80C it was 5 S/m. Our value for starch, pectin and xanthan was 2 S/m at 20C increasing to 5 S/m at 80C. The heating rate of the surimi emulsion was higher than for our hydrocolloid solutions. Sastry and Palaniappan (1992) also pointed out a greater temperature effect for solids than for fluids upon ohmic heating. Surimi paste is more of an emulsion than a liquid. Therefore, a greater temperature effect was expected.
An analysis of variance of the electrical conductivity data inhcated that the type of hydrocolloids, salt concentration and temperature (main effects) were significant along with their significant two way interactions (e.g. type*pH, type*salt, type*temperature, pH*salt and salt*temperature). pH, as a main effect, had generally no influence (p>O.O5) on electrical conductivity. The variance linked to the salt concentration term was the largest. It was followed by the variance associated with the temperature. All other terms were relatively less important. Contrasts were computed and revealed that the effect of temperature as well as the

402 M. MARCOTTE, M. TRIGUI and H.S. RAMASWAMY
effect of salt concentration was linear. Regressions were obtained for each hydrocolloid type including a salt and temperature effect and the interaction between salt and temperature. Results are presented in Table 1.
TABLE 1. REGRESSION PARAMETERS FOR ELECTRICAL CONDUCTIVITIES AND
EXPERIMENTAL HEATING RATES FOR EACH TYPE OF HYDROCOLLOIDS AT 0.25.0.5. 0.75 AND 1% SALT CONCENTRATION
0.75
(2%) 0.75
I+- Pectin (2. S%)
Starch (4.3%)
0.848 0.0199 1.371 0.0313 1.914 0.0413 2.173 0.0481 0.889 0.0181 1.474 0.0305 + 1.969 0.0396
1.201 0.0261 1.690 10.0349
0.953 1 0.9840 0.9959 0.9915 0.9630 0.9837 0.9294 0.9747 0.9619 0.93 12 0.9938 0.9963 0.9959 0.9828 0.9763 0.9999
0.08077 0.00083 0.13856 0.00146 0.19520 0.00185 0.23 182 0.00703 0.08241 0.00155 0.12812 0.00246 0.18535 0.00357 0.23939 0.00562 0.05874 0.00085 0.10817 0.00180 0.16953 0.00173 0.23266 0.00210 0.05120 0.00103 0.10691 0.00194 0.15101 0.00294 0.21339 0.00461
In their statistical analysis of the data, Yongsawatdigul et al. (1995) observed an interaction between the salt and water content. Moreover, electrical conductivities increased quadratically with salt content and there was a significant interaction between the salt content and the temperature. Our data show that only a linear effect for salt was observed. This might be due to the fact that concentrations varied from 0.25 to 1% whereas for Yongsawatdigul el al. (1995) the salt concentration varied over a broader range from 1 to 4%.
Reression parameters were computed for the combined effect of salt concentration and temperature on electrical conductivity and heating rate. For all hydrocolloid types, salt content, temperature and the interaction between salt content and temperature were significant for electrical conductivity. However, only

SALT AND ACID EFFECT ON OHMIC HEATING OF LIQUIDS 403
Carrageenan
Xanthan
Pec t i 11
Starch
the salt concentration and the combined effect of temperature and salt concentration were significant for heating rates. Values of regression parameters for electrical conductivities and heating rates are listed in Table 2. They were used to plot surface response curves for heating rates in Fig. 7. This figure demonstrates the similarity between electrical conductivity (Marcotte et al. 1998) and heating rates under the context of ohmic heating, both increasing with temperature and salt content.
Salt Temperature Salt * Temperature Salt Temperature Salt* Temperature Salt Temperature Salt*Temperature Salt Temperature Salt *Temperature
TABLE 2. REGRESSION PARAMETERS FOR ELECTRICAL CONDUCTIVITY AND HEATING RATE FOR EACH TYPE OF HYDROCOLLOIDS AT SALT CONCENTRATION, TEMPERATURE
AND COMBINED SALT CONCENTRATION-TEMPERATURE EFFECTS
Estimates
Salt Salt*Temperature Salt
ELECTRICAL CONDUCTII’ITY
Parameter Value r2
0.13 0.01 0.9830 0.0063 2 0.0003 0.148 t 0.007 0.9924
Type I Estimates
Salt*Temperature Salt Salt*Temperature Salt
0.0043 k 0.0002 0.147 5 0.009 0.9784 0.0037 0.0003 0.120 + 0.006 0.9923
Parameter Value
I Salt*Temperature I 0.0044+ 0.0002
1.08 t 0.03 0.014 f 0.005
J
0.034 z 0.001 1.15 + 0.05 0.01% 2 0.0008 0.033 2 0.002 1.04 t 0.04 0.0085 0.0005 0.034 2 0.001 1.01 & 0.03 0.0016 t 0.0004 0.0417 k 0.0008
r2
0.9978
0.9941
0.9968
0.9980
Xanthan
Pectin I---- I Starch

404 M. MARCOTTE, M. TRIGUI and H.S. RAMASWAMY
(a) carrageenan (b) pectin
(c) starch (d) xanthan
FIG. 7. RESPONSE SURFACE PLOTS FOR HEATING RATES AS AFFECTED BY THE SALT CONCENTRATION AND THE TEMPERATURE FOR ALL HYDROCOLLOIDS

SALT AND ACID EFFECT ON OHMIC HEATING OF LIQUIDS 405
As suggested by Sastry and Palaniappan (1992), one of the most interesting features of the ohmic heating process is the potential to control heating rates by product design and formulation. It should be noted that if salt concentration below 1% would be used industrially, special care should be taken for the selection of hydrocolloids to result in enhanced heating rates. This situation is usually encountered for sweet and fruity products. At concentration equal or greater than 1%, the effect of salt on the heating rate is more important than the type of hydrocolloids. Therefore, any type of hydrocolloids could be used or the selection of hydrocolloids should rather be based on other factors. This is usually the case for salty products.
CONCLUSIONS
Results of the study indicate that at low salt concentration ( 4 % ) in a water-based system, the type of hydrocolloids will have an impact on electrical conductivity values and temperature profiles. Charged hydrocolloids like carrageenan and xanthan are more efficient than starch upon ohmic heating. With salt concentration at or greater than 1%, the salt effect is more important than the type of hydrocolloids in solutions. The effect of citric acid addition both for electrical conductivities and heating profiles was found to be small.
ACKNOWLEDGMENTS
The authors would like to thank sincerely Nicolas Elazhary and Francois Brunet for their valuable help in carrying out the experimental work. Thanks are extended to Dr. Sudhir Sastry and Brian Heslutt who contributed with their time, knowledge and expertise.
REFERENCES
DE ALWIS, A.A.P. and FRYER, P.J. 1992. Operability of the ohmic heating process: Electrical conductivity effects. J. Food Eng. 15, 21-48.
DE ALWIS, A.A.P., HALDEN, K. and FRYER, P.J. 1989. Shape and conductivity effects in the ohmic heating of foods. Chem. Eng. Res. Des. 67, 159-168.
FRYER, P. J., DE ALWIS, A.A.P., KOURY, E., STAPLEY, A.G.F. and ZHANG, L. 1993. Ohmic processing of solid-liquid mixtures: Heat generation and convection effects. J. Food Eng. 18, 102-125.
KIM, H.J. et al. 1996. Validation of ohmic heating for quality enhancement of food products. Food Techno]. 50(5), 253-261.

406 M. MARCOTTE, M. TRIGUI and H.S. RAMASWAMY
LUZURIAGA, D.E. and BALABAN, M.O. 1996. Electrical conductivity of frozen shnmp and flounder at different temperatures and voltage levels. J. Aquatic Food Product Technol. 5(3), 41-63.
MARCOTTE, M., RAMASWAMY, H.S. and PIETTE, J.P.G. 1998. Electrical conductivity of hydrocolloid solutions. J. Food Process Engineering 21,
PALANIAPPAN, S. and SASTRY, S.K. 1991a. Electrical conductivities of selected solid foods during ohmic heating. J. Food Process Engineering 14,221-236.
PALA"PAN, S. and SASTRY, S.K. 1991b. Electrical conductivity of selected juices: Influences of temperature, solids content, applied voltage, and particle sue. J. Food Process Engineering 14,247-260.
SASTRY, S.K. and PALANIAPPAN, S. 1992. Mathematical modeling and experimental studies on ohmic heating of liquid-particle mixtures in a static heater. J. Food Process Engineering 15,241-261.
SKUDDER, P. J. and BISS, C. 1987. Aseptic processing of food products using ohmic heating. Chem. Eng. 433,26-28.
WANG, W.-C. and SASTRY, S.K. 1993. Salt diffusion into vegetable tissue as a pretreatment for ohmic heating: electrical conductivity profiles and vacuuni infusion studies. J. Food Eng. 20, 299-309.
YONGSAWATDIGUL, J., PARK, J.W. and KOLBE, E. 1995. Electrical conductivity of Pacific Whiting surimi paste during ohmic heating. J. Food Sci.
503-520.
60(5), 922-925,935.