effect of speaking rate and contrastive stress on formant
TRANSCRIPT
HAL Id: hal-00131702https://hal.archives-ouvertes.fr/hal-00131702
Submitted on 19 Feb 2007
HAL is a multi-disciplinary open accessarchive for the deposit and dissemination of sci-entific research documents, whether they are pub-lished or not. The documents may come fromteaching and research institutions in France orabroad, or from public or private research centers.
L’archive ouverte pluridisciplinaire HAL, estdestinée au dépôt et à la diffusion de documentsscientifiques de niveau recherche, publiés ou non,émanant des établissements d’enseignement et derecherche français ou étrangers, des laboratoirespublics ou privés.
Effect of speaking rate and contrastive stress on formantdynamics and vowel perception
Michel Pitermann
To cite this version:Michel Pitermann. Effect of speaking rate and contrastive stress on formant dynamics and vowelperception. Journal of the Acoustical Society of America, Acoustical Society of America, 2000, 107,pp.3425-3437. �hal-00131702�

Effect of speaking rate and contrastive stress on formant
dynamics and vowel perception
Michel Pitermann
Department of Psychology, Queen’s University
Kingston, Ontario, Canada K7L 3N6
(Abbreviated title: Formant dynamic and kinematic modeling
Received)
Abstract
Vowel formants play an important role in speech theories and applica-
tions, however, the same formant values measured for the steady-state part of
a vowel can correspond to different vowel categories. Experimental evidence
indicates that dynamic information can also contribute to vowel characteriza-
tion. Hence dynamically modeling formant transitions may lead to quantita-
tively testable predictions in vowel categorization. Because the articulatory
strategy used to manage different speaking rates and contrastive stress may
depend on speaker and situation, the parameter values of a dynamic formant
model may vary with speaking rate and stress. In most experiments speak-
ing rate is rarely controlled, only 2 or 3 rates are tested, and most corpora
contain just a few repetitions of each item. As a consequence, the depen-
dence of dynamic models on those factors is difficult to gauge. This article
presents a study of 2,300 [iai] or [iεi] stimuli produced by two speakers at 9 or
10 speaking rates in a carrier sentence for 2 contrastive stress patterns. The
corpus was perceptually evaluated by naive listeners. Formant frequencies
1

Michel Pitermann The Journal of the Acoustical Society of America 2
were measured during the steady-state parts of the stimuli, and the formant
transitions were dynamically and kinematically modeled. The results indicate
that (1) the corpus was characterized by a contextual assimilation instead of a
centralization effect; (2) dynamic or kinematic modeling was equivalent as far
as the analysis of the model parameters was concerned; (3) the dependence
of the model parameter estimates on speaking rate and stress suggests that
the formant transitions were sharper for high speaking rate, but no consistent
trend was found for contrastive stress; (4) the formant frequencies measured
in the steady-state parts of the vowels were sufficient to explain the perceptual
results while the dynamic parameters of the models were not.
PACS number: 43.70, 43.71
Typeset using REVTEX

Michel Pitermann The Journal of the Acoustical Society of America 3
INTRODUCTION
Previous studies indicate that the first two formant frequencies measured in the steady-
state part of a vowel plays an important role in its characterization (Helmholtz, 1885 -
1954; Joos, 1948; Delattre, Liberman, Cooper and Gerstman, 1952). However the formants
of the same vowel uttered by different speakers, in different contexts, at different speaking
rates and with different stress patterns exhibit a lot of variability (Joos, 1948; Peterson and
Barney, 1952; Stevens and House, 1963; Lindblom, 1963).
The formant dependence on speaking rate and stress is usually described either by a
centralization process or a context assimilation. Some studies have reported that formant
frequencies of unstressed vowels or vowels uttered at fast speaking rates shift to a more
central position around (500, 1500) Hz in the (F1, F2) plane (Joos, 1948; Koopmans-van
Beinum, 1980). This is called centralization effect. A traditional view is that the vocal tract
tends to become more similar to its “schwa” configuration for unstressed vowels and for fast
utterances. In contrast, other studies have reported that vowel formants shift toward the
values of their context instead of a central position (Stevens and House, 1963; Moon and
Lindblom, 1994). This is called contextual assimilation.
An important issue related to vowel formant variability is that different vowels can be
characterized by the same steady-state values of the first two formants (Joos, 1948; Peterson
and Barney, 1952; Stevens and House, 1963). Because static formant values do not seem
sufficient to identify vowels, dynamic information is also analyzed.
Lindblom and Studdert-Kennedy (1967) showed that vowels were categorized differently
when they were presented in semi-vowel context instead of isolation. In context, listeners
heard formant values extrapolated beyond the values actually reached at the end of the
transitions. This perceptual overshoot was confirmed by Nearey (1989) for occlusive con-
texts. But another perceptual experiment presented in Nearey’s article showed that the
classification of sustained vowels was influenced by the presence of other sustained vowels.
Hence an acoustical contrast between stationary segments may also contribute to a percep-

Michel Pitermann The Journal of the Acoustical Society of America 4
tual overshoot. Some results conversely suggest that listeners can perceive formant values
averaged over a full syllable, i.e. a value closer to the vowel context than the value actually
reached (Pols and van Son, 1993). van Son (1993) proposed that a listener would exhibit a
perceptual overshoot only when the vowel context has been identified.
Strange (1989a,b) presented several experiments where the vowel steady-state part of
natural CVC stimuli were excised from the speech signals and replaced by silence. The
perceptual scores of these silent-center stimuli were at least as good as the scores of the
excised stationary segments presented in isolation. She proposed the theory of dynamic
specification of vowels stating that vowels in continuous speech are better identified by
coarticulation with their context than by information intrinsic to the vowel nuclei. Strange’s
results were replicated with adults and prelingual babies aged between 6 and 12 months for
one German and one English vowel contrast (Polka and Bohn, 1996), and with adults for the
14 German monophtongs (Strange and Bohn, 1998). On the other hand Nearey and Assmann
(1986) showed that isolated Canadian English monophtongs were slightly diphtongized, i.e.
the steady-state stimuli contained significant formant frequency change over time. The same
level of diphtongization was found for the vowels produced in context. The results of their
experiments suggested that listeners may rely more on this vowel-inherent spectral change
(VISC) than dynamic specification to identify vowels. Hence, vowels in continuous speech
would be better characterized by their nuclei than by coarticulation with context. Andruski
and Nearey (1992) showed perceptual results contradicting dynamic specification of vowels,
but compatible with VISC. Jenkins, Strange and Trent (1999) presented an experiment
based on the silent-center paradigm showing the opposite, i.e. results contradicting VISC
theory but compatible with dynamic specification of vowels.
Automatic classification procedures also showed that dynamic information may help to
categorize vowels. Cassidy and Harrington (1992) compared the performance of a neural net-
work in vowel categorization for logatomes [CVd] using either static or dynamic information.
The neural network used either formant transitions or stationary formant values duplicated
several times in order to have the same segment durations in both cases. The network had

Michel Pitermann The Journal of the Acoustical Society of America 5
higher identification scores when dynamic information was available. In Beautemps (1993)
a neural network could categorize [iai] and [iεi] speech signals when only one 26-ms segment
of each F1 transition of [iV] stimuli was available. Conversely the network failed a complete
categorization when the first three formants values measured in the stationary part were
used. In contrast with the two previous works Watson and Harrington (1999) showed that
a Gaussian classification algorithm could categorize vowels in a /h d/ or /h / context only
on the base of vowel duration plus formant values measured in the steady-state part of the
vowel. But /h d/ and /h / contexts produce less coarticulation than other consonant con-
texts (Stevens and House, 1963). The dynamics involved in the transitions could therefore
be insufficient to play a role.
As Nearey (1989) proposed, all the previous contradicting results suggest that listeners
may use many strategies together, but the perceptual weights given to of each of them would
depend on the situation and task. Perceptual results and automatic classification procedures
indicate that some of these strategies may rely on formant dynamics. Its characterization
could thereby improve our understanding of vowel categorization.
There are no good theories predicting formant dynamics or what dynamic features could
be used in vowel classification. It is not even clear whether the shape of a formant transition
plays a perceptual role. Carre, Chennoukh, Lindblom and Divenyi (1994) activated the
commands of a vocal tract model (Carre and Mrayati, 1992) with different mathematical
functions (linear, parabola, sine, etc.) to synthesize [iai] stimuli. An analysis of the for-
mant transitions in the (F1, F2) plane showed that the shape of the transition varied with
the mathematical form of the model commands. The perception of [a] was affected only
when the canonical formant frequencies corresponding to a good [a] were far from being
reached. Nabelek and Ovchinnikov (1997) perceptually compared linear and quadratic for-
mant contours in a vowel identification task. The two formant contours led to the same
categorization.
Other results suggest that the shape of formant transitions might change vowel catego-
rization. Divenyi, Lindblom and Carre (1995) showed that perceptual overshoot depends

Michel Pitermann The Journal of the Acoustical Society of America 6
on transition slope. In Carre, Chennoukh, Jospa and Maeda (1996), [abi] stimuli were syn-
thesized by means of a vocal tract model (Carre and Mrayati, 1992) with different phasing
between the consonant and vowel gestures. The shape of the formant transitions varied
with this “articulatory” phasing. For some formant transitions, listeners heard an extra
vowel. The perceptual results were [aεbi], [abi] or [abei] depending on the “articulatory”
phasing. As a consequence, even if a description of formant dynamics may not need to be
highly accurate in all situations (Carre et al., 1994; Nabelek and Ovchinnikov, 1997), its
characterization may lead to testable predictions in vowel identification.
Some attempts have been done to describe formant dynamics. For example, Broad and
Clermont (1987) offered several models of formant transition. The more elaborate one was
an exponential fit and it had good variance explanation. In van Son and Pols (1992) a
professional radio speaker read a Dutch text at normal then fast speaking rate. Vowel
duration was normalized during formant extraction, i.e. all formant time series segments
corresponding to vowels had the same length. No differences were found between the formant
contours when the two speaking rates were compared, but this representation helped to
distinguished front from back vowels. The normalized time series were also fitted to Legendre
polynomial expansions in order to characterize the shape of the formant transitions, and the
same results were found, i.e. no fit differences for the two speaking rates and the same
classification performance. In Watson and Harrington (1999), formant time series were
fitted to discrete cosine expansions to characterize formant contours of vowels uttered in
[h d] and [h ] contexts. This representation helped to identify the diphthongs. However
good, none of these formant contour characterizations were proven sufficient to identify all
vowels in a general context. New attempts may therefore be needed. This work presents
models of formant dynamics and kinematics and analyzes how their parameters and the
formant frequencies depended on speaking rate and contrastive stress.
To model the dynamics of the first two formants, the system underlying their production
was assumed stationary during an analyzed transition. F1 and F2 were modeled separately
for two reasons. Firstly, it can be seen in Pitermann (1996) that the first two formants of the

Michel Pitermann The Journal of the Acoustical Society of America 7
corpus presented here ([iai] and [iεi] stimuli) were not synchronized. Hence, two independent
models appeared a better choice. Secondly, there are more mathematical tools available to
guide one-dimensional than two-dimensional modeling.
It is often presumed that an articulatory movement can approximately be described by
a second-order linear model (Sonoda, 1987; Laboissiere, Ostry and Perrier, 1995). A corpus
with simple articulatory movements was chosen (only a front-back-front tongue movement
and a jaw opening-closing may be involved in the production of [iai] and [iεi] stimuli). As a
consequence, and because it is the simplest model, the linear model was firstly selected.
In a revision of Lindblom’s original target undershoot model (Lindblom, 1963), Moon and
Lindblom (1994) proposed to describe the relationship between vowel duration and steady-
state formant frequency by a second-order linear model at critical damping. Although the
mathematical forms of a formant time series and of the relationship between vowel duration
and formant frequency may be different, these two concepts may be closely tied. This model
was therefore chosen too. One may object that the second-order linear model at critical
damping is a special case of the linear model firstly selected, hence a study of the latter
should be sufficient to back up or contradict the former. This point will be discussed in the
“Results” section IID.
A small-order linear model cannot accurately describe an asymmetrical transition. The
first- and second-half of each formant transition were therefore separately modeled. To
model a whole transition, a nonlinear dynamic model having the logistic curve among its
solutions was implemented. It will be called the logistic model in this article.
Fitting the parameters of a dynamic model or of one of its solutions (a kinematic model,
i.e. a curve fitting) may lead to different results. The reason is that the kinematic and
dynamic model equations are different, and the associated cost functions to be minimized
are different too. For example, an exponential is the solution of a first-order linear dynamic
model. Fitting an exponential or a linear model may be different. A linear least-squares
method can be used for the linear model, not for the exponential. Hence, the two fits may
lead to different results.

Michel Pitermann The Journal of the Acoustical Society of America 8
For each dynamic model, one of its solutions was therefore tested: an exponential, a
combination of an exponential and time, and a logistic curve respectively for the linear,
second-order linear at critical damping, and logistic models. Only the exponential was
chosen as the solution for the linear model because, as will be justified in the “Results”
section IID, the first order was sufficient to describe the half-transitions of the corpus.
The model equations are summarized in Table I and their graphics can be seen in Figure 1.
Three general criticisms can be made about most studies dealing with speaking rate and
formants extracted from natural speech. Firstly, many corpora include a lot of different
phonemes in different contexts with few examples of each particular case, e.g. (Kuwabara,
1985; van Son and Pols, 1992). Many sources of variability may thereby be responsible for
the results, and it is difficult to assess the role of each of them. Secondly, only two or three
speaking rates are usually used in those experiments, e.g. (Imaizumi and Kiritani, 1989;
Loevenbruck and Perrier, 1993). Thirdly, the speaking rates are generally not controlled.
The speakers are usually asked to speak slowly, naturally or fast, e.g. (van Son and Pols,
1992; Beautemps, 1993).
In contrast, this article presents an analysis of approximately 2,300 [iai] or [iεi] stim-
uli uttered by two speakers in a carrier sentence at 9 or 10 speaking rates controlled by
metronome for two contrastive stress patterns. The stimuli were categorized during a per-
ceptual task. The first two formants were measured in the stationary parts of the vowels,
and three dynamic and three kinematic models were fitted to the formant transitions. The
contribution of static and dynamic information to the perceptual results was assessed, and
the centralization versus context assimilation issue was discussed in the light of the results.
The dynamic and kinematic models gave a quantitative description of the formant contours
to be related to the perceptual results. The high number of speaking rates controlled by
metronome and the high number of repetitions of each corpus item provided more accuracy
for the relationship between speaking rate and variables than what is usually presented.

Michel Pitermann The Journal of the Acoustical Society of America 9
I. METHOD
A. Speech material
The first two formants of [ia] and [iε] transitions taken from [iVi] segments were analyzed
(V was [a] or [ε]). The segments were excised from two carrier sentence portions [iliVimedia]
taken from two French sentences: “Il y a immediatement souscrit” (“He immediately sub-
scribed to it”) and “Il y est immediatement retourne” (“He immediately returned to it”).
The carrier sentence portions were produced in an anechoic room by two French speaking
male speakers, A and B, at 10 and 9 different speaking rates respectively. All speaking
rates were controlled by metronome. The speakers had to synchronize the beginning of the
carrier segment with a metronome beat, and the plosion of [d] with the following one. The
metronome rhythms were 48, 54, 60, 69, 80, 88, 96, 104, 112 and 120 beats/minute. The low-
est rate was very slow for the speakers, the highest was the limit bearable by each of them,
i.e. the highest rate before they could not synchronize their production and the metronome
beats. The speakers were asked to produce the whole corpus placing a contrastive stress on
V, then a second time without any contrastive stress. I controlled the recording sessions, and
each combination of speaking rate, contrastive stress and vowel was repeated until 30 sat-
isfying examples were produced. Around 4,600 formant transitions were therefore analyzed
(2 vowels × 2 contrastive stresses × 19 speaking rates × 30 repetitions × 2 formants).
The signals were recorded with a microphone (NEUMAN U 87 P 48) connected to a
8-kHz low-pass filter and sampled at 32 kHz by a DAT recorder (SONY PCM-2300, 16-
bit recording). The cutoff frequency of the low-pass filter was 8,000 Hz, and its slope was
360 dB/octave. The corpus was then digitally transfered from the DAT to a computer. The
sampling frequency was thereafter reduced to 16 kHz on the computer by taking away one
sample out of two. The 8-kHz low-pass filter used during the recording sessions avoided any
potential aliasing problems when the sampling frequency was reduced from 32 to 16 kHz.
Michel Pitermann The Journal of the Acoustical Society of America 10
B. Perceptual analysis
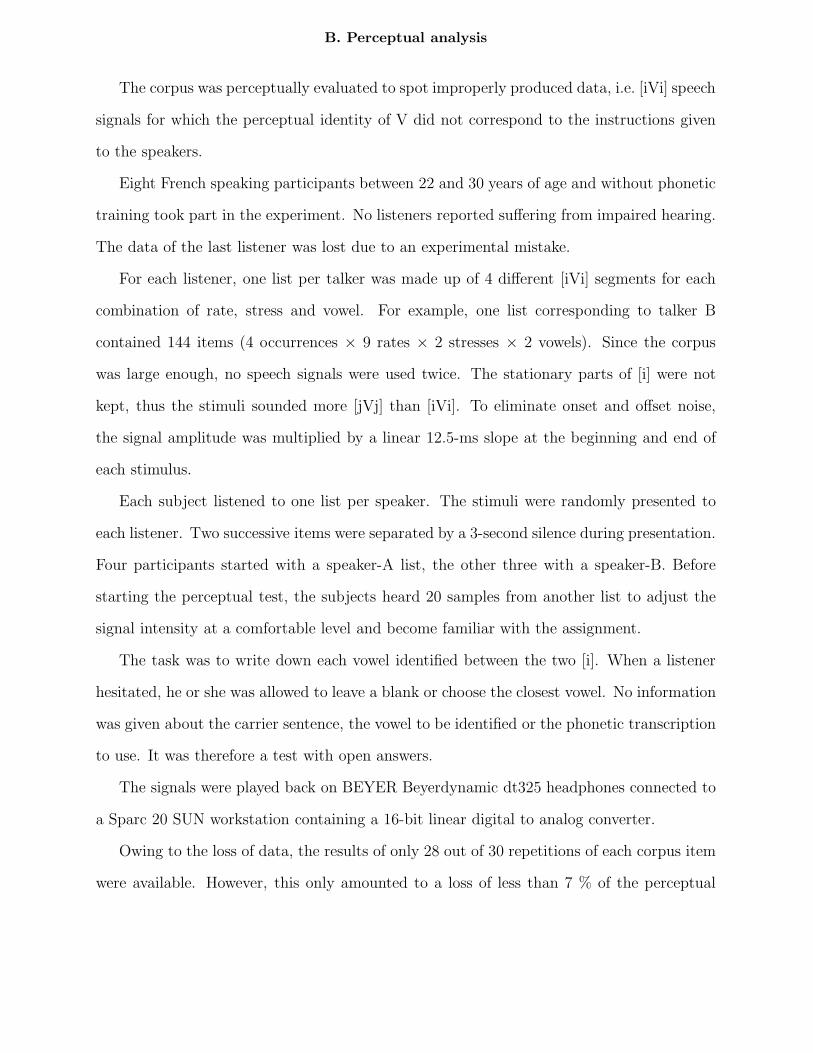
The corpus was perceptually evaluated to spot improperly produced data, i.e. [iVi] speech
signals for which the perceptual identity of V did not correspond to the instructions given
to the speakers.
Eight French speaking participants between 22 and 30 years of age and without phonetic
training took part in the experiment. No listeners reported suffering from impaired hearing.
The data of the last listener was lost due to an experimental mistake.
For each listener, one list per talker was made up of 4 different [iVi] segments for each
combination of rate, stress and vowel. For example, one list corresponding to talker B
contained 144 items (4 occurrences × 9 rates × 2 stresses × 2 vowels). Since the corpus
was large enough, no speech signals were used twice. The stationary parts of [i] were not
kept, thus the stimuli sounded more [jVj] than [iVi]. To eliminate onset and offset noise,
the signal amplitude was multiplied by a linear 12.5-ms slope at the beginning and end of
each stimulus.
Each subject listened to one list per speaker. The stimuli were randomly presented to
each listener. Two successive items were separated by a 3-second silence during presentation.
Four participants started with a speaker-A list, the other three with a speaker-B. Before
starting the perceptual test, the subjects heard 20 samples from another list to adjust the
signal intensity at a comfortable level and become familiar with the assignment.
The task was to write down each vowel identified between the two [i]. When a listener
hesitated, he or she was allowed to leave a blank or choose the closest vowel. No information
was given about the carrier sentence, the vowel to be identified or the phonetic transcription
to use. It was therefore a test with open answers.
The signals were played back on BEYER Beyerdynamic dt325 headphones connected to
a Sparc 20 SUN workstation containing a 16-bit linear digital to analog converter.
Owing to the loss of data, the results of only 28 out of 30 repetitions of each corpus item
were available. However, this only amounted to a loss of less than 7 % of the perceptual

Michel Pitermann The Journal of the Acoustical Society of America 11
data.
C. Formant measurements
Formant frequency estimation is a mathematically ill-formed problem, i.e. there are no
theorems proving that a solution exists, that a solution is unique and that a solution con-
tinuously depends on the initial conditions. Hence, several heuristics may be tried for each
problem. In this study, the outcome of dynamically modeling a formant transition may be
influenced by the quality of the formant extractor used. Several formant estimate proce-
dures were therefore compared: a pure LPC method (Atal and Hanauer, 1971), a method
combining the results of one cepstral and two LPC algorithms (Soquet, 1995a), and a pitch-
synchronous method (Soquet, 1995b). The pitch-synchronous method produced cleaner
formant time series than the two other algorithms, but all techniques led to the same con-
clusion as far as dynamic modeling was concerned. I thereby kept the LPC-based formant
extractor to stick to the simplest tool.
The speech signals were sampled at 16 kHz, then modified by means of a (1 − 0.95z)
preemphasis filter (in z-transform notation). Every 9 ms, the first two formant frequencies
were estimated by means of an 18 order covariance LPC (Linear Predictive Coding) analysis
in a 26-ms rectangular window. The lowest pole frequency was assigned to the first formant,
the second pole frequency to the second formant.
All formant time series were visually examined to check for formant misclassifications.
Formant insertions were manually erased. When a formant omission was found, the time
series of the first two formants of the speech signal were reestimated by means of a LPC
model with a different order. If no orders in the [10,20] interval could produce two time
series without omissions, the speech signal was discarded. Less than 1 % of the corpus was
rejected this way.
Values 0.70, 0.75, 0.80, 0.85, 0.90 and 0.95 were tested for the preemphasis filter. Since
these values did not lead to different results as far as dynamic modeling of formant transitions

Michel Pitermann The Journal of the Acoustical Society of America 12
was concerned, 0.95 was selected in order to be consistent with the literature (Makhoul,
1975).
For each corpus item, formant frequencies of vowel [V] were defined as the F1 maximum
and F2 minimum of their time series. This means that a formant frequency was measured
at the time coordinate for which the time series took on a nearly horizontal slope inside
segment [V].
D. Formant modeling
1. Choice of models
Three dynamic models and one solution of each model was fitted to each formant tran-
sition. The three dynamic models were a linear, a second-order linear at critical damping
and a logistic model. The three kinematic models were an exponential, a combination of
exponential and time, and a logistic curve. The model equations are summarized in Table I
and their graphics can be seen in Figure 1.
2. Parameters estimations
The coefficients of the six models were estimated by means of least-squares methods
for each formant transition. Because there were approximately 4,600 formant transitions
in the corpus, around 4,600 sets of parameters were estimated for each model. The merit
function was the classical sum of the squared differences between model-generated and mea-
sured values. The coefficients of the linear model (1) that gave rise to the minimum merit
function were determined by means of a conventional linear method. The coefficients of the
nonlinear difference equation (5) and curves (2), (4) and (6) were estimated by means of
the Levenberg-Marquardt algorithm. This is an optimizer that gradually switches from a
steepest descent method to a quadratic approximation when the merit function approaches
a minimum (Press, Teukolsky, Vetterling and Flannery, 1992).

Michel Pitermann The Journal of the Acoustical Society of America 13
The merit function of the second-order linear model at critical damping (3) was
E =1
N − 2
N∑
i=3
(xi − a0 − a1xi−1 +a2
1
4xi−2)
2 (7)
where E is the merit function, xi is the ith sample of the time series, N is the length of the
time series, and a0 and a1 are the parameters of the model. Setting to 0 the first derivative
of the merit function with respect ot a0 and a1 leads to a nonlinear system of two equations:
a0 = xn − a1xn−1 +a21
4xn−2
0 = σ2xn−2
(a1
2)3 − 3σxn−1xn−2(
a1
2)2 + (2σ2
xn−1+ σxnxn−2)(
a1
2) − σxnxn−1
(8)
where:
xn−k =1
N − 2
N∑
i=3
xi−k (9)
σ2xn−k
=1
N − 2
N∑
i=3
(xi−k − xn−k)2 (10)
σxn−kxn−l=
1
N − 2
N∑
i=3
(xi−k − xn−k)(xi−l − xn−l). (11)
The procedure to estimate a0 and a1 for a time series xi was straightforward. The third-
degree polynomial (8) was solved to produce 1 or 3 real roots. For each a1 (1 or 3 values),
the corresponding a0 value was calculated by means of the first equation of (8). The couple
(a0, a1) that gave rise to the minimum merit function (7) was selected.
The order of the linear difference equation (1) was determined by analyzing the random
variable (ai − ai)/σ(ai), where ai is the ith unknown coefficient of the model for the full
population of all possible formant transitions, ai is its estimate based on a sample of the
population, and σ(ai) is the estimate of its standard error. When the conditions of applica-
tion of a linear regression are met, this variable is characterized by a t-distribution (Spiegel,
1988, chapter 14, pp. 300). The null hypothesis “H0 : ai = 0” could thereby be tested at
0.05 level for any coefficient of the model. The model order was iteratively increased by 1
until the null hypothesis for the highest-order coefficient ak could not be rejected. The last
but one order was selected.

Michel Pitermann The Journal of the Acoustical Society of America 14
The [iVi] segmentation procedures were the following. Complete formant transitions
between preceding [i] and [V] were modeled by means of the logistic models (5) and (6).
The first sample of a transition was manually chosen near the end of the horizontal part of
the formant time series of the [i], the last sample was the next maximum for F1 or minimum
for F2.
In contrast to models (5) and (6), only the half-transitions before or after the points of
inflection were modeled by means of the four other models. The position of each point of
inflection was determined by means of parameter t0 of the logistic curve (6). To increase
t0-estimate accuracy, a speaker was assumed to use the same articulatory gesture for the 30
repetitions of a corpus item. Accordingly, the 30 transitions were presumed to be charac-
terized by a single coefficient vector (a, b, c) while each transition assumed a different time
position t0. I used the Viterbi algorithm in order to estimate a unique (a, b, c) vector and 30
different t0 values simultaneously using the 30 transitions (Viterbi, 1967). The method con-
sisted of alternatively estimating either one structural vector (a, b, c) or the 30 time positions
t0 while keeping the other coefficient class fixed until convergence was achieved.
II. RESULTS
A. Transition length and speaking rate
Figure 2 shows how the duration of the F1 transitions varied with speaking rate. Each
point of the plot is a median of 30 durations computed from 30 repetitions of a corpus item
in one speaking rate and contrastive stress condition. The same pattern was observed for
F2.
The graphics show that formant transition duration decreased as speaking rate increased.
A floor effect appeared after 80 beats/minute, although the speakers continued to increase
their speaking rate. Other parts of the segment sentence were therefore shortened for the
highest speaking rates.

Michel Pitermann The Journal of the Acoustical Society of America 15
B. Perceptual evaluation of the corpus
The purpose of the perceptual analysis was to spot the [iVi] tokens that were incorrectly
produced.
Around 99.5 % of vowels V were labeled /a/, /ε/ or /e/. Because [e]–[ε] distinction
depended on regional accent, and because the listeners did not receive any references, labels
/e/ were replaced by /ε/. This way, 99.5 % of the labels became /a/ or /ε/, and most
mistakes were considered to be confusions between [a] and [ε].
More than 90 % of vowels [ε] were correctly identified for 35 speaking rate and contrastive
stress groups out of 38 (38 = 9 rates × 2 stresses + 10 rates × 2 stresses). The identification
scores of the remaining 3 conditions were 86 %.
Figure 3 shows the average identification scores normalized by the total number of an-
swers of the seven listeners for vowel [a] as a function of speaking rate.
More than 90 % of speaker A’s [a] were correctly identified for the seven lowest speaking
rates. The identification scores were below 85 % for the other speaking rates.
The identification scores of speaker B’s [a] were above 90 % for only 9 categories out of 18
(the stressed [a] produced at the six lowest speaking rates and the unstressed [a] produced
at the three lowest ones). For the other categories, the identification scores varied between
18 and 68 %.
C. Formant measurements
Processing about 4,600 formant transitions by means of six dynamic or kinematic models
led to around 27,600 fits. Due to noise, some of them were physically impossible and should
be considered as aberrations. To lower their impact on the statistical description of the
corpus, the median and a similar measure to semi-interquartile range were chosen instead
of the mean and square deviation. For consistency, the formants were described in the same
way.

Michel Pitermann The Journal of the Acoustical Society of America 16
Instead of the semi-interquartile range, the semi-68-% range leaving 16 % instead of
25 % of the elements in each tail of the distribution was used. The advantage of the semi-
68-% compared to the semi-interquartile range is that it has the same value as the standard
deviation when the distribution is Gaussian. It is more convenient for comparisons when
different statistical feature sets are used to describe the data.
Table II shows the medians and semi-68-% ranges of the first two formants of [i], [ε] and
[a] for both speakers. Those values were computed across all repetitions, speaking rates and
stresses. The variability of [i]’s formant frequencies was lower than [a]’s but similar to [ε]’s.
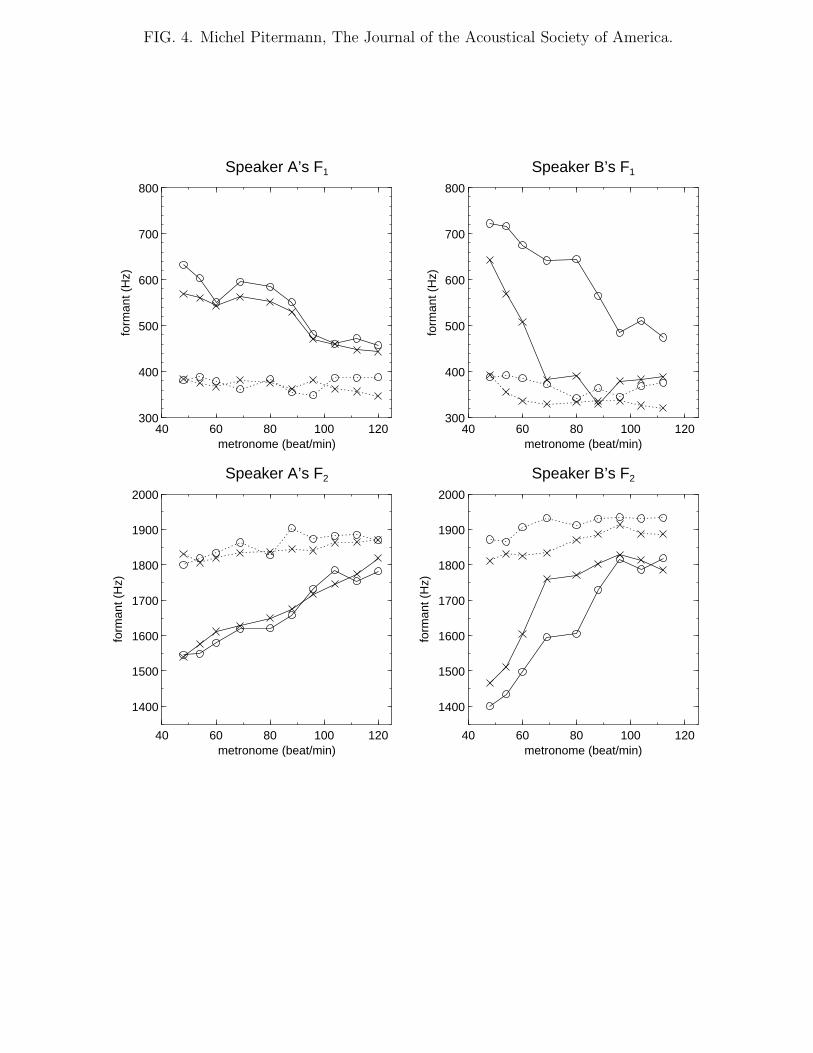
Figure 4 shows the medians of the first two formants of each speakers’ [ε] and [a] computed
for each set of 30 repetitions of a corpus item for all combinations of speaking rate and
contrastive stress. The data is plotted as functions of speaking rate measured in metronome
rhythm. Table III shows the results of two-factor (rate and stress) analyses of variance for
all combinations of speaker, vowel and formant. All analyses of variance were carried out
with a linear additive model with replication. Interactions between factors were included in
the model.
D. Model parameters
The first step to analyze the corpus using a linear model (1) was to estimate its order
k. To validate the first order, the null hypothesis that a1 was equal to 0 was tested for each
formant half-transition. The hypothesis was rejected at 0.05 level in 97.7 % of the cases.
Hence a1 should be considered as different from 0, so the first order was mandatory. For the
second order, the null hypothesis was tested for a2, and it was rejected at 0.05 level in 4.5 %
of the cases. Thus a2 could not be considered as different from 0, and the first order was
sufficient to model the formant half-transitions. Accordingly, we used a first-order linear
model and one of its solutions, an exponential.
Because a first-order linear model was sufficient to describe the data, the second-order
model at critical damping proposed in Moon and Lindblom (1994) may appear inadequate.

Michel Pitermann The Journal of the Acoustical Society of America 17
Being able to reject higher-order linear models, however, does not imply that a first-order
linear model was underlying the data. It only means that, with the number of points
available for each fit under the noise condition, no information could be found about higher-
order parameters by a classical linear regression.
When a constraint between model parameters is added, the parameter space suitable
for a fit is reduced. For example, when a linear second-order model at critical damping is
responsible for some data, the noise can hide information about the second order. If the
topology of the cost function is complex with many local minima, the fitting procedure may
be easily caught in a local minimum far away from the global one. However, adding the
critical constraint to the fitting process reduces the search in a 3-D space (a0, a1 and a2
from equation (1) of Table I) to a search in a 2-D space (a0 and a1 from equation (3)),
i.e. in a plane. Hence the algorithm may converge to a better local minimum or the global
one because the search is better guided by the fitting procedure. For this reason, a second-
order linear model at critical damping was also fitted to the transitions to follow Moon and
Lindblom (1994) suggestion.
In the two selected linear models (1) and (3), a1 indicated how fast a transition left an
asymptote or came close to it and was dampened near it. The lower a1, the faster a formant
left or approached its asymptotic value and was dampened. It may therefore be expected
that fast transitions were modeled with a low a1 value.
Figures 5 and 6 show the medians of the a1 estimates of the first-order linear model for
each set of 30 repetitions of a corpus item for each combination of speaker, vowel, formant,
contrastive stress and speaking rate. The data is presented as functions of speaking rate
measured in metronome rhythm. Tables IV and V show the results of two-factor (stress and
rate) analyses of variance for all combinations of speaker, vowel and formant. Figure 5 and
Table IV refer to the first-half transitions, Figure 6 and Table V to the second-half.
The results produced by means of the two linear models (1) and (3) were slightly different
in their details, but the conclusions of all analyses were the same. Therefore, only the first-
order linear model will be discussed in the rest of the paper.

Michel Pitermann The Journal of the Acoustical Society of America 18
The exponential (2) and the kinematic model (4) were also fitted to the formant half-
transitions. Since the parameters a1 of the dynamic linear models were linked to their
kinematic equivalents by a1 = exp(−q∆t), this value was computed for the kinematic models
in order to compare the dynamic and kinematic results. Because the results were virtually
identical and the kinematic models did not add any new information, those kinematic models
will not be considered further in this paper.
Up to this point, only half-transition modeling has been presented because low-order
linear models with constant parameters could not describe a full transition. The logistic
models (5) and (6) permitted complete transition modeling.
In the logistic models, d of (5) and b of (6) played a similar role than a1 and q of the
linear (1) and exponential (2) models, and the relation d = exp(−b∆t) was valid. In other
words, d or b controlled the models when t → ±∞, i.e. they described how a formant left
its first asymptote and how it was dampened near the second one.
Figure 7 shows the medians of the d values of each set of 30 repetitions of a corpus item
for each combination of speaker, vowel, formant, contrastive stress and speaking rate. The
data is plotted as functions of speaking rate measured in metronome rhythm. A smaller d
value means that the formant left the initial value and was dampened near the final one more
abruptly. Table VI shows the results of two-factor (rate and stress) analyses of variance for
all combinations of speaker, vowel and formant.
Once again, dynamic or kinematic modeling produced approximately the same results.
The kinematic ones were therefore not included in this paper.
Because a second-half transition may be more influenced by following gestures than the
first-half, the logistic models was also fitted to the first-half transitions. Modeling a first-half
or a full transition led to similar results, except that there was more noise in the fits with the
first-half. However, this increase in noise was expected because fewer points were included
in the fits. The tables are not presented because they did not add any new information.
The analysis simply indicated that the first- and second-half transitions were not different
enough to lead to different conclusions.

Michel Pitermann The Journal of the Acoustical Society of America 19
Table VII shows standard linear Pearson correlations measured between the perceptual
scores and the median of the formant measurements or the medians of the model parameters.
Figure 8 plots in the (F1, F2) plane the formant frequencies measured in the steady-state
parts of the [a] and [ε] stimuli correctly identified in the perceptual test. Figure 9 shows a
similar plot for the dynamic parameter a1 of the linear model (1) fitted to the second-half
transitions of F1 or F2 respectively for the x or y axis. The two ellipses formed by each
vowel in the (F1, F2) space are basically disjoint while the two vowels completely overlap in
the dynamic parameter space. The same overlap was found for the parameter a1 fitted to
the first-half formant transitions and for the parameter d of the nonlinear model (5) fitted
to complete formant transitions.
III. DISCUSSION
As explained in the “Introduction” section, fitting a dynamic or an equivalent kinematic
model can lead to different results. Both fits were compared for each model, and both fits
produced similar results every-time. This simply means that the minimization processes of
the merit functions of each dynamic and corresponding kinematic models found a minimum
in the same area of their parameter spaces. Hence both kinds of models were equivalent as
far as the analysis of their fitted parameters was concerned.
Figure 4 shows that the first two formants frequencies measured at the slowest speaking
rate were close to (400, 1800) Hz for both speakers’ [ε] and (600 − 700, 1400− 1500) Hz for
speakers’ [a]. Table II show that the first two formant frequencies of the context were close
to (250, 1950) Hz with small variation around those values. A contextual assimilation should
therefore decrease [a] and [ε] F1, and increase their F2 for high speaking rates. In contrast,
a centralization effect should not modify the [a] formant values much, but should increase
[i] and [ε] F1, and decrease their F2. Figure 4 shows a contextual assimilation for both
speakers because [ε] and [a] formant frequencies were shifted away from a central position
toward [i] formants values for high speaking rates. Table III shows that the dependence of

Michel Pitermann The Journal of the Acoustical Society of America 20
the formants on speaking rate and contrastive stress was statistically significant at 0.05 level
in all cases.
This conclusion should not be generalized to any phoneme and context. The corpus was
purposely chosen to make [i] stable and [ε] and [a] varying. Firstly, French [i] is known to
need more articulatory accuracy and to have more stable formants than other vowels (Majid,
Abry, Boe and Perrier, 1987). Secondly, the carrier sentence [iliVimedia] was built to favor
the context instead of V.
The speakers did not manage their contrastive stress in the same way. Firstly Figure 4
shows that speaker A’s formants were less influenced by contrastive stress than speaker B’s,
specially for [a] (each pair of solid or dotted line was closer for speaker A than B). Secondly
speaker A’s production seemed more regular than speaker B’s. This can be seen on Figure 4
because speaker B’s unstressed [a] uttered at the six highest speaking rates and those uttered
at the three lowest ones seem different. The first two formants of the former were similar
to the speaker’s [ε] formants while the formants of the latter were clearly distinct. The
perceptual results support this hypothesis because the unstressed [a] identification scores
were less than 50 % correct for the six highest speaking rates while they were equal to 100 %
in the three other cases. On the other hand speaker B’s stressed [a] formants were shifted
more gradually toward the contextual formant values when speaking rate was increased.
This pattern suggests that speaker B did not produce his stressed and unstressed [a] in the
same way, like the other speaker did.
It is common to find data in the literature showing that speakers can increase, keep
constant or decrease their articulatory strength when they stress a syllable or speak faster
(Gay, Ushijima, Hirose and Cooper, 1974; Kuehn and Moll, 1976; Sonoda, 1987; Guenther,
1995; Marchal and Meynadier, 1996). Figure 6 suggests that the parameter a1 of the linear
model (1) fitted to the second-half transitions tended to be smaller for high speaking rates but
did not exhibit any consistent trend for contrastive stress. This result means that formants
approached their F1 maximum or F2 minimum faster for high speaking rates. Even if the
trend was consistent, table V shows that it was seldom significant at 0.05 level. It could

Michel Pitermann The Journal of the Acoustical Society of America 21
mean that the trend was partly masked by the noise and that processing a bigger corpus
would confirm the results. Figure 5 shows that the results regarding the first-half transitions
were less regular.
Figure 7 shows that modeling whole transitions by means of the logistic model (5) did not
change the previous trend, although this trend appeared less clearly. The parameter d was
smaller for high speaking rates and the results were less clear for stress. This means that the
formants tended to leave their initial and reached their final values more abruptly for high
speaking rates. Once again, the trend was not always significant but consistent. The trend
suggests that the speakers used more force in their articulatory gestures for high speaking
rates. But the nonlinear relationships between the articulatory and acoustical levels may be
misleading and this conclusion must be confirmed by articulatory or EMG data.
Experiments showed that vowels can be better categorized by dynamic than static in-
formation in some situations (Strange, 1989b; Strange, 1989a; Cassidy and Harrington,
1992; Beautemps, 1993; Jenkins et al., 1999). Table VII shows that the absolute values
of the linear correlations between the perceptual scores and the medians of speakers’ for-
mants measured in the vowel steady-state parts were always greater than 0.8 for [a]. Because
the perceptual scores of [ε] were always close to 100 %, the correlations between those scores
and the formant values are not informative. Only the [a] scores will be discussed.
It is interesting to find such a high correlation between the perceptual scores and the
formant measurements for [a] because those measurements were made in the steady-state
part of the vowels. It suggests that static information was more important than expected.
To investigate this issue, the formant measurements of the 1,900 vowels [a] and [ε] correctly
identified in the perceptual experiment were plotted in the (F1, F2) plane in Figure 8. In
this acoustical representation, all but 40 vowels [a] and [ε] out of 1,900 formed two ellipses
without intersection, i.e. [a] and [ε] could be classified in this representation.
This result contrasts with Beautemps (1993) results showing greater overlap between [a]
and [ε] of a smaller but similar corpus. However he only used 40 stimuli produced by one
speaker so his results should not be generalized.

Michel Pitermann The Journal of the Acoustical Society of America 22
On the other hand my results corroborate one Peterson and Barney (1952) finding.
They showed many measurements of the first two formants of 10 English vowels in the
(F1, F2) plane, and the vowels overlapped in this space. Then, they carried out a perceptual
experiment presenting the vowels with minimal context to listeners. When only the tokens
correctly identified in the perceptual assignment were plotted in the (F1, F2) plane, the
overlap between the vowels almost disappeared. Similarly, as long as a vowel in my corpus
was correctly perceived, the first two formants were sufficient to classify it.
To summarize the perceptual results so far, static information was sufficient to explain
them. But we still do not know if dynamic information could be used by the listeners to
identify the vowels in the perceptual task. Figure 9 shows that the parameter a1 of the linear
model (1) fitted to the second-half formant transitions could not distinguish the [a] from
[ε] speech signals for the subset of stimuli correctly identified in the perceptual assignment.
The same results were also found for the first-half transitions and for the parameter d of
the nonlinear model (5) fitted to whole transitions. This suggests that the part of formant
dynamics encoded in the model parameters did not play a major role in the perceptual task,
i.e. the models did not isolate an important dynamic parameter for the perception.
Furthermore, the linear correlations between the perceptual scores and the medians of
the dynamic parameter estimates are shown in Table VII. The correlations are lower and
less consistent for the model parameters than formant measurements.
It is not perfectly clear why the dynamic parameters did not capture any feature corre-
lated with the perceptual results. A first hypothesis is that the experiment could correspond
to a situation where static information was primary used. A second hypothesis is that the dy-
namic models inadequately described formant dynamics or that the fitting procedures were
inaccurate. Visual inspection of modeled and real formant contours suggested that dynamics
was properly described by the models (see an example on Figure 4), but future work should
include a study of modeling error. Because the formant values measured in the steady-state
part of the vowels were sufficient to explain the perceptual results, it seems plausible that
formant dynamics could have played a secondary role in the perceptual assignment.

Michel Pitermann The Journal of the Acoustical Society of America 23
In summary, the first two formants measured in the steady-state parts of the vowels were
highly correlated with the perceptual results and were sufficient to explain them. Conversely
the dynamic parameters of the models were poorly correlated with the perceptual results
and were not sufficient to explain them. This does not imply that no dynamic information
was used in the perceptual task, but it does not back up dynamic specification of the vowels.
IV. CONCLUSION
A corpus of [iai] and [iεi] was produced by two speakers in a carrier sentence at different
speaking rates with two contrastive stress patterns. The corpus was perceptually analyzed,
the first two formant frequencies were measured in the static parts of [a] or [ε], and the
formant time series were dynamically and kinematically modeled. Relationships between
the perceptual results, the formant measurements and the model parameters were assessed.
The analysis of the first two formant frequencies measured in the steady-state part of the
vowels showed a contextual assimilation instead of a centralization effect. The same data
also suggests that the speakers did not manage their contrastive stress in the same way.
The analysis of model parameters showed that dynamic or kinematic modeling led to the
same results. The formant transitions were sharper for high speaking rate, but no systematic
trends were found for contrastive stress.
Relationships between the perceptual scores and the formants measurements or model
parameters did not support the importance of dynamic specification of vowels.
ACKNOWLEDGMENTS
This research was mainly supported by a grant from the Fondation Van Buuren and
mainly carried out in the Institute of Modern Languages and Phonetics in Bruxelles. Some
parts of the work were also done in the Institute of Phonetics in Aix-en-Provence with
the support of a TMR grant from the European Community, and at Queen’s University in

Michel Pitermann The Journal of the Acoustical Society of America 24
Kingston, Canada with the support of a Natural Sciences and Engineering Research Council
grant from the Government of Canada No 388 429 43.
I am grateful to Jean Caelen and Jean-Luc Schwartz for selecting the subject and for
their valuable suggestions. I also thank Jean Schoentgen for his helpful discussions, as well
as Anders Lofqvist and three anonymous referees for their important suggestions. I express
my gratitude to Kevin Munhall and Jeff Jones for their pertinent and constructive comments
and for translating my personal English into a real language.

Michel Pitermann The Journal of the Acoustical Society of America 25
REFERENCES
Andruski, J. E. and Nearey, T. M. (1992), ‘On the sufficiency of compound target specifica-
tion of isolated vowels and vowels in /bVb/ syllables’, The Journal of the Acoustical Society
of America 91(1), 390–410.
Atal, B. S. and Hanauer, S. L. (1971), ‘Speech analysis and synthesis by linear prediction of
the speech wave’, The Journal of the Acoustical Society of America 50(2 (Part 2)), 637–655.
Beautemps, D. (1993), Recuperation des gestes de la parole a partir de trajectoires forman-
tiques: Identification de cibles vocaliques non-atteintes et modeles pour les profils sagittaux
des consonnes fricatives, PhD thesis, INPG, Grenoble.
Broad, D. J. and Clermont, F. (1987), ‘A methodology for modeling vowel formant contours
in CVC context’, The Journal of the Acoustical Society of America 81(1), 155–165.
Carre, R., Chennoukh, S., Jospa, P. and Maeda, S. (1996), The ears are not sensitive to
certain coarticulatory variations: Results from VCV synthesis/perceptual experiments, in
‘1st ESCA Tutorial and Research Workshop on Speech Production Modeling: From Control
Strategies to Acoustics’, European Speech Communication Association, Autrans, France,
pp. 13–16.
Carre, R., Chennoukh, S., Lindblom, B. and Divenyi, P. (1994), ‘On the perceptual caracter-
istics of ”speech gestures”’, The Journal of the Acoustical Society of America 96, 3326–3326.
ASA meeting held in Austin.
Carre, R. and Mrayati, M. (1992), ‘Distinctive regions in acoustic tubes. speech production
modelling’, Journal of Acoustique 5, 141–159.
Cassidy, S. and Harrington, J. (1992), Investigating the dynamic structure of vowels using
neural networks, in ‘Proceedings of the Fourth Australian International Conference on
Speech Science and Technology’, Australian Speech Science and Technology Association,
University of Queensland, Brisbane, Australia, pp. 495–500.

Michel Pitermann The Journal of the Acoustical Society of America 26
Delattre, P., Liberman, A. M., Cooper, F. S. and Gerstman, L. J. (1952), ‘An experimental
study of the acoustic determinants of vowel color; observations on one- and two-formant
vowels synthesized from spectrographic patterns’, Word 8, 195–210.
Divenyi, P., Lindblom, B. and Carre, R. (1995), The role of transition velocity in the per-
ception of V1V2 complexes, in Elenius and Branderud (1995), pp. 258–261.
Elenius, K. and Branderud, P., eds (1995), Proceedings of the XIIIth International Congress
of Phonetic Sciences, Department of Speech Communication and Music Acoustics, KTH
(Royal Institute of Technology), and the Department of Linguistics, Stockholm University,
Stockholm, Sweden.
Gay, T., Ushijima, T., Hirose, H. and Cooper, F. S. (1974), ‘Effect of speaking rate on labial
consonant-vowel articulation’, Journal of Phonetics 2, 47–63.
Guenther, F. H. (1995), ‘Speech sound acquisition, coarticulation, and rate effects in a neural
network model of speech production’, Psychological Review 102(3), 594–621.
Helmholtz, H. F. (1885 - 1954), On the Sensations of Tone, (Translated by A. J. Ellis.
Reprinted in 1954). New York: Dover.
Imaizumi, S. and Kiritani, S. (1989), ‘Effect of speaking rate on formant trajectories and
inter-speaker variations’, Ann. Bull. RILP 23, 27–37.
Jenkins, J. J., Strange, W. and Trent, S. A. (1999), ‘Context-independent dynamic infor-
mation for the perception of coarticulated vowels’, The Journal of the Acoustical Society of
America 106(1), 438–448.
Joos, M. (1948), Acoustic phonetics, in L. S. of America, ed., ‘Language Monograph No 23’,
Baltimore, MD: Waverly.
Koopmans-van Beinum, F. J. (1980), Vowel contrast reduction, an acoustic and perceptual
study of Dutch vowels in various speech conditions, PhD thesis, University of Amsterdam.

Michel Pitermann The Journal of the Acoustical Society of America 27
Kuehn, D. P. and Moll, K. L. (1976), ‘A cineradiographic study of VC and CV articulatory
velocities’, Journal of Phonetics 4, 303–320.
Kuwabara, H. (1985), ‘An approach to normalization of coarticulation effects for vowels in
connected speech’, The Journal of the Acoustical Society of America 77(2), 686–694.
Laboissiere, R., Ostry, D. and Perrier, P. (1995), A model of human jaw and hyoid motion
and its implications for speech production, in Elenius and Branderud (1995), pp. 60–67.
Lindblom, B. E. F. (1963), ‘Spectrographic study of vowel reduction’, The Journal of the
Acoustical Society of America 35(11), 1773–1781.
Lindblom, B. E. F. and Studdert-Kennedy, M. (1967), ‘On the role of formant transitions
on vowel recognition’, The Journal of the Acoustical Society of America 42(4), 830–843.
Loevenbruck, H. and Perrier, P. (1993), Vocalic reduction : Prediction of acoustic and
articulatory variabilities with invariant motor commands, in ‘Proceedings of Eurospeech’93’,
Vol. 1, catalyst consult, ESCA, Berlin, Germany, pp. 85–88.
Majid, R., Abry, C., Boe, L.-J. and Perrier, P. (1987), ‘Fonctions de macro-sensibilite
articulatori-acoustique, pour le systeme vocalique du francais, a partir d’un modele articu-
latoire du conduit vocal’, Bulletin du Laboratoire de la Communication Parlee de Grenoble
1A, 133–157.
Makhoul, J. (1975), ‘Linear prediction: A tutoral review’, Proceedings of the IEEE
63(4), 561–580.
Marchal, A. and Meynadier, Y. (1996), Coarticulation in /kl/ sequences in French: a multi-
sensor investigation of the timing of lingual gestures, in ‘Proceedings of the 6th Australian
International Conference on Speech Science and Technology’, Australian Speech Science
and Technology Association inc, Adelaide, Australia, pp. 434–438.
Moon, S.-J. and Lindblom, B. (1994), ‘Interaction between duration, context, and speaking

Michel Pitermann The Journal of the Acoustical Society of America 28
style in English stressed vowels’, The Journal of the Acoustical Society of America 96(1), 40–
55.
Nabelek, A. K. and Ovchinnikov, A. (1997), ‘Perception of nonlinear and linear formant
trajectories’, The Journal of the Acoustical Society of America 101(1), 488–497.
Nearey, T. M. (1989), ‘Static, dynamic, and relational properties in vowel perception’, The
Journal of the Acoustical Society of America 85(5), 2088–2113.
Nearey, T. M. and Assmann, P. F. (1986), ‘Modeling the role of inherent spectral change in
vowel identification’, The Journal of the Acoustical Society of America 80(5), 1297–1308.
Peterson, G. and Barney, H. (1952), ‘Control methods used in a study of vowels’, The
Journal of the Acoustical Society of America 24, 175–184.
Pitermann, M. (1996), Evaluation experimentale de la theorie des cibles formantiques dans
le cadre de la production des voyelles, PhD thesis, Universite Libre de Bruxelles.
Polka, L. and Bohn, O.-S. (1996), ‘A cross-language comparison of vowel perception in
English-learning and German-learning infants’, The Journal of the Acoustical Society of
America 100(1), 577–592.
Pols, L. C. W. and van Son, R. J. J. H. (1993), ‘Acoustics and perception of dynamic vowel
segments’, Speech Communication 13, 135–147.
Press, W. H., Teukolsky, S. A., Vetterling, W. T. and Flannery, B. P. (1992), Numerical
Recipes in C, second edn, Cambridge University Press, chapter 15: Modeling of Data,
pp. 681–688.
Sonoda, Y. (1987), ‘Effect of speaking rate on articulatory dynamics and motor event’,
Journal of Phonetics 15, 145–156.
Soquet, A. (1995a), A cooperative approach to formant extraction, in Elenius and Branderud
(1995), pp. 448–451.

Michel Pitermann The Journal of the Acoustical Society of America 29
Soquet, A. (1995b), Etude comparee de representations acoustiques et articulatoires du
signal de parole pour le decodage acoustico-phonetique. Application a la classification de
voyelles et a la determination du lieu d’articulation des occlusives, PhD thesis, Universite
Libre de Bruxelles.
Spiegel, M. R. (1988), Statistics, 2/ed, Schaum’s Outline Series, McGraw-Hill, Inc.
Stevens, K. N. and House, A. S. (1963), ‘Perturbation of vowel articulations by consonantal
context: an acoustical study’, Journal of Speech and Hearing Research 6(2), 111–128.
Strange, W. (1989a), ‘Dynamic specification of coarticulated vowels spoken in sentence con-
text’, The Journal of the Acoustical Society of America 85(5), 2135–2153.
Strange, W. (1989b), ‘Evolving theories of vowel perception’, The Journal of the Acoustical
Society of America 85(5), 2081–2087.
Strange, W. and Bohn, O.-S. (1998), ‘Dynamic specification of coarticulated German vow-
els: Perceptual and acoustical studies’, The Journal of the Acoustical Society of America
104(1), 488–504.
van Son, R. J. J. H. (1993), Vowel perception: a closer look at the literature, in ‘Proceedings
of the Institute of Phonetic Sciences, University of Amsterdam’, Vol. 17, pp. 33–64.
van Son, R. J. J. H. and Pols, L. C. W. (1992), ‘Formant movements of Dutch vowels in
a text, read at normal and fast rate’, The Journal of the Acoustical Society of America
92(1), 121–127.
Viterbi, A. (1967), ‘Error bounds for convolutional codes and an asymptotically optimum
decoding algorithm’, IEEE Trans. formation Theory IT-13, 260–269.
Watson, C. I. and Harrington, J. (1999), ‘Acoustic evidence for dynamic formant trajectories
in Australian English vowels’, The Journal of the Acoustical Society of America 106(1), 458–
468.

Michel Pitermann The Journal of the Acoustical Society of America 30
TABLES
TABLE I. Equations of the dynamic and kinematic models. Symbol xn represents the formant
frequency at time coordinate n∆t; a, ai, b, c, c1, c2, d, p, q, t0, and x∗ are the model parameters;
k is the order of linear model (1); ∆t is the sampling step (i.e. 9 ms).
dynamic models kinematic models
linear & exp. xn = a0 +∑k
i=1 aixn−i (1) xn = x∗ + pe−qn∆t (2)
critical damping xn = a0 + a1xn−1 −a214 xn−2 (3) xn = x∗ + (c1 + c2n∆t)e−qn∆t (4)
logistic xn = c + a(xn−1−c)ad+(1−d)(xn−1−c) (5) xn = c + a
1+e−b(n∆t−t0) (6)

Michel Pitermann The Journal of the Acoustical Society of America 31
TABLE II. Medians and semi-68-% ranges of the first two formant frequencies (Hz) measured
in the steady-state part of speakers’ [i], [ε] or [a]. The medians were computed across all speaking
rate and stress conditions.
F1 F2
Speaker A Speaker B Speaker A Speaker B
median range median range median range median range
[i] 282 28 225 14 1965 36 1954 43
[ε] 373 20 353 32 1848 37 1890 52
[a] 530 73 513 144 1661 102 1732 168

Michel Pitermann The Journal of the Acoustical Society of America 32
TABLE III. Results of analyses of variance of formant measurements for speaking rate and
contrastive stress factors. One analysis was carried out for each combination of formant, speaker
and vowel. Labels “DF”, “s:r” and “resid” stand for degree of freedom, interaction between stress
and rate, and residuals respectively. When p < 1e-10, 0 was reported in the table.
F1
Speaker A Speaker B
[ε] [a] [ε] [a]
DF F p DF F p DF F p DF F p
stress 1 17.3 3.7e-5 1 79.9 0 1 296.3 0 1 4261.3 0
rate 9 11.4 0 9 158.4 0 8 47.1 0 8 637.1 0
s:r 9 24.6 0 9 3.1 0.0011 8 11.8 0 8 83.7 0
resid 604 620 569 589
F2
Speaker A Speaker B
[ε] [a] [ε] [a]
DF F p DF F p DF F p DF F p
stress 1 37.5 1.7e-9 1 34.4 7.4e-9 1 549.4 0 1 558.3 0
rate 9 52.6 0 9 489.4 0 8 81.6 0 8 972.5 0
s:r 9 10.0 0 9 8.3 0 8 10.7 0 8 44.2 0
resid 599 620 553 584

Michel Pitermann The Journal of the Acoustical Society of America 33
TABLE IV. Results of analyses of variance of a1 (linear model (1)) estimates fitted to the
first-half formant transitions for speaking rate and contrastive stress factors. One analysis was
carried out for each combination of formant, speaker and vowel. Labels “DF”, “s:r” and “resid”
stand for degree of freedom, interaction between stress and rate, and residuals respectively. When
p < 1e-10, 0 was reported in the table.
F1
Speaker A Speaker B
[ε] [a] [ε] [a]
DF F p DF F p DF F p DF F p
stress 1 0.55 0.46 1 20.83 6.3e-6 1 0.67 0.41 1 68.86 0
rate 9 0.76 0.65 9 1.98 0.040 8 5.51 1.0e-6 8 1.77 0.081
s:r 9 0.68 0.73 9 8.03 0 8 3.60 4.4e-4 8 3.41 7.9e-4
resid 444 522 539 545
F2
Speaker A Speaker B
[ε] [a] [ε] [a]
DF F p DF F p DF F p DF F p
stress 1 0.51 0.47 1 0.57 0.45 1 9.23 0.0025 1 0.87 0.35
rate 9 1.26 0.26 9 0.97 0.46 8 1.23 0.28 8 0.90 0.52
s:r 9 0.76 0.65 9 0.93 0.50 8 1.30 0.24 8 0.82 0.59
resid 514 502 514 561

Michel Pitermann The Journal of the Acoustical Society of America 34
TABLE V. Results of analyses of variance of a1 (linear model (1)) estimates fitted to the
second-half formant transitions for speaking rate and contrastive stress factors. One analysis was
carried out for each combination of formant, speaker and vowel. Labels “DF”, “s:r” and “resid”
stand for degree of freedom, interaction between stress and rate, and residuals respectively. When
p < 1e-10, 0 was reported in the table.
F1
Speaker A Speaker B
[ε] [a] [ε] [a]
DF F p DF F p DF F p DF F p
stress 1 3.42 0.065 1 0.75 0.39 1 2.48 0.12 1 51.80 0
rate 9 2.35 0.013 9 1.20 0.29 8 1.29 0.24 8 18.12 0
s:r 9 1.99 0.038 9 1.06 0.39 8 2.67 0.0069 8 8.88 0
resid 570 569 548 538
F2
Speaker A Speaker B
[ε] [a] [ε] [a]
DF F p DF F p DF F p DF F p
stress 1 2.89 0.089 1 0.88 0.35 1 0.46 0.50 1 3.11 0.079
rate 9 1.35 0.21 9 1.80 0.066 8 1.62 0.12 8 3.90 1.8e-4
s:r 9 0.99 0.45 9 1.57 0.12 8 0.85 0.56 8 1.72 0.091
resid 554 596 385 448

Michel Pitermann The Journal of the Acoustical Society of America 35
TABLE VI. Results of analyses of variance of d (nonlinear model (5)) estimates fitted to
complete formant transitions for speaking rate and contrastive stress factors. One analysis was
carried out for each combination of formant, speaker and vowel. Labels “DF”, “s:r” and “resid”
stand for degree of freedom, interaction between stress and rate, and residuals respectively. When
p < 1e-10, 0 was reported in the table.
F1
Speaker A Speaker B
[ε] [a] [ε] [a]
DF F p DF F p DF F p DF F p
stress 1 1.37 0.24 1 1.23 0.27 1 2.26 0.13 1 237.16 0
rate 9 12.70 0 9 20.63 0 8 8.02 0 8 2.68 0.0067
s:r 9 3.77 1.2e-4 9 10.89 0 8 7.57 0 8 6.51 3.9e-8
resid 604 615 567 586
F2
Speaker A Speaker B
[ε] [a] [ε] [a]
DF F p DF F p DF F p DF F p
stress 1 14.84 1.3e-4 1 0.037 0.85 1 2.09 0.15 1 0.99 0.32
rate 9 5.05 1.4e-6 9 18.07 0 8 1.46 0.17 8 1.17 0.32
s:r 9 2.31 0.015 9 1.68 0.091 8 0.56 0.81 8 1.05 0.40
resid 602 616 545 568

Michel Pitermann The Journal of the Acoustical Society of America 36
TABLE VII. Standard linear Pearson correlations between the medians of the formant mea-
surements or the medians of the model parameters and the perceptual results for [a]. The medians
are shown in Figures 4, 5, 6 and 7, the perceptual scores are shown in Figure 3. Labels “u” or “s”
stands for unstressed or stressed [a], “Fi” for the ith formant, “a1(1)” or “a1(2)” for the parameter
a1 of the linear model (1) estimated on the first- or second-half transitions, and d for the parameter
d of the logistic model (5). Correlations printed in bold were significantly different from 0 at 0.05
level according to a two-tail standard Pearson sample correlation test. The number of degrees of
freedom were 8 and 7 respectively for speaker A and B.
F1 F2
Speaker A Speaker B Speaker A Speaker B
u s u s u s u s
Fi 0.82 0.87 0.90 0.89 -0.85 -0.87 -0.94 -0.81
a1(1) -0.52 0.84 0.35 0.74 -0.73 -0.21 0.75 0.86
a1(2) 0.79 0.46 0.02 0.49 0.89 0.96 0.68 0.53
d 0.79 0.51 -0.22 -0.78 0.83 0.82 0.68 -0.56

Michel Pitermann The Journal of the Acoustical Society of America 37
FIGURES
FIG. 1. Plots of each kinematic model (solid lines) fitted to a second-half or full transition of
the first formant (dotted line) of the first part of a [iai] stimulus.
FIG. 2. Length medians of the [ia] or [iε] F1 transitions plotted as functions of speaking rate
measured in metronome rhythm: ’O’ stressed vowels, ’×’ unstressed vowels, solid lines for [ia], and
dotted lines for [iε]. Low speaking rates are on the left hand side of each graph.
FIG. 3. Normalized identification scores averaged over the seven listeners for speakers A and
B’s vowel [a] as functions of speaking rate: ’O’ stressed [a], ’×’ unstressed [a]. Low speaking rates
are on the left hand side of each graph.
FIG. 4. Medians of the first two formant frequencies (Hz) measured in the steady-state part
of speakers’ [ε] and [a] for all combinations of speaking rate and contrastive stress. The data is
plotted as functions of speaking rate measured in metronome rhythm: ’O’ stressed vowels, ’×’
unstressed vowels, solid lines for [a], and dotted lines for [ε]. Low speaking rates are on the left
hand side of each graph.
FIG. 5. Medians of parameter a1 of the linear model (1) fitted to the first-half formant transi-
tions of speakers’ [iε] or [ia] for each combination of speaking rate and contrastive stress. The data
is plotted as functions of speaking rate measured in metronome rhythm: ’O’ stressed vowels, ’×’
unstressed vowels, solid lines for [a], and dotted lines for [ε]. Low speaking rates are on the left
hand side of each graph.
FIG. 6. Medians of parameter a1 of the linear model (1) fitted to the second-half formant
transitions of speakers’ [iε] or [ia] for each combination of speaking rate and contrastive stress.
The data is plotted as functions of speaking rate measured in metronome rhythm: ’O’ stressed
vowels, ’×’ unstressed vowels, solid lines for [a], and dotted lines for [ε]. Low speaking rates are on
the left hand side of each graph.

Michel Pitermann The Journal of the Acoustical Society of America 38
FIG. 7. Medians of parameter d of the logistic model (5) fitted to the whole formant transitions
of speakers’ [iε] or [ia] for each combination of speaking rate and contrastive stress. The data is
plotted as functions of speaking rate measured in metronome rhythm: ’O’ stressed vowels, ’×’
unstressed vowels, solid lines for [a], and dotted lines for [ε]. Low speaking rates are on the left
hand side of each graph.
FIG. 8. Formant measurements for the [a] and [ε] correctly identified in the perceptual exper-
iment. The ’|’ signs correspond to the [ε], the ’–’ to the [a]. The axes are linearly graduated in
Hz.
FIG. 9. Parameter a1 of the linear model (1) fitted to the second-half F1 or F2 transitions of
the [ia] or [iε] stimuli correctly identified in the perceptual experiment. The x axis corresponds to
F1, the y axis to F2, the ’|’ signs to [ε] and ’–’ to [a] stimuli.

Michel Pitermann The Journal of the Acoustical Society of America 39
FIG. 1. Michel Pitermann, The Journal of the Acoustical Society of America.
Exponential
0 50 100 150 200 250 300250
300
350
400
450
500
550
600
650
t (ms)
F1
(Hz)
Critical damping
0 50 100 150 200 250 300250
300
350
400
450
500
550
600
650
t (ms)
F1
(Hz)
Logistic
0 50 100 150 200 250 300250
300
350
400
450
500
550
600
650
t (ms)
F1
(Hz)

Michel Pitermann The Journal of the Acoustical Society of America 40
FIG. 2. Michel Pitermann, The Journal of the Acoustical Society of America.
Speaker A
40 60 80 100 120
80
100
120
140
160
180
200
metronome (beat/min)
dura
tion
(ms)
Speaker B
40 60 80 100 120
80
100
120
140
160
180
200
metronome (beat/min)du
ratio
n (m
s)

Michel Pitermann The Journal of the Acoustical Society of America 41
FIG. 3. Michel Pitermann, The Journal of the Acoustical Society of America.
Speaker A
40 60 80 100 1200.0
0.2
0.4
0.6
0.8
1.0
metronome (beat/min)
norm
aliz
ed s
core
s
Speaker B
40 60 80 100 1200.0
0.2
0.4
0.6
0.8
1.0
metronome (beat/min)no
rmal
ized
sco
res
Michel Pitermann The Journal of the Acoustical Society of America 42
FIG. 4. Michel Pitermann, The Journal of the Acoustical Society of America.
Speaker A’s F1
40 60 80 100 120300
400
500
600
700
800
metronome (beat/min)
form
ant (
Hz)
Speaker B’s F1
40 60 80 100 120300
400
500
600
700
800
metronome (beat/min)fo
rman
t (H
z)
Speaker A’s F2
40 60 80 100 120
1400
1500
1600
1700
1800
1900
2000
metronome (beat/min)
form
ant (
Hz)
Speaker B’s F2
40 60 80 100 120
1400
1500
1600
1700
1800
1900
2000
metronome (beat/min)
form
ant (
Hz)

Michel Pitermann The Journal of the Acoustical Society of America 43
FIG. 5. Michel Pitermann, The Journal of the Acoustical Society of America.
Speaker A’s a1 for F1
40 60 80 100 1200.6
0.8
1.0
1.2
1.4
1.6
1.8
metronome (beat/min)
dim
ensi
onle
ss
Speaker B’s a1 for F1
40 60 80 100 1200.6
0.8
1.0
1.2
1.4
1.6
1.8
metronome (beat/min)di
men
sion
less
Speaker A’s a1 for F2
40 60 80 100 1200.6
0.8
1.0
1.2
1.4
1.6
1.8
metronome (beat/min)
dim
ensi
onle
ss
Speaker B’s a1 for F2
40 60 80 100 1200.6
0.8
1.0
1.2
1.4
1.6
1.8
metronome (beat/min)
dim
ensi
onle
ss

Michel Pitermann The Journal of the Acoustical Society of America 44
FIG. 6. Michel Pitermann, The Journal of the Acoustical Society of America.
Speaker A’s a1 for F1
40 60 80 100 1200.3
0.4
0.5
0.6
0.7
0.8
0.9
metronome (beat/min)
dim
ensi
onle
ss
Speaker B’s a1 for F1
40 60 80 100 1200.3
0.4
0.5
0.6
0.7
0.8
0.9
metronome (beat/min)di
men
sion
less
Speaker A’s a1 for F2
40 60 80 100 1200.3
0.4
0.5
0.6
0.7
0.8
0.9
metronome (beat/min)
dim
ensi
onle
ss
Speaker B’s a1 for F2
40 60 80 100 1200.3
0.4
0.5
0.6
0.7
0.8
0.9
metronome (beat/min)
dim
ensi
onle
ss

Michel Pitermann The Journal of the Acoustical Society of America 45
FIG. 7. Michel Pitermann, The Journal of the Acoustical Society of America.
Speaker A’s d for F1
40 60 80 100 1200.4
0.5
0.6
0.7
0.8
0.9
1.0
metronome (beat/min)
dim
ensi
onle
ss
Speaker B’s d for F1
40 60 80 100 1200.4
0.5
0.6
0.7
0.8
0.9
1.0
metronome (beat/min)di
men
sion
less
Speaker A’s d for F2
40 60 80 100 1200.4
0.5
0.6
0.7
0.8
0.9
1.0
metronome (beat/min)
dim
ensi
onle
ss
Speaker B’s d for F2
40 60 80 100 1200.4
0.5
0.6
0.7
0.8
0.9
1.0
metronome (beat/min)
dim
ensi
onle
ss

Michel Pitermann The Journal of the Acoustical Society of America 46
FIG. 8. Michel Pitermann, The Journal of the Acoustical Society of America.
300 400 500 600 700
1400
1600
1800
2000
2200
F1 (Hz)
F2
(Hz)
|
|
| |
|
||
|
|
|
||
|
|
||
|
|
|
|
|
|
| |
|
|
|
|
|
|
||
|
|
|
|
|
|
|
|
|
|
|
||
|
|
|
|
|
|
|
|
|
|
| |
|
|
||
|
||
|
||
|
|
|
|
|
|
|
|
|
|
|
|
||
|
|
|
|
||
|
|
| |
|
|
|
|
|
|
|
|
||
|
||
||
|||
|
|
|
|
|
|
|
| |
|
|
||
|
|
|
||
|
||
|
|
|
|
|
|
|
|
|
|
||
|
|
|
|
|
|
|
|
|
|
|
|
|
|
|
||
|
|| |
|
|
|
|
|
|
|
|
|
| |
|
|
|
|
|
|
|
|
||
|
|
|
|
|
|
|
|
|
|
|
|
|
|
|
|
|
||
|
|
|
|
|
||
|
|
|
|
|
|
|
|
|
|
|
||
|
|
|
|
|
|
|
|
|
|
|
|
|
|
|
|
|
|
|
|
|
|
|
|
|
|
|
|
|
||
|
||
|||
|
|
|
|
|
|
|
|
|
|
|
|
|
|
|
|
||
||
|
|
|
|
|
|
|
|
|
|||
||
|
|
|
|||
||
|
|
|
|
|
|
|
|
|
|
|
||
|
|
|
|
|
||
|
|
||
|
|
|
|
|
|
|
|
|
|
|
||
|
|
||
|
|
||
|
|
|
|
|
|
|
|
||
|
|
|
|
|
||
|
| |
|||
|
||
|
|
|
||
|
||
|
|
|
|
|
||
|
|
| |
|
|
|
|
|
||
||
|
|
|
|
|
|
|
|
||
|
|
|
|
|
|
|
|
|
|
||
|
|
|
|
|
|
|
|
|
|
|
|
|
||
|
|
|
|
|
|
||
|
||
|
|
|||
|
|
|
|
|
|
|
||
|
|
|
||
|
|
||
|
|
|
|
|
|
||
|
|
|
|
||
|
|
|
|
|
|
|
|
||
|
|
|
|
|
|
|
|
| |
|
|
|
||
|
|
|
|
|
|
|
|
|
|
|
||
|
|
|
|
|
||
|
||
|
|
|
|| |
|
|||
|
|
|
|
|
|
|
|
|
| |
||
|
|
|
|
|
|
|
||
|
||
|
| |
|
|
|
|
|
||
|
|
|
|
|
|
|
||
||
|| |
|
|
||
|
|
|
|
|
|
|
|
|
|
|
|
| |
|
|
|
|
|
|
|
|
|
|
|
|
|
|
|
|
|
|
|
|
|
|
|
|
|
|
|
|
|
| ||
|
|
|
|
|
|
|
|
|
|
|
||
|
|
|
|
|
|
|
|
|
|
|
|
|
|
|
|
|
|
|
|
|
|
|
|
|
|
|
||
|
||
|
|
|
|
|
|
|
|
|
||
|
|
|
||
| |
|
|
|
|
||
|
|
|
| |
|
|
|
|
|
|
|
|
|
|
|
|
|
|
|
|
|
||
|
|
|
|
|
|
|
|
|
|||
|
|
|
|
|
||
|
|
|
|
|
|
||
|
|
|
|
|
|
|
|
|
|
|
|
|
|
|
|
|
|
|
|
|
||
|
|
|
|
|
|
||
|
|
|
|
|
|
|
|
|
|
|| |
|
|
|
|
|
|
|
|
|
|
|
|||
|
|
|
|
|
||
|
|
|
|
|
|
|
|
|
|
|
|
|
|
|
|
|
|
|
|
|
|
|
|
|
|
|
|
|
|
|
|
|
|
|
|
|
|
|
|
|
|
|
|
|
| |
|
|
||
|
|
|
|
|
|
|
||| |
|
|
|
||
|
|
|
|
|
|
|
|
| |
|
| |
|
|
|
|
|
|
|
|
|
|
|
|
|
|
|
|
|
|
|
|
|
|
|| |
|
|
|
||
|
|
|
|
| ||
||
|
|
||
||
|
|
||
|| |
|
|
||
|||
|
|
|
|
||
|
|
||
|
|
|
|||
|
|
|
|
|
| |
||
||
||
|
|
|
|
|
||
|
|
|
|
|
|
|
|
|
||
|
|
|
|
|
|
|
|
|
|
|
|
|
|
|
|
||
|
|
−−
−−
− −−−
−− −
−
−−−
−− −
−
−−
−
−−−
−
−
− −−−−−−−
−−−− −
−−
− −−
−
−− −−−−
−−
−
−
−
− −
−−
−−
−
−−− −−−
−
− −
−−
−
−−
−
−−−
− −
−
−−
−
−−
−
−−− −
−
−−
−
−− −
−−−
−
−−
−
−−
−
−
−
−−
−−
−−− −
−− −
−
− −− − −
−− −−−
− −−
−−
− −−
−
−−
−
−
−− −−
−−
−−
−−
− −− −−
−
−
−−
−
−−
−−
−−−
−−
−
− −
−
−
−
−
−−− −− −
−−
−−
−−
−
−
−
−−
−
−− −
−−
−
−−
−
−
−
−−
−
−−
−−−−− −−
−−
− −−− −−
−−
−
−−
−−
−−−−
−−−
−−
− −− −
−
−−− −
−
−−
−−
−−
−
−−
−−
− −
−−
−
−−
−−−
−
−
−
−
−
−−−
−−−
−−
−
−−− − −
−
−−−− −
−
−−−−
−
−−−−
− − −−
−−
−
−
−
−−
−
−−
−−
−− −− −
−
−−−
−
−−−
−
− −−
− −−
−− −
−
−
−−
− −− −−−
−−−
−
−−−− −− −−
−− − −−−
−−−−
−
−
−−−− −−−
−−−−
− −−
−
−− −
−−−
− −
−−
−
− −
−
−−−
−− −
−−− −
−
−−
−
−
−
−
− −
−−
−−
− −−−
−
−
−−
−
−
−−− −−
−−
−
−−
−−−−
−
−−−
−−
−−
−−
− −
−
−−
−
−−
−
−−−− −
−− −
−
−− −
−−
− −
−−
−−− −−−−
−
−−
−
−−
−− −
−−
− −
−
−− −−−
−−
− −
−
−−
−−
−
− −
−−
−−−
−−
−
−
−
−−
−−−−−
−−−
−−
−
−
− −
−−
−−
−
−
−
−
−−
−−
−
−
−
−−
−
−− −
−
−
−−−−
−−
−−−
−
−
−
−
−−
−−
− −−
−
−−
−
−
−−
−
−−−
−−
−− −
−
− −
− −−
−
−−
−−−
−
−−
−
− −
−
−
−
−
−−−
−−
−−−
−
−−
−−− −
− −
−
−
−
−− −−
−−
−−
−−
−−
−− −−−−−−−
−−−−
−− −−−−−− −−
−−
−−−
− −
−
−
−−
−− −
−−−
−
−
−
−−
−−
−−
−−−−
−−
− −−
−−−−
−−
−
−−
−−
−−
−
−
−−−
−− −−
−
−
−− −−
−−
−−
−
−
−−
−
−
−−−
−−
−
−−
−
−
−
−−
−−
−
−−− −
− −
−−−
−
−−
−−
−−
−
−
−
−−
−−
−−− −−−
−
−−
− −
−−
− −−− −−
−
−−
−
−
−−
−
−
−− −−−
−−
−
−
−
−

Michel Pitermann The Journal of the Acoustical Society of America 47
FIG. 9. Michel Pitermann, The Journal of the Acoustical Society of America.
0.0 0.5 1.0 1.5
0.0
0.5
1.0
1.5
a1(F1) (dimensionless)
a 1(F
2) (
dim
ensi
onle
ss)
|
|
|
|
|
|
|
|
|
|
|
|
|
|
|
|
|
|
|
|
|
|
|
|
|
|
|
|
|
|
|
|
|
|
|
|
|
|
|
|
|
|
|
|
|
|
|
|
|
|
|
|
|
|
|
|
|
|
|
|
|
|
|
|
|
|
|
|
|
|
|
|
|
|
|
|
|
|
|
||
|
|
|
|
|
|
|
|
|
|
|
|
|
|
|
|
|
|
|
|
|
|
|
|
|
|
|
|
|
|
||
|
|
|
|
|
|
|
|
|
|
|
|
|
|
|
|
|
|
|
|
|
|
|
|
||
|
|
|
|
|
|
|
|
|
|
|
|
||
|
|
|
|
|
|
|
|
|
|
|
|
|
|
|
|
|
|
|
|
|
|
|
|| |
|
|
|
|
|
|
|
|
|
|
|
|
|
|
|
|
|
|
|
|
|
| |
|
|
|
|
|
|
|
|
|
|
|
|
|
|
|
|
|
|
|
|
|
|
|
|
|
|
|
|
|
|
|
|
|
|
|
|
|
|
|
|
|
|
|
|
|
|
|
|
|
|
|
|
|
|
|
|
|
|
|
|
|
|
|
|
|
|
|
|
|
|
|
|
|
|
|
|
||
| |
|
|
|
|
||
|
||
|
|
||
|
|
||
|
|
|
||
|
|
|
|
|
|
|
|
|
|
|
|
|
|
|
|
|
|
||
|
|
|
|
|
|
|
||
|
|
|
|
|
|
|
|
|
|
|
|
|
|
|
|
|
|
|
|
|
|
|
|
|
|
|
|
|
|
|
|
||
|
|
|
|
|
|
|
|
|
||
|
|
|
|
|
||
|
|
|
|
|
|
|
|
|
|
|
|
|
|
||
|
||
|
||
|
|
|
|
||
|
|
|
|
||
|
|
|
|
||
|
|
|
|
|
|
|
|
|
|
|
||
|
|
|
|
|
|
|
||
|
|
|
|
|
|
|
|
|
|
|
|
|
|
|
|
|
|
|
|
|
|
||
| |
|
|
|
|
|
||
|
|
|
|
|
|
|
|
|
|
|
|
|
|
|
|
|
|
|
|
|
|
|
|
|
|
|
|
| |
|
|
|
|
|
|
|
|
|
|
|
|
|
|
|
|
|
|
|
|
|
|
|
|
|
|
|
|
|
|
|
|
|
||
|
|
|
|
|
|
|
|
|
|
||
|
|
|
|
|
|
|
|
|
|
|
|
|
|
|
|
|
|
|
|
|
|
|
|
|
|
|
|
|
|
|
||
|
|
|
|
|
|
|
|
|
|
|
|
|
|
|
|
|
|
|
|
|
|
||
|
|
|
|
|
|
|
|
|
|
|
|
|
|
|
|
|
|
|
|
|
|
|
|
|
|
|
|
|
|
|| |
|
|
|
|
|
|
|
|
|
|
|
|
|
|
|
|
|
|
|
|
|
|| ||
|
|
|
|
|
||
|
|
|
|
|
|
|
|
|
|
|
|
|
|
|
|
|
|
|
|
|
|
|
|
|
|
|
|
|
|
| |
|
|
||
|
|
|
|
|
|
|
|
|
||
|
|
||
|
|
|
|
|
|
|
|
−
−
−
−
−
−
−
−
−−
−−−
−
−
−−−−
−
−
−− −
−−
−
−
−
−
−−
−−
−−
−
−
−
−
−
−
−
−−−
− −
−
−
− −−
−
−−
− −
−−−
−−−
−
−
−
−
−−
−
−
−
−
−
−
−
− −
−
−
−−
−
−
−
−
−
−−
−−
−
−
−
−
− −−
−
−
−
−
−
−
−
−
−−−
−
−−
−
−−
−−
−
−
−
−−
−
−−−
−
−−−−−
−
−−−
−−
− −
−
−
−
−
−
−
−
−
−
−
−
−
−
−
−
−
−
−
−
−
−
−
−
−
−
−
−
−
−
−
−
−
−
−
−
−
−
−
−−
−
−
−
−
− −
−
−−
−
−
−
−
−
−−
−
−
−
−−
−
−
−
−
−
−
−
−
−
−
−
−
−
−
−
−
−− −
−− −
−−
−
−
−
−
−
−
−
−
−
−
−
−
−
−
−
−
−
−
−
−
−
−
−
−−−
−
−
−
−
−−
−−
−
−
−
−
−
−
−−
−
−
−−
−
−
−
−
−
−
−
−
−
−−
−
−
−
−
−
−
−
−
−−
−
−
−
−
− −
−
−−
−
−−
−
−
−
−−
−
− −
−−
−
−
−
−
−
−−
−−
−
−
−−
−
−
−
−
−
−
−−
−
−
−
−
−−
−
−
−−
−
−
−
−
−
−
−
−
−
−
−
−
−
−
−
−
−
− −
−
−−−−
−−
−
−−
−
−
−
−
−
−
−
−
−
−
−
−
−−
−−
−
−
−−
−
−
−
−
−− −
−
−−− −−
−
−
−−
−
−
−−
−
−−
−
−−
−−
−−−
−
−
−−
−−
−
− −
−
−
−−
−
−−−
−
−−− −−− −
−−
−−−
− −
− −
− −−
−
−
−
−
−−
−
−
−
−−−
−−−
− −
−
−−
−−−
− −−
−
−−−
−−
−
−
−−−− −
−
−
−
−− −
−
−− − −
−
−
−
−
−−−
−− −
−
−
−
−−−−
−
−−
−−
−
−
−
−−
−
−
− −−
−−
−
−
−
−−−
−
−−−
−−
−−
−−−
−
−
−
−
−−−
−
−
−
−
−
−−−−
−
−
−
−−
−
−
−−
−
−−
−−
−
−
−
−
−
− −−
−
−
−
−
−−
−
−−
−
−
−
−
−
−−−
−
−−−
−
−
−
−
−
−
−
−
−
−
−
−
−
−
−
−− −−
−
−
−
−
−
−−
−
−
−
−
−−
−−
−
−
−
− −
− −
−
−
−
−
−
−−
−−−
−
−
−
−
−−
−
−
−
−
− −
−
−
−
−−
−
−
−
−
−
−
−
−
−
−
−
−
−
−
−
−
−
−
−
−
−
−
−
− −
−
−
−
−
− −
−
−
−
−
−−
−