effect of specular focal distance on endothelial cell density accuracy
TRANSCRIPT
Effect of Specular Focal DistanceEffect of Specular Focal Distanceon Endothelial Cell Counting Accuracyon Endothelial Cell Counting Accuracy
Jackie Hai and Vivian XueJackie Hai and Vivian XueHAI Laboratories, Inc.HAI Laboratories, Inc.

Special ThanksSpecial Thanks
for providing research corneafor providing research cornea

PurposePurpose
Quantify the relationship between Quantify the relationship between focal distance and image distortion focal distance and image distortion in specular microscopyin specular microscopy
Determine predictive model of cell Determine predictive model of cell counting error based on amount of counting error based on amount of deviance from true endothelial cell deviance from true endothelial cell shape and sizeshape and size

Sample Area: 39981.10μm2
Cells Counted: 113Density: 2826
High Resolution Analysis(640x480 pixels)

Sample Area: 44843.25μm2
Cells Counted: 113Density: 2520
High Resolution Analysis(640x480 pixels)

MethodMethod
High resolution specular image of High resolution specular image of standard calibration lensstandard calibration lens
Baseline pachymetry of 0.000mm Baseline pachymetry of 0.000mm established for focused imageestablished for focused image

Calibration LensCalibration Lens
Baseline focal distance = 0.000mmBaseline focal distance = 0.000mm

Images captured 30Images captured 30μm, 40, 40μm, 50, 50μm, , 6060μm, 70, 70μm, 80, 80μm, 90, 90μm and 100 and 100μm from baseline focal distancefrom baseline focal distance
10 sample area measurements per 10 sample area measurements per image (single blind trial)image (single blind trial)
Determine mean area of each imageDetermine mean area of each image
Simple linear regression modelSimple linear regression model
MethodMethod

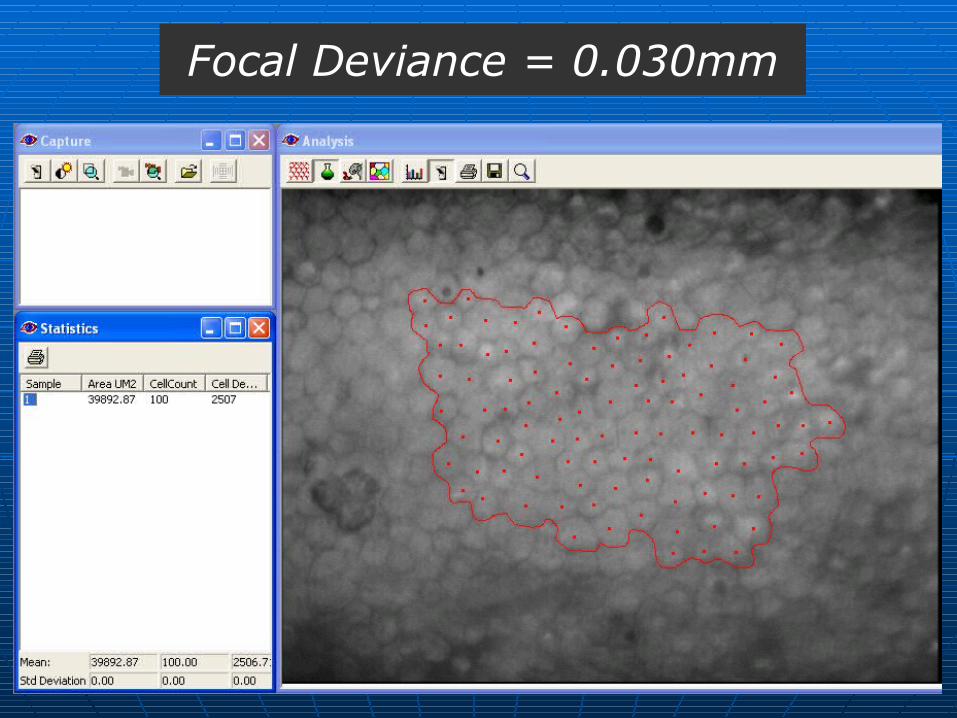
Focal Deviance = 0.030mmFocal Deviance = 0.030mm

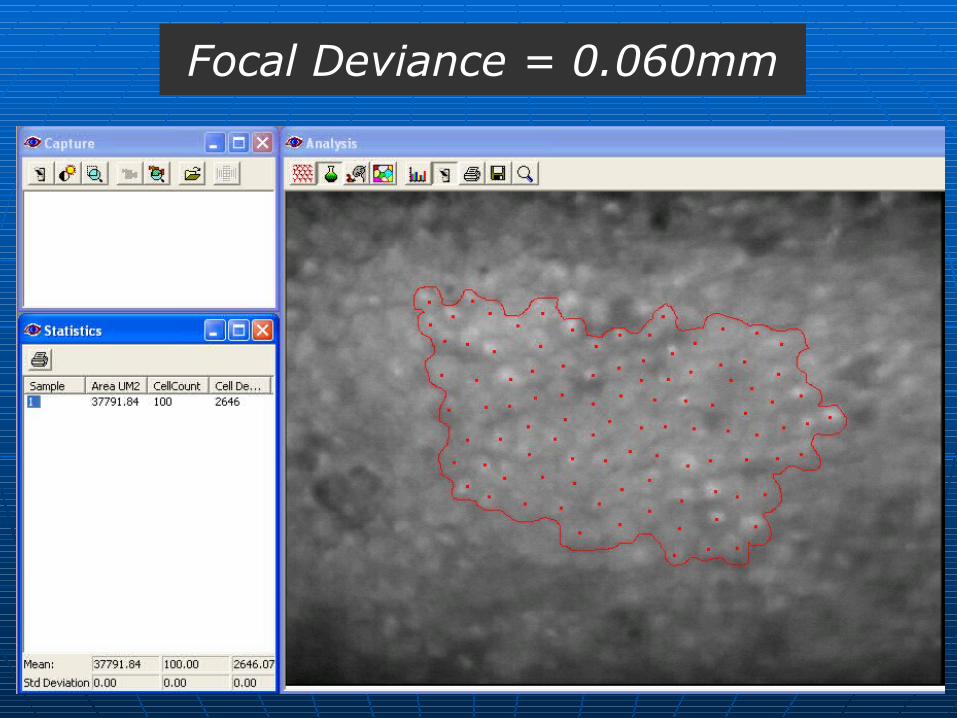
Focal Deviance = 0.060mmFocal Deviance = 0.060mm

Focal Deviance = 0.100mmFocal Deviance = 0.100mm

ResultsResults

A=8,869μm2 F=70μmA=8,767μm2 F=80μmA=8,694μm2 F=90μm
A=9,666μm2 F=30μmA=9,444μm2 F=40μm
A=8,467μm2 F=100μm
A=9,055μm2 F=60μmA=9,180μm2 F=50μm
Mean Area (A)Focal Deviance (F)
ResultsResults

Projected cell counting errorProjected cell counting error
ResultsResults
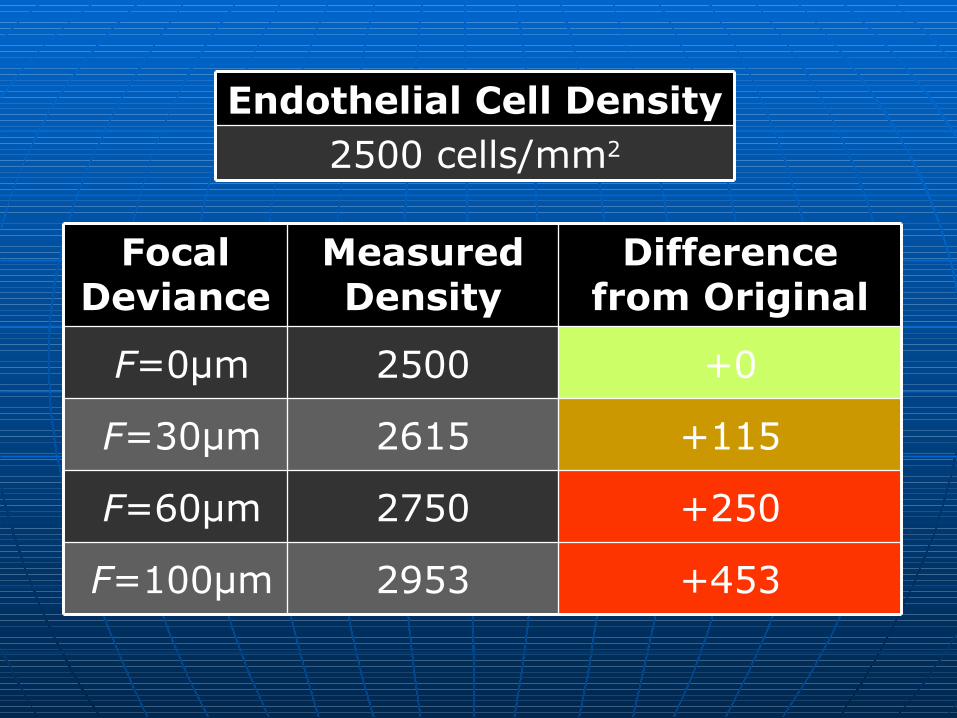
2953
2750
2615
2500
Measured Density
+0 F=0μm
+115 F=30μm
+453 F=100μm
+250 F=60μm
Difference from Original
Focal Deviance
2500 cells/mm2
Endothelial Cell Density

3544
3300
3137
3000
Measured Density
+0 F=0μm
+137 F=30μm
+544 F=100μm
+300 F=60μm
Difference from Original
Focal Deviance
3000 cells/mm2
Endothelial Cell Density

Problematic(>200 cells/mm2)
60-100μm
Non-negligible(>100 cells/mm2)
30-59μm
Negligible(<100 cells/mm2)
0-29μm
Cell Density ErrorFocal Deviance
Conclusion

Focal Deviance = 0.100mm
Focal Deviance = 0.060mm
Focal Deviance = 0.030mm

Focal Deviance = 0.000mm

36,711μm2
37,792μm2
39,893μm2
42,061μm2
Measured Area
2377 cells/mm2 F=0μm
2507 cells/mm2 F=30μm
2724 cells/mm2 F=100μm
2646 cells/mm2 F=60μm
Endothelial Cell Density
Focal Deviance
2377 cells/mm242,061μm2
Endothelial Cell Density
TrueArea

Qualitative Properties
Cell surfaces are uneven and/or have hot spots
Cell surfaces are even and consistently lit
Cell morphology appears flattened or stretched
Cell morphology includes regular polygons
Low contrast between cell borders and interiors
High contrast between cell borders and interiors
Cell borders are fuzzyand poorly visible
Cell borders are boldand clearly visible
Out of FocusIn Focus

Focal Deviance = 0.000mm
640x480

Focal Deviance = 0.030mm
640x480

Focal Deviance = 0.060mm
640x480

Focal Deviance = 0.100mm
640x480

Discussion
Minimizing focal deviance is essential to capturing true area and attaining accurate cell density
Higher resolution images allow better judgment of focal deviance
Lower resolution images obscure focal deviance due to compression
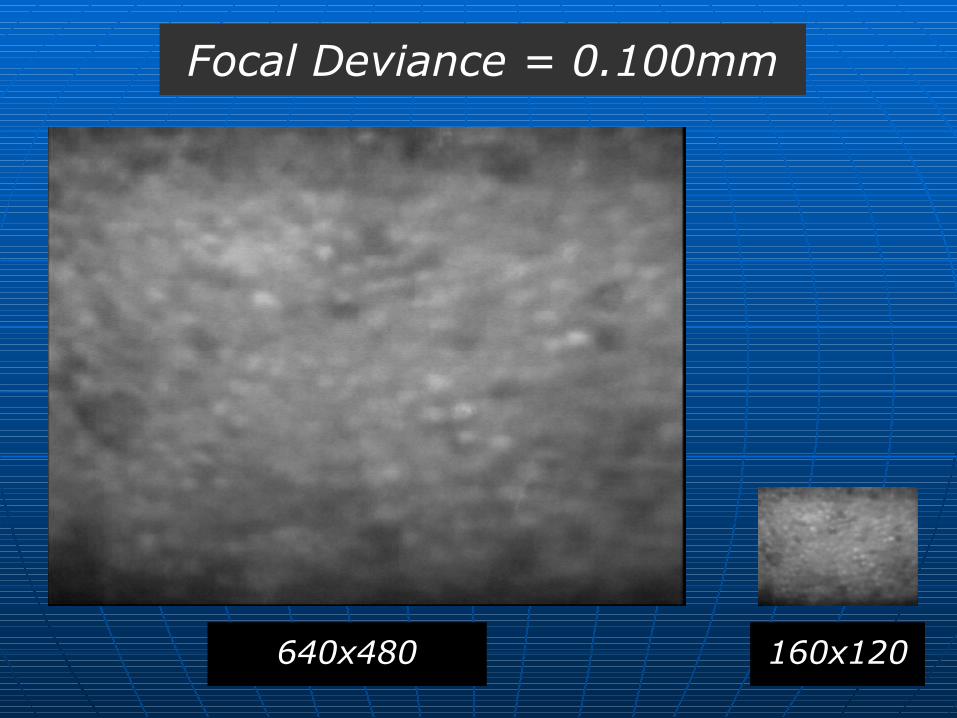
Focal Deviance = 0.100mm
640x480 160x120

Focal Deviance = 0.060mm
640x480 160x120
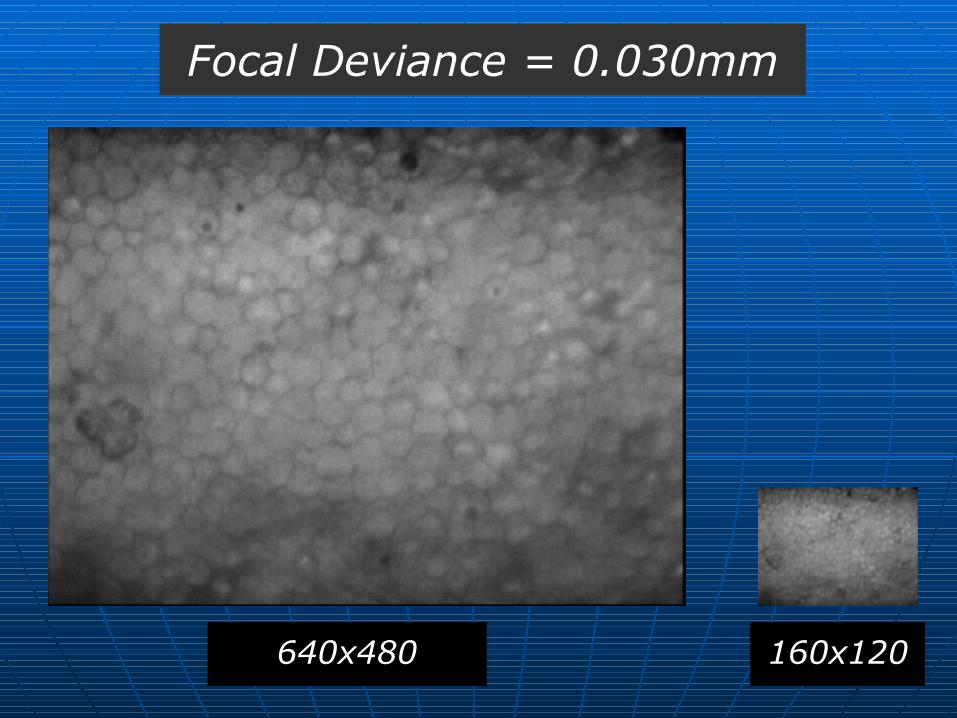
Focal Deviance = 0.030mm
640x480 160x120

Focal Deviance = 0.000mm
640x480 160x120

Recommendations
Allow donor tissue to warm up to room temperature
Use both coarse and fine Z-knobs to attain optimum focus
If it is difficult to focus, change the angle of the chamber or vial

Recommendations
Capture specular images at the highest possible resolution (e.g. 640x480 pixels)
Select flat areas of endothelial cells to perform density analysis
http://www.hailabs.com/specular-microscopy