effect of strain range on the low cycle fatigue in alloy
TRANSCRIPT

metals
Article
Effect of Strain Range on the Low Cycle Fatigue inAlloy 617 at High Temperature
Rando Tungga Dewa 1, Seon Jin Kim 1,*, Woo Gon Kim 2 and Eung Seon Kim 2
1 Department of Mechanical Design Engineering, Pukyong National University, Busan 48547, Korea;[email protected]
2 Korea Atomic Energy Research Institute (KAERI), Daejeon 305-353, Korea; [email protected] (W.G.K.);[email protected] (E.S.K.)
* Correspondence: [email protected]; Tel.: +82-51-629-6163; Fax: +82-51-629-6150
Academic Editor: Filippo BertoReceived: 28 December 2016; Accepted: 7 February 2017; Published: 10 February 2017
Abstract: The aim of this study is to investigate the fully-reversed low cycle fatigue properties ofAlloy 617 in the air at 950 ◦C; these tests were conducted at total strain ranges from 0.9% to 1.5%with a constant strain rate of 10−3/s. The result of the fatigue tests showed a decrease in fatigueresistance with an increasing total strain range. The reduction of fatigue resistance was due to theeffect of the total strain range and microstructure evolution during high temperature, such as brittleoxides cracking. At all testing conditions, the cyclic softening mechanism was observed as a functionof the total strain range in the current high temperature condition. An analysis of low cycle fatigueresistance was performed using the Coffin–Manson relationship and the total strain energy density;it was found that Alloy 617 followed these relationships well. In addition, this study compared wellwith previous work reported in the literature for a similar testing condition. Post-fracture analysis onthe fracture surfaces of failed specimens revealed a more severe damage cracking at the peripheryof specimens due to the increase in the total strain range. The surface connected grain boundarycracks induced by oxidation were obvious at low strain range. Thus, the primary crack propagationoccurred in transgranular mode from persistent slip bands.
Keywords: Alloy 617; nickel-based superalloy; very high temperature gas-cooled reactor (VHTR);low cycle fatigue; high temperature; fatigue damage; life prediction; solute drag creep; oxidation
1. Introduction
The very high temperature gas cooled reactor (VHTR) is considered as a candidate design forGeneration IV (Gen IV) reactors to authorize the eventual operation in the thermal and core outlettemperature of 950 ◦C. Materials of potential interest include nickel Alloy 800H, Alloy 617 and HastelloyX of the VHTR main components, including the intermediate heat exchanger (IHX) and hot gas duct(HGD) [1,2]. The VHTR is designed for a life span of 60 years and will be exposed to a very hightemperature environment. Therefore, in the high temperature design, creep resistance, creep-fatigueresistance, oxidation and corrosion resistance, and also phase stability should be satisfied. Alloy 617,a Nickel-based superalloy, is a leading candidate material for IHX and HGD because of its excellenthigh-temperature mechanical properties, formability, and weld ability [3]. Alloy 617 is strengthenedby solid solution hardening provided by the alloy chemical compositions of chromium, cobalt, andmolybdenum. The strengthening process of this Alloy 617 is granted by the hardening precipitates ofAlloy carbides, which provide excellent fatigue resistance at high temperature processes [3,4]; the hightemperature oxidation resistance is derived from the high nickel and chromium content. The Alloy 617is expected to provide good thermal stability for components of power generating plants with hightemperature strength up to 950 ◦C [5].
Metals 2017, 7, 54; doi:10.3390/met7020054 www.mdpi.com/journal/metals

Metals 2017, 7, 54 2 of 14
In mechanical design components, however, creep and fatigue damages are usually more criticalthan the other design parameters. Investigation into these design considerations should be carriedout, because a significant degradation of mechanical strength may occur in the high temperaturecondition. Under this circumstance, the cyclic loadings in the low cycle fatigue (LCF) regime describea main failure mechanism from a temperature-gradient-induced thermal strain during operation,as well as startups and shutdowns and power transients or temperature change of flowing coolant [5,6].In the state-of-the-art, fatigue damage accumulation as a stress and strain concentration duringcyclic loading is potentially causing the crack initiation site and propagation onwards [7]. Therefore,a thorough knowledge of the elastoplastic behavior is necessary in the design and life evaluationof such components that operate in the high temperature condition. Although Alloy 617 has manysuperior properties, many researchers have reported that the number of cycles to failure varies widelyat high temperatures [5–9]. However, they did not provide sufficient data on the Alloy 617 in the LCFregime over a range of conditions. In fact, a draft Code Case has not been developed to qualify the Alloy617 for design use. Various LCF data for Alloy 617 used for nuclear application are ongoing researchand must be collected to complete the database. The need for fatigue data, such as the influence oftotal strain ranges, strain rates, and temperatures are necessary for predicting the lifetime of the reactorcomponents. Furthermore, the LCF behavior should be investigated through life data evaluationaccording to the LCF temperature and total strain range controlled. However, there still remains aneed for experiments on the Alloy 617 in high temperature operation with more homogeneous plasticdeformation and oxidation behaviors where the cyclic strain might be localized. Thus, many datashould be supplemented to provide a baseline draft Code Case to confirm the suitability.
In this study, the LCF tests of Alloy 617 in air environment have been conducted through a seriesof a fully-reversed strain-controlled strain ratio (Rε = −1) with different applied total strain rangesat 950 ◦C, according to the ASTM E606. Only the results relevant to the LCF properties and fatiguelife were investigated here as a function of the total strain range. In addition, several fatigue damageparameters in the structural material were evaluated through a systematical life analysis, such as stress,strain elements, and energy dissipated during each cycle. Metallography and fatigue slip behaviorwere discussed so as to study the crack initiation and early micro crack growth of Alloy 617 duringhigh temperature LCF.
2. Experimental Procedure
A commercial grade Alloy 617 is approved for construction of nuclear facility components in theASME Boiler and Pressure Vessel Code Section III Subsection NH Class 1. The composition (wt %) ofthe Alloy 617 used for material chosen in this study is shown in Table 1. The initial microstructureanalysis of Alloy 617 revealed the microstructure with well-uniformed equiaxed grains with the largergrain size of about 70–100 µm, and the fine smaller grain size of about 30–40 µm, as shown in Figure 1.The Alloy 617 has a fine microstructure with a fully austenitic matrix. The tensile test specimenswere machined into a rectangular cross-section with a gage length of 28.5 mm, width of 6.25 mm, andthickness of 1.5 mm. LCF specimens were fabricated in cylindrical shape with a diameter of 6.0 mm inthe reduced section with a gauge length of 12 mm. Figure 2 shows the tensile and LCF specimens usedin this work. The gage section was parallel to the longitudinal rolling direction and the high-precisionextensometer was attached axially to it for collecting the real-time data of the strain on the specimenthroughout the duration of LCF testing.
Table 1. The chemical compositions of Alloy 617 (wt %).
C Ni Fe Si Mn Co Cr Ti P S Mo Al B Cu
0.08 53.11 0.949 0.084 0.029 12.3 22.2 0.41 0.003 0.002 9.5 1.06 <0.002 0.0268

Metals 2017, 7, 54 3 of 14
A closed loop 100 kN servo hydraulic testing machine (MTS 370 Landmark, Eden Prairie, MN,USA) was used and equipped with a tube furnace for heating the specimens of Alloy 617 in open air,as shown in Figure 3. The three temperature zones (top, center, bottom zone) were measured witheach thermocouple attached on the furnace to monitor the temperatures within the gage section ofthe specimens. Therefore, the temperature was maintained within ±2 ◦C of the nominal temperaturethroughout the test. Before the commencement of the test, the specimen was held at a targettemperature with zero load for about 30 min to allow the temperature to stabilize. We performedfully-reversed (strain ratio, Rε = −1) strain control cycling tests of Alloy 617 at the 950 ◦C temperaturecondition regarding the different applied total strain ranges, i.e., 0.9%, 1.2%, and 1.5%. A triangularwaveform (continuous cycling) and a constant strain rate equal to 10−3/s was applied. At least200 data per cycle were generated using an extensometer clamped to the gage section of the specimen.The failure criterion was defined as the number of cycles, which means a 20% reduction in the stressratio (peak tensile-compressive stress ratio) in order to separate the effect of softening or hardeningbehavior of the material under cyclic loading. The fracture surface of the selected specimens wasexamined by use of a scanning electron microscope (SEM, Hitach JEOL JSM 5610, JEOL Ltd., Tokyo,Japan), and optical microscope (OM, JP/GX51, Olympus Corp., Tokyo, Japan) in order to identify thecrack nucleation and modes of propagation.
Metals 2017, 7, 54 3 of 14
each thermocouple attached on the furnace to monitor the temperatures within the gage section of
the specimens. Therefore, the temperature was maintained within ±2 °C of the nominal temperature
throughout the test. Before the commencement of the test, the specimen was held at a target
temperature with zero load for about 30 min to allow the temperature to stabilize. We performed
fully‐reversed (strain ratio, Rε = −1) strain control cycling tests of Alloy 617 at the 950 °C temperature
condition regarding the different applied total strain ranges, i.e., 0.9%, 1.2%, and 1.5%. A triangular
waveform (continuous cycling) and a constant strain rate equal to 10−3/s was applied. At least 200
data per cycle were generated using an extensometer clamped to the gage section of the specimen.
The failure criterion was defined as the number of cycles, which means a 20% reduction in the stress
ratio (peak tensile‐compressive stress ratio) in order to separate the effect of softening or hardening
behavior of the material under cyclic loading. The fracture surface of the selected specimens was
examined by use of a scanning electron microscope (SEM, Hitach JEOL JSM 5610, JEOL Ltd., Tokyo,
Japan), and optical microscope (OM, JP/GX51, Olympus Corp., Tokyo, Japan) in order to identify the
crack nucleation and modes of propagation.
Figure 1. Microstructure of the cross‐view of Alloy 617.
(a) (b)
Figure 2. Specimen’s geometry of the (a) Tensile and (b) LCF test. LCF, Low Cycle Fatigue.
Figure 3. Apparatus and experimental setup of the LCF test.
Figure 1. Microstructure of the cross-view of Alloy 617.
Metals 2017, 7, 54 3 of 14
each thermocouple attached on the furnace to monitor the temperatures within the gage section of
the specimens. Therefore, the temperature was maintained within ±2 °C of the nominal temperature
throughout the test. Before the commencement of the test, the specimen was held at a target
temperature with zero load for about 30 min to allow the temperature to stabilize. We performed
fully‐reversed (strain ratio, Rε = −1) strain control cycling tests of Alloy 617 at the 950 °C temperature
condition regarding the different applied total strain ranges, i.e., 0.9%, 1.2%, and 1.5%. A triangular
waveform (continuous cycling) and a constant strain rate equal to 10−3/s was applied. At least 200
data per cycle were generated using an extensometer clamped to the gage section of the specimen.
The failure criterion was defined as the number of cycles, which means a 20% reduction in the stress
ratio (peak tensile‐compressive stress ratio) in order to separate the effect of softening or hardening
behavior of the material under cyclic loading. The fracture surface of the selected specimens was
examined by use of a scanning electron microscope (SEM, Hitach JEOL JSM 5610, JEOL Ltd., Tokyo,
Japan), and optical microscope (OM, JP/GX51, Olympus Corp., Tokyo, Japan) in order to identify the
crack nucleation and modes of propagation.
Figure 1. Microstructure of the cross‐view of Alloy 617.
(a) (b)
Figure 2. Specimen’s geometry of the (a) Tensile and (b) LCF test. LCF, Low Cycle Fatigue.
Figure 3. Apparatus and experimental setup of the LCF test.
Figure 2. Specimen’s geometry of the (a) Tensile and (b) LCF test. LCF, Low Cycle Fatigue.
Metals 2017, 7, 54 3 of 14
each thermocouple attached on the furnace to monitor the temperatures within the gage section of
the specimens. Therefore, the temperature was maintained within ±2 °C of the nominal temperature
throughout the test. Before the commencement of the test, the specimen was held at a target
temperature with zero load for about 30 min to allow the temperature to stabilize. We performed
fully‐reversed (strain ratio, Rε = −1) strain control cycling tests of Alloy 617 at the 950 °C temperature
condition regarding the different applied total strain ranges, i.e., 0.9%, 1.2%, and 1.5%. A triangular
waveform (continuous cycling) and a constant strain rate equal to 10−3/s was applied. At least 200
data per cycle were generated using an extensometer clamped to the gage section of the specimen.
The failure criterion was defined as the number of cycles, which means a 20% reduction in the stress
ratio (peak tensile‐compressive stress ratio) in order to separate the effect of softening or hardening
behavior of the material under cyclic loading. The fracture surface of the selected specimens was
examined by use of a scanning electron microscope (SEM, Hitach JEOL JSM 5610, JEOL Ltd., Tokyo,
Japan), and optical microscope (OM, JP/GX51, Olympus Corp., Tokyo, Japan) in order to identify the
crack nucleation and modes of propagation.
Figure 1. Microstructure of the cross‐view of Alloy 617.
(a) (b)
Figure 2. Specimen’s geometry of the (a) Tensile and (b) LCF test. LCF, Low Cycle Fatigue.
Figure 3. Apparatus and experimental setup of the LCF test. Figure 3. Apparatus and experimental setup of the LCF test.

Metals 2017, 7, 54 4 of 14
3. Results and Discussions
3.1. Monotonic and Low Cycle Fatigue Properties
Figure 4 shows the tensile test of Alloy 617, with a strain rate of 5.85 × 10⁻⁴/s at 950 ◦C that wasfirst done as a reference data for better understanding and explanation of fracture behavior. It is notablethat the yield strength (YS) and the ultimate tensile strength (UTS) values were determined from thearea in which the plastic deformation occurred (non-uniform) along the engineering stress–strainrelationship, as well as with the highest stress magnitude during deformation behavior, respectively.The elastic modulus was calculated according to the slope in the elastic region, which is in goodagreement with that reported in the literature [5]. The tensile elongation and reduction of area(as a definition of material ductility) are also in accordance with the literature.
Metals 2017, 7, 54 4 of 14
3. Results and Discussions
3.1. Monotonic and Low Cycle Fatigue Properties
Figure 4 shows the tensile test of Alloy 617, with a strain rate of 5.85 × 10⁻⁴/s at 950 °C that was
first done as a reference data for better understanding and explanation of fracture behavior. It is
notable that the yield strength (YS) and the ultimate tensile strength (UTS) values were determined
from the area in which the plastic deformation occurred (non‐uniform) along the engineering stress–
strain relationship, as well as with the highest stress magnitude during deformation behavior,
respectively. The elastic modulus was calculated according to the slope in the elastic region, which is
in good agreement with that reported in the literature [5]. The tensile elongation and reduction of
area (as a definition of material ductility) are also in accordance with the literature.
Figure 4. Engineering stress–strain curve of Alloy 617 at 950 °C. UTS, Ultimate Tensile Strength. YS,
Yield Strength.
LCF testing of Alloy 617 was completed in air at 950 °C regarding the different applied total
strain ranges to provide a baseline data for the fatigue behavior. Table 2 reports the LCF test total
strain condition, cycles to failure, cycles to initiation, plastic strain range, and stress range at half‐life
cycle. The results of fatigue tests consistently showed an appropriate decrease of fatigue life as a
number of cycles according to the increase in the total strain range. We could find relatively higher
plastic strain magnitude results in large plastic deformation which probably induced early crack
nucleation. Most of fatigue life is spent in micro crack nucleation. These results could suggest that at
higher total strain ranges, the reduction in fatigue life can be taken as being superior to cyclic plastic
deformation. However, the stress response behavior was decreased when the total strain range was
elevated, which is a definition of the cyclic softening mechanism. This point of view will be explained
in the next section according to the cyclic damage mechanism at the very high temperature process.
Table 2. LCF test reports of Alloy 617 completed at 950 °C and at a strain rate of 10−3/s.
Total Strain
Range (mm/mm)
Cycles to
Failure
Cycles to
Initiation
Plastic Strain Range at
Half‐Life (mm/mm)
Stress Range at
Half‐Life (MPa)
0.0075 392 300 0.00641 136.6
0.0060 481 292 0.0048 139.9
0.0045 823 803 0.00343 148.9
Figure 5a shows the hysteresis loops that represented a reduction in the peak stress response
with the increasing total strain range. However, the plastic strain also becomes significantly higher
as the shape of the hysteresis loops is wider. Figure 5b shows the interval cycles in the hysteresis
loops as a stress–strain response of Alloy 617 tested at 0.9% total strain range. In this phenomenon, a
-0.2 0.0 0.2 0.4 0.6 0.8 1.0 1.2 1.4-20
0
20
40
60
80
100
120
140
160
180
E = 144 GPa
5.84 x 10⁻⁴ /secUTS(148.7 MPa)
YS(131.1 MPa)
En
gin
eeri
ng
Str
ess,
(M
Pa)
Engineering Strain,
Figure 4. Engineering stress–strain curve of Alloy 617 at 950 ◦C. UTS, Ultimate Tensile Strength. YS,Yield Strength.
LCF testing of Alloy 617 was completed in air at 950 ◦C regarding the different applied total strainranges to provide a baseline data for the fatigue behavior. Table 2 reports the LCF test total straincondition, cycles to failure, cycles to initiation, plastic strain range, and stress range at half-life cycle.The results of fatigue tests consistently showed an appropriate decrease of fatigue life as a numberof cycles according to the increase in the total strain range. We could find relatively higher plasticstrain magnitude results in large plastic deformation which probably induced early crack nucleation.Most of fatigue life is spent in micro crack nucleation. These results could suggest that at higher totalstrain ranges, the reduction in fatigue life can be taken as being superior to cyclic plastic deformation.However, the stress response behavior was decreased when the total strain range was elevated, whichis a definition of the cyclic softening mechanism. This point of view will be explained in the nextsection according to the cyclic damage mechanism at the very high temperature process.
Table 2. LCF test reports of Alloy 617 completed at 950 ◦C and at a strain rate of 10−3/s.
Total Strain Range(mm/mm) Cycles to Failure Cycles to Initiation Plastic Strain Range at
Half-Life (mm/mm)Stress Range atHalf-Life (MPa)
0.0075 392 300 0.00641 136.60.0060 481 292 0.0048 139.90.0045 823 803 0.00343 148.9
Figure 5a shows the hysteresis loops that represented a reduction in the peak stress responsewith the increasing total strain range. However, the plastic strain also becomes significantly higher

Metals 2017, 7, 54 5 of 14
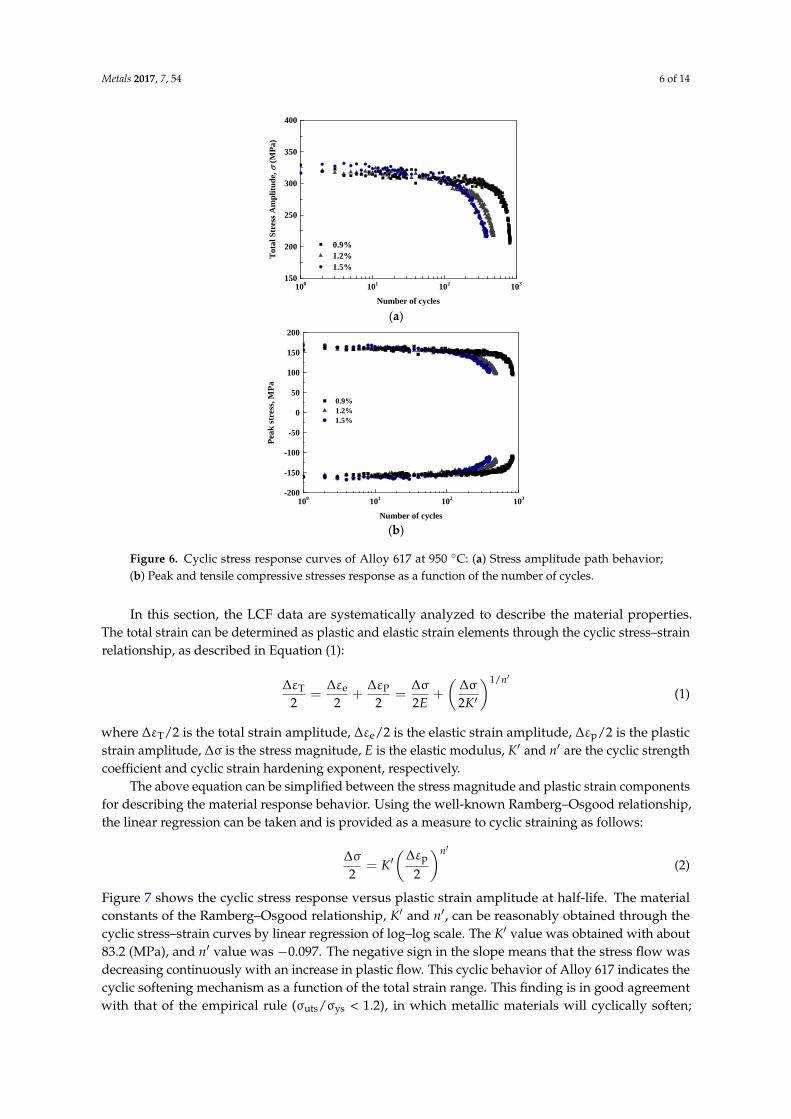
as the shape of the hysteresis loops is wider. Figure 5b shows the interval cycles in the hysteresisloops as a stress–strain response of Alloy 617 tested at 0.9% total strain range. In this phenomenon,a cyclic softening mechanism was observed as the stress response was decreased with the increasingof the number of cycles. The stable cycle phase was reached generally above 10 cycles, therefore,the half-life value is appropriate as the stable behavior during LCF loadings. Figure 6 shows the cyclicstress response behavior of Alloy 617 at different applied total strain ranges. Almost all of the stressamplitude paths of Alloy 617 at 950 ◦C exhibit a cyclic softening region for the major portion of thelife, as shown in Figure 6a. At the end of the test, the stress amplitude was decreased rapidly as aformation of macro-crack initiation or just prior to failure. Under the lowest total strain range, i.e.,0.9%, a short saturation phase was also observed with a longer fatigue resistance. Figure 6b showsthat the peak tensile and compressive stress response under different applied total strain ranges wereof the same magnitude. At all the testing conditions, the peak tensile and compressive stresses as afunction of cycle (Figure 6b) reached a stable value within less than 30 cycles. Also, it is noted that thecyclic stress response behavior is consistent with the shape of the cyclic stress–strain hysteresis loopsshown in Figure 5.
Metals 2017, 7, 54 5 of 14
cyclic softening mechanism was observed as the stress response was decreased with the increasing
of the number of cycles. The stable cycle phase was reached generally above 10 cycles, therefore, the
half‐life value is appropriate as the stable behavior during LCF loadings. Figure 6 shows the cyclic
stress response behavior of Alloy 617 at different applied total strain ranges. Almost all of the stress
amplitude paths of Alloy 617 at 950 °C exhibit a cyclic softening region for the major portion of the
life, as shown in Figure 6a. At the end of the test, the stress amplitude was decreased rapidly as a
formation of macro‐crack initiation or just prior to failure. Under the lowest total strain range, i.e.,
0.9%, a short saturation phase was also observed with a longer fatigue resistance. Figure 6b shows
that the peak tensile and compressive stress response under different applied total strain ranges were
of the same magnitude. At all the testing conditions, the peak tensile and compressive stresses as a
function of cycle (Figure 6b) reached a stable value within less than 30 cycles. Also, it is noted that
the cyclic stress response behavior is consistent with the shape of the cyclic stress–strain hysteresis
loops shown in Figure 5.
(a)
(b)
Figure 5. Stress–strain hysteresis loops plotted at: (a) Half‐life cycle under different total strain ranges;
(b) Interval hysteresis loops for the 0.9% total strain range of Alloy 617 at 950 °C.
-1.0 -0.8 -0.6 -0.4 -0.2 0.0 0.2 0.4 0.6 0.8 1.0
-200
-100
0
100
200
Cyclic
Monotonic
T = 1.2%
T = 1.5%
Stra
in,
1e-3/s, 950C
Stress (MPa)
T = 0.9%
-1.0 -0.8 -0.6 -0.4 -0.2 0.0 0.2 0.4 0.6 0.8 1.0
-200
-100
0
100
200
Final
Half
510
1
Str
ain
,
Stress (MPa)
Figure 5. Stress–strain hysteresis loops plotted at: (a) Half-life cycle under different total strain ranges;(b) Interval hysteresis loops for the 0.9% total strain range of Alloy 617 at 950 ◦C.
Metals 2017, 7, 54 6 of 14Metals 2017, 7, 54 6 of 14
(a)
(b)
Figure 6. Cyclic stress response curves of Alloy 617 at 950 °C: (a) Stress amplitude path behavior; (b)
Peak and tensile compressive stresses response as a function of the number of cycles.
In this section, the LCF data are systematically analyzed to describe the material properties. The
total strain can be determined as plastic and elastic strain elements through the cyclic stress–strain
relationship, as described in Equation (1):
1/
2 2 2 2 2eT PΔεΔε Δε Δσ Δσ
n
E K
(1)
where ΔεT/2 is the total strain amplitude, Δεe/2 is the elastic strain amplitude, Δεp/2 is the plastic strain
amplitude, Δσ is the stress magnitude, E is the elastic modulus, K′ and n′ are the cyclic strength
coefficient and cyclic strain hardening exponent, respectively.
The above equation can be simplified between the stress magnitude and plastic strain
components for describing the material response behavior. Using the well‐known Ramberg–Osgood
relationship, the linear regression can be taken and is provided as a measure to cyclic straining as
follows:
2 2
pΔεΔσn
K
(2)
Figure 7 shows the cyclic stress response versus plastic strain amplitude at half‐life. The material
constants of the Ramberg–Osgood relationship, K′ and n′, can be reasonably obtained through the
cyclic stress–strain curves by linear regression of log–log scale. The K′ value was obtained with about
83.2 (MPa), and n′ value was −0.097. The negative sign in the slope means that the stress flow was
decreasing continuously with an increase in plastic flow. This cyclic behavior of Alloy 617 indicates
the cyclic softening mechanism as a function of the total strain range. This finding is in good
agreement with that of the empirical rule (σuts/σys < 1.2), in which metallic materials will cyclically
100 101 102 103150
200
250
300
350
400
Tot
al S
tres
s A
mpl
itud
e,
(M
Pa)
Number of cycles
0.9% 1.2% 1.5%
100 101 102 103-200
-150
-100
-50
0
50
100
150
200
Pea
k st
ress
, MP
a
Number of cycles
0.9% 1.2% 1.5%
Figure 6. Cyclic stress response curves of Alloy 617 at 950 ◦C: (a) Stress amplitude path behavior;(b) Peak and tensile compressive stresses response as a function of the number of cycles.
In this section, the LCF data are systematically analyzed to describe the material properties.The total strain can be determined as plastic and elastic strain elements through the cyclic stress–strainrelationship, as described in Equation (1):
∆εT
2=
∆εe
2+
∆εP
2=
∆σ2E
+
(∆σ2K′
)1/n′
(1)
where ∆εT/2 is the total strain amplitude, ∆εe/2 is the elastic strain amplitude, ∆εp/2 is the plasticstrain amplitude, ∆σ is the stress magnitude, E is the elastic modulus, K′ and n′ are the cyclic strengthcoefficient and cyclic strain hardening exponent, respectively.
The above equation can be simplified between the stress magnitude and plastic strain componentsfor describing the material response behavior. Using the well-known Ramberg–Osgood relationship,the linear regression can be taken and is provided as a measure to cyclic straining as follows:
∆σ2
= K′(
∆εp
2
)n′
(2)
Figure 7 shows the cyclic stress response versus plastic strain amplitude at half-life. The materialconstants of the Ramberg–Osgood relationship, K′ and n′, can be reasonably obtained through thecyclic stress–strain curves by linear regression of log–log scale. The K′ value was obtained with about83.2 (MPa), and n′ value was −0.097. The negative sign in the slope means that the stress flow wasdecreasing continuously with an increase in plastic flow. This cyclic behavior of Alloy 617 indicates thecyclic softening mechanism as a function of the total strain range. This finding is in good agreementwith that of the empirical rule (σuts/σys < 1.2), in which metallic materials will cyclically soften;

Metals 2017, 7, 54 7 of 14
in this study, we found that (σuts/σys = 1.134). According to Wright et al. [6], they confirmed that adecrease in peak flow stress followed by an increase in the strain range is characteristic of a solutedrag creep deformation mechanism. Also, it has been reported in previous work that a consequence ofthe solute drag creep mechanism operating during LCF of Alloy 617 at high temperature ranges of900–950 ◦C [6,7] was due to the amount of solute atoms motion, which reduces the flow stress.
Metals 2017, 7, 54 7 of 14
soften; in this study, we found that (σuts/σys = 1.134). According to Wright et al. [6], they confirmed
that a decrease in peak flow stress followed by an increase in the strain range is characteristic of a
solute drag creep deformation mechanism. Also, it has been reported in previous work that a
consequence of the solute drag creep mechanism operating during LCF of Alloy 617 at high
temperature ranges of 900–950 °C [6,7] was due to the amount of solute atoms motion, which reduces
the flow stress.
Figure 7. The cyclic stress–strain behavior of Alloy 617 at 950 °C determined through the Ramberg–
Osgood relationship.
Branco et al. [10] reported that evaluation of the variation of the cyclic softening with the total
strain range during cyclic loading can be done through the characterization of the degree of softening
(DOS), as given in Equation (3):
/ 2 / 2
/ 2
max
max
Δσ ΔσDOS
Δσ
(3)
where Δσ/2max and Δσ/2 represent the maximum stress amplitude and the stress amplitude at the
half‐life, respectively. Figure 8 shows the degree of softening calculated as the total strain range
dependency. According to the result, a continuous increase in the softening rate acts as a function of
total strain ranges. This mechanism occurred as a decrease in flow stress to enforce the total strain
range in the high temperature regime, and thus an increase in the magnitude of the softening rate.
Figure 8. Degree of softening as a function of the total strain range of Alloy 617 at 950 °C.
0.002 0.004 0.006 0.008 0.01100
120
140
160
180
200
Str
ess
amp
litu
de, M
Pa
Plastic strain range, mm/mm
0.097
1.922 2
p
0.8 1.0 1.2 1.4 1.66
8
10
12
14
16
Deg
ree
of s
ofte
nin
g (%
)
Total strain range, (%)
2 2
2
m
mDOS
Figure 7. The cyclic stress–strain behavior of Alloy 617 at 950 ◦C determined through the Ramberg–Osgoodrelationship.
Branco et al. [10] reported that evaluation of the variation of the cyclic softening with the totalstrain range during cyclic loading can be done through the characterization of the degree of softening(DOS), as given in Equation (3):
DOS =(∆σ/2)max − (∆σ/2)
(∆σ/2)max (3)
where ∆σ/2max and ∆σ/2 represent the maximum stress amplitude and the stress amplitude at thehalf-life, respectively. Figure 8 shows the degree of softening calculated as the total strain rangedependency. According to the result, a continuous increase in the softening rate acts as a function oftotal strain ranges. This mechanism occurred as a decrease in flow stress to enforce the total strainrange in the high temperature regime, and thus an increase in the magnitude of the softening rate.
Metals 2017, 7, 54 7 of 14
soften; in this study, we found that (σuts/σys = 1.134). According to Wright et al. [6], they confirmed
that a decrease in peak flow stress followed by an increase in the strain range is characteristic of a
solute drag creep deformation mechanism. Also, it has been reported in previous work that a
consequence of the solute drag creep mechanism operating during LCF of Alloy 617 at high
temperature ranges of 900–950 °C [6,7] was due to the amount of solute atoms motion, which reduces
the flow stress.
Figure 7. The cyclic stress–strain behavior of Alloy 617 at 950 °C determined through the Ramberg–
Osgood relationship.
Branco et al. [10] reported that evaluation of the variation of the cyclic softening with the total
strain range during cyclic loading can be done through the characterization of the degree of softening
(DOS), as given in Equation (3):
/ 2 / 2
/ 2
max
max
Δσ ΔσDOS
Δσ
(3)
where Δσ/2max and Δσ/2 represent the maximum stress amplitude and the stress amplitude at the
half‐life, respectively. Figure 8 shows the degree of softening calculated as the total strain range
dependency. According to the result, a continuous increase in the softening rate acts as a function of
total strain ranges. This mechanism occurred as a decrease in flow stress to enforce the total strain
range in the high temperature regime, and thus an increase in the magnitude of the softening rate.
Figure 8. Degree of softening as a function of the total strain range of Alloy 617 at 950 °C.
0.002 0.004 0.006 0.008 0.01100
120
140
160
180
200
Str
ess
amp
litu
de, M
Pa
Plastic strain range, mm/mm
0.097
1.922 2
p
0.8 1.0 1.2 1.4 1.66
8
10
12
14
16
Deg
ree
of s
ofte
nin
g (%
)
Total strain range, (%)
2 2
2
m
mDOS
Figure 8. Degree of softening as a function of the total strain range of Alloy 617 at 950 ◦C.

Metals 2017, 7, 54 8 of 14
3.2. Low Cycle Fatigue Damage Evaluation
The axial strain control cycling test provides the important information on the strain–liferelationship. Therefore, the Alloy 617 may represent a typical Coffin–Manson life dependence on thetotal strain range. The well-known Coffin–Manson fatigue design method, or strain–life relationship,correlates the number of cycles, Nf, with the strain profile during LCF loadings. This model can beused to model the LCF problem, when the plastic strain range, ∆εp, is the same or even larger thanthe elastic strain range, ∆εe. The Coffin–Manson method can be worked out with the stress–strain(log scale) relationship to describe the hysteresis loop and considers the cyclic softening or hardeningof the material.
The Coffin–Manson relationship consists of elastic and plastic strain elements. The first approachis the relation between stress amplitude and fatigue life, which in turn determines the elastic straindefinition. Equation (4) is proposed:
∆σ2E
=σ′fE(2Nf)
b ⇔ ∆εe
2=σ′fE(2Nf)
b (4)
where σf′ is the fatigue strength coefficient, b is the fatigue strength exponent, and 2Nf is the number
of reversals to failure. From Equation (4), the material constants can be determined through the linearrelationship in a log–log scale using a least square fit method based on experimental data.
The strain based as a dependence parameter can be separated into the plastic and elastic strainranges. In the LCF regime, the correlation between the plastic strain amplitude and the fatigue life isexpressed by:
∆εP
2= ε′f(2Nf)
c (5)
where εf′ is the fatigue ductility coefficient and c is the fatigue ductility exponent. The material
constants can be determined through the least square fit method as well. Alloy 617 resistance to thetotal strain ranges can be defined by the summation of its elastic and plastic deformation, which areexpressed by Coffin–Manson relationships. Equation (6) graphically represents the Coffin–Mansoncurves of strain amplitude and the number of reversals to failure, as shown in Figure 9. All materialconstants are listed in Table 3. The c slope value was determined as about −0.80. This value iscomparable to the literature review [6], where they found the c slope of ≈−1 at 950 ◦C. At all totalstrain ranges, it could be seen that the plastic regime controlled the fatigue deformation. The domain isin the intersection between the plastic and elastic strain line, called by the transition of the fatigue life,(Nt = 3789 cycles). When 2Nf is lower than Nt, a plastic strain is dominant and the ductility governsthe fatigue resistance. Otherwise, when 2Nf is higher than Nt, the elastic strain is dominant and thestrength governs the fatigue resistance. Furthermore, an excellent correlation between predicted lifeand experimental data through the Coffin–Manson relationship can be observed of Alloy 617 underthe isothermal condition with a value of 5.11% error variance.
∆εT
2=
∆εP
2+
∆εe
2= 1.74× 10⁻³(2Nf)
−0.063 + 1.249(2Nf)−0.80 (6)

Metals 2017, 7, 54 9 of 14Metals 2017, 7, 54 9 of 14
Figure 9. The Coffin–Manson curves of Alloy 617 at the 950 °C condition.
Table 3. The Coffin–Manson coefficients of Alloy 617 completed at 950 °C and a strain rate of 10−3/s.
Parameters Values
Fatigue ductility coefficient, εf′ 1.249
Fatigue ductility exponent, c −0.80
Fatigue strength coefficient, σf′ (MPa) 250.4
Fatigue strength exponent, b −0.063
One of the proposed models that seems to be more complex, is the so‐called strain energy density
based model. The fatigue of materials is a specific energy consuming process with an absorption of
the cyclic deformation, and the fatigue life can be characterized by this absorbed mechanical energy
[11]. The fatigue life analysis procedure based on total strain energy density has been used to separate
the effect of microstructures on the fatigue life. The total dissipated energy is the sum of the plastic
energy and the elastic energy in (MJ/m3). This parameter model has been found to play an important
role in the LCF damage process [10–13]. Figure 10 represents the evolutions of several fatigue damage
parameters with the number of cycles on Alloy 617 where each parameter is normalized by its
maximum value. As is seen, the peak stress amplitude and plastic strain energy density experienced
variation at the ultimate phase. On the other hand, the plastic strain is more homogeneous during
cycles at high temperature. In this case, the magnitude of stress and plastic strain are related to the
active slip movement and its resistance, respectively.
Figure 10. Evolutions of fatigue damage parameters: plastic strain energy absorbed per cycle, plastic
strain amplitude, and peak tensile stress.
102 103 10410-4
10-3
10-2
Plastic Strain Elastic Strain Total Strain
/2
Str
ain
Am
plit
ud
e
Number of reversals, 2Nf
2Nt = 7577 cycles
Ductilitycontrols
0 100 200 300 400 500 600 700 8000.0
0.2
0.4
0.6
0.8
1.0
1.2
1.4
1.6
Plastic Strain Energy Density, Wp
Plastic Strain Amplitude, p
Peak Tensile Stress,
Nor
mal
ized
Fat
igue
Dam
age
Par
amet
ers
Number of cycles, N (cycle)
0.9%, 950C
Figure 9. The Coffin–Manson curves of Alloy 617 at the 950 ◦C condition.
Table 3. The Coffin–Manson coefficients of Alloy 617 completed at 950 ◦C and a strain rate of 10−3/s.
Parameters Values
Fatigue ductility coefficient, εf′ 1.249
Fatigue ductility exponent, c −0.80Fatigue strength coefficient, σf
′ (MPa) 250.4Fatigue strength exponent, b −0.063
One of the proposed models that seems to be more complex, is the so-called strain energy densitybased model. The fatigue of materials is a specific energy consuming process with an absorptionof the cyclic deformation, and the fatigue life can be characterized by this absorbed mechanicalenergy [11]. The fatigue life analysis procedure based on total strain energy density has been usedto separate the effect of microstructures on the fatigue life. The total dissipated energy is the sumof the plastic energy and the elastic energy in (MJ/m3). This parameter model has been found toplay an important role in the LCF damage process [10–13]. Figure 10 represents the evolutions ofseveral fatigue damage parameters with the number of cycles on Alloy 617 where each parameter isnormalized by its maximum value. As is seen, the peak stress amplitude and plastic strain energydensity experienced variation at the ultimate phase. On the other hand, the plastic strain is morehomogeneous during cycles at high temperature. In this case, the magnitude of stress and plasticstrain are related to the active slip movement and its resistance, respectively.
Metals 2017, 7, 54 9 of 14
Figure 9. The Coffin–Manson curves of Alloy 617 at the 950 °C condition.
Table 3. The Coffin–Manson coefficients of Alloy 617 completed at 950 °C and a strain rate of 10−3/s.
Parameters Values
Fatigue ductility coefficient, εf′ 1.249
Fatigue ductility exponent, c −0.80
Fatigue strength coefficient, σf′ (MPa) 250.4
Fatigue strength exponent, b −0.063
One of the proposed models that seems to be more complex, is the so‐called strain energy density
based model. The fatigue of materials is a specific energy consuming process with an absorption of
the cyclic deformation, and the fatigue life can be characterized by this absorbed mechanical energy
[11]. The fatigue life analysis procedure based on total strain energy density has been used to separate
the effect of microstructures on the fatigue life. The total dissipated energy is the sum of the plastic
energy and the elastic energy in (MJ/m3). This parameter model has been found to play an important
role in the LCF damage process [10–13]. Figure 10 represents the evolutions of several fatigue damage
parameters with the number of cycles on Alloy 617 where each parameter is normalized by its
maximum value. As is seen, the peak stress amplitude and plastic strain energy density experienced
variation at the ultimate phase. On the other hand, the plastic strain is more homogeneous during
cycles at high temperature. In this case, the magnitude of stress and plastic strain are related to the
active slip movement and its resistance, respectively.
Figure 10. Evolutions of fatigue damage parameters: plastic strain energy absorbed per cycle, plastic
strain amplitude, and peak tensile stress.
102 103 10410-4
10-3
10-2
Plastic Strain Elastic Strain Total Strain
/2
Str
ain
Am
plit
ud
e
Number of reversals, 2Nf
2Nt = 7577 cycles
Ductilitycontrols
0 100 200 300 400 500 600 700 8000.0
0.2
0.4
0.6
0.8
1.0
1.2
1.4
1.6
Plastic Strain Energy Density, Wp
Plastic Strain Amplitude, p
Peak Tensile Stress,
Nor
mal
ized
Fat
igue
Dam
age
Par
amet
ers
Number of cycles, N (cycle)
0.9%, 950C
Figure 10. Evolutions of fatigue damage parameters: plastic strain energy absorbed per cycle, plasticstrain amplitude, and peak tensile stress.

Metals 2017, 7, 54 10 of 14
The plastic strain energy density is characterized by the inside area of the hysteresis loop. Hence,the plastic strain energy density is related to the absorption of plastic deformation during cyclic loading.The inside area can be integrally evaluated through the empirical equation or based on the previousmaterial constants obtained in the strain–life relationship. Therefore, the plastic strain energy, ∆Wp,and number of reversals can be satisfied using the following Equation:
∆Wp =
ε∫0
∆σdεp =
(1− n′
1 + n′
)∆σ∆εp = 4
(1− n′
1 + n′
)σ′fε′f(2Nf)
b+c (7)
To consider the effect of mean stress, especially during the tensile portion, S. Hyuk et al. [13] adoptedthe tensile mean stress effect, i.e., a tensile elastic strain energy density, ∆We. In the case of longerfatigue life, the plastic deformation is difficult to measure. The summation of this can be used to ouradvantage for parameter determination. The elastic strain energy is related to the material propertiessuch as the elastic modulus and the stress of material during LCF. Thus, the relation can be determinedthrough the following Equation:
∆We =
ε∫0
∆σdεe =1
2E
(∆σ2
)2(8)
As mentioned above, the total strain energy density, ∆WT, is the summation of the plastic strain energyand the elastic strain energy density (∆WT = ∆Wp + ∆We). This formulation is more suitable for fullyreversed tests. From this point of view, the strain energy density is related to the number of cycles(or number of reversals) through power law, and can be estimated by the following equation:
∆WT =
ε∫0
∆σdεp +
ε∫0
∆σdεe (9)
∆WT = A(
2N f
)α∆2Nf =
(∆WT
A
)1/α(10)
where the material constants A and α are the material energy absorption capacity and the fatigueexponent, respectively. These material constants can be determined from the universal slope basedon the experimental data. Figure 11 shows the fatigue life curves based on the total and plastic strainenergy dissipated per cycle. There was no significant difference of the related constants, and both thecurves exhibit good linearity and can be satisfied through the linear regression. From that, the existingenergy absorbed during the mean strain is very small, thus the effect of the mean strain is noticed tobe the minor influence. Specifying the total strain energy per cycle is used for the fatigue life studiedat hand. The A value was obtained with about 436.5, and the α value was −0.7 from the best fit to theexperimental data. The prediction of service lifetime based on the total strain energy density-basedmodel is very close to the proposed function with a scattering value of 6.61%. Using a similar approachand universal slope, the prediction of service lifetime can be derived in a particular operation.Metals 2017, 7, 54 11 of 14
Figure 11. Fatigue life curves based on total and plastic strain energy dissipated per cycle of Alloy 617
at the 950 °C condition.
3.3. Microstructural Investigations
Figure 12 shows the comprehensive SEM images of the LCF cracking of Alloy 617 at (a) 0.9 and
(b) 1.5% total strain range, where the fracture was visible within the gage section. From Figure 12, the
LCF cracks of Alloy 617 illustrate a primary crack and some secondary cracks at the periphery of the
fatigued specimens. The total strain range obviously played an important role in the crack initiation
mechanism. It indicates that the low total strain range, which contains fewer secondary cracks, is
probably due to the lower plastic deformation during LCF testing. The LCF cracks induced by
oxidation levels was also dominant due to the longer time exposed to high temperature at the low
total strain range. Otherwise, the higher total strain ranges that induced the higher plastic
deformation must have favored the higher occurrence of secondary cracks initiating. A thin oxide
layer makes it difficult to observe the crack initiation. The cracking of surface brittle oxides at the
periphery specimen was developed on the grain boundary, and this may induce a weak stress
response, see [5,6]. The reduction in fatigue life under higher total strain ranges is clearly acquired
partly from the activation of the slip system and an increase in plastic deformation in a cycle, and is
evidenced by those non‐linear cracks.
(a) (b)
Figure 12. General view of LCF cracking of Alloy 617 fatigued specimens at 950 °C conditions were
within the gage section: (a) for the 0.9% total strain range; and (b) for the 1.5% total strain range.
In this study, there are two types of crack initiation mechanisms that occur in this Alloy at high
temperature. Crack initiation is formed by precipitate shearing and the slip band inducing pile‐up
dislocations at high strain range (transgranular nature cracking), while crack initiation is induced by
oxidation interactions owing to carbide diffusion from the matrix which is dominant at low strain
range (intergranular oxide cracking) [14]. This phenomenon on the LCF test at 950 °C is similar to the
author’s previous study observed at 900 °C [7]. Figure 13 shows typical OM micrographs on top‐side
photos that are for stage I crack initiation and bottom‐side photos that are for stage II crack
600 1200 1800 2400
2
4
6
8
WT = 2.64 (2N
f)-0.7
Total Energy Plastic EnergyW
T ,
Tot
al S
trai
n E
ner
gy D
ensi
ty (
MJ/
m3 )
Number of reversals, 2Nf
Wp = 2.69 (2N
f)-0.72
Figure 11. Fatigue life curves based on total and plastic strain energy dissipated per cycle of Alloy 617at the 950 ◦C condition.

Metals 2017, 7, 54 11 of 14
3.3. Microstructural Investigations
Figure 12 shows the comprehensive SEM images of the LCF cracking of Alloy 617 at (a) 0.9 and(b) 1.5% total strain range, where the fracture was visible within the gage section. From Figure 12,the LCF cracks of Alloy 617 illustrate a primary crack and some secondary cracks at the peripheryof the fatigued specimens. The total strain range obviously played an important role in the crackinitiation mechanism. It indicates that the low total strain range, which contains fewer secondarycracks, is probably due to the lower plastic deformation during LCF testing. The LCF cracks induced byoxidation levels was also dominant due to the longer time exposed to high temperature at the low totalstrain range. Otherwise, the higher total strain ranges that induced the higher plastic deformation musthave favored the higher occurrence of secondary cracks initiating. A thin oxide layer makes it difficultto observe the crack initiation. The cracking of surface brittle oxides at the periphery specimen wasdeveloped on the grain boundary, and this may induce a weak stress response, see [5,6]. The reductionin fatigue life under higher total strain ranges is clearly acquired partly from the activation of the slipsystem and an increase in plastic deformation in a cycle, and is evidenced by those non-linear cracks.
Metals 2017, 7, 54 11 of 14
Figure 11. Fatigue life curves based on total and plastic strain energy dissipated per cycle of Alloy 617
at the 950 °C condition.
3.3. Microstructural Investigations
Figure 12 shows the comprehensive SEM images of the LCF cracking of Alloy 617 at (a) 0.9 and
(b) 1.5% total strain range, where the fracture was visible within the gage section. From Figure 12, the
LCF cracks of Alloy 617 illustrate a primary crack and some secondary cracks at the periphery of the
fatigued specimens. The total strain range obviously played an important role in the crack initiation
mechanism. It indicates that the low total strain range, which contains fewer secondary cracks, is
probably due to the lower plastic deformation during LCF testing. The LCF cracks induced by
oxidation levels was also dominant due to the longer time exposed to high temperature at the low
total strain range. Otherwise, the higher total strain ranges that induced the higher plastic
deformation must have favored the higher occurrence of secondary cracks initiating. A thin oxide
layer makes it difficult to observe the crack initiation. The cracking of surface brittle oxides at the
periphery specimen was developed on the grain boundary, and this may induce a weak stress
response, see [5,6]. The reduction in fatigue life under higher total strain ranges is clearly acquired
partly from the activation of the slip system and an increase in plastic deformation in a cycle, and is
evidenced by those non‐linear cracks.
(a) (b)
Figure 12. General view of LCF cracking of Alloy 617 fatigued specimens at 950 °C conditions were
within the gage section: (a) for the 0.9% total strain range; and (b) for the 1.5% total strain range.
In this study, there are two types of crack initiation mechanisms that occur in this Alloy at high
temperature. Crack initiation is formed by precipitate shearing and the slip band inducing pile‐up
dislocations at high strain range (transgranular nature cracking), while crack initiation is induced by
oxidation interactions owing to carbide diffusion from the matrix which is dominant at low strain
range (intergranular oxide cracking) [14]. This phenomenon on the LCF test at 950 °C is similar to the
author’s previous study observed at 900 °C [7]. Figure 13 shows typical OM micrographs on top‐side
photos that are for stage I crack initiation and bottom‐side photos that are for stage II crack
600 1200 1800 2400
2
4
6
8
WT = 2.64 (2N
f)-0.7
Total Energy Plastic EnergyW
T ,
Tot
al S
trai
n E
ner
gy D
ensi
ty (
MJ/
m3 )
Number of reversals, 2Nf
Wp = 2.69 (2N
f)-0.72
Figure 12. General view of LCF cracking of Alloy 617 fatigued specimens at 950 ◦C conditions werewithin the gage section: (a) for the 0.9% total strain range; and (b) for the 1.5% total strain range.
In this study, there are two types of crack initiation mechanisms that occur in this Alloy at hightemperature. Crack initiation is formed by precipitate shearing and the slip band inducing pile-updislocations at high strain range (transgranular nature cracking), while crack initiation is induced byoxidation interactions owing to carbide diffusion from the matrix which is dominant at low strainrange (intergranular oxide cracking) [14]. This phenomenon on the LCF test at 950 ◦C is similar to theauthor’s previous study observed at 900 ◦C [7]. Figure 13 shows typical OM micrographs on top-sidephotos that are for stage I crack initiation and bottom-side photos that are for stage II crack propagationof the fatigued specimens for (a) the 0.9% total strain range and (b) the 1.5% total strain range. Most ofthe crack initiation sites were found at the free surface through the intergranular cracking resultingfrom the oxidation of surface-connected precipitates, formed on the grain boundary during hightemperature exposure time. These precipitates were formed due to the high temperature process anddistributed along the grain boundary where cyclic strain is localized [15]. Some damage mechanismsinduced by the slip band can also be found for the high strain range, resulting in transgranular crackingin the interior grain. LCF failure was finally generated by the incorporation of these crack paths.
The bottom-side photos of Figure 13 additionally show the stage II crack propagation of thefatigued specimens. In the propagation region, the LCF cracks were propagated in predominantlytransgranular nature. The strengthening of carbides creates a barrier to prevent intergranular creepby persecution of grain boundary movement. The higher ductility of grain boundary carbides alsoimposed the transgranular cracking. In addition, the as-received microstructure of Alloy 617 is knownto be uniform and stable. Thus, the grain boundary sliding is restricted and the plastic cyclic strain

Metals 2017, 7, 54 12 of 14
is provided by transgranular cracking. However, the crack branching over the grain boundary wasstill observed. For the high total strain range (Figure 13b), fatigue damage is more obvious due to thepresence of more parallel slip bands. These slip orientations are different from each grain. Therefore,the LCF cracks for the high total strain range have a greater degree of surface cracking and morebranches than in the specimens tested at low total strain range. The fatigue damage process of thepropagation mode is identified by the result of the slip band containing extrusions and intrusionsleading to the propagation of a macro-crack within the grain on the specimen surface; finally, at thecritical stage, the coalescence of the macro-cracks was just about to fail [16]. The fracture modes arenot different in either of the total strain range conditions.
Metals 2017, 7, 54 12 of 14
propagation of the fatigued specimens for (a) the 0.9% total strain range and (b) the 1.5% total strain
range. Most of the crack initiation sites were found at the free surface through the intergranular
cracking resulting from the oxidation of surface‐connected precipitates, formed on the grain
boundary during high temperature exposure time. These precipitates were formed due to the high
temperature process and distributed along the grain boundary where cyclic strain is localized [15].
Some damage mechanisms induced by the slip band can also be found for the high strain range,
resulting in transgranular cracking in the interior grain. LCF failure was finally generated by the
incorporation of these crack paths.
The bottom‐side photos of Figure 13 additionally show the stage II crack propagation of the
fatigued specimens. In the propagation region, the LCF cracks were propagated in predominantly
transgranular nature. The strengthening of carbides creates a barrier to prevent intergranular creep
by persecution of grain boundary movement. The higher ductility of grain boundary carbides also
imposed the transgranular cracking. In addition, the as‐received microstructure of Alloy 617 is
known to be uniform and stable. Thus, the grain boundary sliding is restricted and the plastic cyclic
strain is provided by transgranular cracking. However, the crack branching over the grain boundary
was still observed. For the high total strain range (Figure 13b), fatigue damage is more obvious due
to the presence of more parallel slip bands. These slip orientations are different from each grain.
Therefore, the LCF cracks for the high total strain range have a greater degree of surface cracking and
more branches than in the specimens tested at low total strain range. The fatigue damage process of
the propagation mode is identified by the result of the slip band containing extrusions and intrusions
leading to the propagation of a macro‐crack within the grain on the specimen surface; finally, at the
critical stage, the coalescence of the macro‐cracks was just about to fail [16]. The fracture modes are
not different in either of the total strain range conditions.
(a) 0.9% total strain range (b) 1.5% total strain range
Figure 13. Typical OM micrographs of the fatigued specimens of Alloy 617 at 950 °C conditions
showing Stage I and Stage II of LCF cracking: (a) for the 0.9% total strain range; and (b) for the 1.5%
total strain range. OM, Optical Microscopy.
3.4. High Temperature Effects on Low Cycle Fatigue
It is well known that when over exposed to high temperature applications, metal alloys are
oxidized, which significantly reduces their mechanical properties. Figure 14 shows typical
micrographs showing (a) precipitates and cavities formed, and (b) cracks of surface brittle oxides
Figure 13. Typical OM micrographs of the fatigued specimens of Alloy 617 at 950 ◦C conditionsshowing Stage I and Stage II of LCF cracking: (a) for the 0.9% total strain range; and (b) for the 1.5%total strain range. OM, Optical Microscopy.
3.4. High Temperature Effects on Low Cycle Fatigue
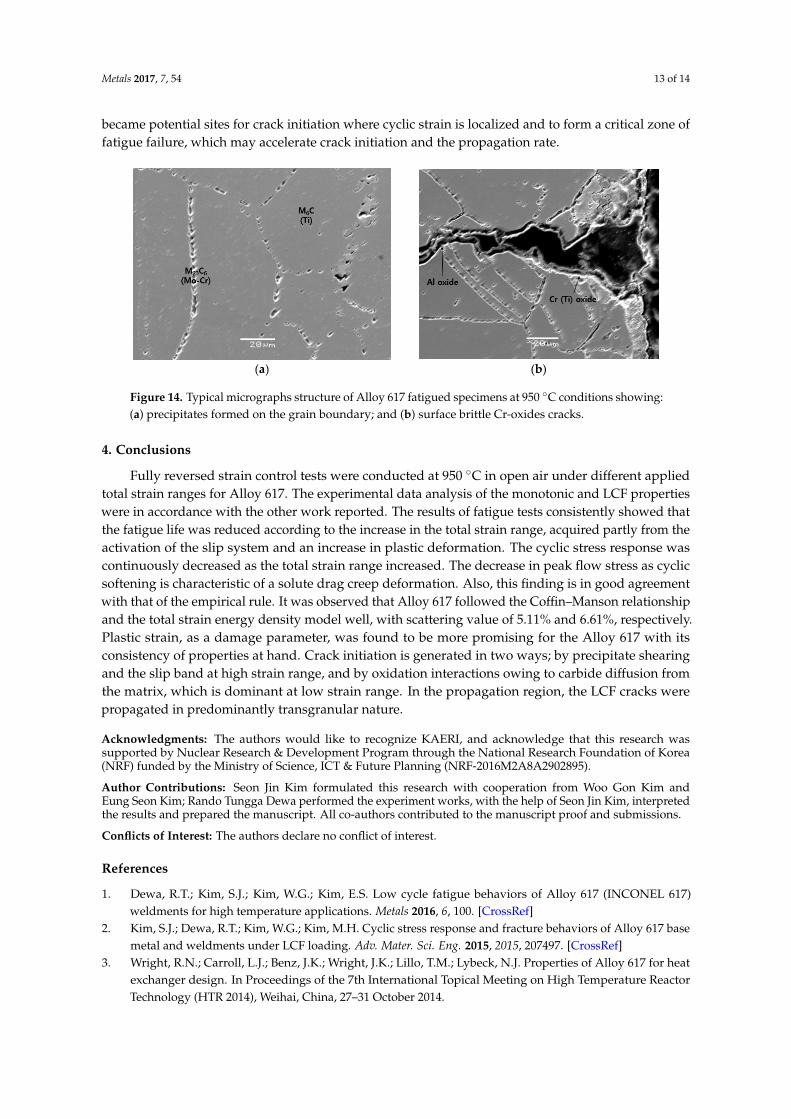
It is well known that when over exposed to high temperature applications, metal alloys areoxidized, which significantly reduces their mechanical properties. Figure 14 shows typical micrographsshowing (a) precipitates and cavities formed, and (b) cracks of surface brittle oxides along the grainboundary during the high temperature LCF testing. The cracks’ opening will appear after the LCFtest due to intergranular precipitations. EDX spectroscopy shows that the primary carbides of Ti-richM6C, with large precipitations, were formed in the body of the grain structure and the carbides ofMo, Cr-rich M23C6 were developed mainly on the grain boundary. These precipitates (especiallyMo, Cr-rich M23C6) were diffused with oxygen ions simultaneously and adapted with metal ions tocreate a protective oxide layer, namely Cr2O3 on the surface of Alloy 617. The internal-oxide layerswere generated between the surface oxide layer and the bulk material, in which the precipitates werecoarsened. The second layer was observed as the carbide depleted zone, and it is mainly composed ofAl-oxide (Al2O3) [16,17]. When the cracks are initiated, it was filled with alumina oxide and this oxygendissolution was developed in front of the crack tip. Cracks were following this path preferentiallythrough those brittle alumina [17]. These brittle oxides on the surface-connected grain boundary
Metals 2017, 7, 54 13 of 14
became potential sites for crack initiation where cyclic strain is localized and to form a critical zone offatigue failure, which may accelerate crack initiation and the propagation rate.
Metals 2017, 7, 54 13 of 14
along the grain boundary during the high temperature LCF testing. The cracks’ opening will appear
after the LCF test due to intergranular precipitations. EDX spectroscopy shows that the primary
carbides of Ti‐rich M6C, with large precipitations, were formed in the body of the grain structure and
the carbides of Mo, Cr‐rich M23C6 were developed mainly on the grain boundary. These precipitates
(especially Mo, Cr‐rich M23C6) were diffused with oxygen ions simultaneously and adapted with
metal ions to create a protective oxide layer, namely Cr2O3 on the surface of Alloy 617. The internal‐
oxide layers were generated between the surface oxide layer and the bulk material, in which the
precipitates were coarsened. The second layer was observed as the carbide depleted zone, and it is
mainly composed of Al‐oxide (Al2O3) [16,17]. When the cracks are initiated, it was filled with alumina
oxide and this oxygen dissolution was developed in front of the crack tip. Cracks were following this
path preferentially through those brittle alumina [17]. These brittle oxides on the surface‐connected
grain boundary became potential sites for crack initiation where cyclic strain is localized and to form
a critical zone of fatigue failure, which may accelerate crack initiation and the propagation rate.
(a) (b)
Figure 14. Typical micrographs structure of Alloy 617 fatigued specimens at 950 °C conditions
showing: (a) precipitates formed on the grain boundary; and (b) surface brittle Cr‐oxides cracks.
4. Conclusions
Fully reversed strain control tests were conducted at 950 °C in open air under different applied
total strain ranges for Alloy 617. The experimental data analysis of the monotonic and LCF properties
were in accordance with the other work reported. The results of fatigue tests consistently showed
that the fatigue life was reduced according to the increase in the total strain range, acquired partly
from the activation of the slip system and an increase in plastic deformation. The cyclic stress
response was continuously decreased as the total strain range increased. The decrease in peak flow
stress as cyclic softening is characteristic of a solute drag creep deformation. Also, this finding is in
good agreement with that of the empirical rule. It was observed that Alloy 617 followed the Coffin–
Manson relationship and the total strain energy density model well, with scattering value of 5.11%
and 6.61%, respectively. Plastic strain, as a damage parameter, was found to be more promising for
the Alloy 617 with its consistency of properties at hand. Crack initiation is generated in two ways; by
precipitate shearing and the slip band at high strain range, and by oxidation interactions owing to
carbide diffusion from the matrix, which is dominant at low strain range. In the propagation region,
the LCF cracks were propagated in predominantly transgranular nature.
Acknowledgments: The authors would like to recognize KAERI, and acknowledge that this research was
supported by Nuclear Research & Development Program through the National Research Foundation of Korea
(NRF) funded by the Ministry of Science, ICT & Future Planning (NRF‐2016M2A8A2902895).
Author Contributions: Seon Jin Kim formulated this research with cooperation from Woo Gon Kim and Eung
Seon Kim; Rando Tungga Dewa performed the experiment works, with the help of Seon Jin Kim, interpreted the
results and prepared the manuscript. All co‐authors contributed to the manuscript proof and submissions.
Conflicts of Interest: The authors declare no conflict of interest.
Figure 14. Typical micrographs structure of Alloy 617 fatigued specimens at 950 ◦C conditions showing:(a) precipitates formed on the grain boundary; and (b) surface brittle Cr-oxides cracks.
4. Conclusions
Fully reversed strain control tests were conducted at 950 ◦C in open air under different appliedtotal strain ranges for Alloy 617. The experimental data analysis of the monotonic and LCF propertieswere in accordance with the other work reported. The results of fatigue tests consistently showed thatthe fatigue life was reduced according to the increase in the total strain range, acquired partly from theactivation of the slip system and an increase in plastic deformation. The cyclic stress response wascontinuously decreased as the total strain range increased. The decrease in peak flow stress as cyclicsoftening is characteristic of a solute drag creep deformation. Also, this finding is in good agreementwith that of the empirical rule. It was observed that Alloy 617 followed the Coffin–Manson relationshipand the total strain energy density model well, with scattering value of 5.11% and 6.61%, respectively.Plastic strain, as a damage parameter, was found to be more promising for the Alloy 617 with itsconsistency of properties at hand. Crack initiation is generated in two ways; by precipitate shearingand the slip band at high strain range, and by oxidation interactions owing to carbide diffusion fromthe matrix, which is dominant at low strain range. In the propagation region, the LCF cracks werepropagated in predominantly transgranular nature.
Acknowledgments: The authors would like to recognize KAERI, and acknowledge that this research wassupported by Nuclear Research & Development Program through the National Research Foundation of Korea(NRF) funded by the Ministry of Science, ICT & Future Planning (NRF-2016M2A8A2902895).
Author Contributions: Seon Jin Kim formulated this research with cooperation from Woo Gon Kim andEung Seon Kim; Rando Tungga Dewa performed the experiment works, with the help of Seon Jin Kim, interpretedthe results and prepared the manuscript. All co-authors contributed to the manuscript proof and submissions.
Conflicts of Interest: The authors declare no conflict of interest.
References
1. Dewa, R.T.; Kim, S.J.; Kim, W.G.; Kim, E.S. Low cycle fatigue behaviors of Alloy 617 (INCONEL 617)weldments for high temperature applications. Metals 2016, 6, 100. [CrossRef]
2. Kim, S.J.; Dewa, R.T.; Kim, W.G.; Kim, M.H. Cyclic stress response and fracture behaviors of Alloy 617 basemetal and weldments under LCF loading. Adv. Mater. Sci. Eng. 2015, 2015, 207497. [CrossRef]
3. Wright, R.N.; Carroll, L.J.; Benz, J.K.; Wright, J.K.; Lillo, T.M.; Lybeck, N.J. Properties of Alloy 617 for heatexchanger design. In Proceedings of the 7th International Topical Meeting on High Temperature ReactorTechnology (HTR 2014), Weihai, China, 27–31 October 2014.

Metals 2017, 7, 54 14 of 14
4. Smith, G.D.; Yates, D.H. Optimization of the fatigue properties of INCONEL Alloy 617. In Proceedings ofthe International Gas Turbine and Aeroengine Congress and Exposition, Orlando, FL, USA, 3–6 June 1991.
5. Wright, J.K.; Carroll, L.J.; Cabet, C.; Lillo, T.M.; Benz, J.K.; Simpson, J.A.; Lloyd, W.R.; Chapman, J.A.;Wright, R.N. Characterization of elevated temperature properties of heat exchanger and steam generatoralloys. Nucl. Eng. Des. 2012, 251, 252–260. [CrossRef]
6. Wright, J.K.; Carroll, L.J.; Simpson, J.A.; Wright, R.N. Low cycle fatigue of Alloy 617 at 850 ◦C and 950 ◦C.J. Eng. Mater. Technol. 2013, 135, 031005. [CrossRef]
7. Dewa, R.T.; Kim, S.J.; Kim, W.G.; Kim, E.S. Understanding low cycle fatigue behavior of Alloy 617 base metaland weldments at 950 ◦C. Metals 2016, 6, 178. [CrossRef]
8. Lee, H.Y.; Kim, Y.W.; Song, K.N. Preliminary application of the draft code case for alloy 617 for a hightemperature component. J. Mech. Sci. Technol. 2008, 22, 856–863. [CrossRef]
9. Breitling, H.; Dietz, W.; Penkalla, H.J. Evaluation of mechanical properties of the Alloy NiCr22Co12Mo(Alloy 617) for heat exchanging components of HTGRs. In Proceedings of the Specialists’ Meeting onHigh-Temperature Metallic Materials for Gas-Cooled Reactors, Cracow, Poland, 20–23 June 1988.
10. Branco, R.; Costa, J.D.M.; Antunes, F.V.; Perdigão, S. Monotonic and cyclic behavior of DIN 34CrNiMo6tempered alloy steel. Metals 2016, 6, 98. [CrossRef]
11. Song, M.S.; Kong, Y.Y.; Ran, M.W.; She, Y.C. Cyclic stress–strain behavior and low cycle fatigue life of castA356 alloys. Int. J. Fatigue 2011, 33, 1600–1607. [CrossRef]
12. Lee, K.O.; Hong, S.G.; Lee, S.B. A new energy-based fatigue damage parameter in life prediction ofhigh-temperature structural materials. Mater. Sci. Eng. A 2008, 496, 471–477. [CrossRef]
13. Park, S.H.; Hong, S.G.; Lee, B.H.; Bang, W.; Lee, C.S. Low-cycle fatigue characteristics of rolled Mg-3Al-1Znalloy. Int. J. Fatigue 2010, 32, 1835–1842. [CrossRef]
14. Fleury, E.; Rémy, L. Low cycle fatigue damage in nickel-base superalloy single crystals at elevatedtemperature. Mater. Sci. Eng. A 1993, 167, 23–30. [CrossRef]
15. Kim, W.G.; Ekaputra, I.M.W.; Park, J.Y.; Kim, M.H.; Kim, Y.W. Investigation of creep rupture properties in airand He environments of alloy 617 at 800 ◦C. Nucl. Eng. Des. 2016, 306, 177–185. [CrossRef]
16. Jang, C.; Lee, D.; Kim, D. Oxidation behaviour of an Alloy 617 in very high-temperature air and heliumenvironments. Int. J. Press. Vessels Pip. 2008, 85, 368–377. [CrossRef]
17. Cabet, C.; Carroll, L.; Wright, R. Low cycle fatigue and creep-fatigue behavior of Alloy 617 at high temperature.J. Press. Vessel Technol. 2013, 135, 061401. [CrossRef]
© 2017 by the authors; licensee MDPI, Basel, Switzerland. This article is an open accessarticle distributed under the terms and conditions of the Creative Commons Attribution(CC BY) license (http://creativecommons.org/licenses/by/4.0/).