effect of sub- and supercritical water treatments on the
TRANSCRIPT

1
Effect of Sub- and Supercritical Water Treatments on the Physicochemical Properties of
Crab Shell Chitin and its Enzymatic Degradation
Mitsumasa OSADA a,*, Chika MIURAb, Yuko S. NAKAGAWAb, Mikio KAIHARAb,
Mitsuru NIKAIDOb, and Kazuhide TOTANIb
a Division of Chemistry and Materials, Faculty of Textile Science and Technology, Shinshu
University, 3-15-1, Tokida, Ueda, Nagano, 386-8567, Japan
b Department of Chemical Engineering, National Institute of Technology, Ichinoseki College,
Takanashi, Hagisho, Ichinoseki, Iwate, 021-8511, Japan
*Corresponding Author: Mitsumasa OSADA;
Division of Chemistry and Materials, Faculty of Textile Science and Technology, Shinshu
University, 3-15-1, Tokida, Ueda, Nagano, 386-8567, Japan
Tel.: +81-268-21-5458; Fax: +81-268-21-5391;
E-mail: [email protected]
brought to you by COREView metadata, citation and similar papers at core.ac.uk
provided by Shinshu University Institutional Repository
2
Abstract
This study examined the effects of sub- and supercritical water pretreatments on the
physicochemical properties of crab shell α-chitin and its enzymatic degradation to obtain
N,N’-diacetylchitobiose (GlcNAc)2. Following sub- and supercritical water pretreatments, the
protein in the crab shell was removed and the residue of crab shell contained α-chitin and
CaCO3. Prolonged pretreatment led to α-chitin decomposition. The reaction of pure α-chitin
in sub- and supercritical water pretreatments was investigated separately; we observed lower
mean molecular weight and weaker hydrogen bonds compared with untreated α-chitin.
(GlcNAc)2 yields from enzymatic degradation of subcritical (350C, 7 min) and supercritical
water (400C, 2.5 min) pretreated crab shell were 8% and 6%, compared with 0% without any
pretreatment. This study shows that sub- and supercritical water pretreatments of crab shell
provide to an alternative method to the use of acid and base for decalcification and
deproteinization of crab shell required for (GlcNAc)2 production.
Keywords: Chitin; Enzymatic degradation; Marine biomass; N-acetyl glucosamine;
Hydrothermal treatment
3
1. Introduction
Chitin is the second most abundant biomass on earth after cellulose and is a major
component of the cell walls of fungi as well as of the exoskeletons of insects and crustaceans
(Ravi Kumar et al., 2004). N,N’-diacetylchitobiose, (GlcNAc)2, is a dimer of N-acetyl
glucosamine (GlcNAc). GlcNAc, derived from crustacean chitin (α-chitin), is a versatile,
functional compound used in skin moisturizers, analgesics for joint pain, and antitumoral and
antimicrobial agents (Muzzarelli, 2011; Muzzarelli et al., 2012). (GlcNAc)2 is also a useful
product, acting as an inducer in the production of chitinolytic enzymes (Uchiyama et al.,
2003). Moreover, it is a suitable building block for the production of chitin oligomers by
enzymatic transglycosylation (Usui et al., 1990). Chitin oligomers have elicitor activities in
plants and have been implicated in the activation of immune responses, the regulation of
intentional inflammation, and the stimulation of bifidobacteria growth (Aam et al., 2010;
Hirano, 2004). The production of α-chitin from crab shells involves numerous steps that
require a strong acid and a base to remove CaCO3 and protein in the crab shell. If the direct
conversion of crab shell to (GlcNAc)2 can be achieved using enzymes, it would not be
necessary to use deleterious substances or to produce an excessive amounts of waste water,
thereby allowing for a more environmentally friendly process.
Sub- and supercritical water (Tc = 374.3C, Pc = 22.1 MPa) have been recognized as
a green chemical medium for some organic reactions that can proceed without any catalyst.

4
Previously, we have reported that sub- and supercritical water pretreatments improve
enzymatic degradation of pure α-chitin (Osada et al., 2012). The (GlcNAc)2 yield after
enzymatic degradation with optimum supercritical water pretreatment at 400C for 1.0 min
was about 7 times greater than that without pretreatment. Although sub- and supercritical
water pretreatments were effective for enzymatic degradation of pure α-chitin, the effect of
these pretreatments on crab shell has not been investigated.
The effect of sub- and supercritical water treatments on α-chitin present in biomass
such as crab shell has been reported. Quitain et al. (2001) treated shrimp shell in sub- and
supercritical water up to 400C, and obtained amino acids through the hydrolysis of proteins
in the shrimp shell. However, they could not obtain glucosamine from shrimp shell and
claimed that glucosamine might decompose in sub- and supercritical water. Nakamura et al.
(2007) treated crab shell in subcritical water up to 350C, and reported that protein was
removed at temperature ranging from 260C to 320C, after 1 to 20 min of treatment. In
subcritical water, the decomposition of α-chitin was also promoted; however, GlcNAc and
glucosamine were not obtained as products. On the other hand, they reported that CaCO3 was
stable up to 350C. Some reports suggest that sub- and supercritical water treatments on their
own are not sufficient to obtain (GlcNAc)2 and GlcNAc from crab shell, because under these
conditions, (GlcNAc)2 and GlcNAc decompose at the same time that the α-chitin is
hydrolyzed (Aida et al., 2014; Sakanishi et al., 1999).
5
In this study, we used pretreatment of crab shell in sub- and supercritical water for
enzymatic degradation and investigated the conditions that promote enzymatic degradation to
obtain (GlcNAc)2 directly. We have previously reported the effect of sub- and supercritical
water pretreatments on the properties of pure α-chitin; in this study, we have analyzed new
data to obtain deeper insights into the structural changes in α-chitin. We will discuss the
effect of sub- and supercritical water pretreatments on crab shell properties in comparison
with those of pure α-chitin.
2. Materials and Methods
2.1. Materials and enzymes
Crab shell and pure α-chitin were obtained from Yaizu Suisankagaku Industry Co.
Ltd. The flake size of the crab shell or pure α-chitin was approximately 3 mm × 3 mm × 0.5
mm. The pure α-chitin was obtained from crab shell by acid and base treatments. The source
of enzymes has been reported previously (Osada et al., 2012).
2.2. Sub- and supercritical water pretreatments
The method used for the pretreatment of crab shell or pure α-chitin with sub- and
supercritical water has been reported previously (Osada et al., 2012). Crab shell or pure
α-chitin (0.2 g) and water (3 g) were loaded in the reactor. The treatment conditions used in

6
this study were 400°C, 350°C, and 300°C for 0.5–40 min. After sub- and supercritical water
pretreatments, the crab shell or pure α-chitin was dried at 90°C for 24 h.
2.3. Weight change
We evaluated the weight change of the crab shell or pure α-chitin after sub- and
supercritical water treatments as given below:
2.4. X-ray diffraction (XRD)
Equatorial diffraction profiles of crab shell were obtained with Cu-Kα from a
powder X-ray generator (Japan Electronic Organization Co. Ltd., JDX-3530), operating at 30
kV and 30 mA.
2.5. Fourier transform infrared (FTIR) spectroscopy
The FTIR spectra of crab shell were measured using a Nicolet iS10 spectrometer
(Thermo Fisher Scientific Inc.).
2.6. Molecular weight distribution
The molecular weight distribution of pure α-chitin was measured using a gel

7
permeation chromatography (GPC) system. The details of the GPC analysis have been
reported previously (Osada et al., 2013b).
2.7. Thermo gravimetric analysis (TG)
Thermal analysis of pure α-chitin was conducted in a nitrogen atmosphere using a
TG instrument (Rigaku, Thermo plus EVO TG-8120). The temperature program was set to
produce a temperature range of 30–600C, at a rate of 20C min–1.
2.8. Laser scanning microscopy
The surface micrograph and roughness patterns of pure α-chitin were measured
using a 3D confocal laser scanning microscope (Keyence Corp., VK-9710). The
magnification of the objective lens was set to 50 times.
2.9. Enzymatic degradation of crab shell or pure α-chitin
Enzymatic degradation of crab shell (or pure α-chitin) was conducted using the
following protocol. We mixed 20 mg of crab shell (or pure α-chitin) before and after sub- and
supercritical water pretreatments (1% of final concentration) with 1.8 mL of 10 mmol/L
phosphate buffer (at pH 6.0) and 0.2 mL of 10 mg/mL enzyme, diluted with 10 mmol/L
phosphate buffer (0.1% of final concentration, approximately 100 U). The reaction mixture

8
was shaken at 1400 rpm at 40°C and 0.4 mL of the mixture was harvested at the appropriate
time. The harvested reaction solution was filtered (pore size 0.45 μm, ADVANTEC) after
boiling for 10 min, and centrifuged.
2.10. High-performance liquid chromatography (HPLC)
The HPLC system and the method used have been reported previously (Osada et al.,
2012). The product yield was defined as given below:
The definition of product yield is different from our previous research (Osada et al.,
2012, 2013b) because the exact amount of α-chitin in the crab shell residue after sub- and
supercritical water treatments was not clear. In this study, the denominator of eq. (2) was the
weight before sub- and supercritical water treatments and therefore, it was fixed at 0.2 g. On
the other hand, in our previous research, the denominator was the weight after sub- and
supercritical water treatments and therefore, it changed with the treatment, as in eq. (1).
Consequently, the (GlcNAc)2 yield from pure α-chitin in this study was lower than yield
reported earlier. Some experiments were repeated three times to confirm reproducibility. The
averages of these experiments were shown in the Figs along with the standard errors.
3. Results
9
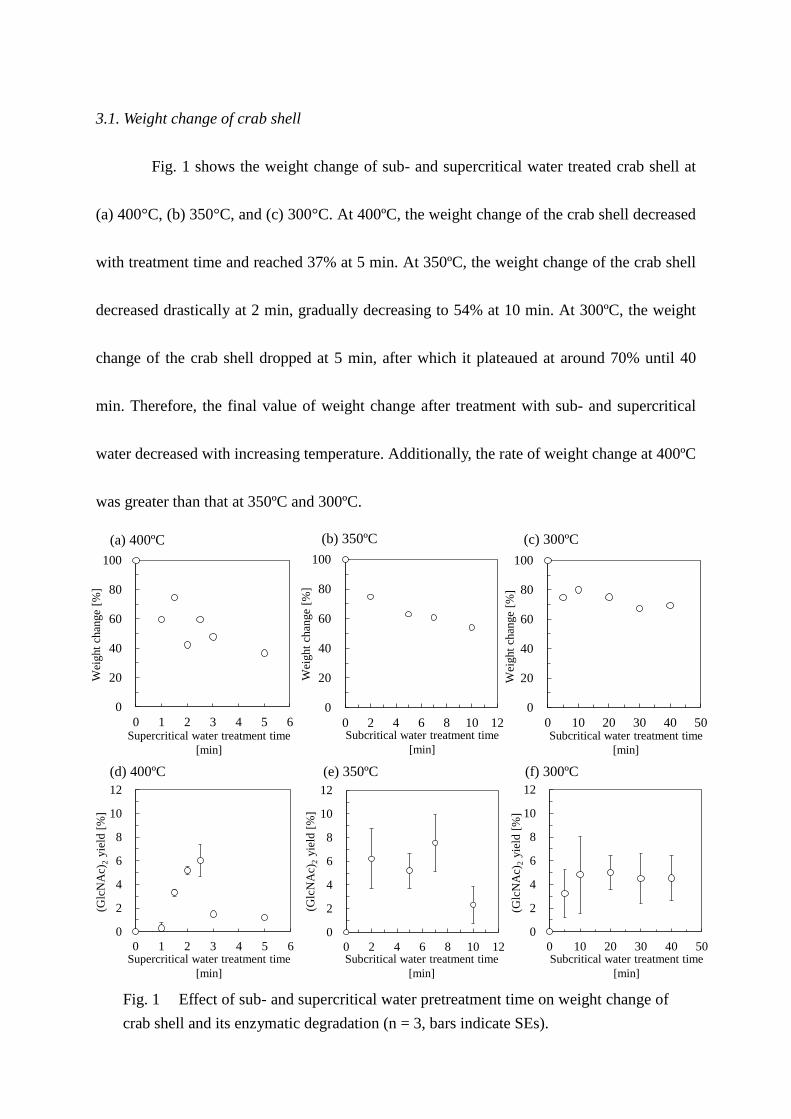
3.1. Weight change of crab shell
Fig. 1 shows the weight change of sub- and supercritical water treated crab shell at
(a) 400°C, (b) 350°C, and (c) 300°C. At 400ºC, the weight change of the crab shell decreased
with treatment time and reached 37% at 5 min. At 350ºC, the weight change of the crab shell
decreased drastically at 2 min, gradually decreasing to 54% at 10 min. At 300ºC, the weight
change of the crab shell dropped at 5 min, after which it plateaued at around 70% until 40
min. Therefore, the final value of weight change after treatment with sub- and supercritical
water decreased with increasing temperature. Additionally, the rate of weight change at 400ºC
was greater than that at 350ºC and 300ºC.
0
2
4
6
8
10
12
0 10 20 30 40 50
0
2
4
6
8
10
12
0 2 4 6 8 10 12
0
2
4
6
8
10
12
0 1 2 3 4 5 6
0
20
40
60
80
100
0 10 20 30 40 50
0
20
40
60
80
100
0 2 4 6 8 10 12
0
20
40
60
80
100
0 1 2 3 4 5 6
Wei
ght
chan
ge
[%]
Supercritical water treatment time
[min]
(a) 400ºC
Subcritical water treatment time
[min]
(b) 350ºC
Wei
ght
chan
ge
[%]
Subcritical water treatment time
[min]
Wei
ght
chan
ge
[%]
(c) 300ºC
(d) 400ºC
Supercritical water treatment time
[min]
(Glc
NA
c)2
yie
ld [
%]
Subcritical water treatment time
[min]
(Glc
NA
c)2
yie
ld [
%]
(e) 350ºC
Subcritical water treatment time
[min]
(Glc
NA
c)2
yie
ld [
%]
(f) 300ºC
Fig. 1 Effect of sub- and supercritical water pretreatment time on weight change of
crab shell and its enzymatic degradation (n = 3, bars indicate SEs).

10
3.2. Enzymatic degradation of crab shell
Fig. 1 (d), (e), and (f) show the effect of sub- and supercritical water treatment on the
yield of (GlcNAc)2 from crab shell after enzymatic degradation for 48 h. The crab shell
contains approximately 30% α-chitin and therefore, the theoretical maximum (GlcNAc)2
yield obtained by enzymatic degradation would be 30%. Zero min of treatment time means
enzymatic degradation of untreated crab shell; however, it was not enzymatically degraded
and the yield of (GlcNAc)2 for 48 h was 0%. At 400ºC, the yield of (GlcNAc)2 increased with
increasing treatment time, reaching 6% at 2.5 min; it then decreased to approximately 1% at 5
min. At 350 ºC, the yield of (GlcNAc)2 peaked at around 7 min, reaching 8%. At 300 ºC, the
yield of (GlcNAc)2 was almost constant after 10 min of treatment time. These results indicate
that the optimum pretreatment temperature is 350ºC, for 7 min. The yields of GlcNAc from
enzymatic degradation of untreated, and sub- and supercritical water treated crab shell for 48
h were less than 0.1%. Therefore, we focused our analysis on (GlcNAc)2. We also analyzed
the aqueous solution recovered after sub- and supercritical water treatment without
subsequent enzymatic treatment. However, (GlcNAc)2 and GlcNAc were not obtained under
these conditions.
Fig. 2 shows the reaction time profile for enzymatic degradation of untreated and
sub- and supercritical water treated crab shell at 400°C for 2.5 min and at 350°C for 7 min

11
those showed peaks of the yields of (GlcNAc)2 in Fig. 1 (d) and (e). Untreated crab shell was
not enzymatically degraded and the yield of (GlcNAc)2 kept 0%. The yields of (GlcNAc)2
after treatment with sub- and supercritical water at 400°C and 350°C increased with
increasing the enzymatic reaction time, reaching 6 and 8%, respectively. Fig. 2 indicates that
complete enzymatic degradation was achieved by 24 h.
0
2
4
6
8
10
12
0 20 40 60
Enzyme reaction time [h]
(Glc
NA
c)2
yie
ld [
%]
○ 350ºC, 7 min
△ 400ºC, 2.5 min
× untreated
3.3. X-ray diffraction (XRD)
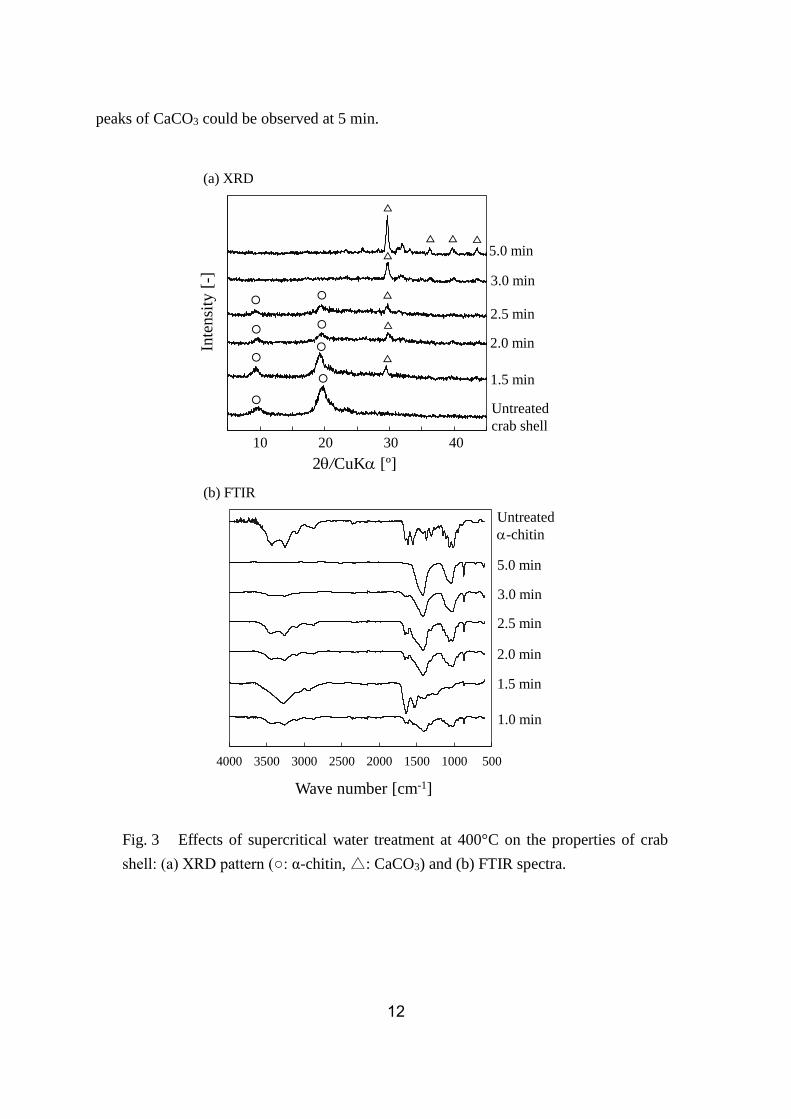
Fig. 3 (a) shows the XRD patterns of untreated and supercritical water treated crab
shell. For untreated crab shell, we observed a peak that was derived from α-chitin. The
α-chitin peak became smaller with increasing treatment time and disappeared at 3.0 min. In
contrast to this, the peak for CaCO3 increased with increasing treatment time and only the
Fig. 2 Reaction time profile for enzymatic degradation of untreated, sub- and
supercritical water treated crab shell (n = 3, bars indicate SEs).
12
peaks of CaCO3 could be observed at 5 min.
2/CuKa [º]
Inte
nsi
ty [
-]
○
○
○
○
○ ○
○ ○
△
△ △ △
△
△
△
△
Untreated
crab shell
1.5 min
2.0 min
2.5 min
3.0 min
5.0 min
10 20 30 40
5001000150020002500300035004000
Wave number [cm-1]
Untreated
a-chitin
1.0 min
2.0 min
2.5 min
3.0 min
5.0 min
1.5 min
(a) XRD
(b) FTIR
Fig. 3 Effects of supercritical water treatment at 400°C on the properties of crab
shell: (a) XRD pattern (○: α-chitin, △: CaCO3) and (b) FTIR spectra.
13
3.4. Fourier transform infrared (FTIR) spectroscopy
Fig. 3 (b) shows the FTIR spectra of supercritical water treated crab shell. The peaks
around 3200–3500 cm–1 and 1500–1700 cm–1 are derived from α-chitin. The peaks around
1400 cm–1 and 870 cm–1 are derived from CaCO3 in the crab shell. The peaks around
1000–1100 cm–1 are generally derived from ethers (C-O-C), namely β-1,4 bond of α-chitin.
The FTIR spectrum at 1 min was a combination of α-chitin and CaCO3. The peak of α-chitin
increased at 1.5 min and decreased after 2 min. In contrast to this, the peak of CaCO3 became
greater after 2 min. At 5 min, the peak of α-chitin disappeared and only the peaks of CaCO3
could be observed.
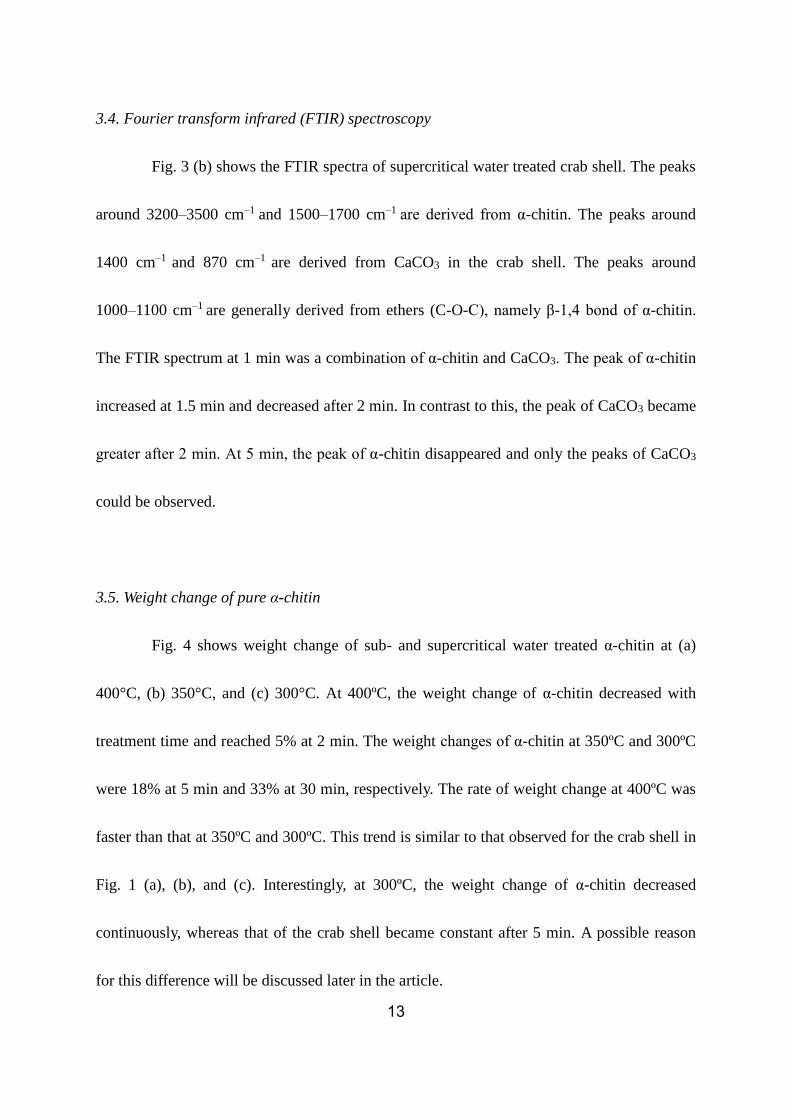
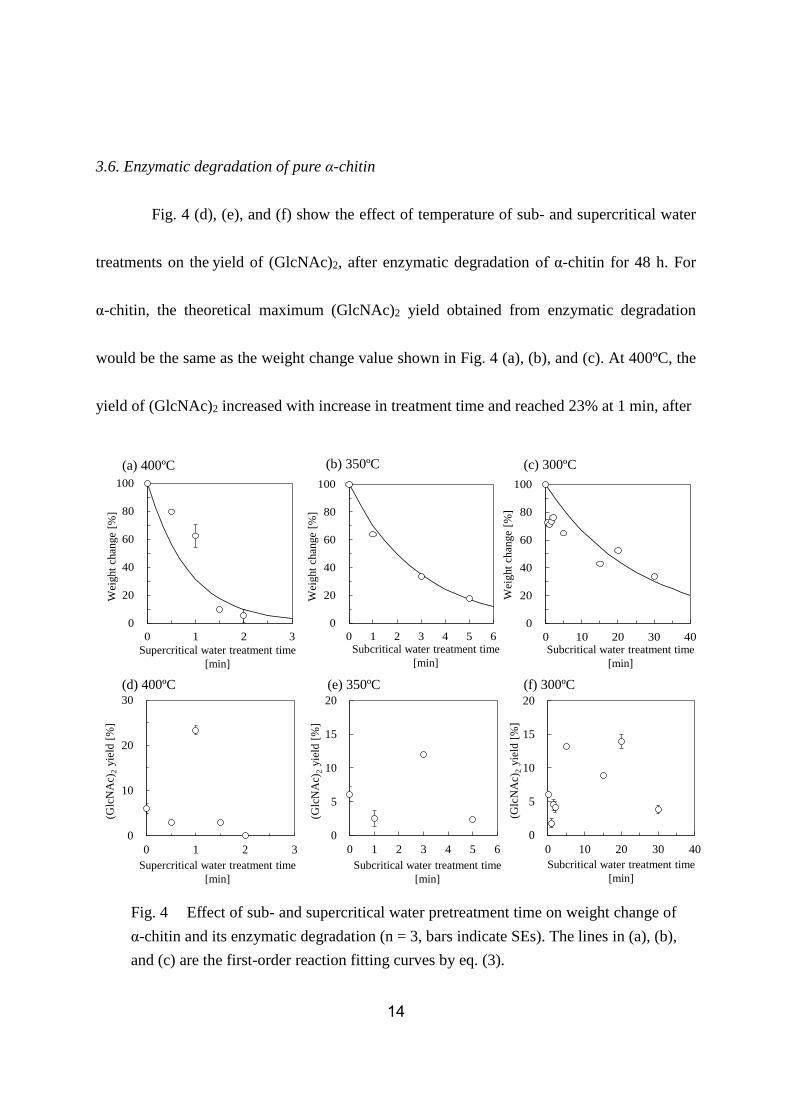
3.5. Weight change of pure α-chitin
Fig. 4 shows weight change of sub- and supercritical water treated α-chitin at (a)
400°C, (b) 350°C, and (c) 300°C. At 400ºC, the weight change of α-chitin decreased with
treatment time and reached 5% at 2 min. The weight changes of α-chitin at 350ºC and 300ºC
were 18% at 5 min and 33% at 30 min, respectively. The rate of weight change at 400ºC was
faster than that at 350ºC and 300ºC. This trend is similar to that observed for the crab shell in
Fig. 1 (a), (b), and (c). Interestingly, at 300ºC, the weight change of α-chitin decreased
continuously, whereas that of the crab shell became constant after 5 min. A possible reason
for this difference will be discussed later in the article.
14
3.6. Enzymatic degradation of pure α-chitin
Fig. 4 (d), (e), and (f) show the effect of temperature of sub- and supercritical water
treatments on the yield of (GlcNAc)2, after enzymatic degradation of α-chitin for 48 h. For
α-chitin, the theoretical maximum (GlcNAc)2 yield obtained from enzymatic degradation
would be the same as the weight change value shown in Fig. 4 (a), (b), and (c). At 400ºC, the
yield of (GlcNAc)2 increased with increase in treatment time and reached 23% at 1 min, after
0
20
40
60
80
100
0 10 20 30 40
0
20
40
60
80
100
0 1 2 3 4 5 6
0
20
40
60
80
100
0 1 2 3
0
10
20
30
0 1 2 3
0
5
10
15
20
0 10 20 30 40
0
5
10
15
20
0 1 2 3 4 5 6
Wei
ght
chan
ge
[%]
Supercritical water treatment time
[min]
(a) 400ºC
Subcritical water treatment time
[min]
(b) 350ºC
Wei
ght
chan
ge
[%]
Subcritical water treatment time
[min]
Wei
ght
chan
ge
[%]
(c) 300ºC
(d) 400ºC
Supercritical water treatment time
[min]
(Glc
NA
c)2
yie
ld [
%]
Subcritical water treatment time
[min]
(Glc
NA
c)2
yie
ld [
%]
(e) 350ºC
Subcritical water treatment time
[min]
(Glc
NA
c)2
yie
ld [
%]
(f) 300ºC
Fig. 4 Effect of sub- and supercritical water pretreatment time on weight change of
α-chitin and its enzymatic degradation (n = 3, bars indicate SEs). The lines in (a), (b),
and (c) are the first-order reaction fitting curves by eq. (3).
15
which it decreased to approximately 0% at 2 min. At 350ºC, the yield of (GlcNAc)2 peaked at
around 3 min, reaching 12%. At 300 ºC, the yield of (GlcNAc)2 increased for 5 min and
stayed constant at approximately 13% until 20 min, finally decreasing to 4% at 30 min. These
results indicate that the optimum pretreatment time required for α-chitin at each treatment
temperature is shorter than that required for crab shell, as shown in Fig. 1.
3.7. Mean molecular weight of pure α-chitin
Fig. 5 (a) shows the effect of reaction time on the mean molecular weight of α-chitin
in supercritical water at 400ºC. Untreated α-chitin flake (at 0 min) did not dissolve
completely in the LiCl/DMAC solvent and we measured the mean molecular weight of only
the soluble part of α-chitin. Therefore, the real mean molecular weight of untreated α-chitin
would be greater than 760 kDa. On the other hand, α-chitin samples after supercritical water
treatment dissolved completely in the LiCl/DMAC solvent. The mean molecular weight
decreased with increasing treatment time and it was 0.9 kDa at 2 min.
3.8. Thermo gravimetric (TG) analysis of pure α-chitin
Fig. 5 (b) shows TG curves of untreated and supercritical water treated α-chitin at
400°C. The curves of untreated and supercritical water treated α-chitin at 0.5 to 1.5 min were
almost the same, only changing at 2 min. These results indicate that the structure of treated

16
α-chitin until 1.5 min remained similar to untreated α-chitin. After 2 min, α-chitin changed to
a carbonaceous material and the weight change as depicted by the TG curve decreased.
0
100
200
300
400
500
600
700
800
0 0.5 1 1.5 2 2.5
Supercritical water treatment time
[min]
Mea
n m
ole
cula
r w
eight
[kD
a]
0 100 200 300 400 500 600
0
20
40
60
80
100
Temperature [C]
Wei
ght
chan
ge
[%]
Untreated
1 min
1.5 min
0.5 min
2 min
(a) Molecular weight
(b) Thermo gravimetric (TG) analysis
Treatment time
(Average of surface
roughness)
Surface image Surface roughness
Untreated
(0.2 µm)
0.5 min
(0.2µm)
1 min
(2 µm)
1.5 min
(3 µm)
2 min
(8 µm)
100 mm
100 mm
100 mm
100 mm
100 mm
(c) Laser scanning microscopy
3.9. Laser scanning microscopy of pure α-chitin
Fig. 5 (c) shows the laser scanning microscopy image of supercritical water treated
Fig. 5 Effects of supercritical water treatment at 400°C on the properties of pure
α-chitin: (a) mean molecular weight, (b) TG curves, and (c) surface roughness
observed by laser scanning microscopy.

17
α-chitin surface at 400°C. The surface roughness was low and under 3 μm until 1.5 min,
increasing to 8 μm at 2 min. The trend of the surface roughness was similar to that of TG
curve, as shown in Fig. 5 (b).
4. Discussion
4.1. Effects of sub- and supercritical water treatments on the properties of crab shell
As seen in Fig. 1 and 4, the weight change of crab shell was less than that of pure
α-chitin at each temperature. Raw crab shell is composed of 30% α-chitin, 30% protein, and
40% CaCO3. It has been reported that protein decomposes to amino acids through hydrolysis
in subcritical water at around 200°C (Quitain et al., 2001). CaCO3 is stable up to 400°C and
40 MPa, and is not soluble in supercritical water (Nakamura et al., 2007). Therefore, the
change in the weight of crab shell at 300°C is mainly due to the decomposition of protein. At
400°C and 350°C, both α-chitin and protein were decomposed to water-soluble products.
From XRD and IR analyses of the crab shell (Fig. 3), peaks derived from α-chitin could be
observed until 2.5 min at 400°C. The peaks from CaCO3 in XRD and IR analyses became
greater after 3 min at 400°C, indicating that the main component of the solid residue was
CaCO3.
In enzymatic degradation of the crab shell, the peaks of (GlcNAc)2 yield were
observed at 2.5 min (at 400°C) and around 7 min (at 350°C). At 300°C, (GlcNAc)2 yield did

18
not show a clear peak and remained at around 5%. These results indicate that the optimum
sub- and supercritical water pretreatment time for crab shell for enzymatic degradation is
after the removal of protein, but before the decomposition of α-chitin. At 300°C, the protein
was hydrolyzed to amino acids and α-chitin was relatively stable. Therefore, the (GlcNAc)2
yield showed a constant value. At 400°C and 350°C, we observed the decomposition of not
only protein but also α-chitin after 2.5 and 7 min, respectively. This was followed by a
decrease in (GlcNAc)2 yield.
A comparison of weight change of crab shell and pure α-chitin indicated that the
α-chitin contained in the crab shell was more stable than pure α-chitin. At 300°C, the weight
change of crab shell after 5 min was about 70% (Fig. 1 (c)), which almost corresponds to the
sum of CaCO3 (40%) and α-chitin (30%). This indicated that α-chitin in the crab shell was
almost stable at 300°C. However, the weight change of pure α-chitin decreased continuously
with increasing treatment time at 300°C (Fig. 4 (c)). These results indicate that the
physicochemical properties of α-chitin contained in the crab shell are different from those of
pure α-chitin. The rate of changes observed in the properties of pure α-chitin as mentioned in
section 4.2 would be slower for α-chitin contained in the crab shell. This is probably due to
acid and base treatments used for α-chitin extraction. In this work, we found that the
treatment time required for maximum (GlcNAc)2 yield from crab shell was longer than that
from pure α-chitin at each temperature. From the experimental results, the optimum treatment
19
times for crab shell at 400°C and 350°C are 2.5 and 7 min, respectively.
Although the optimum reaction time required for the treatment of crab shell was
greater than that for pure α-chitin, the maximum (GlcNAc)2 ratio based on the residual
amount of chitin—as defined in our previous studies (Osada et al., 2012, 2013b)— was
comparable for both crab shell and pure α-chitin. For example, the weight change of crab
shell was 60% at 400°C and 2.5 min, assuming that 30% protein and 10% α-chitin
decomposed. Therefore, 20% α-chitin remained and we obtained a (GlcNAc)2 yield of 6%,
making the (GlcNAc)2 ratio based on the amount of residual chitin 30% (6/20 = 0.3). On the
other hand, the weight change of pure α-chitin was 62% at 400°C and 1 min, indicating 38%
pure α-chitin decomposed, and (GlcNAc)2 yield of 23% was obtained. Therefore, the
(GlcNAc)2 ratio based on the amount of residual chitin was 37% (23/62 = 0.37). Similarly,
(GlcNAc)2 ratio based on the amount of chitin in the crab shell at 350°C and 7 min was 40%
(8/20 = 0.4), and that in pure α-chitin at 350°C and 3 min was 35% (12/34 = 0.35). The
(GlcNAc)2 ratio based on the residual amount of chitin was approximately 30% to 40% for
both crab shell or pure α-chitin, as discussed in Section 4.2. However, it should be noted that
these calculations were based on assumptions of the residual amount of chitin in the crab
shell.
4.2. Effects of sub- and supercritical water treatments on the properties of pure α-chitin

20
The decomposition rate of α-chitin in sub- and supercritical water was evaluated by
assuming the first order reaction kinetics for the residual amount of α-chitin, W(t), at time t.
dW(t)/dt = –k W(t) (3)
where k is the overall reaction rate constant.
The results obtained in Fig. 4 (a), (b), and (c) were fitted with Eq. (3) to evaluate the
rate constant, k. From the analysis of the solid residue of α-chitin by XRD and FT-IR (Osada
et al., 2013b) and the laser scanning microscopy images in Fig. 5 (c), it could be concluded
that α-chitin chemical structure was relatively stable, except supercritical water treatment at
400°C for more than 2 min. Therefore, we did not use these conditions to evaluate the rate
constant, k.
The estimated rate constants are plotted against reciprocal temperature in Fig. 6. The
kinetic parameters at temperature ranging from 300C to 400C such as the apparent
activation energy, Ea, and the preexponential factor A were 108 kJ mol-1 and 106.76,
respectively. The decomposition rate of cellulose as reported in the literature (Peterson et al.,
2008) is shown in Fig. 6; it was greater than that of α-chitin. Sakanishi et al. (1999) reported
that N-acetyl group stabilized the α-chitin crystallite structure because of the additional
hydrogen bond between the N-acetyl and OH group therefore, the hydrolysis of the -1,4
bond of α-chitin was suppressed, as compared with cellulose. Some researchers have reported
the decomposition rate of cellulose in sub- and supercritical water. However, similar reports

21
on α-chitin are limited in number. Aida et al. (2014) claimed that decomposition rate of
α-chitin is greatly affected by particle size and crystallinity. Therefore, it should be noted that
the data shown in Fig. 6 obtained from α-chitin of particle size approximately 3 mm × 3 mm
× 0.5 mm and 90% crystallinity.
Interestingly, the decomposition rate of GlcNAc is greater than that of glucose
(Osada et al. 2013a), which is opposite trend between α-chitin and cellulose. For GlcNAc, the
dehydration proceeds between H-2 and OH-3 because the N-acetyl group is an
electron-withdrawing group and the elimination of H-2 takes place easier, as compared with
glucose. We also reported that the dehydration of (GlcNAc)2 is promoted at the reducing end
of (GlcNAc)2 at lower temperatures of around 200°C, as compared with cellobiose (Osada et
al., 2014). We have reported these findings in our previous studies that were focused on the
dehydration of GlcNAc and (GlcNAc)2 in subcritical water at around 200°C.
-8.0
-6.0
-4.0
-2.0
0.0
2.0
4.0
6.0
1.4 1.5 1.6 1.7 1.8 1.9
1/T ×10-3 [K-1]
ln k
[s-1
]
a-chitin
cellulose
Fig. 6 Arrhenius plot overlay of first-order decomposition rate constants for the
degradation of cellulose and α-chitin.

22
α-Chitin is almost stable at around 200°C as reported by Aida et al. (2014), whereas
the dehydration of GlcNAc and (GlcNAc)2 proceeds at the same temperature range. Since the
dehydration rates of GlcNAc and (GlcNAc)2 are greater than the hydrolysis rate of the -1,4
bond of α-chitin, GlcNAc, (GlcNAc)2, and chitin oligosaccharide cannot be obtained from
α-chitin by sub- and supercritical water treatments on their own. Therefore, sub- and
supercritical water pretreatments followed by enzymatic degradation of α-chitin or crab shell
is a more promising method for the production of GlcNAc and (GlcNAc)2.
Based on the experimental results of this work as well as previous studies, a
schematic reaction of α-chitin in supercritical water at 400°C has been suggested in Fig. 7
From 0 to 0.5 min, the crystallite structures of α-chitin and the chemical structure of GlcNAc
units are almost stable; these observations supported by XRD and IR analyses reported in our
previous study (Osada et al., 2012). However, the hydrolysis of α-chitin continued and the
molecular weight of α-chitin decreased gradually, as shown in Fig. 5 (a). At around 1 min,
the distance between chitin chains increased, which is indicated by XRD analysis done in our
previous study, and it is attributed an increased number of exposed amide group detected in
the NIR spectra (Osada et al., 2013b). At around 1.5 min, water-soluble low-molecular
weight chitin chains are formed because of the hydrolysis, and they are released from the
chitin solid surface. At around 2 min, there was further hydrolysis of chitin chains and release
of low-molecular weight chitin chains, which is attributed to the rough surface of chitin solid,

23
Decrease in mean molecular weight
Increase in the distance between
chitin chains
0–0.5 min 1 min
1.5 min 2 min
≈1.5–2 min
Decomposition products
Dehydration of GlcNAc and
its oligomers
Dissolution
>2 min
GlcNAc unit
dehydrated GlcNAc unit
Fig. 7 Schematic of α-chitin reaction in supercritical water.

24
as shown in Fig. 5 (c). The low-molecular weight chitin chains are immediately dehydrated at
the reducing end, reported in our previous study (Osada et al., 2014). We observed that the
dehydration of (GlcNAc)2 proceeded at temperatures above 180°C for 1 min, altering the
chemical structure of GlcNAc unit. At a longer reaction time of 2 min, it has been reported
that a condensation reaction between chitin decomposition products occurs, and
water-insoluble solid products are formed. (Aida et al., 2014, Sakanishi et al., 1999).
The important changes in α-chitin properties that take place during pretreatment with
sub- and supercritical water required for enzymatic degradation are (a) a decrease in mean
molecular weight and (b) an increase in the distance between chitin chains. In this study, we
used a batch type reactor, in which the treatment times included heat-up time. For a set
temperature at 400C, the actual temperature of the reactor at 1 min reached at about 380C
as we reported previously (Osada et al., 2012). Therefore, pure a-chitin was treated with both
sub- and supercritical water within 1 min. In this work, 3.0g of water was loaded into 6 cm3
of the reactor and an evaluation of water properties is possible. The ion product of water (Kw
= [H+][OH−]) at 25C is 1.0 × 10⁻¹⁴ mol2 kg−2 and it increases with increasing temperature,
reaches a maximum of 4.0 × 10⁻¹² mol2 kg−2 around 300C above saturated vapor pressure of
9 MPa. Then the Kw decreases with increasing temperature and it became 1.9 × 10⁻¹³ mol2
kg−2 at 400C and 37 MPa. These Kw values mean that pure a-chitin was exposed from 10 to
100 times higher H+ and OH− concentrations condition during sub- and supercritical water

25
treatments than ambient condition. The combined effects of high H+ and OH− concentrations
and high temperature are probably responsible for the hydrolysis of pure a-chitin and the
weakened hydrogen bond between a-chitin chains observed in the absence of an added acid
or base.
In this work, we found that the mean molecular weight decreased continuously
through hydrolysis, as shown in Fig. 5 (a). We used a mixture of both endo- and exo-type
enzymes. The decrease in the molecular weight leads to an increased number of end point of
chitin chain and enhances a hydrolysable place by the exo-type enzyme. The increase in the
distance between chitin chains indicates that the hydrogen bonds between hydroxyl groups of
the chitin chains become weak. The weakened hydrogen bond groups increase the
hydrophilicity of chitin, leading to easier access by enzymes. Therefore, the yields of
(GlcNAc)2 increased for up to 1 min at 400°C, as shown in Fig. 4 (d). After 1 min, the
GlcNAc structure changed due to continuous dehydration and the enzymes could not
hydrolyze dehydrated GlcNAc unit further. As mentioned in Section 4.1, the (GlcNAc)2 ratio,
based on residual amount of chitin, ranged from 30 to 40% for both crab shell and pure
α-chitin. This is due to a kinetic balance between the hydrolysis of chitin chain and the
dehydration of the GlcNAc structure.

26
5. Conclusions
This study demonstrates that sub- and supercritical water pretreatments significantly
affect the physicochemical properties of crab shell and enhance the enzymatic degradation of
crab shell. Sub- and supercritical water pretreatments removed the protein in the crab shell,
whereas α-chitin and CaCO3 remained stable for a certain reaction time and temperature.
Prolonged treatment decomposed the α-chitin, and CaCO3 was obtained as solid residue.
These results indicate that, ideally, pretreatment of crab shell with sub- and supercritical
water for enzymatic degradation should be done after the removal of protein, but before the
decomposition of α-chitin. During sub- and supercritical water treatments, the mean
molecular weight of pure α-chitin decreased and the distance between chitin chains increased
due to weakening of hydrogen bonds. These changes of properties of α-chitin promoted
enzymatic degradation. Subcritical (350C, 7 min) and supercritical water (400C, 2.5 min)
treatments of crab shell, followed by enzymatic degradation, provided (GlcNAc)2 yields of
8% and 6%, respectively. Without any pretreatment, the yield dropped to 0%. We found that
crab shell requires a longer treatment time with sub- and supercritical water compared to pure
α-chitin. In general, acid and base pretreatments of crab shell are required to remove CaCO3
and protein before enzymatic degradation. This study shows that water treatment alone is
adequate for the removal of protein and that changing α-chitin properties for producing
GlcNAc and (GlcNAc)2 from crab shell in an eco-friendly and sustainable manner is possible.

27
Although a small batch-type reactor was used in this work, development of a tubular flow
reactor is needed to increase the treated crab shell amount.
Acknowledgements
This work was supported by the Program for Promotion of Basic and Applied
Researches for Innovations in Bio-oriented Industry.

28
References
Aam, B. B., Heggset, E. B., Norberg, A. L., Sørlie, M., Varum, K. M., & Eijsink, V. G. H.
(2010) Production of chitooligosaccharides and their potential applications in medicine.
Marine Drugs, 8, 1482–1517.
Aida, T. M., Oshima, K., Abe, C., Maruta, R., Iguchi, M., Watanabe, M., & Smith, R. L. Jr.
(2014) Dissolution of mechanically milled chitin in high temperature water.
Carbohydrate Polymers, 106, 172–178.
Hirano, S. (2004). Development and technology of chitin and chitosan. Tokyo: CMC
Publishing Co. Ltd. (Chapter 8) (in Japanese).
Muzzarelli, R. A. A., (2011). Biomedical exploitation of chitin and chitosan via
mechano-chemical disassembly, electrospinning, dissolution in imidazolium ionic liquids,
and supercritical drying. Marine Drugs, 9, 1510–1533.
Muzzarelli, R. A. A., Boudrant, J., Meyer, D., Manno, N., DeMarchis, M., & Paoletti, M. G.
(2012). Current views on fungal chitin/chitosan, human chitinases, food preservation,
glucans, pectins and inulin: A tribute to Henri Braconnot, precursor of the carbohydrate
polymers science, on the chitin bicentennial. Carbohydrate Polymers, 87, 995–1012.
Nakamura, H., Oozono, H., Nakai, N., & Yoshida, H. (2007). Conversion of crab shell to
useful resources using sub-critical water treatment. Proceedings of International
Symposium on EcoTopia Science, 260.

29
Osada, M., Kikuta, K., Yoshida, K., Totani, K., Ogata, M., & Usui, T. (2013a). Non-catalytic
synthesis of chromogen I and III from N-acetyl-D-glucosamine in high-temperature water.
Green Chemistry, 15, 2960–2966.
Osada, M., Kikuta, K., Yoshida, K., Totani, K., Ogata, M., & Usui, T. (2014). Non-catalytic
dehydration of N,N’-diacetylchitobiose in high-temperature water. RSC Advances, 4,
33651–33657.
Osada, M., Miura, C., Nakagawa, Y. S., Kaihara, M., Nikaido, M., & Totani, K. (2012).
Effect of sub- and supercritical water pretreatment on enzymatic degradation of chitin.
Carbohydrate Polymers, 88, 308–312.
Osada, M., Miura, C., Nakagawa, Y. S., Kaihara, M., Nikaido, M., & Totani, K. (2013b).
Effects of supercritical water and mechanochemical grinding treatments on
physicochemical properties of chitin. Carbohydrate Polymers, 92, 1573–1578.
Peterson, A. A., Vogel, F., Lachance, R. P., Fröling, M., Antal, M. J. Jr., & Tester, J. W.
(2008). Thermochemical biofuel production in hydrothermal media: A review of sub- and
supercritical water technologies. Energy & Environmental Science. 1, 32–65.
Quitain, A. T., Sato, N., Daimon, H., & Fujie, K. (2001). Production of valuable materials by
hydrothermal treatment of shrimp shells. Industrial & Engineering Chemistry Research,
40, 5885–5888.
Ravi Kumar, M. N. V., Muzzarelli, R. A. A., Muzzarelli, C., Sashiwa, H., & Domb, A. J.

30
(2004) Chitosan chemistry and pharmaceutical perspectives. Chemical Reviews, 104,
6017–6084.
Sakanishi, K., Ikeyama, N., Sakaki, T., Shibata, M., & Miki, T. (1999). Comparison of the
hydrothermal decomposition reactivities of chitin and cellulose. Industrial & Engineering
Chemistry Research, 38, 2177–2181.
Uchiyama, T., Kaneko, R., Yamaguchi, J., Inoue, A., Yanagida, T., Nikaidou, N., Regue, M.,
& Watanabe, T. (2003). Uptake of N,N′-diacetylchitobiose [(GlcNAc)2] via the
phosphotransferase system is essential for Chitinase production by Serratia marcescens
2170. Journal of Bacteriology. 185, 1776−1782.
Usui, T., Matsui, H., & Isobe, K. (1990). Enzymatic synthesis of useful chitooligosaccharides
utilizing transglycosylation by chitinolytic enzymes in a buffer containing ammonium
sulfate. Carbohydrate Research, 203, 65–77.