effect of tax policy reforms on tax revenue in kenya …
TRANSCRIPT

EFFECT OF TAX POLICY REFORMS ON TAX REVENUE IN KENYA
BY
PHOSTINE KANYI
A RESEARCH PROJECT SUBMITTED TO THE GRADUATE SCHOOL IN
PARTIAL FULFILLMENT OF THE REQUIREMENT FOR THE AWARD OF THE
DEGREE OF MASTER OF BUSINESS ADMINISTRATION
EGERTON UNIVERSITY
APRIL 2015

ii
DECLARATION
Declaration by the Student
I, the undersigned declare that this is my original work and has not been submitted for a
degree qualification in any other university or institution of learning or to any other
examination body.
Sign ____________________ Date _____________
PHOSTINE KANYI
CM16/0102/12
Recommendation by the Supervisor
This research report has been submitted for examination with my approval as Egerton
University Supervisor.
Sign ____________________ Date _____________
Dr. FREDRICK M. KALUI
Lecturer, Department of Accounting, Finance and Management Science
Faculty of Commerce
Egerton University

iii
COPYRIGHT
© 2015, Phostine Kanyi
All rights reserved. No part of this project may be reproduced, stored in any retrieval system
or transmitted in any form or means electronic, mechanical, photocopying or otherwise
without prior written permission of the author or Egerton University

iv
DEDICATION
This project work is dedicated to my dear wife Ruth and daughters Nicole and Beslie for
their unwavering support and prayers, and for being a source of inspiration during the course
of my studies.

v
ACKNOWLEDGEMENT
It is said that a journey of a thousand miles starts with the first step. This far has been with
many challenges. It would not have been possible were it not for the support, prayers and
encouragement of everyone who at one time or the other played a particular role. First and
foremost, I would like to thank the almighty God for giving me the strength, endurance,
resilience, courage and above all wisdom to conquer. Without God it wouldn’t have been
possible. Next, I would like to thank Egerton University for giving me an opportunity to
study in the institution. I would also like to give my special and sincere thanks to my
supervisor Dr. Fredrick M. Kalui for his advice, patience, and guidance throughout the
project period. Without your help I could not have made it. To my family, I say thank you for
your prayers, moral support and patience throughout the process. I also appreciate my
friends, workmates and colleagues for their timely support. To you all, I say THANK YOU.

vi
ABSTRACT
Taxation provides principal lenses in measuring state capacity, state formation and
power relations in a whole society. In the evaluation of tax reforms in the developing
countries, it is important to first determine the unique role of the tax system in each
particular country. The main reason for undertaking tax policy reforms in Kenya was to
address issues of inequality and to create a sustainable tax system that could generate
adequate revenue to finance public expenditures. In this respect, the government of
Kenya introduced in the country the tax modernization programmes for achievement of a
tax system that was sustainable in the face of changing conditions locally and
internationally. This study examined the reform efforts of the country with respect to
revenue generated, and reviewed the strengths and weakness of the tax system as it has
evolved over the years from 2003/2004 to 2012/2013. The methodology used was a
descriptive research design. The general objective was to evaluate the effect of tax
policy reforms on tax revenue in Kenya. The specific objectives of the research study
were: to establish the relationship between domestic taxes policy reforms and tax
revenue in Kenya, to determine the effect of customs policy reforms on tax revenue in
Kenya, to evaluate the relationship between road transport policy reforms and tax
revenue in Kenya and to assess the relationship between tax evasion and tax revenue in
Kenya. The study used both descriptive and regression statistics. Correlation analysis
was made to measure the strength of the relationship between the variables. With the aid
of SPSS, a multivariate analysis was employed with the OLS regression being used.
From the findings on the relationship between domestic taxes policy reforms and tax
revenue in Kenya, the study established that there was a significant relationship between
taxes policy reforms and tax revenue in Kenya.

vii
TABLE OF CONTENTS
DECLARATION..................................................................................................................... ii
COPYRIGHT ......................................................................................................................... iii
DEDICATION........................................................................................................................ iv
ACKNOWLEDGEMENT ...................................................................................................... v
ABSTRACT ............................................................................................................................ vi
TABLE OF CONTENTS ..................................................................................................... vii
LIST OF TABLES .................................................................................................................. x
LIST OF FIGURES ............................................................................................................... xi
LIST OF ACRONYMS ........................................................................................................ xii
CHAPTER ONE ..................................................................................................................... 2
INTRODUCTION................................................................................................................... 2
1.1 Background of the Study ................................................................................................ 2
1.2 Statement of the Problem ................................................................................................ 4
1.3 Objectives of the study ................................................................................................... 5
1.3.1 General Objective ..................................................................................................................... 5
1.3.2 Specific Objectives ................................................................................................................... 5
1.4 Research Hypothesis ....................................................................................................... 6
1.5 Significance of the Study ................................................................................................ 6
1.6 Scope of the Study .......................................................................................................... 7
1.7 Limitations and delimitations of the Study ..................................................................... 7
1.8 Definition of operational terms ....................................................................................... 7
CHAPTER TWO .................................................................................................................... 9
LITERATURE REVIEW ...................................................................................................... 9
2.1 Introduction ..................................................................................................................... 9
2.2 Kenya Revenue Authority .............................................................................................. 9
2.3 Tax Reforms ................................................................................................................. 10
2.3.1 Domestic Taxes Policy Reform .............................................................................................. 11
2.3.2 Customs Policy Reforms ........................................................................................................ 18
2.3.3 Road Transport Tax Policy Reforms ...................................................................................... 20

viii
2.3.4 Tax Evasion Policy Reforms .................................................................................................. 20
2.4 Economic Conditions .................................................................................................... 21
2.5 Price Level Changes .................................................................................................... 22
2.6 Tax Revenue in Kenya .................................................................................................. 22
2.8 Theoretical Review ....................................................................................................... 25
2.8.1 Wagner’s Law of Increasing State Activity............................................................................ 25
2.8.2 Peacock Wiseman Theory of Public Expenditure .................................................................. 26
2.9 Empirical Review ......................................................................................................... 28
2.10 Research Gap .............................................................................................................. 33
2.11 Conceptual Framework ........................................................................................................... 34
2.11.1 Domestic Taxes Policy Reform ............................................................................................ 35
2.11.2 Customs Policy Reform ........................................................................................................ 35
2.11.3 Road Transport Tax Policy Reform ...................................................................................... 35
2.11.4 Tax Evasion Policy Reforms ................................................................................................ 36
CHAPTER THREE .............................................................................................................. 37
RESEARCH DESIGN AND METHODOLOGY .............................................................. 37
3.1 Introduction ................................................................................................................... 37
3.2 Research Design ........................................................................................................... 37
3.3 Data Collection ............................................................................................................. 37
3.4 Data Analysis ................................................................................................................ 37
CHAPTER FOUR: ............................................................................................................... 40
DATA ANALYSIS, RESULTS AND DISCUSSION ......................................................... 40
4.1 Introduction ................................................................................................................... 40
4.2 Descriptive Statistics ..................................................................................................... 40
4.3 Correlations Analysis .................................................................................................... 42
4.4 Regression Analysis ...................................................................................................... 44
4.4.1 Univariate Linear Regression .................................................................................... 45
4.4.1.1 Univariate Linear Regression for Domestic Taxes .............................................................. 45
4.4.1.2 Univariate Linear Regression for the Customs Duty ........................................................... 47
4.4.3 Univariate Linear Regression for the Road Transport Taxes ................................................. 48
4.4.4 Univariate Linear Regression for the Tax Evasion ................................................................. 50

ix
4.4.2 Multivariate Regression - Dependent Variable and Combined Independent Variables ........ 52
4.4.2.1 Regression Analysis before Tax Reforms ........................................................................... 52
4.4.2.2 Regression Analysis after Tax Reforms .............................................................................. 54
4.5 Testing the Hypothesis .................................................................................................. 56
4.5.1 Paired Samples Statistics ........................................................................................................ 56
CHAPTER FIVE: ................................................................................................................. 60
SUMMARY OF FINDINGS, CONCLUSIONS AND RECOMMENDATIONS ........... 60
5.1 Introduction .................................................................................................................. 60
5.2 Summary of Findings .................................................................................................... 60
5.5 Recommendations ......................................................................................................... 65
5.6 Suggestions for Future Research .................................................................................. 66
REFERENCES ...................................................................................................................... 68
APPENDICES .................................................................................................................... 72
Appendix I: Data Collection Sheet .................................................................................... 72
APPENDIX II: Summary of the actual and expected tax revenue (2003/2004 – 2012/2013) ........ 76
x
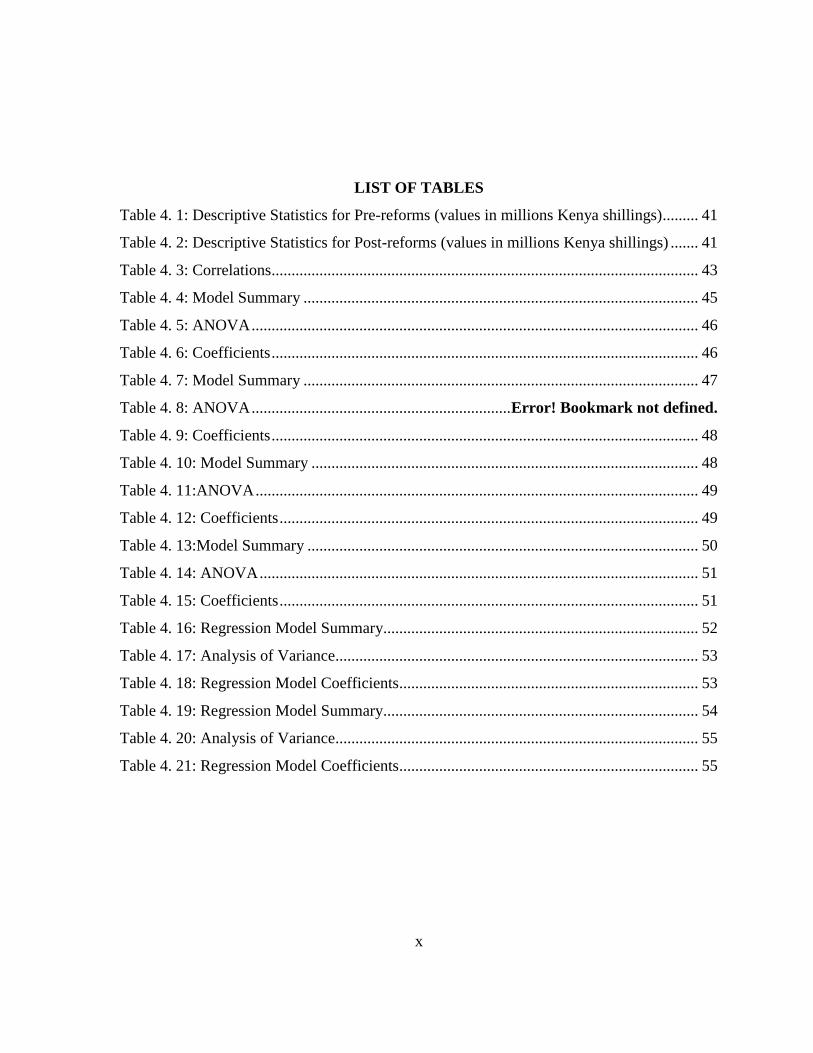
LIST OF TABLES
Table 4. 1: Descriptive Statistics for Pre-reforms (values in millions Kenya shillings) ......... 41
Table 4. 2: Descriptive Statistics for Post-reforms (values in millions Kenya shillings) ....... 41
Table 4. 3: Correlations........................................................................................................... 43
Table 4. 4: Model Summary ................................................................................................... 45
Table 4. 5: ANOVA ................................................................................................................ 46
Table 4. 6: Coefficients ........................................................................................................... 46
Table 4. 7: Model Summary ................................................................................................... 47
Table 4. 8: ANOVA ................................................................. Error! Bookmark not defined.
Table 4. 9: Coefficients ........................................................................................................... 48
Table 4. 10: Model Summary ................................................................................................. 48
Table 4. 11:ANOVA ............................................................................................................... 49
Table 4. 12: Coefficients ......................................................................................................... 49
Table 4. 13:Model Summary .................................................................................................. 50
Table 4. 14: ANOVA .............................................................................................................. 51
Table 4. 15: Coefficients ......................................................................................................... 51
Table 4. 16: Regression Model Summary............................................................................... 52
Table 4. 17: Analysis of Variance........................................................................................... 53
Table 4. 18: Regression Model Coefficients........................................................................... 53
Table 4. 19: Regression Model Summary............................................................................... 54
Table 4. 20: Analysis of Variance........................................................................................... 55
Table 4. 21: Regression Model Coefficients........................................................................... 55

xi
LIST OF FIGURES
Figure 2. 1: Conceptual framework ........................................................................................ 34
.
xii
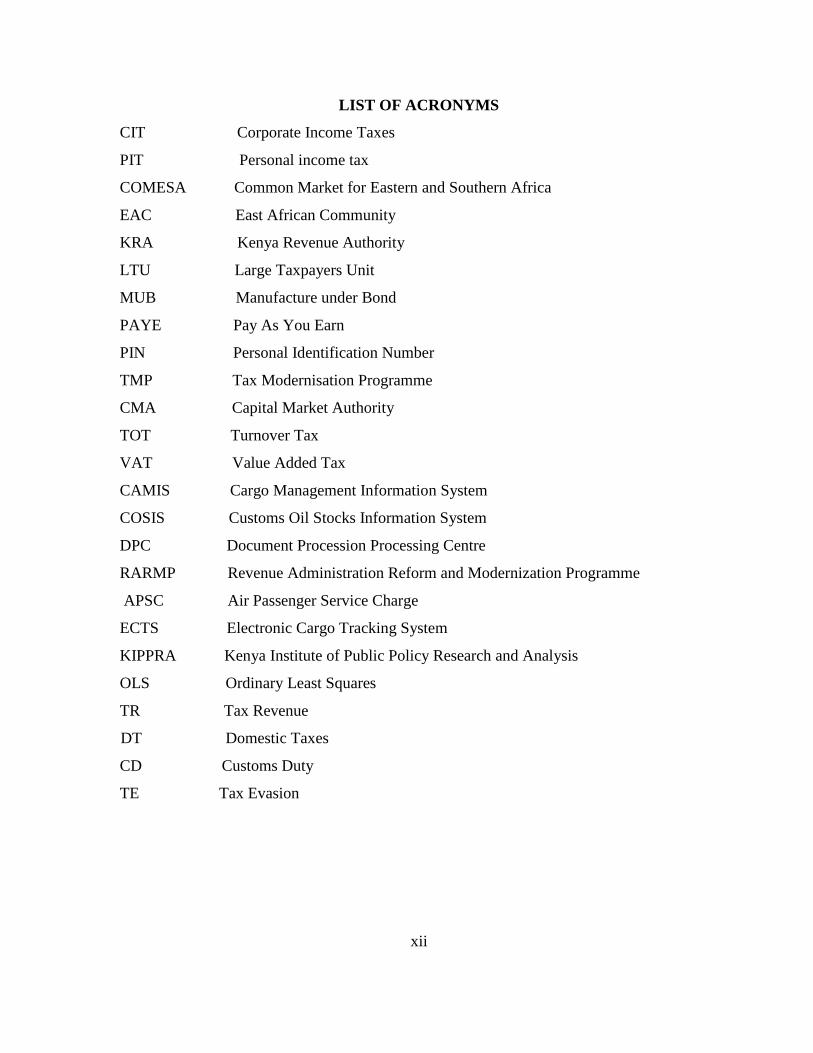
LIST OF ACRONYMS
CIT Corporate Income Taxes
PIT Personal income tax
COMESA Common Market for Eastern and Southern Africa
EAC East African Community
KRA Kenya Revenue Authority
LTU Large Taxpayers Unit
MUB Manufacture under Bond
PAYE Pay As You Earn
PIN Personal Identification Number
TMP Tax Modernisation Programme
CMA Capital Market Authority
TOT Turnover Tax
VAT Value Added Tax
CAMIS Cargo Management Information System
COSIS Customs Oil Stocks Information System
DPC Document Procession Processing Centre
RARMP Revenue Administration Reform and Modernization Programme
APSC Air Passenger Service Charge
ECTS Electronic Cargo Tracking System
KIPPRA Kenya Institute of Public Policy Research and Analysis
OLS Ordinary Least Squares
TR Tax Revenue
DT Domestic Taxes
CD Customs Duty
TE Tax Evasion

2
CHAPTER ONE
INTRODUCTION
1.1 Background of the Study
Tax reform is the process of changing the way taxes are collected or managed by the
government which may involve the adoption of a Value Added Tax (VAT), the expansion of
the VAT, the elimination of stamp and other minor duties, the simplification and broadening
of corporate income or personal or asset taxes, or the revision of the tax code to enact
comprehensive administration and criminal penalties for evasion (Mahon, 1997).
In Kenya, taxation is the single largest source of government budgetary resources. Between
1995 and 2004, tax revenue constituted 80.4% of total government revenue (including
grants). Relatively, the importance of non-tax revenue is also significant in sustaining the
public budget, although its importance is much less than the role of taxation given that it’s
share over the same period was 15.1%. Foreign grants play a minimal role as they have
averaged only 4.5%. Given its central role, taxation has been applied to meet two objectives.
First, taxation is used to raise sufficient revenue to fund public spending without recourse to
excessive public sector borrowing (Glenday, 2002).
Second, it is used to mobilize revenue in ways that are equitable and that minimize its
disincentive effects on economic activities. Over time, Kenya has moved from being a low
tax burden country to a high tax burden country yet the country faces the obvious need for
more tax revenues to maintain public services. Given the high tax burden, prospects to raise
additional revenue seem bleak. In addition, Kenyans are yet to accept a tax paying “culture”.
On one hand, those with political power and economic ability are few and do not want to pay
tax while on the other hand, those without political power are many, but have almost nothing
to tax, and so resist paying taxes. As no one enjoys paying taxes, there is always mistrust
between those collecting taxes and taxpayers. This mistrust generates a hostile coexistence
between tax agents and tax payers, with agents perceiving
taxpayers as criminals unwilling to pay their taxes, and tax payers being wary of government
agencies’ high-handedness in collection of taxes (KRA, 2004).

3
Even though the tax system continuously changes, in pursuit of the objectives of the Tax
Modernization Programme that came into force in 1986, the challenges that confront the tax
authorities today are not much different from the pre-reform challenges. With Kenyan firms
reporting that about 68.2% of profit is taken away in taxes, tax competitiveness is low and
the country remains among the most tax unfriendly countries in the world. Tax evasion
remains high, with a tax gap of about 35% and 33.1% in 2000/1 and 2001/2 respectively
(KIPPRA, 2004a). The tax code is still complex and cumbersome, characterized by uneven
and unfair taxes, a narrow tax base with very high tax rates and rates dispersions with respect
to trade, and low compliance (KIPPRA, 2004b).
Additional challenges include tax systems with rates and structures that are difficult to
administer and comply with, are unresponsive to growth and discretionary policy hence low
productivity, raise little revenue but introduce serious economic distortions, treat labor and
capital in similar circumstances differently and are selective and skewed in favor of those
with the ability to defeat the tax administration and enforcement system (KIPPRA. 2004b).
The composition of taxes could also change as a result of increased difficulty in taxing
mobile tax bases with the total tax burden from income taxes on mobile tax bases like capital
and skilled labour likely to decline across governments, while taxes on immobile tax bases
will likely increase. In the face of tax competition, national governments may attempt to
harmonize their tax systems in an attempt to reduce the negative externalities that one
government’s decisions impose on other governments. Such harmonization implies that there
should be some convergence in tax rates across governments, and in the definitions of tax
bases. Some also argue that neither a “race to the bottom” nor international tax convergence
are universal outcomes of increased globalization. Analysts differ on whether these
developments are positive (e.g., tax competition that reduces the size of government and
government waste) or negative (e.g., tax competition that reduces the ability of governments
to provide public goods, eliminating the welfare state). However, few question that

4
globalization has led, and will still to lead to a significant reduction in the autonomy of
governments (Musgrave, 1987).
In evaluating tax reform in developing countries, one first needs to determine the unique role
of the tax system in each individual country. Among the key reasons for undertaking tax
reforms in Kenya was to address issues of inequality and to create a sustainable tax system
that could generate adequate revenue to finance public expenditure hence, the tax
modernization programme introduced in the country was to achieve a tax system that was
sustainable in the face of changing conditions domestically and internationally. Policy was
shifted towards greater reliance on indirect taxes as opposed to direct taxes as consumption
taxes were seen to be more favourable to investments and thus growth while trade taxes,
instead of being used for protection or revenue-maximization purposes, were viewed more as
instruments to foster export-led industrialization. Trade taxes were hence used to create a
competitive exports sector rather than protect the import-competing manufacturing sector, as
had been done in the past (Karingi and Wanjala, 2005).
Given the destabilizing effects of the deficits and the fact that they were becoming
unsustainable, the Kenya Government through Sessional Paper No 1 of 1986 (GOK, 1986)
came up with measures to address this problem. The most notable fiscal policy proposals
adopted were the Tax Modernization Programme (TMP) that was adopted in 1986 and the
Budget Rationalization Programme that followed in 1987 (Muriithi and Moyi, 2003) .
1.2 Statement of the Problem
Taxation is the key source of revenue that the government of Kenya uses to provide public
services to its citizens. Due to its importance, tax policy debates and decision making
becomes a critical issue to the public, businesses and the general economy owing to the
varied impact that it will have on each of these entities. The main reason of undertaking tax
reforms in Kenya was to address issues of inequality and to create a sustainable tax system
that could generate adequate revenue to finance public expenditure. In this respect, tax
modernization programmes were introduced in the country for achievement of a tax system

5
that was sustainable in the face of changing conditions locally and internationally. Of the
total tax revenue collected by the government over the last ten years, the largest contributors
are income tax, followed by VAT. However it is important to note that the burden on income
tax and in particular PAYE is felt by a small percentage of the total productive labour force
raising fairness concerns. In addition, a number of businesses especially in the informal
sector are not taxed again raising equity questions. Mutua (2012) noted that the tax structure
in Kenya is skewed heavily towards income taxes and VAT as the two largest source of total
tax revenue. In spite of the efforts by the Kenya government to improve tax administration,
there are still a myriad of problems militating against effective and efficient tax system in
Kenya and hence affecting the tax revenue collected by the Kenya government. It is against
this background that the researcher examined the whole spectrum of tax policy reforms in
Kenya with the view of analysing the effects of the policy reforms on tax revenue in Kenya.
1.3 Objectives of the study
1.3.1 General Objective
The general objective was to evaluate the effect s of Tax Policy Reforms on Tax Revenue in
Kenya.
1.3.2 Specific Objectives
The specific objectives of the research study were;
i. To establish the relationship between domestic taxes policy reforms and tax revenue
in Kenya
ii. To determine the effect of customs policy reforms on tax revenue in Kenya
iii. To determine the relationship between road transport tax policy reforms and tax
revenue in Kenya
iv. To determine the effect of tax evasion policy reforms on tax revenue in Kenya
v. To determine the effect of domestic taxes policy reform, customs policy reform, road
transport tax policy reforms and tax evasion policy reform on tax revenue in Kenya.

6
1.4 Research Hypothesis
Ho 1: There is no significant relationship between domestic taxes policy reforms and tax
revenue in Kenya
Ho 2: There is no significant relationship between customs policy reforms on tax revenue in
Kenya
Ho 3: There is no significant relationship between road transport policy reforms and tax
revenue in Kenya
Ho 4: There is no significant relationship between tax evasion and tax revenue in Kenya
Ho 5: There is no combined effect between domestic taxes policy reform, customs policy
reform, road transport tax policy reforms and tax evasion policy reform on tax revenue in
Kenya
1.5 Significance of the Study
This study shall be of value to various parties that have a direct or indirect stake in Kenya tax
system including:
Kenya Revenue Authority and other Government agencies
KRA is the taxation implementing institution in Kenya. From the findings and
recommendations that the researcher will make, it will use them to enhance efficiency and
effectiveness in tax administration in Kenya.
Researchers and Students of Accountancy Profession
The research will add new knowledge to the already existing body of knowledge that will be
used as a source of reference by the other researchers and the students. It will also enhance
their understandability of how tax policy reforms affect tax revenue.
Policy Makers
The study will also be important to policy makers in the money market, the capital market
and the government who will be interested in knowing the effect of tax reform policies on the
performance of companies at the securities exchange market as well as to the business

7
community at large. This is because companies’ income, investors’ income and other market
players’ income is always affected by the tax policy reforms.
1.6 Scope of the Study
This study will focus on the evaluation of the effects of tax policy reforms on tax revenue in
Kenya. Specifically, the study will be concentrated on the period from 2003/2004 to
2012/2013 for a number of reasons: This period is long enough to capture both the pure and
total responsiveness of tax revenues to tax policy reforms. It is also within this period that
Kenya has witnessed political as well as a lot of economic changes.
1.7 Limitations and delimitations of the Study
One of the limitations of the study was that the researcher was denied access to some records
by KRA staff as it was considered sensitive. The researcher delimited this by obtaining a
letter from Egerton University authorizing him to carry the research purely for academic
work. In addition, he assured the authorities that the information will be kept very
confidential.
1.8 Definition of operational terms
Tax
A compulsory contribution imposed/levied by a government on income, a product or an
activity payable by the citizens of a country resident and non- resident the purpose of which
is to finance government expenditure i.e. public goods and services.
Tax payer
This any person who is eligible to bear the liability of tax as per the tax laws of Kenya and
includes individuals, corporate bodies, trusts, unincorporated organisations among others.
Resident
A resident is a person domiciled in Kenya for the whole tax year.

8
Non-resident
This is an individual who mainly resides in Kenya but has interests in another country.
Direct taxes
This means that taxes are levied on income and property of individuals or group of
individuals who bears their full burden, i.e. the impact and the incidence of the tax are on the
same individual.
Indirect taxes
These are the taxes levied on goods and services and are paid by individuals by virtue of their
associating with the goods and services i.e. the impact of the tax is on one person while the
incidence is on a different person.
Tax reform
Tax reform is the process of changing the way taxes are collected or managed by the
government.
Tax revenue
This is the amount of income that is gained by governments through taxation.
Tax avoidance
This is the use of legal methods to modify an individual's financial situation in order to lower
the amount of income tax liability.
Tax evasion
It is the failure to disclose the correct income that should be assessed either by misstatement
of facts, falsification of figures, filing of incorrect returns or by misrepresentation of tax
liabilities.

9
CHAPTER TWO
LITERATURE REVIEW
2.1 Introduction
In this chapter, the various tax policy reforms are discussed. The chapter will cover the
following: background on Kenya Revenue Authority, theoretical framework, the critical
review and finally the conceptual framework where a diagrammatic presentation showing the
relationship between tax policy reforms and tax revenue in Kenya will be shown.
2.2 Kenya Revenue Authority
The Kenya Revenue Authority was established by an Act of Parliament on July 1, 1995
under Cap. 469 of the laws of Kenya, for the purpose of enhancing the mobilisation of
Government revenue, while providing enhance tax administration and sustainability in
revenue collection. The Board together with Management of KRA has since its inception
spent time and resources setting up systems, procedures and adopting of new strategies aimed
at enhancing the operational efficiency of the Authority's processes. In particular, the
functions of the Authority are: To assess, collect and account for all revenues in accordance
with the written laws and the specified provisions of the written laws, to advise on matters
relating to the administration of, and collection of revenue under the written laws or the
specified provisions of the written laws, and to perform such other functions in relation to
revenue as the Minster may direct.
In order to realise its mandates, the Authority administers the fourteen written laws relating
to revenue. These written laws administered by the Authority therefore legally constitute the
functional departments and sections of Kenya Revenue Authority, which include: - Income
Tax Department, Customs & Excise Department, Value Added Tax Department, Registrar of
Motor Vehicle Department and Kenya Revenue Authority Headquarters (support)
Departments (KRA, 2012).

10
2.3 Tax Reforms
Tax reform is the process of changing the way taxes are collected or managed by the
government. It may involve the adoption of a Value Added Tax (VAT), the expansion of the
VAT, the elimination of stamp and other minor duties, the simplification and broadening of
personal or corporate income or asset taxes, or the revision of the tax code to enact
comprehensive administration and criminal penalties for evasion (Mahon, 1997).
Tax policy is an administrative apparatus that is built to levy and collect taxes, through
application of different tariffs and basis of taxation. Tax policy reform is the process of
changing the way the taxes are collected or managed by a government. Tax reformers have
different goals, while some seek to reduce the level of taxation of all people by the
government, others seek to make the tax system either more progressive or less progressive.
Whereas tax policy reforms commenced in 1986, administrative reforms were initiated in
1995 when KRA was established to strengthen revenue collection and harmonize the separate
tax collection arms. The overall objective was to provide operational autonomy in revenue
administration and enable its evolution into a modern, effective, flexible and integrated
revenue collection agency. Since the inception of KRA, revenue collection has continued to
grow while professionalism in revenue administration has been enhanced. However,
challenges inhibiting the achievement of a fully integrated and modern tax administration
remain (KRA, 2012).
The KRA Second Corporate Plan (2003/04 – 2005/06) set the stage for the Revenue
Administration Reform and Modernization Programme (RARMP) to ensure that momentum
was injected to consolidate the gains that had been made in tax administration. During the
Third Corporate Plan Period (2006/07 – 2008/09), the RARMP made enormous strides in
ensuring that KRA transformed itself into an ultra-modern, fully integrated and client-
focused organization (KRA, 2012).
KRA also implemented the Fourth Corporate Plan (2009/10 – 2011/12). The aim was to
entrench the reforms at the operational levels to achieve operational efficiencies and enhance
service delivery. The achievements so far have largely been credited through the

11
implementation of the following key projects; Customs Reforms & Modernisation Project,
Domestic Taxes Reform & Modernisation Project, Road Transport Reform & Modernisation
Project, Investigation & Enforcement Reform & Modernisation Project, Business
Automation Project, Human Resources and Revitalisation Project and Infrastructure
Development Project. However, other reform initiatives touching on other critical functions
including the Internal Audit and revenue collection payments are being implemented (KRA,
2012).
The tax base in Kenya, as in most sub-Saharan African countries, is extremely narrow. So
far, attempts to increase tax revenue have focused on closing the ‘taxation gap’ and
expanding the tax base. The main policies recommended by the IMF have led to trade
liberalisation, the transition from a sales tax to a system of VAT, and the creation of the
Kenya Revenue Authority. These policies have had mixed results. The reduction in tariffs
has been successful, as increased imports have so far more than compensated for the
reduction in tariffs and resulted in an increase in trade tax revenue. However, the impact of
domestic tax reforms has been less impressive. Most importantly, revenue collected from
VAT and direct taxation has not increased as hoped. Neither the switch to VAT, nor the
creation of the KRA has significantly altered the proportion of government revenue made up
by domestic taxation (Cheeseman and Griffiths, 2005).
2.3.1 Domestic Taxes Policy Reform
This reforms sot to create a fully integrated and modern domestic tax administration with the
key objectives of integrating domestic revenue administration; developing a wholistic
approach to taxpayer services thereby providing a single view of the taxpayer; reducing the
administrative and compliance costs; improving services through taxpayer segmentation;
enhancing taxpayer compliance and broadening the tax base.
These objectives were achieved through implementation of the following reforms: Merger of
Income Tax and VAT to form Domestic Taxes Department (DTD) in July 2004. In July
2005, DTD took over the administration of Domestic Excise from Customs & Excise
Department, Segmentation of taxpayers to address their unique needs by creating the Large

12
Taxpayer Office (LTO) to cater for large taxpayers and the Medium Taxpayer Office (MTO)
for medium sized taxpayers, Widening the tax net by introducing Turnover Tax (TOT) for
small taxpayers and particularly those in the informal sector, Enhancing taxpayer compliance
through introduction of Withholding VAT system in October 2003 and Electronic Tax
Register (ETR) system in July 2005, Development and implementation of a web based
Integrated Tax Management System (ITMS) to provide various tax services online. e-tax
registration and e-tax filing modules were rolled out as well as Provision of online facilities
for verification of Personal Identification Number (PIN) and Tax Compliance Certificate
(TCC) at the KRA website to enable taxpayers and the public to verify authenticity (KRA,
2012).
2.3.1.1 Income Tax
Income tax is a direct tax charged on employment income, business income, rent income,
pensions, and investment income. The main goal of income tax reforms has been to enhance
collection by broadening the tax base while reducing the maximum rates. The top rate for
individual tax was reduced from 65% (in 1987) to 32.5% in 1998 to 30% currently. Further,
basic tax allowances (tax credits) were increased and simplified while the single credit per
individual was introduced in 1997. The changes in the company tax structure include
reducing the top rate from 45% to 32.5% between 1989 and 1998 to 30% currently. The rate
was rationalized by unifying the structure across all types of business. There were efforts to
lower and equalize company and individual marginal tax rates. This was aimed at increasing
the disposable income for both corporate and individual capital investments, thus
encouraging private investment through the consumption transmission mechanism. The
income tax structure was integrated in the following ways:
First, there was a shift from the classical system that encouraged double taxation to the
current system that encourages single-stage taxation. The taxation of dividends was limited
to a final withholding tax while a compensating tax was introduced to ensure all corporate
distributions are made out of after-tax profits. The interest and penalty system has been
rationalized along with the introduction of the installment and self-assessment tax systems, as

13
well as the reintroduction of the personal identification number (PIN) for purposes of tax
assessment. The PIN was aimed at improving tax information management by identifying all
taxable persons in the country so that any transaction made by them could be systematically
identified and the appropriate tax captured. Another element of income tax reforms was the
timing of collections and rationalization of the withholding tax system. The system of paying
tax on business income was changed from delayed payment to current payment through a
seven-year phase-in (from 1990 to 1996). The withholding tax net was expanded to cover
interest income from discounts on debt instruments, payments to contractors and self-
employed persons without the PIN. Again, withholding tax on interest was raised from 10%
to 15% but was made a final tax when received by an individual from a financial institution
(KIPPRA, 2004b).
In Kenya, income tax has been designed to target corporate profits (Corporate Income Tax -
CIT) and employment (Personal income tax -PIT) and Pay As You Earn (PAYE). Income tax
is charged directly on employment income, business income, rent income, pension earnings,
investment income (dividends, royalties) and commissions. Income from self-employment is
subject to the Personal Income Tax (PIT) while employment income is subject to Pay As
You Earn. The PIT and PAYE are charged at the same graduated scale while CIT is charged
on profits on limited liability companies. Other income taxes include fringe benefits tax,
advance tax, taxes under Widows and Orphans Act and Parliamentary Pensions Act.
At the theoretical level, income taxation is applied to achieve broad objectives of income
redistribution and revenue mobilization. In practice, Kenya has always relied heavily on
income taxation on the basis of ease of collection rather than on the basis of abstract
principles of equity. This explains why the pre-reform period was characterized by high top
marginal rates, very wide brackets between the lowest and highest brackets, discrepancy
between CIT and PIT rates, too many income tax brackets, and low levels of compliance.
Given these features, the main challenges of income tax reforms were to reduce the
maximum rates, reduce the dispersion between the minimum and maximum tax rates, and
rationalize the income tax brackets (KRA, 2004).

14
Measures to expand the income tax base included taxation of employer provided benefits,
PAYE amnesty (1993), application of presumptive income tax on selected agricultural
produce and taxation of foreign exchange gains. Businesses having assets and liabilities
denominated in foreign currency were required to pay tax on such assets and liabilities on a
realization basis. The Presumptive income tax on agricultural produce (which was abolished
in 1993 and re-introduced in 1995) required farmers of direct agricultural exports to pay 20%
of their total earnings in tax. Currently, the rate of the deduction is 2% of the gross amount
paid. This Presumptive income tax was used to expand coverage of farmers while also
raising tax compliance (Nzioki et al, 2004).
The Income Tax Act provides for personal relief to taxpayers. Since 1990, tax brackets and
tax relief have been reviewed with the objective of cushioning low-income earners against
bracket creep while ensuring that high income earners bear a larger proportion of the tax
burden. In the period from 1990 to 1997, there were sustained increases in the single and
family relief. Thereafter, a personal relief of Ksh7,200 was introduced to replace the family
relief and single relief. The personal tax relief introduced in 1997 has been subjected to 10%
annual increments. These increments have had the effect of raising the minimum monthly
income at which income tax becomes payable (KRA, 2005).
2.3.1.1a Personal Income Taxes (PIT)
Personal income taxes are justified on the basis of several theoretical arguments. It is argued
that that PIT is income elastic since its revenue grows in proportion to income. Second, it is
argued that PIT is progressive in its distribution of tax burdens. Third, PIT can be relatively
neutral in its effects on economic decisions, hence reducing distortions in the economy. The
incidence of PIT falls entirely on the salaried persons and wage employees working in the
formal sector. Before the reforms, the PIT system had suffered from several setbacks, which
include high marginal tax rates, discrepancies between nominal and effective progressivity,
complexity of the system and tax evasion. One of the most pertinent challenges facing the tax
authorities has to do with differential treatment of dividend and interest income; they attract
different rates even for the same income. The next challenge remains taxation of agriculture
15
and the informal sector. Despite the use of presumptive taxes, this has been a problematic tax
weapon. The performance of the tax has been poor, despite the reform efforts at introducing
(Karingi, 2004).
2.3.1.1b Corporate Income Taxes (CIT)
Theoretically, a positive case can be built for the imposition of a corporate tax. This is based
on several factors: On equity grounds; Ease of administration for those companies that
comply with statutory accounting standards; Political considerations make it more prudent to
tax corporations -which have no votes - than taxing individuals; and The benefit principle
where corporations should pay taxes in return for the benefits conferred by incorporation.
There are, however, negative sides to the imposition of corporate taxes. These include;
Corporation taxes have a retarding effect on the corporate sector to the extent that they
discourage existing corporations from growing or deterring unincorporated businesses from
adopting a corporate form or even encourage existing corporate to discard their corporate
identity; Revenue yields from corporate income tax may be at the expense of private savings
rather than consumption because corporate taxes mean that dividends are less than they
should be; and Corporate income tax may become a deterrent to foreign capital inflow (Moyi
and Ronge, 2003).
Prior to the reforms, the main problems of corporate income taxation included low levels of
compliance, inefficient tax assessment and collection procedures of tax administration. Since
enterprises are the engine of job creation and growth, lower corporate tax rates encourage
investment, entrepreneurship and production by increasing the net reward for productive
effort. In addition, lower corporate tax rates make Kenya tax competitive and therefore a
suitable destination for foreign direct investment. Based on this viewpoint, the most
prominent feature of corporate tax reform was the reduction of the top rate from 45% in 1989
to 30% currently. Similarly, the top CIT rate and the top marginal PIT rate were unified as a
means of increasing the disposable income for both corporate and individual capital
investments. As well as reducing incentives for tax avoidance that results from differentiated
top CIT and PIT rates. Similarly, the differentiated CIT rate structure was also rationalized

16
by unifying the structure across all kinds of business. However, the differentiated rates
between local and foreign companies have persisted even during the reforms period. This
acts as a disincentive to local companies, which are not eligible for the incentives that are
available for their foreign counterparts (Gallagher, 2004).
Turnover Tax was introduced by the Finance Act 2007 through the provision of the Income
Tax Act, Cap 470,with the Tax being applicable to any resident person whose turnover from
business does not exceed Kshs.5 million during any year of Income but does not include:
employment income, exempt incomes falling under the I" Schedule of the Income Tax Act,
business incomes subject to a final withholding tax, persons in receipt of business Incomes
But with annual turnover below Kshs. 500,000, limited companies, rental Income and
professional management fees (KRA, 2011).
2.3.1.2 Value Added Tax
VAT was introduced in Kenya in 1990 to replace sales tax. This shift was motivated by the
argument that VAT (relative to sales tax) had a higher revenue potential, and its collection
and administration was more economical, efficient and expedient. Since 1991, a number of
steps have been taken to rationalize and strengthen the VAT, most importantly by moving
several items subject to VAT from specific to ad valorem rates and broadening VAT
coverage in the service sector. Four measures were applied to broaden the base of VAT.
First, from 1990, sales tax (retail-level) was changed to VAT (manufacturer-level) including
business services. Second, the tax point was gradually moved from the manufacturer level to
the retail level in a number of sectors including jewellery, household appliances and
entertainment equipment, furniture, construction materials, vehicle parts, and pre-recorded
music. As a result of this, the coverage of VAT on goods supplied at retail level expanded
tremendously from 1990 through 1995. Third, “goods” were redefined to exclude the supply
of immovable tangible and all intangible property and rental or immovable property. Fourth,
from 1991,the coverage of the service sector was expanded to include business services;
hotel and restaurant services; entertainment; conferences; advertising; telecommunications;
construction; transportation; the rental, repairs and maintenance of all equipment (including
vehicles); and a range of personal services (KIPPRA, 2004b).
17
Measures aimed at VAT rationalization included the reduction of the maximum rate from
over 150% to 15% (between 1990 and 1997) and the reduction of the rate bands from 15 to 3.
Whereas the low rate was increased from 50% to 78%, all the other rates were reduced; the
top rate from 150% to 15% and the standard rate from 18% to 16%. Additional measures
included raising the minimum turnover level for compulsory registration from Ksh10,000 to
Ksh40,000 and also introducing stiff penalties for defaulters in the following areas: late
filing of VAT returns, failure to issue VAT invoices and failure to maintain proper books of
account. Another aspect of VAT that elicited much interest from the taxpayers was the tax
refund system. At the time of inception, the refund system was characterized by weak
controls and corruption that led to loss of revenue (Nyamunga, 2001).
Administrative changes were undertaken thereafter (mid 1990s) to streamline the refund
system. The improved management that followed has been behind the introduction of tighter
verification measures and the elimination of the large backlog of claims. Since 1991, the
coverage of excise duties has expanded from domestic production to include imports. Excise
duties were rationalised to cover the luxury goods tax element on wine, beer, spirits, mineral
water, tobacco products, matches, luxury passenger cars and minibuses while automotive
fuels and cosmetics were introduced into the excise tax net (KIPPRA, 2004b).
2.3.1.3 Excise Duty
Excise taxes are levied on (imported) oil products, as well as consumption of beer and spirits,
cigarettes, matches, and tobacco. Before the TMP, excise taxes had been levied at specific
rates, but moderate to high inflation induced a change to an ad valorem basis. Later, in the
1980s, the tax regimes were selectively switched back to specific charges in the face of
undervaluation by traders. Prior to 1990, taxes on cigarettes had provided more than half of
non-oil excise tax revenues and beer about one-quarter. However coincident with the
introduction of the VAT, the specific tax on beer was replaced with a 100 percent tax rate,
and these shares were effectively reversed (Kiringai et al. 2002).

18
Excise duty is levied on specified schedule goods and services and charged at either specific
or ad valorem (value based) depending on type of goods. An ad valorem is a rate charged in
accordance with the value of goods, whereas specific rates are charged as per volume or
quantity. In the late 1980s, Kenya initiated a Tax Modernization Programme (TMP) which
was meant to reform the tax system affecting excise tax policy. In this respect, there was a
switch between specific rate and ad valorem regimes, in order to ensure that revenue
maximization was maintained. For example, although Kenya maintained specific rate regime
during the implementation of TMP, in 1991/2, there was a switch from specific to ad
valorem, where there were discretionary annual changes to excise duty for beer and tobacco
to keep in line with inflation. Further, in 1997/98 there was rationalization of multiple excise
rates on cigarettes to uniform rate in order to simplify collection and curb mis-declaration of
imported cigarettes. In 2003/04, the government reverted back to specific tax regime from ad
valorem; and more recently, excise tax policy is currently influenced by the East African
Community integration and harmonization policies of which Kenya is a member. Generally,
ad valorem is used where the objective is to raise revenue, whereas specific excise duty is
imposed to correct for externalities (Mutua, 2012).
2.3.2 Customs Policy Reforms
The customs policy reforms aim at transforming and modernising Customs administration in
accordance with internationally accepted conventional standards and best practices. This also
involved embracing the redefined function of Customs to lay greater emphasis on trade
facilitation and protection of society. This was achieved through implementation of the
following reform initiatives: a web based Simba 2005 System and its subsidiary systems, i.e.
Cargo Management Information System (CAMIS) and Customs Oil Stocks Information
System (COSIS), a 24 hour Document Procession Processing Centre (DPC) for processing
documents to replace the long-room concept, Embracing Risk Management practices,
Enhancing cargo clearance by implementation of an electronic document exchange platform
(ORBUS) and expansion of the Authorized Economic Operator (AEO) programme,
Enhancing uniformity in commodity valuation by implementation of a Valuation Database,
Strengthening enforcement by adopting the EAC recommended forms including Single

19
Administrative Document (C17B); enhancing Post Clearance Audit (PCA); automating Air
Passenger Service Charge (APSC); implementation of One Stop Border Posts (OSBP);
implementation of Electronic Cargo Tracking System (ECTS); and adoption of X-Ray Cargo
Scanners, Sniffer Dogs (K9 Unit) and Patrol Boats, and Capacity Building in various
Customs operational areas (KRA 2012).
Kenya’s customs taxes underwent significant changes during the reform period in the
direction of restricting exemptions on duty, encouraging exports, reforming the tariff
structure and strengthening the administration of customs duties. Broadly, these reforms were
aimed at encouraging a free market atmosphere and therefore increasing the level of foreign
direct investment in Kenya. During the period 1987 to 1998, the top tariff rate was reduced
systematically from 170% to 25%, while the rate bands were reduced from 24 to 5. As a
result of the changes, the simple average rate fell from 40% to 16% (KIPPRA, 2005).
Before 1991, the exemption system had been rather generous, and several measures were
implemented to restrict the generosity. Such restrictive policies included the reduction in the
range of exempt goods, making imports by all parastatals tax deductible, abolishing
discretionary exemptions (in 1992) and eliminating exemptions on agricultural commodity
aid (except during cases of a national disaster or refugee support) in 1995. The reforms
during the period 1994 to 1998 also targeted the non-government organization (NGO) sector
by imposing restrictions on NGO exemptions, introducing the bonding of major project aid-
funded imports and initiating post project reconciliation. Similarly, NGOs and other relief
organizations were required to register for purposes of income tax in order to qualify for
exemption (Nyamunga, J. 2004a).
In order to achieve these reforms, the administrative capacity of the tax system had to be
strengthened. (Taliercio, R. 2004) The measures undertaken towards this end include the re-
introduction of the selective examination/rapid release system and the re-establishment of the
intelligence and investigation functions. Others were the strengthening of the transit controls
system, revising the pre-shipment inspection programme (from 1994), implementing limited

20
“modularized” computerization on selected functions, introducing warehouse controls and
strengthening cargo control at Mombasa port (from 1996).
2.3.3 Road Transport Tax Policy Reforms
Road Transport Tax Policy Reforms aimed at modernize Road Transport Department’s
(RTD) operations. This ensured improved service delivery to the taxpayers, increased
revenue collection while at the same time reducing the cost of revenue collection. This was
achieved through implementation of the following reform initiatives: Undertaking business
process reengineering and automation in which Vehicle Management System (VMS) and
Driving License Management System (DLMS) were implemented for more efficient
processing of applications and better records management, introduction of smart card Driving
Licenses, achieving full connectivity of RTD IT systems with other KRA departments and
the Ministry of Transport in order to ensure seamless flow of information. As part of this,
VMS was linked to Customs Simba 2005 System to communicate seamlessly. This allowed
for payment and registration of vehicles at the point of entry, decentralization of RTD
services to regional offices in order to take services closer to the customers, introduction of a
new-look security logbook with enhanced security features to minimize forgery, introduction
of specific registration number plates for motor cycles to prevent tax evasion and creation of
an automated receipting system to enhance revenue accountability.
2.3.4 Tax Evasion Policy Reforms
Tax evasion is the failure to disclose the correct income that should be assessed either by
misstatement of facts, falsification of figures, filing of incorrect returns or by
misrepresentation of tax liabilities. Thus, through the employment of criminal or fraudulent
means, the tax payer pays less tax than he ought to pay. Tax evasion is accomplished by
deliberate act of omission or commission which themselves constitutes criminal acts under
the tax laws. These acts of omission or commission might include failure to pay tax; failure
to submit return; omission or misstatement of items from returns; claiming illegal reliefs;
understating income; documenting fictitious transactions; overstating expenses; failure to
answer queries and so on. Tax evasion involves willful default and is therefore a criminal

21
offence. The most common form of tax evasion is through failure to render tax returns to the
relevant tax authority. A tax evader may be charged to court for criminal offences with the
consequent fines, penalties and at times imprisonment being levied on him for evading tax
(Faseun, 2001).
Investigation and Enforcement Reform and Modernization project was initiated aiming at
enhancing KRA’s capability to efficiently and effectively detect, deter and punish tax fraud
through proactive intelligence, coordinated and rapid enforcement, and targeted
prosecution. This was achieved through implementation of the following reform initiatives:
Integration of all investigation and enforcement units that were previously in various
departments under the Investigations & Enforcement (I&E) Department, Restructuring I&E
department through establishment of the Business Intelligence Office, Prosecution Office,
Enforcement Division and Anti-smuggling and Anti-Counterfeit Unit to enhance
enforcement, Enhancement of prosecution capacity, Acquisition and use of anti-counterfeit
and anti-smuggling solutions, Capacity building in critical investigations and enforcement
areas including computer forensic audit, intelligence gathering, risk management, intellectual
property and investigation skills and Development and implementation of a KRA-wide
Enforcement strategy (KRA,2012).
2.4 Economic Conditions
According to Richard A. et al, Changes in economic conditions are expected to modify
forecasting assumptions in various ways. For instance, changes in the foreign trade sector as
a share of the total production in the economy affect the taxable capacity of a country. This is
especially true in the case of a developing country, in which trade taxes constitute a
significant proportion of tax revenues. Similarly, the deregulation of certain sectors of the
economy should automatically change the structure of the relevant markets for goods and
services, and such changes will consequently affect the size of the tax bases. Devaluation of
the domestic currency will also affect the quantities of imports and exports, which in turn
will affect the trade tax revenues from import duties. Changes in the economic conditions of

22
major trading partners will also have a significant impact on the domestic economy and on
tax revenues.
2.5 Price Level Changes
Movements in price levels have different effects on the tax structure and real revenue
collection by the government. For instance, inflation has an ambiguous effect on business
income tax revenues, by affecting differently the components of taxable income, such as
depreciation allowances, accounts receivable and payable, and costs of goods sold.
Furthermore, the impact of inflation on indirect tax revenues will ultimately depend on
whether the tax is imposed on a unit tax or ad valorem tax. Therefore, the tax policy units
have to account for the impact of inflation on the tax bases, for the behavioral responses and
for the expected changes in real revenue conditions (McDaniel, 1985).
2.6 Tax Revenue in Kenya
Tax revenue refers to compulsory transfers to the central government for public purpose with
certain compulsory transfers such as fines, penalties, and most social security contributions
being excluded. The refunds and corrections of erroneously collected tax revenue are treated
as negative revenue. According to Barnett and Grown (2004), tax policy is at the heart of the
political debate on the level of public services that should be provided and who should pay
for them because taxes are the principal source of recurring revenue under government
control and besides, taxes are used to assist in the redistribution of wealth and incomes and to
regulate economic activities.
Tax is a central but neglected element of development policy. The structure and
administration of taxation are frequently omitted from discussion and research agenda.
Questions of a primarily redistributive nature may be deemed political, and so unsuitable for
neutral economic analysis, and moreover as questions to be resolved by the democratic
process in individual countries. On the other hand, many questions are posed in terms of
system reform and these may instead be considered as purely ‘technical’ – matters of
economic and bureaucratic efficiency to be settled by experts (Martinez-Vazques, 2001).

23
As a result, tax generates neither the sort of attention given by independent empirical
academic research such as questions of optimal exchange rate arrangements, nor the level of
NGO advocacy focus devoted to e.g. multinational investment behavior. This twin neglect
may explain how an element of such importance for human development has such a low
profile – and possibly why its contribution may have been damaging. This neglect, it is
argued, has led to two main developments. First, the treatments of tax as a specialist area,
with a resultant focus on ‘efficiency’ rather than theoretical analysis or practical research,
which has contributed to a lack of knowledge of potentially important peculiarities of
individual countries. This in turn has contributed to treatment of poor countries’ systems as
simply underdeveloped versions of rich country equivalents. Technical assistance then
focused on helping the former to reach ‘our level’, rather than a more careful and
constructive engagement (Crowe, 2005). Problems of this nature are increasingly widely
recognized. The World Bank’s study of its own performance in this area during the 1990s is
damning: Such recognition has brought with it efforts to improve assessment, including a
recent USAID project (Gallagher, 2004) which attempts to construct a series of international
benchmarks by which to compare tax systems internationally.
Kenya’s dependence on foreign aid and borrowing has declined over the last five years,
averaging about 11% of the total budget relative to the East Africa Community (EAC)
member states, whose budgets are financed to the tune of 30-40% by development partners.
To this end, tax policy decisions have different impacts on different individuals, businesses
and the economy at large (Mutua, 2012). According to Karingi et al. (2005), Kenya has
moved from a low tax yield country during the 1980s, when total tax revenue as a percentage
of Gross Domestic Product (GDP) which is measure of the size of the economy, averaged
19.7% to the current average of about 24% following continuous reforms through the Tax
Modernization Programme (TMP) after 1994/95 to date. The tax revenue performance over
the period 1991/92 - 2010/11 has maintained a consistent growth, in nominal terms.

24
It is important to note that tax structure in Kenya is skewed heavily towards income taxes and
Value Added Taxes (VAT) as the two largest source of total tax revenue. For example, for
the period 2005/06 - 2011/12 income taxes accounted for 36.3% of total government revenue
(total taxes plus appropriation-in-aid). VAT comes in second, averaging over 25% in the
same period, followed by excise duty with import duty and other taxes (for example, stamp
duty) accounting for more or less similar proportions (Mutua, 2012).
2.7 Justification for use of the Reforms and the Period 2003/2004 to 2012/2013
The following particular Domestic Taxes Policy Reforms were initiated: Merger of
Income Tax and VAT to form Domestic Taxes Department (DTD) in July 2004. In July
2005, DTD took over the administration of Domestic Excise from Customs & Excise
Department, Segmentation of taxpayers to address their unique needs by creating the
Large Taxpayer Office (LTO) to cater for large taxpayers and the Medium Taxpayer
Office (MTO) for medium sized taxpayers. Others were widening the tax net by
introducing Turnover Tax (TOT) for small taxpayers and particularly those in the
informal sector, Enhancing taxpayer compliance through introduction of Withholding
VAT system in October 2003 and Electronic Tax Register (ETR) system in July 2005.
Development and implementation of a web based Integrated Tax Management System
(ITMS) to provide various tax services online, e-tax registration and e-tax filing modules
were rolled out as well as Provision of online facilities for verification of Personal
Identification Number (PIN) and Tax Compliance Certificate (TCC) at the KRA website
to enable taxpayers and the public to verify authenticity (KRA 2012).
The customs policy reforms were achieved through implementation of the reform initiatives
such as the web based Simba 2005 System, a 24 hour Document Procession Processing
Centre, Embracing Risk Management practices and enhancing cargo clearance by
implementation of an electronic document exchange platform. Others were Enhancing
uniformity in commodity valuation by implementation of a Valuation Database,
Strengthening enforcement by adopting the EAC recommended forms, automating Air
Passenger Service Charge, implementation of One Stop Border Posts, implementation of
Electronic Cargo Tracking System and adoption of X-Ray Cargo Scanners, Sniffer Dogs and

25
Patrol Boats, and Capacity Building in various Customs operational areas (KRA 2012). The
road transport tax policy reforms was achieved through implementation of reform initiatives
such as undertaking business process reengineering and automation achieving full
connectivity of RTD IT systems with other KRA departments and the Ministry of Transport
in order to ensure seamless flow of information. This was aimed at increasing the tax revenue
generated from road transport.
Tax evasion policy reform initiatives implemented were; integration of all investigation and
enforcement units that were previously in various departments under the Investigations &
Enforcement (I&E) Department, Restructuring I&E department through establishment of the
Business Intelligence Office, Prosecution Office, Enforcement Division and Anti-smuggling
and Anti-Counterfeit Unit to enhance enforcement, Enhancement of prosecution capacity,
Acquisition and use of anti-counterfeit and anti-smuggling solutions, Capacity building in
critical investigations and enforcement areas including computer forensic audit, intelligence
gathering, risk management, intellectual property and investigation skills and Development
and implementation of a KRA-wide Enforcement strategy (KRA,2012).
As can be seen above, the reforms were mainly initiated from the year 2003 up to the
year 2006 hence the reason for designating this period as the pre reform period and the
years up to 2013 the post reform period. The research was then undertaken for the period
2003/2004 to 2012/2013. This period was not only current but also appropriate to
capture most of the data sought by the researcher for the research study.
2.8 Theoretical Review
2.8.1 Wagner’s Law of Increasing State Activity
The Law of increasing State activity was introduced by Adolf Wagner a nineteen century
German economist to explain the growth of the share of public expenditure in Gross National
Product (GNP). He divided government expenditures into three categories namely;
administration and defense, cultural and welfare, and provision of direct services by
government in case of market failure. It is well known that rather than allow for monopoly to

26
emerge, government usually creates Statutory Corporations such as NITEL, Post Office,
Water Boards etc, to cater for the welfare of the people. Wagner’s Law states that as per-
capita income increase, the relative size of the public sector will grow.
According to Wagner as the economy becomes industrialized, population tends to
concentrate in the urban areas. This in turn leads to externalities (market failure) and
congestion which require government intervention and regulations. Legal authorities and the
police emerge to address problems of law and order, peace and security. Banking services by
the State arise to link surplus funds with those who have the investment opportunities. The
increase of public expenditures on recreation, education, health, and welfare services is
explained in terms of the high population in the urban centers. Wagner argued that as real
income increases, public expenditure on education, recreation, health etc would increase
more than the increase in real income. This explains the increasing ratio of government
expenditure to gross national product.
Wagner’s theory of increasing State activity has many defects. First, it is not a well-
articulated theory of public wants; rather it is an organic theory of the State where the State
behaves as if it were an individual and takes decisions independent of members of the
society. Secondly, the predictive power of the theory is very much doubtful. It is not always
true that as par-capita income grows, the share of public expenditure in GNP increases. The
share of public expenditure may actually decrease as the economy grows particularly when
the private sector is strong and dynamic.
2.8.2 Peacock Wiseman Theory of Public Expenditure
Allan Peacock and Jack Wiseman theory (PWT), was based on the political theory of public
expenditure determination which states that government likes to spend more money, citizens
do not like to pay more taxes, and that government needs to pay some attention to the
aspiration and wishes of their people. PWT attempted to explain the circular trend or time
pattern of change in government expenditure in response to development in the political
economy while the taxable capacity of the electorate acts as a constraint. Their theory is

27
known as the Displacement Hypothesis and is based on the experience of Great Britain.
Displacement hypothesis states that government expenditure grows in step wise fashion.
During periods of catastrophes or wars, government expenditure grew rapidly in Great
Britain and remained constant during the war, famine, or disaster otherwise catastrophic
period. They also argued that government expenditures are largely determined by
government revenue or taxation, PWT maintains that as the economy and income grew, tax
revenue would raise thereby enabling government expenditures to rise in line with GNP. The
acceptance of the existence of tolerable level of taxation which acts as a constraint on
government behaviour is consistent with Clark’s “Catastrophe School” of taxation. PWT
make a destination in government expenditure growth between normal or peak time and war,
crisis or social upheaval period.
According to PWT, during peak, public expenditures would tend to experience an upward
trend, even though there may be some discrepancies between a desirable level of government
expenditure and a desirable level of taxation. During war, famine or social upheaval this
normal and steady growth in government expenditures, would be interrupted. This is as a
result of the displacement hypothesis as unproductive government spending during social
upheavals displaced productive government expenditure leading to rapid increase in public
expenditure.
Government imposes higher taxes which are regarded as acceptable during period of crisis.
During this period, public expenditure is displaced upward (i.e. displacement effect). War-
related expenditure displaces private and other government expenditures. However after the
wars or crisis, aggregate public expenditures does not fall back to its original level since a
war is not fully paid for from taxation alone. Inspection effect may also occur as government
attempts to increase expenditures to improve social conditions which have deteriorated
during the period of the crisis. Government finances the high expenditure from the increase
and tolerable level of taxation that does not return to its former level. There are two possible
scenarios which may occur after the war or social upheaval. First, total private expenditures
28
may return to its original growth path and second, government expenditures experienced
during the war may continue in the post-war period along with an increase in civilian
government expenditures until the desired growth is reached (Baghebo M. 2012).
2.9 Empirical Review
Gachanja (2012), in his research on The effect of tax reforms and economic factors on tax
revenues in Kenya observed that Kenya introduced the tax modernisation programme in
1986 with the hope that this would, among other things, enhance revenue collection. The
objective of this study was to establish the effect of tax reforms and economic factors on tax
revenues in Kenya.
A correlational study design was selected. Secondary data was collected for a ten year period
(2000-2009) from various sources included the Central Bank of Kenya website, the Kenya
National Bureau of Statistics, Transparency International website and the World Bank
website. Trend analysis was used to graphically present some of the trends in the data. With
the aid of SPSS, a multivariate analysis was employed with the OLS regression being used.
The dependent variable was tax revenues while the independent variables were tax reforms
(measured as a dummy variable).
The regression model was controlled for corruption (measured by the corruption perception
index). The trend analyses revealed that there corruption index in Kenya had been improving
since 2000 while tax revenues had been rising over the period. The OLS regression revealed
that the independent variables accounted for 91.6% of the variance in tax revenues. Reforms
were negatively and significantly correlated with tax revenues, which had a positive and
significant influence on tax revenues, while corruption had a positive but insignificant impact
on tax revenues. The study concludes that tax reforms have negatively contributed to tax
revenues in Kenya while economic conditions (GOP) have positively impacted on revenues.
The effect of tax reforms is therefore counter-intuitive. The study recommends that the
Kenya Revenue Authority relook into the issue of reforms and modernization programs to
check on whether some of the reforms they have instituted lead to better revenue collections.

29
The study also recommends that reforms and measures need to be carried out in all sectors of
the economy to spur economic growth and therefore improving the tax revenues. Future
studies should also perform the normality of distribution tests to determine which type of
multivariate analysis to be carried out. Other tests to check whether the conditions for
parametric analysis as well as for OLS regression analysis are met can be performed.
Okech and Mburu (2011), in their research ‘Analysis of responsiveness of tax revenue to
changes in national income in Kenya 1986-2009’, observed over the years, the Kenyan
government had continued to experience budget deficit. This had been partly attributed to the
inability of the tax system to generate sufficient revenue to finance public expenditure.
Inadequacy of tax revenue to finance public expenditure had largely been attributed to lack of
responsiveness of tax revenue to changes in national income.
To reverse the trend, the Kenyan government continues to initiate and implement tax reforms
over years. The purpose of their study was to analyze the responsiveness of tax revenue to
changes in national income using tax elasticity and buoyancy given the various tax reform
measures that had been mooted over years. This was guided by various specific objectives
namely i) to determine the income-elasticity of tax revenue; ii) to determine buoyancy of tax
revenue; iii) to examine tax-to-base elasticity of tax revenue; and iv)to determine base to
income elasticity of tax revenue.
By adopting a causal research design, a multiplicative model of estimating elasticity and
buoyancy was used. In terms of data, the study relied primarily on secondary data obtained
from various Kenya Statistical Abstracts, Economic Surveys and International Financial
Statistics Browser. ADF test was done to detect non stationarity and differencing done to
make data stationary. The study found that the tax revenue was neither buoyant nor income-
elastic despite reforms undertaken over period since 1986. On the basis of this, it was
recommended that there was need re-evaluate the tax policy measures that had been
implemented over the years to make tax responsive to national income while enhancing tax
collection measures.

30
Moyi, E. and Ronge E. (2006) in their research on Taxation and Tax Modernization in Kenya
observed that Kenya introduced the Tax Modernisation Programme in 1986 with the hope
that it would, among other things, enhance revenue collection, improve tax administration
and reduce compliance and collection costs. Despite the tax modernization, there were
concerns that the challenges that confront the Ministry of Finance and Kenya Revenue
Authority were not much different from the challenges that faced these revenue authorities
before the reforms.
They also noted that there were also concerns that tax competitiveness in Kenya was low and
the country remained among the most tax unfriendly countries in the world. Their study
reviewed tax revenue performance as well as tax design and administration changes during
the period 1996 - 2005 in order to identify priorities for further tax reform.
Their empirical analysis revealed the adverse effect of inflation on tax revenues. The tax
structure was less buoyant and possibly inelastic although indirect taxes, and not direct taxes,
held the capacity to improve the flexibility of the tax system. The challenges that confronted
tax design included taxation of agriculture and the informal sector, repeal of tax holidays,
high effective protection, high dispersion of tariff rates, detailed and rigid custom rules, poor
response of VAT to reforms, weak capacity to process large volumes of returns and refunds
for zero-rated transactions. In addition, Kenya’s tax system was burdensome in terms of time
taken to prepare and submit tax returns.
The study concluded that further tax reforms should give priority to the following areas: first,
taxation of the informal sector by designing simplified registration processes and giving the
sector treatment other than that provided by the current methods and tax code. Second, there
should be a policy shift towards internationally acceptable investment incentives such as
accelerated depreciation for qualifying manufacturing assets. Third, tax productivity should
be improved through simplifying the tax structure and reducing the tax rates, reviewing
cumbersome custom procedures and enhancing the tax monitoring function. Fourth, lowering

31
effective protection of Kenya’s products by reducing tariffs with the goal of achieving broad
based uniform tariffs. Fifth, strengthen tax administration through developing integrated
taxpayer registration systems; simplifying tax laws, forms and procedures; developing
frequently updated information systems on registered tax payers; and intensifying the use of
automatic triggering mechanisms. Sixth, the response of VAT to economic and policy
changes should be enhanced by strengthening the administrative capacity (personnel,
computers and audits) to handle large volumes of returns and refunds; and continue to
harmonize the VAT rates. Seventh, the tax system should be insulated from inflation effects
by ensuring that adequate indexing procedures are applied to accurately account for full
movements in prices. Finally, there is need to build vertical accountability of the tax system
by ensuring that taxpayers are more involved in the formulation of tax policy and planning
for any reforms.
Omondi O. V. et al (2014) in their research on Effects of Tax Reforms on Buoyancy and
Elasticity of the Tax System in Kenya: 1963–2010 examined the effects of tax reforms on tax
buoyancy and elasticity estimates. The specific objectives of the study were; to determine the
effect of tax modernization programme and revenue administration reforms and
modernization programme on tax buoyancy and tax elasticity. The study employed
regression analysis and used annual time series data for the period 1963 to 2010. Secondary
data from Kenya National Bureau of Statistics, Kenya Revenue Authority, Central Bank of
Kenya and World Bank was used. Elasticity estimates were determined by adjusting data for
discretionary changes using the proportional adjustment method. The study revealed that
both revenue administration reform and modernization programme (RARMP) and tax
modernization programme (TMP) were important in explaining the variations in buoyancy
and elasticity of the tax system in Kenya. Although the reforms analyzed had positive effect
on both tax buoyancy and elasticity, the results indicated that this was not sufficient to help
generate adequate revenue to finance the ever increasing government expenditure. They
noted that with an inelastic tax system, the Kenya government had to re-evaluate the
implementation strategies and pursue further reforms for it to fully exploit the tax revenue
potential in the economy.

32
Muriithi M. K. and Moyi E. D. (2003), in their research on Tax reforms and revenue
mobilization in Kenya, noted that Kenya embarked on massive tax reforms in 1986, but what
was known about the performance of the reforms in terms of raising the revenue mobilization
capacity of the tax system? Did the reforms mitigate Kenya's perpetual fiscal imbalances?
This study attempted to examine the impact of Kenya’s tax reform programme in light of the
in-built revenue mobilization capacity of the tax system. The paper analysed the trend of tax
reforms for each category of tax, and evaluated the impact of these reforms, both on the
overall tax system and on individual tax handles. The magnitude of the fiscal gap and the
reaction of the government to this problem were first discussed. The rationale and process of
tax reforms in Kenya was then outlined. A framework for estimating revenue productivity
was then presented, and an empirical analysis was provided.
The paper reported that: the expectation was that these policies would ensure that every
individual tax was designed so that its yield was responsive to national income changes, tax
policy was expected to ensure that the predominant taxes in the revenue were those with a
highly elastic yield with respect to national income, reforms had a positive impact on the
overall tax structure and on individual tax handles, the elasticity of indirect taxes was lower
compared to direct taxes.
The paper concluded that: the reforms' larger impact on direct taxes than on indirect taxes,
suggests that revenue leakage is still a major problem for indirect taxes, the better
responsiveness of direct taxes can be attributed to the relative effectiveness of the reforms in
direct taxes, which not only made the tax system simpler but also reduced avenues for
evasion and corruption, effective reforms in direct taxes include the introduction of PIN,
lower rates, reduction of exemptions and a shift away from multiple rates across many
categories, tax reform has raised the productivity of the tax system with the exception of
sales tax/VAT and the low elasticity of sales tax/VAT in both periods is surprising given that
the base grew faster than income, this suggests collusion between the tax collectors and the
taxpayers among other things.

33
2.10 Research Gap
Okech and Mburu (2011), in their research ‘Analysis of responsiveness of tax revenue to
changes in national income in Kenya 1986-2009’ found that the tax revenue was neither
buoyant nor income-elastic despite reforms undertaken over period since 1986. On the basis
of this, they recommended that there was need re-evaluate the tax policy measures that had
been implemented over the years to make tax responsive to national income while enhancing
tax collection measures.
Moyi, E. and Ronge E. (2006) in their research on Taxation and Tax Modernization in Kenya
noted challenges that confronted tax design included taxation of agriculture and the informal
sector, repeal of tax holidays, high effective protection, high dispersion of tariff rates,
detailed and rigid custom rules, poor response of VAT to reforms, weak capacity to process
large volumes of returns and refunds for zero-rated transactions. In addition, Kenya’s tax
system was burdensome in terms of time taken to prepare and submit tax returns.
Muriithi M. K. and Moyi E. D. (2003), in their research on Tax reforms and revenue
mobilization in Kenya recommended that further improvements were required in the area of
reduction of rates and exemptions, increasing VAT administration capacity through a higher
budgetary outlay, increasing tax collectors’ salaries and reviewing collusion penalties
upwards, and strengthening the development of audit skills, additional capacity was required
in areas such as automation, audit and risk profiling, and general skill development. It also
recommended that the tax authorities should pay more attention to taxpayer education,
compliance and tax audits.
Most of the researches that have been done have not addressed the particular reforms to do
with domestic taxes, customs taxes, road transport taxes and tax evasion. It is against this
background that the researcher undertook this research on the basis of these reforms so as to
evaluate their effects on tax revenue in Kenya.

34
2.11 Conceptual Framework
The diagrammatic representation of conceptual framework shows how the variables are
related. Domestic Taxes Policy Reform, Customs Policy Reform, Road Transport Tax Policy
Reform and Tax Evasion Policy Reforms are independent variables while Tax Revenue was
the dependent variable which depended on the occurrences of the independent variables.
Figure 2. 1: Conceptual framework
Independent Variable Moderating Variable Dependent Variable
Tax Policy Reforms
The dependent variable of this study was tax revenue which was influenced by the
independent variables namely domestic taxes policy reform, customs policy reform, road
transport tax policy reform and tax evasion policy reforms.
I. Domestic Taxes Policy
Reform
Domestic tax
revenue
II. Customs Policy Reform
Customs revenue
III. Road Transport Tax
Policy Reform
Road Transport Tax
revenue
IV. Tax Evasion Policy
Reforms
Total tax evaded
I. Economic
conditions
II. Price changes
Tax Revenue
Tax revenue generated

35
2.11.1 Domestic Taxes Policy Reform
Domestic taxes policy reform to a great extent influence tax revenue. Well formulated
domestic policy reforms will increase tax revenue while poorly formulated policy reforms
will reduce tax revenue. No reforms mean that the tax revenue may eventually fall leading to huge
budget deficits. These reforms seek to create a fully integrated and modern domestic tax
administration with the key objectives of integrating domestic revenue administration as well
as developing a holistic approach to taxpayer services thereby providing a single view of the
taxpayer while enhancing taxpayer compliance and broadening the tax base.
2.11.2 Customs Policy Reform
The customs policy reforms aim at transforming and modernising Customs administration in
accordance with internationally accepted conventional standards and best practices. This also
involved embracing the redefined function of Customs to lay greater emphasis on trade
facilitation and protection of society. This was achieved through implementation of the
reform initiatives such as the web based Simba 2005 System, a 24 hour Document
Procession Processing Centre, Embracing Risk Management practices, Enhancing cargo
clearance by implementation of an electronic document exchange platform, Enhancing
uniformity in commodity valuation by implementation of a Valuation Database,
Strengthening enforcement by adopting the EAC recommended forms, automating Air
Passenger Service Charge, implementation of One Stop Border Posts, implementation of
Electronic Cargo Tracking System and adoption of X-Ray Cargo Scanners, Sniffer Dogs and
Patrol Boats, and Capacity Building in various Customs operational areas (KRA 2012).
These policy reforms were aimed at increasing the total tax revenue generated in the country.
2.11.3 Road Transport Tax Policy Reform
The road transport tax policy reforms contribute to tax revenue to a great extent. Poor road
transport tax policy reforms for example will create a huge drop in tax revenue and vice
versa. Road Transport Tax Policy Reforms aimed at modernising road transport department’s
operations so as to ensure improved service delivery to the taxpayers, increased revenue

36
collection while at the same time reducing the cost of revenue collection. This was achieved
through implementation of reform initiatives such as undertaking business process
reengineering and automation achieving full connectivity of RTD IT systems with other
KRA departments and the Ministry of Transport in order to ensure seamless flow of
information. This was aimed at increasing the tax revenue generated from road transport.
2.11.4 Tax Evasion Policy Reforms
Tax evasion is the failure to disclose the correct income that should be assessed either by
misstatement of facts, falsification of figures, filing of incorrect returns or by
misrepresentation of tax liabilities. The most common form of tax evasion is through failure
to render tax returns to the relevant tax authority. A tax evader may be charged to court for
criminal offences with the consequent fines, penalties and at times imprisonment being
levied on him for evading tax (Faseun, 2001). So as to reduce tax evasion, the following
reform initiatives were implemented; integration of all investigation and enforcement units
that were previously in various departments under the Investigations & Enforcement (I&E)
Department, Restructuring I&E department through establishment of the Business
Intelligence Office, Prosecution Office, Enforcement Division and Anti-smuggling and Anti-
Counterfeit Unit to enhance enforcement, Enhancement of prosecution capacity, Acquisition
and use of anti-counterfeit and anti-smuggling solutions, Capacity building in critical
investigations and enforcement areas including computer forensic audit, intelligence
gathering, risk management, intellectual property and investigation skills and Development
and implementation of a KRA-wide Enforcement strategy (KRA,2012). This was to make
sure that loop holes in the tax system were finally eliminated and so as to increase the tax
revenue generated.

37
CHAPTER THREE
RESEARCH DESIGN AND METHODOLOGY
3.1 Introduction
This chapter starts with a discussion on the research design of the study. It then discusses the
method of data collection and data analysis. It concludes with the measurement of the
variables.
3.2 Research Design
A research design can be regarded as an arrangement of conditions of collection and analysis
of data in a manner that aims to combine relevance with research purpose (Kombo and
Tromp, 2006). The research design adopted was descriptive research design in which data
was gathered just once over the period 2003/2004 to 2012/2013 from Kenya Revenue
Authority. The data collected was analysed over the period and compared the results for
periods before and after the regulations came to effect. A cross-sectional study analysed the
data collected to make inferences about a population of interest (universe) at one point in
time. The study was descriptive research as it was conducted to evaluate the effect s of Tax
Policy Reforms on Tax Revenue in Kenya.
3.3 Data Collection
The researcher used secondary data that was collected for a five year period (2003/2004 to
2012/2013) from Kenya Revenue Authority. The data collection tools being employed were
the data collection sheets, which gathered the data for the whole period under study.
3.4 Data Analysis
The researcher examined the correlation between the dependent variable (tax revenue)
and the independent variables (tax policy reforms) and then evaluated the effects of the
variables on tax revenue. With the aid of SPSS, a multivariate analysis was employed
with the OLS regression being used where the dependent variable was the tax revenues
while the independent variables were the tax reforms. Paired T-test was carried out to

38
determine the differences between the mean revenue collected in the two period pre and
post reforms. Paired Sample Correlations were calculated to establish the significance of
the correlation between each pair of the variables. The study also used descriptive
statistics, regression analysis and correlation analysis to analyze the data. The regression
model was presented in the equation below:
Y = α + b1X1 + b2X2 + b3X3 + b4X4 + ε Where:
Y = Tax Revenue
α = Constant
X1 = Domestic Taxes
X2 = Customs duty
X3 = Road Transport Taxes
X4 = Tax Evasion
b1… b4 = Regression Coefficients
ε = Error
This compares well with the approach used by Muriithi and Moyi (2003) in their
research, “Tax Reforms and Revenue Mobilization in Kenya”, which stated that before
subjecting their data to regression analysis, variables were described showing the trends
of various variables and also used the Ordinary Least Square method estimate the
parameters of the model. This study used ANOVA to test for significant differences
between means.
The use of both descriptive and regression statistics was appropriate as they assisted in
establishing patterns, trends and relationships and made it easier to understand and interpret
the implications of the research study. The study utilized regression test in testing the
significance of the variables in the study. Regression analysis is the statistical technique that
identifies the relationship between two or more quantitative variables: a dependent variable,
whose value is to be predicted, and an independent or explanatory variable (or variables),
about which knowledge is available. The technique was used to find the equation that
represented the relationship between the variables. Multiple regressions provide an equation

39
that predicts one variable from two or more independent variables. The study sought to test
the following null hypothesis: H0: There is no significant relationship between tax policy
reforms and tax revenue in Kenya.
40
CHAPTER FOUR:
DATA ANALYSIS, RESULTS AND DISCUSSION
4.1 Introduction
This chapter presents the data findings to evaluate the effect s of Tax Policy Reforms on Tax
Revenue in Kenya. These data were collected from the Kenya revenue Authority. Multiple
linear regressions were used to evaluate the effects of Tax Policy Reforms on Tax Revenue
in Kenya. The study covered a period of 10 years, 5 year pre and 5 year post reform starting
form year 2003/2004 to year 2012/2013.
4.2 Descriptive Statistics
Descriptive statistics is the term given to the analysis of data that helps describe, show or
summarize data in a meaningful way such that patterns might emerge from the data. The
researcher used descriptive statistics because if he simply presented the raw data it would be
hard to visualize what the data was showing. Descriptive statistics therefore enabled the
researcher to present the data in a more meaningful way, which allowed simpler
interpretation of the data.
Descriptive statistics were used in this study to describe the basic features of the data in a
study. They provided simple summaries about the sample and the measures. Secondary data
for 2003/2004 to 2012/2013 from KRA corporate plan was used in this study. The period
from 2003/2004 to 2007/2008 was treated as re-reforms while 2008/2009 to 2012/2013 as
post-reforms period. In section 4.2 the study present the research finding on the descriptive
statistics in the data collected. The table 4.1 below displays the descriptive statistics for each
of the variables used segregated by the two time periods i.e. the pre reform and the post
reform periods.

41
Table 4. 1: Descriptive Statistics for Pre-reforms (values in millions Kenya shillings)
N Minimum Maximum Mean Std. Deviation
Total Revenue 5 201763 433915 3.13E5 88359.595
Domestic Tax 5 97948 274263 1.89E5 64199.647
Customs 5 90630 157304 1.19E5 30062.070
Road Transport 5 1685.00 3620.00 2.9110E3 742.97880
Tax Evasion 5 1402 2930 2289.00 581.212
Valid N (list wise) 5
The study found that in the pre-reforms period, actual total revenue had a minimum of Kshs.
201,763 million, a maximum of Kshs. 433,915 million and an average of Kshs. 313,000
million with a standard deviation of Kshs. 88,359.595 millions. This mean was then
compared to the post reform period so as to see the effect of the reforms on the tax revenue.
Table 4.2 below illustrates the descriptive statistics for the post reform period which was
compared to the descriptive statistics of the pre reform period.
Table 4. 2: Descriptive Statistics for Post-reforms (values in millions Kenya shillings)
N Minimum Maximum Mean Std. Deviation
Total Revenue 5 480569 870100 6.31E5 149305.929
Domestic Tax 5 298799 543450 4.00E5 93281.467
Customs 5 179361 328800 2.30E5 58553.650
Road Transport 5 3941.00 5123.00 4.4606E3 509.32387
Tax Evasion 5 2409 2950 2605.40 210.702
Valid N (list wise) 5
The study found out that, in the post-reform period, actual total revenue had a minimum of
Kshs. 480569 million and a maximum of Kshs. 870,100 million. The minimum of the post
reform period was much higher than the maximum at pre-reforms indicating that the reforms
had effect on tax revenue. The mean of the post reform period was Kshs. 631,000 million
with a standard deviation of Kshs. 149,305.929 millions for the total tax revenue. This was
42
also higher compared to the pre reform period also indicating the positive effect the reforms
had on total revenue. It can therefore be concluded that reforms had a direct influence on the
tax revenue.
4.3 Correlations Analysis
To quantify the strength of the relationship between the variables, the study used Karl
Pearson’s coefficient of correlation. The Pearson product-moment correlation coefficient (or
Pearson correlation coefficient) is a measure of the strength of a linear association between
two variables and is denoted by r. The Pearson correlation coefficient, r, can take a range of
values from +1 to -1. A value of 0 indicates that there is no association between the two
variables. A value greater than 0 indicates a positive association, that is, as the value of one
variable increases so does the value of the other variable. A value less than 0 indicates a
negative association, that is, as the value of one variable increases the value of the other
variable decreases. In this section, the study presents the research finding on the Pearson
product moment correlation. Pearson product moment correlation was conducted to
determine the strength of relationship between the study variables.
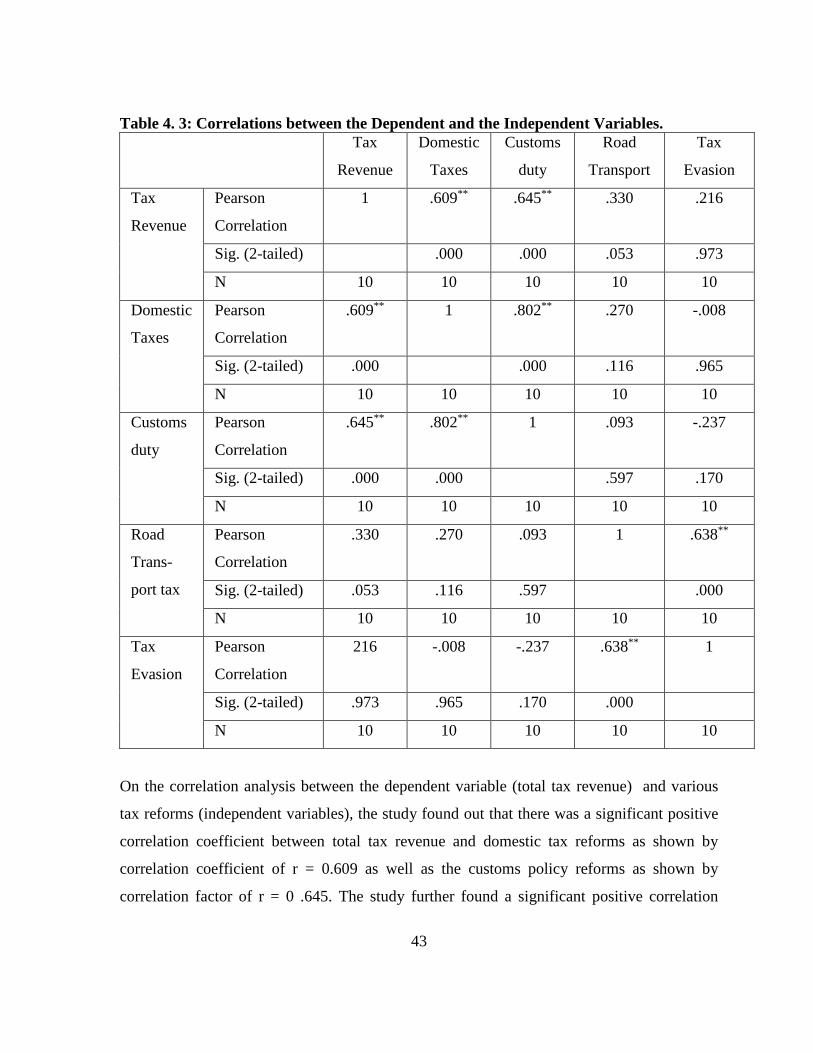
43
Table 4. 3: Correlations between the Dependent and the Independent Variables.
Tax
Revenue
Domestic
Taxes
Customs
duty
Road
Transport
Tax
Evasion
Tax
Revenue
Pearson
Correlation
1 .609** .645** .330 .216
Sig. (2-tailed) .000 .000 .053 .973
N 10 10 10 10 10
Domestic
Taxes
Pearson
Correlation
.609** 1 .802** .270 -.008
Sig. (2-tailed) .000 .000 .116 .965
N 10 10 10 10 10
Customs
duty
Pearson
Correlation
.645** .802** 1 .093 -.237
Sig. (2-tailed) .000 .000 .597 .170
N 10 10 10 10 10
Road
Trans-
port tax
Pearson
Correlation
.330 .270 .093 1 .638**
Sig. (2-tailed) .053 .116 .597 .000
N 10 10 10 10 10
Tax
Evasion
Pearson
Correlation
216 -.008 -.237 .638** 1
Sig. (2-tailed) .973 .965 .170 .000
N 10 10 10 10 10
On the correlation analysis between the dependent variable (total tax revenue) and various
tax reforms (independent variables), the study found out that there was a significant positive
correlation coefficient between total tax revenue and domestic tax reforms as shown by
correlation coefficient of r = 0.609 as well as the customs policy reforms as shown by
correlation factor of r = 0 .645. The study further found a significant positive correlation

44
between total tax revenue road transport tax reform as shown by correlation coefficient of r =
0.330. The study finally found a positive correlation between total tax revenue and tax
evasion reform as shown by correlation coefficient of 0.216. This compares well with Moyi
and Muriithi (2003) in their research tax reforms and revenue mobilization in Kenya.
4.4 Regression Analysis
Regression analysis is the statistical technique that identifies the relationship between two or
more quantitative variables: a dependent variable, whose value is to be predicted, and an
independent or explanatory variable (or variables), about which knowledge is available. The
technique is used to find the equation that represents the relationship between the variables.
Multiple regressions provide an equation that predicts one variable from two or more
independent variables. Regression analysis is used to understand the statistical dependence of
one variable on other variables. The technique can show what proportion of variance
between variables is due to the dependent variable, and what proportion is due to the
independent variables. The relation between the variables can be illustrated graphically, or
more usually using an equation.
In this study, both Univariate and multiple regression analysis were conducted to test the
influence among predictor variables. The depended variable was regressed against the
individual independent variables and thereafter the depended variable was regressed against
the combined (all) independent variables. The research used statistical package for social
sciences (SPSS V 21) to code, enter and compute the measurements of the multiple
regressions. The study adopted simple regression guided by the following model:
Y = α + b1X1 + b2X2 + b3X3 + b4X4 + ε Where:
Y = Tax Revenue
α = Constant
X1 = Domestic Taxes
X2 = Customs duty
X3 = Road Transport Taxes
X4 = Tax Evasion

45
b1… b4 = Regression Coefficients
ε = Error
4.4.1 Univariate Linear Regression
4.4.1.1 Univariate Linear Regression for Domestic Taxes
To detect the presence of autocorrelation (a relationship between values separated from each
other by a given time lag) in the residuals (prediction errors) from a regression analysis,
the Durbin–Watson statistic was used. Durbin Watson statistic is the number that tests for
autocorrelation in the residuals from a statistical regression analysis. A value of 2 means that
there is no autocorrelation in the sample. Values approaching 0 indicate positive
autocorrelation and values toward 4 indicate negative autocorrelation.
Table 4. 4: Regression Model Summary
Model R R Square
Adjusted R
Square
Std. Error of the
Estimate
Durbin-
Watson
1 .415a .172 .167 .38473 1.770
a. Predictors: (Constant), Domestic Taxes
b. Dependent Variable: Tax Revenue
In this case, the value of Durbin Watson was 1.770 indicating that there was no serious
problem of autocorrelation. In order to detect whether multicollinearity was a problem to the
model, condition index; the variance-inflation factor (VIF); and tolerance of each variable
were calculated. VIF values are considered a problem when they go beyond 10, and tolerance
values below 0.10 should be a cause for concern. An R2 value of 0.172 indicates that 17.2%
of the variation in Tax Revenue can be explained by the model. Hence Domestic Taxes can
explain 17.2% of the variation in Tax Revenue while other factors can explain 82.8%.

46
Table 4. 5: ANOVA
Model Sum of Squares df Mean Square F Sig.
1 Regression 1.832 1 1.832 12.378 .000a
Residual 1.332 9 .148
Total 3.164 10
a. Predictors: (Constant), Domestic Taxes
b. Dependent Variable: Tax Revenue
To determine how best the regression model fits our data, Analysis of Variance on the
coefficient of determination (R2) was calculated. The F value was 12.378 (P<.001). This
shows that the model was suitable at 95% confidence level (0.05% level of significance).
Table 4.6 displays the coefficient of the regression model of Tax Revenue on Domestic
Taxes.
Table 4. 6: Regression Model Coefficients
Model
Unstandardized
Coefficients
Standardized
Coefficients
t Sig.
Collinearity
Statistics
B Std. Error Beta Tolerance VIF
1 (Constant) 3.071 .187 16.425 .000
Domestic Taxes .268 .047 .415 5.714 .000 1.000 1.000
a. Dependent Variable: Tax Revenue
From the results of the regression model, the coefficient for Domestic Taxes was significant
at 5% level of significance. Therefore, Tax Revenue was predicted using Domestic Taxes in
the following equation: Y=3.071+.268X1 Where; Y was Tax Revenue and X1 was the
Domestic Taxes. This means that for every unit increase in domestic taxes there will be 0.268
increase in total taxes indicating that there is significant relationship between domestic taxes
policy reforms and tax revenue in Kenya.
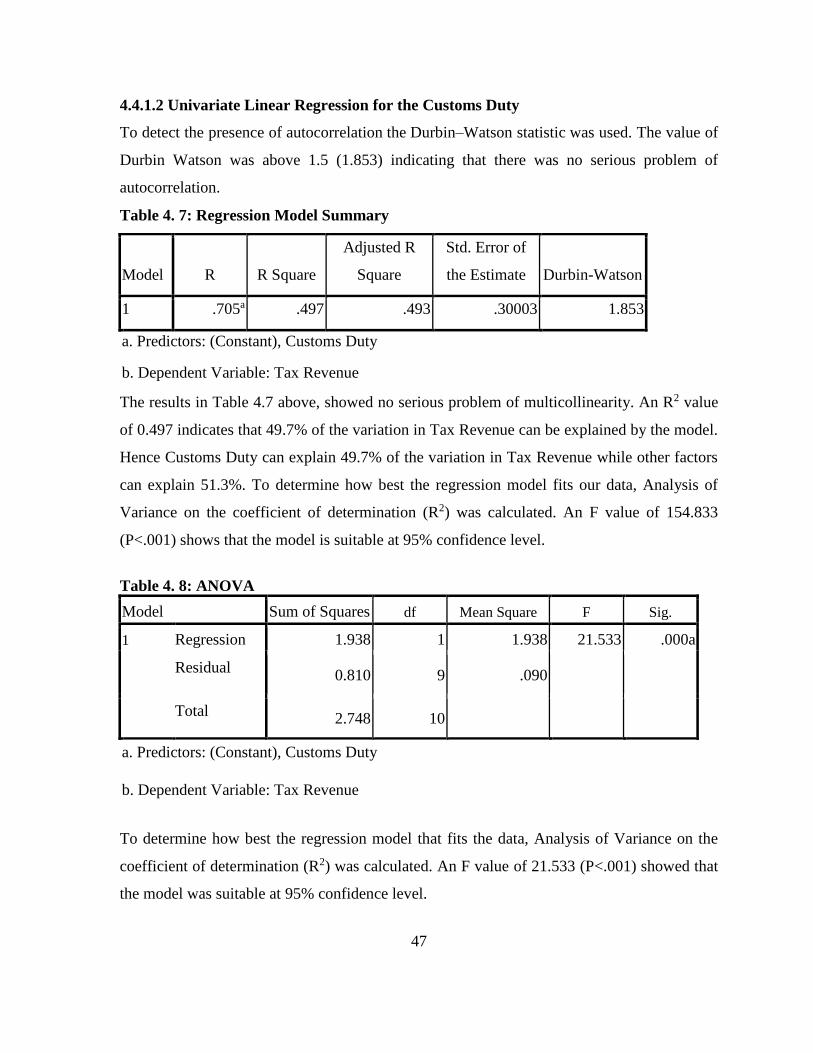
47
4.4.1.2 Univariate Linear Regression for the Customs Duty
To detect the presence of autocorrelation the Durbin–Watson statistic was used. The value of
Durbin Watson was above 1.5 (1.853) indicating that there was no serious problem of
autocorrelation.
Table 4. 7: Regression Model Summary
Model R R Square
Adjusted R
Square
Std. Error of
the Estimate Durbin-Watson
1 .705a .497 .493 .30003 1.853
a. Predictors: (Constant), Customs Duty
b. Dependent Variable: Tax Revenue
The results in Table 4.7 above, showed no serious problem of multicollinearity. An R2 value
of 0.497 indicates that 49.7% of the variation in Tax Revenue can be explained by the model.
Hence Customs Duty can explain 49.7% of the variation in Tax Revenue while other factors
can explain 51.3%. To determine how best the regression model fits our data, Analysis of
Variance on the coefficient of determination (R2) was calculated. An F value of 154.833
(P<.001) shows that the model is suitable at 95% confidence level.
Table 4. 8: ANOVA
Model Sum of Squares df Mean Square F Sig.
1 Regression 1.938 1 1.938 21.533 .000a
Residual 0.810 9 .090
Total 2.748 10
a. Predictors: (Constant), Customs Duty
b. Dependent Variable: Tax Revenue
To determine how best the regression model that fits the data, Analysis of Variance on the
coefficient of determination (R2) was calculated. An F value of 21.533 (P<.001) showed that
the model was suitable at 95% confidence level.

48
Table 4.9 displays the coefficient of the regression model of Tax Revenue on Customs Duty.
Table 4. 9: Regression Model Coefficients
Model
Unstandardized
Coefficients
Standardized
Coefficients
t Sig.
Collinearity
Statistics
B Std. Error Beta Tolerance VIF
1 (Constant) 1.667 .199 8.378 .000
Customs Duty
.595 .048 .705 12.443 .000 1.000 1.000
a. Dependent Variable: Tax Revenue
From the results of the regression model the coefficient for Customs Duty was significant at 5%
level of significance. Therefore, Tax Revenue can be predicted using Customs Duty in the
following equation: Y=1.667+.595X2 Where; Y is Tax Revenue and X2 is the Customs Duty.
This means that for every unit increase in Customs Duty, there will be 0. 595 increase in total
taxes indicating that indicating that there was significant relationship between Customs Duty
policy reforms and tax revenue in Kenya.
4.4.3 Univariate Linear Regression for the Road Transport Taxes
Table 4. 10: Regression Model Summary
Model R R Square
Adjusted R
Square
Std. Error of
the Estimate Durbin-Watson
1 .511a .261 .257 .36340 1.847
a. Predictors: (Constant), Road Transport Taxes
b. Dependent Variable: Tax Revenue

49
The value of Durbin Watson was 1.847 which was above 1.5 indicating that there was no
serious problem of autocorrelation. The results in Table 4.10 below, showed no serious
problem of multicollinearity. An R2 value of 0.261 indicates that 26.1% of the variation in
Tax Revenue can be explained by the model. Hence Road Transport Taxes can explain
26.1% of the variation in Tax Revenue while other factors can explain 73.9%.
Table 4. 11:ANOVA
Model Sum of Squares df Mean Square F Sig.
1 Regression 1.938 1 1.938 21.533 .000a
Residual 0.810 9 .090
Total 2.748 10
a. Predictors: (Constant), Customs Duty
b. Dependent Variable: Tax Revenue
To determine how best the regression model fits the data, Analysis of Variance on the
coefficient of determination (R2) was calculated. The findings show an F value of 21.533
(P<.001) which shows that the model was suitable at 95% confidence level.
Table 4. 12: Regression Model Coefficients
Model
Unstandardized
Coefficients
Standardized
Coefficients
t Sig.
Collinearity
Statistics
B Std. Error Beta Tolerance VIF
1 (Constant) 2.704 .193 14.024 .000
Road Transport
Taxes .388 .052 .511 7.454 .000 1.000 1.000
a. Dependent Variable: Tax Revenue

50
Table 4.12 displays the coefficient of the regression model of Tax Revenue on Road
Transport Taxes in the following equation: Y=2.704+.388X3 Where; Y was Tax Revenue
and X3 was the Road Transport Taxes. From the results of the regression model, the
coefficient for Road Transport Taxes was significant at 5% level of significance. Therefore,
Tax Revenue can be predicted using Road Transport Tax policy reforms. This means that for
every unit increase in Road Transport Taxes, there will be 0.388 increases in total taxes
indicating that indicating that there was significant relationship between Road Transport Tax
policy reforms and tax revenue in Kenya.
4.4.4 Univariate Linear Regression for the Tax Evasion
The value of Durbin Watson was above 1.589 indicating that there was no serious problem of
autocorrelation. The results in Table 4.13 below, showed no serious problem of
multicollinearity.
Table 4. 13: Regression Model Summary
Model R R Square
Adjusted R
Square
Std. Error of
the Estimate Durbin-Watson
1 .515a .265 .261 .36242 1.589
a. Predictors: (Constant), Tax Evasion
b. Dependent Variable: Tax Revenue
The results in Table 4.13 above, showed no serious problem of multicollinearity. An R2 value
of 0.265 indicates that 26.5% of the variation in Tax Revenue can be explained by the model.
Hence Tax Evasion can explain 26.5% of the variation in Tax Revenue while other factors
can explain 73.5%. To determine how best the regression model fits our data, Analysis of
Variance on the coefficient of determination (R2) was calculated.
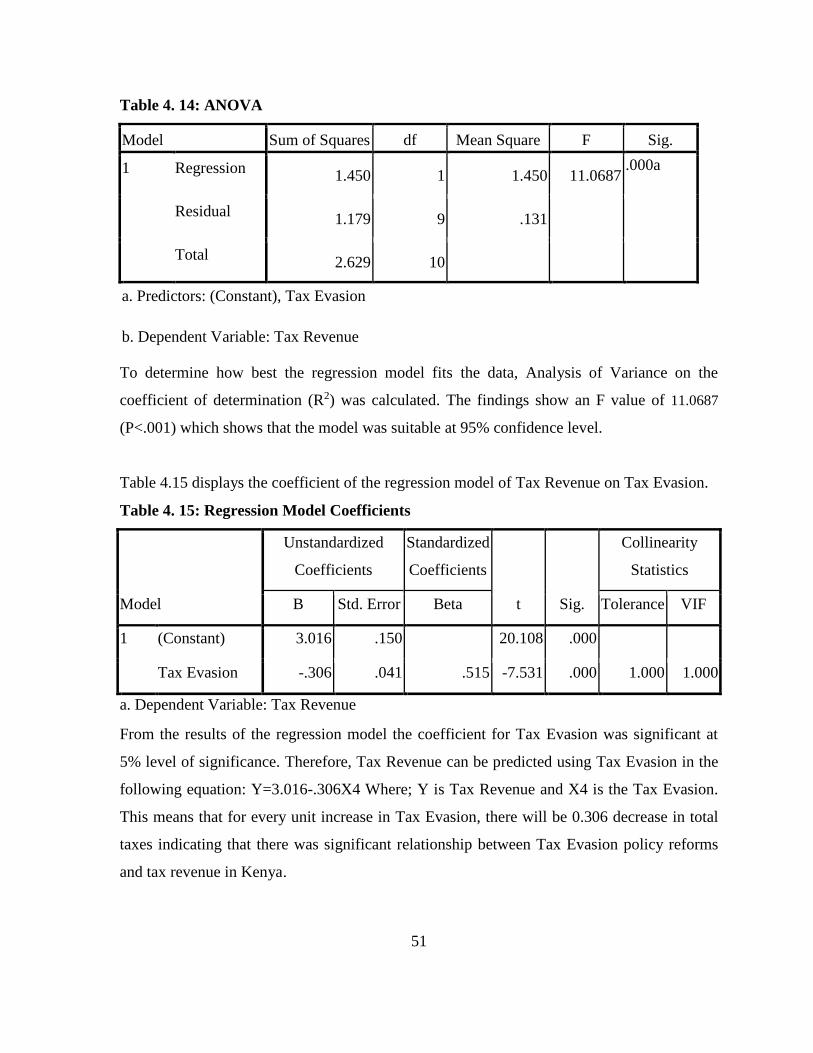
51
Table 4. 14: ANOVA
Model Sum of Squares df Mean Square F Sig.
1 Regression 1.450 1 1.450 11.0687
.000a
Residual 1.179 9 .131
Total 2.629 10
a. Predictors: (Constant), Tax Evasion
b. Dependent Variable: Tax Revenue
To determine how best the regression model fits the data, Analysis of Variance on the
coefficient of determination (R2) was calculated. The findings show an F value of 11.0687
(P<.001) which shows that the model was suitable at 95% confidence level.
Table 4.15 displays the coefficient of the regression model of Tax Revenue on Tax Evasion.
Table 4. 15: Regression Model Coefficients
Model
Unstandardized
Coefficients
Standardized
Coefficients
t Sig.
Collinearity
Statistics
B Std. Error Beta Tolerance VIF
1 (Constant) 3.016 .150 20.108 .000
Tax Evasion -.306 .041 .515 -7.531 .000 1.000 1.000
a. Dependent Variable: Tax Revenue
From the results of the regression model the coefficient for Tax Evasion was significant at
5% level of significance. Therefore, Tax Revenue can be predicted using Tax Evasion in the
following equation: Y=3.016-.306X4 Where; Y is Tax Revenue and X4 is the Tax Evasion.
This means that for every unit increase in Tax Evasion, there will be 0.306 decrease in total
taxes indicating that there was significant relationship between Tax Evasion policy reforms
and tax revenue in Kenya.

52
4.4.2 Multivariate Regression - Dependent Variable and Combined Independent
Variables
4.4.2.1 Regression Analysis before Tax Reforms
In this section the study presents the research findings on the relationship between various
aspect of tax reforms and total tax revenues, before adoption of tax reforms.
Table 4. 168: Regression Model Summary
Model R R
Square
Adjusted
R Square
Std. Error of
the Estimate
Change Statistics
R Square
Change
F
Change
Sig. F
Change
1 .851a .724 .711 2.01670 .711 2.619 .015b
Adjusted R squared is coefficient of determination which tells us the variation in the
dependent variable due to changes in the independent variable. From the findings in the
above table the value of adjusted R squared was 0.711 an indication that there was variation
of 71.1% on total tax revenue due to changes in domestic taxes policy reforms, customs
policy reforms, road transport policy reform and tax evasion policy reforms at 95%
confidence interval. This shows that 71.1% changes in total tax revenue could be accounted
for by changes in domestic taxes policy, customs policy reforms, road transport tax reform
and tax evasion reforms. Therefore, further research should be conducted to investigate the
other (28.9%) factors not studied in this research that affects total tax revenue. R was the
correlation coefficient which shows the relationship between the study variables. From the
findings shown in the table above there was a strong positive relationship between the study
variables as shown by the correlation coefficient of 0.851. This compares with Gachanja
2012, who’s regression revealed that the indepenedt variables accounted for 91.6% of the
variance in tax revenues. This compares well with Moyi nad Muriithi (2003), who found out
that there was a significant positive relationship between the study variables. They found out
that during the pre-reform period, the overall tax system yielded an elasticity of 0.276 against
a bouyancy index of 1.023 (a difference of 0.747)

53
Table 4. 179: Analysis of Variance
Model Sum of Squares df Mean Square F Sig.
1 Regression 1.872 4 0.468 1.619 .065b
Residual 0.121 1 0.121
Total 1.993 5
The ANOVA test is used to determine the impact the independent variables have on the
independent variable in the regression analysis. From the ANOVA statistics above, the study
established the regression model had a significance level of 6.5%, which was an indication
that the data was not ideal for making a conclusion on the population parameters as the value
of significance (p-value) was more than 5%. The calculated value was less than the critical
value (1.619<1.697) an indication that domestic taxes policy, customs policy reforms, road
transport tax reform and tax evasion reforms do not significantly influence the total tax
revenues. The significance value was greater than 0.05 indicating that the model was
significant.
Table 4. 18: Regression Model Coefficients
Model Unstandardized
Coefficients
Standardized
Coefficients
t Sig.
B Std. Error Beta
1 (Constant) .569 .388 4.479 .021
Domestic taxes policy .266 .020 .276 5.230 .024
Customs policy reforms .050 .929 .755 3.459 .041
Road transport tax reform .517 .105 1.044 4.173 .025
Tax evasion reforms .112 .087 .158 1.294 .019
The established regression equation was:
Y = 0.569 + 0.266 X1 + 0.050X2 +0.517 X3 + 0.112X4
The above regression equation revealed that holding domestic taxes policy, customs policy
reforms, road transport policy reforms and tax evasion reforms to a constant zero, total tax

54
revenues would stand at 0.569. A unit increase in domestic tax reforms would lead to
increase in tax reforms by a factor of 0.266. A unit increase in customs tax reforms led to
increase in tax revenues by a factor of 0.050, a unit increase in road transport tax reforms
would lead to increase in total tax revenues by a factor of 0.517 and a unit increase in tax
evasion reforms would lead to increase in total tax revenues by a factor of 0.112. This was
shown the research by Wawire et al (2014), which found out that the coefficient of this
variable was positive suggesting that if GDP increases by 1% total tax increases by 1.144%.
This means that the tax system yielded a 1.144% change in tax revenue as a result of changes
in discretionary policy measures for every change in GDP.
4.4.2.2 Regression Analysis after Tax Reforms
In this section the study presents the research findings on the relationship between various
aspect of tax reforms and total tax revenues, after adoption of tax reforms.
Table 4. 21: Regression Model Summary
Model R R
Square
Adjusted
R Square
Std. Error
of the
Estimate
Change Statistics
R Square
Change
F
Change
Sig. F
Change
1 .972a .945 .891 .88133 .891 2.671 .001b
Adjusted R squared was coefficient of determination which gives the variation in the
dependent variable due to changes in the independent variable. From the findings as shown
in the above table, the value of adjusted R squared was 0.891 an indication that there was
variation of 89.1% on total tax revenue due to changes in domestic taxes policy, customs
policy reforms, road transport tax reform and tax evasion reforms at 95% confidence interval.
This shows that 89.1% changes in total tax revenue could be accounted for by changes in
domestic taxes policy, customs policy reforms, road transport tax reform and tax evasion
reforms. R is the correlation coefficient which shows the relationship between the study
variables. This compares well with moyi and Muroothi (2003), who found out that there was
a significant positive relationship between tha study variables. They found out that during the

55
pre-reform period, the overall tax system yielded an elasticity of 0.276 against a bouyancy
index of 1.023 (a difference of 0.747). In comparison, the post reform period recorded a
bouyancy and elasticity of 1.661 and 1.495 respectively ( a diffrence of 0.166). It is apparent
that the bouyancy index increased by almost 62% between the two periods, while the
elasticity inreased by over 400%.
Table 4. 22: Analysis of Variance
Model Sum of Squares df Mean Square F Sig.
1 Regression 2.61 4 0.435 2.671 .001b
Residual 15.974 1 0.163
Total 18.584 5
From the ANOVA statistics above, the study established the regression model had a
significance level of 0.1% which is an indication that the data was ideal for making a
conclusion on the population parameters as the value of significance (p-value) was less than
5%. The calculated value was greater than the critical value (2.671>1.697) an indication that
domestic taxes policy, customs policy reforms, road transport tax reform and tax evasion
reforms significantly influence total tax revenues. The significance value was less than 0.05
indicating that the model was significant.
Table 4. 19: Regression Model Coefficients
Model Unstandardized
Coefficients
Standardized
Coefficients
t Sig.
B Std. Error Beta
1 (Constant) .639 .396 3.133 .052
Domestic taxes policy .400 .884 .823 4.792 .017
Customs policy reforms .138 .193 1.00 6.448 .008
Road transport tax
reform
.173 .085 -.545 -2.984 .018
Tax evasion reforms .614 .394 .671 4.098 .000

56
The established regression equation was:
Y = 0.639 + 0.400 X1 + 0.138X2 + 0.173 X3 + 0.614 X4
From the above regression equation, it was revealed that holding domestic taxes policy,
customs policy reforms, road transport tax reform and tax evasion reforms to a constant zero,
total tax revenues at would stand at 0.639, a unit increase in domestic tax reforms would lead
to increase in tax reforms by a factors of 0.400, a unit increase in customs tax reforms
would lead to increase in tax revenues by factors of 0.138, a unit increase in road transport
tax reforms would lead to increase in total tax revenues by a factor of 0.173 and a unit
increase in tax evasion reforms would lead to increase in total tax revenues by a factors of
0.614. This also compares well with moyi and Muroothi (2003), who found out that there
was a significant positive relationship between tha study variables. They found out that
during the pre-reform period, a bouyancy and elasticity of 1.661 and 1.495 respectively ( a
diffrence of 0.166).
4.5 Testing the Hypothesis
4.5.1 Paired Samples Statistics
Testing the significance was done by the use of the Paired T-test. A Paired T-test is
a statistical hypothesis test in which the test statistic follows a Student's t distribution if
the null hypothesis is supported.
Paired T-test was carried out to determine the differences between the mean revenue
collected in the two period pre and post reforms. Paired Sample Correlations were calculated
to establish the significance of the correlation between each pair of the variables. This is
shown in the table below:

57
Table 4. 16: Paired Samples Correlations
N Correlation Sig.
Pair 1 Actual Total Revenue-Pre &
Actual Total Revenue-Post 5 .945 .015
Pair 2 Actual Domestic Tax-Pre &
Actual Domestic Tax-Post 5 .939 .018
Pair 3 Actual Customs-Pre & Actual
Customs-Post 5 .869 .036
Pair 4 Actual Road Transport-Pre &
Actual Road Transport-Post 5 .839 .045
Pair 5 Actual Tax Evasion-Pre & Actual
Tax Evasion-Post 5 .405 .099
In testing for the significance of the differences in mean revenue collected between the two
periods, post and pre reforms, the following hypothesis was used; H0: There are no
differences in mean revenue collected between pre and post reforms period. All the pairs
were significantly correlated at 5% level of significance apart from Tax evasion that was
significant at 10%. The results obtained indicate that there are significant differences
between pre and post reforms period (p<.05) for Total Revenue, Domestic Tax, Customs and
Road Transport tax. However, there was no significant difference in mean Tax Evasion
between the two periods.

58
Table 4.17: Paired Samples Test
Paired Differences
t df
Sig. (2-
tailed)
Mean
Std.
Deviation
Std. Error
Mean
95% Confidence Interval
of the Difference
Lower Upper
Pair
1
ATR-Pre -
ATR-Post -3.18E5 71801.69 32110.69 -4.074E5 -2.291E5 -9.91 4 .001
Pair
2
ADT-Pre
- ADT-
Post
-2.10E5 39699.46 17754.14 -2.596E5 -1.610E5 -
11.84 4 .001
Pair
3
ACD-Pre
- ACD-
Post
-1.11E5 35684.34 15958.52 -1.555E5 -66941.23 -6.97 4 .002
Pair
4
ART-Pre -
ART-Post -1.54E3 419.63 187.66 -2070.64 -1028.55 -8.25 4 .001
Pair
5
ATE-Pre -
ATE-Post
-
3.164E2 532.00 237.92 -976.97 344.17 -1.33 4 .004
Ho 1: There is no significant relationship between domestic taxes policy reforms and
tax revenue in Kenya.
Testing of the null hypotheses was based on the fact that, if the p value calculated is p > 0.05,
then the null hypothesis is accepted otherwise it is rejected. The first specific objective of the
study was to establish the relationship between domestic taxes policy reforms and tax
revenue in Kenya. The associated P- value was 0.002. This value was less than 0.05
indicating that there was evidence against the null hypotheses and therefore the null
hypothesis that there is no significant relationship between domestic taxes policy reforms and
tax revenue in Kenya was rejected. A conclusion was therefore drawn that there was
significant relationship between domestic taxes policy reforms and tax revenue in Kenya.
This is in line with Saahdong (2008), who found out that though there was a stable revenue
mobilization after the tax reform, but in general, there was an overall increase in the country's
revenue especially after the tax reforms.
59
Ho 2: There is no significant relationship between customs policy reforms on tax
revenue in Kenya.
The second specific objective of the study was to establish the relationship between customs
policy reforms and tax revenue in Kenya. The associated P- value was 0.001. This value was
less than 0.05 indicating that there was evidence against the null hypotheses and therefore the
null hypothesis that there is no significant relationship between customs policy reforms and
tax revenue in Kenya was rejected. A conclusion was therefore drawn that there was
significant relationship between customs policy reforms and tax revenue in Kenya. This
compares well with Moyi nad Muriithi (2003), who found out that there was a significant
positive relationship between the independent and the dependent variable.
Ho 3: There is no significant relationship between road transport policy reforms and
tax revenue in Kenya.
The third specific objective of the study was to establish the relationship between road
transport policy reforms and tax revenue in Kenya. The associated P- value was 0.001. This
value was less than 0.05 indicating that there was evidence against the null hypotheses and
therefore the null hypothesis that there is no significant relationship between road transport
policy reforms and tax revenue in Kenya was rejected. A conclusion was therefore drawn
that there was significant relationship between road transport policy reforms and tax revenue
in Kenya. This also compares well with Moyi nad Muriithi (2003), who found out that there
was a significant positive relationship between the independent and the dependent variable.
Ho 4: There is no significant relationship between tax evasion policy reforms and tax
revenue in Kenya.
The fourth specific objective of the study was to establish the relationship between tax
evasion policy reforms and tax revenue in Kenya. The associated P- value was 0.004. This
value was less than 0.05 indicating that there was evidence against the null hypotheses and
therefore the null hypothesis that there is no significant relationship between tax evasion
policy reforms and tax revenue in Kenya was rejected.

60
CHAPTER FIVE:
SUMMARY OF FINDINGS, CONCLUSIONS AND RECOMMENDATIONS
5.1 Introduction
The purpose of this chapter was to summarize the findings, discuss and draw conclusions and
recommendations on the findings of the main objective of the study, which were the effects
of tax policy reforms on tax revenue in Kenya. It was based on the specific objectives of the
study which included: to establish the relationship between domestic taxes policy reforms
and tax revenue in Kenya, to determine the effect of customs policy reforms on tax revenue
in Kenya, to evaluate the relationship between road transport policy reforms and tax revenue
in Kenya and to assess the impact of tax evasion on tax revenue in Kenya.
5.2 Summary of Findings
From the finding on the correlation analysis, the study found that there was positive
correlation between tax revenues and custom reforms. The study also found a positive
correlation between total tax revenue and domestic tax reforms. It also revealed that there
was positive relationship between total tax revenue and road transport tax reform. The study
further revealed that there was a positive correlation between total tax revenue and tax
evasion reform. From the finding on the regression analysis the study found that was a
greater variation on total tax revenue due to changes in domestic taxes policy, customs policy
reforms, road transport tax reform and tax evasion reforms. The study also found that there
was significant positive relationship between domestic taxes policy, customs policy reforms,
road transport tax reform , tax evasion reforms and total tax revenue. In the post tax reform
the study established that domestic taxes policy, customs policy reforms, road transport tax
reform and tax evasion reforms significantly influence total tax revenues.
The study established that in the pre reform period the domestic taxes policy, customs policy
reforms, road transport tax reform and tax evasion reforms do not significantly influence the
total tax revenues in Kenya. The study revealed that a unit increase in domestic tax reforms,
customs tax reforms, road transport tax reforms and tax evasion reforms would lead to
increase in total tax revenues. From the finding on the hypothesis testing the study revealed

61
that there was significant positive relationship between domestic taxes policy reforms and tax
revenue in Kenya, between customs policy reforms on tax revenue in Kenya, between road
transport policy reforms and tax revenue in Kenya and between tax evasion and tax revenue
in Kenya.
In summary, it was noted that tax reforms sources for economic development are very
important if Kenya must rank among equals in the improvement of the lives of her citizens.
Results of this study have revealed evidence in significant increase in total tax revenue
attributed to tax reforms in Kenya. Therefore, to build and maintain the culture of sustainable
development, there is urgent need for a review and restructure of the nation's tax policy and
administrative system. While the government takes step to address the perennial annual
budget deficits and tax gap, the citizens should wake up to their civic responsibilities in terms
of tax compliance. This is in line with Saahdong (2008), who found out that though there was
a stable revenue mobilization after the tax reform, but in general, there was an overall
increase in the country's revenue especially after the tax reforms but the system is still
characterized with lot of revenue leakages which need to be checked and controlled.
5.3 Discussion of the Findings
5.3.1 Pre Reform Period
From the above regression models, the study found out that before tax policy reforms,
holding domestic taxes policy, customs policy reforms, road transport tax reform and tax
evasion reforms to a constant zero, total tax revenues would stand at 0.569. A unit increase in
domestic tax reforms would lead to increase in tax reforms by a factor of 0.266 while a unit
increase in customs tax reforms would lead to increase in tax revenues by a factor of 0.050.
A unit increase in road transport tax reforms would lead to increase in total tax revenues by a
factor of 0.517 and a unit increase in tax evasion reforms would lead to increase in total tax
revenues by a factor of 0.112. This was in line with Kieleko (2006) who evaluated tax
revenue productivity in Kenya for the period 1973-2003. The results showed that there had
been a considerable improvement of the tax revenue productivity and that the reforms made
in this period had significant effect on the responsiveness of the tax system.

62
5.3.2 Post Reform Period
The study found the model after adoption of tax reforms, while holding domestic taxes policy
reforms, customs policy reforms, road transport tax reforms and tax evasion reforms to a
constant zero, total tax revenues at would stand at 0.639. A unit increase in domestic tax
reforms would lead to increase in tax reforms by a factors of 0.400 whereas a unit increase in
customs tax reforms would lead to increase in tax revenues by factors of 0.138. A unit
increase in road transport reforms would lead to increase in total tax revenues by a factor of
0.173 and a unit increase in tax evasion reforms would lead to increase in total tax revenues
by a factor of 0.614. This was in line with Kieleko (2006) who evaluated tax revenue
productivity in Kenya for the period 1973-2003. The results showed that there had been a
considerable improvement of the tax revenue productivity and that the reforms made in this
period had significant effect on the responsiveness of the tax system.
5.3.3 Domestic Tax Policy Reforms
The first objective of this study sought to establish the relationship between domestic taxes
policy reforms and tax revenue in Kenya and the first hypothesis for the stud}" was; He 1:
There is no significant relationship between domestic taxes policy reforms and tax revenue in
Kenya. The study established that after adoption of tax reforms the coefficient for domestic
tax reforms was 0.400 compared to 0.266 in the pre reforms period, showing an difference of
+0.134. This was in line with Kieleko (2006) who evaluated tax revenue productivity in
Kenya for the period 1973-2003. The productivity was measured through buoyancy and
elasticity. The coefficients were measured through log regression of the taxes to the Gross
Domestic Product. The analysis of this study was carried out using the Proportional
Adjustment Method (PAM) in capturing the effects of tax reforms on discretionary tax
measures and tax productivity. The results showed that there had been a considerable
improvement of the tax revenue productivity and that the reforms made in this period had
significant effect on the responsiveness of the tax system.

63
5.3.4 Customs Policy Reforms
The second objective of this study was to determine the effect of customs policy reforms on
tax revenue in Kenya and the hypothesis was; Ho 2: There is no significant relationship
between customs policy reforms on tax revenue in Kenya. The study also deduced that
custom tax reforms had a positive and significant influence on the total tax revenues as it had
a coefficient of 0.138. Compared to the pre reform period of 0.050, there was a difference of
+0.088. This was in line with Muriithi and Moyi (2003) who analyzed the productivity of
Kenya's tax structure in the context of the tax reforms focusing on pre and post reform
period. In the study, they assessed the buoyancy and elasticity of individual taxes and the
overall tax system. Their findings suggested that tax reforms had a positive impact on the
overall tax structure and on the individual tax handles, even though the impact of the reforms
was not always uniform. The reforms had a bigger impact on direct taxes than on indirect
taxes, suggesting that revenue leakage is still a major problem for indirect taxes.
5.3.5 Road Transport Policy Reforms
The third objective was to determine the effect of customs policy reforms on tax revenue in
Kenya and the hypothesis, Ho 3: There is no significant relationship between road transport
policy reforms and tax revenue in Kenya. The study further deduced that road transport tax
reforms positively and significant influenced the total tax revenues as it had a positive
coefficient 0.173. Compared to the pre reform period of 0.517, there was a difference of -
0.334. This correlates with Karingi and Wanjala (2005) who evaluated the effect of tax
reforms on tax revenue and its composition in the pre and post adjustment period, as
measured by the tax/GDP ratios and the share of specific taxes in total tax revenue. In their
study, they observed that tax yield rose successfully even before the major tax reform
programme to peak on average at 19.7 per cent of GDP. However, this level of tax yield
compared to the expenditure-to-GDP ratio was nonetheless insufficient. Consequently, they
argued that since one of the main objectives of the TMP was to raise tax yield on a zero
deficit strategy to match expenditures, which were on average 28 per cent of GDP.

64
5.3.6 Tax Evasion Policy Reforms
The third objective was to assess the impact of tax evasion on tax revenue in Kenya and the
hypothesis, Ho 4: There is no significant relationship between tax evasion and tax revenue in
Kenya. It was further found out that tax evasion reforms positively and significantly
influenced the total tax revenues as it had a positive coefficient 0.614. Compared to the pre
reform period of 0.112, there was a difference of +0.502. This concurs with Wawire (2011)
who studied the determinants of value added tax revenue in Kenya for the period 1963/64 to
2008/2009.
5.4 Conclusions
From the findings on the relationship between domestic taxes policy reforms and tax revenue
in Kenya, the study established that there was a significant relationship between taxes policy
reforms and tax revenue. The study established that domestic taxes policy reforms positively
influence the tax revenue in Kenya. It also found that there was significant relationship
between custom policy reforms and tax revenues, and thus the study concludes that domestic
taxes policy reforms and customs policy reforms positively influence the tax revenue in
Kenya. The study also found that there was positive significant relationship between road
transport policy reforms and tax revenue in Kenya, and therefore concludes that that there
was positive significant relationship between road transport policy reforms and tax revenue
in Kenya. From then finding on the tax evasion policy reform positively impacted on tax
revenue in Kenya, the study also found that there is significant relationship between tax
evasion and tax revenue in Kenya, thus the study concludes that there is significant
relationship between tax evasion and tax revenue in Kenya.
It was also concluded that, unless the citizens work in hand with the government, every effort
of the later to better their lives might prove abortive. Inequitable tax, which is one of the
major problems in taxation, was promoted by the actions of those in the informal sector.
However, government should note that it is not possible to tax a nation into prosperity. High
tax rates will not only increase evasion but will equally discourage investment. This is the
case of fiscal neutrality. Economic decisions may be influenced due to high tax rates and that

65
may influence negatively on the nation's economy. (Bowles 1999) cited in Richardson 2006,
posit that the higher the marginal tax rate, the higher the likelihood of evasion. In this era of
globalization, unfriendly tax policies may create room for capital flight from Kenya to other
countries with more relaxed tax policies. The move towards borderless world has opened up
new opportunities for taxpayers to minimize their tax liabilities (Owens 2006). This also
compares well with Musgrave (1987) who found that a strong tax system is fundamental to
the development of nation's economy. Tax reforms, such as the reduction in personal income
tax rates, and the determination of a minimum exemption limit (tax threshold), are generally
applicable to both developed and developing economies.
5.5 Recommendations
From the findings, the study recommends that in order to encourage voluntary compliance,
tax policy formulation should be after due consultation with all the stakeholders. This will
enhance the positive impact of tax reform on total tax revenues. There is need for Kenya
Revenue Authority to increase customer satisfaction as satisfactory services to the taxpayers
could encourage voluntary compliance. There is the need for management and organizational
approach that emphasizes services, support and information for the honest taxpayers.
Tax reforms sources for economic development is very important if Kenya must rank among
equals in the improvement of the lives of her citizens. Results of this study have revealed
evidence in significant increase in total tax revenue attributed to tax reforms in Kenya.
Therefore, to build and maintain the culture of sustainable development, there is urgent need
for a review and restructure of the nation's tax policy and administrative system. Why
government takes step to address the perennial annual budget deficits and tax gap, the
citizens should wake up to their civic responsibilities in terms of tax compliance.
The gap between the citizens and the government is so wide that policies are made and
forced down on the people without due consultation. For there to be a good tax
administration, all the citizens must welcome tax policies. Besides, the involvement of all
stakeholders may further foster the sincerity of the government thereby reducing the problem
66
of trust, which had bedeviled tax administration. This calls for public private partnership in
decision-making process for good governance.
Increase tax revenue is a function of effective enforcement strategy, which is the pure
responsibility of tax administrators. Kenya lacks the enforcement machineries, which include
among other things, adequate manpower, technology and effective communication system.
This among other issues call for the autonomy of tax administration, which the system had
long been yearning for. Tax administration requires highly trained personnel to match up
with the sophistication of tax evasion with the use of modern technology. The autonomy if
granted will enable tax administration to hire the appropriate qualified personnel, fire the
redundant ones, reduce internal layers of management with its attendant bureaucracy and
official red tape, buy the appropriate equipment required for the job, reduce political
interference which had encouraged frequent changes in policy and many more.
Evidently, budgetary constraint has hindered the employment of highly paid personnel by
Kenya revenue authority. Literature shows that most of the tax laws are obsolete and need
review. The requirements of such laws no doubt cannot match up with the current trend of
economic changes. This calls for a review of such laws to meet the prevailing situation on a
regular basis. Taxation as a means of revenue generation is like a double edge sword. A
carefully planned tax policy that is consciously and faithfully implemented can help to
generate revenue that can greatly transform a nation. Okech and Mburu 2011 also
recommended that there was need re-evaluate the tax policy measures that had been
implemented over the years to make tax responsive to national income while enhancing tax
collection measures.
5.6 Suggestions for Future Research
The study sought to evaluate to evaluate the effect s of Tax Policy Reforms on Tax Revenue
in Kenya. Composite datasets that include all taxable services often make unbiased results.
Thus, while the results show a high degree of confidence in the relationship between tax
reforms and revenue, it does so relative to the four categories of revenue put together, not one

67
individual taxable service. The study did not look at all the tax policy reforms in Kenya but
concentrated on four key reforms namely domestic taxes policy reforms, custom duty policy
reforms, road transport policy reforms and tax evasion policy reforms. However, it is
worthwhile to note that there are other tax reforms in Kenya that have effect on tax revenue.
Clearly, tax revenue in Kenya is subject to all tax policy reforms. However this was not done
in this study although an in depth analysis of the effects was done thus ensuring that
generalization of the study findings was possible. However, it is important to undertake
further comprehensive study on the effects of tax policy reforms on tax revenue in Kenya. A
better and thorough understanding of specific effects would require studying those taxable
services individually.

68
REFERENCES
Baghebo, M. (2012). Natural Resource Economics. Bayelsa: Kadmon Printing Press and
Publishing House.
Barnet K. and G. Caren. (2004). “Gender impact of government revenue collection: The case
of taxation.” Commonwealth Economic Paper Series Economic. Affairs of the
Commonwealth Secretariat, London, United Kingdom.
Cheeseman N. and R. Griffiths. (2005). “Increasing Tax Revenue in Sub-Saharan Africa: The
Case of Kenya”,Oxford Council on Good Governance, Economy Analysis No 6,
Oxford, United Kingdom.
Chelliah R.J, (1996). “Towards Sustainable Growth: Essays in fiscal sector reforms in India,
Oxford University Press, Delhi, India.
Faseun, L.A., (2001). Tax planning, Lagos tax the newsletter of CITN-Lagos District
Society, 1: 6 -9.
Gachanja, D., (2012). ‘The effect of tax reforms and economic factors on tax revenues in
Kenya’ University of Nairobi, Kenya.
Glenday. G. (2002). “Does Trade Liberalization lead to lower Custom Revenues? The Case
of Kenya”, Duke Center for International Development, Duke University, USA.
Karingi, S. N., & Wanjala, B. (2005). Tax reforms experience of Kenya. Research Paper No.
2005/67. Worldwide Institute of Development Economics Research. United
Nations University.
Karingi, S.N., B. Wanjala, E. Pamba, and E. Nyakang’o. (2005). “Tax Reform Experience in
Kenya”, Working Paper 13, KIPPRA, Nairobi, Kenya.
Kieleko, P. M. (2006). The effects of tax reforms on tax productivity in Kenya. Unpublished
M. A Project. University of Nairobi.
KIPPRA. (2004a). “Tax Compliance Study”, Tax Policy Unit, Macroeconomics Division,
Kenya Institute of Public Policy Research and Analysis, Nairobi, Kenya.
KIPPRA. (2004b). “Tax Reform Experience and the Reform Agenda for Kenya”, Policy
Brief No 3, Kenya Institute of Public Policy Research and Analysis, Nairobi,
Kenya.

69
KIPPRA. (2005). “Assessment of the Potential Impact of Economic Partnership Agreements
(EPAs) on the Kenyan Economy”, A study by the Kenya Institute for Public Policy
Research and Analysis (KIPPRA) on behalf of the Ministry of Trade and Industry,
Nairobi, Kenya.
Kiringai, J., Ndung’u, N., and Karingi, S. (2002). “Tobacco Excise Tax in Kenya: An
Appraisal.” KIPPRA Discussion Paper DP/21/2002. Nairobi, Kenya: KIPPRA.
Kombo D.K and Tromp L.A (2006): Proposal and Thesis writing. An introduction, Nairobi
Pauline’s publication Africa.
KRA. (2004). Staff Quarterly Newsletter, Kenya Revenue Authority, Edition No 22,
December 2004.
KRA. (2006). Third Corporate Plan, 2006/07 – 2008/09: Volume 1, Kenya Revenue
Authority.
KRA. (2012). Fourth Corporate Plan, 2009/10 - 2011/12: Volume 1, Kenya Revenue
Authority.
Mahon, J.E. (1997). “Tax Reform and its Determinants in Latin America, 1997-94:
Implications for Theories of State Development”, Paper prepared for the meeting
of the Latin American Studies Association, Continatal Plaza Hotel, Guadalajara,
Mexico.
Martinez-Vazquez, J. (2001). 'Mexico: An Evaluation of the Main Features of the Tax
System', Working Paper No. 01–12, International Studies Program,
Andrew Young School of Policy Studies, Georgia State University, November.
McDaniel (1985). “Tax Expenditures”, Cambridge: Harvard University Press.
Moyi, E. and Ronge E. (2006).“Taxation and Tax Modernization in Kenya: A Diagnosis of
Performance and Options for Further Reform.” Institute of Economic Affairs.
Nairobi, Kenya.
Moyi, E. D., & Muriithi M.K. (2003). “Tax Reforms and Revenue Mobilization in Kenya”,
Research Paper No 131, African Economic Research Consortium (AERC),
Nairobi, Kenya.
Mugenda, O.M. & mugenda A.G. (1999). “Research Methods: Quantitative and Qualitative
Approaches.” African Centre for Technology Studies.

70
Muriithi, M. K., & Moyi, E. D. (2003). Tax reforms and revenue mobilization in Kenya.
AERC Research Paper 131, Nairobi: AERC.
Musgrave, R. (1987). “Tax Reforms in Developing Countries” in The Theory of Taxation for
Developing Countries edited by David Newberry and Nicholas Stern, Oxford
University Press, pp 242-263.
Mutua, J. M. (2012). A Citizen’s Handbook on Taxation in Kenya: Institute of Economic
Affairs, Nairobi, Kenya.
Nyamunga, J. (2004a). “Fiscal Architecture and Revenue Capacity in Kenya.” KIPPRA
Discussion Paper DP/45/2004. Nairobi, Kenya.
Nyamunga, J.B. (2001). “Assessing taxation in Kenya: The case of VAT”. Paper presented at
a workshop on “Taxation in Kenya” organized by the Kenya Institute for Public
Policy Research and Analysis (KIPPRA) in collaboration with International
Tax and Investment Centre (UK). Nairobi, Kenya.
Nzioki, B.K. & Kibua, T.N. (2004). “Are Export Processing Zones Relevant in a Liberalized
Environment? The Kenyan Case”, IPAR Discussion Paper No 45, Nairobi, Kenya.
Okech, T. C. & Mburu P. G. (2011). ‘Analysis of responsiveness of tax revenue to changes in
national income in Kenya between 1986 - 2009’International Journal of Business
and Social Science Vol. 2 No. 21
Omondi O. V. et al (2014). “Effects of Tax Reforms on Buoyancy and Elasticity of the
Tax System in Kenya: 1963–2010”.International Journal of Economics and
Finance Vol. 6
Peacock, A.T. & Wiseman J. assisted by Veverka J. (1961). “The Growth of Public
Expenditure in the United Kingdom.” Princeton University Press, Princeton. U.K.
Saahdong C (2008). Indirect tax reforms and revenue mobilization in Cameroon. University
of Oslo
Taliercio, R. (2004). “Designing Performance: The Semi-Autonomous Revenue Authority
Model in Africa and Latin America”, World Bank Policy Research Working Paper
3423, Washington.
Tanzi,V. (1988). “The impact of macroeconomic policies on the level of taxation in
developing countries”, IMF Working Papers, WP/88/95,Washington, D.C.

71
Wawire, N. H. W. (1991). An empirical assessment of tax performance in Kenya: 1958–
1989. M. A. Research Paper, Kenyatta University.
.

72
APPENDICES
Appendix I: Data Collection Sheet
SECTION A: DOMESTIC TAXES DATA COLLECTION SHEET
Period
Year
Actual
Revenue
Target
Revenue
Deviation
Pre – reform
Period
2003/2004
2004/2005
2005/2006
2006/2007
2007/2008
Post – reform
Period
2008/2009
2009/2010
2010/2011
2011/2012
2012/1013

73
SECTION B: CUSTOMS DUTY DATA COLLECTION SHEET
Period
Year
Actual
Revenue
Target
Revenue
Deviation
Pre – reform
Period
2003/2004
2004/2005
2005/2006
2006/2007
2007/2008
Post – reform
Period
2008/2009
2009/2010
2010/2011
2011/2012
2012/1013

74
SECTION C: ROAD TRANSPORT TAX DATA COLLECTION SHEET
Period
Year
Actual
Revenue
Target
Revenue
Deviation
Pre – reform
Period
2003/2004
2004/2005
2005/2006
2006/2007
2007/2008
Post – reform
Period
2008/2009
2009/2010
2010/2011
2011/2012
2012/1013

75
SECTION D: TAX EVASION DATA COLLECTION SHEET
Period
Year
Actual
Revenue
saved
Target
Revenue
Saved
Deviation
Pre – reform
Period
2003/2004
2004/2005
2005/2006
2006/2007
2007/2008
Post – reform
Period
2008/2009
2009/2010
2010/2011
2011/2012
2012/1013

76
Appendix II: Summary of the actual and expected tax revenue
Year ATR ETR ADT EDT ACD ECD ART ERT ATE ETE
2003/2004 201763 208083 97948 98848 90630 99424 1685 1700 1402 1802
2004/2005 270,875 280456 175244 182110 91946 989932 2880 2997 2640 2890
2005/2006 297699 301069 183614 184970 111155 112536 3025 3125 2930 3563
2006/2007 360191 356086 215617 213540 142449 140353 3345 3462 2125 2193
2007/2008 433915 424671 274263 263169 157304 158564 3620 3789 2348 2938
2008/2009 480569 493035 298799 309846 179361 179886 3941 4124 2409 3303
2009/2010 534403 545228 338152 339669 193752 201352 4123 4259 2499 4207
2010/2011 634903 641212 408787 412925 223551 225551 4245 4321 2648 2736
2011/2012 635971 658640 409183 424278 224266 231602 4871 4889 2521 2759
2012/2013 870100 956300 543450 5450020 328800 3278820 5123 5134 2950 3021
Source: KRA (2014) WHERE:
ATR Actual Total Revenue
ETR Expected Total Revenue
ADT Actual Domestic Taxes
EDT Expected Domestic Taxes
ACD Actual Custom Duty
ECD Expected Custom Duty
ART Actual Road Transport Tax
ERT Expected Road Transport Tax
ATE Actual Tax Evasion
ETE Expected Tax Evasion