effect of technology adoption on underwriting …
TRANSCRIPT

EFFECT OF TECHNOLOGY ADOPTION ON UNDERWRITING
PROCESSES AMONG TOP FIVE INSURANCE COMPANIES IN
NAIROBI COUNTY
BY
NGIRI MUGECHI SUSAN
UNITED STATES INTERNATIONAL UNIVERSITY – AFRICA
SUMMER 2021

EFFECT OF TECHNOLOGY ADOPTION ON UNDERWRITING
PROCESSES AMONG TOP FIVE INSURANCE COMPANIES IN
NAIROBI COUNTY
BY
NGIRI MUGECHI SUSAN
A Research Project Report Submitted to the Chandaria School of Business
in Partial Fulfillment of the Requirement for the Masters of Business
Administration (MBA)
UNITED STATES INTERNATIONAL UNIVERSITY-AFRICA
SUMMER 2021

ii
STUDENT’S DECLARATION
I, the undersigned, declare that this Research Project is my original work and has not been
submitted to any other college, institution or university other than the United States
International University in Nairobi for academic credit.
Signed: ________________________ Date: _____________________________
Ngiri Mugechi Susan (660334)
This research project report has been presented for examination with my approval as the
appointed supervisor.
Signed: ________________________ Date: _______________________________
Dr. Gabriel O. Okello
Sign: __________________________ Date___________________________
Dean, Chandaria School of Business

iii
COPYRIGHT
All rights reserved. No part of this work may be produced or transmitted in any form or by any
means, electronic, mechanical, including photocopying, recording or any information storage
without prior written permission from the author.
© Copyright by MUGECHI NGIRI SUSAN, 2021

iv
ABSTRACT
The purpose of the study was to examine the effect of technology adoption on underwriting
processes among top five insurance companies in Nairobi County. The study was guided by
the following research questions: How does digitization of claims process affect the
underwriting process among the top five insurance firms in Nairobi County? What is the effect
of digital fraud detection on the underwriting process among the top five insurance company
in Nairobi County? Lastly, what is the effect of using customer relationship management
system on the underwriting process among top five insurance firms in Nairobi County?
The study employed survey descriptive design. The target population was 1174 employees of
top 5 insurance companies operating in Nairobi County. The study used stratified sampling to
select 298 employees of the selected insurance firms to participate in the survey. The study
relied on primary data. Data collection was performed through the use of structured
questionnaires. Through SPSS Version 26.0, data analysis entailed the use of descriptive and
inferential statistics techniques. Descriptive statistics techniques to be used include
percentages, mean and standard deviation. Inferential statistics techniques used entailed
Pearson Correlation Coefficient and Simple Linear Regression. Simple linear regression
analysis was used to determine linear relationship and the effect of each technology adoption
variable on the underwriting process. The results and findings were presented in the form of
tables and figures.
The findings on the effect of digital claim processing on the underwriting process among top
five insurers in Nairobi County indicated that most of insurers agreed that automation ensures
that the insured provided accurate information that was verifiable during investigation. The
relationship between digital claim processing and the underwriting process was positive and
weak. The findings further revealed that digital claim processing had positive and significant
effect on the underwriting process among insurers in Nairobi County.
Regarding the effect of digital fraud detection on the underwriting process among top five
insurers in Nairobi County, the findings indicated that most insures agreed that they encounter
the risk of inability to meet claims due to fraudulent claims from policyholders. The
relationship between digital fraud detection and underwriting process was positive and weak.

v
The findings further revealed that digital fraud detection had a positive and significant effect
on the underwriting process among insurers in Nairobi County.
The findings on the effect of customer relationship management system on the underwriting
process among top five insurers in Nairobi County indicated that most insurers agreed that
staff provided service to customers as a priority entry into the company without exceeding.
The relationship between customer relationship management system and underwriting process
was strong and positive. The findings further revealed that customer relationship management
system had a positive and significant effect on process among insurers in Nairobi County.
The study concluded that digitization of claims process, digital fraud detection, and customer
relationship management system factors significantly affected the underwriting among top
insurers. Statistical results (correlation and regression analysis) concluded that all the three
independent variables used in the study namely: Digital claim processing, digital fraud
detection, and customer relationship management system attributes had a significant positive
relationship with the dependent variable, underwriting process. The study recommends that
insurers should always work towards automating their clam’s processes. In addition, the study
recommends that insurers should put in place aspects of building up digital insurance control
mechanisms. The study further recommends that insurers should consider investing in their
customer relationship management programs.

vi
ACKNOWLEDGEMENT
I acknowledge God for guiding me through my academic’s journey, the entire staff of USIU
and my family for the support, sacrifice and encouragement all through. This endeavor would
not have been accomplished without the support of my colleagues in the insurance sector. I
must also thank the Chandaria School of Business for the support offered in this research
project under the invaluable guidance of Dr. Gabriel Okello.

vii
DEDICATION
This project is dedicated to Family. My husband Mr. Joseph K. Mutiga and my children
Natalie, Madeleine and Emmanuel Kimani. for your love, support and sacrifice in all aspects
of my life. To my siblings, mother and to my father Mr. John Ngiri, for encouraging to pursue
further education and his passion for academic excellence. I will forever be indebted to all of
you for molding me to the person I am and the values you instilled in me. Gratias tibi

viii
TABLE OF CONTENTS
STUDENT’S DECLARATION ............................................................................................. ii
COPYRIGHT ......................................................................................................................... iii
ABSTRACT ............................................................................................................................ iv
ACKNOWLEDGEMENT ..................................................................................................... vi
DEDICATION....................................................................................................................... vii
TABLE OF CONTENTS .................................................................................................... viii
LIST OF TABLES ...................................................................................................................x
LIST OF FIGURES .............................................................................................................. xii
LIST OF ACRONYMS ....................................................................................................... xiii
CHAPTER ONE ......................................................................................................................1
1.0 INTRODUCTION.........................................................................................................1
1.1 Background to the Study .............................................................................................1
1.2 Statement of the Problem ............................................................................................5
1.3 Purpose of the Study ...................................................................................................7
1.4 Research Questions .....................................................................................................7
1.5 Significance of the Study ............................................................................................7
1.6 Scope of the Study.......................................................................................................8
1.7 Definition of Terms .....................................................................................................8
1.8 Chapter Summary ........................................................................................................9
CHAPTER TWO ...................................................................................................................10
2.0 LITERATURE REVIEW ..........................................................................................10
2.1 Introduction ...............................................................................................................10
2.2 Effect of Digitization of Claims Process on Underwriting Processes .......................10
2.3 Effect of Digital Fraud Detection on the Underwriting Process ...............................15
2.4 Effect of Using Customer Relationship Management System on the Underwriting
Process ..................................................................................................................................19
2.5 Chapter Summary ......................................................................................................26
CHAPTER THREE ...............................................................................................................27
3.0 RESEARCH METHODOLOGY ..............................................................................27
3.1 Introduction ...............................................................................................................27

ix
3.2 Research Design ........................................................................................................27
3.3 Population and Sampling Design ..............................................................................28
3.4 Data Collection Methods ...........................................................................................31
3.5 Research Procedures .................................................................................................32
3.6 Data Analysis Methods .............................................................................................34
3.7 Chapter Summary ......................................................................................................37
CHAPTER FOUR ..................................................................................................................38
4.0 RESULTS AND FINDINGS ......................................................................................38
4.1 Introduction ...............................................................................................................38
4.2 General Information ..................................................................................................38
4.3 Effect of Digitization of Claims Process on Underwriting Processes .......................43
4.4 Effect of Digital Fraud Detection on the Underwriting Process ...............................50
4.5 Effect of Using Customer Relationship Management System on the Underwriting
Process ..................................................................................................................................56
4.6 Chapter Summary ......................................................................................................63
CHAPTER FIVE ...................................................................................................................64
5.0 DISCUSSION, CONCLUSIONS AND RECOMMENDATIONS ..............................64
5.1 Introduction ...............................................................................................................64
5.2 Summary ...................................................................................................................64
5.3 Discussion .................................................................................................................65
5.4 Conclusions ...............................................................................................................71
5.5 Recommendations .....................................................................................................72
REFERENCES .......................................................................................................................74
APPENDICES
APPENDIX I: INTRODUCTION LETTER
APPENDIX II: QUESTIONNAIRE
APPENDIX III: RESEARCH INFORMED CONSENT
APPENDIX IV: DEBREIF FORM
APPENDIX V: IRB CONFIDENTIALITY FORM
APPENDIX VI: USIU-AFRICA INTRODUCTION LETTER
APPENDIX VII: RESEARCH ETHICAL LETTER
APPENDIX VIII: NACOSTI PERMIT

x
LIST OF TABLES
Table 3.1 : Population Distribution ..........................................................................................28
Table 3.2: Sample Size Distribution ........................................................................................31
Table 3.3: Validity of the Questionnaire..................................................................................33
Table 3.4: Reliability of the Questionnaire ..............................................................................34
Table 4.1: Duration for Handling aspects of Claim Management ...........................................41
Table 4.2: Descriptive Statistics on Digitization of Claims Process .......................................44
Table 4.3: Correlation between Digitization of Claims Process and Underwriting Processes 45
Table 4.4: Tests of Normality for Digitization of Claims Process Variable ............................46
Table 4.5: Linearity Test between Digitization of Claims Process and Underwriting
Process .....................................................................................................................................46
Table 4.6: Multicollinearity Test for Digitization of Claims Process and Underwriting Process
..................................................................................................................................................48
Table 4.7: Regression Model Summary for Linear Relationship between Digitization of Claims
Process and Underwriting Processes .......................................................................................48
Table 4.8: Regression ANOVA for Linear Relationship between Digitization of Claims
Process and Underwriting Processes .......................................................................................49
Table 4.9: Regression Coefficients Values for Linear Relationship between Digitization of
Claims Process and Underwriting Processes ...........................................................................49
Table 4.10: Descriptive Statistics on Digital Fraud Detection ................................................51
Table 4.11: Correlation between Digital Fraud Detection and Underwriting Process ............52
Table 4.12: Normality Test for Digital Fraud Detection Variable ...........................................53
Table 4.13: Linearity Test for Digital Fraud Detection and Underwriting Process .................53
Table 4.14: Multicollinearity Test for Digital Fraud Detection and Underwriting Process ....54
Table 4.15: Regression Model Summary for Linear Relationship between Fraud Detection and
Underwriting Processes ...........................................................................................................55
Table 4.16: Regression ANOVA for Linear Relationship between Digital Fraud Detection and
Underwriting Processes ...........................................................................................................55
Table 4.17: Regression Coefficients Values for Linear Relationship between Digitization of
Claims Process and Underwriting Processes ...........................................................................56

xi
Table 4.18: Descriptive Statistics for Customer Relationship Management System ..............57
Table 4.19: Correlation between Customer Relationship Management System and
Underwriting Process ...............................................................................................................58
Table 4.20: Tests of Normality for Customer Relationship Management System Variable ...59
Table 4.21: Linearity Test for Customer Relationship Management System and Underwriting
Process .....................................................................................................................................60
Table 4.22: Multicollinearity for Customer Relationship Management System and
Underwriting Process ...............................................................................................................61
Table 4.23: Regression Model Summary for Linear Relationship between Customer
Relationship Management System and Underwriting Processes .............................................62
Table 4.24: Regression ANOVA for Linear Relationship between Customer Relationship
Management System and Underwriting Processes ..................................................................62
Table 4.25: Regression Coefficients Values for Linear Relationship between Customer
Relationship Management System and Underwriting Processes .............................................63

xii
LIST OF FIGURES
Figure 4.1: Response Rate .......................................................................................................38
Figure 4.2: Insurance Provider .................................................................................................39
Figure 4.3: Years of Operation in Local Market......................................................................40
Figure 4.4 : Number of Employees ..........................................................................................40
Figure 4.5: Level of Technology Implementation ...................................................................41
Figure 4.6: Incidences of Insurance Fraud ...............................................................................42
Figure 4.7: Profitability of Insurers .........................................................................................43
Figure 4.8: Homoscedasticity Test for Digitization of Claim Process ...................................47
Figure 4.9: Homoscedasticity Test For Digital Fraud Detection .............................................54
Figure 4.10: Homoscedasticity Test Results for Customer Relationship Management
System ......................................................................................................................................60

xiii
LIST OF ACRONYMS
AKI Association of Kenya Insurer
CRM Customer Relationship Management
CRS Claim Review Support
EIC Earned Income Tax Credit
FTUSA The Tunisian Federation of Insurance Companies
GARCH Generalized Autoregressive Conditional Heteroskedasticity
GWP Gross Written Premium
HIRA Health Insurance Review and Assessment
HMI Health Microinsurance
ICICI Industrial Credit and Investment Corporation
IoT Internet of Things
IRA Insurance Regulatory Authority
IRDA Insurance Regulatory and Development Authority
IT Information Technology
ML Machine Learning
P & C Property and Casualty
PARE Payment Request
RFM Recency, frequency, monetary value
SAS Coalition Statistical Analysis Software
SME Small- to Mid-size Enterprise
SPSS Statistical Package for the Social Sciences
UW Underwriting
VAR Vector Autoregressive
1
CHAPTER ONE
1.0 INTRODUCTION
1.1 Background to the Study
Over the last decade, a variety of breakthrough technologies have spurred a fundamental
transformation of the insurance industry (Bondurant & White, 2019). The new technologies
such as Cloud computing, the Internet of Things (IoT), advanced analytics, mobile phones,
blockchain, smart contracts, and artificial intelligence (AI) are providing new ways to measure,
control, and price risk, engage with customers, reduce cost, improve efficiency, and expand
insurability (Ferenzy, Silverberg, Van Liebergen, & French, 2016). Fundamentally, one of the
elements of insurance spectrum which has undergone significant revolution is underwriting
process. The emergence of new technology has the potential to change the way insurers
underwrite customers, distribute insurance products, collect data, and change consumer
behaviour in the actual buying of insurance products (Gandhi & Kaul, 2016).
Conventionally, underwriting occurs when an insurer and an insured conclude a contract of
insurance, whereby the insurer undertakes to indemnify the insured against losses due to
specific future risks, while the insured has the obligation to pay periodic premiums to the
insurer in return (Conrad, Mostert, & Mostert, 2015). Underwriting can be categorized into
two major categories; general and life insurance underwriting (Scordis, 2019). There are two
kinds of life insurance underwriting options: Simplified Issue and Fully Underwritten. General
insurance or non-life insurance policies, including automobile and homeowners’ policies,
provide payments depending on the loss from a particular financial event (Neale, Drake, &
Konstantopoulos, 2020).
A report by the Wyman and Zhong (2017) acknowledges wide-scale technology application in
underwriting processes. For instance, Artificial Intelligence applied to past underwriting (UW)
decisions could be used to program next generation underwriting systems (Chester, Ebert,
Kauderer, & McNeill, 2016). Insurers have mandate to respond to growth among consumers
in the use of apps and Internet of things to manage their personal health. Insurers have the
mandate to respond to changing customer demands for convenience, personalisation, and fast

2
execution (Van Dalen, Cusick, & Ferris, 2021). In essence, technology plays a significant role
in underwriting transformation across all segments from SME to mid-market to large
commercial.
According to Schmid (2019) key levers that have a major impact on the underwriting value
chain include automation, data insights and analytics, and underwriting platform-based
solutions. These technologies affect the assessment and proactive monitoring of risks and
hence help in the prevention of the same. Thus, countries with low insurance penetration rates
but with large market and growing middle class are finding great opportunity in tech-insurance.
In Brazil, for instance, the development of information and communication technology in the
country is brightening up the outlook for Brazil’s insurance industry, considering it has the
fourth highest number of internet users in the world (Dimas, 2017).
In developed economies, top insures have led the way in the adoption of modern technology
(Joshi, Pelling, O’Connor, & Wompa, 2020). In 2018, the Germany leading insurer Allianz,
announced a partnership with Microsoft for the digital transformation of the insurance industry
by making the insurance process easier and creating an improved experience for both insurance
companies and customers (Daramola, Oderinde, Anene, Abu, & Akande, 2020). In the same
year, Allianz Insurance launched “Defendant Hub” a new digital proposition that uses artificial
intelligence to enable the company’s injury claims handlers to action Ministry of Justice Stage
3 claims at a single click of a button.
In France, the leading insurer, AXA managed to automate its operations in pursuit of
strengthening its underwriting activities. To reinforce its presence on the strategic SME
business market, AXA developed “OSE”, a corporate underwriting tool that considerably
speeds up and simplifies new contracts through data and automation (Borselli, 2020). To
combat fraud in insurance sector, AXA implemented Sherlock; a data analysis software
solution designed to automate and simplify fraud detection. The tool can help identify and
extract suspicious claims, while more importantly enabling honest claims to be processed more
quickly (Kumar, Srivastava, & Bisht, 2019). In early 2012, AXA made the decision to roll out
the point-of-sale risk assessment and accumulations management software solution,
3
LexisNexis® Map View, globally, to adopt a standardised and consistent approach to risk
management across all its property underwriting divisions worldwide.
In 2020, the China Life Insurance Company Limited pushed forward digital transformation in
all aspects (Shaw & Baumann, 2020). Being customer-centric, the company pushed forward
intelligent upgrade of online services. The “Contactless Services” facilitated customers
accessing insurance services just at home by employing Internet video and intelligent
identification technology. Based on big data and AI technologies, the intelligent claims
settlement model for health insurance, covering 19 key risks in five categories, made claims
settlement services more efficient and convenient (Eckert & Osterrieder, 2020).
In Russia, there has been a growth in digital insurance. The main tasks that a Russian insurer
solves when using IT technologies are the automation of business operations and the formation
of an online system of interaction with customers with the main focus on sales (Kaigorodova,
et al, 2021). Maslova and Ilina (2020) observe that the key advantage of the latter is time saving
and no pressure from insurer or intermediary, whereas the main threat is loss of data access
and leaks. For Russian companies, the prior challenge is to provide the complete service cycle
starting from the pre-sale stage and ending with the settlement of insurance case, as well as to
implement an individual approach to each insurant. Similar shortcomings are observed in the
Mexican insurance market. Kędra, Lyubov, Lyskawa, and Klapkiv (2019) contend that in
Mexico, there is a different tendency in the raising of ICT investments and the values of gross
premiums, claims and expenses.
In order to explore consumers’ preferences, the authors interview 110 Russian policyholders
and study their relations with insurers, their choice of policy acquisition channels, and the
quality of particular digital insurance customized offers. The poll results show the higher
demand for conventional insurance rather than digital one. Nevertheless, there has been a
growth in digital insurance. The key advantage of the latter is time saving and no pressure from
insurer or intermediary, whereas the main threat is loss of data access and leaks. The authors
analyze main drivers of online-insurance in Russia. The general problem is lack of trust
between consumers and insurers. For Russian companies, the prior challenge is to provide the
complete service cycle starting from the pre-sale stage and ending with the settlement of
insurance case, as well as to implement an individual approach to each insurant. That will

4
become the basis for insurance service customization which is considered to be one of the most
promising global trends in this sector.
A substantial portion of insurance companies now are including anti-fraud technology in their
anti-fraud programs. On April 26 2021, The Insurance Fraud Bureau (IFB) commenced
building of a powerful, new fraud detection system on behalf of the UK insurance sector.
Currently one insurance scam takes place each minute in the UK, devastating countless victims
and costing the economy over £3 billion a year (Mohammed, Abdelsalam, Ashraf, & Barake,
2020). In comparison, internal fraud, rate evasion, underwriting fraud, claims fraud,
cybersecurity fraud adds up to more than $80 billion a year in the US (Coalition Against
Insurance Fraud, 2020). Indeed, the Coalition Against Insurance Fraud (2016) surveyed
insurance companies and found that nearly 75 percent had fully integrated technology into
their anti-fraud systems- up from about 50 percent four years ago.
The South Africa’s top insurer, Old Mutual Insure, has developed a laudable reputation for
customer centricity and service quality which are values that form the foundations of its digital
transformation journey (Singh, 2020). The company’s digital transformation is focused on
establishing lean operations that maximise efficiency and improve the customer experience.
Additionally, Sanlam’s understanding of the imperative for cutting-edge digital solutions is
firmly rooted in its desire to offer its customers a seamless and meaningful insurance
experience (Benton, 2020). In Ghana, BIMA agents, the company also utilizes mobile
technology to sign up customers, verify registration, receive premium payments and pay out
claims. BIMA’s registration process is fully paperless and can be completed within two
minutes (Edinger, Adepoj, & Masha, 2017).
The Kenyan insurance life market is characterised by seven main products with ordinary life,
group life and pensions being the key products in the market (Chache, Mwangi, Nyamute, &
Angima, 2020; Kahonga & Kariuki, 2020). Most of the top ten insurers have experienced
reasonable premium growth with an average premium growth of 11% over the year 2018/2019
(Muriuki, & Luo, 2020). In 2019, the number of insurance companies remained 54 similar to
2018. There were 16 Reinsurance brokers in 2019 up two from 14 in 2018. The number of
agents increased from 8,955 in 2018 to 9,262 in 2019. Licensed brokers decreased from 216
in 2018 to 213 in 2019. The number of insurance surveyors and loss adjusters stood at 30 in

5
2019 compared to 28 in 2018. In terms of market capitalization, Britam Life ranks top with
23.59%, Jubilee Insurance came second with 14.48% capitalization, ICEA (13.86%), CIC
(6.95%), and APA (6.59%) (Insurance Regulatory Authority, 2020). Based on market
capitalization and capital investment, the top 10 non-life insurers accounted for more than
56.08% of the fast-growing gross premium income for the year. Squeezed margins in the
sector, continued cases of fraud, and premiums that have grown at a slower rate than the
economic growth, have had a negative impact on shareholders’ returns. Notably, Permanent
Health has not experienced significant growth within the last 4 years (Ngunguni, Misango, &
Onsiro, 2020).
Overall, the Association of Kenya Insurers (2020) reports that Kenya has insurance penetration
of 2.37%. According to Association of Kenyan Insurers (2019), although, the segment is
experiencing growth in terms of premium income, there is persistent recording of underwriting
losses for the past five years. Above all, the insurance sector has quickly recognised the
compelling need for digitalization as a defining and redefining factor to its success and survival
(Kandiri, 2015). There is a particular opportunity for transformation in the underwriting, fraud
detection, customer relationships, and claims functions in the Kenyan market.
1.2 Statement of the Problem
The revolution of Information Technology and internet facilitates the outstanding performance
of the economy in business sector; through the exchanges of information by using internet and
electronic devices facilitate accessibility of doing business between companies globally
(Mgunda, 2019). A study by Genpact (2014) associates technology with significant positive
monetary impact, and that technology is proportionally more applicable to business functions
that address multiple challenges across the enterprise. Cavalcante (2015) argues that
technology platform potentially represents the creation of a new business model for the partner
companies in the consortium. Deloitte (2019) regards digital innovation as a key to unlocking
new markets. The adoption of digital technology enables insurance companies to reduce the
cost of servicing clients, to tailor products to the needs of specific income groups, and to
streamline internal processes (Zahid, 2020).
Insurers are faced with several global challenges ranging from; lack of a centralised view of
its accumulations risk and exposure to perils globally, weak underwriting performance

6
facilitated by inconsistent risk management practices across the underwriting divisions, poor
customer satisfaction levels, and the growing concerns over insurance fraud (Borselli, 2020).
Kumar, Srivastava, and Bisht (2019) categories challenges confronting the insurance sector
into six strategic areas: Opportunity cost, right advice, time consuming, cost, frauds, and bulky
operations.
Locally, as top insurers struggle to absorb the underwriting impacts of large loss associated
with COVID-19, the impact on profitability is still uncertain. Based, on the 2019 market
capitalization, the top 5 leading insurers in Kenya control the larger market share in the
country. According to The Association of Kenya Insurers (2019), approximately 48 percent of
the underwriting markets share is controlled by the top 5 insurance firms. In the financial year
that ended June 2020, General reinsurance business sunk into the loss-making territory after
the reinsurers incurred Sh3.09 billion in claims and Sh1.95 billion in direct expenses (Insurance
Regulatory Authority, 2020). This resulted in an underwriting loss of Sh1.39 billion million,
driven mainly by claim expenses. It appears that the command is simple, insurers digitize or
die. According to Catlin, Deetjen, and Lorenz (2019), digitization can reduce the cost of a
claims journey by as much as 30%.
Studies have been conducted in attempt to establish the linkage between digitization and
performance of underwriting processes. Yıldırım (2019) analysed the prospects of InsurTech
in insurance business. The study did not link on how InsurTech impacted performance of
underwriting process. Owens (2020) analysed The adoption of Big Data Analytics and
algorithms in motor insurance underwriting practice is robust, proving advantageous for
competition in the market. Soye, Adeyemo, and Adeyemo (2018) addressed how underwriting
capacity affected the income of insurance industry in Nigeria. Besides, entirely employing
secondary data from the insurers’ financial records. The study did not incorporate the role of
digitization in underwriting income and asset value. Gakinya (2018) established the influence
of technology as a strategic resource on performance of insurance companies, focusing on
AAR insurance Kenya limited. The study was limited to AAR company hence the need to
survey the top five insurers inorder to make the findings more representative. Mungai (2019)
identified the determinants of the uptake of insurance underwriting of public service vehicles
plying for hire in Kenya.

7
The study focused on government regulations, industry practice, influence of shareholders’
interests but did not assess the extent to which digitization impacted operations of insurance
firms. With the existing scarcity in literature, it is evident that research is conducted in attempt
to establish the effect of technology on underwriting processes within the Kenyan context.
1.3 Purpose of the Study
The purpose of the study was to examine the effect of technology adoption on underwriting
processes among top five insurance companies in Nairobi County.
1.4 Research Questions
1.4.1 How does digitization of claims process affect the underwriting process among the top
five insurance firms in Nairobi County?
1.4.2 What is the effect of digital fraud detection on the underwriting process among the top
five insurance company in Nairobi County?
1.4.3 What is the effect of using customer relationship management system on the
underwriting process among top five insurance firms in Nairobi County?
1.5 Significance of the Study
1.5.1 Management of the Insurance Firms
The management of the insurance firms operating in Nairobi County could find this study
useful in guiding them in the identification critical areas within underwriting that need
technological redress to ensure sustainability of service delivery to the insured.
1.5.2 The Policy Makers
The study findings add value to the leadership of insurance firms in Kenya. The Kenyan
parliament is presented with the opportunity to enact laws that facilitate safe, faster, and
affordable technological adoption within the insurance sector. It also assists the Insurance
Regulatory Authority in the formulation of effective policies that guarantee sound and effective
performance of the insurance sector which can spur the realization of Sustainable Development
Goals and the Vision 2030.
8
1.5.3 The Academia and Researchers
Research on the subject remains scanty within the context of the technology use in the
underwriting procedures. This is part of concerted effort to assess the position of technology
uptake among the insurers with the perspective to recommend certain lines of action through
which existing problems such as low uptake, lengthy claim processing, fraud, and customer
complaints can be managed through proper use of technology. Finally, the study findings
would be of value to the academicians and other researchers as it would provide the base for
further research in the area of techinsurance.
1.6 Scope of the Study
The study concentrates on the digitization of underwriting processes in the Kenyan insurance
market. Specifically, the study was confined to the digitization of claims process, digitization
of fraud detection, and the adoption of customer management system. It covers the top 5
insurance firms operating in Nairobi market. According to the Association of Kenya Insurers
(2019), approximately 48 percent of the underwriting markets share is controlled by the top 5
insurance firms. The target population is 1174 employees of the five underwriters. A sample
of 298 was derived from the staff of: Jubilee, Britam, APA, CIC, and ICEA Lion insurance
companies. The study was conducted between September 2020 and July 2021.
1.7 Definition of Terms
1.7.1 Technology
Technology refers to the technical aspects of the software and hardware required to adopt and
utilize digitization of core business processes to enhance operational efficiency (Carroll, 2017).
1.7.2 Insurance
This is the contractual agreement between two parties, the insured and insurer. At an agreed
fee (premium), the insured transfers their risk to a third party, the insurer/underwriter. The
contract between the two parties is binding. Once the contract is bound, the insured is covered
(indemnified) in the event of a loss (Chartered Insurance Institute, 2016).
1.7.3 Underwriting Processes
Underwriting describes the consideration given to a life or general insurance application, to
determine whether a policy applied for should be issued or there are changes to be made

9
depending on the person’s risk profile (Murphy, Mostert F, & Mostert H, 2014). The process
helps in the selection of risks for the insurance company involved in issuance of an insurance
policy to the person in question.
1.7.4 Digital Claim Processing
This is the automation of some tasks such as: following up with the claimant or third party for
missing documentation and validating that all required claim information has been collected
(Tajudeen, Ajemunigbohunb, & Gbenga, 2017).
1.7.5 Digital Fraud Detection
Digital insurance detection is a set of technological activities undertaken by insurers to prevent
money or property from being obtained through false pretenses or deception (Kalwihura &
Logeswaran, 2020).
1.7.6 Customer Relationship Management System
Customer relationship management (CRM) is the combination of practices, strategies and
technologies that underwriters use to manage and analyze customer interactions and data
throughout the customer lifecycle (Hassan, 2018). The goal is to improve customer service
relationships and assist in customer retention and drive sales growth in insurance companies.
1.8 Chapter Summary
This chapter sets the ground for the study detailing the background information, problem
statement and purpose of this study, its significance, scope and definition of terms. In this
chapter, the study highlights the key role played by digitization in the insurance sector,
stressing the need for technology uptake in addressing matters in consumer relationship
management, fraud prevention, and effective handling of the underwriting operations. Chapter
two presents review and analysis of literature in relation to the effect of technology on the
underwriting processes within the scope of insurance service provision. Chapter three presents
the methodology, which was adopted when accomplishing the study. Chapter four provides
the results and findings while chapter five is about discussion, conclusion and
recommendations based on the research questions.
10
CHAPTER TWO
2.0 LITERATURE REVIEW
2.1 Introduction
The chapter provides review of empirical studies in alignment with the technological adoption
in the underwriting services across global, regional, and local markets. The chapter is
organized based on the research questions under investigation. The first section reviews
literature on digitization of claim processing on the underwriting activities. The section
reviews literature on the effect of fraud detection system on the underwriting processes in
insurance firms. The third section provides analysis of studies concerned with the effect of
using customer relationship management system on the Underwriting process among insurance
firms. The study ends with summary of major themes in the literature.
2.2 Effect of Digitization of Claims Process on Underwriting Processes
Claim is the largest expenses of any insurance company (Olalekan & Sewhenu, 2016). Claims
are filed at the time of maturity or in case of death/disability (Yadav & Mohania, 2015); when
the covered loss or policy event occurs/happens. Therefore, claims management is seen as an
essential tool of image boosting in insurance industry. Excellence in claims handling gives an
insurance company a competitive edge over its competitors. For an insurance company, claims
processing is one of its core activities. It could be said to be the main reason why insurance
companies are established. Investigating, paying and recording claims data is crucial to any
insurance company’s financial stability (Dash, Shakyawar, & Sharma, 2019). Managing it
more effectively and efficiently, aligning it with corporate business objectives, and achieving
real-time operational awareness are high priorities of an insurance company. This is because
claims processing touches all part of the organization, affecting competitive positioning,
customer service, fraud management, risk exposure, cost control and Information Technology
infrastructure (Ogunnubi, 2018). This section reviews literature in connection with claims
investigation, claims processing, and claims settlement with the aid of automation models
within the insurance sector.
2.2.1 Digitized Claim Investigation
Claim is a formal request by a policyholder to an insurance company for cover or compensation
for a specified loss or policy event (Ntwali, Kituyi, & Kengere, 2020). The Claims

11
Investigations process is one in which Insurance Companies, Insurance Examiners, or
Investigators obtain information to evaluate a claim. As a result, it may require perusing
documents, locating witnesses, visiting and interviewing people, inspecting property such as
vehicles, accident sites and physical locations to name a few. The insurance company validates
the claim and, once approved, issues payment to the insured or an approved interested party
on behalf of the insured (Khurramov, 2020).
In some cases, the insurer may not have full facts of the claim and is unable to make a decision
on a claim. The company may therefore appoint an investigator, to carry out investigations and
file a report to the insurer. This is mainly for motor and liability claims. Either for health
insurance, the insured or the injured person might report the claim to the insurer. Once the
insurer opens a file, the insurer will assign it to a claims adjuster. The adjuster is the person
who will investigate the facts of an accident and negotiate a settlement of the claim (Patil &
Abhyankar, 2019). Investigations are also necessary if a claim is suspected to be fraudulent.
The nature of other claims requires an insurer to appoint a loss adjuster, to establish liability
and quantum of the claim. This is especially for property claims, including Fire, Burglary,
Domestic Package, All Risks, and Marine among others (Vanguard, 2017).
Anchan, Jathanna, and Marla (2016) aimed to understand the current claim process of existing
health insurance schemes, to identify the barriers in the claim process at the hospital level and
to study the consumer awareness and satisfaction in health insurance. Method employed was
cross-sectional study with convenient sampling, data included time analysis format and
validated questionnaire. Overall there was a delay in query justification followed by pre-
authorization, preparation and faxing. Policyholders were not fully aware about health
insurance, 50 per cent of policyholders knew what Third Party Administrator (TPA) meant and
consumers were not fully satisfied with health insurance. This study aims to incorporate the
effect of digitization in smoothening claim processing among insurers.
Holtz, Hoffarth, and Desai (2015) demonstrated that analyzing claims data equips
microinsurance (HMI) practitioners with valuable insights to improve the client value and
viability of HMI programmes. The study performed a comparative analysis of three South
Asian HMI programmes - run by VimoSEWA, Uplift Mutuals and Naya Jeevan. Overall
findings illustrated that a relatively small number of common illnesses, such as diarrhoea or
12
fever/malaria, along with trauma and accidents, generate approximately 50 per cent of claims
costs, a pattern that invites closer, focused monitoring and deeper analysis. Park, Yoon, and
Speedie (2012) described the Health Insurance Review and Assessment Service (HIRA)'s
payment request (PARE) system that played the role of the gateway for all health insurance
claims submitted to HIRA, and the claim review support (CRS) system that supports the work
of claim review experts in South Korea. The study found that HIRA's two IT systems had a
critical role in reducing heavy administrative workloads through automatic data processing.
Although the return rate of the problematic claims to providers and the error detection rate by
two systems was low, the actual count of the returned claims was large. However,
interpretation of the study results was confined to the Korean population, paving the way to
replicate the same study in the local context.
2.2.2 Claim Processing
According to Machui (2016), claims process commences at underwriting function which is
guided by structured losses experience data. The first stage starts with the verification of
occurrence of loss. The second stage is the verification of proof of loss to make sure that the
loss occurred accidentally and it was insured. The third process is the negotiation stage to find
out. The funding viewpoints, the volume and allocation of claims are assessed. Whereas, the
operational deals with the operating features of a Claims Settlement Procedure, like processing
capacity, claims quantity and outstanding claims register, are assessed. The helpfulness of this
analysis for efficient and effective organization and management of the claims handling
function is obvious. Claims handling procedures is a tool that allows analysis and predictions
of the handling procedures.
Ashturkar (2015) observed that, in the category of settlement of the claims within 30 days,
private sector companies are more competent compared to public insurers. Hence, Private
companies are more competitive and consumer oriented compared to LIC. Yadav and Mohania
(2015) focused on the claim settlement process of life insurance services of LIC of India and
ICICI prudential life insurance company. The study established that the LIC of India claim
settlement process is very much efficient but not that transparent and approachable as claim
settlement process of ICICI Prudential Life Insurance Company. This study builds on these
findings to incorporate insurance firms engaging in life and non-life insurance claims.

13
Olalekan, Ajemunigbohun, and Alli (2017) investigated claims management among selected
insurance companies in Nigeria. The study was conducted in Lagos metropolis, employed a
descriptive survey design using random sampling technique and thus gathered data through the
use of structured questionnaire. The sample population consisted of 127 respondents made up
of claims managers and other members of staff within the surveyed companies. One sample T-
test was adopted in the analysis of collected data. Empirical assessment revealed that the
various claims handling processing have significant effects in the claims management
processes of insurance companies. The findings from study confirmed the significance of the
various claims handling processing in claims management of insurance companies in Nigeria.
The study suggested that future studies should focus efforts at gathering information from the
larger population as related to customers’ experience of insurance claims.
2.2.3 Claim Settlement
The image and efficiency of any insurance company depends upon the satisfaction of their
policyholders in getting their claims processed and settled in time (Ashturkar, 2015). Payment
of claim is the ultimate objective of life insurance and the policyholder has waited for it for a
quite long time and in some cases for the entire life time literally for the payment (Ntwali,
Kituyi, & Kengere, 2020). It is the final obligation of the insurer in terms of the insurance
contract, as the policyholder has already carried out his/her obligation of paying the premium
regularly as per the conditions mentioned in the schedule of the policy document. Thus, the
settlement of claims within time is very important aspect of service to the policy holders
(Gahigi, 2017).
According to Rendek, Holtz, and Fonseca (2015) large complex claims, especially liability
claims may take long to be concluded. Besides, they may involve a lot of correspondence
between the insurance company and claimant and/or the claimant’s advocate. For such claims,
Capiello (2020) elucidates that there may be a lot of manual intervention, and the IT system
may not be flexible enough to capture all the intricacies of the claims. Further, general
insurance claims are paper-based to a large extent; therefore, automation may be only partial.
In addition, interfaces between insurers and service providers may not be integrated, which
may result to poor claims tracking and lack of management information (Kimura, Saton, Ikeda,
& Noda, 2016).

14
Claims managers need to maximize the use of information technology, in order to reduce
claims processing cycle, thus enhancing efficiency and customer satisfaction. Ineffective IT
governance and control is likely to be the main cause of the negative experiences many
organizations and especially insurance firms have had with the use of IT, including lost
business, damaged reputations, weakened competitive position, inability to meet deadlines,
failed or aborted projects, budget overruns and poor returns on investments (Ostagar, 2018).
Yadav and Mohania (2015) focused on the claim settlement process of life insurance services
of LIC of India and ICICI prudential life insurance company. The study was based on the
secondary data collected from IRDA and research papers from various journals. The study
concluded that in both LIC of India and ICICI prudential life insurance company followed
proper claim settlement process. LIC of India claim settlement process is very much efficient
but not that transparent and approachable as claim settlement process of ICICI Prudential Life
Insurance Company. Yusuf and Ajemunigbohun (2016) assessed the effectiveness, efficiency
and promptness of claims handling process within the Nigerian insurance industry. The study
concluded that claims handling procedures should be managed promptly to evade shortfall in
operational objectives of organization.
Van Jaarsveld, Mostert, and Mostert (2019) paid special attention to the importance of the
claims handling factors of liability insurance, how often the stipulations of liability insurance
policies are adjusted by the short-term insurers to take the claims handling factors into
consideration, as well as the problem areas which short-term insurers may experience during
the claims handling process. Feasible solutions to address the problem areas are also discussed.
De Beer, Mosterst, and Mostert (2015) embodied the improvement of financial decision-
making concerning the claims handling process of engineering insurance. The questionnaire
was sent to the top 10 short-term insurers in South Africa that were providing engineering
insurance. The empirical results focused on the importance of various claims handling factors
when assessing the claims handling process of engineering insurance, the problem areas in the
claims handling process concerned, as well as how often the stipulations of engineering
insurance policies are adjusted to take the claims handling factors into account.

15
Owolabi, Oloyede, Iriyemi and Akinola (2017) investigated the nexus between risk
management and profitability of insurance Company. Findings from regression analysis
disclosed that financial risk management practices, operational risk management practices and
strategic risk management practices have a positive and significant effect on the profitability
of insurance firm. The present study transcends the spectrum of management to focus on digital
strategies in safeguarding insurance firms against fraudulent activities. Anigma and Mwangi
(2017) performed a cross-country on effects of underwriting and claims management practices
on the performance of insurance firms in Kenya, Uganda and Tanzania. Result indicated that
underwriting and claims management practices by non-financial performance are directly and
significantly associated, whereas, the reverse is the case when compared with financial
performance. The model used in the study focused only on underwriting and claims
management practices as a determinant of firm performance of P and C insurance firms in East
Africa. However, there are other insurance risk management practices like pricing and
reinsurance as well as other factors such as liquidity, leverage, investment income among
others, which may have an influence on performance which were not considered and the
inclusion of these variables in future studies would make the findings more robust.
2.3 Effect of Digital Fraud Detection on the Underwriting Process
Insurance fraud is any act committed with the intent to obtain a fraudulent outcome from an
insurance process (Ghorbani & Farzai, (2018). According to the Association of Certified Fraud
Examiners (2018), insurance fraud is the most practiced fraud in the world, and for the third
consecutive time in six years, SAS Coalition (2019) reports that insurers have reported an
increasing amount of suspected fraud. It is hard to reduce the fraud problem as the insurance
business by its very nature is susceptible to fraud. Certified Fraud Examiners (2018) explains
that the large accumulation of reserved funds that are available to pay for loss claims, make
insurance companies attractive for take over and loot schemes. Bodaghi and Teimourpour
(2018) identified that there are two broad types of fraud schemes, namely opportunistic and
professional fraud, alternatively known as soft and hard fraud, respectively. Insurance fraud
falls under the broad category of financial fraud, which consists of other common frauds such
as credit card fraud, money laundering, corporate financial fraud and health-care insurance
fraud. The challenges presented in fraud detection are imbalanced class distribution, lack of
sufficient centralized data and costly black-boxed solutions.

16
2.3.1 Fraud in Insurance Sector
Insurance fraud is a serious and growing problem, and there is widespread recognition that
traditional approaches to tackling fraud are inadequate (Morley, Ball, & Ormerod, 2018).
Insurers are seeing an increase in fraudulent cases and believe awareness and cooperation
between departments is key to stopping this costly problem Insurers indicate that claims (68%)
and underwriting (43%) departments need to be more engaged. Compared to 2016, Callaway,
Kueker, Barker, Dion, Allen, and Kocisak (2019) maintain that there is no change in the
perceived need for fraud engagement in claims departments. However, fraud engagement in
underwriting departments has increased from 30% to 43%. Fighting fraud is still a manual
operation within many organizations, making it a time consuming and error-prone process.
Studies of insurance fraud have typically focused upon identifying characteristics of fraudulent
claims and claimants, and this focus is apparent in the current wave of forensic and data-mining
technologies for fraud detection (Morley, Ball, & Ormerod, 2018). As a result, an alternative
approach is to understand and then optimize existing practices in the detection of fraud. An
ethnographic study by Salim and Hamed (2018) explored the nature of motor insurance fraud-
detection practices in two leading insurance companies. The results of the study suggested that
an occupational focus on the practices of fraud detection can complement and enhance forensic
and data-mining approaches to the detection of potentially fraudulent claims. This necessitates
a study of this nature especially in developing countries such as Kenya.
The Tunisian Federation of Insurance Companies (FTUSA) is currently working in
collaboration with the authorities concerned, to create an agency to fight against fraud in the
sector, particularly in motor insurance, according to the FTUSA president, Mr Habib Ben
Hassine. In July 2020, the Insurance Regulatory Authority of Uganda (2020) added mobile
phone as a new payment platform for Motor Third Party Insurance to supplement walk-ins and
bancassurance. The new digitized mobile payment platform, according to Insurance
Regulatory Authority (IRA) will help curb fraud in the industry as well as promote
convenience (Mukooza, 2020). Wine (2015) postulates that the Kenya’s insurance regulatory
authority is rallying on shared data systems to counter against health insurance fraud in the
sector.

17
2.3.2 Fraud Detection
The machine learning (ML) approach to fraud detection has received a lot of publicity in recent
years and shifted industry interest from rule based fraud detection systems to ML-based
solutions. Insurance fraud investigation is majorly performed using two approaches, the
Machine Learning based solution and the Rule-based approach. In comparison, the rule-based
approach entail using algorithms that perform several fraud detection scenarios, manually
written by fraud analysts. Today, legacy systems apply about 300 different rules on average to
approve a transaction. That is why rule-based systems remain too straightforward. They require
adding/adjusting scenarios manually and can hardly detect implicit correlations. On top of that,
rule-based systems often use legacy software that can hardly process the real-time data streams
that are critical for the digital space; ML-based fraud detection. However, there are also subtle
and hidden events in user behavior that may not be evident, but still signal possible fraud.
Machine learning allows for creating algorithms that process large datasets with many
variables and help find these hidden correlations between user behavior and the likelihood of
fraudulent actions. Another strength of machine learning systems compared to rule-based ones
is faster data processing and less manual work. For example, smart algorithms fit well with
behavior analytics for helping reduce the number of verification steps.
The digital transformation is of increasing relevance for insurance companies’ business
models. It leads to opportunities as well as challenges, especially for IT departments as core
enablers or preventers. Against this background, the aim of this paper is to provide
a comprehensive overview of digital technologies (e.g., artificial intelligence, cloud
computing) and the resulting use cases for the insurance industry. To this end, Eckert and
Osterrieder (2020) conducted a review of academic articles, industry studies and publications
of the supervisory authorities. The study point to the resulting requirements for an insurer’s IT
and find many interdependencies between the digital technologies. The results therefore
emphasize the importance of a holistic digital strategy.
Literature differentiates data mining and machine learning into supervised, unsupervised,
hybrids or semi-supervised methods. As supervised techniques require the data to be labeled
for building a training set, unsupervised techniques will deal with data based on group or
statistical outlying behavior. The unsupervised methods are a piece of technology to identify

18
potentially fraudulent transactions, that additional require the use of expertise to determine the
legitimacy of the claims. Although fraud detection research is a relatively large field, most of
the studies consider outlier detection as the primary tool (Vineela, Swathi, Sritha, & Ashesh,
2020).
2.3.3 Anti-Fraud Solutions for Insurance Claims
Multiple data analytics approaches can mitigate insurance fraud related risks. Wine (2015)
notes that each type of anti-fraud measure has certain advantages and limitations which need
to be carefully considered along with the needs of each individual insurance company before
being implemented. Advanced systems are not limited to finding anomalies but, in many cases,
can recognize existing patterns that signal specific fraud scenarios. There are two types of
machine learning approaches that are commonly used in anti-fraud systems: unsupervised and
supervised machine learning. They can be used independently or be combined to build more
sophisticated anomaly detection algorithms. Supervised learning entails training an algorithm
using labeled historical data. In this case, existing datasets already have target variables
marked, and the goal of training is to make the system predict these variables in future data.
Unsupervised learning models process unlabeled data and classify it into different clusters
detecting hidden relations between variables in data items.
Bogaghi, Modares, and Teimourpour (2017) has put forward a new approach for identification,
representation, and analysis of organized fraudulent groups in automobile insurance through
focusing on structural aspects of networks, and cycles in particular, that demonstrate the
occurrence of potential fraud. Suspicious groups have been detected by applying cycle
detection algorithms (using both DFS, BFS trees), afterward, the probability of being
fraudulent for suspicious components were investigated to reveal fraudulent groups with the
maximum likelihood, and their reviews were prioritized. The actual data of Iran Insurance
Company is used for evaluating the provided approach. As a result, the detection of cycles is
not only more efficient, accurate, but also less time-consuming in comparison with previous
methods for finding such groups.

19
De Zoete, Sjerps, Lagnado, Fenton (2015) have found how the use of a Bayesian Network can
interpret the existing evidence in some linked crimes; in fact, they indicate that how this
method can show the similar dependencies and links between crimes in order to identify the
key people. Kose, Gokturk, and Kilic (2015) studied, implemented and evaluated a new
framework for detecting the fraudulent cases involved in these claims, and developed a
structure for introducing new types of fraud. Moreover, used the well-known methods such as
AHP and EM unsupervised ranking to detect abnormalities and increase the accuracy of the
framework. To sum up, although prevalent fraud detection methods, along with
aforementioned weaknesses, are capable of coping with opportunistic fraudulent activities, and
the least number of them have focused on organized collaboration of perpetrators
(sophisticated fraud), our work is completely different.
Kalwihura and Logeswaran (2020) proposes a data pre-processing technique, particularly a
fraud behavior feature engineering approach, to improve the overall performance of prediction
models. The behavior being assessed is be based on the RFM model along with an additional
behavior analysis related to policy expiration. Furthermore, an ensemble feature selection and
modeling is used to deal with the high dimensionality problems that the feature engineering
approach brings along with it, as well as the class imbalance problems. The proposed approach
shows a 56.2% increase in the F1-meaure, compared against the previous published stat-of-
the-art results.
2.4 Effect of Using Customer Relationship Management System on the Underwriting
Process
According to Nagalakshmi and Subramanian (2016), customer relationship management
becomes more important of market but insurance sector; customer relationship management
cannot be achieved without having an effective procedure for redressing the complaints of
dissatisfied customers. The section reviews literature in line with customer relationship
management, it looks at empirical studies linked to sales and customer service CRM Solutions,
and customer complaint management.
20
2.4.1 Customer Relationship Management
Customer information management is critical to understand the breadth of relationships with
customers, the value of customers, and customer needs and preferences (Srinivasa &
Muramalla, 2020). It is imperative that insurers aggregate their customer information to fulfill
these projects and drive tighter relationships with customers (Assad, 201). Without having this,
insurers are crippled, not being able to make accurate decisions on how to treat customers,
ensure customer value, improve marketing and sales effectiveness, ensure positive customer
experiences, and protect their customer base from churn. Customer intelligence must be in
place, and will be a strategic asset for companies that complete customer data integration and
apply customer analytics to their customer data.
CRM in this industry is one of the factors that can affect the supply and demand for life
insurance. Brofer, Rezaeian, and Shokouhyar (2016) suggested in their research that to
maintain customers in life insurance, the company attempts to transform behavioral loyalty of
these customers to attitudinal loyalty through establishing more communications and
interactions with them; this means managing customer relationships in life insurance industry.
The importance of CRM as a comprehensive and strategic process for maximizing customer
value is emphasized by the organization (Kumar, 2017). Accordingly, studies carried out in
relation to the subject of this research are presented as follows.
In a research titled Implementation of CRM Processes in Life Insurance Sector: A Customers’
Perspective Analysis, Kannan & Vikkraman (2016) stated that CRM processes represent the
stages involved in customer relationship management, with a centralized trend from customer
engagement to customer retention. This research analyzed customers’ perspective on CRM
implementation processes by life insurances. The results also indicated that today, life
insurance companies need to develop CRM processes to attract and maintain customers as well
as profitability.
Using Data Mining Techniques, Brofer, Rezaeian, and Shokouhyar (2016) provided an
appropriate model for customer segmentation based on some of the most important financial
and demographic characteristics as factors affecting indices of customer lifetime value (RFM).
In the proposed process of this research, which was implemented in Saman Insurance
Company, after determining values of indexes of the RFM model, including recency,

21
frequency and monetary in 180000 customers and weighting them using hierarchical analysis,
the optimal number of cluster based on silhouette index and the impact of RFM indexes were
determined using the two-step algorithm. In the next step, customers’ clustering was conducted
using the K-means method. Also, key and valuable customers of the company were identified
by prioritization of clusters based on RFM indexes. Using a case study of Iranian insurance
firms, Ziaeifar & Nazeri (2014) investigated the effect of services quality and customer
relationship management on customer loyalty. For this purpose, 120 customers of Iran
Insurance were selected using convenience sampling. The results indicated that service quality
and customer relationship management are respectively 61% and 47% effective on customer
loyalty.
Brain (2015) used a case study of a UK car insurance company to investigate the relationships
among price aggregator (re-intermediation) purchase channel, purchasing habits, marketing
response models, marketing mix variables, business models, and strategic customer
relationship marketing. A wide range of statistical models and data mining tools were applied
to this research, including vector autoregressive (VAR) modelling, general linear regression,
quantile regression, autoregressive, moving average; autoregressive integrated moving
average, Autoregressive conditional heteroskedasticity (GARCH), logistic regression;
decision trees and neural networks models. These methods allowed the researcher to better
understand the new aggregator enriched environment. The analyses showed that price
aggregator channel significantly interact with other channels in influencing the customer
retention rates and life time values available to the company and hence its future growth and
profitability.
2.4.2 Lead Management and Sales
Customer relationship management (CRM) has been a growing priority among life insurers
during the past 10 years. However, unlike the early days when suites were the primary solution
option, insurers are now opting for targeted solutions to support vertical processes unique to
managing field sales, agent and broker management, and customer service via the call center.
By employing CRM, life insurers can improve the relationships with their sales network,
enhance sales efficiency and improve customer experiences. Buttle and Maklan (2015) assert
that empowering the channels with more customer information (including customer analytics

22
and a whole view of the relationship with the customer) and tools to assist in the sales process,
insurers can drive more profitability in sales and customer service processes.
Knowledge related to leads was investigated by Świeczak and Łukowski (2016), as well as
transaction and activity information that could be tied to leads. Empirical research was
conducted through interviews with sales and marketing management and participant
observation. It was found that to best support sales’ lead management work at Metso, the CRM
system should be configured to support collaboration between different stakeholders.
Collaboration was seen as an important part of being able to manage leads through information.
The scope of this thesis was restricted to concentrate on sales’ part of the lead qualification
process, between the phases of lead generation and opportunity management. Extending the
scope to take into account the full range of activities and processes related to, for example, the
REAN framework, would give a better understanding of all activities related to sales leads.
Assad (2015) examined the factors that affect the customer satisfaction and accordingly
influence the behavior of the customers and what are the perceptions of the customers about
the service quality in the insurance companies in Palestine. The study was quantitative and
qualitative, interviews were conducted with the main key players of PIS, a questionnaire was
designed for insurance companies’ customers. Out of 180 questionnaire distributed, 168
questionnaire returned for analysis representing 93% of the sample. The study found a very
strong relationship between overall customer satisfaction and each of the dimensions:
Reliability, Technical Quality, Image quality, and Price Quality. Also, customer satisfaction
affects customer behavioral intentions such that the customers with lower satisfaction are
thinking to switch to use a better insurance company’s service or unlikely to re-purchase
insurance services of the same insurance company.
In the post-liberalization of insurance market in Kenya; one factor that contributes to the
overall performance of insurance players is Customer Relationship Management (CRM). Due
to the increase in number of insurance players and rising awareness among customers about
different products, companies in the insurance sector realize the importance of CRM (Kumar,
2017). CRM allows insurance companies to enable the marketing departments to identify and
target their best customers, manage marketing campaigns with clear goals and objectives, and

23
generate quality leads for the sales team. In the present study, author attempts to analyze the
effectiveness of CRM practices in underwriting processes.
Accordingly, Moradi (2017) investigated the impact of CRM factors on tendency for life
insurance demand in Dana Insurance. The study population included all Dana Insurance clients
in Tehran. A number of 384 questionnaires were randomly distributed among them. To test the
hypotheses, Spearman correlation coefficient test was applied in SPSS. Based on the results
obtained from testing the hypotheses, all CRM factors, namely creating and maintaining
relationships with key customers, organizing business processes, knowledge management and
technology-based CRM have a significant and positive effect on tendency for life insurance
demand. In general, it can be claimed that with increasing customer relationship management
factors in the insurance industry, the demand for life insurance will increase by customers. It
was suggested that researchers investigate the impact of customer relationship management on
other areas of the insurance industry in further research.
2.4.3 Customer Complaint Management
Belay (2018) identified five elements of the motor insurance claim management process at
EIC, which are ‘claim reporting’, ‘response to a claim’, ‘towing damaged vehicle’ ‘damage
assessment’ and ‘repair handling’. The motor insurance claim management included a sixth
process ‘complaint or dispute settlement’ for those raising any. Taking a sample of 102
customers selected using a convenience sampling technique from EIC customers; the research
examined the relationship between the elements of the claim management process and
customer satisfaction. The results indicated that there is a statistically significant correlation
between customer satisfaction and motor insurance claim management processes presented in
their order of Pearson correlation coefficient (repair handling (0.783), damage assessment
(0.745), complaint settlement (0.705), damaged vehicle towing (0.632), claim reporting
(0.540), and response to a claim (0.205) with p< 0.05 or more). Basing this research as a
springboard, further research confirming the result at a broader geographic area and across
other insurance products could be done to cement the findings of this research.
Similarly, The James David Power U.S. (2016) auto claims satisfaction study showed that
drivers of increase in overall satisfaction level were found to be availability of multiple
communication option to report and follow up claims. The study also found that the use of

24
technology to check the status of a claim is relevant for satisfaction. The study also calculated
satisfaction on a 1,000-point scale using dimensions of first notice of loss (claim); service
interaction; appraisal; repair process; rental experience; and settlement to rank motor insurance
service providers. A research conducted by TeleTech to identify what drives customer
satisfaction during the insurance claims process, identified initial filing of the claim, use of
knowledgeable insurance reps, obtaining approval for the claim, overall effort required to file
a claim and initial assignment of the adjustor on the claim as the top reasons for satisfaction
(Belay, 2018).
Choo, Hiltz, and Hiltz (2016) investigated the current sources and causes of online complaints;
sought effective ways of handling customer complaints by examining different product types;
and provided guidelines for successful e-CRM. One thousand customer complaints from three
different publicized e-business customer service centers and five hundred complaints from
online feedback systems were analyzed in this study. The research findings suggested that e-
businesses should provide excellent online customer services because customer service is the
most important factor in online customer satisfaction; respond to customers'
requests/complaints fast because the response speed is more important in online customer
satisfaction than offline; and employ strategies that are appropriate for the product category in
question. This study offers clear theoretical implications pertaining understanding of satisfied
and dissatisfied customers through the use of CRM models.
Kumar and Kaur (2020) carried out a review on past literature on complaint management,
identified from online academic databases like Proquest, Google scholar and Emerald. A total
of 64 conceptual and empirical articles published in the time span 1991-2018 were analyzed
on different classification basis. By analyzing the distribution of articles across different
parameters and highlighting the agenda for future research – the current study will serve as a
valuable tool for researchers to understand the current scenario of complaint management
research in strategic management discipline and take complaint management as a research area
forward.
Yusuf and Ajemunigbohun (2015) conducted a study of effectiveness, efficiency, and
promptness of claims handling process in the Nigerian insurance industry. Using a sample of
107 respondents drawn from claims department of 33 insurance companies and One Sample
25
T-test, he tested two hypotheses. Their finding indicated that that managing claims effectively
and efficiently will significantly affect operational process in claims management and thus,
promptness in claims handling processes does essentially assist in fraud detection and
prevention. Gachau (2015) also tried to examine the impact of service delivery quality on
customer satisfaction in Kenyan Insurance Industry. Using a sample of 64 respondents from
16 insurance companies, the study found out that those who were dissatisfied with the service
offer at the insurance companies cited poor service delivery quality as a reason.
Wendel, De Jong, and Curfs (2017) tested the direct and relative effects of service quality
dimensions on consumer complaint satisfaction evaluations and trust in a company in the
Dutch health insurance market. A cross-sectional survey design was used. Survey data of 150
members of a Dutch insurance panel who lodged a complaint at their healthcare insurer within
the past 12 months were surveyed. The data was collected using a questionnaire containing
validated multi-item measures. Regression analysis was used to examine the relationships
between these variables. Overall, results confirmed the hypothesized direct and relative effects
between the service quality dimensions and consumer complaint satisfaction evaluations and
trust in the company. No support was found for the effect of technical quality on overall
satisfaction with the company. By incorporating the role of digitization as a moderating
variable n the relationship between insurance products and complain handling, the present
study fills the void in service quality dimensions.
Complaint management is a multi-dimensional concept comprising of customer complaint
behavior, complaint handling by firms and post complaint behavior of customers. Complaint
management as a research theme gained pace after the year 1991, however it is mostly
researched in developed countries in west such as USA, UK, Australia and Germany (Agu,
Ogbuji, Okrapa, & Ogwo, 2018). Reviewed literature revealed that no empirical study exists
in Nigeria on this all-important area of marketing theory and practice. This study remains a
hallmark of intellectual exercise and a landmark in this aspect of consumer behavior in Kenya
and the country’s insurance sector. In the recent time, digital complaint-handling system is
increasingly important in assisting companies with customer complaints.

26
The bottom-line is that insurance players have long realized the strategic importance of
customer experience, yet translating this strategy into action and tangible experience for
customers is long overdue. Insurers face increasing competition from in-market and over-the-
top players, which use a “digital-first” approach enabled by software capabilities, new-age
skills and a customer-obsessed mindset. In such a hyper-competitive context, customer
experience is arguably the most fundamental lever for insurers’ survival. The challenge is ever-
increasing customer expectations driven by their exposure to a range of digital-native services
across eco-systems (Little, 2019).
2.5 Chapter Summary
The chapter reviewed empirical studies in the perspective of automation of underwriting
processes. This section reviews literature in connection with claim investigation, claim
processing, and claim settlement with the aid of automation models within the insurance sector.
Secondly insurance companies are increasingly adopting sophisticated technological system in
detecting, analyzing, and reporting fraud related cases. Finally, insurance companies have
embraced CRM solutions as a practice to strengthen customer interactions with the cover
provider. However, it emerges that developing economies like Kenya are yet to adequately
embrace automation as significant processes in underwriting are still manual based. The next
chapter presents the methodology that was pursued by the researcher. The fourth chapter
presents results and findings whereas the last chapter concerns discussion of the obtained
findings, conclusion, and recommendations.

27
CHAPTER THREE
3.0 RESEARCH METHODOLOGY
3.1 Introduction
The chapter provides the research methodology utilized in conducting the research. It identifies
and justifies the research design approach. It also highlights the study population, the sampling
technique as well derivation of the sample size that participated in the study. Additionally, it
explains the data collection methods and the procedures employed in fulfilling the study.
Finally, data analysis including techniques, tools, data presentation, and ethical considerations
are also presented.
3.2 Research Design
This design is the roadmap which the researcher uses in order to obtain the data to answer the
objectives of the research. This captures reliable, unbiased and extremely generalizable results
(Dannels, 2018). Sileyew (2019) stipulates that a very significant decision in research design
process is the choice to be made regarding research approach since it determines how relevant
information for a study was obtained. The purpose of research design is to provide answers to
research question validly, objectively, accurately and economically as well as serve as a control
platform, maximize systemic variance, control extraneous variance and minimize error. It
helps the researcher organize a research study following established guidelines, rules and
procedures (Ebrahim, 2018). Research design is necessary because it makes possible the
smooth sailing of the various research procedures, thereby making research as professional as
possible, yielding maximum information with a minimum resources i.e effort, time and money.
There are four major categories of research design; Exploratory or Formulative Research,
Descriptive Research or Statistical Research, Explanatory Research, and Experimental
Research or Analytical Research (Jongbo, 2017).
The study employed descriptive research design. It is also known as statistical research; it
describes phenomena as they exist (Akhtar, 2016). It is used to identify and obtain information
on characteristic of a particular issue like community, group or people. A descriptive study
may be concerned with the attitude or views (of a person) towards anything (Zikmund,

28
Quinlan, Griffin, Babin, & Carr, 2019). Descriptive research design may be divided into case
studies, naturalistic observation, and surveys (Loeb, Morris, Dynarski, Reardon, & McFarland,
2017). The study adopted descriptive survey design. Descriptive survey research helped in
answering the questions; what, where, when, and how. It is used commonly in the social
sciences like the present study (Atmowardoyo, 2018).
3.3 Population and Sampling Design
3.3.1 Population
According to Cooper and Schindler (2014) a population is the total collection of elements about
which we wish to make inferences. Target population in statistics is the specific population
about which information is desired. Saunders, Lewis, and Thornhill (2016) also define a
population as a well-defined or set of people, services, elements, and events, group of things
or households which were being investigated. The population of interest is the study’s target
population that it intends to study or treat (Asiamah, Mensah, & Oteng-Abayie, 2017).
The target population is the group of individuals that the researcher intends to conduct research
in and draw conclusions from (Barnsbee, Barnett, Halton, & Nghiem, 2018). The target
population for this study was 1174 employees derived and classified from the 5 leading
insurers in Kenya based on 2019 market capitalization. Based on the report by The Association
of Kenya Insurers (2019), approximately 48 percent of the underwriting markets share is
controlled by the top 5 insurance firms.
The population is distributed as shown in the Table 3.1 below.
Table 3.1 : Population Distribution
Insurer Workforce Size Proportion
Jubilee Insurance 148 13%
Britam Insurance 148 13%
APA 358 30%
CIC 332 28%
ICEA Lion 188 16%
Total 1174 100%
Source: Insurance Regulatory Authority (2020)

29
3.3.2 Sampling Design
3.3.2.1 Sampling Frame
A sampling frame is a list of the actual cases from which sample was drawn (Turner, 2020;
Saunders, Lewis, & Thornhill, 2016). The sampling frame must be representative of the
population. As a remedy, researchers seek a sampling frame which has the property that we
identify every single element and include any in the sample. Sampling was employed to make
sure that members of a population is selected as representative of the whole population. A
sampling frame has an implication on the extent to which one can generalize findings from the
sample because within probability sampling defining sampling frame means defining the target
population about which you want to generalize. The sampling frame for this study was a list
of all employees of top 5 leading insurers in Kenya. The list constituted 2528 employees and
was it obtained from the Insurance Regulatory Authority as shown in Table 3.1.
3.3.2.2 Sampling Technique
Sampling is the selection of the subset of the population of interest in a research study
(Taherdoost, 2020). The basic purpose of sampling is to provide an estimate of the population
parameter and to test the hypothesis. Broadly, there two forms of sampling techniques,
probability and non-probability sampling technique. Non-probability sampling can be
performed using; convenience sampling, consecutive sampling, judgmental or purposive
sampling, snowball sampling, and quota sampling (Showkat & Parveen, 2017). Several
methods of probability sampling exist: Simple random sampling, stratified sampling,
systematic sampling, and cluster sampling (Etikan & Bala, 2017). In a probability sample, each
element in sample frame has a known and nonzero chance of selection.
The study used probability sampling. To ensure fair representation and generalization of the
findings to the general population, proportional stratified random sample was used. According
to Taherdoost (2016), proportional stratified sampling is used when the cases in a population
fall into distinctly different categories of a known sample of that population. Since the
proportions of each stratum for the selected insurers is known, then each stratum was
represented in the same proportion within the overall sample. On selection of survey
participants, the study employed simple random sampling; since it limits biasness in the
findings (Baltes & Ralph, 2021; Kabir, 2016).

30
3.3.2.3 Sample Size
A sample refers to a subset of those entities that decisions relate to (Larson–Hall, 2015).
Sample size can be determined in different ways. For small populations, census is preferred.
In addition, the researcher could imitate a sample size of similar studies, use published tables
or apply formula (Singh & Masuku, 2014). Alternatively, sample size can be determined the
statistical formula approach (such as Yamane 1967; Cochran 1977; Ralph, Holleran &
Ramakrishman, 2002). A sample must be carefully selected to be representative of the
population and the researcher needs to ensure that the subdivisions entails in the analysis are
accurately catered for. The sample size calculation depends primarily on the type of sampling
designs used (Morgan, 2017). However, for all sampling designs, the estimates for the expected
sample characteristics (e.g. mean, proportion or total) desired level of certainty, and the level
of precision must be clearly specified in advanced (Majid, Ennis, & Bhola, 2018). The
statement of the precision desired might be made by giving the amount of error that the
researcher is willing to tolerate in the resulting estimates. Common levels of precisions are 5%
and 10%. The sample size for this study comprised 298 respondents based in Nairobi. In this
study, the sample size was statistically determined using formula method. Thus, the sample
size was determined using the formula of Yamane (1973). The researcher used a confidence
level of 95% and a margin of error of 5% while calculating the sample size as indicated below:
n = N
1 + N (e2)
n = 1174
1 + 1174 (0.052)
= 298 respondents
Where;
n = Sample size to be studied
N = Population size
e = Acceptable error 0.05

31
The estimated sample size was distributed proportionately to the size of the population. Table
3.2 illustrates the sample size distribution for this study.
Table 3.2: Sample Size Distribution
Insurer Workforce Size Proportion Sample Size
Jubilee Insurance 148 13% 26
Britam Insurance 148 13% 26
APA 358 30% 108
CIC 332 28% 94
ICEA Lion 188 16% 44
Total 1174 100% 298
Source: Insurance Regulatory Authority (2020)
3.4 Data Collection Methods
Data collection is the process of gathering quantitative and qualitative information on specific
variables with the aim of evaluating outcomes or gleaning actionable insights (Parveen &
Showkat, 2017). Fundamentally, there are two major categories for collecting data;
quantitative and qualitative (Bailey, 2015). Quantitative method can be organized into
questionnaire, experiments, and surveys, whereas, qualitative method can be split into in-depth
interview, observation methods, and document review (Kabir, 2016). Quantitative data focus
more on the number of respondents with majority having similar opinion about the same
phenomenon concerning automation of underwriting processes and financial performance of
the insurance company (Bakker, 2019).
This study employed primary data collection using questionnaires. A questionnaire is a general
term that includes all techniques of collecting data whereby respondents were asked the same
set of questions following a predefined follow (Saunders, Lewis, & Thornhill, 2016). The
questionnaire entailed both open and closed ended questions in line with the objectives of the
study. The choice of this method is based on the premise that data collected using a
questionnaire could easily be understood and therefore perceived as authoritative.
Questionnaires often make use of checklist and rating scales. These devices help simplify and
quantify people's behaviors and attitudes. The advantages of employing questionnaire in data
collection include; it can be sent to a large number of people, it saves the researcher time and

32
money compared to interviewing. Additionally, respondents are more truthful while
responding to the questionnaires regarding controversial issues in particular due to the fact that
their responses are anonymous.
The study adopted a structured questionnaire. The study employed structured questionnaire
since it requires lower cognitive load on the respondent (Jossey-Bass & Adams, 2019).
Secondly, a structured questionnaire is easier for the researcher to code and analyze. The
questionnaire was organized into five sections. The first section captured background
information of the respondents. The second section is about items related to digitization of
claim processing and effectiveness of underwriting process. The third section presents
statements related to digitization of fraud detection and effectiveness of underwriting process.
The fourth section entails items on customer relationship management system and
effectiveness of underwriting process. The last section is about level of insurers as a result of
automating the underwriting process as experienced through performance in the recent years.
3.5 Research Procedures
Research procedures consist of certain structural process or steps to carry out research
effectively. Research process has several crucial steps (Bist, 2015). The steps involved are;
development of questionnaire, acquisition of research permit, conducting of pilot study, and
conducting of actual study, and finally, coding, analysis, interpretation, and presentation of the
findings. Upon the acceptance of the proposal by the institutional review board, the researcher
was issued with the letter of introduction which stipulates the purpose of undertaking this
exercise. The researcher obtained research permit from National Commission for Science,
Technology and Innovation (NACOSTI) and the introduction letter from Chandaria School of
Business (CSB). The two documents were presented to the management of the top five selected
insurers in Nairobi City.
The questionnaire for this study was structured based on the research questions and was pre-
tested to determine its suitability before distribution to the sampled respondents. This enhanced
reliability of the questionnaire as an instrument for data collection as recommended by Sürücü
and Maslakç (2020). According to Taherdoost (2016), the quality of a measuring instrument

33
informs the reliability and validity of the undertaken statistical measures. According to
Saunders, Lewis, and Thornhill (2016), reliability is primarily concerned with robustness of
the questionnaire and whether or not it would produce consistent findings at different times
and conditions such as that of different samples and under different interviewers. One of the
methods for enhancing the reliability of the questionnaire is to carry out a pretesting exercise
before the actual data collections starts.
The validity of the research instrument is determined by pre-testing the instrument and the
identification of any irrelevant and ambiguous questions to make the necessary modifications
(Cooper & Schindler, 2014). A pilot study is a small feasibility study designed to test various
aspects of the methods planned for a larger, more rigorous, or confirmatory investigation
(Junyong, 2017). Study piloting enables fine-tuning the questionnaire for objectivity and
efficiency of the process (Fraser, Fahlman, Arscott, & Guillot, 2018). Pretesting for this study
was carried out by administering the questionnaire to twenty-nine (29) respondents, which was
approximately 10% of the sample size. The participants were selected randomly from the
sample size. The questionnaire took 10 to 15 minutes to complete. The questionnaire was
distributed to respondents by using a drop and pick approach at the designated offices of the
selected insurers. In terms of reliability of the piloted data, Cronbach’s Alpha was used to
conduct the reliability analysis. The alpha values range from 0 to 1 and reliability increases
with the rise in the values. Cronbach’s Alpha coefficient value of 0.6 - 0.7 indicates acceptable
reliability whereas value 0.8 or higher indicates good reliability (Kothari, 2019). The
researcher was interested in getting feedback on clarity of the questions as well as determine
if there is any ambiguity that would lead to misinterpretation of the questions and thus provide
conflicting answers, hence ensuring content validity. In addition, an overall Content Validity
Index (CVI) of 0.737 was obtained, which was more than 0.5 and therefore content validity
was ensured, as shown in Table 3.3 below.
Table 3.3: Validity of the Questionnaire
Variable No. of Items CVI
Digital Claim Processes 12 0.648
Digital Fraud Detection 12 0.777
Customer Relationship Management System 12 0.704
Underwriting Process 10 0.819
Overall 46 0.737
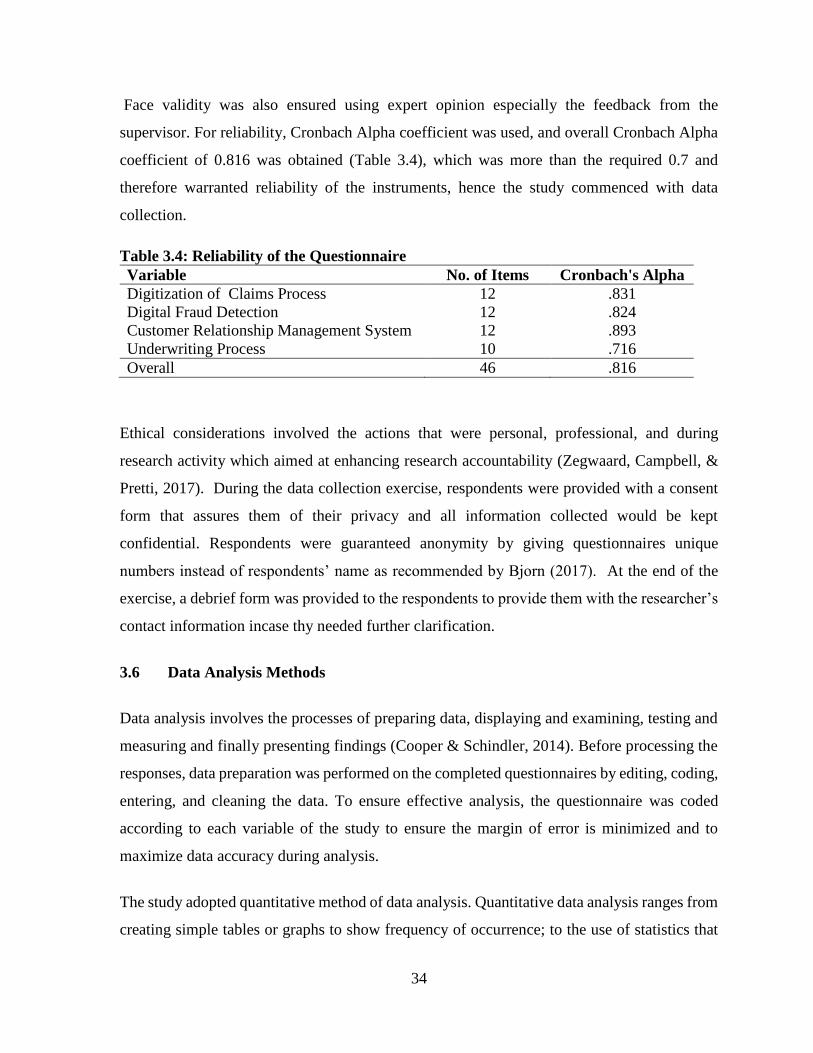
34
Face validity was also ensured using expert opinion especially the feedback from the
supervisor. For reliability, Cronbach Alpha coefficient was used, and overall Cronbach Alpha
coefficient of 0.816 was obtained (Table 3.4), which was more than the required 0.7 and
therefore warranted reliability of the instruments, hence the study commenced with data
collection.
Table 3.4: Reliability of the Questionnaire
Variable No. of Items Cronbach's Alpha
Digitization of Claims Process 12 .831
Digital Fraud Detection 12 .824
Customer Relationship Management System 12 .893
Underwriting Process 10 .716
Overall 46 .816
Ethical considerations involved the actions that were personal, professional, and during
research activity which aimed at enhancing research accountability (Zegwaard, Campbell, &
Pretti, 2017). During the data collection exercise, respondents were provided with a consent
form that assures them of their privacy and all information collected would be kept
confidential. Respondents were guaranteed anonymity by giving questionnaires unique
numbers instead of respondents’ name as recommended by Bjorn (2017). At the end of the
exercise, a debrief form was provided to the respondents to provide them with the researcher’s
contact information incase thy needed further clarification.
3.6 Data Analysis Methods
Data analysis involves the processes of preparing data, displaying and examining, testing and
measuring and finally presenting findings (Cooper & Schindler, 2014). Before processing the
responses, data preparation was performed on the completed questionnaires by editing, coding,
entering, and cleaning the data. To ensure effective analysis, the questionnaire was coded
according to each variable of the study to ensure the margin of error is minimized and to
maximize data accuracy during analysis.
The study adopted quantitative method of data analysis. Quantitative data analysis ranges from
creating simple tables or graphs to show frequency of occurrence; to the use of statistics that

35
enable comparisons by establishing relationships between variables (Saunders, Lewis, &
Thornhill, 2016). The quantitative analyses utilized for this study were descriptive and
inferential statistics. According to Yamane (1973), descriptive statistics involve a process of
transforming a mass of raw data in to tables, charts, with frequency distribution and
percentages, which formed a vital part of making sense of the data. Consequently, inferential
statistics entailed correlation and regression analyses. Data was analyzed using SPSS program
and presented using tables and pie charts to give a clear understanding of the research findings.
Besides, the direction and strength between independent variables (claim processing, fraud
detection, and customer relationship management) and dependent variable (effectiveness of
underwriting processes) were assessed through the Pearson’s correlation coefficient (Schober,
Boer, & Schwarte, 2018). It measures the strength of the linear relationship between normally
distributed variables which are ordinal in nature. In this case, it was hypothesized that data for
the study would be normally distributed.
In order to analyze the effect of independent variables on effectiveness of underwriting
processes among insurers in Kenya and their relationship, the research adopted the linear
regression model. Prior to conducting linear regression analysis, the following statistical tests
were used to test the assumptions for linear regression analysis: Kolmogorov-Smirnov Test
and the Shapiro-Wilk Test were employed in testing for normality of the data; multi-
collinearity was tested using correlation matrix and correlation coefficients of less than .80.
Finally, the linearity assumption was tested with scatter plots. The researcher determined the
nature of relationship between the dependent variable and the independent variable using
simple linear regression model:
The study used the following regression model to examine the effect of digitization of claims
process on the underwriting process among top five insurance firms in Nairobi county:
Y = B0 +B1X1 + ϵ
Where:
Y = Underwriting process

36
X1 = Digitization of claims
B0 = Constant
B1=Regression coefficient of digitization of claims
ϵ = Residual error
The study used the following regression model to examine the effect of digital fraud detection
on the underwriting process among top five insurance firms in Nairobi county.
Y = B0 +B2X2 + ϵ
Where:
Y = Underwriting process
X1 = Digital fraud detection
B0 = Constant
B1=Regression coefficient of digital fraud detection
ϵ = Residual error
The study used the following regression model to examine the effect of using customer
management system on the underwriting process among top five insurance firms in Nairobi
county.
Y = B0 +B3X3 + ϵ
Where:
Y = Underwriting process
X1 = Using customer management system
B0 = Constant
B1=Regression coefficient of using customer management system
ϵ = Residual error

37
3.7 Chapter Summary
The chapter provides descriptive design as research strategy of interest. The target population
involved 1174 staff of the five leading insurance firms in Nairobi County. Additionally, the
chapter discusses the sampling frame with the sampling technique of stratified sampling since
the study population could be categorized into 5 strata. the sample size is estimated at 298 and
data was collected via structured questionnaire. Analysis of data was based on both descriptive
and inferential statistics. The next chapter presents the results and findings based on the
research questions.

38
CHAPTER FOUR
4.0 RESULTS AND FINDINGS
4.1 Introduction
This chapter gives the presentation of the analyzed data and interpretation of the findings
obtained from the field. It presents general information of the participants and the findings of
the analysis based on the specific objectives of the study. The chapter also presents a summary
of key findings and the chapter summary. Descriptive and inferential statistics have been used
to present the findings of the study.
4.2 General Information
This section presents the response rate and other demographic findings for the study
respondents such as; identity of the insurer, the number of operation in the local market,
workforce size, the level of technology adoption, duration of handling claim management, as
well as profitability of the insurers.
4.2.1 Response Rate
The study targeted to collect data from a sample size of 298 staff from top five insurance firms
in Nairobi County from which 236 filled in and returned the questionnaires making a response
rate of 79%. This response rate was satisfactory to make conclusions for the study as it was
representative enough. Based on this assertion, the response rate for the study was excellent.
Figure 4.1 below demonstrates the response rate for the study.
Figure 4.1: Response Rate
298
(100%)
236
(79%)
62
(21%)
0
50
100
150
200
250
300
350
Total Questionnaires Sent Total Questionnaires Filled and
Returned
Total Not Filled
Questionnaires

39
4.2.2 Insurance Provider
The study sought to determine the identity of the insurer of the respondents who participated
in the study. The findings in Figure 4.2 indicate that majority of the insurance providers were
drawn from Britam -28%, 22% were representatives from Jubilee Insurance, ICEA Lion
ranked third at 20%, CIC came fourth at 16% and lastly APA closed the chapter for top five
insurance firms in Nairobi at 14%.
Figure 4.2: Insurance Provider
4.2.3 Years of Operation in The Local Market
The study also sought to determine the determine the number of years that the insurer had
operated in the Kenyan market of the respondents who participated in the study. The results in
Figure 4.3 indicates the number of years that the insurers had operated in the Kenyan market.
Encouragingly, most of the firms had operated for a period more than 31 years, 29% had
existed in Kenya for a period of 21-30 years, 15% for 11-20 years whereas only 11% had
operated in Kenya for ten or lesser years.
65
(28%) 48
(20%)
52
(22%)
38
(16%) 33
(14%)
-
10.00
20.00
30.00
40.00
50.00
60.00
70.00
80.00
0
10
20
30
40
50
60
70
Britam ICEA Jubilee CIC APA

40
Figure 4.3: Years of Operation in Local Market
4.2.4 Number of Employees
It was necessary to establish the number of employees for every insurance firm. It was
established that the majority had more than 350 employees, 18% had 200-250 and 301-350
each, 12% had 251-300 whereas 9% had less than 200 employees. With large workforce size,
the insurers had strong high volume claim processing, fraud detection, and large scale customer
relationship management practices. The results are summarized in Figure 4.4.
Figure 4.4 : Number of Employees
4.2.5 Level of Technology Adoption
The study also sought to determine the extent to which insurance firms had adopted
technological practices. More than half of the respondents indicated high level of
implementation, 20% advanced level, 15% medium extent and 9% low level of
105
(44%)
69
(29%)
35
(15%)
27
(11%)
- 20.00 40.00 60.00 80.00 100.00 120.00 140.00
0 20 40 60 80 100 120
31 Above
21-30
11_20
1_10
102
(43%)
21
(9%)
42
(18%) 29
(12%)
42
(18%)
-
20.00
40.00
60.00
80.00
100.00
120.00
140.00
0
20
40
60
80
100
120
Above 350 Less than 200 200-250 251-300 301-350

41
implementation as reflected in Figure 4.5. With majority of the firm still struggling with
medium to high implementation, there is need to advance and prioritize digitization in the
insurer’s annual budget.
Figure 4.5: Level of Technology Implementation
4.2.6 Duration for Handling Aspects of Claim Management
The study sought to determine the duration of handling aspects of claim management by
the respondents who participated in the study. The findings in Table 4.1 indicates the
approximated time taken to accomplish the claim management process. Claim notification
takes minimum number of days whereas payment of claims takes the longest duration. On
average, it takes nearly 7 weeks to settle a single claim.
Table 4.1: Duration for Handling aspects of Claim Management
Claim Management
Variable
Number of Days
Days
(Average)
Frequency Percentage (%)
Claims notification process 4 45 19%
Verification of records 14 52 22%
Claims reserving 5 36 15%
Negotiation of payment 10 44 19%
Payment of Claims 15 59 25%
Total 48
22
(9%)
36
(15%)
131
(56%)
47
(20%)
-
20.00
40.00
60.00
80.00
100.00
120.00
140.00
160.00
0
20
40
60
80
100
120
140
Low level of
Implementation
Medium level of
Implementation
High level of
Implementation
Advanced level of
Implementation
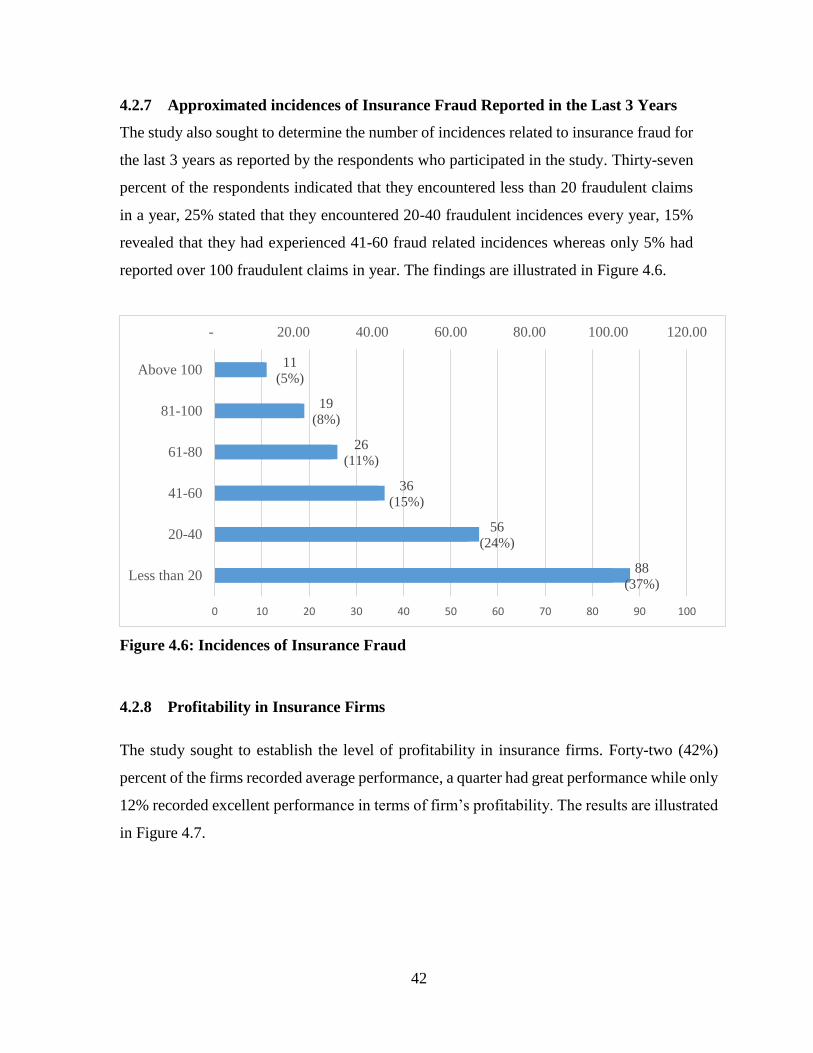
42
4.2.7 Approximated incidences of Insurance Fraud Reported in the Last 3 Years
The study also sought to determine the number of incidences related to insurance fraud for
the last 3 years as reported by the respondents who participated in the study. Thirty-seven
percent of the respondents indicated that they encountered less than 20 fraudulent claims
in a year, 25% stated that they encountered 20-40 fraudulent incidences every year, 15%
revealed that they had experienced 41-60 fraud related incidences whereas only 5% had
reported over 100 fraudulent claims in year. The findings are illustrated in Figure 4.6.
Figure 4.6: Incidences of Insurance Fraud
4.2.8 Profitability in Insurance Firms
The study sought to establish the level of profitability in insurance firms. Forty-two (42%)
percent of the firms recorded average performance, a quarter had great performance while only
12% recorded excellent performance in terms of firm’s profitability. The results are illustrated
in Figure 4.7.
88
(37%)
56
(24%)
36
(15%)
26
(11%)
19
(8%)
11
(5%)
- 20.00 40.00 60.00 80.00 100.00 120.00
0 10 20 30 40 50 60 70 80 90 100
Less than 20
20-40
41-60
61-80
81-100
Above 100

43
Figure 4.7: Profitability of Insurers
4.3 Effect of Digitization of Claims Process on Underwriting Processes
4.3.1 Descriptive Findings on Digitization of Claims Process
The respondents were asked to give their level of agreements with digital claim processing
statements that were adopted by insurers using a scale that ranged between 1 to 5, where 1=
very low, 2= low, 3= medium, 4= high and 5= very high. The highest mean was obtained from
the statement: Automation has enabled synchronization of several claims for payment (M =
4.43, SD = 0.71); The insurer has comprehensively adopted digital claim processing procedure
(M = 3.95, SD = 0.97) attracted the lowest mean. The overall mean for all statements was 4.23
(SD = 0.80). The standard deviations obtained were less than 1 indicating that there were little
variations in responses from the mean value. Table 4.2 below gives results obtained, in
accordance to the data collected by a Likert scale tool.
16
(7%)
33
(14%)
100
(42%)
58
(25%)
29
(12%)
- 20.00 40.00 60.00 80.00 100.00 120.00 140.00
- 20.00 40.00 60.00 80.00 100.00 120.00 140.00
1
2
3
4
5

44
Table 4.2: Descriptive Statistics on Digitization of Claims Process
Statement on Digitization of Claims Processing Level of Agreement
Mean
SD Very
Low
Low Medium High Very
High
Automation ensures that the insured provide accurate information which is verifiable
during investigation.
f 2 0 38 100 96
4.22
0.77 % 0.8 0 16.1 42.4 40.7
Automation significantly reduces response time to insurance claim related matters f 0.0 2 26 100 108
4.33 0.70 % 0.0 0.8 11 42.4 45.8
Automation aids storage of preliminary searchers regarding the claim. f 0 0 28 90 116
4.38 0.69 % 0.0 0.0 11.9 38.1 49.2
Automation enhances access to timely information that boosts evidence on legitimacy f 2 2 20 88 0
4.40 0.75 % 0.8 0.8 8.5 37.3 0.0
Significant transactions with related parties, contingent
liabilities, are extensively disclosed in generated reports
f 8 14 32 106 74 3.96 1.00
% 3.4 5.9 13.6 44.9 31.4
The insurer has comprehensively adopted digital claim processing procedure. f 4 12 58 80 82
3.95 0.97 % 1.7 5.1 24.6 33.9 34.7
Automation of claim processing has improved the customer onboarding process f 0 4 32 106 94
4.23 0.74 % 0.0 1.7 13.6 44.9 39.8
Digital claim processing gives the insurer flexibility to customize insurance products
according to customer needs
f 0 4 22 94 114 4.36 0.72
% 0.0 1.7 9.3 39.8 48.3
Automation has enabled synchronization of several claims for payment f 0 6 12 92 126
4.43 0.71 % 0.0 2.5 5.1 39 53.4
Digitized claims are paid on a first come first pay basis f 6 4 42 108 76
4.03 0.89 % 2.5 1.7 17.8 45.8 32.2
Automated claims workflow allows the customer to keep track of the progress made on
the claim settlement process without having to visit the branch f 2 12 20 106 94 4.19 0.86
% 0.8 5.1 8.5 44.9 39.8
Automated claims management process has robust validation process that shortens the
validation phase
f 2 6 20 108 100 4.26 0.79
% 0.8 2.5 8.5 45.8 42.4
Through technology, insurance innovation capabilities have increased with the
insurer releasing better policies to the market.
f 16 43 81 101 87 3.75 0.98
% 4.9 13.1 24.7 30.8 26.5
Composite mean and Standard deviation 4.23 0.80

45
4.3.2 Correlation between Digitization of Claims Process and Underwriting Processes
The study sought to establish correlation between digitization of claims process and
underwriting processes. Correlation was employed in this study to examine the association
between the independent variable (digitization of claims process) with the dependent variable
(underwriting processes). The correlation test was conducted at 5% level of significance with
a 2-tailed test. Thus, the significance critical value was set at 0.025 above which the association
is deemed to be insignificant and vice versa. The findings illustrated in Table 4.3 below show
that digitization of claims process used had a weak positive and significant association with
the underwriting processes, r (236) = .361, p < .05.
Table 4.3: Correlation between Digitization of Claims Process and Underwriting
Processes
Digitization of
Claims Process
Underwriting
Process
Digital Claim Processing Pearson Correlation 1 .361**
Sig. (2-tailed) .000
Sum of Squares and Cross-
products
73.576 28.703
Covariance .313 .122
N 236 236
Underwriting Process Pearson Correlation .361** 1
Sig. (2-tailed) .000
Sum of Squares and Cross-
products
28.703 85.987
Covariance .122 .366
N 236 236
**. Correlation is significant at the 0.05 level (2-tailed).
4.3.3 Tests for the Assumptions of Linear Regression between Digitization of Claims Process
and Underwriting Process
Before regression analysis was conducted, the assumptions of regression model were
conducted to determine the suitability of the test before it was used to deduce inferences in the
study.

46
4.3.3.1 Test for Normality for Digitization of Claims Process Variable
The Table 4.4 presents the results from two well-known tests of normality, namely the
Kolmogorov-Smirnov Test and the Shapiro-Wilk Test. The data suggests that digitization of
claims process were not normally distributed, 𝑝 < .05
Table 4.4: Tests of Normality for Digitization of Claims Process Variable
Kolmogorov-Smirnova Shapiro-Wilk
Statistic df Sig. Statistic df Sig.
Digital Claim
Processing
.093 236 .000 .951 236 .000
a. Lilliefors Significance Correction
4.3.3.2 Test for Linearity between Digitization of Claims Process and Underwriting
Process
Test for Linearity means that the independent variables in the regression have a straight-line
relationship with the dependent variable. The findings in Table 4.5 demonstrate that there was
linear relationship between digitization of claims process and underwriting process (𝐹 (25,
209) = 40.578, < .05). The assumption that the independent and dependent variables must have
a linear relationship was not violated and regression analysis can be computed between these
variables.
Table 4.5: Linearity Test between Digitization of Claims Process and Underwriting
Process
Sum of
Squares df
Mean
Square F Sig.
Underwriting Process *
Digital Claim Processing
Between
Groups
(Combined) 28.313 26 1.089 3.946 .000
Linearity 11.197 1 11.197 40.578 .000
Deviation
from
Linearity
17.115 25 .685 2.481 .000
Within Groups 57.674 209 .276
Total 85.987 235

47
4.3.3.3 Test for Homoscedasticity for Digitization of Claims Process and Underwriting
Process
The study findings had the homoscedasticity test evaluated for pairs of variables using the
Scatterplot. The data in Figure 4.8 does not follow a specific pattern hence there is no
heteroscedasticity effect. Thus, this data could be used to perform a normal type of linear
regression because the variance does not vary. The results obtained therefore indicate that the
variance is homogeneous and regression analysis can be applied in the study.
Figure 4.8: Homoscedasticity Test for Digitization of Claims Process
4.3.3.4 Test for Multicollinearity for Digitization of Claims Process and Underwriting
Process
The researcher used the VIF values to check for multicollinearity. The findings show that the
VIF value for digitization of claims process used variable was 1.00, which was between 1 and
5, which indicate absence of multicollinearity. Regression analysis could therefore be
conducted. The findings are shown in Table 4.6.

48
Table 4.6: Multicollinearity Test for Digitization of Claims Process and Underwriting
Process
Model
Unstandardized
Coefficients
Standardized
Coefficients
t Sig.
Collinearity
Statistics
B
Std.
Error Beta Tolerance VIF
1 (Constant) 1.990 .281 7.080 .000
Digital Claim
Processing
.390 .066 .361 5.919 .000 1.000 1.000
a. Dependent Variable: Underwriting Process
4.3.4 Regression Analysis Tests for Digitization of Claims Process and Underwriting
Process
This section presents the R square value for regression model summary, F statistics for
regression ANOVA and t-test statistics for regression coefficient for the linear relationship
between digitization of claims process and underwriting process among insurers in the Nairobi
County.
4.3.4.1 Regression Model Summary for Digitization of Claims Process and
Underwriting Process
The finding in Table 4.7 shows the model summary of the regression analysis. As illustrated
in the Table 4.8 below, the predictor variable (digitization of claims process) explains 13.0%
of the variation in the underwriting processes among insurers in Nairobi County (𝑅2 =
.130, 𝐹(1,236) = 35.035, 𝑝 < .05).
Table 4.7: Regression Model Summary for Linear Relationship between Digitization of
Claims Process and Underwriting Processes
Model R
R
Square
Adjusted
R
Square
Std.
Error of
the
Estimate
Change Statistics
Durbin-
Watson
R
Square
Change
F
Change df1 df2
Sig. F
Change 1 .361a .130 .127 .56534 .130 35.035 1 234 .000 1.318
a. Predictors: (Constant), Digital Claim Processing
b. Dependent Variable: Underwriting Process

49
4.3.4.2 Regression ANOVA for Digitization of Claims Process and Underwriting Process
As shown in Table 4.8, the p-value (0.000) was less than the significance level (0.05) which
shows that there was a statistical and significant linear relationship between digitization of
claims process and the underwriting processes (𝐹(1,236) = 35.035, 𝑝 < .05).
Table 4.8: Regression ANOVA for Linear Relationship between Digitization of Claims
Process and Underwriting Processes
Model
Sum of
Squares df Mean Square F Sig.
1 Regression 11.197 1 11.197 35.035 .000b
Residual 74.789 234 .320
Total 85.987 235
a. Dependent Variable: Underwriting Process
b. Predictors: (Constant), Digital Claim Processing
4.3.4.3 Regression Coefficients for Digitization of Claims Process and Underwriting
Process
The regression coefficient findings shown in Table 4.9 below indicate that digitization of
claims process had a statistical and significant positive effect on the underwriting processes in
Nairobi County (𝛽 = .361, 𝑡(234) = 5.919, 𝑝 < .05).
Table 4.9: Regression Coefficients Values for Linear Relationship between Digitization
of Claims Process and Underwriting Processes
Model
Unstandardized
Coefficients
Standardized
Coefficients
t Sig.
95.0% Confidence
Interval for B
B
Std.
Error Beta
Lower
Bound
Upper
Bound
1 (Constant) 1.990 .281 7.080 .000 1.436 2.544
Digital Claim
Processing
.390 .066 .361 5.919 .000 .260 .520
a. Dependent Variable: Underwriting Process
A linear regression model for Table 4.8 was adopted and is as shown below:
𝑈𝑛𝑑𝑒𝑟𝑤𝑟𝑖𝑡𝑖𝑛𝑔 𝑃𝑟𝑜𝑐𝑒𝑠𝑠𝑒𝑠 = 1.990 + 0.390 × 𝐷𝑖𝑔𝑖𝑡𝑖𝑧𝑎𝑡𝑖𝑜𝑛 𝑜𝑓 𝐶𝑙𝑎𝑖𝑚𝑠 𝑃𝑟𝑜𝑐𝑒𝑠𝑠
This implies that a unit increase in digital claim processing contributed to 0.390 linear change
in the underwriting processes in Nairobi County.

50
4.4 Effect of Digital Fraud Detection on the Underwriting Process
4.4.1 Descriptive Findings on Digital Fraud Detection
The respondents were asked to give their level of agreements with digital fraud detection
statements that were adopted by insurers using a scale that ranged between 1 to 5, where 1=
strongly disagree, 2= disagree, 3= neutral, 4= agree and 5= strongly agree. The study found
the highest mean linked with the to the following statements: General insurance policies record
the greatest number of fraudulent claims (M = 4.39, SD = 0.78); The lowest mean was attributed
to the statement: Life assurance policies record the greatest number of fraudulent claims (M =
2.86, SD = 1.23). The overall mean for all statements was 3.79 (SD = 0.93). The standard
deviations obtained were less than 1 indicating that there were few variations in responses from
the mean value. Table 4.10 below gives results obtained, in accordance to the data collected
by a Likert scale tool.

51
Table 4.10: Descriptive Statistics on Digital Fraud Detection
Statement on Digital Fraud Detection Level of Agreement
Mean
SD Strongly
Disagree
Disagree Neutral Agree Strongly
Agree
The insurer encounters the risk of
inability to meet claims due to
fraudulent claims.
f 8 34 48 98 48
3.61
1.07 % 3.4 14.4 20.3 41.5 20.3
General insurance policies record the
greatest number of fraudulent claims.
f 0 8 20 80 128 4.39 0.78
% 0.0 3.4 8.5 33.9 54.2
Life assurance policies record the
greatest number of fraudulent claims.
f 20 100 46 34 36 2.86 1.23
% 8.5 42.4 19.5 14.4 15.3
The insurer registers multiple fraud
incidences every quarter
f 18 70 26 110 12 3.12 1.12
% 7.6 29.7 11 46.6 5.1
The insurer capitalizes on technology
to strengthen internal controls
f 8 10 12 145 61 4.02 0.89
% 3.4 4.2 5.1 61.4 25.8
The insurer has established monitoring
system to detect fraud
f 10 24 30 136 36 3.69 0.99
% 4.2 10.2 12.7 57.6 15.3
Technology aids reporting of fraud
losses to the auditors, AKI, and IRA
f 4 12 30 124 66 4.00 0.88
% 1.7 5.1 12.7 52.5 28
Automation enables prompt reporting
of suspected fraud cases to the IFIU
f 4 8 40 132 52 3.93 0.82
% 1.7 3.4 16.9 55.9 22
All our financial statements are
published online through a working
website platform.
f 4 6 12 126 88 4.22 0.80
% 1.7 2.5 5.1 53.4 37.3
Targeted training on fraud prevention/
management is undertaken online.
f 2 12 18 120 84
4.15
0.83 % 0.8 5.1 7.6 50.8 35.6
The insurer employs digital screening
techniques of potential policy holders
f 0 36 30 134 36
3.72
0.90 % 0.0 15.3 12.7 56.8 15.3
Technology is employed in providing
early warning to the underwriters of the
looming fraudulent claim
f 0 28 40 116 52
3.81
0.91
% 0.0 11.9 16.9 49.2 22
There is a high chances of re-
purchase of insurance cover from this
insurer.
f 4 38 56 124 14
3.45 0.89 % 1.7 16.1 23.7 52.5 5.9
Composite mean and Standard
deviation
3.79 0.93

52
4.4.2 Correlation between Digital Fraud Detection and Underwriting Process
The study sought to establish correlation between banking digital fraud detection and
underwriting process. Correlation was employed in this study to examine the association
between the independent variable (digital fraud detection) with the dependent variable
(underwriting process). The correlation test was conducted at 5% level of significance with a
2-tailed test. Thus, the significance critical value was set at 0.025 above which the association
is deemed to be insignificant and vice versa. The findings illustrated in Table 4.11 below show
that digital fraud detection had a moderate positive and significant association with the
underwriting process, r(236) = .460, p < .05.
Table 4.11: Correlation between Digital Fraud Detection and Underwriting Process
Correlations
Underwriting
Process Fraud Detection
Underwriting Process Pearson Correlation 1 .460**
Sig. (2-tailed) .000
Sum of Squares and Cross-
products
85.987 27.802
Covariance .366 .118
N 236 236
Fraud Detection Pearson Correlation .460** 1
Sig. (2-tailed) .000
Sum of Squares and Cross-
products
27.802 42.451
Covariance .118 .181
N 236 236 **. Correlation is significant at the 0.01 level (2-tailed).
4.4.3 Tests for Assumptions of Regression for Digital Fraud Detection and Underwriting
Process
Before regression analysis was conducted, the assumptions of regression model were
conducted to determine the suitability of the test before it was used to deduce inferences in the
study.

53
4.4.3.1 Test for Normality Digital Fraud Detection Variable
Table 4.12 presents the results from two well-known tests of normality, namely the
Kolmogorov-Smirnov Test and the Shapiro-Wilk Test. The data suggests that digital fraud
detection were not normally distributed, 𝑝 < .05
Table 4.12: Normality Test for Digital Fraud Detection Variable
Kolmogorov-Smirnova Shapiro-Wilk
Statistic df Sig. Statistic df Sig.
Digital Fraud
Detection
.102 236 .000 .982 236 .005
a. Lilliefors Significance Correction
4.4.3.2 Test for Linearity between Digital Fraud Detection and Underwriting Process
Test for Linearity means that the independent variables in the regression have a straight-line
relationship with the dependent variable. The findings in Table 4.13 demonstrate that there was
linear relationship between digital fraud detection and underwriting process (𝐹 (23, 211) =
69.880, < .05). The assumption that the independent and dependent variables must have a linear
relationship was not violated and regression analysis can be computed between these variables.
Table 4.13: Linearity Test for Digital Fraud Detection and Underwriting Process
Sum of
Squares Df
Mean
Square F Sig.
Underwriting
Process * Digital
Fraud Detection
Between
Groups
(Combined) 31.007 24 1.292 4.958 .000
Linearity 18.209 1 18.209 69.880 .000
Deviation from
Linearity
12.798 23 .556 2.136 .003
Within Groups 54.980 211 .261
Total 85.987 235
4.4.3.3 Test for Homoscedasticity for Digital Fraud Detection and Underwriting Process
The study findings had the homoscedasticity test evaluated for pairs of variables using the
Scatterplot. The data in Figure 4.10 does not follow a specific pattern hence there is no
heteroscedasticity effect. Thus, this data could be used to perform a normal type of linear
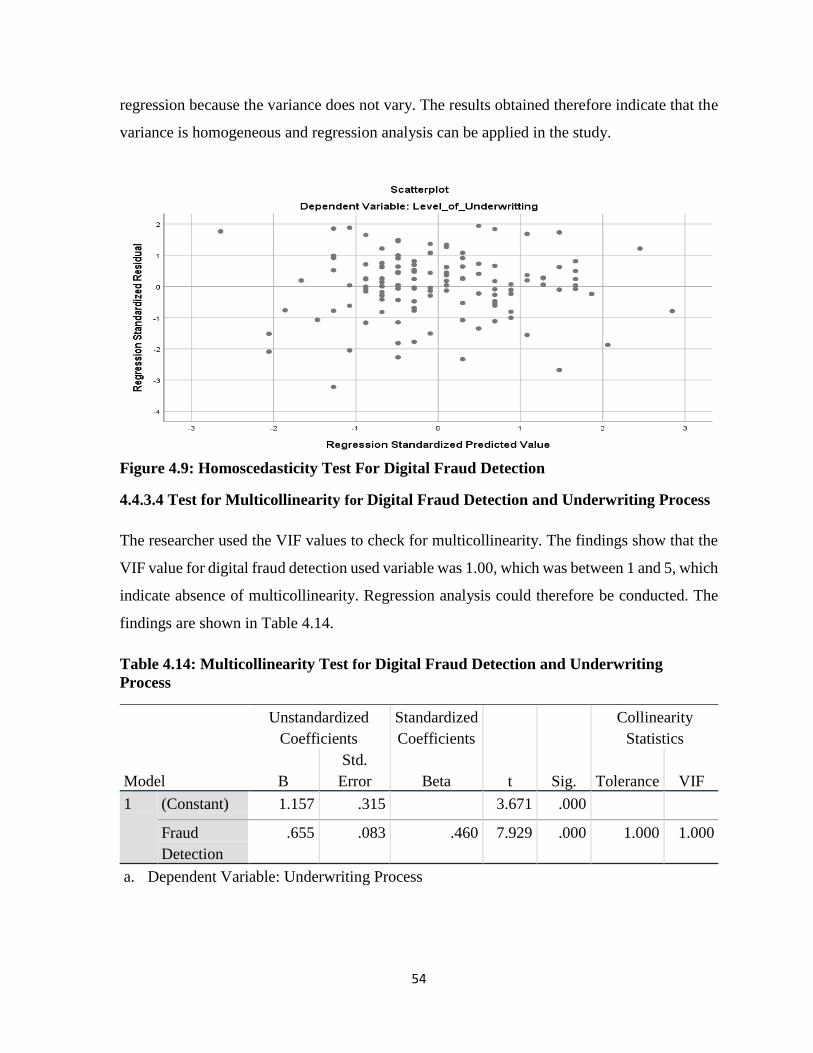
54
regression because the variance does not vary. The results obtained therefore indicate that the
variance is homogeneous and regression analysis can be applied in the study.
Figure 4.9: Homoscedasticity Test For Digital Fraud Detection
4.4.3.4 Test for Multicollinearity for Digital Fraud Detection and Underwriting Process
The researcher used the VIF values to check for multicollinearity. The findings show that the
VIF value for digital fraud detection used variable was 1.00, which was between 1 and 5, which
indicate absence of multicollinearity. Regression analysis could therefore be conducted. The
findings are shown in Table 4.14.
Table 4.14: Multicollinearity Test for Digital Fraud Detection and Underwriting
Process
Model
Unstandardized
Coefficients
Standardized
Coefficients
t Sig.
Collinearity
Statistics
B
Std.
Error Beta Tolerance VIF
1 (Constant) 1.157 .315 3.671 .000 Fraud
Detection
.655 .083 .460 7.929 .000 1.000 1.000
a. Dependent Variable: Underwriting Process

55
4.4.4 Regression Analysis Tests for Digital Fraud Detection and Underwriting Process
This section presents the R square value for regression model summary, F statistics for
regression ANOVA and t-test statistics for regression coefficient for the linear relationship
between digital fraud detection and underwriting process among insurers in the Nairobi
County.
4.4.4.1 Regression Model Summary for Digital Fraud Detection and Underwriting
Process
The finding in Table 4.15 shows the model summary of the regression analysis. As illustrated
in the Table 4.15 below, the predictor variable (digital fraud detection) explains 21.2% of the
variation in the underwriting process in Nairobi County (𝑅2 = .212, 𝐹(1,236) = 62.864, 𝑝 <
.05).
Table 4.15: Regression Model Summary for Linear Relationship between Fraud
Detection and Underwriting Processes
Model Summaryb
Model R
R
Square
Adjusted
R
Square
Std.
Error of
the
Estimate
Change Statistics
Durbin-
Watson
R
Square
Change
F
Change df1 df2
Sig. F
Change
1 .460a .212 .208 .53819 .212 62.864 1 234 .000 1.348
a. Predictors: (Constant), Fraud Detection
b. Dependent Variable: Underwriting Process
4.4.4.2 Regression ANOVA for Digital Fraud Detection and Underwriting Process
As shown in Table 4.16, the p-value (0.000) was less than the significance level (0.05) which
shows that there was a statistical and significant linear relationship between digital fraud
detection and underwriting process (𝐹(1,326) = 62.864, 𝑝 < .05).
Table 4.16: Regression ANOVA for Linear Relationship between Digital Fraud
Detection and Underwriting Processes
ANOVAa
Model
Sum of
Squares df Mean Square F Sig.
1 Regression 18.209 1 18.209 62.864 .000b
Residual 67.778 234 .290
Total 85.987 235
a. Dependent Variable: Underwriting Process
b. Predictors: (Constant), Fraud Detection

56
4.4.4.3 Regression Coefficients for Digital Fraud Detection and Underwriting Process
The regression coefficient findings shown in Table 4.17 below indicate that digital fraud
detection had a statistical and significant positive effect on the underwriting process in Nairobi
County (𝛽 = .655, 𝑡(234) = 7.929, 𝑝 < .05).
Table 4.17: Regression Coefficients Values for Linear Relationship between Digitization
of Claims Process and Underwriting Processes
Model
Unstandardized
Coefficients
Standardized
Coefficients
t Sig.
95.0% Confidence
Interval for B
B
Std.
Error Beta
Lower
Bound Upper
Bound 1 (Constant) 1.157 .315 3.671 .000 .536 1.777
Fraud
Detection
.655 .083 .460 7.929 .000 .492 .818
a. Dependent Variable: Underwriting Process
A linear regression model for Table 4.18 was adopted and is as shown below:
𝑈𝑛𝑑𝑒𝑟𝑤𝑟𝑖𝑡𝑖𝑛𝑔 𝑃𝑟𝑜𝑐𝑒𝑠𝑠𝑒𝑠 = 1.157 + 0.655 × 𝐷𝑖𝑔𝑖𝑡𝑎𝑙 𝐹𝑟𝑎𝑢𝑑 𝐷𝑒𝑡𝑒𝑐𝑡𝑖𝑜𝑛
This implies that a unit increase in banking fraud detection contributed to 0.655 linear change
in uptake of underwriting processes in Nairobi County.
4.5 Effect of Using Customer Relationship Management System on the Underwriting
Process
4.5.1 Descriptive Findings on Customer Relationship Management System
The respondents were asked to give their level of agreements with customer relationship
management system statements that were adopted by insurers using a scale that ranged between
1 to 5, where 1= very least extent, 2= least extent, 3= moderate extent, 4= great extent and 5=
very great extent. The study found that the respondents agreed to the following statements:
CRM facilitates collection of appropriate customer information (M = 4.23, SD =0.66). in terms
of the lowest mean, it was attracted by the following statement: The insurer's staff provide
service to customers as a priority entry into the company without exceeding (M = 3.64, SD =
0.99). The overall mean for all statements was 3.93 (SD = 0.88). The standard deviations
obtained were more than 1 indicating that there were variations in responses from the mean
value. Table 4.18 below gives results obtained, in accordance to the data collected by a Likert
scale tool.

57
Table 4.18: Descriptive Statistics for Customer Relationship Management System
Statement on Customer Relationship Management System Level of Agreement
Mean
SD Very Least
Extent
Least
Extent
Moderate
Extent
Great
Extent
Very Great
Extent
The insurer's staff provide service to customers as a priority entry into the company
without exceeding
f 4 42 24 132 34
3.64
0.99 % 1.7 17.8 10.2 55.9 14.4
The insurer's staff are ready to provide assistance to the policyholders f 2 18 14 134 64
4.03 0.85 % 0.8 7.6 5.9 56.8 27.1
The insurer's staff respond to all the customer's needs, whatever the degree of concern f 2 34 14 136 50
3.84 0.95 % 0.8 14.4 5.9 57.6 21.2
The insurer is committed to its promises toward the customer 4 12 16 136 68
4.07 0.84 % 1.7 5.1 6.8 57.6 28.8
Cross-selling, up-selling of insurance policy is facilitated by CRM f 2 32 28 126 46
3.78 0.95 % 0.8 13.6 11.9 53.4 19.5
CRM lead management campaigns have attracted additional policysholders. f 0 21 28 135 46
3.90 0.82 % 0.0 8.9 11.9 57.2 19.5
CRM aids growth in insurance policy conversion rates f 2 10 23 140 55
4.03 0.77 % 0.8 4.2 9.7 59.3 23.3
CRM facilitates collection of appropriate customer information f 0 8 6 140 74
4.23 0.66 % 0.0 3.4 2.5 59.3 31.4
The insurer’s management is concerned with customer complaints/queries f 4 8 11 134 73
4.15 0.80 % 1.7 3.4 4.7 56.8 30.9
The insurer has the capacity to provide the service without interruption 8 20 22 122 64
3.91 1.00 % 3.4 8.5 9.3 51.7 27.1
The insurer is always fast to implement improvement feedback around claims
management
f 4 26 22 130 54 3.86 0.95
% 1.7 11 9.3 55.1 22.9
There is a culture of sharing concerns of customers with the insurer f 8 22 32 138 36
3.73 0.95 % 3.4 9.3 13.6 58.5 15.3
The insurer's staff has high-efficiency in providing the service f 0 26 64 118 24 3.60 0.82
% 0.0 11 27.1 50 10.2
The insurer is always meeting customer expectations f 2 18 81 116 19 3.56 0.7
% 0.8 7.6 34.3 49.2 8.1
Composite mean and Standard deviation 3.93 0.88

58
4.5.2 Correlation between Customer Relationship Management System and
Underwriting Process
The study sought to establish correlation between customer relationship management system
and underwriting process. Correlation was employed in this study to examine the association
between the independent variable (customer relationship management system) with the
dependent variable (underwriting processes). The correlation test was conducted at 5% level
of significance with a 2-tailed test. Thus, the significance critical value was set at 0.025 above
which the association is deemed to be insignificant and vice versa. The findings illustrated in
Table 4.19 below show that customer relationship management system had a strong positive
and significant association with the underwriting processes, r(236) = .849, p < .05.
Table 4.19: Correlation between Customer Relationship Management System and
Underwriting Process
Underwriting
Process
Customer
Relationship
Management
System
Underwriting Process Pearson Correlation 1 .849**
Sig. (2-tailed) .000
Sum of Squares and Cross-
products
85.987 69.892
Covariance .366 .297
N 236 236
Customer Relationship
Management System
Pearson Correlation .849** 1
Sig. (2-tailed) .000
Sum of Squares and Cross-
products
69.892 78.813
Covariance .297 .335
N 236 236
**. Correlation is significant at the 0.01 level (2-tailed).

59
4.5.3 Tests for Assumptions of Regression of Customer Relationship Management System and
Underwriting Process
Before regression analysis was conducted, the assumptions of regression model were
conducted to determine the suitability of the test before it was used to deduce inferences in the
study.
4.5.3.1 Test for Normality for Customer Relationship Management System Variable
Table 4.20 presents the results from two well-known tests of normality, namely the
Kolmogorov-Smirnov Test and the Shapiro-Wilk Test. The data suggests that customer
relationship management system were not normally distributed, 𝑝 < .05.
Table 4.20: Tests of Normality for Customer Relationship Management System
Variable
Kolmogorov-Smirnova Shapiro-Wilk
Statistic df Sig. Statistic df Sig.
Customer Relationship
Management System
.085 236 .000 .873 236 .000
a. Lilliefors Significance Correction
4.5.3.2 Test for Linearity between Customer Relationship Management System and
Underwriting Process
Test for Linearity means that the independent variables in the regression have a straight-line
relationship with the dependent variable. The findings in Table 4.21 demonstrate that there was
linear relationship between customer relationship management system and underwriting
process (𝐹 (32, 202) = 712.051, < .05). The assumption that the independent and dependent
variables must have a linear relationship was not violated and regression analysis can be
computed between these variables.
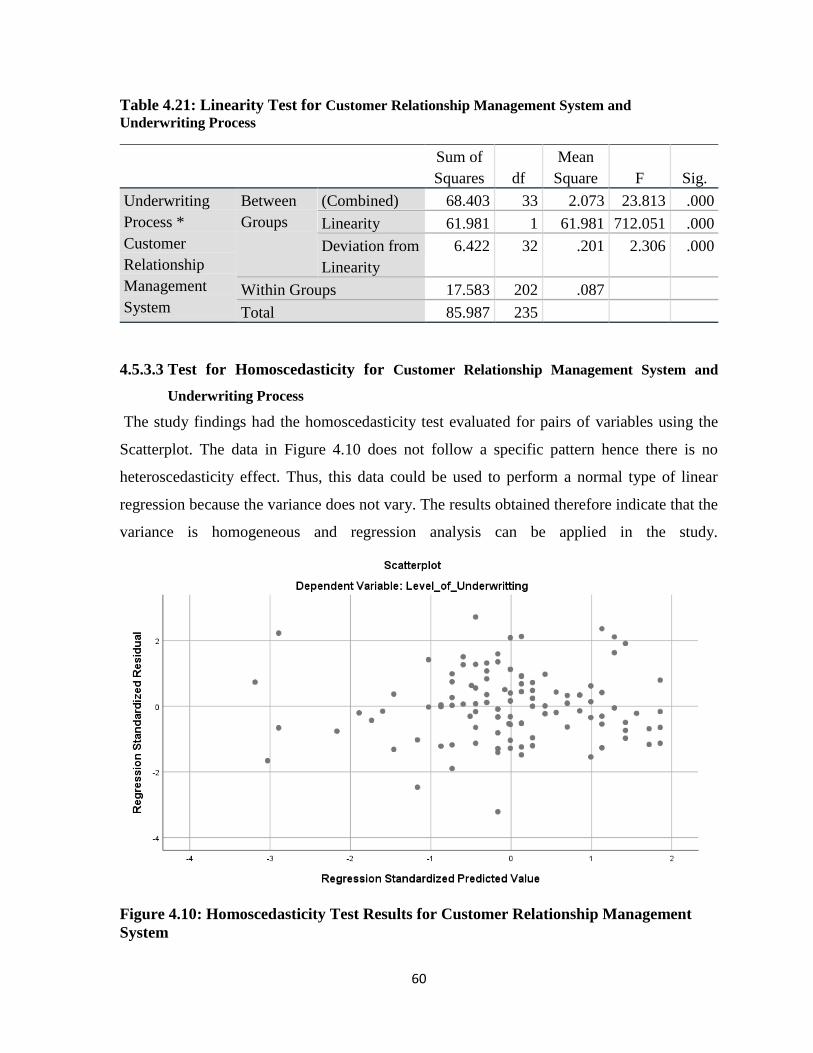
60
Table 4.21: Linearity Test for Customer Relationship Management System and
Underwriting Process
Sum of
Squares df
Mean
Square F Sig.
Underwriting
Process *
Customer
Relationship
Management
System
Between
Groups
(Combined) 68.403 33 2.073 23.813 .000
Linearity 61.981 1 61.981 712.051 .000
Deviation from
Linearity
6.422 32 .201 2.306 .000
Within Groups 17.583 202 .087
Total 85.987 235
4.5.3.3 Test for Homoscedasticity for Customer Relationship Management System and
Underwriting Process
The study findings had the homoscedasticity test evaluated for pairs of variables using the
Scatterplot. The data in Figure 4.10 does not follow a specific pattern hence there is no
heteroscedasticity effect. Thus, this data could be used to perform a normal type of linear
regression because the variance does not vary. The results obtained therefore indicate that the
variance is homogeneous and regression analysis can be applied in the study.
Figure 4.10: Homoscedasticity Test Results for Customer Relationship Management
System
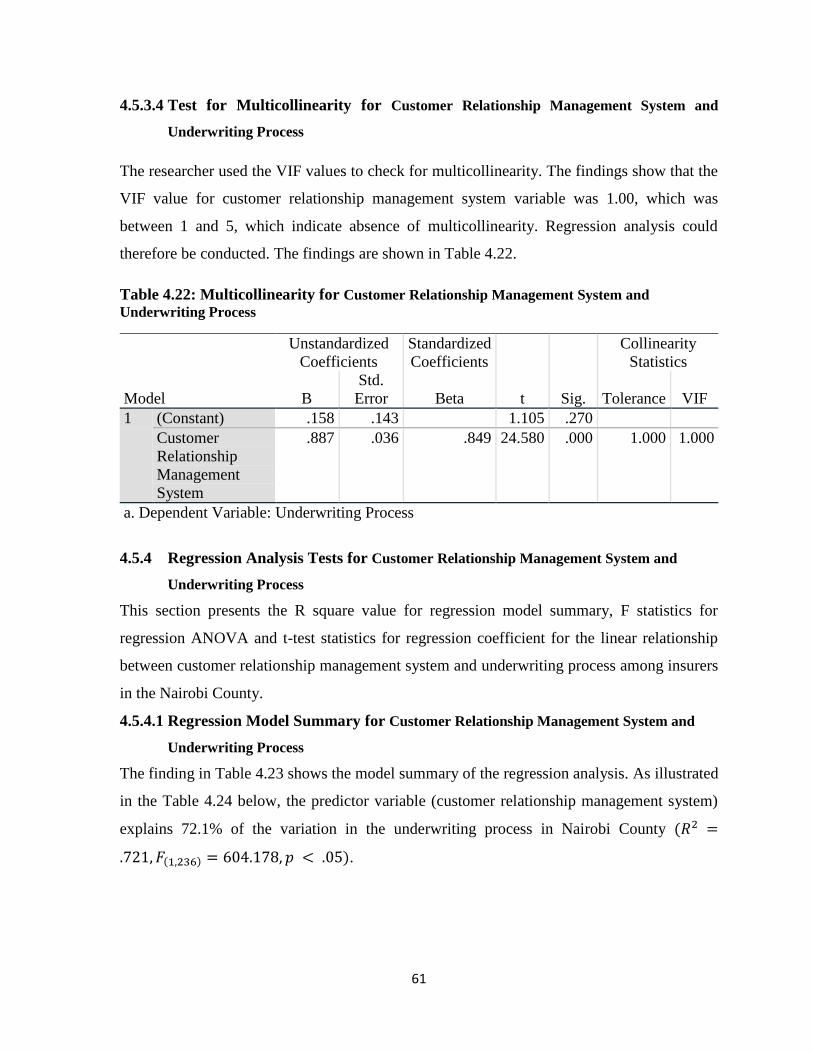
61
4.5.3.4 Test for Multicollinearity for Customer Relationship Management System and
Underwriting Process
The researcher used the VIF values to check for multicollinearity. The findings show that the
VIF value for customer relationship management system variable was 1.00, which was
between 1 and 5, which indicate absence of multicollinearity. Regression analysis could
therefore be conducted. The findings are shown in Table 4.22.
Table 4.22: Multicollinearity for Customer Relationship Management System and
Underwriting Process
Model
Unstandardized
Coefficients
Standardized
Coefficients
t Sig.
Collinearity
Statistics
B
Std.
Error Beta Tolerance VIF
1 (Constant) .158 .143 1.105 .270
Customer
Relationship
Management
System
.887 .036 .849 24.580 .000 1.000 1.000
a. Dependent Variable: Underwriting Process
4.5.4 Regression Analysis Tests for Customer Relationship Management System and
Underwriting Process
This section presents the R square value for regression model summary, F statistics for
regression ANOVA and t-test statistics for regression coefficient for the linear relationship
between customer relationship management system and underwriting process among insurers
in the Nairobi County.
4.5.4.1 Regression Model Summary for Customer Relationship Management System and
Underwriting Process
The finding in Table 4.23 shows the model summary of the regression analysis. As illustrated
in the Table 4.24 below, the predictor variable (customer relationship management system)
explains 72.1% of the variation in the underwriting process in Nairobi County (𝑅2 =
.721, 𝐹(1,236) = 604.178, 𝑝 < .05).

62
Table 4.23: Regression Model Summary for Linear Relationship between Customer
Relationship Management System and Underwriting Processes
Model R
R
Square
Adjusted
R
Square
Std.
Error of
the
Estimate
Change Statistics
Durbin-
Watson
R
Square
Change
F
Change df1 df2
Sig. F
Change
1 .849a .721 .720 .32029 .721 604.178 1 234 .000 1.629
a. Predictors: (Constant), Customer Relationship Management System
b. Dependent Variable: Underwriting Process
4.5.4.2 Regression ANOVA for Customer Relationship Management System and
Underwriting Process
As shown in Table 4.24, the p-value (0.000) was less than the significance level (0.05) which
shows that there was a statistical and significant linear relationship between customer
relationship management system and of underwriting processes(𝐹(1,236) = 604.178, 𝑝 <
.05).
Table 4.24: Regression ANOVA for Linear Relationship between Customer
Relationship Management System and Underwriting Processes
Model
Sum of
Squares df Mean Square F Sig.
1 Regression 61.981 1 61.981 604.178 .000b
Residual 24.005 234 .103
Total 85.987 235
a. Dependent Variable: Underwriting Process
b. Predictors: (Constant), Customer Relationship Management System
4.5.4.3 Regression Coefficients for Customer Relationship Management System and
Underwriting Process
The regression coefficient findings shown in Table 4.25 below indicate that customer
relationship management system used had a statistical and significant positive effect on the
underwriting processes in Nairobi County (𝛽 = .849, 𝑡(234) = 24.580, 𝑝 < .05).

63
Table 4.25: Regression Coefficients Values for Linear Relationship between Customer
Relationship Management System and Underwriting Processes
Model
Unstandardized
Coefficients
Standardized
Coefficients
t Sig.
95.0% Confidence
Interval for B
B
Std.
Error Beta
Lower
Bound
Upper
Bound
1 (Constant) .158 .143 1.105 .270 -.124 .440
Customer
Relationship
Management
System
.887 .036 .849 24.580 .000 .816 .958
a. Dependent Variable: Underwriting Process
A linear regression model for Table 4.8 was adopted and is as shown below:
𝑈𝑛𝑑𝑒𝑟𝑤𝑟𝑖𝑡𝑖𝑛𝑔 𝑃𝑟𝑜𝑐𝑒𝑠𝑠𝑒𝑠
= 0.158 + 0.887 × 𝐶𝑢𝑠𝑡𝑜𝑚𝑒𝑟 𝑅𝑒𝑙𝑎𝑡𝑖𝑜𝑛𝑠ℎ𝑖𝑝 𝑀𝑎𝑛𝑎𝑔𝑒𝑚𝑒𝑛𝑡 𝑆𝑦𝑠𝑡𝑒𝑚
This implies that a unit increase in customer relationship management system contributed to
0.887 linear change in underwriting processes in Nairobi County.
4.6 Chapter Summary
This chapter has been able to present and interpret the findings obtained from the field from a
sample of 298 respondents. The findings of the analysis were based on the objectives of the
study. Descriptive and inferential statistics have been used to discuss the findings of the study.
Correlation and regression analysis have been conducted. Results have been presented in chart
and table forms to allow for the interpretation and discussion according to the trends in the
results. The study has determined that there existed a positive significant relationship between
the study variables. All the independent variables; digitization of claim process, digital fraud
detection and customer relationship management system affect the Underwriting Process
services in Nairobi County. The next chapter presents the summary of findings, discussions,
conclusions and recommendations that were made in the study.

64
CHAPTER FIVE
5.0 DISCUSSION, CONCLUSIONS AND RECOMMENDATIONS
5.1 Introduction
This chapter presents the summary and discussion of the study findings, conclusion and
recommendations of the study. The chapter sections are based on the research questions.
5.2 Summary
The purpose of the study was to examine the effect of technology adoption on underwriting
processes among top five insurance companies in Nairobi County. The study was guided by
the following research questions: How does digitization of claims process affect the
underwriting process among the top five insurance firms in Nairobi County? What is the effect
of digital fraud detection on the underwriting process among the top five insurance company
in Nairobi County? Lastly, what is the effect of using customer relationship management
system on the underwriting process among top five insurance firms in Nairobi County?
The study employed survey descriptive design and focused on the employees of top 5 insurance
firms in Nairobi County. The number of employees in these firms as per the IRA (2020)
statistics stood at 1174. The study used stratified sampling techniques to select a sample of 298
respondents. Primary data was collected using questionnaires which was closed-ended. A pilot
test was conducted to determine the reliability and the validity of the questionnaire. An overall
Cronbach Alpha coefficient of .816 was obtained which was sufficient to warrant data
collection. In addition, an overall Content Validity Index of 0.737 was obtained, which showed
that the questionnaire was valid to warrant data collection. The collected data was analyzed
using Statistical Package for Social Sciences (SPSS) Version 26 software. Descriptive statistics
data analysis techniques including measures of central tendencies and dispersion were used to
describe the study variables. Correlation analysis was used to determine the strength and
direction of relationship between the study variables. Linear regression analysis was used to
determine the effect of technology adoption on underwriting processes among top five
insurance companies in Nairobi County. Finally, presentation of the findings was in form of
tables and figures.

65
The findings on the effect of digitization of claims process on the underwriting process among
top five insurers in Nairobi County indicated that most of insurers agreed that automation
ensures that the insured provided accurate information that was verifiable during investigation.
The relationship between digital claim processing and the underwriting process was positive
and weak. The findings further revealed that digital claim processing had positive and
significant effect on the underwriting process among insurers in Nairobi County.
Regarding the effect of digital fraud detection on the underwriting process among top five
insurers in Nairobi County, the findings indicated that most insures agreed that they encounter
the risk of inability to meet claims due to fraudulent claims from policyholders. The
relationship between digital fraud detection and underwriting process was positive and weak.
The findings further revealed that digital fraud detection had a positive and significant effect
on the underwriting process among insurers in Nairobi County.
The findings on the effect of customer relationship management system on the underwriting
process among top five insurers in Nairobi County indicated that most insurers agreed that
staff provided service to customers as a priority entry into the company without exceeding.
The relationship between customer relationship management system and underwriting process
was strong and positive. The findings further revealed that customer relationship management
system had a positive and significant effect on process among insurers in Nairobi County.
5.3 Discussion
5.3.1 Digitization of Claims Process and Underwriting Process
From the descriptive statistics, the study found that automation ensured the insured provided
accurate information which is verifiable during investigation. In accordance to these findings,
Holtz, Hoffarth, and Desai (2015) established that analyzing claims data equips insurance
practitioners with valuable insights to improve the client value and viability of insurer
programmes. The study also established that automation enhances access to timely information
that boosts evidence on legitimacy or illegitimacy of the claim. Muniappan (2019) supports
this observation that the underwriters have all the data in digital form and can take the prompt
decision. The findings replicate previous observation by Cirule, Voronova, and Pettere (2019)
that digitization increases claim processing speed.

66
The study also found that digitization has been at the forefront of helping insurance companies
improve their claims management. Technology has transformed the insurance industry in a
short span of time. The technology has reduced labor costs and increased the efficiency of
claims processing. Insurers will be looking at AI-based solutions to retain and attract
customers. This can be achieved by offering world-class services that delight the customers
across channels. Hebbar, Shenoy, Rao, and Rao (2015) contend that the use of information
technology is not new to the insurance sector, yet we may find constricted computerization
regarding the use of information technology in various departments of the insurance companies
including the major players from past several years. The most evident departments are
accounting, Legal issue and servicing, claim processing, sales management etc.
The fndings echoe observaton by Odukoya and Samsudin (2021) who estblished a significant
positive relationship between the digitization and reduction in fraud incidence. Perhaps the
siilairy in the findings could be explined by the fact that both studies were conducted in
developing countires. That is, kenya and Nigeria almost have similar economic dynamics
which shape firm performance. Maus and Parker (2020) acknowledge that automation can have
the added benefit of reducing loss adjustment expense and reducing the time from first notice
of loss to claim closure. This is beneficial to the insured both in terms of claim satisfaction and
reduced premiums.
Oza, Padhiyar, Doshi, and Sunita (2020) noted that Robotic Process Automation (RPA) can
help them to achieve their business objectives while leveraging existing technology and
boosting their returns on previous and current transformation investments. Insurers can use the
RPA for handling the high volume & complex data at greater speeds in less time for processing
this request. RPA is ready to help claims organizations advance and enhance their outcomes in
the digital era through increased automation, higher productivity and increased focus for claims
professionals. However, contradicting findings have been established by Anchan, Jathanna,
and Marla (2016) who argued that insurers faced a delay in query justification followed by pre-
authorization, preparation and faxing. The study nonetheless found that insurers were yet to
comprehensively adopt digital claim processing procedure. According to Akkor and Ozyuksel
(2020) gaps between the extant competencies of workers as compared to evolving required
qualifications are widening very fast, which indicates an urgent need for an increased level of

67
education for the workforce. These findings are, however, different from those of
Kaigorodova, Mustafina and Alyakina (2018) that the insurance business at present is getting
opportunities for a technological breakthrough.
The correlation analysis findings showed that digitalization of claims process had a weak
positive and significant association with the underwriting process. Linear regression analysis
showed that there was a statistical and significant linear relationship between digitalization of
claim processing and underwriting process. Linear regression analysis further showed that
digitalization of claim processing used explained a significant amount of the variation in the
underwriting process, which statistically and significantly positively affected the underwriting
process among insurers in Nairobi County. In accordance to these findings, the significant
relationship has been reported in literature by Kędra, Lyubov, Lyskawa, and Klapkiv (2019);
Moodley (2019); and Olalekan, Ajemunigbohun, and Alli (2017). The similarities can be
atrributed to the similar environment where the studies were conducted, with both studies
conducted in developing countries. However, the findings contardicts recent obsrevation
bySadiq (2021) made in Singapore that digitization has insignificant effect on insurers. The
difference in the findings could be linked to the variation in the market dynamics between
Kenya and Singapore.
5.3.2 Digital Fraud Detection and Underwriting Process
The findings of the study also indicated the insurer capitalizes on technology to strengthen
internal controls. These findings are similar to those of Akomea-Frimpong, Andoh, and Ofosu-
Hene (2016) that weak internal controls, poor remuneration of employees, falsified documents,
deliberate acts of policyholders to profit from the insurance contract and inadequate training
for independent brokers are found to be the major causes of insurance fraud. In addition, the
study revealed that technology employed in providing early warning to the underwriters of the
looming fraudulent claim. Bogaghi, Modares, and Teimourpour (2017) has put forward a new
approach for identification, representation, and analysis of organized fraudulent groups in
automobile insurance through focusing on structural aspects of networks, and cycles in
particular, that demonstrate the occurrence of potential fraud. As a result, the detection of
cycles is not only more efficient, accurate, but also less time-consuming in comparison with
previous methods for finding such groups. The insurer employs digital screening techniques

68
of potential policy holders. Policyholders’ digital and review-seeking behavior is a compelling
catalyst for insurers to rethink and better align their channels to reach out to and make customer
experience a primary focus (Campos, 2020).
Fraud acts as a major deterrent to a company’s growth if uncontrolled. It challenges the
fundamental value of “Trust” in the Insurance business. In the same perspective, Kavya,
Anusha, Amrutha, and Harsha (2019) opine that insurance fraud detection is a difficult task,
this industry has grappled with challenges of insurance claim fraud from the very beginning.
As an intervention mechanism, digitization aims at developing a system that can help to
recognize possible frauds with peak magnitude of accuracy. Digitization predicts whether the
claimed insurance is “Fraud” or “Genuine”. Thus helping the insurance companies to spot
frauds with fewer amount of time and with good accuracy rate.
Ismail and Zeadally (2020) explain that the system that performs the manual processing of
medical insurance claims frequently misses the endorsement of some stakeholders (such as the
patient, pharmaceutical companies, wholesale dealers, and medical equipment suppliers) in a
claim’s validation process. Blockchain is a peer-to-peer distributed system that can enable the
validation of healthcare claims in a secure, immutable, and transparent manner. Alongside
tools for the automatic recognition of fraud, systematic manual recognition via checklists,
fraud manuals or the like has proven especially effective, and can be implemented fast (Kuhnt,
Lorenz, & Müssig, 2015).
The study further demonstrated that automation enables prompt reporting of suspected fraud
cases to the IFIU. This observation contradicts previous findings by Odhiambo (2017). The
study established that strategies adopted by insurance companies to combat fraud are
ineffective leading to increasing cases and cost of fraud. That most companies shy away from
investigating and prosecuting suspected fraudulent claims exposing this weakness to fraudsters
who exploit it to their advantage. Musamali (2015) elucidates that poor perception towards the
reporting agencies impacts consumer fraud reporting significantly which means improving
how citizens perceive the police is important in fighting the consumer fraud problem.
However, the study demonstrated that insurers registered multiple fraud incidences every
quarter. Desai and Jain (2016) add that claim is the major area where most of the frauds occur.
The researchers add that only 10% of the frauds are being detected. Thus, it is difficult for the

69
insurance company to maintain the claim settlement ratio and detect frauds at the same time.
Similarly, Al-Rawashde and Singlawi (2016) opined that insurance companies register high
cases of fraud every financial year. Moreover, Dionne and Wang (2015) found that the severity
of insurance fraud is countercyclical. Fraud is stimulated during periods of recession and
mitigated during periods of expansion. According to Baumann (2021), one common detection
system is a rule-based expert system that checks predefined rules and gives alerts when certain
conditions are met. Usually, the rules are treated separately and correlations within the rules
are considered insufficiently.
The correlation analysis findings showed that digital fraud detection had a moderate positive
and significant association with the underwriting process. Linear regression analysis showed
that there was a statistical and significant linear relationship between digital fraud detection
and underwriting process. Linear regression analysis further showed that digital fraud detection
used explained a significant amount of the variation in the underwriting process, which
statistically and significantly positively affected the underwriting process among insurers in
Nairobi County. In accordance to these findings, the significant relationship has been reported
in literature by Rawte and Srinivas (2015) and Verma and Mani (2019). The similarities can
be attributed to the similar environment where the studies were conducted, with both studies
conducted in developing countries. The findings are also similar to those obtained by Gupta
(2020) that there is a high positive correlation between fraud detection and underwriting during
COVID-19 environment. Inconsistent with the present findings, a study conducted in Australia
by Dionne and Wang (2015) established an insignificant relationship between digitization and
insurance fraud among underwriting firms. The dissimilarity in the findings could be explained
by the Australian based study that was limited to automobile theft insurance yet the current
study focused on the entire scope of insurance coverage. Furthermore, the previous study had
analyzed fraud based on business cycle fluctuation, a moderating variable that was not
considered in the current study.
5.3.3 Customer Relationship Management Systems and Underwriting Process
The descriptive statistics findings showed that the insurer's staff provided service to customers
as a priority entry into the company without exceeding. The findings agree with Brofer,
Rezaeian, and Shokouhyar (2016) for insurers to maintain customers, they should attempt to

70
transform behavioral loyalty of these customers to attitudinal loyalty through establishing more
communications and interactions with them. Simialrlly, Kannan and Vikkraman (2016) share
the perspective that life insurance companies need to develop CRM processes to attract and
maintain customers as well as profitability. Laketa, Sanader, Laketa, and Misic (2015) further
opine that Customer Relationship Management concept is tendency of Insurance sector to
establish and maintain long-term relationships with customers in order to provide value for
customers and insurers. This concept allows the insurer to identify, segment, communicate and
build long-term relationships with customers on individual basis.
Additionally, the respondents indicated that the insurers committed to their promises toward
the customer. This is in agreement with Ziaeifar and Nazeri (2014) service quality and
customer relationship management are highly correlated to effective on customer loyalty.
Nyaguthii (2014) found that most customers prefer customer care staff who are enthusiastic,
listen carefully, responsive, courteous and proactive. This clearly reflects the priorities of the
policyholders. Customers want the services provided to them to be efficient (prompt and
hassle-free) as they perceive life insurance as a guard against the uncertainties of the future.
The findings further support the argument by Al-Qudah (2015) that there is a statistically
significant link between seven dimensions’ service quality and customer satisfaction.
The insurer is always fast to implement improvement feedback around claims management.
The observation is in agreement with Nagalakshmi and Subramanian (2016), customer
relationship management in insurance sector cannot be achieved without having an effective
procedure for redressing the complaints of dissatisfied customers. Choo, Hiltz, and Hiltz
(2016) reinforce that digital business need to focus on providing excellent online customer
services because customer service is the most important factor in online customer satisfaction;
respond to customers' requests/complaints fast because the response speed is more important
in online customer satisfaction than offline; and employ strategies that are appropriate for the
product category in question.
The results reflect the observation made by Ghazian, Hossaini and Farsijani (2020) who
showed a direct effect of customer relationship management on customers’ satisfaction. Also,
the study revealed a significant positive relationship between customer relationship
management and customers’ retention. The analysis results showed that Internet service and

71
customer response, brand development, and the customer support and response to price, brand
development, brand preference, purchase castle and finally the reaction to price support and
marketing, brand development, brand preference and intend to buy a significant relationship
was observed. The similarities in the findings could be interpreted as the cross-cutting
elements between the Ghanaian and Kenyan insurance sectors.
The correlation analysis findings showed that customer relationship management system had
a strong positive and significant association with the underwriting process. Linear regression
analysis showed that there was a statistical and significant linear relationship between customer
relationship management system and underwriting process. Linear regression analysis further
showed that customer relationship management system used explained a significant amount of
the variation in the underwriting process, which statistically and significantly positively
affected the underwriting process among insurers in Nairobi County. In accordance to these
findings, the significant relationship has been reported in literature by Kumar (2017) and Yusuf
and Ajemunigbohun (2015). The similarities can be atrributed to the similar environment
where the studies were conducted, with both studies conducted in developing countries.
Hwoever, the findings disagreed with Zaid, Juharsah, Yusuf, and Suleman (2015) who
estbalished that reciprocal as CRM strategy has no significant effect on underwrtting actvities.
The variation in the freults could be explained by the use of moderating effects of relational
capital on CRM which was not incoporated in the present study.
5.4 Conclusions
Based on the findings and discussions of the study, the following conclusions were made in
the study based on the research questions of the study.
5.4.1 Digitization of Claims Process and Underwriting Process
On the effect of digital claim process on underwriting process, this study revealed that digital
claim processing had a positive and significant effect underwriting process among top five
insurance companies in Nairobi County. This means that when the insurers adopt digitization
in reducing response time to insurance claim related matters; and pay on a first come first pay
basis, the underwriting process becomes more efficient. It can be concluded that improvement

72
in underwriting process to the insurers is achieved when customer on boarding process is
digitized, which attracts policy purchasers to the insurer.
5.4.2 Digital Fraud Detection and Underwriting Process
On the effect of digital fraud detection on underwriting process, the study indicated that digital
fraud detection had a positive and significant effect underwriting process among top five
insurance companies in Nairobi County. This means the manner in which insurers capitalize
on technology to strengthen internal controls to the extent that fraud is easily detected and
reported for timely intervention affects underwriting process. It can be concluded that
improvement in underwriting process is realized when insurers digitize their fraud detection
systems to minimize incurring fraud related loses.
5.4.3 Customer Relationship Management System and Underwriting Process
On the effect of customer relationship management system on underwriting process, the study
indicated that digital fraud detection had a positive and significant effect underwriting process
among top five insurance companies in Nairobi County. This means that the way insurers
remain committed to their promises toward policyholders and address complaints on time, the
underwriting process is streamlined. It can be concluded that improvement in underwriting
process is attained when insurers are willing to meet the expectations of policyholders.
5.5 Recommendations
5.5.1 Recommendations for Improvement
5.5.1.1 Digitization of Claims Process and Underwriting Process
The study recommends that insurers should always work towards automating their claims
processes. As it was established that automaton ensures that the insured provide accurate
information which is verifiable during investigation. Instead of insurers spending much time
scanning through multiple documents, automaton ensures that response time is significantly
reduced. This boosts evidence on legitimacy or illegitimacy of the claim. In addition,
automaton will facilitate safe storage and faster retrieval of clam relate matters.

73
5.5.1.2 Digital Fraud Detection and Underwriting Process
The study recommends that insurers should put in place aspects of building up digital insurance
control mechanisms that aid data integrity of underwriting processes. With such sophisticated
security frameworks in place, data integrity is guaranteed and the cases of fraud losses can be
significantly contained. Moreover, there is need to undertake need based training to the
underwriters on the application of digital fraud management systems. Besides insurance firms
should tap into the potential of technology as an early warning to the underwriters of the
possible fraudulent activities.
5.5.1.3 Customer Relationship Management System and Underwriting Process
The study recommends that insurers should consider investing in their customer relationship
management programs and this can be achieved by training of customer support staff as service
quality affects the uptake of underwriting services by the insured. In addition, the CRM system
should be centered at providing timely feedback on consumer requests and complaints as most
insured preferred real-time complaint management. Lastly insurers need to focus on customer-
firm information sharing acknowledge exchange acts as a competitive capability to the insurer.
5.5.2 Recommendations for Further Studies
This study has been able to investigate the factors affecting underwriting process among top
five insurers in Nairobi City County. However, this is a case study of insurers in Nairobi City
County and therefore the scope of generalization is limited. Therefore, other researchers can
expound on the study by undertaking similar studies in other counties especially the rural
counties in Kenya. In addition, the study adopted quantitative approaches in the process of data
collection and analysis. The researcher therefore recommends that other scholars can come in
and undertake research on the same subject area using qualitative methods to enable
comparisons to the current study.

74
REFERENCES
Agu, G. A., Ogbuji, C., Okrapa, I., & Ogwo, E. O. (2018). Understanding Customer Complaint
Behaviour for Sustainable Business Development: Evidence from Nigeria’s Organized
Road Transport Sector, Journal of Economics and Management Sciences; 3(1); 20- 27
Akhtar, I. (2016). Research in Social Science: Interdisciplinary Perspectives, Research
Methodology, 7(2); 68-84
Akkor, D.G. & Ozyuksel& Ozyuksel, S. (2020). The Effects of New Technologies on the
Insurance Sector: A Proposition for Underwriting Qualifications for the Future.
Eurasian Journal of Business and Management, 8(1), 36-50.
Akomea-Frimpong, I., Andoh, C. & Ofosu-Hene, E. (2016). Causes, effects and deterrence of
insurance fraud: evidence from Ghana, Journal of Financial Crime 23(4):678-699
AlQershi, N., Mokhtar, S. S., & Abas, Z. (2020). Innovative CRM and Performance of SMEs:
The Moderating Role of Relational Capital, Journal of Open Innovation 6(4), 155-160
Al-Qudah, K. M. A. (2015). The impact of service quality on Customer satisfaction of Jordan
Insurance Companies, International Journal of Management & Information
Technology 5(2):517-527
Al-Rawashdeh, F. & Al Singlawi, O. (2016). The Existence of Fraud Indicators in Insurance
Industry: Case of Jordan. International Journal of Economics and Financial Issues 6(5)
168-176.
Anchan P. S., Jathanna R, & Marla, A. (2016). Evaluation of Health Insurance and Claim
Process at Tertiary Care Hospital, Mangalore: A Case Report. Journal of Health
Management;13(1):97-112.
Ashturkar, P.B. (2015). An Analytical Approach to Study Claim Settlement and Life
Insurance: Indian Evidence, International Journal of Management Research and
Development (IJMRD), 5(1);
Asiamah, N., Mensah, H. K., & Oteng-Abayie, E. (2017). General, Target, and Accessible
Population: Demystifying the Concepts for Effective Sampling. The Qualitative
Report, 22(6), 1607-1621.
Assad, N. (2015). An Analysis and Assessment of Customer Satisfaction with Service Quality
in Insurance Industry in Palestine, Journal of Insurance Issues, 40 (5), 187-201

75
Association of Certified Fraud Examiners (2018). Insurance fraud handbook, 1st edn. New
York, NY, Henery Press Publishing.
Association of Kenya Insurers (2020). Insurance Industry Annual Report 2019, Industry
Highlights, 10(5); 48-56
Atmowardoyo, H. (2018). Research Methods in TEFL Studies: Descriptive Research, Case
Study, Error Analysis, and R & D. Journal of Language Teaching and
Research,9(1):197
Bailey, K. D. (2015). Methods of Social Research (4. ed.). London: Free Press.
Bakker, A. (2019). Design Research in Education: A Practical Guide for Early Career
Researchers. Design Research in Education, 3rd ed.City, State: Routledge CRC Press.
Baltes, S. & Ralph, P. (2021). Sampling in Software Engineering Research: A Critical Review
and Guidelines, Software Engineering, 5(3); 82-94
Baumann, M. (2021). Improving a Rule-based Fraud Detection System with Classification
Based on Association Rule Mining, International Journal of Engineering and
Management Research, 10(2); 201-216
Belay, Y. (2018). The Effect of Motor Insurance Claim Management On Customer Satisfaction
at Ethiopian Insurance Corporation, The Journal of Risk and Insurance 54(3), 246-262.
Benton, D. (2020). How Sanlam provides innovative insurance services for the digital age. The
Journal of Finance; 56(6) 2237-2264
Bist, B.R. (2015). Research Procedure: An Introduction. Journal of NELTA Surkhet, 4(2); 34-
40
Bjørn, H. (2017). Assurance of anonymity for respondents in sensitive online surveys. Journal
of Psychology, 4(1); 19-25
Bodaghi, A. & Teimourpour, B. (2018). Automobile Insurance Fraud Detection Using Social
Network Analysis. Industrial Engineering, 2(2); 61-68
Bogaghi, A., Modares, T., & Teimourpour, B. (2017). The Detection of Professional Fraud in
Automobile Insurance Using Social Network Analysis, Social and Information
Networks 8(3); 67-75
Bondurant, E., & White, B.H. (2019). Insuretech and Beyond – An Evolving Litigation
Landscape, The National Law Review, 11(151); 167-174
76
Borselli A. (2020) Smart Contracts in Insurance: A Law and Futurology Perspective. Insurance
Law and Regulation, 1(3); 19-27
Brain, A.L. (2015). Strategic Customer Relationship Marketing and Re-Intermediation Models
in the Insurance Industry, International Journal of Electronic Commerce, 10(6), 15-29
Brofer, A., Rezaeian, Al. & Shokouhyar, S. (2016). Identifying Customer Behavior Patterns in
Life Insurance and Capital Formation Using Data Mining Techniques, Management
Research in Iran, 20(4), 65-94.
Buttle, F.A., & Maklan, S. (2015). Customer Relationship Management: Concepts and
Technologies: Customer relationship management CRM. 2nd edn. CRC Press.
Routledge.
Callaway, J., Kueker, D., Barker, R., Dion, M., Allen, L., & Kocisak, N. (2019). Investigating
Life Insurance Fraud and Abuse: Uncovering the Challenges Facing Insurers, The
Geneva Papers on Risk and Insurance. Issues and Practice, 48(4), 1417-1426
Campos, F. (2020). Mobile payment: Understanding the determinants of customer adoption
and intention to recommend the technology, Computers in Human Behavior 61(6):404-
414
Cappiello, A. (2020). The Digital (R)evolution of Insurance Business Models, American
Journal of Economics and Business Administration, 12(1):1-13
Carroll, S. (2017). A Comprehensive Definition of Technology from an Ethological
Perspective, Journal of Communication 6(4); 126-137
Catlin, T., Deetjen, U. & Lorenz, J. (2019). Ecosystems and platforms: How insurers can turn
vision into reality. Financial Services, 8(11); 95-104
Cavalcante, A.S. (2015). Understanding the Impact of Technology on Firms' Business Models,
European Journal of Innovation Management 16(3):285-300
Chache, W. O., Mwangi, C. I., Nyamute, W., & Angima, C. (2020). Risk-Based Capital and
Investment Returns of Insurance Companies in Kenya: Moderating Effect of Firm Size.
European Scientific Journal, 16(31), 227-232
Chartered Insurance Institute (CII) (2016). Annual Report 2014: The Chartered Insurance
Institute. International Business Research 5(1):61-71
Chester, A., Ebert, Ebert, S., Kauderer, S. & McNeill, C. (2019). From Art to Science: The
Future of Underwriting in Commercial P&C Insurance, Digital Insurance, 5(2); 45-52

77
Choo, Y., Hiltz, Y.M., Hiltz, R, S, (2016). An Analysis of Online Customer Complaints:
Implications for Web Complaint Management, System Sciences - All Science Journal
Classification, 3(10); 156-163
Cirule, I.Z., Voronova, I. & Pettere, G. (2019). Internal model for insurers: possibilities and
issues, Business, Management and Economics Engineering, 18(7); 256-265
Coalition Against Insurance Fraud (2020). The state of insurance fraud technology,
Technology Adoption 2(5); 63-77
Cochran, W. G. (1977). Sampling Techniques (3rd ed.). New York: John Wiley & Sons.
Conrad, A, Mostert, F.J., & Mostert, J.M. (2015). The Underwriting Process of Motor Vehicle
Insurance, Corporate Ownership & Control, 6(6); 239-246
Cooper, D. R. & Schindler, P. S. (2014). Business research methods. McGraw-Hill/Irwin -
Boston.
Creswell, J. W., & Creswell, J. D. (2017). Research Design: Qualitative, Quantitative, And
Mixed Methods Approaches. Sage publications.
Dannels, S. A. (2018). Research Design. Quantitative Methods in the Social Sciences, 5(3);
402-416
Daramola, O. E., Oderinde, A. F., Anene, C. M., Abu, J. M., & Akande, T. M. (2020). Health
Insurance and Healthcare Quality: A Comparative Study Between Insured and
Uninsured Patients at a Teaching Hospital in Northeast Nigeria. International Journal
of Tropical Disease & Health, 41(2), 13-19.
Dash, S., Shakyawar, S.K., Sharma, M. (2019). Big data in healthcare: management, analysis
and future prospects. Journal of Big Data, 6(54); 306-318
De Beer, C.I., Mosterst, F.J., Mostert, J.H. (2015). The claims handling process of engineering
insurance in South Africa. Risk Governance and Control Financial Markets &
Institutions 5(2):15-21
De Zoete, J., Sjerps, M., Lagnado, D. & Fenton, N. (2015). “Modelling crime linkage with
Bayesian networks. Science and Justice 55(3): 209–217.
De Zoete, J., Sjerps, M., Lagnado, D. & Fenton, N. (2015). Modelling crime linkage with
Bayesian networks. Science and Justice, 55(3): 209–217.
Deloitte (2019). Unlocking new markets Digital innovation in Africa's insurance industry
August 2017. Tech-Insurance, 2(2); 5-12

78
Desai, A.S. & Jain, U. (2016). Areas of Frauds in Insurance Sector and ITS Impact on Financial
Statements, IOSR Journal of Business and Management (IOSR-JBM), 4(4); 24-29
Dimas, A. (2017). Brazil: the new insurance giant. Reconteur, 7(3); 105-120
Dionne, G., Wang, K. (2015), Does insurance fraud in automobile theft insurance fluctuate
with the business cycle? Journal of Risk and Uncertainty, 47(3), 67-92.
Ebrahim, E. (2018). Research Methodology Textbook On Assessing and Appreciating the
Impact of Urban Built Form On Micro- Temperature Change. Balti, Moldova, LAP
LAMBERT Academic Publishing
Eckert, C. & Osterrieder, K. (2020). How digitalization affects insurance companies: overview
and use cases of digital technologies. Zeitschrift für die gesamte
Versicherungswissenschaft, 109(1), 333–360
Edinger. H., Adepoj, R. & Masha, Y. (2017). Unlocking new markets Digital innovation in
Africa's insurance industry, Industry Analytics, 1(8); 19-30
Eling, M. & Lehmann, M. (2018). The Impact of Digitalization on the Insurance Value Chain
and the Insurability of Risks. Geneva Papers on Risk and Insurance - Issues and
Practice 43(3):359-396
Etikan I, & Bala K. (2017). Sampling and sampling methods. Biom Biostat International
Journal ;5(6):215-217
Ferenzy, D., Silverberg, K., Vvan Liebergen, B. & French, C. (2016). Innovation in Insurance:
How Technology is Changing the Industry. Innovations and Insurance, 7(3); 51-66
Fraser, J., Fahlman, D., Arscott, J. & Guillot, I. (2018). Pilot Testing for Feasibility in a Study
of Student Retention and Attrition in Online Undergraduate Programs, Research
Methods 19(1); 260-278
Gahigi (2017). Technology-Based Industrialization of Claims Management in Motor
Insurance. In for mationssysteme in der Finanzwirtschaft. 6(6); 39-48
Gakinya, C. P. (2018). Influence of Technology as A Strategic Resource on Performance of
Insurance Companies in Kenya. A Case of Aar Insurance Kenya Limited, Strategic
Journal of Business & Change Management, 5(2); 108-125
Gandhi, D. & Kaul, R. (2016). Art, Science & Technology: How new technology is shaping
the future of underwriting and underwriters, Asia Insurance Review, 5(6); 76-77

79
Genpact Research Institute (2014). The Impact of Technology On Business Process
Operations, Research Results Across Industries and Functions, 1(3); 12-18
Ghazian, A., Hossaini, B., & Farsijani, H. (2020). The Effect of Customer Relationship
Management and its Significant Relationship by Customers’ Reactions in LG
Company, British Journal of Marketing Studies (BJMS) 8(2); 77-95
Ghorbani, A. & Farzai, S. (2018). Fraud Detection in Automobile Insurance using a Data
Mining Based Approach. Insurance Journal Research, 7(3); 44-52
Gupta, R.Y. (2020). Implementation of Correlation and Regression Models for Health
Insurance Fraud in Covid-19 Environment using Actuarial and Data Science
Techniques, International Journal of Recent Technology and Engineering, 9(3); 699-
706
Hassan, H. (2018). Impact of Customer Relationship Management (CRM) on Customer
Satisfaction and Loyalty: A Systematic Review. Research Journal of Business
Management 6(1):86-107
Hebbar, C.K., Shenoy, S.S., Rao, G.P. & Nayak, S. (2015). Feasibility Study of Islamic
Insurance (Takaful) in India: Challenges & Prospects. Asian Journal of Research in
Business Economics and Management 4 (9), 88-106
Holtz, J., Hoffarth, T. & Desai, S. (2015). The Value of Claims Analysis in Health
Microinsurance, Journal of Insurance Management, 8(8); 134-141
Insurance Regulatory Authority (2020). Insurance Industry Report for the Period January –
September 2020 Third Quarter Release, 1(2); 1-7
Insurance Regulatory Authority of Uganda (2020). Uganda’s Insurance Sector Performance in
The Year 2019: Another Year of Sustained Positive Growth, Insurance Growth, 6(2);
121-130
Ismail, L. & Zeadally, S. (2020), Healthcare Insurance Frauds: Taxonomy and Blockchain-
based Detection Framework (Block-HI), Blockchain, 4(4); 34-41
James David Power (2016). Use of Digital Channels Increases, But Technology Can’t Fully
Replace Human Connections during Auto Insurance Claims Process, Auto Claims
Satisfaction Study, 7(1); 93-98
Jongbo, C. (2017). The Role of Research Design in A Purpose Driven Enquiry, Review of
Public Administration and Management 3(6); 87-94

80
Joshi, R., Pelling, H., O’Connor, B., & Wompa, S. (2019). Transform Inefficient Operations:
Leverage Intelligent Automation to Drive Efficiency, Agility and Performance,
Intelligent Insurer, 5(3); 32-40
Joshi, R., Pelling, Pelling, H., O’Connor, B., & Wompa, S. (2020). Leverage Intelligent
Automation to Drive Efficiency, Agility and Performance, Journal of Insurance
Management, 4(4); 38-46
Jossey-Bass, V. & Adams, W. (2019). Conducting Semi-Structured Interviews, Research
Methods 4(3); 41-44
Junyong, I. (2017). Introduction of a pilot study. Korean Journal of Anesthesiology 70(6):601-
610
Kabir, S.M.S. (2016). Basic Guidelines for Research: An Introductory Approach for All
Disciplines. 3rd Edn. Chittagong, Book Zone Publication.
Kabir, S.S. (2016). Methods of Data Collection. Basic Guidelines for Research: An
Introductory Approach for All Disciplines, 2nd Edition: Book Zone Publication,
Chittagong.
Kahonga, J., & Kariuki, P. (2020). Growth strategy and performance of insurance companies
in kenya. The Strategic Journal of Business & Change Management, 7(3), 133 – 150.
Kaigorodova, G., Mustafina, A. & Alyakina, P. (2018), Directions of improving information
system of insurance company, Journal of Physics: Conference Series, 6(3); 28-36’
Kaigorodova, G., Mustafina, A., Pyrkova, G., Grzebyk, M. & Belinskaja, L. (2021).
Digitalization of the insurance business: Systematization of net effects through the
example of Russia. Insurance Markets and Companies, 12(1), 32-42
Kalwihura, J.S. & Logeswaran, R. (2020). Auto-Insurance Fraud Detection: A Behavioral
Feature Engineering Approach, Journal of Critical Reviews 7(3); 125-129
Kandiri, M.J. (2015). Effective Implementation of Technology Innovations in Higher
Education Institutions: A Survey of Selected Projects in African Universities.
Lexology. 5(8); 54-61
Kannan, A. D. & Vikkraman, P. (2016), Implementation of CRM Processes in Life Insurance
Sector: A Customers’ Perspective Analysis, A Journal of Management Ethics and
Spirituality, 8(2); 78-84

81
Kavya, P M.L., Anusha, Y.G., Amrutha, T., & Harsha, R. (2019). Auto Insurance Fraud
Detection, International Journal of Advanced Research in Computer and
Communication Engineering 9(7); 94-98
Kędra, A. , Lyubov, K., Lyskawa, K., & Klapkiv, Y. (2019). Digitalization in insurance
companies, Contemporary Issues in Business, Management and Economics
Engineering, 11(5); 842-852
Kędra, A., Lyubov, K., Lyskawa, K., & Klapkiv, Y. (2019). Digitalization in insurance
companies. Contemporary Issues in Business, Management and Economics, 5(12); 98-
106
Khurramov, A. (2020). Investment Activities of Insurance Companies: The Role of
Insurance Companies in The Financial Market, Journal of Advanced Research In
Dynamical & Control Systems, 12(6); 719-725
Kimura, S., Saton, T., Ikeda, S., & Noda, M. (2016). Development of a Database of Health
Insurance Claims: Standardization of Disease Classifications and Anonymous Record
Linkage, Journal of Epidemiology 20(5):413-419
Kose, I., Gokturk, M. & Kilic, K. (2015). An Interactive Machine-Learning-Based Electronic
Fraud and Abuse Detection System in Healthcare Insurance. Applied Soft Computing
36:283–299.
Kothari, C.R. (2019). Research Methodology Methods and Techniques. 4th Edition, New Age
International Publishers, New Delhi.
Kuhnt, D. Lorenz, T., & Müssig, M. (2015). Claims management: Taking a determined stand
Against Insurance Fraud, The Journal of Risk Management and Insurance, 22(4); 389-
394
Kumar, A. & Kaur, A. (2020). Complaint Management- Review and Additional Insights,
International Journal Of Scientific & Technology Research, Pacific Business Review
International, 9(2); 1501-1509
Kumar, A.E. (2017). Customer Relationship Management (CRM) Practices in Life Insurance
Industry. Shanlax International Journal of Commerce, 5(4); 74-78
Kumar, N., Kumar, N., Srivastava, J. D., & Bisht, H. (2020). Artificial Intelligence in Insurance
Sector, Journal of the Gujarat Research Society 21 (7), 79-91

82
Laketa, M. Sanader, D. Laketa, L., & Misic, Z. (2015): Customer relationship management:
Concept and importance for banking sector, UTMS Journal of Economics, 6(2); 241-
254
Larson–Hall, J. (2015). A Guide to Doing Statistics in Second Language Research Using SPSS
and R. Abingdon, UK: Taylor and Francis
Little, A. (2019). Resolving Customer Complaints in The Digital Era, Journal of Services
marketing 28(11), 1678-1685
Loeb, S., Morris, P., Dynarski, S., Reardon, S., & McFarland, D. (2017). Descriptive analysis
in education: A guide for researchers. The Journal of Research on Educational
Effectiveness, 5(4): 69-76
Machui, W. (2016). Nature and challenges of claims management by reinsurance companies
in Kenya. Journal of Business,71(1), 59-68
Majid, U., Ennis, M. & Bhola, T. (2018). Research Fundamentals: Study design, population,
and sample size. Undergraduate Research in Natural and Clinical Science and
Technology (URNCST) Journal, 9(2); 61- 73
Maslova, L. & Ilina, A. (2020). Digital transformation of Russian insurance companies, Issues
and Practice, 42(1), 73-81
Maus, K. J. & Parker, J. F. (2020). How Carriers Implement Fair Claims Practices in a Hands-
Off World, Insurance Law, 3(2); 19-26
Mgunda, M.I. (2019). The Impacts Information Technology On Business. Journal of
International Conference Proceedings. 16(5); 149-1456
Mohammed, A. E., Abdelsalam, M., Ashraf. M. & Barake, S. (2020). Life Insurance in the
UK. European Insurance and Occupational Pensions Authority, 3(3); 28-35
Moodley, A. (2019). Digital transformation in South Africa’s Short-Term Insurance Sector:
Traditional Insurers’ Responses Toto the Internet Of Things (IoT) and insurtech. The
African Journal of Information and Communication (AJIC), 24(2), 1-16.
Moradi, M. (2017). Investigating the Impact of Customer Relationship Management (CRM)
Factors on Tendency for Life Insurance Demand in Dana Insurance, International
Journal of Scientific Study, 5(4); 662-666

83
Morgan, C. J. (2017). Use of Proper Statistical Techniques For Research Studies With Small
Samples. American Journal of Physiology-Lung Cellular and Molecular Physiology,
313, L873–L877
Morley, N.J., Ball, L.J. & Ormerod, T.C. (2018). How the detection of insurance fraud
succeeds and fails? Psychology, Crime & Law, 24(4): 264- 277
Mukooza, S. D. (2020), Insurance Regulator Turns to Phones to Curb Fraud, Insurance
Journal, 5(6); 71-81
Mungai, J. N. (2019). Determinants of uptake of Insurance Underwriting On Public Service
Vehicles Plying for Hire in Kenya, Journal of Financial Crime, 23(4), 678–699.
Muniappan, N. (2019). Information Technology in Insurance Sector, Journal of Business and
Management, 5(6); 35-41
Muriuki, R.K. & Luo, C. (2020). Insurance Outlook Report 2020/21 East Africa. Deloitte
Insights, 2(4); 24-32
Murphy, D.K., Mostert, F.J. & Mostert, J.H. (2014). The Underwriting Process of Liability
Insurance in South Africa. Risk Governance and Control Financial Markets &
Institutions 4(1):46-54
Musamali, R.A. (2015). Factors Determining Consumer Fraud Reporting in Kenya, Research
in Applied Economics 6(3):76-97
Nagalakshmi, N., & Subramanian, M. (2016). Performance of Complaints Redressal Practices
in Public and Private Insurance Companies, Companies, Management Studies 8(7);
101-110
Neale, F., Drake, P., & Konstantopoulos, T. (2020). InsurTech and the Disruption of the
Insurance Industry. Journal of Insurance Issues, 43(2), 64-96.
Ngunguni, J. N., Misango, D. S., & Onsiro, D. M. (2020). Examining The Effects of Financial
Factors On Profitability of General Insurance Companies in Kenya. International
Journal of Finance and Accounting, 5(1), 1 – 18.
Ntwali, A., Kituyi, A. & Kengere, A. (2020). Claims Management and Financial Performance
of Insurance Companies in Rwanda: A Case of SONARWA General Insurance
Company LACP. Journal of Financial Risk Management, 9(3), 190-210.
Nyaguthii, J.M. (2014). Determinants of Customer Satisfaction in The Life Insurance Industry
in Kenya, Academy of Management Journal, 16(3); 81-85

84
Odhiambo, T.O. (2017). Evaluation of Fraud Management Strategies Adopted by Insurance
Companies in Kenya, International Journal of Academic Research in Accounting,
Finance and Management Sciences, 8(3); 29-35
Odukoya, O.O. & Samsudin, R.S. (2021). Knowledge Capability and Fraud Risk Assessment
in Nigeria Deposit Money Banks: The Mediating Effect Of Problem Representation,
Cogent Business & Management, 8(1); 145-155
Ogunnubi, M. (2018). Impact of Claims Management on the Profitability of Nigerian Insurance
Company: An Empirical Study of the Non-Life Insurance Sector, International Journal
of Business and Commerce 3(10); 44-52
Olalekan, Y. M. & Sewhenu, D. (2016). Effect Ofof Claim Cost On Insurers’ Profitability in
Nigeria, International Journal of Business and Commerce, 3(10); 1-20
Olalekan, Y.T., Ajemunigbohun, S. S. & Alli, G. A. (2017): A critical Review of Insurance
Claims Management: A Study Of Selected Insurance Companies in Nigeria, SPOUDAI
- Journal of Economics and Business, 67(2); 69-84
Ostagar, A. M. (2018). Impact of Technology and Innovation in Innovation in Insurance sector.
International Journal of Management, IT &Engineering, 253-254.
Owens, E. (2020). Big Data Analytics, Disclosure and Ethical Underwriting: A Balancing Act
within the Motor Insurance Sector, European Research Studies Journal, 20(3), 961-
973
Owolabi, O. A., Oloyede, F. A., Iriyemi, A. B., & Akinola, A. T. (2017). The impact of risk
management on the profitability of insurance companies in Nigeria. International
Journal of Marketing and Technology, 7(6), 1-26.
Oza, D., Padhiyar, D., Doshi, V. & Sunita, P. (2020). Insurance Claim Processing Using RPA
Along with Chatbot, Advances in Science & Technology, 8(2);116-123
Park, Y., Yoon, J., & Speedie, S. (2012). Health Insurance Claim Review Using Information
Technologies, Healthcare Informatics Research 18(3):215-240
Patil, K. & Abhyankar, M. (2019). A Study of Fraud Investigation in Fraudulent Insurance
Claim, Forensic Science, 9(3); 82-87
Ralp, D., Holleran, S., & Ramakrishna, R. (2002). Sample Size Determination, Journal of
Institute of Laboratory Animal Resources 43(4):207-13

85
Rawte, V. & Srinivas, A. (2015). Fraud detection in health insurance using data mining
techniques, Communication, Information & Computing Technology (ICCICT), 1(3);
16-24
Rendek, K., Holtz, J., & Fonseca, V. (2015). The Moment of Truth: Claims Management in
Microinsurance, Microinsurance, 28(2); 198-207
Sadiq, A. (2021). Singapore:Regulation Covering Digitalisation Has Insignificant Effect On
Insurers, Tech insurance, 8(6); 116-125
Salim, A. M. A., & Hamed, F. H. M. (2018). Exploring health insurance services in Sudan
from the perspectives of insurers. SAGE Open Medicine, 18(4); 213-227
SAS Coalition (2019). The State of Insurance Fraud Technology. International Journal of
Engineering, 13(2); 68-79
Saunders, M., Lewis, P. & Thornhill, A. (2016). Research Methods for Business Students. (2nd
Edn). Harlow: Pearson Education.
Schmid, E. (2019). Underwriting Advisor to the Group EC, TechInsurer, 4(4); 28-36
Schober, P., Boer, C., & Schwarte, L.A. (2018). Correlation Coefficients: Appropriate Use and
Interpretation, Anesthesia & Analgesia 126(5):1-21
Scordis, N. (2019). Underwriting, Investing and Value: Evidence from Simulation and from
Market Data. Journal of Insurance Issues, 42(1), 1-36.
Shaw, G. & Baumann, N. (2020). 2021 insurance outlook: Accelerating recovery from the
pandemic while pivoting to thrive, Issues and Practice, 3(9); 73-81
Showkat, N. & Parveen, H. (2017). Non-Probability and Probability, Sampling Approaches,
1(4); 105-115
Sileyew, J. (2019). Research Design and Methodology, Quantitative Methods, 5(1); 48-57
Singh, A. (2020). Old Mutual Insure – Sustainable Digital Transformation In An Evolving
Market, Insuretech, Future Series, 5(3); 45-59
Soye, Y., Adeyemo, D. & Adeyemo, D. (2018). Underwriting Capacity and Income of
Insurance Companies: (A Case of Nigeria). Sustainability of Insurance Industry,
International Journal of Innovative Science and Research Technology 3(10);731- 738
Srinivasa, V. & Muramalla, S. (2020). Customer Relationship Management in insurance
sector-A study of perceptions of customers and employees in Visakhapatnam City,
International Journal of Research in Commerce & Management, 3(3); 112-115

86
Sürücü, L. & Maslakçı, A. (2020). Validity and Reliability in Quantitative Research, Business
& Management Studies: An International Journal, 8(3): 2694-2726
Świeczak, W. & Łukowski, W. (2017). Lead Generation Strategy as a Multichannel
Mechanism of Growth of a Modern Enterprise. Marketing of Scientific and Research
Organizations, 21(3); 105-140.
Taherdoost, H. (2016). Validity and Reliability of the Research Instrument; How to Test the
Validation of a Questionnaire/Survey in a Research, Research Methodology; Method,
Design & Tools 5(3):28-36
Tajudeen, O.Y., Ajemunigbohunb, S.S., & Gbenga, N.A. (2017). A Critical Review of
Insurance Claims Management: A Study of Selected Insurance Companies in Nigeria,
Journal of Economics and Business, 67(2); 69-84
Turner, G.A. (2020). Sampling Frames and Master Samples. United Nations Secretariat.
Statistics Division.
Van Dalen, B., Cusick, K., & Ferris, A. (2021). The rise of the exponential underwriter,
Deloitte Insights, 5(5); 67-73
Van Jaarsveld, J., Mostert, J.F., & Mostert, H.J. (2019). The claims handling process of liability
insurance in South Africa, Corporate Ownership and Control 5(1):133-140
Vanguard, M. (2017). GIS for the Insurance Claims Process: Five Steps for an Effective
Workflow. Sacramento, CA: ESRI White Paper.
Verma, R. & Mani, S. (2019). Using Analytics for Insurance Fraud Detection. Digital
Transformation, 1(3); 1-8
Vineela, D., Swathi, P., Sritha, T. & Ashesh, K. (2020). Fraud Detection in Health Insurance
Claims using Machine Learning Algorithms. International Journal of Recent
Technology and Engineering, 8(5); 57 -66
Wendel, S., De Jong, S., Curfs, E.C. (2017) Consumer evaluation of complaint handling in the
Dutch health insurance market, BMC Health Services Research 11(1):310-316
Wine, N. (2015). The Feasibility of a Shared Data System in the Kenyan Medical Insurance
Sector as a Means to Reduce Fraud, Insurance Technology Advancement, 2(2); 81-90
Wyman, O. & Zhong, A. (2017). Technology-Driven Value Generation in Insurance, Industry
Report, 2(6); 62-71
87
Yadav, R. & Mohania, S. (2015). Claim Settlement Process of Life Insurance Policies in
Insurance Services – A Comparative Study of LIC of India and ICICI Prudential Life
Insurance Company, International Letters of Social and Humanistic Sciences 49:21-29
Yamane, T. (1973). Statistics: An Introductory Analysis. 3rd Edn. New York: Harper & Row.
Yıldırım, I. (2019). Emergence of Insurance Technologies (InsurTech): The Turkish Case.
Finance, Accounting, and Economics, 3(2); 10-17
Yusuf, T. O., & Ajemunigbohun, S. S. (2015). Effectiveness, efficiency and promptness of
claims handling process in the Nigerian insurance industry. Journal of the Chartered
Insurance Institute, 3 (3), 234-246
Zahid, J. (2020). COVID-19 hits North American P&C insurers’ H1 operating performance –
Fitch. S&P Global Market Intelligence, 3(1); 22-31
Zaid, S., Juharsah, J., Yusuf, H., & Suleman, N. R. (2020). The Customer relationship
marketing as the antecedents to increasing customer loyalty. International Journal of
Research in Business and Social Science, 9(5), 245–254.
Zegwaard, K. E., & Hoskyn, K. (2015). A review of trends in research methods in cooperative
education. Cooperative Education 4(4); 59-62
Ziaeifar, M. & Nazeri, S. (2013). Impact of Services Quality and Customer Relationship
Management on Customer Loyalty (Case Study: Iran Insurance), Accounting and
Management, 5(11); 117-129
Zikmund, W.G., Quinlan, C., Griffin, M., Babin, B. & Carr, J. (2019). Business Research
Methods, 2nd Edn. London: Cengage Learning.

APPENDICES
APPENDIX I: INTRODUCTION LETTER
Susan M. Ngiri
ID 660334
Chandaria School of Business
United States International University-Africa
Dear Respondent,
RE: SELF ADMINISTERED SURVEY
I am a graduate student undertaking a Masters of Administration (MBA) degree program at
United States International University – Africa (USIU-A).
In fulfilment of the programs requirement, am undertaking a study on effect of technology
adoption on underwriting processes among top five insurance companies in Nairobi County.
The structured questionnaire is for collecting data from your organization.
This is an academic research and any data collected from your organization will be treated with
utmost confidentiality and your name or that of your organization will not be disclosed in the
final report. If you would wish to have a copy of the final report, kindly provide your email at
the back of the questionnaire
Yours Sincerely,
Susan Ngiri

APPENDIX II: QUESTIONNAIRE
Any information given by the respondent will be treated with confidentiality. Tick inside the
box provided where necessary and for explanation please be brief. Your contribution will be
highly appreciated.
SECTION I: GENERAL INFORMATION
You are requested to fill out your background information in the spaces below (Tick where
applicable).
1. Insurance provider currently working for? CIC [ ] ICEA [ ] BRITAM [ ] Jubilee [ ] APA
[ ]
2. Years of operation in the local market: 1-5 [ ] 6-10 [ ] 11-15 [ ] 15 and
above [ ]
3. How large is the Insurer you are working for(Number of employee)?
Less than 100 [ ] 100-150: [ ] 151-200: [ ] 201-250: [ ]
4. Level of technology adoption:
No implementation at all” =1 [ ] Low level of implementation” =2 [ ] Medium level of
implementation” =3 [ ] High level of implementation” =4 [ ] Advanced level of
implementation” =5 [ ]
5. How familiar are you with the automated online insurance application process?
Very Familiar [ ] Familiar [ ] Moderately Familiar [ ] Less Familiar [ ] Not Familiar
[ ]
6. Approximated duration for handling the following aspects of claim management
(days):
Claim Management Variable # Days
Claims notification process
Verification of records
Claims reserving
Negotiation of payment
Payment of Claims
Total

7. Common forms of fraud in your firm:
i)…………………………………………………..
ii)…………………………………………………..
iiii)………………………………………………..
iv)…………………………………………………
8. Approximated incidences of insurance fraud reported in the last 3 years:
Less than 20 [ ] 20-40 [ ] 41-60 [ ] 61-80 [ ] 81-100 [ ] Above 100
[ ]
9. On a scale of 1 to 5, how would you rate profitability in your firm? where 1 is non-
profitable and 5 most profitable?
1 [ ] 2 [ ] 3 [ ] 4 [ ] 5 [ ]
SECTION II: DIGITIZATION OF CLAIMS PROCESS AND UNDERWRITING
PROCESSES
10. Please indicate on the scale provided below by ticking the extent to which you agree
with the following statements regarding digitization of claims process and underwriting
processes: 5 Very High =4, High =3, Neutral, Medium =2, Low =1
Automated Claims Investigation
ACI1 Automation ensures that the insured provide accurate
information which is verifiable during investigation.
1 2 3 4 5
ACI2 Automation significantly reduces response time to insurance
claim related matters
1 2 3 4 5
ACI3 Automation aids storage of preliminary searchers regarding
the claim.
1 2 3 4 5
ACI4 Automation enhances access to timely information that boosts
evidence on legitimacy or illegitimacy of the claim.
1 2 3 4 5
EUP1 Through technology, insurance innovation capabilities have
increased with the insurer releasing better policies to the
market.
1 2 3 4 5

Automated Claim Processing
ACP1 Significant transactions with related parties, contingent
liabilities, are extensively disclosed in generated reports
1 2 3 4 5
ACP2 The insurer has comprehensively adopted digital claim
processing procedure.
1 2 3 4 5
ACP3 Automation of claim processing has improved the
customer onboarding process
1 2 3 4 5
ACP4 Digital claim processing gives the insurer flexibility to
customize insurance products according to customer
needs
1 2 3 4 5
Automated Claim Settlement
ACS1 Automation has enabled synchronization of several
claims for payment
1 2 3 4 5
ACS2 Digitized claims are paid on a first come first pay
basis
1 2 3 4 5
ACS3 Automated claims workflow allows the customer to
keep track of the progress made on the claim
settlement process without having to visit the branch
1 2 3 4 5
ACS4 Automated claims management process has robust
validation process that shortens the validation phase
1 2 3 4 5
EUP2 The insurer has recorded a sustainable positive
growth in the local insurance market share
1 2 3 4 5
EUP3 The average cost of operations has declined due to
automation practices by the insurer.
1 2 3 4 5
SECTION III: FRAUD DETECTION AND UNDERWRITING PROCESSES
11.Please indicate your level of agreement with the following statements on effect of
automated fraud detection and underwriting processes. (1. Strongly Agree (SA) 2. Agree (A)
3. Neutral (N) 4. Disagree (D) 5. Strongly Disagree (SD)).

Extent of Fraud in Insurance Sector
FIS1 The insurer encounters the risk of inability to meet
claims due to fraudulent claims from policyholders
1 2 3 4 5
FIS2 General insurance policies record the greatest number of
fraudulent claims.
1 2 3 4 5
FIS3 Life assurance policies record the greatest number of
fraudulent claims.
1 2 3 4 5
FIS4 The insurer registers multiple fraud incidences every
quarter
1 2 3 4 5
EUP5 There is a high chances of re-purchase of insurance cover
from this insurer.
1 2 3 4 5
Automated Fraud Detection Framework
ADF1 The insurer capitalizes on technology to strengthen
internal controls
1 2 3 4 5
ADF2 The insurer has established monitoring system to detect
fraud
1 2 3 4 5
ADF3 Technology aids reporting of fraud losses to the
auditors, AKI, and IRA
1 2 3 4 5
ADF4 Automation enables prompt reporting of suspected
fraud cases to the IFIU
1 2 3 4 5
Modern Fraud Prevention Tools and Softwares
MPT1 All our financial statements are published online
through a working website platform.
1 2 3 4 5
MPT2 Targeted training on fraud prevention/
management is undertaken online.
1 2 3 4 5
MPT3 The insurer employs digital screening techniques
of potential policy holders
1 2 3 4 5
MPT4 Technology is employed in providing early
warning to the underwriters of the looming
fraudulent claim
1 2 3 4 5
EUP6 The insurer's staff has high-efficiency in
providing the service
1 2 3 4 5

SECTION IV: CUSTOMER RELATIONSHIP MANAGEMENT AND
UNDERWRITING PROCESSES
12.Please indicate on the scale provided below by ticking the extent to which you agree with
the following statements about the nature of CRM in your insurance firm and underwriting
processes: Great Extent=4, Moderate Extent=3, Small Extent=2, Not at all=1
Customer Service
CRM1 The insurer's staff provide service to customers as a priority
entry into the company without exceeding
1 2 3 4 5
CRM2 The insurer's staff are ready to provide assistance to the
policyholders
1 2 3 4 5
CRM3 The insurer's staff respond to the customer's needs,
whatever the degree of concern
1 2 3 4 5
CRM4 The insurer is committed to its promises toward the
customer
1 2 3 4 5
EUP7 The insurer is always meeting customer expectations 1 2 3 3 5
Sales and Customer Service CRM Solutions
SCRM1 Cross-selling, up-selling of insurance policy is
facilitated by CRM
1 2 3 4 5
SCRM2 CRM lead management campaigns have attracted
additional policyholders.
1 2 3 4 5
SCRM3 CRM aids growth in insurance policy conversion
rates
1 2 3 4 5
SCRM4 CRM facilitates collection of appropriate customer
information
1 2 3 4 5
EUP8 The insurer’s staff use technology for learning
reasons
1 2 3 4 5
EUP9 The switching behavior among customers to peer
insurers is quite low.
1 2 3 4 5

Customer Complaint Management
CCM1 The insurer’s management is concerned with customer
complaints/queries
1 2 3 4 5
CCM2 The insurer has the capacity to provide the service without
interruption
1 2 3 4 5
CCM3 The insurer is always fast to implement improvement
feedback around claims management
1 2 3 4 5
CCM4 There is a culture of sharing concerns of customers with the
insurer
1 2 3 4 5
CCM 5 All the complains from policyholders are addressed on time
by the insurer
1 2 3 4 5
EUP10 The insurer’s staff has capacity to provide services easily 1 2 3 4 5
Thank you for taking your time to participate in this survey!!!

APPENDIX III: RESEARCH INFORMED CONSENT
TITLE OF STUDY
EFFECT OF TECHNOLOGY ADOPTION ON UNDERWRITING PROCESSES AMONG
TOP FIVE INSURANCE COMPANIES IN NAIROBI COUNTY
PRIMARY RESEARCHER
Name – Ngiri Mugechi Susan
Department – Business Administration
Institution - United States International University-Africa
Address – P.O. Box 14634-00800 City Nairobi State Kenya
Phone - +254 720 532568
Email – [email protected]
PURPOSE OF STUDY
The purpose of the study is to examine the effect of technology adoption on underwriting
processes among top five insurance companies in Nairobi County. Please read this form and
ask any questions that you may have before agreeing to be in the research.
PROCEDURES
If you agree to be a participant in this research, you will be asked to complete a questionnaire.
Filling of the questionnaires will take approximately two weeks after which they will be picked
for analyses. In the questionnaire, you will be asked to give your views on the effects of
technology adoption on underwriting processes among top five insurance companies in Nairobi
County.
RISKS
There are no expected risks to your participation. If you feel uneasy at responding to some
questions, please feel free to skip the question.
BENEFITS
There will be no direct benefit to you, however, your participation is likely to help in finding
out more about the effect of technology adoption on underwriting processes among top five
insurance companies in Nairobi County.
CONFIDENTIALITY
Please do not write any identifying information.
Every effort will be made by the researcher to preserve your confidentiality including the
following:
Assigning code names/numbers for participants that will be used on all research notes
and documents
Keeping notes, interview transcriptions, and any other identifying participant
information in a locked file cabinet in the personal possession of the researcher.
Participant data will be kept confidential except in cases where the researcher is legally
obligated to report specific incidents. These incidents include, but may not be limited to,
incidents of abuse and suicide risk.
COMPENSATION
You will not receive any payment for your participation in this research study.
CONTACT INFORMATION
If you have questions at any time about this study, or you experience adverse effects as the
result of participating in this study, you may contact the researcher whose contact information
is provided on the first page. If you have questions regarding your rights as a research
participant, or if problems arise which you do not feel you can discuss with the Primary
Researcher directly by telephone at +254 720 532568 or at the following email address
VOLUNTARY PARTICIPATION
Your participation in this study is voluntary. It is up to you to decide whether or not to take
part in this study. If you decide to take part in this study, you will be asked to sign a consent
form. After you sign the consent form, you are still free to withdraw at any time and without

giving a reason. Withdrawing from this study will not affect the relationship you have, if any,
with the researcher. If you withdraw from the study before data collection is completed, your
data will be returned to you or destroyed.
CONSENT
I have read and I understand the provided information and have had the opportunity to ask
questions. I understand that my participation is voluntary and that I am free to withdraw at any
time, without giving a reason and without cost. I understand that I will be given a copy of this
consent form. I voluntarily agree to take part in this study.
Participant's Signature _____________________________ Date __________
Researcher’s Signature _____________________________ Date ___________

APPENDIX IV: DEBREIF FORM
UNITED STATES INTERNATIONAL UNIVERSITY-AFRICA
EFFECT OF TECHNOLOGY ADOPTION ON UNDERWRITING PROCESSES AMONG
TOP FIVE INSURANCE COMPANIES IN NAIROBI COUNTY
Thank you for participating as a research participant in the study concerning your view of the
effects of technology adoption in underwriting processes among leading insurance firms in
Nairobi County.
What you should know about this study
This research will adopt a descriptive research design with the intention of building a
relationship on the effect of technology in supporting underwriting processes among top five
insurance companies in Nariobi County This research design is ideal for this research as it
helped in describing, explaining and validating the research findings. A descriptive research
design uses questionnaires, which will be my primary data collection method, thus making the
descriptive research design even more ideal for this research.
This study adopts a stratified simple sampling technique. This technique involves dividing the
population into smaller groups known as strata which are organized based on shared attributes
of the members in the population. The population of the current study has been stratified based
on the top 5 leading insurance firms in Nairobi County. The questionnaires shall be
administrated to the research sample.
Right to withdraw data
You may choose to withdraw the data you provided prior to debriefing, without penalty or
loss of benefits to which you are otherwise entitled. Please indicate below if you do, or do
not, give permission to have your data included in the study:

I give permission for the data collected from or about me to be included in the study.
I DO NOT give permission for the data collected from or about me to be included in
the study.
If you have questions
The main researcher conducting this study is Ngiri Mugechi Susan, a graduate student at the
United States International University-Africa, Department of Business Administration. Please
ask any questions you have now. If you have questions later, you may contact Ngiri Mugechi
Susan at [email protected] or at [+254 720 532568]. If you have any questions or
concerns regarding your rights as a research participant in this study, you may contact the
researcher’s supervisor at [email protected] or at [+254 722 805371]. You may also contact
the Institutional Review Board (IRB) at [email protected].
Final Report: If you would like to receive a copy of the final report of this study or a summary
of the findings when it is completed, please feel free to contact the researcher.
Your signature below indicates that you have been debriefed, and have been given an
opportunity to ask questions about the study, and all the questions have asked have been
answered to the best of the researcher’s knowledge and ability. A copy of this debriefing
form has been provided to the participant.
_________________________ _______________________
Name of Researcher Signature Date
_________________________ _______________________
Name of Participant Signature Date
Please sign both copies, keep one and return one to the researcher.
*** Please keep a copy of this form for your future reference. Once again, thank you for
your participation in this study! ***

APPENDIX V: IRB CONFIDENTIALITY FORM
This confidentiality form is a legal agreement between USIU-A’s IRB and the undersigned
principal investigator who will have access to individually-identifiable original records
(electronic or paper), or any other matters regarding the research process.
IRB Research Number:
PI Name: Date: May 19, 2021
Title of Research: EFFECT OF TECHNOLOGY ADOPTION ON UNDERWRITING
PROCESSES AMONG TOP FIVE INSURANCE COMPANIES IN NAIROBI COUNTY
In conducting this research project, I agree to the following:
1. Keep all the research information shared with me confidential by not discussing or
sharing the research information in any form or format.
2. Keep all research information in any form or format securely maintained on a daily
basis, during the process of conducting and writing the research.
3. At the conclusion of the research, dispose of any documents that contain identification
information, such as participant names or other information that could reveal identity
of the human subject.
4. Monitor all research assistants, administrative persons, supporting on this research
study to ensure their compliance to confidentiality.
Any violation of this agreement would constitute a serious breach of ethical standards, and I
pledge not to do so.
Principal Investigator
_
Print Name Signature Date
Witness Name Signature Date

APPENDIX VI: USIU-AFRICA INTRODUCTION LETTER

APPENDIX VII: RESEARCH ETHICAL LETTER

APPENDIX VIII: NACOSTI PERMIT