effect of temperature, contact time and agitation speed during pre
TRANSCRIPT

EFFECT OF TEMPERATURE, CONTACT TIME
AND AGITATION SPEED DURING PRE-
TREATMENT ON ELUTION OF GOLD
by
TEMITOPE PHILIP OLADELE
Thesis presented in partial fulfilment of the requirements for the Degree
of
MASTER OF ENGINEERING
(EXTRACTIVE METALLURGICAL ENGINEERING)
in the Faculty of Engineering at Stellenbosch University
Supervisor
Prof. Steven Bradshaw
Co-Supervisor
Dr. Neil Snyders
December 2015

Page ii
Declaration
By submitting this thesis electronically, I declare that the entirety of the work contained
therein is my own, original work, that I am the sole author thereof (save to the extent
explicitly otherwise stated), that reproduction and publication thereof by Stellenbosch
University will not infringe any third party rights and that I have not previously in its
entirety or in part submitted it for obtaining any qualification.
Date: ………………
Copyright © 2015 Stellenbosch University
All rights reserved
Stellenbosch University https://scholar.sun.ac.za
Page iii
Abstract
The pronounced effect of the caustic cyanide (NaOH-NaCN) pre-treatment step of the
Anglo American Research Laboratory (AARL) gold (Au) elution process has been
widely investigated. However, research into the reaction kinetics of this step is lacking
and a set industry standard is yet to be determined, i.e., pre-treatment temperature,
contact time and reactor conditions (reactor design and agitation). Among these reactor
conditions, the effect of agitation that significantly improves mass transfer processes
has not been investigated in the presence of NaOH-NaCN on Au elution recovery. This
present study investigates the role of cyanide ( CN ) during pre-treatment as well as the
effect of temperature, contact time and agitation speed on the Au elution recovery. A
suitable elution mechanism was proposed from the results obtained.
Experiments were statistically designed using a Box Behnken experimental design. The
agitation (stirring speed) was correlated by Power number and Reynolds number.
It was shown that Au elution recovery increased by approximately 15% after 6 Bed
volumes (BVs) as the pre-treatment temperature increased from 25°C to 80°C which is
in agreement with findings by previous researchers. The effect of contact time on Au
elution recovery was found to be statistically insignificant between 15 and 45 min. At
25oC, an increase in the recovery of Au of about 4% was seen from 15 to 45 min.
Based on the trends of the experimental result and the validity of the statistically
determined model to predict the effect of pre-treatment parameters on Au elution
recovery, the effect at < 15 min or > 45 min can also be estimated from the result. An
increase in the pre-treatment time had an insignificant effect on the subsequent elution
recovery at 53oC and 80oC. It was suggested that an increase in the temperature
minimises the effect of contact time on the overall Au elution recovery. The effect of
agitation showed a decrease of about 10% in Au elution recovery when the agitation
speed was increased from 0 to 1200 rev/min. The effect of agitation speed was more
significant at 80oC. Further evaluation of solid-liquid mass transfer coefficient SLk of
CN in the pre-treatment medium showed no significant change in the value of SLk
from 0 to 1200 rev/min. The results obtained confirmed that the elution process was not
limited by diffusion.
Stellenbosch University https://scholar.sun.ac.za

Page iv
Several researchers have proposed different elution mechanisms with regards to the
functional role of CN . These mechanisms were evaluated based on the results of the
current study. It was found that the mechanism where the CN is involved in a specific
chemical reaction at the carbon surface which increases the negative charge density
and renders the surface less receptive for adsorption, was suggested to be more
plausible than the oxidation and hydrolysis of CN . Further investigation on loaded
activated carbon that was thermally regenerated showed that CN is required to
convert solid Au particle to soluble
2CNAu which will require longer pre-treatment
times and higher concentrations of CN . Finally, the relevance of this study was shown
to be applicable in gold processing plants where a significant amount of Au remains on
carbon after elution, particularly where CN free elution is being practised in order to
minimise Au loss with the tailings dam.
Stellenbosch University https://scholar.sun.ac.za
Page v
Opsomming
Die beduidende effek van die bytende sianiedvoorbehandeling stap vir die Anglo
Amerikaanse Navorsing Laboratorium (AARL) goud eluering proses is al deeglik
bestudeer. Nietemin is navorsing oor die reaksie kinetika gebrekkig en ʼn
industriestandaard moet nog bepaal word m.b.t. voorbehandelingstemperatuur, tyd en
reaktor toestande (reaktorontwerp en menging). Die effek van menging op Au
herwinning in die teenwoordigheid van NaOH-NaCN is nog nie ondersoek nie. Die
huidige werk bestudeer die rol van CN gedurende die voorbehandelingstap sowel as
die effek van temperatuur, kontaktydperk en roerderspoed op die herwinning van goud
deur eluering. ʼn Gepaste eluerings-meganisme is voorgestel gebaseer op die resultate
wat verkry is.
Eksperimente is statisties ontwerp deur gebruik te maak van ʼn Box Behnken
eksperimentele ontwerp met drie faktore en drie vlakke. Veranderlikes soos
reaktorontwerp, stuwerdeursnee asook die vorm van die stuwer is saamgegooi met
roerderspoed en is gekorreleer deur ʼn mag-nommer en ʼn Reynolds getal.
Daar is gesien dat verhoging in voorbehandelingtemperatuur vanaf 25°C tot 80°C die
herwinning van goud deur eluering verhoog het met nagenoeg 15% na afloop van 6
bedvolumes. Hierdie waarneming het ooreengestem met bevindings van ander
navorsers. Daar is bevind dat die effek van kontaktydperk statisties onbeduidend was
tussen 15 tot 45 min. ʼn Verlenging van voorbehandelingtydperk het ʼn onbeduidende
uitwerking op herwinning deur eluering by 53°C en 80°C gehad. Dit is voorgestel dat die
verhoging in temperatuur die effek van kontaktydperk minimeer op algehele goud
herwinning deur eluering. ʼn Verhoging in roerderspoed vanaf 0 tot 1200 rpm het ʼn
afname van nagenoeg 10% goud herwinning van eluering tot gevolg gehad. Die effek
van roerderspoed was meer beduidend by 80°C. ʼn Ondersoek van die vloeistof-
vastestof massa-oordrag koëffisiënt (kSL) van CN in die voorbehandelingmedium het
geen beduidende verandering getoon met verhoging in roerderspoed vanaf 0 tot 1200
rpm nie. Resultate het daarop gedui dat die elueringsproses nie beperk was deur
diffusie nie.
Verskeie navorsers het verskillende eluerings-meganismes voorgestel m.b.t. die
funksionele rol van CN . Die voorgestelde meganismes is ondersoek deur vergelyking
met resultate wat verkry was tydens eksperimentele ondersoek van voorbehandelings
Stellenbosch University https://scholar.sun.ac.za

Page vi
veranderlikes. Die meganisme waar CN betrokke is by ʼn spesifieke chemiese reaksie
op die koolstof oppervlak wat die negatiewe ladingsdigtheid verhoog en sodoende die
oppervlak minder vatbaar maak vir adsorpsie, is voorgestel as meer waarskynlik as die
oksidasie en hidrolise van CN . Ondersoek van termiesgeregenereerde
geaktiveerdekoolstof het gewys dat CN- nodig is om soliede Au te omskep na oplosbare
2CNAu wat ‘n langer voorbehandelingstydperk en hoër CN- konsentrasies benodig.
Ten slotte, die toepaslikheid van hierdie studie is beduidend waar goud in
goudverfyningsaanlegte agterbly op koolstof na eluering en veral waar sianied-eluering
toegepas word met die oog op vermindering van goudverliese op geëlueerde koolstof.
Stellenbosch University https://scholar.sun.ac.za

Page vii
Acknowledgements
First and foremost, I want to give all the glory to God and my saviour for the gift of life
and strength granted onto me in the course of this research and for making it possible
“With God all things are possible Mark 10:27 b”.
I greatly acknowledge the Process Engineering department of Stellenbosch University
for their financial support and assistance rendered regarding all analysis by Mrs Botha
Hanlie.
My profound gratitude goes to my supervisors; Prof Steven Bradshaw and Dr. Neil
Snyders for their encouragement and training as a researcher during this period. Many
thanks for your time, wealth of experience, guidance and unhindered access into your
office anytime I came for help.
To the members of my families especially my parents, Engr. and Mrs S.O Oladele,
thank you for your encouragement. May you live long to enjoy the fruit of your labour on
me. Sade, Bimbo, Oxy, and Tanmolas’ are not left out.
Finally to my loved ones, brothers, friends and well-wishers such as Temitayo Adeleke,
Dr. Tobi Fadiji, Toyosi Craig, Dr Femi Olaoye, Christianah Oyindamola Olojede, Dr
Arnotte, Willem Rossouw, Brian Mwewa, Neil Knobloch, all post graduate students in
Process Engineering, Pastor Funlola Olojede and all the members of RCCG desire of
nations, Stellenbosch. Thank you for your support, motivations and prayers.
Stellenbosch University https://scholar.sun.ac.za
Page viii
Table of contents
Declaration..................................................................................................................................ii
Abstract ..................................................................................................................................... iii
Opsomming ............................................................................................................................... v
Acknowledgements ................................................................................................................... vii
Table of contents ..................................................................................................................... viii
List of figures ........................................................................................................................... xiii
List of tables ............................................................................................................................. xvi
Nomenclature .......................................................................................................................... xix
Abbreviations ............................................................................................................................ xx
1 Introduction ......................................................................................................................... 1
1.1 Background ................................................................................................................. 1
1.2 Problem statement ....................................................................................................... 2
1.3 Research questions ..................................................................................................... 2
1.4 Research objectives..................................................................................................... 3
1.5 Project scope ............................................................................................................... 3
1.6 Significance of the project ............................................................................................ 3
1.7 Structure of thesis ........................................................................................................ 4
2 Literature review: Gold process, activated carbon, adsorption and elution .......................... 5
2.1 Overview of gold process ............................................................................................. 5
2.2 Properties and application of activated carbon ............................................................. 8
2.2.1 Structure and functional groups in activated carbon .............................................. 9
2.3 Adsorption ................................................................................................................. 10
2.3.1 Carbon in pulp process ....................................................................................... 11
2.3.2 Carbon in leach................................................................................................... 13
2.4 Adsorption mechanism .............................................................................................. 13
2.4.1 Theory A: Reduction mechanism ........................................................................ 14
2.4.2 Theory B: Electrostatic attraction mechanism ..................................................... 14
Stellenbosch University https://scholar.sun.ac.za

Page ix
2.4.3 Theory C: Ion pair mechanism ............................................................................ 15
2.4.4 Theory D: Non ion pair mechanism ..................................................................... 15
2.5 Adsorbed gold species ............................................................................................... 16
2.6 Adsorption factors ...................................................................................................... 16
2.6.1 Ionic strength ...................................................................................................... 16
2.6.2 pH ....................................................................................................................... 17
2.6.3 Presence of oxygen ............................................................................................ 18
2.6.4 Free cyanides ..................................................................................................... 18
2.6.5 Temperature ....................................................................................................... 18
2.7 Preliminary summary on adsorption ........................................................................... 19
2.8 Elution ....................................................................................................................... 19
2.8.1 AARL elution process ......................................................................................... 20
2.9 Factors affecting elution ............................................................................................. 22
2.9.1 Effect of temperature .......................................................................................... 22
2.9.2 Effect of cyanide and hydroxide concentration. ................................................... 24
2.9.3 Effect of cations .................................................................................................. 24
2.9.4 Flow rate ............................................................................................................. 25
2.10 Elution mechanism .................................................................................................... 26
2.10.1 Mechanism based on the nature of the adsorbed gold ........................................ 27
2.10.2 Mechanism based on competitive adsorption of CN- ........................................... 27
2.10.3 Mechanism based on passivation of the carbon surface ..................................... 28
2.10.4 Mechanism based on the modification of functional group of activated carbon ... 28
2.11 Nucleophilic-electrophilic reaction mechanism ........................................................... 29
2.12 Behaviour of cyanide and pre-treatment operation. .................................................... 30
2.12.1 Chemical behaviour of cyanide ........................................................................... 30
2.13 Mass transfer theory .................................................................................................. 33
2.14 Pre-treatment operation ............................................................................................. 34
2.15 Summary on literature review .................................................................................... 36
Stellenbosch University https://scholar.sun.ac.za

Page x
3 Materials and methodology ............................................................................................... 38
3.1 Materials .................................................................................................................... 38
3.1.1 Preparation of activated carbon .......................................................................... 38
3.1.2 Preparation of alkaline buffer solution ................................................................. 39
3.1.3 Preparation of synthetic gold solution ................................................................. 39
3.2 Methodology .............................................................................................................. 40
3.2.1 Phase 1: Adsorption stage .................................................................................. 40
3.2.2 Phase 2: Pre-treatment stage ............................................................................. 41
3.2.3 Phase 3: Elution stage ........................................................................................ 43
3.2.4 Chosen point of analysis ..................................................................................... 45
3.3 Experimental design .................................................................................................. 46
3.3.1 Choice of levels .................................................................................................. 49
3.3.2 Pre-treatment temperature .................................................................................. 49
3.3.3 Pre-treatment time .............................................................................................. 50
3.3.4 Agitation speed ................................................................................................... 50
3.4 Method of analysis ..................................................................................................... 52
3.4.1 ICP_OS .............................................................................................................. 52
3.4.2 Silver nitrate titration ........................................................................................... 52
3.4.3 Scanning electron microscopic analysis .............................................................. 52
3.4.4 Measurement of natural or dissolved oxygen ...................................................... 53
3.5 Chapter summary ...................................................................................................... 53
4 Results and discussion ..................................................................................................... 54
4.1 Adsorption result ........................................................................................................ 54
4.2 Elution results ............................................................................................................ 54
4.2.1 Gold elution after pre-treatment .......................................................................... 55
4.3 Effect and role of caustic-cyanide during pre-treatment. ............................................ 57
4.4 Cyanide loss during pre-treatment condition .............................................................. 61
4.5 Effect of selected parameters on the elution of gold. .................................................. 66
Stellenbosch University https://scholar.sun.ac.za

Page xi
4.5.1 Effect of temperature .......................................................................................... 66
4.5.2 Effect of contact time .......................................................................................... 68
4.5.3 Effect of agitation speed ..................................................................................... 72
4.6 Proposed mechanism ................................................................................................ 79
4.6.1 Evaluating the previous mechanisms .................................................................. 79
4.6.2 Possible site(s) of reaction mechansim ............................................................... 80
4.6.3 Reaction mechanisms......................................................................................... 81
4.7 Industrial application .................................................................................................. 85
4.7.1 Effect of oxygen supply during pre-treatment ...................................................... 87
4.7.2 Effect of pre-treatment parameters on goldplat regenerated carbon ................... 88
4.8 Chapter summary ...................................................................................................... 89
5 Statistical analysis of results ............................................................................................. 91
5.1 Pareto chart ............................................................................................................... 93
5.2 Regression model ...................................................................................................... 94
5.3 Model adequacy test .................................................................................................. 94
5.4 Model validation ......................................................................................................... 95
5.5 Pre-treatment parameters within the confidence interval ............................................ 96
5.5.1 Pre-treatment temperature within ±95% confidence level ................................... 96
5.5.2 Contact time within ±95% confidence level ......................................................... 97
5.5.3 Agitation speed within ±95% confidence level ..................................................... 99
5.6 Optimum condition ................................................................................................... 100
5.7 Experimental error and reproducibility ...................................................................... 101
5.7.1 Cyanide loss study ............................................................................................ 102
5.7.2 Elution .............................................................................................................. 106
5.8 Chapter Summary .................................................................................................... 108
6 Conclusions and Recommendations ............................................................................... 109
6.1 Conclusions ............................................................................................................. 109
6.2 Recommendations ................................................................................................... 110
Stellenbosch University https://scholar.sun.ac.za

Page xii
7 References ..................................................................................................................... 111
Appendix A: Experimental steps, risks and precautions ......................................................... 125
Appendix B: Sample preparation and supporting calculations ................................................ 129
Appendix C: Results of experimental anaysis ........................................................................ 133
Appendix D: Pictures of experimental setup ........................................................................... 150
Appendix E: Publication based on this thesis ......................................................................... 154
Stellenbosch University https://scholar.sun.ac.za

Page xiii
List of figures
Figure 2.1: Simplified flow-sheet of a gold processing plant. ..................................................... 6
Figure 2.2: Activated carbon derived from coconut shell ............................................................ 8
Figure 2.3: Graphitic structure of activated carbon. . .................................................................. 9
Figure 2.4: Examples of Oxygen functional group .................................................................... 10
Figure 2.5: CIP circuit ............................................................................................................. 11
Figure 2.6: Proposed interaction between activated carbon and
2Au(CN) . ............................ 16
Figure 2.7: Effect of cations ..................................................................................................... 17
Figure 2.8 Typical Elution columns. ......................................................................................... 20
Figure 2.9: Simplified flow sheet of AARL. . ............................................................................. 21
Figure 2.10. Illustration of effect of elution flow rate on the Au elution profile also showing the
elution peak of each elution curve. .......................................................................................... 26
Figure 2.11: Formation of HCN and CN- with change in pH. .................................................... 31
Figure 2.12: Eh-pH diagram of CN-H2O system at 25oC.. ........................................................ 32
Figure 3.1: Schematic diagram of adsorption setup. ................................................................ 41
Figure 3.2: Unbaffled reactor used in the study. ....................................................................... 42
Figure 3.3: Experimental set-up of pre-treatment process. ....................................................... 43
Figure 3.4: Schematic diagram of the step-up for elution process. .......................................... 44
Figure 3.5: Illustration of the different recovery curves detected .............................................. 46
Figure 4.1: Description of Au elution curve. ............................................................................. 56
Figure 4.2: Effect of rinsing of excessive Na from the surface of pre-treated carbon. .............. 59
Figure 4.3: Effect of rinsing of excessive free cyanide from the surface of pretreated carbon . 60
Figure 4.4: Cyanide behaviour in solution at 25oC, 0 rev/min, and 60 min. ............................... 62
Figure 4.5: Cyanide behaviour in solution at 53oC, 0 rev/min, and 60 min. ............................... 62
Figure 4.6: Cyanide behaviour in solution at 80oC, 0 rev/min, 60 min ....................................... 63
Figure 4.7: Combined Eh-pH diagram of CN-H2O at 25oC, 53oC and 80oC .............................. 65
Figure 4.8 The effect of pre-treatment temperature on the elution recovery of Au. .................. 67
Stellenbosch University https://scholar.sun.ac.za

Page xiv
Figure 4.9: Surface response plot of interaction of effect of contact time and temperature at 0
rev/min. .................................................................................................................................... 67
Figure 4.10: The effect of pre-treatment time on the elution recovery of Au for different agitation
speeds. .................................................................................................................................... 69
Figure 4.11: The effect of pre-treatment time on the elution recovery of Au for different agitation
speeds. .................................................................................................................................... 69
Figure 4.12: The effect of pre-treatment time on the elution recovery of Au for different agitation
speeds. . .................................................................................................................................. 70
Figure 4.13: Surface response plot of interaction of effect of agitation speed and temperature at
15 min ...................................................................................................................................... 70
Figure 4.14: Surface response plot of interaction of effect of agitation speed and temperature at
30 min ...................................................................................................................................... 71
Figure 4.15: Surface response plot of interaction of effect of agitation speed and temperature at
45 min. ..................................................................................................................................... 71
Figure 4.16: The effect of pre-treatment agitation on the elution recovery of Au. (Pre-treatment
with 1% NaOH and 3% NaCN at 25°C, elution at 90°C) ........................................................... 72
Figure 4.17: The effect of pre-treatment agitation on the elution recovery of Au. (Pre-treatment
with 1% NaOH and 3% NaCN at 53°C, elution at 90°C) ........................................................... 73
Figure 4.18: The effect of pre-treatment agitation on the elution recovery of Au. (Pre-treatment
with 1% NaOH and 3% NaCN at 80°C, elution at 90°C) ........................................................... 73
Figure 4.19: Surface response plot of interaction of effect of agitation speed and contact time at
25oC ......................................................................................................................................... 74
Figure 4.20: Surface response plot of interaction of effect of agitation speed and contact time at
53oC ......................................................................................................................................... 74
Figure 4.21: Surface response plot of interaction of effect of agitation speed and contact time at
80oC. ........................................................................................................................................ 75
Figure 4.22: The effect of agitation speed on carbon loaded with Au obtained from carbon
granules at the agitation speed of 600rev/min ......................................................................... 76
Figure 4.23: The effect of agitation speed on carbon loaded with Au obtained from carbon
granules at the agitation speed of 1200rev/min ....................................................................... 76
Figure 4.24: Effect of increasing agitation speed from 0 to 1200rev/min on SLk at 25oC, 53oC
and 80oC .................................................................................................................................. 79
Stellenbosch University https://scholar.sun.ac.za

Page xv
Figure 4.25: Molecular orbital diagram of hydrogen molecule. ................................................. 84
Figure 4.26: Illustration of LUMO-HOMO interaction of carbonyl vs CN and OH ................ 85
Figure 4.27: SEM analysis of Goldplat loaded carbon after regeneration in kiln. ...................... 86
Figure 4.28: Visual Spectra of Au detection on carbon surface ................................................ 86
Figure 5.1: illustration of quadratic effect and linear effect on a response ................................ 92
Figure 5.2:Pareto plot for standardised effect of pre-treatment temperature, speed contact time
and its intrraction on Au elution recovery ................................................................................. 93
Figure 5.3: Plot of Observed vs predicted values of Au elution recovery at 6 bedvolumes ....... 95
Figure 5.4: Probability plot vs Residuals of Au recovery at 6 bed volumes. .............................. 96
Figure 5.5: Effect of temperature within ±95% confidence level. .............................................. 97
Figure 5.6: Effect of contact time within ±95% confidence level. ............................................. 98
Figure 5.7: Effect of agitation speed within ±95% confidence level .......................................... 99
Figure 5.8: Surface response plot showing the optimum recovery at point x. ........................ 100
Figure 5.9: Optimum condition for validation of statistically determined optimum condition. pre-
treatment condition ............................................................................................................... 101
Figure 5.10: Reproducibility of CN- and Na+ in the absence of AC. ....................................... 102
Figure 5.11: Reproducibility of CN- and Na+ in the presence of AC ....................................... 104
Figure 5.12: Reproducibility plot of elution experiment. ......................................................... 106
Figure 5.13: Descriptive Duncan analysis of the elution experiment. ..................................... 107
Stellenbosch University https://scholar.sun.ac.za
Page xvi
List of tables
Table 2.1: Description of gold process ....................................................................................... 7
Table 2.2: Proposed adsorption mechanisms .......................................................................... 14
Table 2.3: Reported AARL conditions at different Gold plant ................................................... 35
Table 3.1: Properties of the activated carbon used in the study ............................................... 38
Table 3.2: Elution sampling points ........................................................................................... 45
Table 3.3: Conditions used during the elution process. ............................................................ 45
Table 3.4: Box-Behnken Experimental design in standard order .............................................. 47
Table 3.5: Box-Behnken Experimental design in random order ................................................ 47
Table 4.1: Overview of experimental result of Au elution at different pre-treatment conditions. 55
Table 4.2: Description of the divided sections of elution curve ................................................. 56
Table 4.3: Concentration (M) of CN at 15-min interval after elimination of vapourisation ... 63
Table 4.4: Effect of agitation speed at different temperatures on carbon fines ......................... 77
Table 4.5: Results of CN- (M) measured at different pre-treatment conditions at 15 min time
intervals ................................................................................................................................... 78
Table 4.6. Dissolved (natural) oxygen (mg/L) measured at different time intervals during pre-
treatment with loaded activated carbon sourced from Goldplat Recovery (PTY) at different
temperature without stirring. ..................................................................................................... 87
Table 4.7: Effect of oxygen supply during pre-treatment on elution at 6 BV. Conditions 3%
NaCN, 1% NaOH, no agitation, 30 min .................................................................................... 88
Table 4.8: Elution recovery at 20 bed volumes, 80oC, different concentration of cyanide,
agitation speed and contact time. ............................................................................................. 89
Table 5.1: ANOVA table showing the effect of factors in terms of Au elution recovery at 6BV .. 91
Table 5.2: Average concentration, SD and CR. Condition (25oC, 0 rev/min, No-AC) ............. 103
Table 5.3: Average concentration, SD and CR. Condition (80oC, 0 rev/min, No-AC) .............. 103
Table 5.4: Average concentration, SD and CR. Condition (25oC, 0 rev/min, No-AC) .............. 103
Table 5.5: Average concentration, SD and CR. Condition (80oC, 0 rev/min, No-AC) ............. 104
Table 5.6: Average concentration, SD and CR. Condition (25oC, 0rpm, AC) .......................... 105
Table 5.7: Average concentration, SD and CR. Condition (80oC, 0rpm, AC) .......................... 105
Stellenbosch University https://scholar.sun.ac.za
Page xvii
Table 5.8: Average concentration, SD and CR . Condition (25oC, 0rpm, AC) ......................... 105
Table 5.9: Average concentration, SD and CR . Condition (80oC, 0rpm, AC) ......................... 106
Table 5.10: Average concentration, SD and CR for elution results ......................................... 107
Table C. 1. ICP result for pre-treatment condition at 25oC, 600rpm, 45 minutes ..................... 133
Table C. 2. ICP result for pre-treatment condition at 80oC, 600rpm, 15, minutes .................... 134
Table C. 3. ICP result for pre-treatment condition at 80oC, 1200rpm, 30 minutes ................... 134
Table C. 4. ICP result for pre-treatment condition at 80oC, 600 rpm, 45 minutes .................... 135
Table C. 5. ICP result for pre-treatment condition at 25oC, 600 rpm, 15 minutes .................... 135
Table C. 6. ICP result for pre-treatment condition at 53oC, 0rpm, 15 minutes ........................ 136
Table C. 7. ICP result for pre-treatment condition at 25oC, 0rpm, 30 minutes ........................ 136
Table C. 8. ICP result for pre-treatment condition at 80oC, 0rpm, 30 minutes ........................ 137
Table C. 9. ICP result for pre-treatment condition at 25oC, 1200rpm, 30 minutes ................... 137
Table C. 10. ICP result for pre-treatment condition at 53oC, 0rpm, 45 minutes ....................... 138
Table C. 11. ICP result for pre-treatment condition at 53oC, 1200rpm, 15 minutes ................. 138
Table C. 12. ICP result for pre-treatment condition at 53oC, 1200rpm, 45minutes ................. 139
Table C. 13. ICP result for pre-treatment condition at 53oC, 600rpm, 30minutes .................... 139
Table C. 14. . ICP result for pre-treatment condition at 53oC, 600rpm, 30minutes .................. 140
Table C. 15. . ICP result for pre-treatment condition at 53oC, 600rpm, 30minutes .................. 140
Table C. 16. ICP result of oxygen supply experiment. Pre-treatment condition: ..................... 141
Table C. 17. ICP result of oxygen supply experiment at different flow rates. Pre-treatment
condition: 3%NaCN, 1%NaOH, 80oC,0 rpm and 30minutes ................................................... 141
Table C. 18. ICP result of both no-pre-treated and pre-treated and rinsed at 80oC,0 rpm and
30minutes .............................................................................................................................. 142
Table C. 19: ICP result for validation of statistical model. ....................................................... 142
Table C. 20. Titration result at 25oC, 0rpm, No-AC ................................................................. 143
Table C. 21. Titration result 25oC,600 rpm, No-AC ................................................................. 143
Table C. 22. Titration result at 25oC, 1200 rpm, No-AC .......................................................... 143
Table C. 23. Titration result at 53oC, 0 rpm, No-AC ................................................................ 143
Stellenbosch University https://scholar.sun.ac.za
Page xviii
Table C. 24. Titration result at 53oC, 600 rpm, No-AC ............................................................ 144
Table C. 25. Titration result at 53oC, 1200 rpm, No-AC .......................................................... 144
Table C. 26. Titration result at 80oC, 0 rpm, No-AC ................................................................ 144
Table C. 27. Titration result at 80oC, 600 rpm, No-AC ............................................................ 144
Table C. 28. Titration result at 80oC, 1200 rpm, No-AC .......................................................... 145
Table C. 29. Titration result at 25oC, 0 rpm, in the presence of AC ........................................ 145
Table C. 30. Titration result at 25oC,600 rpm, in the presence of AC ..................................... 145
Table C. 31. Titration result at 25oC,1200 rpm, in the presence of AC ................................... 145
Table C. 32. Titration result at 53oC, 0 rpm, in the presence of AC ........................................ 146
Table C. 33. Titration result at 53oC, 600 rpm, in the presence of AC .................................... 146
Table C. 34. Titration result at 53oC, 1200 rpm, in the presence of AC .................................. 146
Table C. 35. Titration result at 80oC, 0 rpm, in the presence of AC ........................................ 146
Table C. 36. Titration result at 80oC, 600 rpm, in the presence of AC .................................... 147
Table C. 37. Titration result at 80oC, 1200 rpm, in the presence of AC .................................. 147
Table C. 38. Titration result at 25oC, 0 rpm, in the presence of AC-Au ................................... 147
Table C. 39. Titration result at 25oC, 600 rpm, in the presence of AC-Au ............................... 147
Table C. 40. Titration result at 25oC, 1200 rpm, in the presence of AC-Au ............................. 148
Table C. 41. Titration result at 53oC, 0 rpm, in the presence of AC-Au .................................. 148
Table C. 42. Titration result at 53oC, 600 rpm, in the presence of AC-Au. .............................. 148
Table C. 43. Titration result at 53oC, 1200 rpm, in the presence of AC-Au ............................. 148
Table C. 44. Titration result at 80oC, 0 rpm, in the presence of AC-Au ................................... 149
Table C. 45. Titration result at 80oC, 600 rpm, in the presence of AC-Au ............................... 149
Table C. 46. Titration result at 80oC, 1200 rpm, in the presence of AC-Au ............................. 149
Stellenbosch University https://scholar.sun.ac.za
Page xix
Nomenclature
Symbol Description Unit
A Loading capacity mg/g
C Concentration of CN- in the bulk solution at time t g/L
C* Concentration of CN- at the carbon surface g/L
CCA Concentration of calcium g/L
Cf Final concentration of CN- g/L
Ci Initial concentration of CN- g/L
CK Concentration of Potassium g/L
Co Concentration at time zero g/L
Cw Concentration of solids by weight in slurry %
D Impeller Diameter m
ɛ Experimental error
N Rotational speed of impeller rev/min
Np Power number
P Power consumption Watts
R Reynolds number
Vf Final volume of water mL
Vi Initial volume of water mL
Y Percentage Recovery %
μL Viscosity of Liquid N.s/m2
μm Viscosity of mixture N.s/m2
ρL Density of Liquid kg/m3
ρm Density of mixture kg/m3
ρs Density of solid kg/m3
as Interfacial area m2/m3
ɸ Volume fraction
Activated carbon loading in solution g/L
ρc Density of the activated carbon kg/m3
dc Diameter of the activated carbon m
kSL Solid-liquid mass transfer coefficient cm min-1
x1 Temperature oC
Stellenbosch University https://scholar.sun.ac.za
Page xx
x2 Contact Time minutes
x3 Agitation speed rev/min
Abbreviations
Abbreviation Description
AARL Anglo American Research Laboratory
AC Activated carbon
AC-Au Activated carbon loaded with gold
ANOVA Analysis of Variance
AV Average value
BB Box Behnken
BV Bed volumes
CIL Carbon in leach
CIP Carbon-in-pulp
CV Coefficient of variation
FTIR Fourier transform infrared spectroscopy
ICP_MS Inductively Coupled Plasma-Mass Spectrometry
L Linear
Min Minutes
PGM Platinum group metals
Q Quadratic
SD Standard Deviation
SEM Scanning Electron Microscopy
TPD Temperature programmed desorption
UAC Unloaded activated carbon
XANES X-ray Absorption Near Edge Structure
XPS X-ray Photoelectron spectroscopy
Stellenbosch University https://scholar.sun.ac.za

Page xxi
Subscript
CA Calcium
C Carbon
F Final
I Initial
K Potassium
L Liquid
M Mixture
O Zero
P Power
S Solid
sL Solid-Liquid
W Weight
Superscript
* Carbon surface
Stellenbosch University https://scholar.sun.ac.za

Page 1
1 Introduction
1.1 Background
Two major elution techniques have been widely used for gold (Au) elution recovery from
activated carbon using caustic cyanide (NaOH-NaCN) solution (Davidson and Bailey,
1991). These are the Anglo American Research Laboratory (AARL) elution and the
Zadra elution techniques. The AARL involves pre-treatment of the granular activated
carbon adsorbed with gold-cyanide [1
2Au(CN) ] in NaOH-NaCN solution, followed by
elution with hot (110oC–130oC) deionised water (Davidson and Schmidt, 1986). Zadra
elution involves recirculation of hot (≈95°C) eluant containing NaOH-NaCN solution
through electrowinning cells connected in series (Zadra et al., 1950). Of these two
elution techniques, the AARL is the most widely used due to its numerous advantages;
the major one being its short elution time and improved Au elution recovery with high
“barrenness” of eluted carbon (Marsden and House, 2006).
Pre-treatment of Au loaded activated carbon with NaOH-NaCN solution and high elution
temperature have been investigated to have a significant effect on Au elution recovery
in AARL technique (Davidson, 1993). However, no set standard regarding the pre-
treatment conditions i.e., pre-treatment temperature (which is the measured
temperature of NaOH-NaCN solution in a vessel containing Au loaded carbon before
the introduction of eluant) and contact time exists in the industry. According to Van
Deventer and Van Der Merwe (1994), high pre-treatment temperature yields improved
Au elution recovery than low temperature. The researchers suggested that this was
attributed to improved decomposition of cyanide ( CN ), but the conclusion was not
proven.
Van Deventer and Van der Merwe (1995) observed an improved decomposition of CN
by increasing the agitation speed after 70 hours. However, the subsequent effect of
agitation speed on elution recovery of Au was not investigated. In this vein, little is
1
2Au(CN) is a specie of Au formed after leaching that is adsorbed onto activated carbon.
Stellenbosch University https://scholar.sun.ac.za
Page 2
known about the combined effect of temperature and agitation speed for a set time, on
the behaviour and decomposition of CN during pre-treatment and the elution process
that follows.
Clear understanding of the role and behaviour of NaOH-NaCN during pre-treatment in
the presence and absence of activated carbon will provide insight into the possible
elution mechanisms involved. Following this, the effects of time, temperature, agitation
and their interactions were investigated in order to determine how it affects the
subsequent elution process. Results obtained on laboratory scale were therefore,
related to plant conditions.
1.2 Problem statement
Over the years in gold industries, variability exists among the pre-treatment factors,
particularly the pre-treatment temperature and contact time (Davidson and Bailey,
1991). Au elution recovery, with regards to these factors has not received much
attention. The effect of pre-treatment temperature on CN decomposition that
consequently improves Au elution recovery has been suggested (Van Deventer and
Van der Merwe, 1993). Similarly, the effect of agitation speed on the decomposition of
CN for a set contact time has been investigated (Van Deventer and Van der Merwe,
1995). However, the effect of agitation speed on Au elution recovery and its effect on
the mass transfer of CN during pre-treatment have not been reported. Due to lack of
understanding of the effect of temperature, contact time and agitation speed on the Au
elution recovery and the associated CN mass transfer, it is difficult to carry out
optimisation of gold elution process. It was thus the primary objective of this study to
investigate the effect of these pre-treatment process parameters on Au elution
recovery.
1.3 Research questions
What are the roles and behaviour of NaOH-NaCN on Au loaded activated carbon
during pre-treatment?
Is there any significant effect of pre-treatment temperature, contact time and
agitation speed on Au elution recovery?
Stellenbosch University https://scholar.sun.ac.za
Page 3
What are all the various proposed elution mechanisms available?
Which elution mechanism will suitably explain the elution mechanism based on
the outcome of the second research question?
What is the significance of this research to the gold industry?
1.4 Research objectives
In order to gain better understanding of the pre-treatment parameters affecting Au
elution recovery, the following were the objectives of this project:
To investigate the effects of pre-treatment temperature, contact time, agitation
speed and their combined effect on Au elution recovery.
To review the existing theories on elution mechanisms and explain the fitting
elution mechanism based on the results obtained.
1.5 Project scope
This work focused on the AARL elution process with the pre-treatment operation
conducted at a fixed concentration of NaOH-NaCN. The effects of time, temperature,
agitation speed and their interactions on Au elution recovery were investigated. The
behaviour of CN under these parameters was monitored on activated carbon and in
solution, to provide insight into the rate controlling process.
1.6 Significance of the project
This work will provide an understanding of the effects of pre-treatment temperature,
contact time and agitation speed on Au elution recovery. Based on this insight and the
outcome from the effect of these parameters on Au elution recovery, a better
explanation on the appropriate elution mechanism from the already proposed
mechanisms by other researchers will be provided. Furthermore, this study will also
provide recommendations for South African gold industries on possible ways of
improving Au elution recovery.
Stellenbosch University https://scholar.sun.ac.za
Page 4
1.7 Structure of thesis
This study is presented as follows:
Chapter 1
This chapter gives a broad view of what this research is about. It also states the
problem statement, objectives and scope of the project.
Chapter 2
This chapter is a review chapter which starts with the broad view of gold processing. It
comprises a review of the application and properties of activated carbon in gold
processing. The previous findings of Au adsorption and the factors that affect
adsorption and elution of Au from activated carbon were also reported in this chapter.
Furthermore, the behaviour of CN was reviewed. The various pre-treatment
operations of Au with NaOH-NaCN solution and the adopted parameters during pre-
treatment by different industries were reported.
Chapter 3
The chapter describes the materials used, the methods and analytical techniques
adopted in the experimental work. The approach to the design of experiments, choice of
factor levels and analytical techniques were also discussed.
Chapter 4
The mechanisms of CN loss from pre-treatment solution were discussed and the
recovery due to elution at different combinations of pre-treatment parameters were
presented and discussed. A result of the investigated parameters applied to Au loaded
carbon that has been eluted and regenerated from gold plant was also reported. Based
on the results, a possible elution mechanism was suggested.
Chapter 5
Results obtained were statistically analysed. Possible errors that might be associated
with the experiment were estimated and discussed.
Chapter 6
The main conclusions drawn from the elution results at different pre-treatment
parameters as well as the possible mechanism of pre-treatment were presented in this
chapter. Recommendations on the practical implication were also presented and future
works to further improve on it.
Stellenbosch University https://scholar.sun.ac.za
Page 5
2 Literature review: Gold process, activated carbon, adsorption
and elution
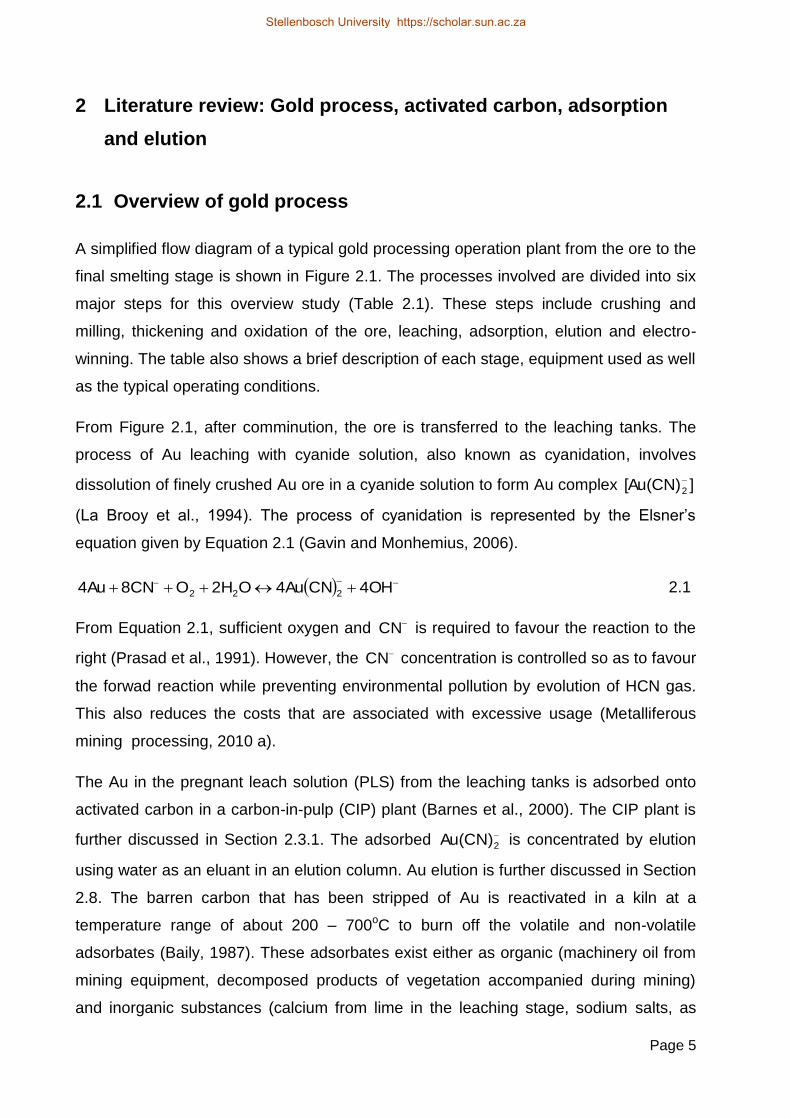
2.1 Overview of gold process
A simplified flow diagram of a typical gold processing operation plant from the ore to the
final smelting stage is shown in Figure 2.1. The processes involved are divided into six
major steps for this overview study (Table 2.1). These steps include crushing and
milling, thickening and oxidation of the ore, leaching, adsorption, elution and electro-
winning. The table also shows a brief description of each stage, equipment used as well
as the typical operating conditions.
From Figure 2.1, after comminution, the ore is transferred to the leaching tanks. The
process of Au leaching with cyanide solution, also known as cyanidation, involves
dissolution of finely crushed Au ore in a cyanide solution to form Au complex ][Au(CN)2
(La Brooy et al., 1994). The process of cyanidation is represented by the Elsner’s
equation given by Equation 2.1 (Gavin and Monhemius, 2006).
4OHCN4AuO2HO8CN4Au 222 2.1
From Equation 2.1, sufficient oxygen and CN is required to favour the reaction to the
right (Prasad et al., 1991). However, the CN concentration is controlled so as to favour
the forwad reaction while preventing environmental pollution by evolution of HCN gas.
This also reduces the costs that are associated with excessive usage (Metalliferous
mining processing, 2010 a).
The Au in the pregnant leach solution (PLS) from the leaching tanks is adsorbed onto
activated carbon in a carbon-in-pulp (CIP) plant (Barnes et al., 2000). The CIP plant is
further discussed in Section 2.3.1. The adsorbed
2Au(CN) is concentrated by elution
using water as an eluant in an elution column. Au elution is further discussed in Section
2.8. The barren carbon that has been stripped of Au is reactivated in a kiln at a
temperature range of about 200 – 700oC to burn off the volatile and non-volatile
adsorbates (Baily, 1987). These adsorbates exist either as organic (machinery oil from
mining equipment, decomposed products of vegetation accompanied during mining)
and inorganic substances (calcium from lime in the leaching stage, sodium salts, as
Stellenbosch University https://scholar.sun.ac.za

Page 6
well as fine ore minerals which includes aluminate, complex silicates, silica and base
metal precipitates) (Marsden and House, 2006; Fleming, 1992). Volatile adsorbate are
vaporised and decomposed between the temperature range of 200 – 500oC while non-
volatile adsorbate are pyrolysed at higher temperature of about 500 – 700oC (Baily,
1987). The concentrated Au solution by elution is passed through the electrowinning
cell to produce loaded cathodes (Marsden and House, 2006). The ‘electrowon’ products
are smelted into Au bars and transported to a gold refinery for further refining.
Ore
Crusher
Ball mill
Pre-Leach
thickner
Pre-areation
tanks
Leach
tanks
Adsorption
tanks
Tailings
disposal
Carbon
Regeneration
Elution
ElectrowinningSmelting
Pure
gold
Figure 2.1: Simplified flow-sheet of a gold processing plant. Modified from Mt
Todd (2013)
Stellenbosch University https://scholar.sun.ac.za

Page 7
Table 2.1: Description of gold process
STEPS OPERATION PURPOSE(S) EQUIPMENT/REAGENTS OPERATING CONDITION(S)
REFERENCES
STEP1 Crushing and Milling
Size reduction (<75 µm) for liberation of valuable metals from host rocks Finer grinding (<38 µm) is suitable for refractory ore
Crushers and Ball mills Depends on the nature of the ore
La Brooy et al., 1994; Fleming, 1992.
STEP2(a) Thickening (auxiliary operation)
To achieve high pulp density
Pre-leached thickener Small solid density and high slurry fluid could reduce residence time of leaching and adsorption
Yannopoulous, 1991; Fleming, 2011
STEP2(b) Oxidation of ore (auxiliary operation)
For refractory ore to passivate sulphide minerals that would consume cyanide
Pre-aeration tanks 48 to 72 hours of retention time for complete oxidation
Marsden and House, 2006; Fleming, 1992
STEP3 Leaching with cyanide, other reagents include; halides, thiourea, thiosulphate, thiocyanate, ammonia
Dissolution Agitation tanks, heaps 24 hours for free milling ores 48 hours for refractory ores
Marsden and House, 2006; Aylmore, 2005; Fleming, 1992; Groudev et al., 1996
STEP4 Adsorption Selective adsorption of precious metals
Carbon-in-pulp plant, Carbon-in-leach, Resin-in-pulp, activated carbon, resins (adsorption tanks)
Room temperature, presence of cations
Goyal, 2010, Stanley, 1987
STEP5 Elution Removal of adsorbed gold (stripping)
Elution columns High temperature (110–130
oC), pressure of
230 kPa, low ionic strength, high cyanide concentration
Jeffery et al., 2010
STEP 6 Electrowinning Purification Electro-winning cells Applied voltage > reversible electrode potential
Marsden and House, 2006; Conradie et al., 1995; Filmer, 1982
Stellenbosch University https://scholar.sun.ac.za
Stellenbosch University https://scholar.sun.ac.za
Page 8
2.2 Properties and application of activated carbon
The application of activated carbon either in powdered or granulated form in gold
processing has been widely used since the 1880s (Habashi and Fathi, 2005; Bailey
1987). The unique feature that made it gain acceptance in Au process is its large
internal surface area (>400m2/g) and preferential selectivity for precious metals [Au
and silver (Ag)] at low metal concentration (0.2 mg/L or less) in pulp (Yalcin and Arol,
2002; McDougal and Hancock, 1981). Although the powdered form of the activated
carbon possesses a larger internal surface area of about 1500 m2/g (Basal and
Goyal, 2010), it is less preferable to granulated carbon due to Au loss that is
associated with carbon fines (Stanley, 1987).
Spent activated carbon can be reused after reactivation (Marsden and House, 2006).
Reactivation below 600oC burns off the volatile materials while higher temperature
(700–1000oC) burns the carbon skeleton thus increasing the pores of carbon (Marsh
and Reinoso, 2006; Bailey, 1987). These pores have been further classified into
macro pores (60–10000 nm), meso-pores (3–60 nm), micro pores (less than
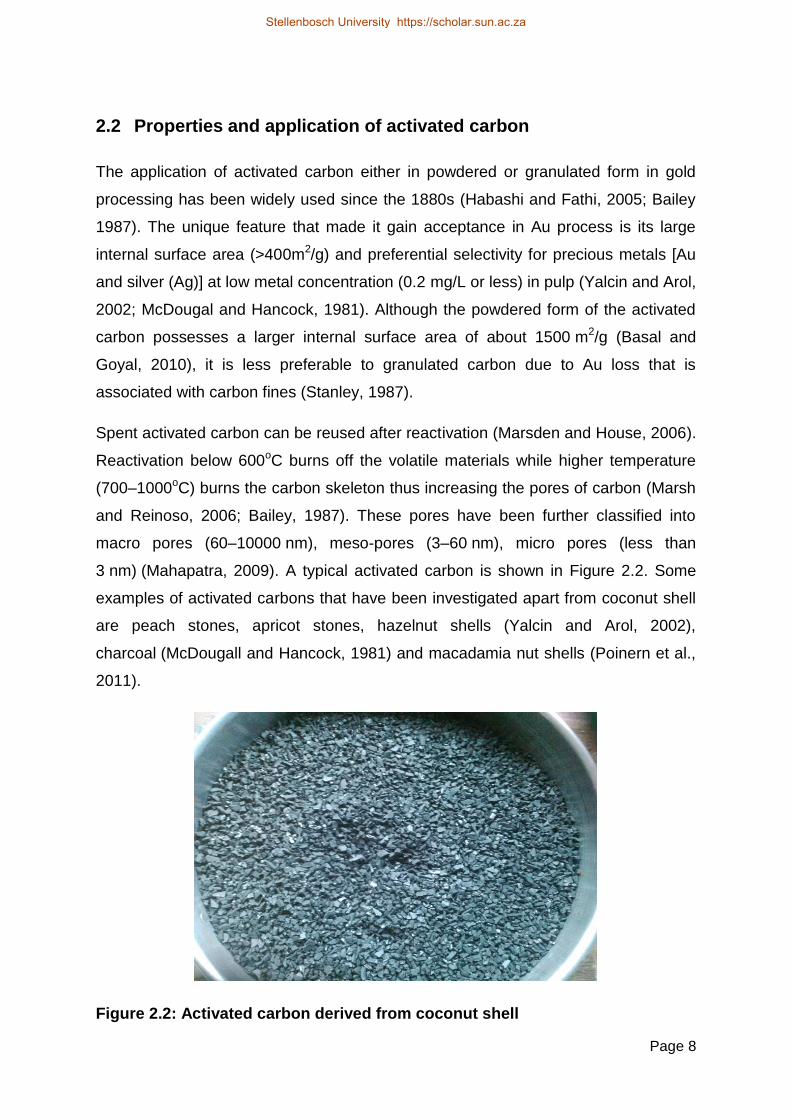
3 nm) (Mahapatra, 2009). A typical activated carbon is shown in Figure 2.2. Some
examples of activated carbons that have been investigated apart from coconut shell
are peach stones, apricot stones, hazelnut shells (Yalcin and Arol, 2002),
charcoal (McDougall and Hancock, 1981) and macadamia nut shells (Poinern et al.,
2011).
Figure 2.2: Activated carbon derived from coconut shell
Stellenbosch University https://scholar.sun.ac.za
Page 9
Several researchers (Ibrado and Fuerstenau, 1995; 1992; Klauber, 1991; Cho et al.,
1979) have reported a likely mechanism of Au adsorption onto activated carbon on
the basis of functional group characterisation. A mechanism of Au elution from
carbon surface was also proposed to be as a result of modification of functional
group of activated carbon (Adams and Fleming, 1989). Hence the study of the
functional group of activated carbon provided a plausible elution mechanism from the
result of the effect of pre-treatment parameters investigated in this study. The review
of the structure, properties and functional groups in activated carbon is discussed in
the next section.
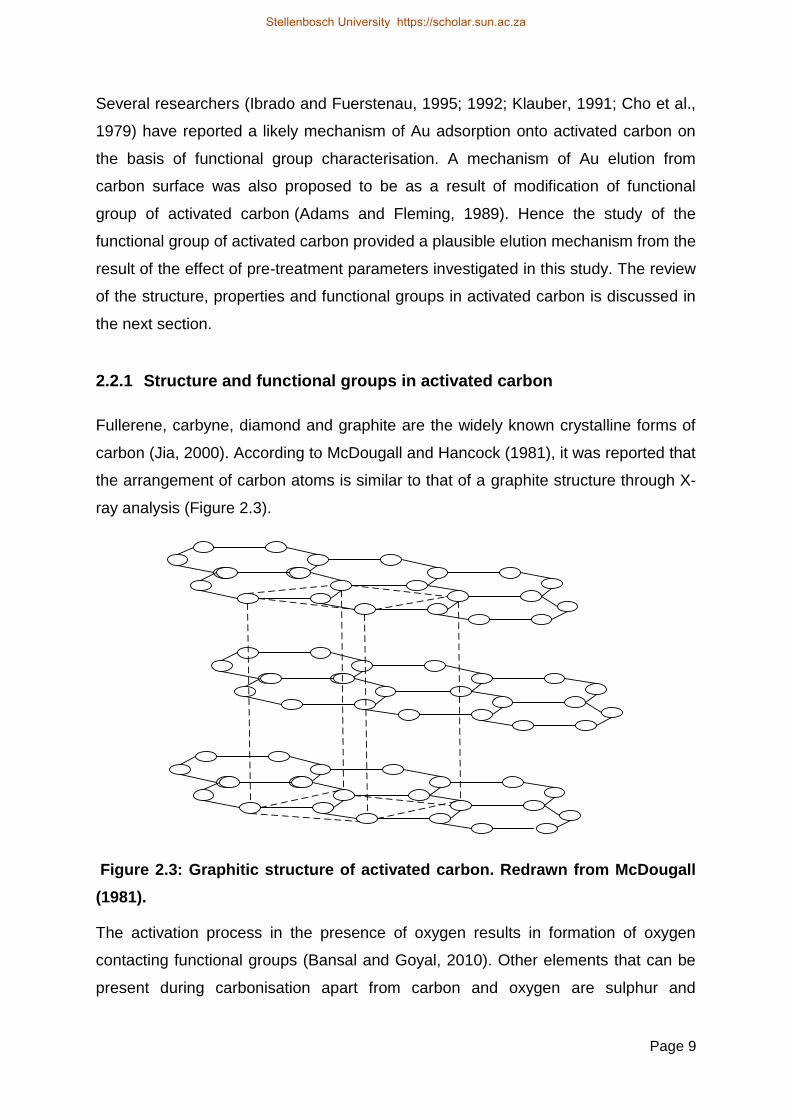
2.2.1 Structure and functional groups in activated carbon
Fullerene, carbyne, diamond and graphite are the widely known crystalline forms of
carbon (Jia, 2000). According to McDougall and Hancock (1981), it was reported that
the arrangement of carbon atoms is similar to that of a graphite structure through X-
ray analysis (Figure 2.3).
Figure 2.3: Graphitic structure of activated carbon. Redrawn from McDougall
(1981).
The activation process in the presence of oxygen results in formation of oxygen
contacting functional groups (Bansal and Goyal, 2010). Other elements that can be
present during carbonisation apart from carbon and oxygen are sulphur and
Stellenbosch University https://scholar.sun.ac.za

Page 10
hydrogen (Bansal and Goyal, 2010). Jia (2000) reviewed various attempts that have
been used to categorise the oxygen functional groups on carbon. These are
selective neutralisation, temperature programmed desorption (TPD), Fourier
transform infrared spectroscopy (FTIR), specific chemical reaction, potentiometric,
polarography, X-ray photoelectron spectroscopy and X-ray absorption near edge
structure (XANES). Some of the suggested functional groups due to these
investigations are carboxyl, lactones, phenols, anhydrides, ketones, quinones,
hydroquinones, aldehydes and ethereal structures (Jia, 2000; McDougal and
Hancock, 1981). Jia et al. (1998) suggested that nitrogen functional groups are of
less importance to
2Au(CN) adsorption in comparison to oxygen functional groups.
Some examples of oxygen functional groups are shown in Figure 2.4. However,
regarding the significance of oxygen for adsorption, Ibrado and Fuerstenau (1992;
1995) proposed that oxygen functional group was less significant for the adsorption
of
2Au(CN) after increasing the quantity of oxygen. The authors suggested that the
degree of adsorption is strongly dependent on the graphite planes of the activated
carbon
c
o
OH
O
H
O
Carboxyl groupPhenolic
Hydroxyl group
Quinone type carbonyl
group
Figure 2.4: Examples of Oxygen functional group. Redrawn from Jia (2000)
2.3 Adsorption
According to Adams and Nicol (1984) and Adams (1983),
2Au(CN) adsorption is
thermodynamically reversible. Therefore, Au elution recovery is a function of the
adsorption stage taking into consideration the factors that influence adsorption (Van
der Merwe, 1991). This justifies the need for a detailed discussions on Au adsorption
Stellenbosch University https://scholar.sun.ac.za

Page 11
process. Two major adsorption techniques are typically used. These are CIP and
carbon in leach (CIL) technique. These are described in the following sections.
2.3.1 Carbon in pulp process
The CIP circuit is a well-known technology in gold processing. It consists of the
adsorption, elution and carbon regeneration stage as shown in Figure 2.5 (La Brooy
et al., 1994; Laxen, 1979).
New activated
carbon
Recycled
carbon
Regeneration
stage
Elution
stage
Activated carbon
flow
Pulp flow
Activeted
carbon
Ore
Adsorption stage
Figure 2.5: CIP circuit modified from Lima (2007)
The leached pulp in the adsorption stage ( Figure 2.5) is allowed to flow in a counter-
current direction with the activated carbon by means of an airlift in each tank (Laxen,
1979). The average retention time ranges between 20–60 min (Laxen, 1979).
However, with the introduction of newer technology such as pump cells, Buson et al.
(1999) reported that 15–20 min/stage residence times were obtained and the plant
size was reduced thrice compared with a conventional CIP plant. Pump cell offers an
advantage of agitation, screening and pumping within the adsorption tank
(Dippenaar and Proudfoot, 2005). The agitation provided by the pump cell aids the
Stellenbosch University https://scholar.sun.ac.za

Page 12
mass transport of Au onto activated carbon (Fleming, 2011). The resulting outcome
of the counter-current flow is the depletion of Au in the pulp and enrichment of Au on
the activated carbon (Davidson et al., 1982; Fleming, 1981). The activated carbon
loaded with Au is then transferred to the elution stage.
True equilibrium is rarely achieved during adsorption even after several weeks of
adsorption (Fleming and Nicol, 1984). As such, several investigations have been
conducted to improve adsorption efficiency. Staunton (2005) summarised a number
of factors that are critical in a CIP plant for optimum carbon management and design
consideration that can improve adsorption efficiency. These are: agitation with the
use of pump cell (discussed above), the number of adsorption tanks, soluble Au loss,
carbon residence time, carbon concentration, and target Au loading among other
factors. These factors are amplified in the next section.
2.3.1.1 Adsorption tanks and gold loss
According to Stange (1991), increasing the number of adsorption tanks with low
amount of carbon in each tank offer the advantages of improving adsorption of Au;
reducing Au loss associated with fine carbon particle due to reduced abrasion,
shortens retention time and lessens Au lock up. The number of adsorption tanks
usually ranges from 4 to 10 but up to 7 adsorption tanks could be beneficial.
Insignificant effect in Au adsorption is noticed with further increase in the number of
adsorption tanks and loss might be recorded in terms of cost incurred on the tanks
(Adams, 2005).
2.3.1.2 Carbon concentration, residence time and target gold loading
Previous reports have shown that most CIP plants operate at carbon concentrations
of about 20–25 g/L and retention time of about an hour per stage (Bailey, 1991;
Laxen, 1984). These conditions were believed to improve adsorption rate and
satisfactory Au adsorption (Laxen et al., 1979). However, plant operation and
performance under these conditions have been underutilised (Fleming et al., 2011).
Furthermore, through a modelling approach, Fleming et al. (2011) showed that a
number of factors can be varied in order to optimise the adsorption process. These
are: the number of adsorption tanks, amount of carbon in the adsorption tanks, rate
of carbon transfer through the CIP plant, target concentration of Au in solution at the
Stellenbosch University https://scholar.sun.ac.za

Page 13
last adsorption tank and the amount of Au remaining on carbon after elution (Fleming
et al., 2011). A high activity for eluted carbon is important to adsorb the trace metals
in the last adsorption tank and minimise Au loss into the tailing solution (Snyders et
al., 2013; Fleming et al., 2011).
2.3.2 Carbon in leach
Carbon in leach (CIL) is a modification of CIP involving simultaneous leaching and
adsorption by the addition of activated carbon in the leaching vessel (Stange, 1999).
A major advantage associated with this is cost reduction in terms of replacement of a
series of tanks used in CIP plant with a single large vessel (Fleming, 1992). Other
advantages of CIL over CIP are in the adsorption of low grade ores that require
longer leaching time. Another advantage is the preferential adsorption of
2Au(CN)
complex onto activated carbon instead of the carbonaceous material (Stange, 1999).
2.4 Adsorption mechanism
Various mechanisms of adsorption of
2Au(CN) have been proposed by numerous
researchers (Ibrado and Fuerstenau, 1992; Adams and Fleming 1989; Cho et al.,
1979) in which the exact mechanism for
2Au(CN) adsorption is yet to be established
(Free, 2013). Possible reasons for the different proposed mechanisms was
suggested to be due to different experimental conditions (high temperature,
presence of acid or high alkalinity), types of carbon used and uncertainty of the
adsorbed Au species (Van Deventer, 1993). A summary of the proposed
mechanisms by various researchers is presented in Table 2.2
Stellenbosch University https://scholar.sun.ac.za

Page 14
Table 2.2: Proposed adsorption mechanisms
Theory Suggested adsorption mechanisms Supporting authors
A reduction mechanism of
2Au(CN)
Green (1913), Feldtman
(1914) Edmands (1917),
B electrostatic attraction of Au(CN)2
- on the
positively charged surface of the carbon
Garten and Weiss (1957),
Cho et al. (1979),
Kuzminykh and Tjurin
(1968)
C ion pair mechanism with cation in the form
of Mn+
[Au(CN)2
-]n
Davidson (1974), McDougall
et al.(1980), Gross and
Scott (1927), Adams and
Fleming (1989), Tsuchida et
al. (1984), Cho and Pitt
(1979)
D non- ion pair mechanism on graphite
plane in the form of Au(CN)2
-
Jones et al., (1989); Ibrado
and Fuerstenau (1992;
1995); Klauber (1991)
Theory A is reduction mechanism, B is electrostatic attraction mechanism, C is ion-pair mechanism and D is non-ion pair mechanism.
2.4.1 Theory A: Reduction mechanism
The reduction mechanism was based on the explanation that the leached
2Au(CN) is
reduced to AuCN that was formed as precipitate on the carbon surface (Gross and
Scott, 1927 reported by Bailey, 1987). This precipitation was suggested to take place
by decomposition reaction given by Equation 2.2.
Au(CN)2
-+ H
+↔ AuCN(s)+HCN 2.2
2.4.2 Theory B: Electrostatic attraction mechanism
According to this theory, anions [
2Au(CN) ] are electrostatically adsorbed to the
positive carbonium sites of activated carbon given by Equation 2.3 (Garten et al.,
1957):
Stellenbosch University https://scholar.sun.ac.za
Page 15
oc
R
H+
+ 1
2O
2 + K[Au(CN)2]+ CO2→
oc
R
Au(CN)2
+ KHCO3 2.3
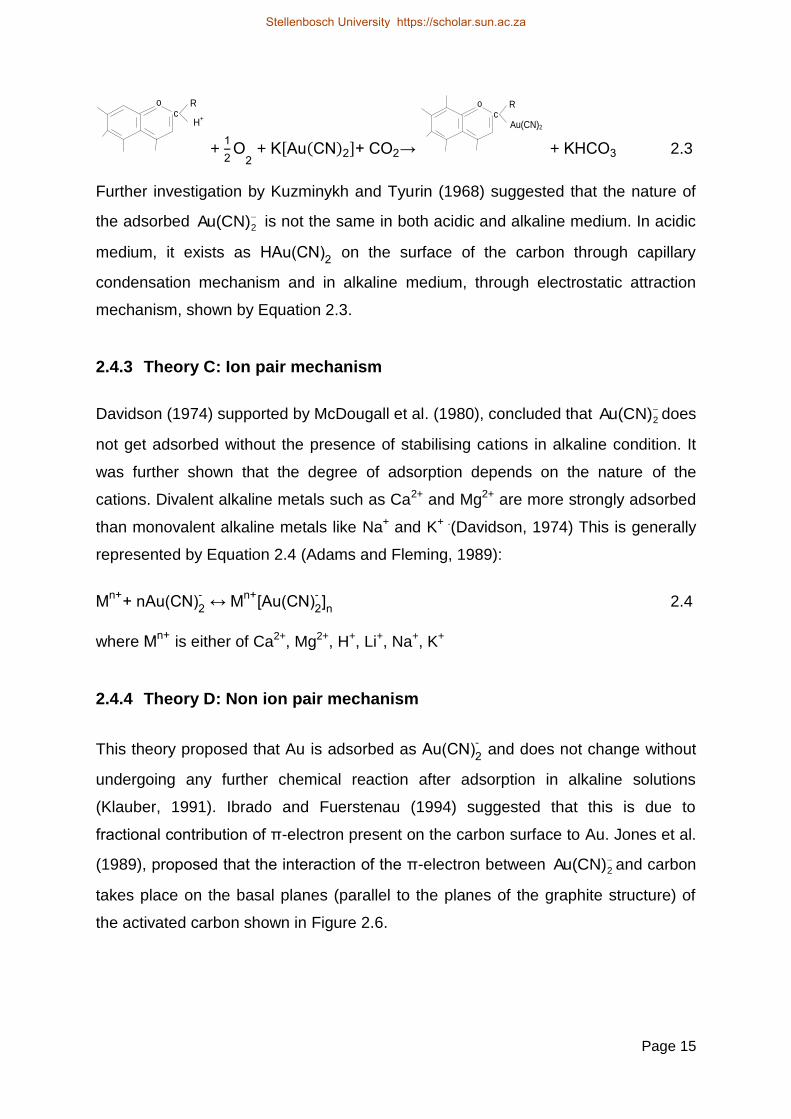
Further investigation by Kuzminykh and Tyurin (1968) suggested that the nature of
the adsorbed
2Au(CN) is not the same in both acidic and alkaline medium. In acidic
medium, it exists as HAu(CN)2 on the surface of the carbon through capillary
condensation mechanism and in alkaline medium, through electrostatic attraction
mechanism, shown by Equation 2.3.
2.4.3 Theory C: Ion pair mechanism
Davidson (1974) supported by McDougall et al. (1980), concluded that
2Au(CN) does
not get adsorbed without the presence of stabilising cations in alkaline condition. It
was further shown that the degree of adsorption depends on the nature of the
cations. Divalent alkaline metals such as Ca2+ and Mg2+ are more strongly adsorbed
than monovalent alkaline metals like Na+ and K+ .(Davidson, 1974) This is generally
represented by Equation 2.4 (Adams and Fleming, 1989):
Mn+
+ nAu(CN)2
- ↔ M
n+[Au(CN)
2
-]n 2.4
where Mn+
is either of Ca2+, Mg2+, H+, Li+, Na+, K+
2.4.4 Theory D: Non ion pair mechanism
This theory proposed that Au is adsorbed as Au(CN)2
- and does not change without
undergoing any further chemical reaction after adsorption in alkaline solutions
(Klauber, 1991). Ibrado and Fuerstenau (1994) suggested that this is due to
fractional contribution of π-electron present on the carbon surface to Au. Jones et al.
(1989), proposed that the interaction of the π-electron between
2Au(CN) and carbon
takes place on the basal planes (parallel to the planes of the graphite structure) of
the activated carbon shown in Figure 2.6.
Stellenbosch University https://scholar.sun.ac.za

Page 16
N C Au C N
π
Figure 2.6: Proposed interaction between activated carbon and
2Au(CN)
Redrawn from Ibrado and Fuerstenau (1994).
2.5 Adsorbed gold species
Understanding the nature of adsorbed Au gives insight into the requirement for
reagents needed for the subsequent elution stage. It has been widely suggested that
the main probable forms in which Au exists on activated carbon are: Au(s), AuCN,
Au(CN)2
- or M
n+[Au(CN)
2
-]n (Davidson and Bailey, 1991; Adams, 1989; Gross and
Scott, 1927). This forms the main disagreement of the adsorption mechanisms
proposed by previous authors as discussed in section 2.4. The change in the nature
of these species depends on temperature, pH, aging (degradation) and addition of
CN (McGrath et al., 2002; Van Deventer and Van der Merwe, 1993; Cook et al.,
1989). These findings were confirmed by FTIR scans and XPS analysis (Van
Deventer and Van der Merwe, 1993). At pH less than 9.3 which is the case in acid
washing, reaction shown in Equation 2.5 takes place on the adsorbed
2Au(CN) to
form AuCN (Adams, 1990c)
Au(CN)2
-+ H
+ →AuCN+HCN 2.5
2.6 Adsorption factors
2.6.1 Ionic strength
Ionic strength is usually referred to as the concentration of dissolved chemical
constituents in solution. Ionic strength is calculated as half the product of the
concentration of the chemical constituent and the oxidation number or charge of the
chemical constituent (Green, 1996) .This suggest that ionic strength is dependent on
the concentration and the charge number of the ion. According to the ion pair
Stellenbosch University https://scholar.sun.ac.za

Page 17
mechanism of adsorption (Theory C), Davidson (1974) investigated the degree of
enhanced adsorption of
2Au(CN) with different cations. The degree of adsorption
decreases as shown in the trend below from calcium ions (Ca2+) to potassium ion
(K+) (Marsden and House, 2006; McDougal et al., 1980; Davidson, 1974):
Ca2+>Mg2+>H+>Li+>Na+>K+ .
It was concluded that strong adsorption was more favoured by the presence of
divalent ions (Ca2+ and Mg2+) than by monovalent ions (Na+, K+). An illustration with
Mg2+ and Na+ is shown in Figure 2.7. where the ionic strength can be suggested to
be higher for Mg2+ due to higher oxidation number. The higher magnitude of ionic
strength of Mg2+ suggest that it will cause better interaction with the of
2Au(CN) than
Na+ as shown in Figure 2.7
- - - - - -
+
Mg
+
+
Mg
+
+
Mg
+
- -
+
Na
+
Na +
Na
- ---
Figure 2.7: Effect of cations: Redrawn from Menńe (1991)
2.6.2 pH
A decrease in pH of the adsorbing medium from 7 to 1 was shown to increase both
the loading capacity and adsorption efficiency of
2Au(CN) . (Marsden and House,
2006). According to Adams (1989), it was suggested that Au is probably loaded as
HAu(CN)2. This suggests that the mechanism of ion pair was not supported at this
pH range. The presence of high concentration (100 times higher than H+) of cations
used, causes initial adsorption of the ion pair complex at low pH (<7) which later
reduced due to the displacement of K+ and Ca+ by H+ (acidic medium) (Adams and
Fleming, 1989). This clearly suggests the dominance of pH in equilibrium loading
(Fleming and Nicol, 1984). Practically, CIP plants operate at pH above 10. However,
the adsorption rate is slower when compared to adsorption at pH below 9 (Marsden
and House, 2006). At pH above 10, loss of CN through hydrolysis reaction is
reduced (Marsden and House, 2006). Further discussions on chemical behaviour of
CN are discussed in chapter 2.12.
Stellenbosch University https://scholar.sun.ac.za
Page 18
2.6.3 Presence of oxygen
According to Hughes et al. (1984), improved loading of
2Au(CN) is as a result of
oxygen supply. Van der Merwe (1988) reported that an insignificant amount of
oxygen was adsorbed by activated carbon present in water while substantial amount
of oxygen was consumed during adsorption of
2Au(CN) . The benefical effect of
oxygen for the adsorption of
2Au(CN) was reported to be pronounced under the
condition of low ionic strength (Marsden and House, 2006; Adams, 1991). At high
ionic strength condition, which is the typical condition in most CIP plant, adsorption in
form of ion-pair dominates (Adams, 1991)
2.6.4 Free cyanides
According to Marsden and House (2006), the rate of Au loading and the capacity of
activated carbon to adsorbed Au in solution decreases with an increase in
concentration of CN . These CN were suggested to compete with
2Au(CN) for
adsorption sites. On the other hand, Adams (1990) and Muir et al. (1988) suggested
that oxygen aids in the catalytic oxidation of CN to form CO32-
and NH3. These
oxidised products (CO32-
and NH3) thereby hinders carbon surface from adsorption of
2Au(CN) through competitive adsorption (Van der Merwe, 1991). This suggest that a
condition of low CN concentration is recommended for Au adsorption.
2.6.5 Temperature
The effect of an increase in temperature on the adsorption of Au has been reported
to have a significant effect on the equilibrium loading as well as the loading rate of
Au (Adams and Nicol, 1984). This is because Au adsorption is an exothermic
process (McDougal, 1980). Fleming and Nicol (1984) investigated the effect of
different temperatures (20, 44 and 62oC) on the rate of adsorption and Au loading
capacity on activated carbon. It was found that the rate of Au adsorption increased
from 3400, 4190 and 4900 h-1 while Au loading capacity decreased from 73000,
48000 and 35000 mg/L at these temperatures (20, 44 and 62oC) respectively.
Similarly, McDougall et al. (1980) found out that an initial Au concentration of
Stellenbosch University https://scholar.sun.ac.za

Page 19
180 mg/L decreased to about 140 mg/L at 80oC and approximately 70 mg/L at 30oC
after 24 hours of adsorption time. It was suggested that the Au metal complex
[KAu(CN)2] was highly soluble (14 times) in hot water than in cold water.
2.7 Preliminary summary on adsorption
Gold process was broadly reviewed with more specific discussions on the CIP plant.
Furthermore, discussions were made about the application and properties of
activated carbon in CIP plant. These are: the structure of the carbon atom
arrangement and the functional groups. A detailed literature about the adsorption
process was reviewed because
2Au(CN) is thermodynamically reversible (Adams,
1983). Therefore, reversing the adsorption conditions for Au loaded activated carbon
enhances elution. The factors that were reported to favour adsorption are: high ionic
strength, oxygen supply under low ionic strength, low pH, low CN concentration,
and low temperature. This further led to the reports of various mechanisms proposed
by different authors and the adsorption factors. Based on the understood properties
of activated carbon, the adsorption mechanism of
2Au(CN) and its factors provided
a background knowledge to propose a suitable elution mechanism after the
investigation of pre-treatment parameters on Au elution recovery. The next sections
focus on the elution stage, factors and its mechanisms.
2.8 Elution
The two major types of elution techniques that were earlier introduced in Chapter 1
are Zadra elution and AARL elution techniques. The elution process of either Zadra
or AARL elution process takes place in an elution column with a typical industrial
elution column shown in Figure 2.8.
The elution columns are made from mild steel with height of about 10 m and a
diameter of 1.2 m which also holds pressure of about 350 kPa and accommodates
approximately 6 tonnes of activated carbon with a lagged wall to prevent heat loss.
These specifications vary for different companies.
Stellenbosch University https://scholar.sun.ac.za
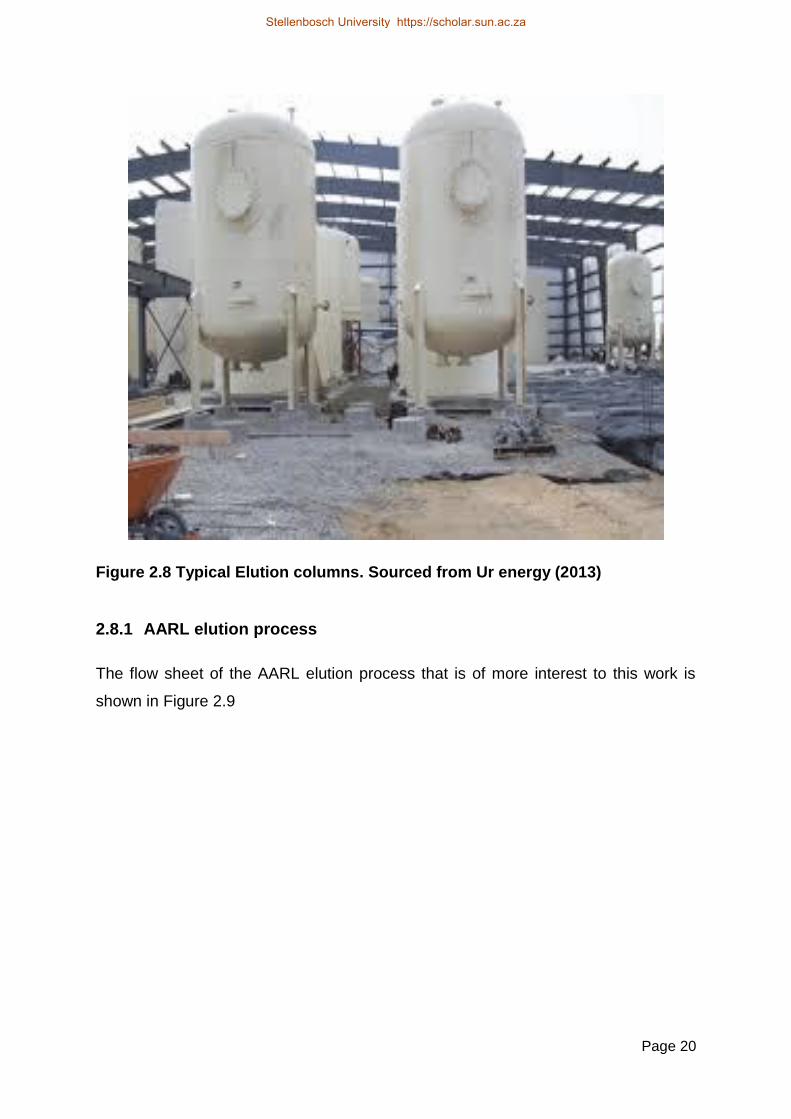
Page 20
Figure 2.8 Typical Elution columns. Sourced from Ur energy (2013)
2.8.1 AARL elution process
The flow sheet of the AARL elution process that is of more interest to this work is
shown in Figure 2.9
Stellenbosch University https://scholar.sun.ac.za

Page 21
NaCN
NaOH
Eluate
Storage
Deionised
water
Loaded
Carbon
Elution
Column
Eluted
Carbon
Heat
Exchanger
Elution Conditions
· Acid wash and water-wash
· Pre-treatment in 3% NaCN and
1-2%NaoH
· Elution with deionised water at
110oC -120
oC
· Flow rate of 2bV/hr
Figure 2.9: Simplified flow sheet of AARL. Modified from Stange (1991).
The AARL elution technique was developed to ensure improved Au elution recovery
and reduced operating time to the Zadra elution technique. In the Zadra elution
technique, the eluant is recirculated with electrowinning cells connected in series
(Zadra et al., 1950). It was believed that some of the desorbed Au gets reabsorbed
during the recirculation process. This resulted in high elution time which led to the
investigation of AARL with short elution time involving pre-treatment in NaOH-NaCN
solution (Davidson and Duncanson, 1977). The elution time is within the range of 32
to 72 hours and 8 to 14 hours for Zadra and AARL elution respectively (Marsden and
Stellenbosch University https://scholar.sun.ac.za
Page 22
house, 2006). AARL elution process typically involves pre-treatment of the Au loaded
carbon which has been described in Section 1.1(Davidson, 1986).
The AARL elution process shown in Figure 2.9 is described according to Stanley and
Bailey (1987). Carbon loaded with Au is fed into the column through the hopper. This
is followed by hot acid washing with 1 bed volume of hydrochloric acid (3%v/v) to
remove entrapped contaminants (calcium and foulants), followed by passage of 1 to
2 bed volume of water. Hot acid washing also helps in the removal of calcium that
can inhibit adsorption after regeneration (Davidson, 1986). A plug flow of eluant is
desirable during elution which can either be upward or downward flow (Davidson and
Bailey, 1991). The essence of the plug flow is to ensure desorption of Au at each
cross section of the elution column. The upward flow is often used in most industries
especially when acid washing occurs prior to elution. In this case, the upward plug
flow helps to minimise trapped carbon-dioxide gas produced as a result of the
reaction of the carbonate (Davidson and Bailey, 1991). However, in the presence of
small wood chips or fibres, neutralisation of the acid washed carbon is carried out
prior to elution, in which case downward flow of eluant is preferred (Davidson and
Bailey, 1991). According to these authors, there is a tendency of the eluate collector
being choked with the wood fibres if upward flow is adopted.
Hereafter, pre-treatment of the acid wash carbon is carried out in about 0.6 bed
volumes of NaOH-NaCN solution to soak for about 30 min. Finally, Au is then eluted
by pumping de-ionised water through the column at a temperature of 120oC and flow
rate of 2 bed volumes per hour for about 8 hours. These values are not fixed and
vary for different industries. The inconsistency of the pre-treatment forms part of the
objective of this research. The factors that affect the elution process are discussed in
the next section.
2.9 Factors affecting elution
2.9.1 Effect of temperature
Elution temperature (measured temperature of the eluant used for washing the Au
from loaded carbon after pre-treatment). has been suggested to be the most
important factor that influences Au elution recovery (Free, 2013; Adams and Nicol,
Stellenbosch University https://scholar.sun.ac.za
Page 23
1986; Davidson and Duncanson, 1977). An Increase in the elution temperature
results in change in equilibrium which favours desorption because adsorption is an
exothermic process (Section 2.6.5). According to Adams (1991), adsorbing power of
activated carbon to adsorb Au reduces with an increase in temperature which
determines the rate of elution. Practically, elution can occur either under atmospheric
or pressurised condition in order to control the elution rate (Marsden and House,
2006). Under the atmospheric conditions, elution process takes place in temperature
close to the boiling point of water (≈90–95oC) while a pressurised elution process
which results in a faster elution rate takes place above 100oC and pressure above
200 kPa depending on the temperature aimed to be achieved (Metalliferous mining
processing, 2010 b; Marsden and House, 2006).
Van der Merwe (1991) investigated the effect of temperature in relation to the
reaction of CN during pre-treatment. The decomposition of CN takes place via
oxidation at low temperature and hydrolysis at high temperature (Jeffery et al., 2010;
Van der Merwe and Van Deventer, 1993, Ver der Merwe, 1991). It was suggested
that the decomposed product formed by CN inhibits adsorption of Au thereby
favouring desorption. The hydrolysis and oxidation reactions that were considered to
be relevant in this regards are given by Equations 2.6–2.10 (Nicol, 1986; Van
Deventer and Van der Merwe, 1993).
Hydrolysis
CN-+ 3H2O→[HCOONH4]+ OH
- 2.6
[HCOONH4]+0.5O2→ HCO3-+ NH4
+ 2.7
HCO3-+NH4
-+2OH
- pH 10.5→ NH3+CO3
2-+2H2O 2.8
Oxidation
CN-+ 0.5O2 →[CNO
-] 2.9
[CNO-]+2H2O→ CO3
2-+ NH4
+ 2.10
Stellenbosch University https://scholar.sun.ac.za
Page 24
2.9.2 Effect of cyanide and hydroxide concentration.
The use of hydroxide ( OH ) alone to achieve an almost complete elution of Au has
been reported (Boshoff, 1994; Adams and Fleming, 1989). However, this proceeds
at a slower rate when compared with when CN is utilised. Adams (1991) reported
that the combination of CN and OH yielded a more effective result than either of
OH or CN . Some theories on the role of CN exist. According to Marsden and
House (2006), the presence of CN during elution causes competition of adsorption
site with
2Au(CN) which in turn favours elution. Contrary to this, Van Deventer and
Van der Merwe, (1992), reported the absence of Au in solution after pre-treatment
with NaOH-NaCN. CN was therefore, suggested to undergo decomposition
reaction that passivated the carbon surface (Van Deventer and Van der Merwe,
1992). According to Adam (1991) and McDougall and Fleming (1987), an increase in
concentration of CN and OH increased Au elution recovery when pre-treated with
NaOH-NaCN. However, excessive amounts of NaOH-NaCN resulted in a decrease
in elution rate. Optimum concentration of Au elution recovery was suggested to be
attained when pre-treated with about 3% concentration of NaOH-NaCN (Davidson
and Schmidt, 1986). Elution rate was observed to drop above this suggested
concentration of NaOH-NaCN. This opposing effect was suggested to be due to an
increase in the ionic strength of the cations (Adams, 1991).
2.9.3 Effect of cations
Accroding to Section 2.6.1 on the level of cations in adsorption, desorption is
favoured by the removal of cations. From the trend of the ionic strength presented
Section 2.6.1, desorption proceeds easily upon removal of monovalent ions (Na+, K+)
than the removal of divalent ions (Mg2+, Ca2+) from Au loaded carbon (Van Deventer
and Van der Merwe, 1994).
Furthermore, Van Deventer and Van der Merwe (1994), Van der Merwe (1991),
showed the influence of cations on Au loading capacity through a model. The model
was based on study of previous authors (Van Deventer, 1984; Cho and Pitt, 1979)
and adopted a modified Freudlinch isotherm by reducing the number of parameters
to Equation 2.11.
Stellenbosch University https://scholar.sun.ac.za

Page 25
Qi=ACibA+D
, 2.11
where Qi and Ci are the Au loading on activated carbon and in solution respectively,
b and D are constants that were measured in a specific carbon in the isotherm
equation. A (loading capacity constant) is the only parameter to be determined (Van
Deventer and Van der Merwe, 1994). The model showed that there is a strong
dependence of loading capacity constant of divalent ions (Ca2+) than monovalent
(K+). This suggests that elution proceeded easily in K+ than Ca2+. A least square
regression model showed that In(A) is a linear function of In(cation concentration)
given by Equations 2.12–2.13 at room temperature (Van Deventer and Van der
Merwe, 1994) This model indicated that desorption can be explained on this same
principle recalling that Au adsorption is thermodynamically reversible.
A= 24 (CK+1)0.069 2.12
A= 26 (CCa+1)0.127 2.13
CK = concentration of potassium
CCa = concentration of calcium
2.9.4 Flow rate
The rate of elution has been suggested to be independent on eluant flow rate under
strong pre-treatment conditions and high elution temperature (Marsden and House,
2006; Van der Merwe and Van Deventer, 1994; Adams, 1991). Davidson (1974)
investigated the effect of elution flow rate on activated carbon loaded with Au and
then pre-treated in 3% potassium carbonate (K2CO3) and 1% potassium hydroxide
(KOH). It was shown that the maximum concentration of Au in the elution profile (Au
elution peak on the elution curve shown in Figure 2.10) reduced with an increase in
flow rate from about 0.5–1.5 BV/h. Under these conditions, it was suggested that
elution is diffusion controlled (Davidson, 1974). Further investigation with pre-
treatment concentrations of 2% NaCN and 2% NaOH showed that elution was not
affected by flow rate within 1–5 BV/hr (Davidson and Schmidt, 1986). Under this
condition, it was suggested that elution was not controlled by diffusion. Van der
Merwe and Van Deventer (1994) investigated the effect of different elution flow rates
at 2.9, 5.9, and 37 BV/h on Au loaded carbon pre-treated in 2% KCN. The result
Stellenbosch University https://scholar.sun.ac.za
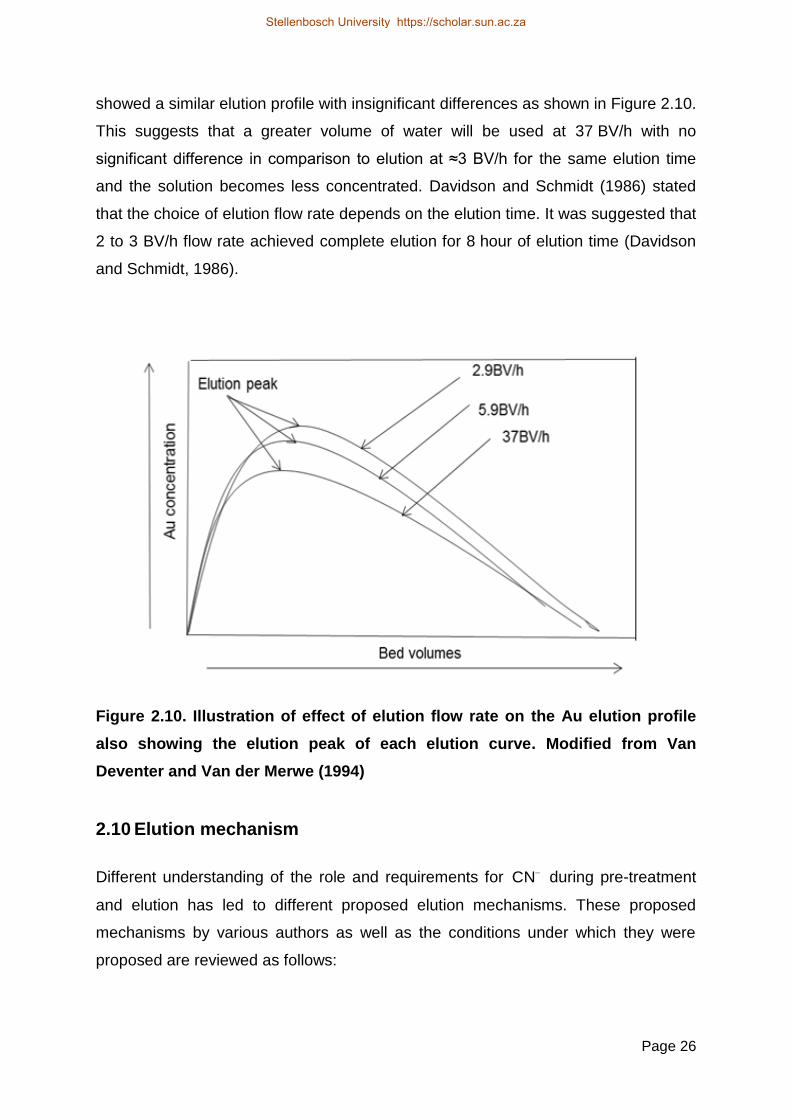
Page 26
showed a similar elution profile with insignificant differences as shown in Figure 2.10.
This suggests that a greater volume of water will be used at 37 BV/h with no
significant difference in comparison to elution at ≈3 BV/h for the same elution time
and the solution becomes less concentrated. Davidson and Schmidt (1986) stated
that the choice of elution flow rate depends on the elution time. It was suggested that
2 to 3 BV/h flow rate achieved complete elution for 8 hour of elution time (Davidson
and Schmidt, 1986).
Figure 2.10. Illustration of effect of elution flow rate on the Au elution profile
also showing the elution peak of each elution curve. Modified from Van
Deventer and Van der Merwe (1994)
2.10 Elution mechanism
Different understanding of the role and requirements for CN during pre-treatment
and elution has led to different proposed elution mechanisms. These proposed
mechanisms by various authors as well as the conditions under which they were
proposed are reviewed as follows:
Stellenbosch University https://scholar.sun.ac.za

Page 27
2.10.1 Mechanism based on the nature of the adsorbed gold
According to this mechanism, the nature of the adsorbed Au determines the need for
CN in the subsequent elution step (Section 2.5). In a typical CIP condition the
nature of the adsorbed Au can exist either as AuCN when acid pre-treatment is
carried out prior to elution or as (AuCN)2
- in the absence of acid washing. It was
believed that AuCN is strongly adsorbed on carbon while (AuCN)2
- was more soluble
in water and easily desorbed from the carbon surface (Davidson and Bailey, 1991).
Therefore, the addition of CN will result in the change of the nature of the adsorbed
Au according to Equation 2.14 (Adams, 1991).
AuCN+ CN-→ Au(CN)
2
- 2.14
Another form of Au is its existence in the solid state [Au]s which has been suggested
to occur in residual Au on carbon after elution at the regeneration temperature
(Vorobev-desyatovskii et al., 2010). In this case, [Au]s can be suggested to form
Au(CN)2
- through the Elsner’s equation (Equation 2.1)
2.10.2 Mechanism based on competitive adsorption of CN-
According to this theory, the presence of CN causes competitive adsorption with
Au(CN)2
- for adsorption site. This results in displacement of Au(CN)
2
- from carbon
surface, thereby resulting into elution (Adams and Nicol, 1986). Tsuchida (1984)
reported by Van Deventer and Van der Merwe (1994) proposed the following
Equations:
[AuCN]carbon
+ CN-↔ [Au(CN)
2
-]carbon
2.15
[Au(CN)2
-]carbon
+ CN- ↔ [CN
-]carbon
+ [Au(CN)2
-]solution
2.16
As it appears from Equations 2.15–2.16, the role of CN was only seen from the
elution point of view even though CN from NaOH-NaCN solution was introduced
during pre-treatment. This theory was, however, criticised not to be probable due to
absence of Au in solution after pre-treatment with NaOH-NaCN (Van Deventer and
Van der Merwe, 1994; 1992).
Stellenbosch University https://scholar.sun.ac.za

Page 28
2.10.3 Mechanism based on passivation of the carbon surface
In a quest to gain more insight to the functional role of CN after establishing that it
is a necessity for the improved elution of Au, Van Deventer and Van der Merwe
(1992) showed that CN carried over from the pre-treatment step to the elution step
had no effect on Au elution. According to these above mentioned authors, it was
shown in an experiment that the ability of fresh activated carbon to adsorb Au from
an initial concentration of 24.5 mg /L Au is higher than activated carbon pre-treated
in 20 g/L KCN and rinsed before being used for adsorption. This lower absorptivity of
treated carbon led to the suggestion that CN degrades to form a passivating
product which becomes deposited on carbon surface during pre-treatment. This
renders it less receptive towards adsorption thereby enhancing elution of Au (Van
Deventer and Van der Merwe, 1994; 1992). The degree of passivation was further
reported to increase with increase in pre-treatment temperature as more elution was
obtained at higher pre-treatment temperature of 100oC when compared to 20oC.
(Van Deventer and Van der Merwe, 1994).
2.10.4 Mechanism based on the modification of functional group of
activated carbon
This theory was based on the fundamental chemistry study of nucleophilic-
electrophilic reaction. Adams and Fleming (1989) suggested that the presence of
OH or CN causes a specific chemical reaction at the carbon surface. The
adsorption of
2Au(CN) and Na was investigated on three different types of resins (S-
761, S-862 and XAD-8) in both sodium chloride (NaCl) and NaOH solution (Adams
and Fleming, 1989). The result of Na extraction analysed when G210 activated
carbon was contacted with NaOH solution was shown to be a similar mechanism as
S-761 resin which consists of phenol group. This reaction is shown in Equation 2.17
(Adams and Fleming, 1989).
OH
+ NaOH
O-Na
+
+ H2O
2.17
Stellenbosch University https://scholar.sun.ac.za

Page 29
It was also suggested that CN was involved in a specific reaction on the surface of
carbon. With CN being a strong nucleophile, the appropriate functional group which
this nucleophile will react with, to have β acid-base reaction, will be carbonyl group.
Equations 2.18 and 2.19 were suggested to be the possible reaction mechanisms
(Adams and Fleming, 1989).
2.18
2.19
2.11 Nucleophilic-electrophilic reaction mechanism
The relevance of nucleophilic-electrophilic reaction mechanism is seen when dealing
with the reaction of negatively charged ions with positively charged surface
functional groups of organic compound such as activated carbon. This will also
provide possible insight to a possible reaction mechanism for Au elution mechanism.
A brief review of this theory is summarised in this section.
One of the major concepts through which chemical reaction mechanisms are well
understood is through the concept of nucleophilic-electrophilic reaction mechanism.
According to this theory, a positively polarised site gets attacked by a negatively
polarised charge. According to McMurry (1998), carbonyl functional group is one of
the main functional groups present in organic compounds. Carbonyl carbon is
positively polarised (Cδ+) (electrophile) and therefore, shows more tendencies to
react with nucleophile and base. A carbonyl oxygen (Oδ–) that is negatively polarised
readily reacts with electrophiles and acids. Dissolution of NaOH-NaCN on the other
hand will ionise to Na+, OH and CN in solution. It can be deduced that CN and
OH will react with Cδ+.
Stellenbosch University https://scholar.sun.ac.za
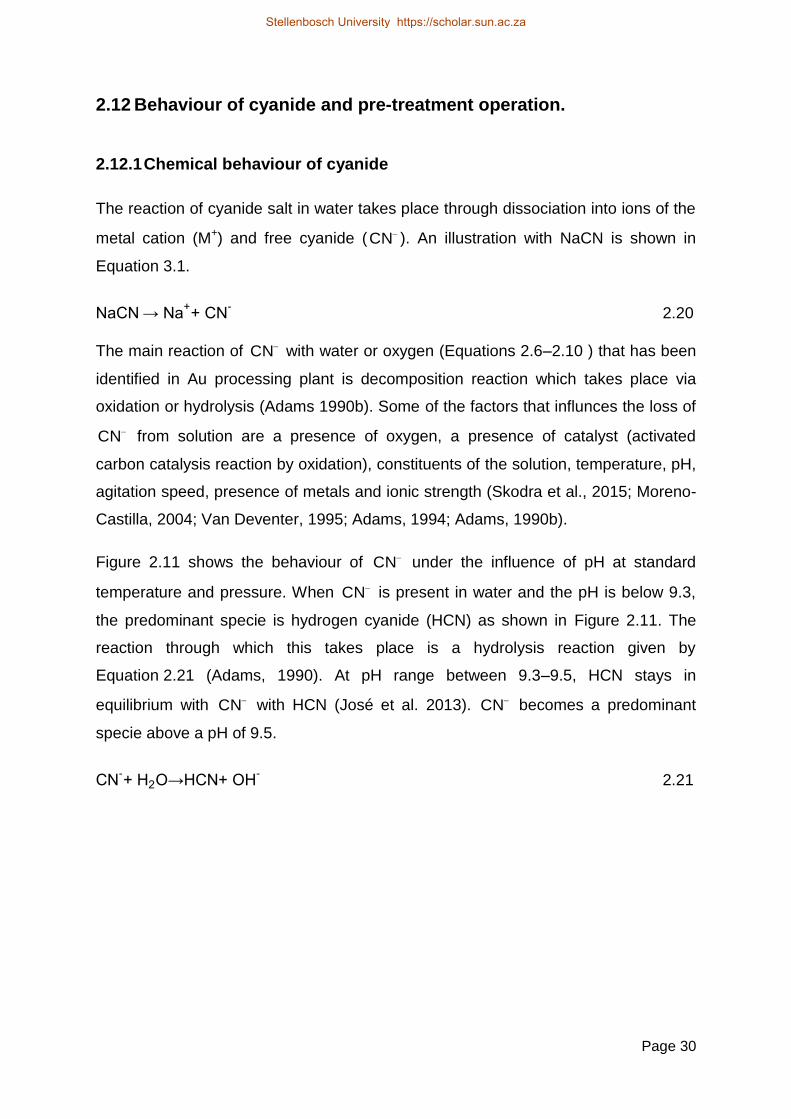
Page 30
2.12 Behaviour of cyanide and pre-treatment operation.
2.12.1 Chemical behaviour of cyanide
The reaction of cyanide salt in water takes place through dissociation into ions of the
metal cation (M+) and free cyanide ( CN ). An illustration with NaCN is shown in
Equation 3.1.
NaCN → Na++ CN
- 2.20
The main reaction of CN with water or oxygen (Equations 2.6–2.10 ) that has been
identified in Au processing plant is decomposition reaction which takes place via
oxidation or hydrolysis (Adams 1990b). Some of the factors that influnces the loss of
CN from solution are a presence of oxygen, a presence of catalyst (activated
carbon catalysis reaction by oxidation), constituents of the solution, temperature, pH,
agitation speed, presence of metals and ionic strength (Skodra et al., 2015; Moreno-
Castilla, 2004; Van Deventer, 1995; Adams, 1994; Adams, 1990b).
Figure 2.11 shows the behaviour of CN under the influence of pH at standard
temperature and pressure. When CN is present in water and the pH is below 9.3,
the predominant specie is hydrogen cyanide (HCN) as shown in Figure 2.11. The
reaction through which this takes place is a hydrolysis reaction given by
Equation 2.21 (Adams, 1990). At pH range between 9.3–9.5, HCN stays in
equilibrium with CN with HCN (José et al. 2013). CN becomes a predominant
specie above a pH of 9.5.
CN-+ H2O→HCN+ OH
- 2.21
Stellenbosch University https://scholar.sun.ac.za

Page 31
Figure 2.11: Formation of HCN and CN- with change in pH. Redrawn from José
et al. (2013)
In CIP plant, CN is utilised during adsorption, elution and electrowinning (Adams
1990a). It was stated that during pre-treatment in AARL elution process, significant
amount (about 80–90%) of CN is lost via thermal decomposition at temperature
above 130oC. The CN loss became evident after 30 min of pretreatment especially
at higher temperatures of more than 130oC (Adams, 1990a; b) Equation 2.22 was
suggested as a possible reaction (Mudder et al., 2001; Huiati et al., 1983 cited by
Adams 1990)
CN-+ H2O → NH3+HCO3
2- 2.22
2.12.1.1 Eh-ph of cyanide-water system
Figure 2.12 shows the Eh-pH diagram for CN-H2O system at 25oC and the various
equilibrium species formed by cyanide in water. It can be seen that HCN is formed
from CN in water as the pH reduces below 9.3 (Equation 2.21). The formation of
HCNO is rarely encountered in Au operation as most processes that involves CN
use are carried out in alkaline medium. CN is oxidized to cyanate CNO at pH above
9.5 given by Equation 2.23 (Adams 1990a; b; Bard, 1973)
Stellenbosch University https://scholar.sun.ac.za
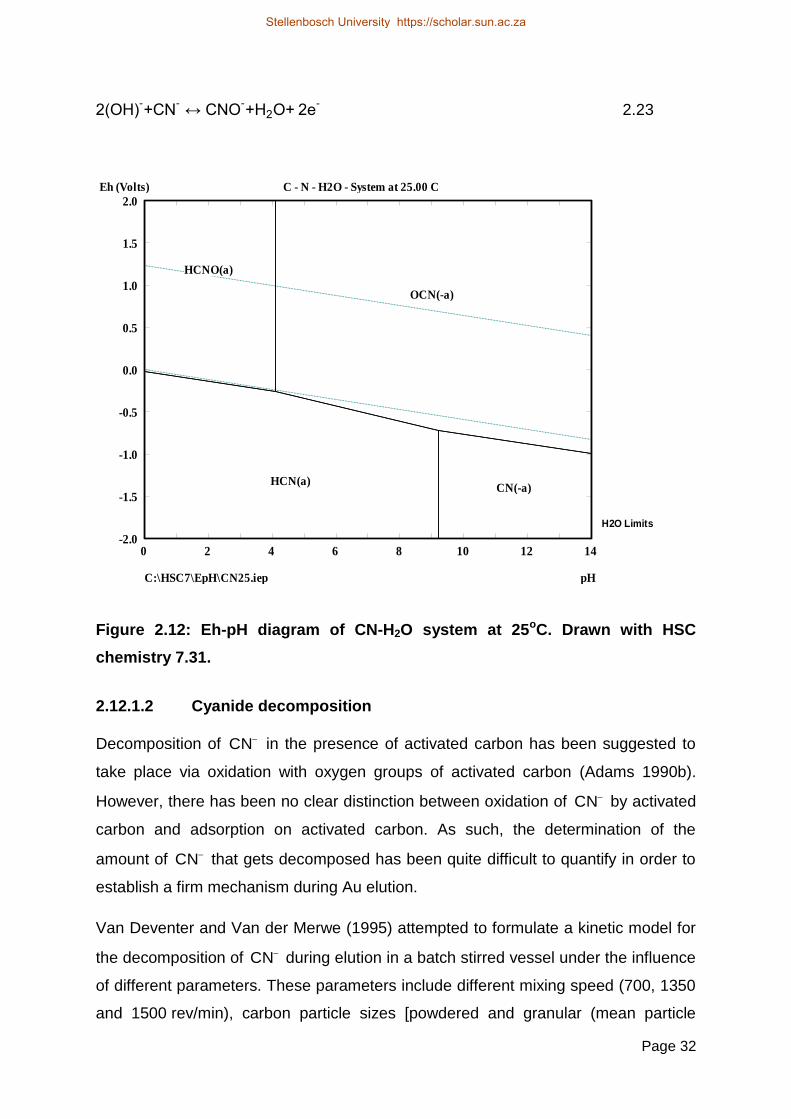
Page 32
2(OH)-+CN
- ↔ CNO
-+H2O+ 2e
- 2.23
Figure 2.12: Eh-pH diagram of CN-H2O system at 25oC. Drawn with HSC
chemistry 7.31.
2.12.1.2 Cyanide decomposition
Decomposition of CN in the presence of activated carbon has been suggested to
take place via oxidation with oxygen groups of activated carbon (Adams 1990b).
However, there has been no clear distinction between oxidation of CN by activated
carbon and adsorption on activated carbon. As such, the determination of the
amount of CN that gets decomposed has been quite difficult to quantify in order to
establish a firm mechanism during Au elution.
Van Deventer and Van der Merwe (1995) attempted to formulate a kinetic model for
the decomposition of CN during elution in a batch stirred vessel under the influence
of different parameters. These parameters include different mixing speed (700, 1350
and 1500 rev/min), carbon particle sizes [powdered and granular (mean particle
14121086420
2.0
1.5
1.0
0.5
0.0
-0.5
-1.0
-1.5
-2.0
C - N - H2O - System at 25.00 C
C:\HSC7\EpH\CN25.iep pH
Eh (Volts)
H2O Limits
CN(-a)HCN(a)
HCNO(a)
OCN(-a)
Stellenbosch University https://scholar.sun.ac.za

Page 33
diameter of about 1.42mm )], constant temperature and initial concentration of CN .
These authors reported that CN decomposition is independent of the particle size,
but increased with an increase in agitation speed. Based on these results, it was
suggested that the rate limiting process is the mass transfer between the solution
and the activated carbon but has nothing to do with pore diffusion (intraparticle
diffusion) (Van Deventer and Van der Merwe, 1995).
2.13 Mass transfer theory
One of the main aims of including agitation in chemical and metallurgical processes
is to improve rate of mass transfer between the solid and liquid phase (Paul et al.,
2004; Cooper et al., 1973). In a solid-liquid system that is mechanically agitated, rate
controlling process could either be by (Paul et al., 2004; Forgler, 1999; Doraiswamy
and Sharma, 1984):
· External diffusion of specie (film diffusion) of interest ( CN ) from the bulk fluid
through the boundary film to the surface of the activated carbon. In this case,
agitation and particle size have significant effect.
· Internal or intra-particle diffusion which is influenced by particle size and
temperature.
· Surface reaction. This is independent on agitation and particle size but
dependent on changes in temperature (Fogler, 1999).
Investigation of any of the above processes will give insight to the rate controlling
process and its connection to elution process. Several authors have reported the use
of boundary model (rate of mass diffusional transfer) to estimate solid-liquid mass
transfer coefficient (kSL) assuming a spherical particle (Atiemo-Obeng et al., 2004;
Sağ and Aktay, 2000; Findon et al., 1993; McKay and Poots, 1980; Weber and
Mathews, 1976). This model is given by Equation 2.24 was also adopted in this
study to estimate the effect of agitation speed on kSL.
dC
dt= -kSLas(C-C
*) 2.24
Where: C* = is the concentration of CN- at the carbon surface
C = concentration of CN- in the bulk solution at time t
as = specific surface area per unit volume
Stellenbosch University https://scholar.sun.ac.za

Page 34
as=6θ
ρcdc 2.25
Where: θ = activated carbon concentration in solution
ρc = density of the activated carbon
dc = diameter of the activated carbon
In the boundary model, the following assumptions were made:
· Intraparticle diffusion is insignificant and therefore, assumed to be negligible.
· Concentration of CN- at the carbon surface at time zero (t=0) is negligible.
· At t=0, C becomes Co.
Based on these assumptions, Equation 2.24 was simplified to Equation 2.26 (Sağ
and Aktay, 2000)
[d(
C
Co)
dt ]= - kSLas 2.26
Therefore, the gradient of a plot of C
Co vs t gives - kSLas from which kSL can be
calculated.
2.14 Pre-treatment operation
Several pre-treatment options with regards to the pre-treatment reagents have been
tested over the years. These include; a mixture of potassium carbonate ( 32COK )
and potassium hydroxide (KOH), KOH, NaOH, lithium hydroxide(LiOH), and a
mixture of NaOH and NaCN (Davidson and Duncanson, 1977). Among these
reagents, a mixture of 32COK and KOH and a mixture of NaOH and NaCN were
reported to yield more than 99% of Au elution recovery.
NaOH-NaCN solution was suggested as the most suitable reagent because it
efficiently eluted both Au and other metals such as silver (Ag), copper (Cu) and
nickel (Ni) compared to other pre-treatment reagents (Davidson and Duncanson,
1977). While CN helps in the stability of metal cyanide complexes, the hydroxide
maintains the alkalinity condition for the stability of CN to prevent evolution of HCN
gas during pre-treatment (Davidson and Schmidt, 1986)
Stellenbosch University https://scholar.sun.ac.za

Page 35
Two types of pre-treatment techniques are used in industry according to the AARL
elution plant design (Riley, 1991). These are batch AARL and continuous AARL
elution, which are being used in some plants like Genmin’s Grootvlei gold mine
(Riley, 1991). In terms of pre-treatment operation, batch AARL uses the same elution
column for pre-treatment while the continuous process uses a separated pre-
treatment column (Riley, 1991). The adsorbed AC is soaked (usually 30 min) in
approximately 1 bed volume of NaOH-NaCN solution (Davidson, 1986). Although it
has been suggested that a long pre-treatment time will be necessary for a low
(<110oC) pre-treatment temperature (Davidson and Bailey, 1991), many Gold plants
operate at different pre-treatment times with no record of a justifiable reason. Results
compiled by Davidson and Baily (1991) showing the effect of different pre-treatment
time and temperature on elution efficiency is shown in Table 2.3. The average
NaOH-NaCN adopted was around 5% NaCN and about 3% NaOH. It could possibly
be that the operators of these Gold plants were satisfied with the elution result
obtained at these pre-treatment conditions because it has been yielding an
acceptable Au elution recovery right from its usage. However, this has led to limited
attention given to the optimisation of the pre-treatment parameters.
Table 2.3: Reported AARL conditions at different Gold plants (Davidson and
Bailey, 1991)
Gold plant Pre-treatement
condition
Elution
condition
Efficiency
( %)
Temp.
(oC)
Time
(min)
Flow rate
(BV/h)
Temp.
(oC)
Ergo 120 60 1.8 120 84.3
Daggafontein 120-140 60 0.8 120-140 95.9
Simmergo 80 <10 1.8 120 90.1
New Brand 120 30 2 120 96.5
Western Deep No 1 125 60 1.8 120 96.8
Western Deep No 3 90 30 2-3 120 97
Afr Lease 70 45 1.6 110 94.2
City Deep 115-110 120 2.7 110 93.6
Crown sands 110-100 120 2.7 110 94.4
Western Areas 110 90 1.8 110 99.6
Doornkop 95 30 1.1 110 96
Stellenbosch University https://scholar.sun.ac.za

Page 36
It can be seen from Table 2.3 that variability exists in the pre-treatment parameters
adopted at different Gold plant and no set standard can be suggested to be existing
in the industry.
2.15 Summary on literature review
Chapter 2 considered the literature review of gold processing, more specifically the
adsorption and elution of Au in CIP plant. This chapter started with a broad view of
gold processing operation followed by the review of the application and properties of
activated carbon for Au adsorption in CIP plant. Furthermore, the various
components of the CIP plant was described. The factors suggested by different
authors for optimum performance of the plant.and improved Au adsorption was also
reported. According to Adams (1983),
2Au(CN) adsorption is thermodynamically
reversible. This justified the elaborate discussions on adsorption mechanism and its
factors. The suggested mechanisms are reduction mechanism, electrostatic
attraction mechanism, ion pair mechanism and non-ion pair mechanism. The factors
that were reviewed to enhance Au adsorption are: high ionic strength, oxygen supply
under low ionic strength, low pH, low CN concentration, and low temperature. This
implies that reversing these factors will enhance elution. This led to a discussion of
the elution process with more emphasis on AARL elution process that is of more
interest to this work. The role of CN during pre-treatment in the AARL elution
process for improved elution of Au demonstrated by different authors was also
reported. However, there still seems to be less agreement on the exact mechanism
of how CN aids in this efficient elution. This resulted into the review of previously
proposed elution mechanisms and elution factors. The theories on which the elution
mechanisms were based are: nature of the adsorbed Au, competition of adsorption
site by CN with
2Au(CN) , passivation mechanism by the formation of decomposed
product formed from the reaction CN with carbon surface and the modification of
functional group. Furthermore, an overview of the theory of nucleophilic-electrophilic
reaction which was considered an important aspect for suggesting a reaction
mechanism for organic compounds such as activated carbon was presented.
Stellenbosch University https://scholar.sun.ac.za
Page 37
More emphasis was placed on the various possible reactions of CN in CIP plant
and pre-treatment stage in AARL elution which will form a sound framework for this
study. The inconsistency of the pre-treatment variables i.e., pre-treatment
temperature and contact time adopted in different industries which forms one of the
main objectives of this work was also reported in this chapter. Agitation speed on the
other hand has not been reported as a pre-treatment parameter. However, in relation
to decomposition mechanism, improved decomposition of CN with an increase in
agiation speed for a set time has been suggested but the effect on Au elution
recovery has not been investigated.
Significant understanding of the literature about Au process, role of CN under the
influence of different factors, uncertainity of the exact elution mechanism and the
variabilities that exist in the industry with regards to pre-treatment parameter helped
to provide reasonable explanations of the effect of pre-treatment parameters. The
result obtained further helped to suggest the most suitable elution mechanism with
relevant recommendations made to the industry.
The next chapter focuses on the materials and methods used to investigate the
effect of the pre-treatment parameters. This gives an understanding of the role of
CN on Au loaded on activated carbon and noting the effect on elution
.
Stellenbosch University https://scholar.sun.ac.za
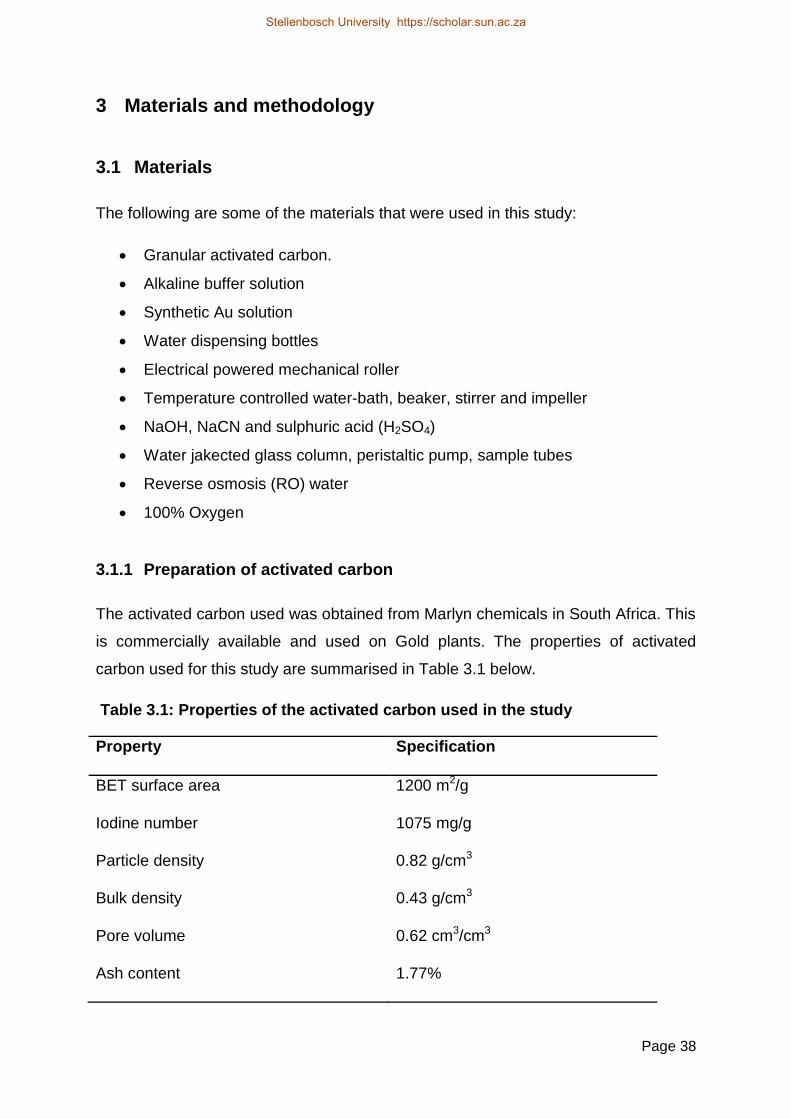
Page 38
3 Materials and methodology
3.1 Materials
The following are some of the materials that were used in this study:
· Granular activated carbon.
· Alkaline buffer solution
· Synthetic Au solution
· Water dispensing bottles
· Electrical powered mechanical roller
· Temperature controlled water-bath, beaker, stirrer and impeller
· NaOH, NaCN and sulphuric acid (H2SO4)
· Water jakected glass column, peristaltic pump, sample tubes
· Reverse osmosis (RO) water
· 100% Oxygen
3.1.1 Preparation of activated carbon
The activated carbon used was obtained from Marlyn chemicals in South Africa. This
is commercially available and used on Gold plants. The properties of activated
carbon used for this study are summarised in Table 3.1 below.
Table 3.1: Properties of the activated carbon used in the study
Property Specification
BET surface area 1200 m2/g
Iodine number 1075 mg/g
Particle density 0.82 g/cm3
Bulk density 0.43 g/cm3
Pore volume 0.62 cm3/cm3
Ash content 1.77%
Stellenbosch University https://scholar.sun.ac.za
Page 39
A 900 g of fresh activated carbon was weighed, screened. Thereafter, a geometric
mean size of 2537 µm was determined. This was followed by rinsing in RO water for
30 min to remove any contaminants and then oven dried at 90oC for 48 hours. From
the prepared 900 g, 840 g was taken and divided into two equal parts (420 g each).
Each 420 g of the oven-dried fresh activated carbon was poured into a 10 L bucket
each containing de-ionised water and agitated for 30 min to restore the activity of the
activated carbon (Lorenzen et al., 1995) after which adsorption of Au was carried
out.
3.1.2 Preparation of alkaline buffer solution
Buffer solution was prepared according to the description by Mpinga (2012). Alkaline
buffer solution was used to stabilise the pH of the adsorbing medium (sodium salt
and weak base). Sodium bicarbonate (NaHCO3) and sodium carbonate (Na2CO3)
weighed at 8.4g and 1.91g respectively were poured into a 1000mL beaker followed
by the addition of water to two-third of the beaker. This mixture was allowed to
dissolved and then acid (H2SO4) and base (NaOH) was added to monitor the pH to
around 10. Additional water was added to volume of 35 litres.
3.1.3 Preparation of synthetic gold solution
Potassium gold-cyanide KAu(CN)2 salt was mixed in the 9.5 pH prepared buffer
solution and diluted to a volume of 30 litres to produce a 200 mg/L Au solution. The
pH of the solution was adjusted by adding NaOH and H2SO4 to control and maintain
a pH of 10. The alkaline medium served to prevent the formation of HCN gas that
could evolve at pH below 9.3 (Marsden and House, 2006). The aim of this work was
not to obtain an optimum Au adsorption; therefore, a low Au concentration of about
11 mg/L was used. After preparation, a 5 mL solution was taken for ICP_OES
analysis for confirmation of the Au uptake by activated carbon.
Stellenbosch University https://scholar.sun.ac.za
Page 40
3.2 Methodology
3.2.1 Phase 1: Adsorption stage
The procedure for the loading of activated carbon is similar to the work of Mpinga
(2012). The prepared 420 g activated carbon described in Section 3.1.1 was
transferred into an 18.9 litres of water dispensing bottles, which contained 15 litres of
the synthetic Au solution. This procedure was carried out for an additional bottle.
These two bottles were transferred onto a mechanical roller powered by electricity
rotated at a constant speed of 450 rev/min measured with a MT952 tachometer for
72 hours as shown in Figure 3.1. Almost a complete equilibrium would have been
achieved at 72 hours of adsorption time which have been demonstrated in a similar
adsorption process (Mpinga, 2012; Van Deventer, 1984). The mechanical roller has
been demonstrated to give an analogous loading rate in comparison to the
conventional CIP plant (Fleming, 2011). A sample of the solution was taken after 72
hours for ICP_MS analysis to determine the Au uptake by the activated carbon. The
loaded carbon was filtered with a 800 µm screen, oven dried at 80oCfor 48 hours and
divided into 12 g each using a rotary divider. Each of the 12 g loaded carbon was
placed inside a zip-lock and stored in a dry, cool place for the next phase of the
experiment. Details of the experimental steps, risk analysis as well as precautions
taken during this stage are provided in Appendix A.
Stellenbosch University https://scholar.sun.ac.za
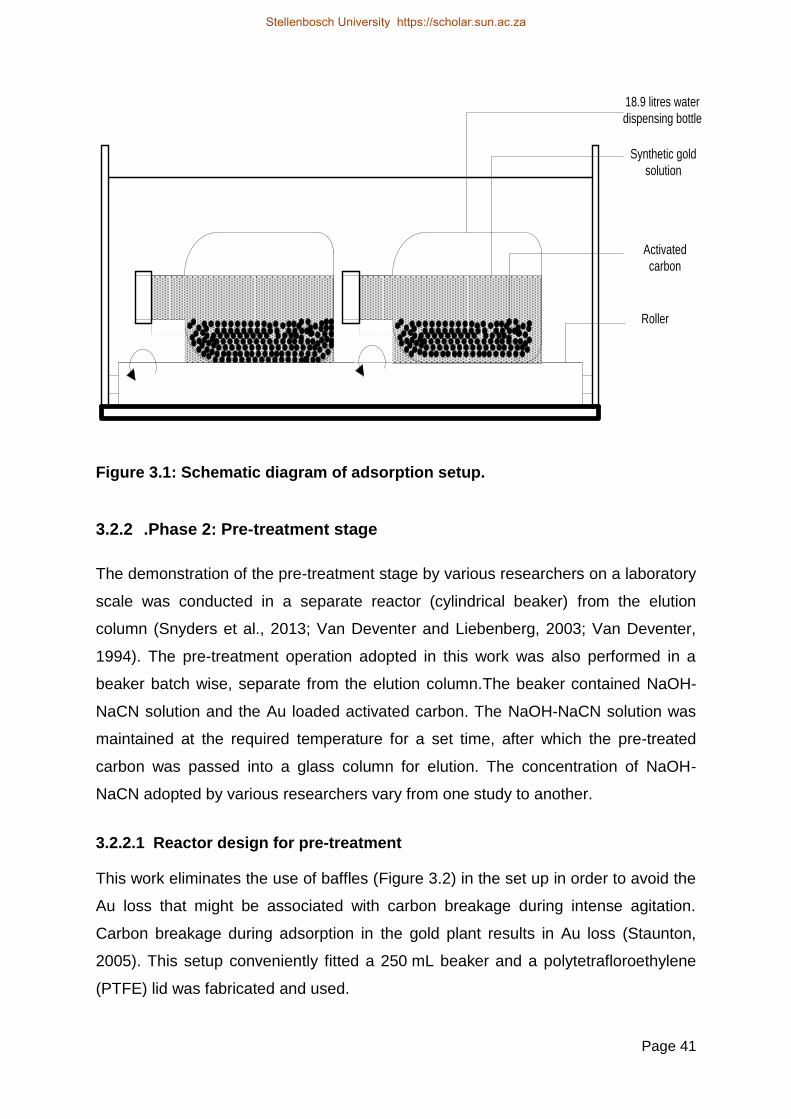
Page 41
18.9 litres water
dispensing bottle
Synthetic gold
solution
Activated
carbon
Roller
Figure 3.1: Schematic diagram of adsorption setup.
3.2.2 .Phase 2: Pre-treatment stage
The demonstration of the pre-treatment stage by various researchers on a laboratory
scale was conducted in a separate reactor (cylindrical beaker) from the elution
column (Snyders et al., 2013; Van Deventer and Liebenberg, 2003; Van Deventer,
1994). The pre-treatment operation adopted in this work was also performed in a
beaker batch wise, separate from the elution column.The beaker contained NaOH-
NaCN solution and the Au loaded activated carbon. The NaOH-NaCN solution was
maintained at the required temperature for a set time, after which the pre-treated
carbon was passed into a glass column for elution. The concentration of NaOH-
NaCN adopted by various researchers vary from one study to another.
3.2.2.1 Reactor design for pre-treatment
This work eliminates the use of baffles (Figure 3.2) in the set up in order to avoid the
Au loss that might be associated with carbon breakage during intense agitation.
Carbon breakage during adsorption in the gold plant results in Au loss (Staunton,
2005). This setup conveniently fitted a 250 mL beaker and a polytetrafloroethylene
(PTFE) lid was fabricated and used.
Stellenbosch University https://scholar.sun.ac.za
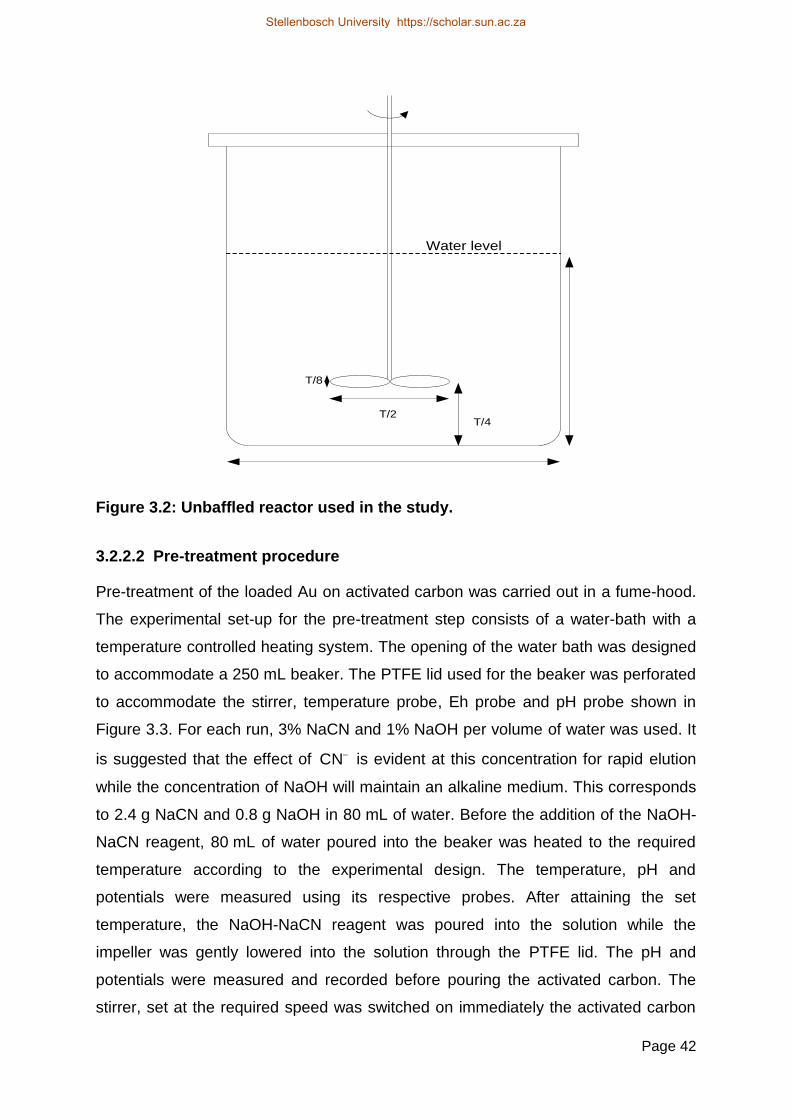
Page 42
T/2T/4
Water level
T/8
Figure 3.2: Unbaffled reactor used in the study.
3.2.2.2 Pre-treatment procedure
Pre-treatment of the loaded Au on activated carbon was carried out in a fume-hood.
The experimental set-up for the pre-treatment step consists of a water-bath with a
temperature controlled heating system. The opening of the water bath was designed
to accommodate a 250 mL beaker. The PTFE lid used for the beaker was perforated
to accommodate the stirrer, temperature probe, Eh probe and pH probe shown in
Figure 3.3. For each run, 3% NaCN and 1% NaOH per volume of water was used. It
is suggested that the effect of CN is evident at this concentration for rapid elution
while the concentration of NaOH will maintain an alkaline medium. This corresponds
to 2.4 g NaCN and 0.8 g NaOH in 80 mL of water. Before the addition of the NaOH-
NaCN reagent, 80 mL of water poured into the beaker was heated to the required
temperature according to the experimental design. The temperature, pH and
potentials were measured using its respective probes. After attaining the set
temperature, the NaOH-NaCN reagent was poured into the solution while the
impeller was gently lowered into the solution through the PTFE lid. The pH and
potentials were measured and recorded before pouring the activated carbon. The
stirrer, set at the required speed was switched on immediately the activated carbon
Stellenbosch University https://scholar.sun.ac.za

Page 43
was poured into the solution. The pH and potentials at 5 min intervals was measured
and recorded.
Water-bath
Heater
Overhead
stirrerTemperature
probe
pH probe
Eh probe
Water bath
Figure 3.3: Experimental set-up of pre-treatment process.
3.2.2.3 Rinsing of pre-treatment reagent
Some additional experiments were devised to investigate the effect of rinsing the
pre-treatment reagent (NaOH-NaCN solution) on the elution process. Rinsing was
conducted on the pre-treated activated carbon after decanting the pre-treated
solution. RO water with a volume of 5 mL was poured into the pre-treated activated
carbon and gently shaken for about 2 min. This procedure was repeated 5 times,
which resulted in 300 mL of rinsed solution corresponding to 6 bed volumes of the
present elution study. The Au in the pre-treatment solution was analysed. During the
rinsing process, the HCN gas detector was placed close to the beaker lid and the
observed HCN gas read on the Dragger cyanide detector was recorded.
3.2.3 Phase 3: Elution stage
A simplified flow sheet of the elution set-up is presented in Figure 3.4. This is similar
to the experimental set-up adopted by Snyders et al. (2014). Before the start of the
elution, RO water was heated to 90oC with water bath pump and the water jacketed
Stellenbosch University https://scholar.sun.ac.za
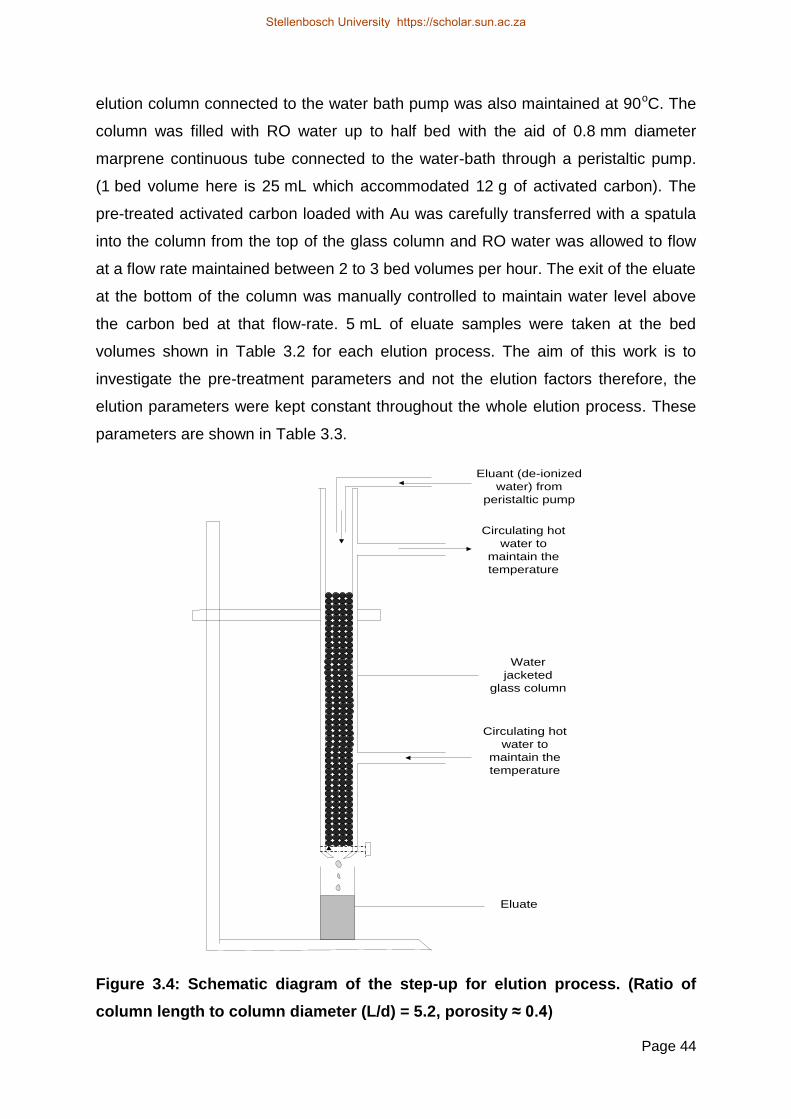
Page 44
elution column connected to the water bath pump was also maintained at 90oC. The
column was filled with RO water up to half bed with the aid of 0.8 mm diameter
marprene continuous tube connected to the water-bath through a peristaltic pump.
(1 bed volume here is 25 mL which accommodated 12 g of activated carbon). The
pre-treated activated carbon loaded with Au was carefully transferred with a spatula
into the column from the top of the glass column and RO water was allowed to flow
at a flow rate maintained between 2 to 3 bed volumes per hour. The exit of the eluate
at the bottom of the column was manually controlled to maintain water level above
the carbon bed at that flow-rate. 5 mL of eluate samples were taken at the bed
volumes shown in Table 3.2 for each elution process. The aim of this work is to
investigate the pre-treatment parameters and not the elution factors therefore, the
elution parameters were kept constant throughout the whole elution process. These
parameters are shown in Table 3.3.
Eluant (de-ionized
water) from
peristaltic pump
Circulating hot
water to
maintain the
temperature
Circulating hot
water to
maintain the
temperature
Eluate
Water
jacketed
glass column
Figure 3.4: Schematic diagram of the step-up for elution process. (Ratio of
column length to column diameter (L/d) = 5.2, porosity ≈ 0.4)
Stellenbosch University https://scholar.sun.ac.za
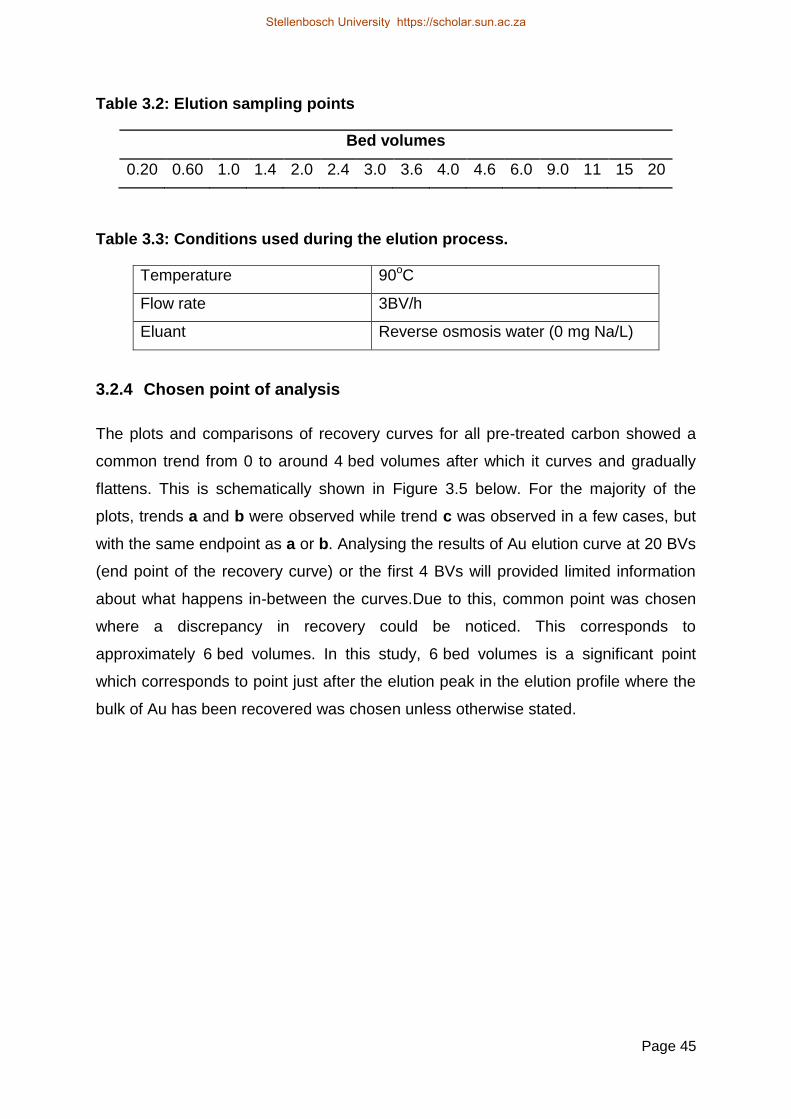
Page 45
Table 3.2: Elution sampling points
Bed volumes
0.20 0.60 1.0 1.4 2.0 2.4 3.0 3.6 4.0 4.6 6.0 9.0 11 15 20
Table 3.3: Conditions used during the elution process.
Temperature 90oC
Flow rate 3BV/h
Eluant Reverse osmosis water (0 mg Na/L)
3.2.4 Chosen point of analysis
The plots and comparisons of recovery curves for all pre-treated carbon showed a
common trend from 0 to around 4 bed volumes after which it curves and gradually
flattens. This is schematically shown in Figure 3.5 below. For the majority of the
plots, trends a and b were observed while trend c was observed in a few cases, but
with the same endpoint as a or b. Analysing the results of Au elution curve at 20 BVs
(end point of the recovery curve) or the first 4 BVs will provided limited information
about what happens in-between the curves.Due to this, common point was chosen
where a discrepancy in recovery could be noticed. This corresponds to
approximately 6 bed volumes. In this study, 6 bed volumes is a significant point
which corresponds to point just after the elution peak in the elution profile where the
bulk of Au has been recovered was chosen unless otherwise stated.
Stellenbosch University https://scholar.sun.ac.za

Page 46
Figure 3.5: Illustration of the different recovery curves detected from the
experimental work also showing the point of analysis at 6 bed volumes.
3.3 Experimental design
Based on the three levels and three factors that was investigated, experiments were
statistically designed adopting a Box-Behnken design (BB) using Statistical 12
software. BB design offers advantages of fewer runs than three-level full factorial
design than the Central composite design (CCD) and it is also suitable for
optimisation through the response surface plot (Montgomery, 2013). If a three level
full factorial with three replicates were to be adopted, eighty-one runs would have
been required. However, with BB design, forty-five efficient runs are required with
replications included. The experimental design without replicating is presented in
Table 3.4 and the random design with the replicated is shown in Table 3.5.
Experiments were replicated three times to minimise errors and improve accuracy of
the regression model used for the predictions of points that were not included in the
Stellenbosch University https://scholar.sun.ac.za

Page 47
experiment. Another advantage of BB is that it is rotatable or very nearly rotatable
providing equal variances (Montgomery, 2013). This will also reduce the cost and
time by approximately 50% when compared with a three level full factorial design.
Table 3.4: Box-Behnken Experimental design in standard order
Run Temperature
(oC)
Time
(min)
Speed
(rev/min)
1 25 15 600
2 80 15 600
3 25 45 600
4 80 45 600
5 25 30 0
6 80 30 0
7 25 30 1200
8 80 30 1200
9 53 15 0
10 53 45 0
11 53 15 1200
12 53 45 1200
13 53 30 600
14 53 30 600
15 53 30 600
Table 3.5: Box-Behnken Experimental design in random order
Run nr Replicate Temperature (oC)
Time (min)
Speed (rev/min)
18 2 25 45 600
29 2 53 30 600
45 3 53 30 600
4 1 80 45 600
16 2 25 15 600
17 2 80 15 600
Stellenbosch University https://scholar.sun.ac.za
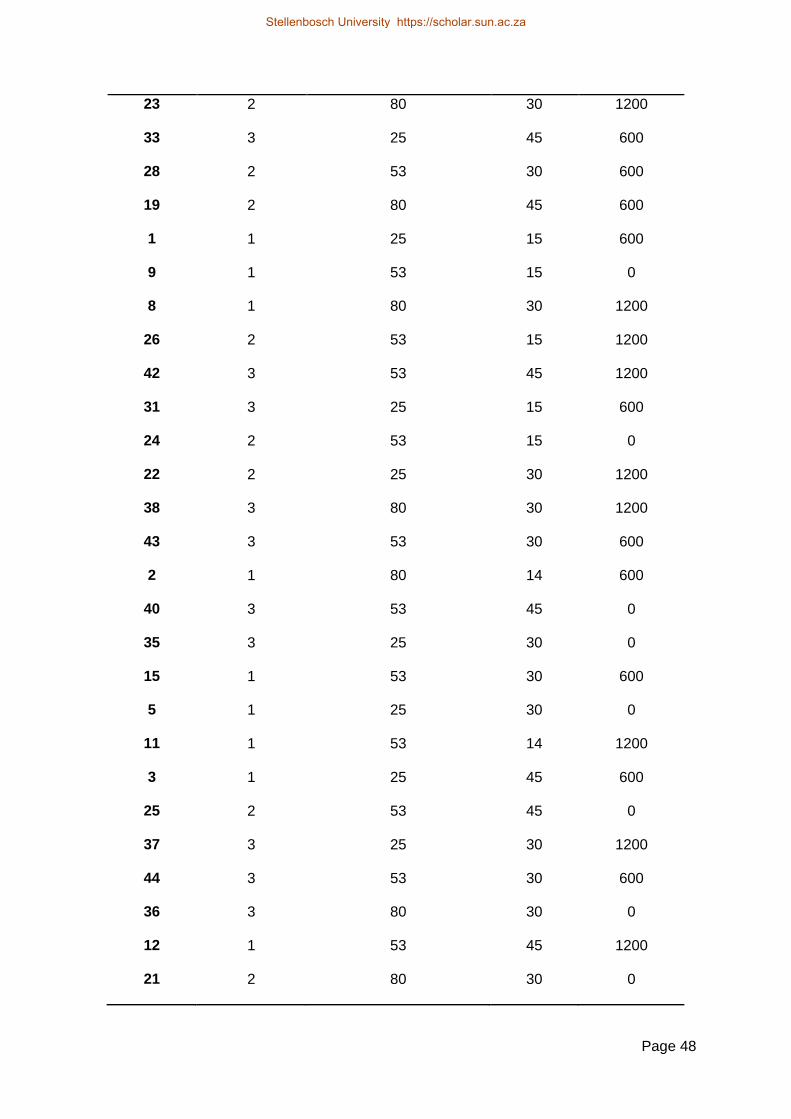
Page 48
23 2 80 30 1200
33 3 25 45 600
28 2 53 30 600
19 2 80 45 600
1 1 25 15 600
9 1 53 15 0
8 1 80 30 1200
26 2 53 15 1200
42 3 53 45 1200
31 3 25 15 600
24 2 53 15 0
22 2 25 30 1200
38 3 80 30 1200
43 3 53 30 600
2 1 80 14 600
40 3 53 45 0
35 3 25 30 0
15 1 53 30 600
5 1 25 30 0
11 1 53 14 1200
3 1 25 45 600
25 2 53 45 0
37 3 25 30 1200
44 3 53 30 600
36 3 80 30 0
12 1 53 45 1200
21 2 80 30 0
Stellenbosch University https://scholar.sun.ac.za

Page 49
14 1 53 30 600
41 3 53 15 1200
39 3 53 15 0
6 1 80 30 0
32 3 80 15 600
27 2 53 45 1200
20 2 25 30 0
10 1 53 45 0
30 2 53 30 600
7 1 25 30 1200
34 3 80 45 600
13 1 53 30 600
3.3.1 Choice of levels
The variables that were investigated during the pre-treatment stage and the three
levels chosen are:
· Pre-treatment temperature (25, 53, 80) oC
· Pre-treatment time (15, 30, 45) min
· Stirring during the pre-treatment operation.(0, 600, 1200) rev/min
Three levels of each variable investigated were chosen according to the Box-
Behnken experimental design for suitable optimisation (Montgomery, 2013). Incase
optimisation will be required.
3.3.2 Pre-treatment temperature
Temperature has been discussed as one of the main factors that favours desorption
(Section 2.9.1). Van der Merwe and Van Deventer (1993) investigated the effect of
pre-treatment temperature at 20oC and 100oC. Likewise Jeffery et al. (2010) adopted
Stellenbosch University https://scholar.sun.ac.za

Page 50
a pre-treatment temperature of 130oC. In these cases, it was concluded that more
elution occurs during pre-treatment at high temperature. 80oC was chosen for the
high level pre-treatment temperature in this research. At this temperature, it was a
convenient temperature at atmospheric pressure and the aim was to investigate the
effect rather than finding an optimum solution. Low level pre-treatment temperature
of 25oC was chosen and the mid-point corresponding to approximately 53oC was
used as the mid-point level.
3.3.3 Pre-treatment time
According to Laxen et al. (1982), reduction in pre-treatment time from 8 hours to
about 2 hours does not have a detrimental effect on elution efficiency. Pre-treatment
time of 30 min is commonly used by various researchers on a laboratory scale and
variabilities of pre-treatment time exist in the industry (Marsden and House, 2006;
Van Deventer and Van der Merwe, 1993; Davidson and Bailey, 1991; Davidson and
Schmidt, 1986). 30 min was chosen as the reference and midpoint to investigate the
effect above and below the reference point. As such, 15 min and 45 min were
chosen for the low and high level respectively.
3.3.4 Agitation speed
Several researchers have shown that no stirring for 30 min was adopted in the pre-
treatment condition (Jeffery et al., 2009, Van Deventer 1993; Van Deventer 1992;
Davidson 1986; Davidson and Veronese, 1979; Davidson 1977). However, in the
investigation of the feasibility of using activated carbon for PGM [Platinum (Pt),
Palladium (Pd) and Au] recovery from low grade ore, Snyders (2014) adopted a
stirring time of 30 min at a constant speed. Van Deventer and Van der Merwe (1995)
investigated the effect of different stirring speeds on the decomposition of CN for
about 70 hours. The result showed that more CN decomposes with increasing
agitation speed, however, the effect on elution was also not provided.
This work adopted a low level of no agitation (0 rev/min) which can be seen as a
region of laminar regime and a high level of intense turbulent condition
(1200 rev/min) which corresponds to speed of just the suspension (Njs) of carbon
particles. The Njs was determined based on visual inspection of the carbon particles
Stellenbosch University https://scholar.sun.ac.za

Page 51
at 1200 rev/min (Paul et el., 2004; Gray, 1999). Njs is suggested to increase
maximum exposure of the particles for uniform mixing (Paul et al., 2004). The
midpoint of 600 rev/min was calculated from the range of chosen speeds.
The appropriate dimensionless parameters (Power numbers and Reynolds numbers)
used to quantify the agitation speeds were calculated according to Equations 3.1 and
3.2 respectively (Wong et al., 2014; Hemrajani and Tatterson, 2004).
Np= P
ρmN3D
5 3.1
R= D
2Nρm
μm
3.2
Where: Np = Power number
P = Power consumption of slurry (W)
N = Rotational speed of the impeller (rps)
D = Impeller Diameter (m)
R = Reynolds number
ρm
= Density of mixture (kg/m3)
μm
= Viscosity of the mixture (N.s/m2)
2The density of the mixture and viscosity of the mixture was calculated using
Equations 3.3 and 3.4 respectively (Menon, 2004)
ρm
= 100
[Cwρs
+[100-Cw]
ρL] 3.3
μm
= μL*[1+2.5*ɸ+10.5*ɸ
2+0.00237*exp (16.6*ɸ)] 3.4
Where: 𝐶𝑤 = concentration of solids by weight in slurry (%)
ρs = density of solids (kg/m3)
ρL = density of liquid (kg/m3)
2 Mixture is a combination of solids (carbon + NaOH-NaCN) and liquids(RO water)
Stellenbosch University https://scholar.sun.ac.za

Page 52
μL = viscosity of liquid
ɸ = volume fraction
3.4 Method of analysis
3.4.1 ICP_OS
Au and Na concentrations in solution were analysed using an i-cap 6000 series ICP
spectrometer. A standard stock of Au and Na solution was prepared in which the
intensities of the wavelength were known. This corresponds to the concentration of
the standard solution. The concentration of the wavelengths and intensity of the
aqueous samples to be determined are converted to aerosols through a nebulizer at
high temperatures between 8000oC to 10000oC. The comparisons of these
wavelengths against the standard solution were finally used to correlate the actual
concentration.
3.4.2 Silver nitrate titration
Free cyanide ( CN ) was measured by titrating 1 mL volume of solution containing
CN against a 0.1 M concentration of silver nitrate (AgNO3) with an automatic
titrating machine (TIM856 titration manager), using a silver electrode as the indicator.
Mille-Q water was added to the 1 mL solution containing CN to have contact with
the indicator. The potentiometric end-points were detected from the derivated plot
(indicated on the screen of the titrating machine) of the potential of the solution
against the volume of AgNO3 used. This was signified by the maximum peak in the
plot while the corresponding volume was used to calculate the concentration of CN .
See Appendix B for supporting calculation.
3.4.3 Scanning electron microscopic analysis
The Image of Au loaded activated carbon was investigated using a Zeiss EVO®
MA15 Scanning Electron Microscope at the Geology department of Stellenbosch
University. Firstly, before the imaging was carried out, the samples were mounted on
a stub carbon tape with double side in order to make the sample surface electrically
Stellenbosch University https://scholar.sun.ac.za

Page 53
conducting. The Scanning electron (SE) images show the surface structure of the
material. The spot size of the beam was 550 and the conditions of the surface were
20 kV.
3.4.4 Measurement of natural or dissolved oxygen
Dissolved oxygen (DO) in solution was measured using a cyber-scan 300 dissolved
oxygen meter connected to a dissolved oxygen probe.
3.5 Chapter summary
The materials and methodology used in the conduction of this research were
outlined and described in this chapter. These materials and approaches include the
synthetic Au solution, properties of activated carbon, how the loading of Au on
activated carbon was performed, pre-treatment and the elution process. In addition,
choice of experimental design and the selection of pre-treatment parameters were
also discussed. The last section of this chapter discussed the various analytical
techniques adopted. These include ICP_OES analysis, titration technique for the
measurement of CN , SEM and the dissolved oxygen measurement.
The results of these experiments that investigated the role of NaOH-NaCN and effect
of temperature, contact time and agiation speed on Au elution are discussed in the
next chapter.
Stellenbosch University https://scholar.sun.ac.za

Page 54
4 Results and discussion
The results obtained from the experiments and its interpretations are presented in
this charpter in order to answer the research questions. These include a brief
summary of the loading on activated carbon and results obtained in the pre-
treatment stage where the role of NaOH-NaCN and the effect of pre-treatment
parameters on Au elutions were investigated. Adequate understanding of these
effects significantly assisted in the explanation of the most suitable elution
mechanism. Furthermore, the industrial application on Au loaded activated carbon
supplied from Au processing plant was presented.
4.1 Adsorption result
The adsorption experiment was conducted at atmospheric conditions in an electrical
powered mechanical roller rotating at a speed of 450 rev/min. ICP analysis of the
barren solution after adsorption revealed a concentration of 0.03 mg/L from an initial
concentration of 10.6 mg/L of the prepared synthetic Au solution. This showed that
more than 99% of the Au was adsorbed. The concentration of carbon used in
comparison to the amount of Au adsorbed resulted in large amount of surface area
for sufficient adsorption (Van Nguyen et al., 2010). It was assumed that the loading
was uniform through the thorough mixing that was carried out using a rotary divider.
As such, each 12 g of AC that were subsequently used during pre-treatment and
elution were assumed to have 0.38 mg/g of Au. The remaining adsorbed Au on
carbon after elution was not estimated. Therefore, It was assumed that the maximum
(100%) recovery of Au elution recovery was obtained at the optimum pre-treatment
condition at 20 BV
4.2 Elution results
Table 4.1 shows an overview of the Au elution results after pre-treatment and at
6 bed volumes (just after the elution peak). The elution results presented are the
average values after three replicates of each run. Using the mean after three
replicates minimises the error that might be associated with the experiment, it also
improves the accuracy of the regression model used to predict other data points that
Stellenbosch University https://scholar.sun.ac.za

Page 55
are not conducted experimentally. Statistical analysis of results and the errors
associated with the experiment are further discussed in chapter 6
Table 4.1: Overview of experimental result of Au elution at different pre-
treatment conditions.
Run Temperature
(oC)
Time
(min)
Speed
(rev/min)
Au (mg/L)
after pre-
treatment
%Recovery
after pre-
treatment
%Recovery
at 6BV
Na (mg/L)
after pre-
treatment
1 25 15 600 0.06 0.03 54.6 17156
2 80 15 600 0.61 0.27 61.2 18415
3 25 45 600 0.04 0.02 59.5 17641
4 80 45 600 0.47 0.21 61.7 18942
5 25 30 0 0.06 0.03 59.9 16658
6 80 30 0 0.97 0.44 70.9 18132
7 25 30 1200 0.10 0.04 58.3 16593
8 80 30 1200 0.13 0.06 56.5 18448
9 53 15 0 0.11 0.05 59.9 18283
10 53 45 0 0.17 0.08 60.3 17276
11 53 15 1200 0.06 0.03 56.7 17540
12 53 45 1200 0.04 0.02 56.8 18706
13 53 30 600 0.08 0.04 55.5 18050
14 53 30 600 0.11 0.05 57.3 16958
15 53 30 600 0.05 0.02 55.1 16001
4.2.1 Gold elution after pre-treatment
It can also be seen from Table 4.1 that the percentage of Au eluted after pre-
treatment did not exceed 0.44% even at high levels of any of the pre-treatment
parameter (80oC or 45 min or 1200 rev/min). This suggested that insignificant
amount of Au was eluted during pre-treatment when compared with Au eluted at
6BVs. Therefore, it was assumed that amount of Au eluted after pre-treatment will
not influence results found at 6 BVs. The results of elution performed at pre-
treatment condition of 80oC, 30 min and no agitation is shown in Figure 4.1. This
curve was used as an example for all the elution curves obtained and is used to
explain the elution behaviour of Au.
Stellenbosch University https://scholar.sun.ac.za

Page 56
1 2 3
Figure 4.1: Description of Au elution curve. (Pre-treatment with 1% NaOH and
3% NaCN, 80oC, 30 min and no agitation , elution at 90°C)
For clarity, the elution profile was divided into 3 sections. The description for each of
this section is shown in Table 4.2 which is similar to the description by Snyders et al.
(2015).
Table 4.2: Description of the divided sections of elution curve
Section Observation and description Suggestion or possible reason
1 The amount of Na eluted increases
while Au is yet to be eluting.
Excessive amount of Na carried
over from pre-treatment supressed
Au elution.
2 The concentration of Na drops while
the concentration of Au increases to
a maximum point in solution
Removal of Na favours Au elution
recovery
3 The amount of Au eluted from the
column decreases while Na remains
depleted at low concentration
throughout this stage.
Depletion of Au on carbon surface
resulting in decrease in
concentration of Au in solution
Stellenbosch University https://scholar.sun.ac.za
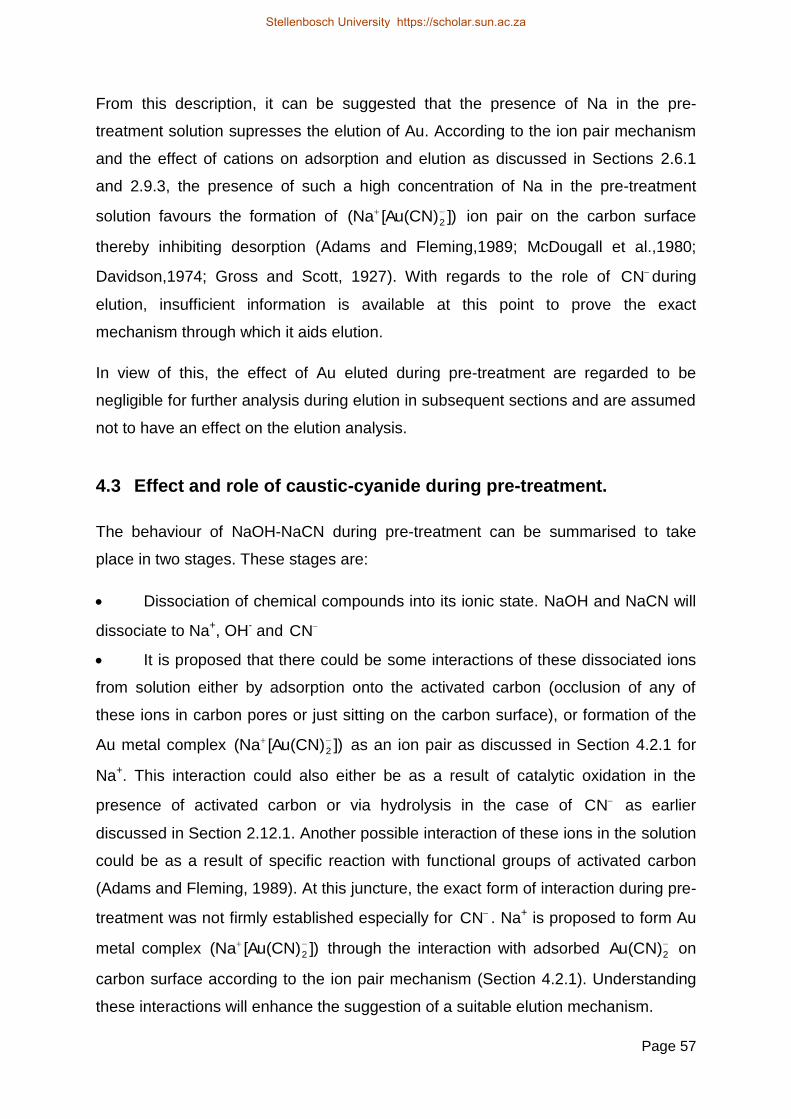
Page 57
From this description, it can be suggested that the presence of Na in the pre-
treatment solution supresses the elution of Au. According to the ion pair mechanism
and the effect of cations on adsorption and elution as discussed in Sections 2.6.1
and 2.9.3, the presence of such a high concentration of Na in the pre-treatment
solution favours the formation of ])[Au(CN)(Na 2
ion pair on the carbon surface
thereby inhibiting desorption (Adams and Fleming,1989; McDougall et al.,1980;
Davidson,1974; Gross and Scott, 1927). With regards to the role of CN during
elution, insufficient information is available at this point to prove the exact
mechanism through which it aids elution.
In view of this, the effect of Au eluted during pre-treatment are regarded to be
negligible for further analysis during elution in subsequent sections and are assumed
not to have an effect on the elution analysis.
4.3 Effect and role of caustic-cyanide during pre-treatment.
The behaviour of NaOH-NaCN during pre-treatment can be summarised to take
place in two stages. These stages are:
· Dissociation of chemical compounds into its ionic state. NaOH and NaCN will
dissociate to Na+, OH- and CN
· It is proposed that there could be some interactions of these dissociated ions
from solution either by adsorption onto the activated carbon (occlusion of any of
these ions in carbon pores or just sitting on the carbon surface), or formation of the
Au metal complex ])[Au(CN)(Na 2
as an ion pair as discussed in Section 4.2.1 for
Na+. This interaction could also either be as a result of catalytic oxidation in the
presence of activated carbon or via hydrolysis in the case of CN as earlier
discussed in Section 2.12.1. Another possible interaction of these ions in the solution
could be as a result of specific reaction with functional groups of activated carbon
(Adams and Fleming, 1989). At this juncture, the exact form of interaction during pre-
treatment was not firmly established especially for CN . Na+ is proposed to form Au
metal complex ])[Au(CN)(Na 2
through the interaction with adsorbed
2Au(CN) on
carbon surface according to the ion pair mechanism (Section 4.2.1). Understanding
these interactions will enhance the suggestion of a suitable elution mechanism.
Stellenbosch University https://scholar.sun.ac.za

Page 58
In addition, from the first case (dissociation of chemical compounds), depending on
the pH of the medium, CN can either form HCN or exist as CN (Figure 2.11). The
presence of OH and the stability of CN were confirmed with the measured pH of
the solution within the range of 11 and 12.9 throughout the whole experiment. CN
becomes more stable when pH > pKa of HCN. This is in agreement with the work of
Van der Merwe (1992) where it was stated that the OH ion stabilises the CN to
prevent evolution of HCN. Although all experiments were conducted in alkaline
medium (pH≥11). However, it was observed that HCN gas was evolved at 25oC
which fluctuated between 0.1 and 0.6 mg/L as seen in the Drägger HCN gas
detector for about a minute. The set of combinations of parameters where this
observation occurred were repeated to confirm the evolution of HCN gas. However,
observations of the exact concentration of the HCN gas evolved were inconsistent
after three repetitions and the HCN gas was considered to be insignificant.
The high amount of Na+ (>16000 mg/L) present after pre-treatment can be attributed
to the contributions from NaOH and NaCN. Further investigation of the effect of Na+
on the adsorption with carbon surface and
2Au(CN) showed that the majority of Na+
that adsorbed on the carbon surface loaded with
2Au(CN) were strongly bonded
through ion-pair mechanism (Section 2.4.4). This was confirmed with two sets of pre-
treatment experiments. In the first set, the pre-treated Au loaded AC at 80oC, 30 min
and 0 rev/min was rinsed with 300 mL of RO water at 25oC to wash off the excess
Na+ on the carbon surface before elution while the other set was eluted immediately
after pre-treatment. The result of the two cases, as shown in Figure 4.2, suggested
that the Au elution peak was attained after the elution of the majority of Na+.
Stellenbosch University https://scholar.sun.ac.za
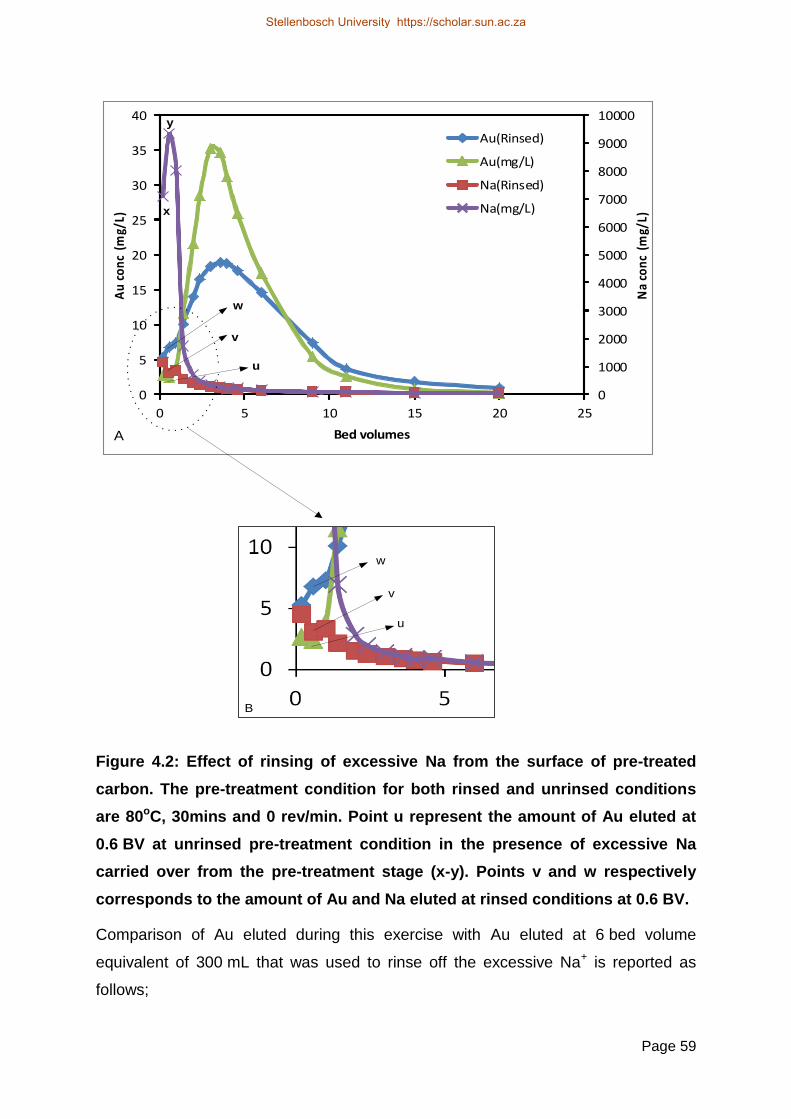
Page 59
0
1000
2000
3000
4000
5000
6000
7000
8000
9000
10000
0
5
10
15
20
25
30
35
40
0 5 10 15 20 25
Na
con
c (m
g/L)
Au
co
nc
(mg/
L)
Bed volumes
Au(Rinsed)
Au(mg/L)
Na(Rinsed)
Na(mg/L)
A
u
v
w
u
v
w
B
x
y
Figure 4.2: Effect of rinsing of excessive Na from the surface of pre-treated
carbon. The pre-treatment condition for both rinsed and unrinsed conditions
are 80oC, 30mins and 0 rev/min. Point u represent the amount of Au eluted at
0.6 BV at unrinsed pre-treatment condition in the presence of excessive Na
carried over from the pre-treatment stage (x-y). Points v and w respectively
corresponds to the amount of Au and Na eluted at rinsed conditions at 0.6 BV.
Comparison of Au eluted during this exercise with Au eluted at 6 bed volume
equivalent of 300 mL that was used to rinse off the excessive Na+ is reported as
follows;
Stellenbosch University https://scholar.sun.ac.za

Page 60
In the rinsed solution (6 bed volume), the amount of Au present in the solution was
about 0.1%. At 6 bed volumes of the rinsed and unrinsed elution recovery, amount of
Au was about 50 and 70% respectively as shown in Figure 4.3. These results
correspond to the observed depletion of Na+ in both cases as shown in Figure 4.2.
Figure 4.3: Effect of rinsing of excessive free cyanide from the surface of
pretreated carbon Pre-treatment condition for both rinsed and unrinsed
conditions are 80oC, 30mins and 0rev/min.
This explanation can be supported by the work of Van der Merwe (1994) stating that
Au elution is strongly dependent on cation removal. From Figure 4.2 , the effect of
excessive sodium carried over from the pre-treatment stage to elution stage was
seen to suppress Au elution recovery. This is seen with about 10000 mg/L Na at
point y and eluted Au of about 1.6 mg/L (point u) at unrinsed pre-treatment condition.
When this is compared with the rinsed condition of excessive Na at the same point of
evaluation, It was seen that Au eluted (point w) was high (approximately 7 mg/L) at
an approximate concentration of 800 mg/L Na (point v).
Another noticeable observation that can be seen in Figure 4.2 is the discrepancy in
the Au elution curves of the rinsed and unrinsed conditions. This discrepancy of the
amount of Au eluted in mg was done by calculating the difference in the amount of
Au eluted for the two elution recovery curves.
0
10
20
30
40
50
60
70
80
90
100
0 5 10 15 20 25
% R
ecovery
Bed Volumes
Not Pre-treated
Pre-treated
Pre-treated and rinsed
Stellenbosch University https://scholar.sun.ac.za

Page 61
Calculated difference of about 77 mg of Au implies that it remained uneluted on the
activated carbon. Possible reasons for this retained Au on carbon can be suggested
to be confined into two factors which are the deficit of Na and reduction to AuCN
according to Equation 4.1 (Section 2.5)
Au(CN)2
-+ H
+ → AuCN + HCN 4.1
From these two suggestions, reduction process (Equation 4.1) seems to be a more
reasonable explanation due to the drop in pH from 12 to around 8.5 during the
rinsing process. In addition the measured HCN gas with the HCN gas detector that
remained stable between 0.6-0.8 mg/L suggested that Equation 4.1 occurred. Under
severe acidic condition of about 4, greater occurrence of Equation 4.1 would be
expected (Adams, 1990c). This implies that some Au may remain strongly adsorbed
as AuCN (Van Deventer and Van der Merwe, 1993; Davidson and Schmidt, 1986)
which accounts for the residual Au remained on activated carbon in a rinsed pre-
treatment condition.
4.4 Cyanide loss during pre-treatment condition
Little is known about the loss of CN during pre-treatment of Au. This study will help
to better understand the mechanism of CN depletion from solution. In this study,
similar approach adopted by Nafaâ and Lotfi (2002) and Adams (1990) in the kinetic
and equilibrium study of CIL and water containing cyanide was adopted. The
concentration of CN in solution was measured at 15 min interval for a pre-treatment
time of 60 min. This was carried out for NaOH-NaCN solution in the absence of
activated carbon, in the presence of unloaded activated carbon (UAC) and carbon
loaded with Au (AC-Au). For cases involving activated carbon, 12 g of activated
carbon was used and 3% NaCN and 1% NaOH by volume of 80 mL of water as
earlier adopted for the elution experiment were used in all cases.
A comparison plot of CN concentration against four consecutive contact times at
25oC, 53oC and 80oC in the absence, presence of UAC and AC-Au is shown in
Figures 4.4–4.6.
Stellenbosch University https://scholar.sun.ac.za
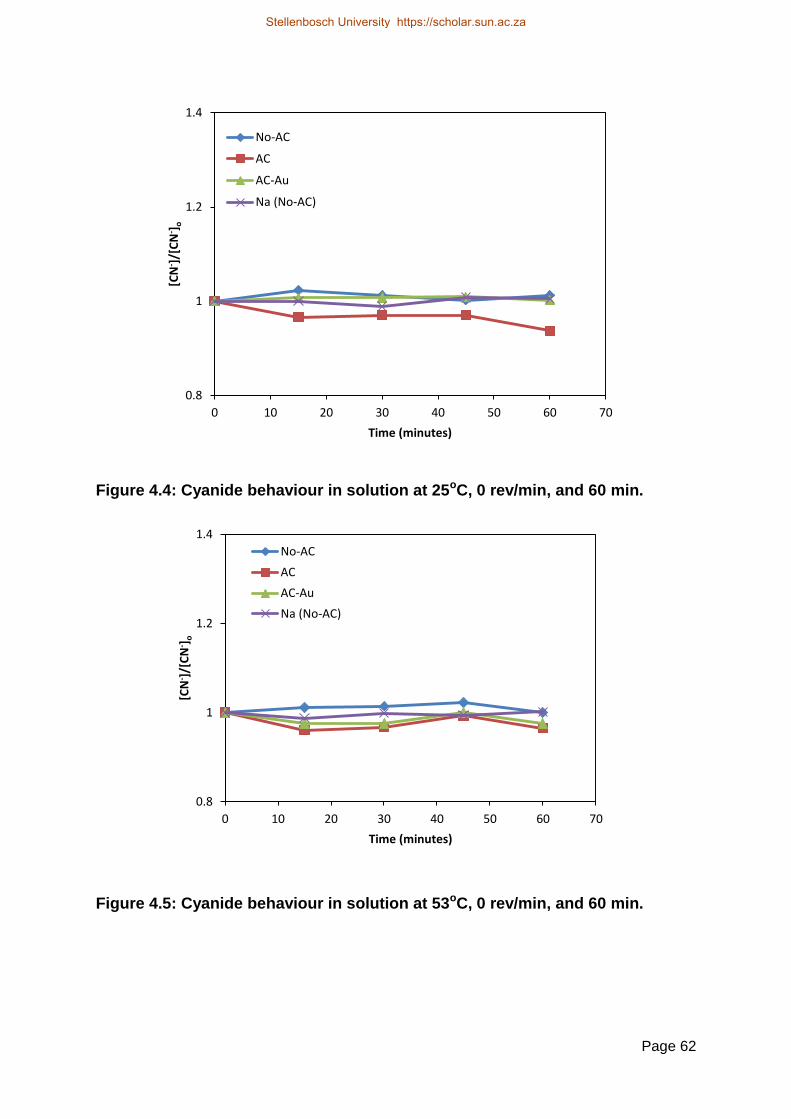
Page 62
Figure 4.4: Cyanide behaviour in solution at 25oC, 0 rev/min, and 60 min.
Figure 4.5: Cyanide behaviour in solution at 53oC, 0 rev/min, and 60 min.
0.8
1
1.2
1.4
0 10 20 30 40 50 60 70
[CN
- ]/[
CN
- ]o
Time (minutes)
No-AC
AC
AC-Au
Na (No-AC)
0.8
1
1.2
1.4
0 10 20 30 40 50 60 70
[CN
- ]/[
CN
- ]o
Time (minutes)
No-AC
AC
AC-Au
Na (No-AC)
Stellenbosch University https://scholar.sun.ac.za
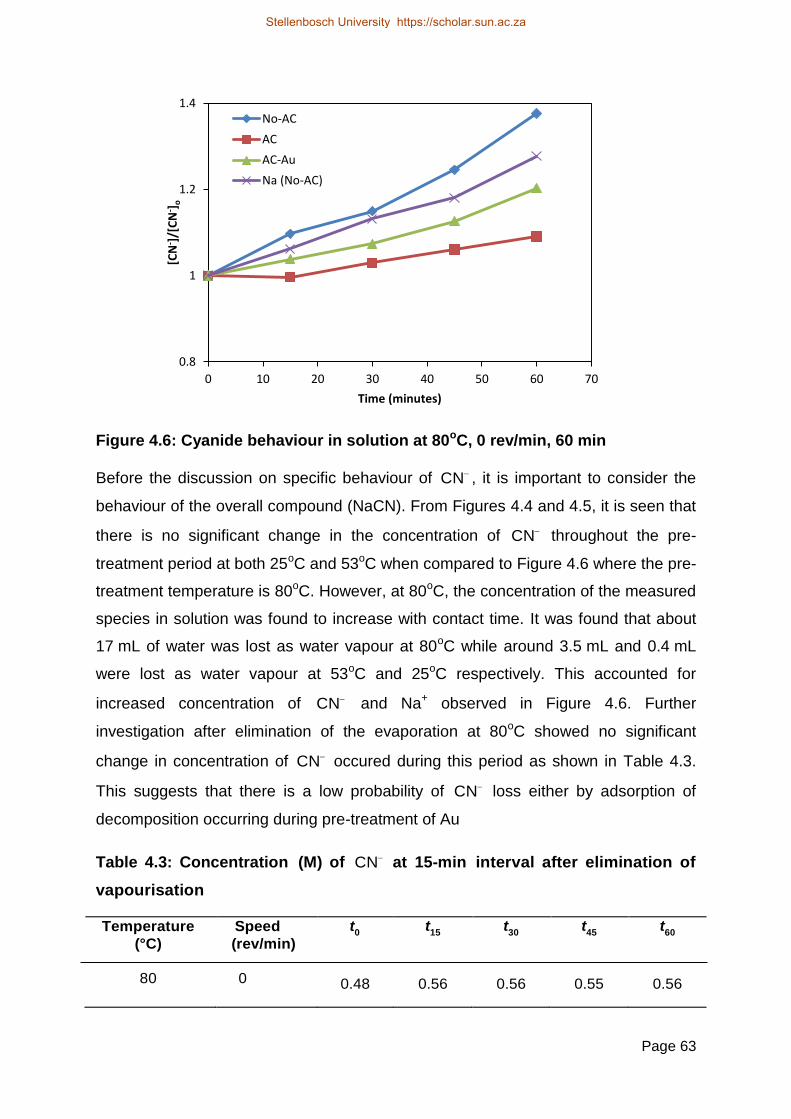
Page 63
Figure 4.6: Cyanide behaviour in solution at 80oC, 0 rev/min, 60 min
Before the discussion on specific behaviour of CN , it is important to consider the
behaviour of the overall compound (NaCN). From Figures 4.4 and 4.5, it is seen that
there is no significant change in the concentration of CN throughout the pre-
treatment period at both 25oC and 53oC when compared to Figure 4.6 where the pre-
treatment temperature is 80oC. However, at 80oC, the concentration of the measured
species in solution was found to increase with contact time. It was found that about
17 mL of water was lost as water vapour at 80oC while around 3.5 mL and 0.4 mL
were lost as water vapour at 53oC and 25oC respectively. This accounted for
increased concentration of CN and Na+ observed in Figure 4.6. Further
investigation after elimination of the evaporation at 80oC showed no significant
change in concentration of CN occured during this period as shown in Table 4.3.
This suggests that there is a low probability of CN loss either by adsorption of
decomposition occurring during pre-treatment of Au
Table 4.3: Concentration (M) of CN at 15-min interval after elimination of
vapourisation
Temperature
(°C)
Speed
(rev/min)
t0 t
15 t30 t
45 t60
80 0 0.48 0.56 0.56 0.55 0.56
0.8
1
1.2
1.4
0 10 20 30 40 50 60 70
[CN
- ]/[
CN
- ]o
Time (minutes)
No-AC
AC
AC-Au
Na (No-AC)
Stellenbosch University https://scholar.sun.ac.za

Page 64
Eh-ph of the system
In a quest to further gain more insight into the behaviour of cyanide during the pre-
treatment process, the phase stability (Eh–pH) of CN–H2O system was investigated.
This is a useful tool for predicting dominant specie (stable or meta-stable) in a region
at equilibrium (Free, 2013). Figure 4.7 shows the Eh–pH diagram of CN–H2O
combined for temperatures at 25oC, 53oC and 80oC for ease of comparison with the
aid of HSC chemistry 7.31 software. From Figure 4.7, there is no significant change
in the equilibrium lines between species at HCNO/HCN, HCN/OCN, HCNO/OCN and
CN/OCN species except between CN and HCN species at the selected
temperatures (25oC, 53oC and 80oC). The equilibrium lines between CN and HCN
for all temperatures varied between pH of 8 and 9.5. However, the measured pH in
the present study prepared at 3% NaOH-NaCN solution was around 12.5. The range
of pH maintained, suggests that CN present in this pH region can either exist in the
form of OCN- or CN depending on the potential of the solution. Bard et al. (1985)
reported that CN in alkaline medium moderately oxidises to cyanate (OCN- or
CNO ) and cyanogen gas given by Equations 4.2 and 4.3 respectively.
2OH-+ CN
- ⇌ CNO
-+H2O+ 2e
- E
o =-0.97v 4.2
2CN- ⇌ (CN)
2(g)+ 2e
- E
o= -0.182v 4.3
An increase in the concentration of CN with decreasing volume as earlier discussed
and Eh-pH diagram suggested that there is a lower chance of oxidation of CN to
CNO or probably insignificant if there is any. The measured Eh with an ORP
electrode dropped from about 0.03 v to around -0.2 v for the pre-treatment time. This
drop was observed to continue after the pre-treatment time which did not remain
stable at -0.2 v. This suggest that the stable values of the potential has not been
reached during this pre-treatment time and more drop in the potiential would be
expected to confirm a predominate phase of CN as shown in Figure 4.7 .These
evidences were used to suggest the possible reactions of cyanide in solution. Similar
trend was also noticed with the behaviour of sodium, which suggested dissociation of
NaCN to Na+ and CN significantly occurred and that little or no CN is being
oxidised to CNO .
Stellenbosch University https://scholar.sun.ac.za

Page 65
Figure 4.7: Combined Eh-pH diagram of CN-H2O at 25oC, 53oC and 80oC
14121086420
2.0
1.5
1.0
0.5
0.0
-0.5
-1.0
-1.5
-2.0
25
25
53
53
80
80
25
25
53
53
80
80 25
25
25
53
53
53
80
80
80
25
25
53
53
80
80
25
25
25
53
53
53
80
80
80
CN- H2O - System at 25.00, 53.00 and 80.00 C
C:\HSC7\EpH\CN25.iep pH
Eh (Volts)
H2O limits
CN(-a)HCN(a)
HCNO(a)
OCN(-a)
Stellenbosch University https://scholar.sun.ac.za
Stellenbosch University https://scholar.sun.ac.za
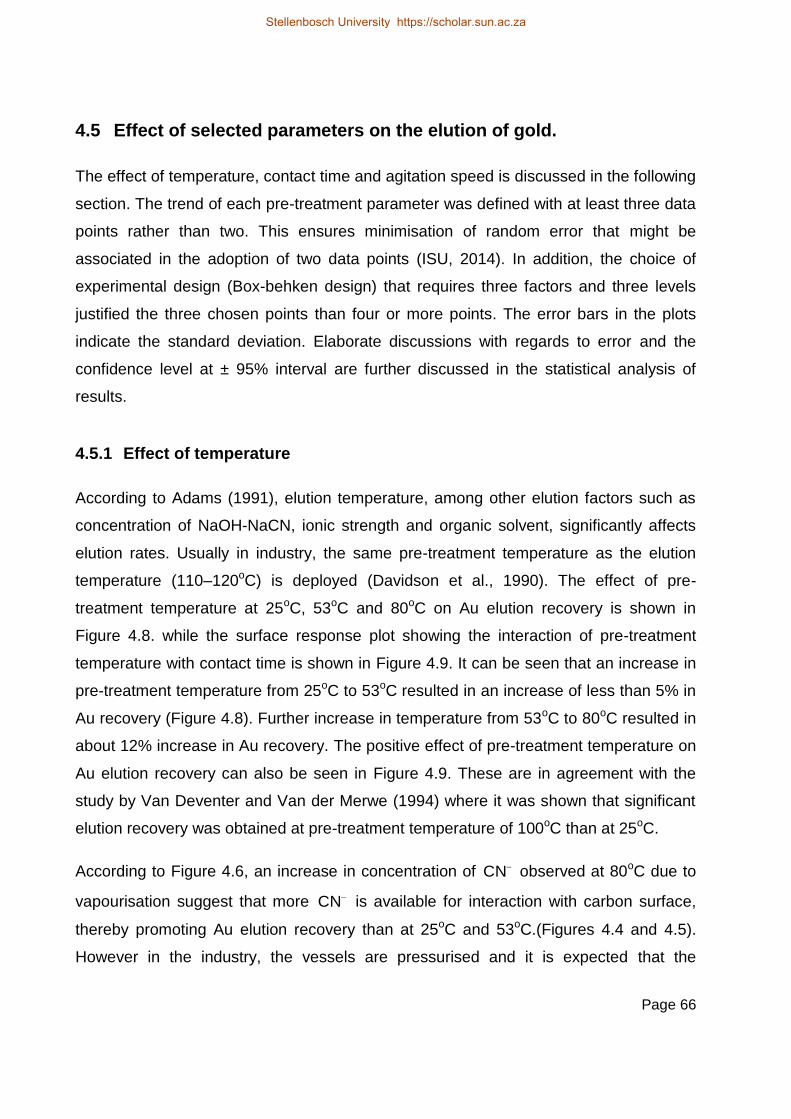
Page 66
4.5 Effect of selected parameters on the elution of gold.
The effect of temperature, contact time and agitation speed is discussed in the following
section. The trend of each pre-treatment parameter was defined with at least three data
points rather than two. This ensures minimisation of random error that might be
associated in the adoption of two data points (ISU, 2014). In addition, the choice of
experimental design (Box-behken design) that requires three factors and three levels
justified the three chosen points than four or more points. The error bars in the plots
indicate the standard deviation. Elaborate discussions with regards to error and the
confidence level at ± 95% interval are further discussed in the statistical analysis of
results.
4.5.1 Effect of temperature
According to Adams (1991), elution temperature, among other elution factors such as
concentration of NaOH-NaCN, ionic strength and organic solvent, significantly affects
elution rates. Usually in industry, the same pre-treatment temperature as the elution
temperature (110–120oC) is deployed (Davidson et al., 1990). The effect of pre-
treatment temperature at 25oC, 53oC and 80oC on Au elution recovery is shown in
Figure 4.8. while the surface response plot showing the interaction of pre-treatment
temperature with contact time is shown in Figure 4.9. It can be seen that an increase in
pre-treatment temperature from 25oC to 53oC resulted in an increase of less than 5% in
Au recovery (Figure 4.8). Further increase in temperature from 53oC to 80oC resulted in
about 12% increase in Au recovery. The positive effect of pre-treatment temperature on
Au elution recovery can also be seen in Figure 4.9. These are in agreement with the
study by Van Deventer and Van der Merwe (1994) where it was shown that significant
elution recovery was obtained at pre-treatment temperature of 100oC than at 25oC.
According to Figure 4.6, an increase in concentration of CN observed at 80oC due to
vapourisation suggest that more CN is available for interaction with carbon surface,
thereby promoting Au elution recovery than at 25oC and 53oC.(Figures 4.4 and 4.5).
However in the industry, the vessels are pressurised and it is expected that the
Stellenbosch University https://scholar.sun.ac.za
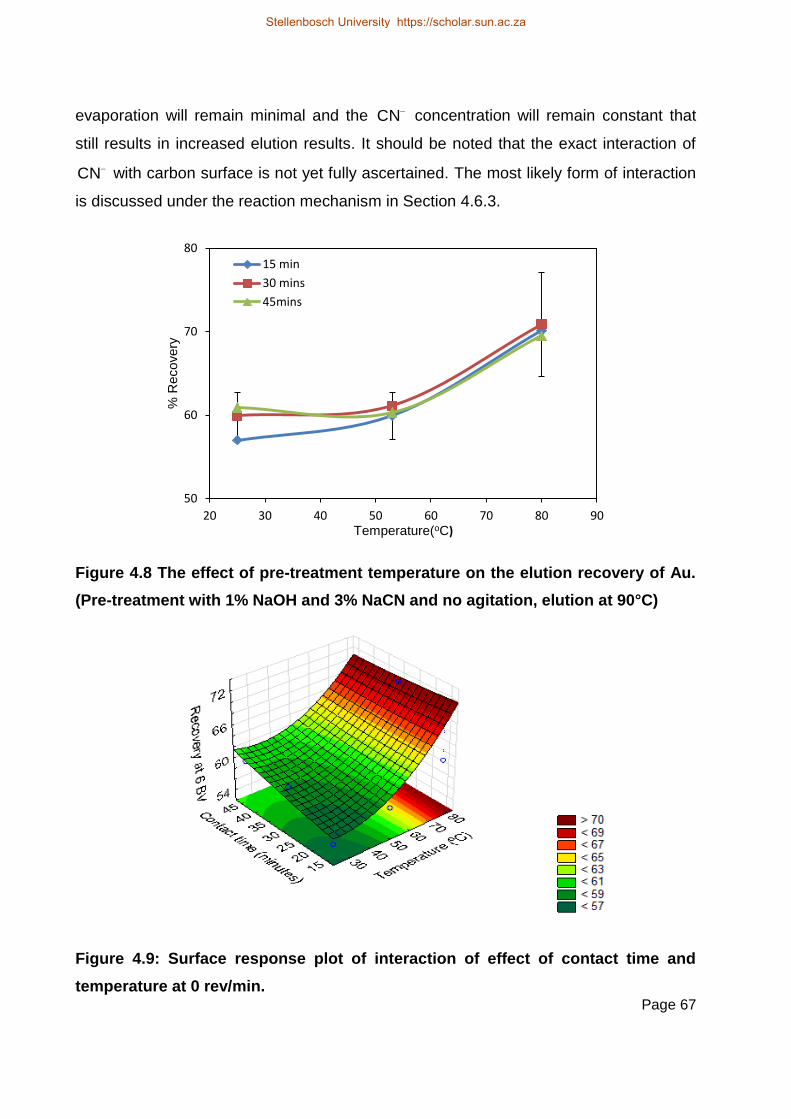
Page 67
evaporation will remain minimal and the CN concentration will remain constant that
still results in increased elution results. It should be noted that the exact interaction of
CN with carbon surface is not yet fully ascertained. The most likely form of interaction
is discussed under the reaction mechanism in Section 4.6.3.
Figure 4.8 The effect of pre-treatment temperature on the elution recovery of Au.
(Pre-treatment with 1% NaOH and 3% NaCN and no agitation, elution at 90°C)
Figure 4.9: Surface response plot of interaction of effect of contact time and
temperature at 0 rev/min.
50
60
70
80
20 30 40 50 60 70 80 90
% R
ecovery
Temperature(oC)
15 min
30 mins
45mins
Stellenbosch University https://scholar.sun.ac.za
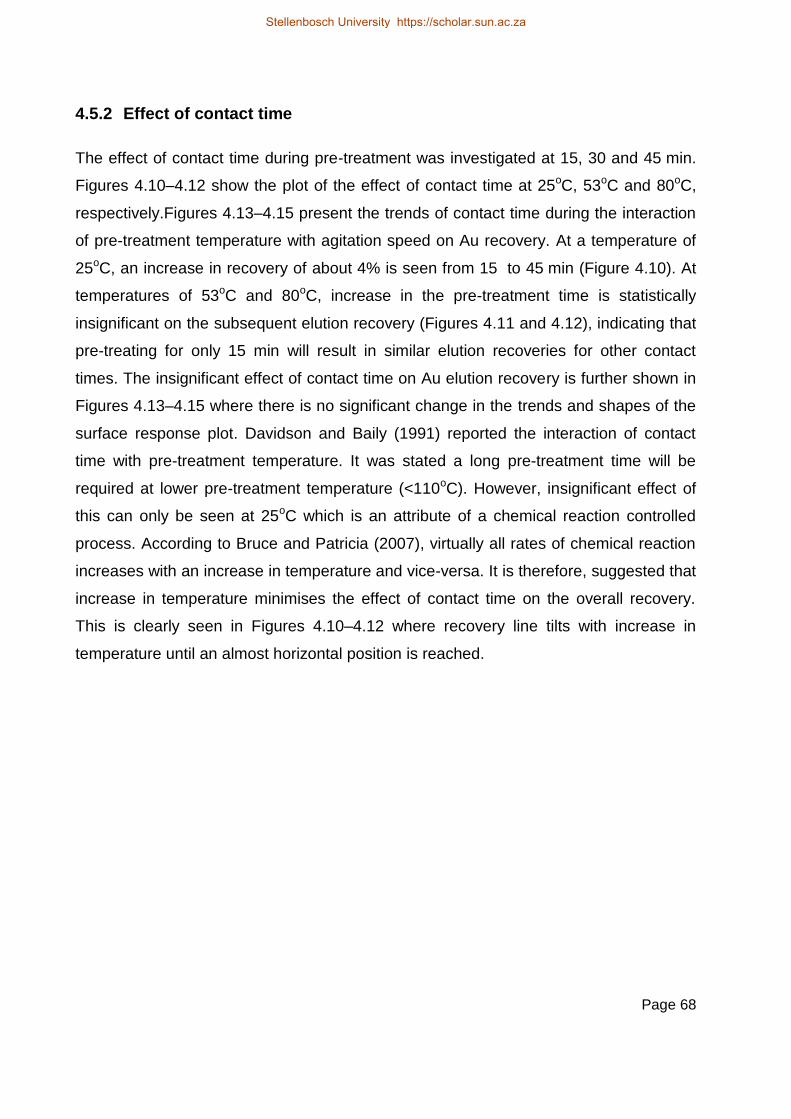
Page 68
4.5.2 Effect of contact time
The effect of contact time during pre-treatment was investigated at 15, 30 and 45 min.
Figures 4.10–4.12 show the plot of the effect of contact time at 25oC, 53oC and 80oC,
respectively.Figures 4.13–4.15 present the trends of contact time during the interaction
of pre-treatment temperature with agitation speed on Au recovery. At a temperature of
25oC, an increase in recovery of about 4% is seen from 15 to 45 min (Figure 4.10). At
temperatures of 53oC and 80oC, increase in the pre-treatment time is statistically
insignificant on the subsequent elution recovery (Figures 4.11 and 4.12), indicating that
pre-treating for only 15 min will result in similar elution recoveries for other contact
times. The insignificant effect of contact time on Au elution recovery is further shown in
Figures 4.13–4.15 where there is no significant change in the trends and shapes of the
surface response plot. Davidson and Baily (1991) reported the interaction of contact
time with pre-treatment temperature. It was stated a long pre-treatment time will be
required at lower pre-treatment temperature (<110oC). However, insignificant effect of
this can only be seen at 25oC which is an attribute of a chemical reaction controlled
process. According to Bruce and Patricia (2007), virtually all rates of chemical reaction
increases with an increase in temperature and vice-versa. It is therefore, suggested that
increase in temperature minimises the effect of contact time on the overall recovery.
This is clearly seen in Figures 4.10–4.12 where recovery line tilts with increase in
temperature until an almost horizontal position is reached.
Stellenbosch University https://scholar.sun.ac.za
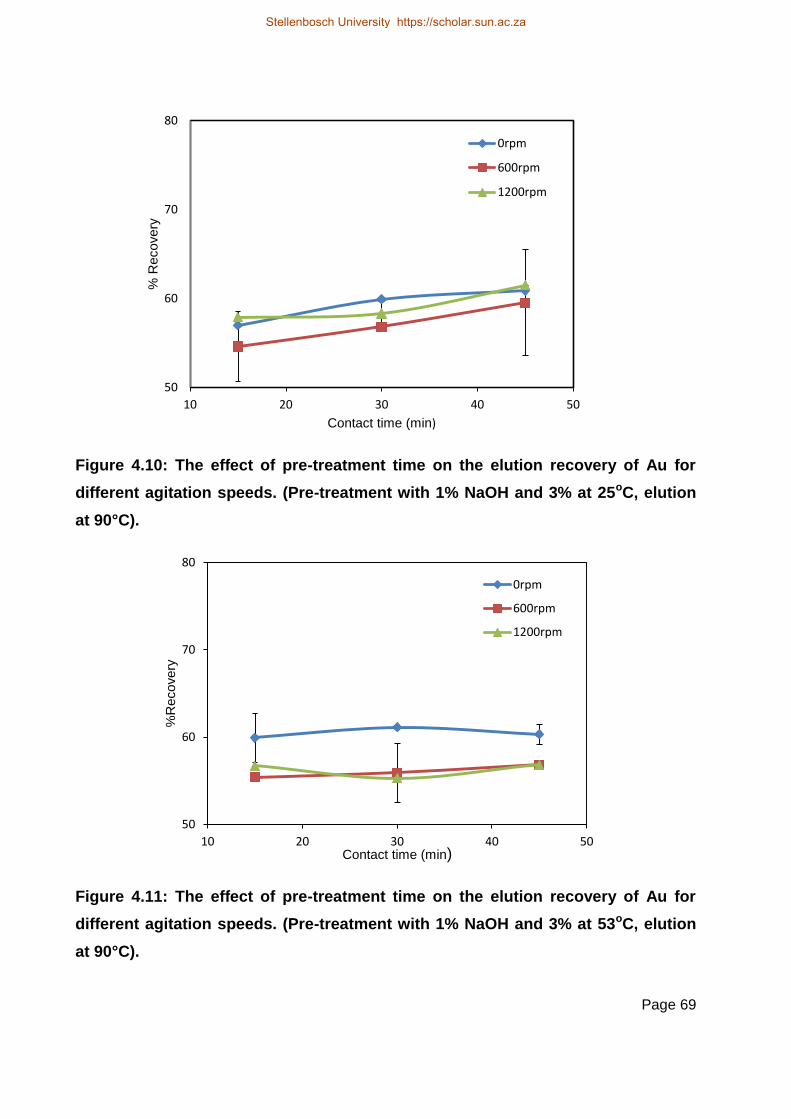
Page 69
Figure 4.10: The effect of pre-treatment time on the elution recovery of Au for
different agitation speeds. (Pre-treatment with 1% NaOH and 3% at 25oC, elution
at 90°C).
Figure 4.11: The effect of pre-treatment time on the elution recovery of Au for
different agitation speeds. (Pre-treatment with 1% NaOH and 3% at 53oC, elution
at 90°C).
50
60
70
80
10 20 30 40 50
% R
ecovery
Contact time (min)
0rpm
600rpm
1200rpm
50
60
70
80
10 20 30 40 50
%R
ecovery
Contact time (min)
0rpm
600rpm
1200rpm
Stellenbosch University https://scholar.sun.ac.za
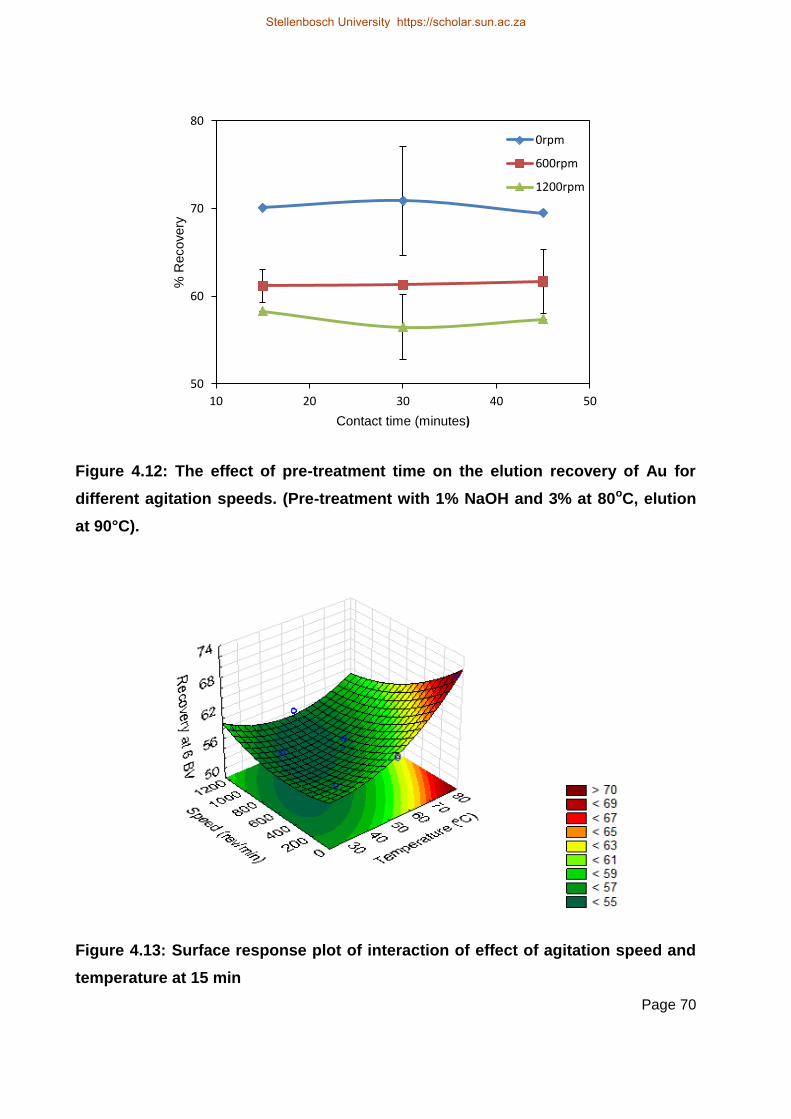
Page 70
Figure 4.12: The effect of pre-treatment time on the elution recovery of Au for
different agitation speeds. (Pre-treatment with 1% NaOH and 3% at 80oC, elution
at 90°C).
Figure 4.13: Surface response plot of interaction of effect of agitation speed and
temperature at 15 min
50
60
70
80
10 20 30 40 50
% R
ecovery
Contact time (minutes)
0rpm
600rpm
1200rpm
Stellenbosch University https://scholar.sun.ac.za

Page 71
Figure 4.14: Surface response plot of interaction of effect of agitation speed and
temperature at 30 min
Figure 4.15: Surface response plot of interaction of effect of agitation speed and
temperature at 45 min.
Stellenbosch University https://scholar.sun.ac.za

Page 72
4.5.3 Effect of agitation speed
The effects of agitation speed at 0, 600 and 1200 rev/min on Au recovery at different
temperatures are shown in Figures 4.16 –4.18. Increasing the agitation speed from 0 to
1200 rev/min at 25oC of pre-treatment temperature did not result in any significant
change in Au elution recovery as seen in Figure 4.16. At 53oC, the effect of agitation
speed becomes more visible towards a negative side with a decrease in Au elution
recovery (Figure 4.17). This is seen with about 6% decrease in elution recovery from 0
to 1200 rev/min. This effect becomes more severe at a higher temperature (80oC) with
approximately 10% decrease from 0 to 600 rev/min and additional 7% decrease in Au
elution recovery from 600 to 1200 rev/min as shown in Figure 4.18. Likewise the
opposing effect of increasing agitation speed on Au elution recovery is also seen with
lowering the surface plot especially around the region of high temperature as shown in
Figures 4.19–4.21
Figure 4.16: The effect of pre-treatment agitation on the elution recovery of Au.
(Pre-treatment with 1% NaOH and 3% NaCN at 25°C, elution at 90°C)
50
55
60
65
70
75
80
0 300 600 900 1200
% R
ecovery
Agitation speed(rev/min)
15 min
30 min
45 min
Stellenbosch University https://scholar.sun.ac.za
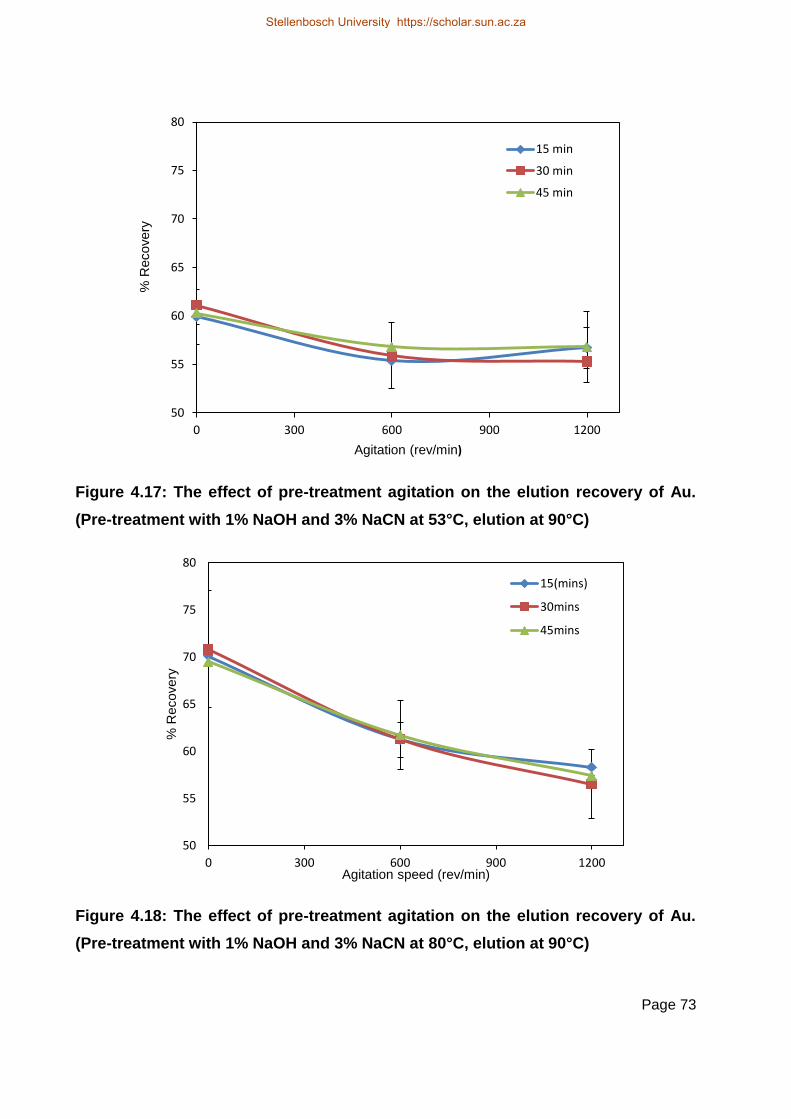
Page 73
Figure 4.17: The effect of pre-treatment agitation on the elution recovery of Au.
(Pre-treatment with 1% NaOH and 3% NaCN at 53°C, elution at 90°C)
Figure 4.18: The effect of pre-treatment agitation on the elution recovery of Au.
(Pre-treatment with 1% NaOH and 3% NaCN at 80°C, elution at 90°C)
50
55
60
65
70
75
80
0 300 600 900 1200
% R
ecovery
Agitation (rev/min)
15 min
30 min
45 min
50
55
60
65
70
75
80
0 300 600 900 1200
% R
ecovery
Agitation speed (rev/min)
15(mins)
30mins
45mins
Stellenbosch University https://scholar.sun.ac.za
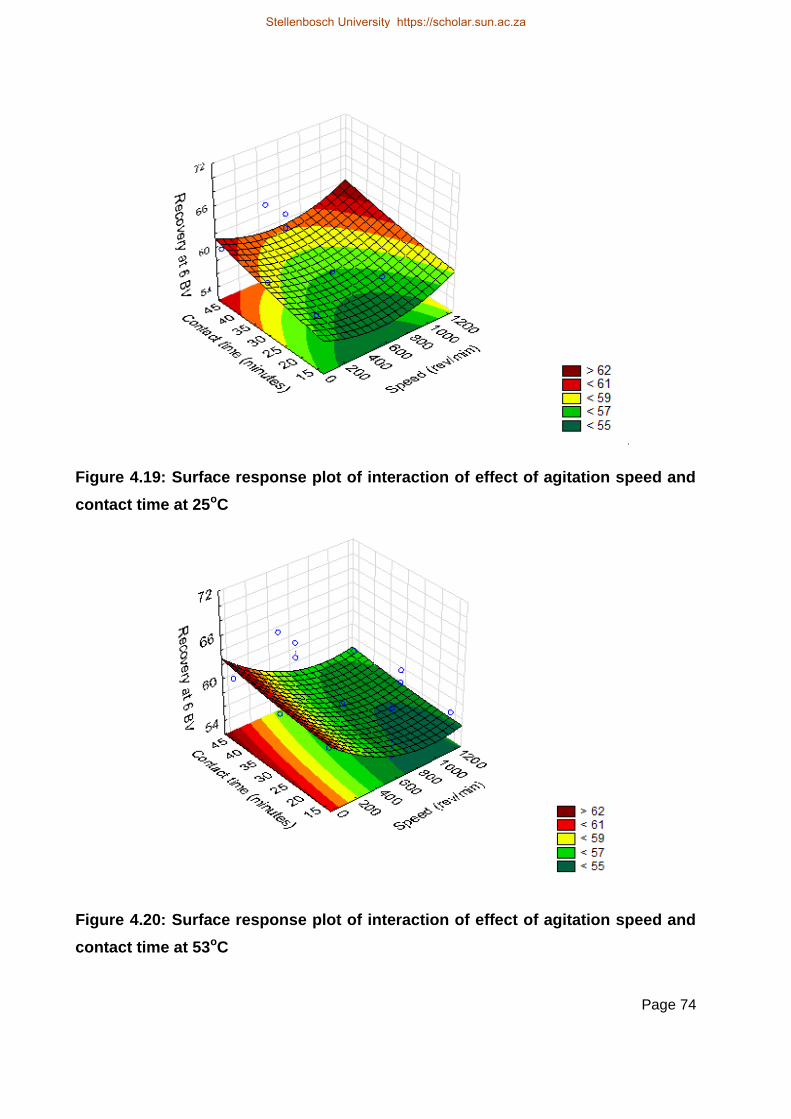
Page 74
Figure 4.19: Surface response plot of interaction of effect of agitation speed and
contact time at 25oC
Figure 4.20: Surface response plot of interaction of effect of agitation speed and
contact time at 53oC
Stellenbosch University https://scholar.sun.ac.za
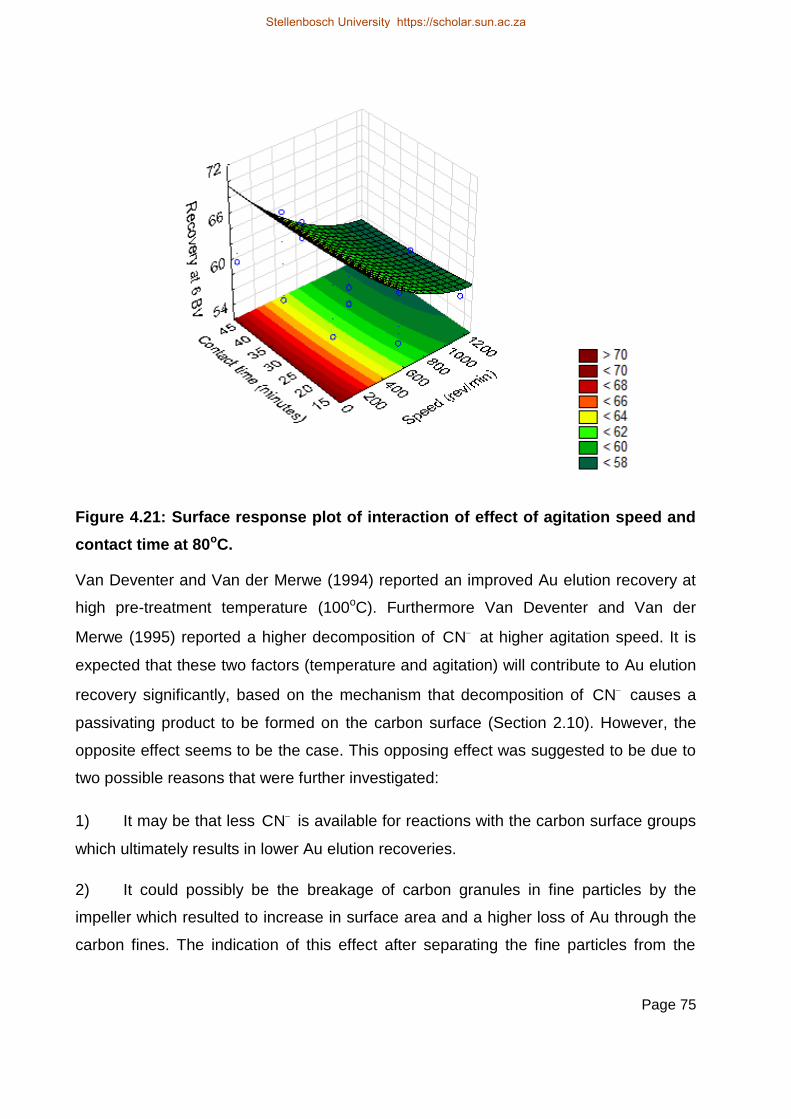
Page 75
Figure 4.21: Surface response plot of interaction of effect of agitation speed and
contact time at 80oC.
Van Deventer and Van der Merwe (1994) reported an improved Au elution recovery at
high pre-treatment temperature (100oC). Furthermore Van Deventer and Van der
Merwe (1995) reported a higher decomposition of CN at higher agitation speed. It is
expected that these two factors (temperature and agitation) will contribute to Au elution
recovery significantly, based on the mechanism that decomposition of CN causes a
passivating product to be formed on the carbon surface (Section 2.10). However, the
opposite effect seems to be the case. This opposing effect was suggested to be due to
two possible reasons that were further investigated:
1) It may be that less CN is available for reactions with the carbon surface groups
which ultimately results in lower Au elution recoveries.
2) It could possibly be the breakage of carbon granules in fine particles by the
impeller which resulted to increase in surface area and a higher loss of Au through the
carbon fines. The indication of this effect after separating the fine particles from the
Stellenbosch University https://scholar.sun.ac.za
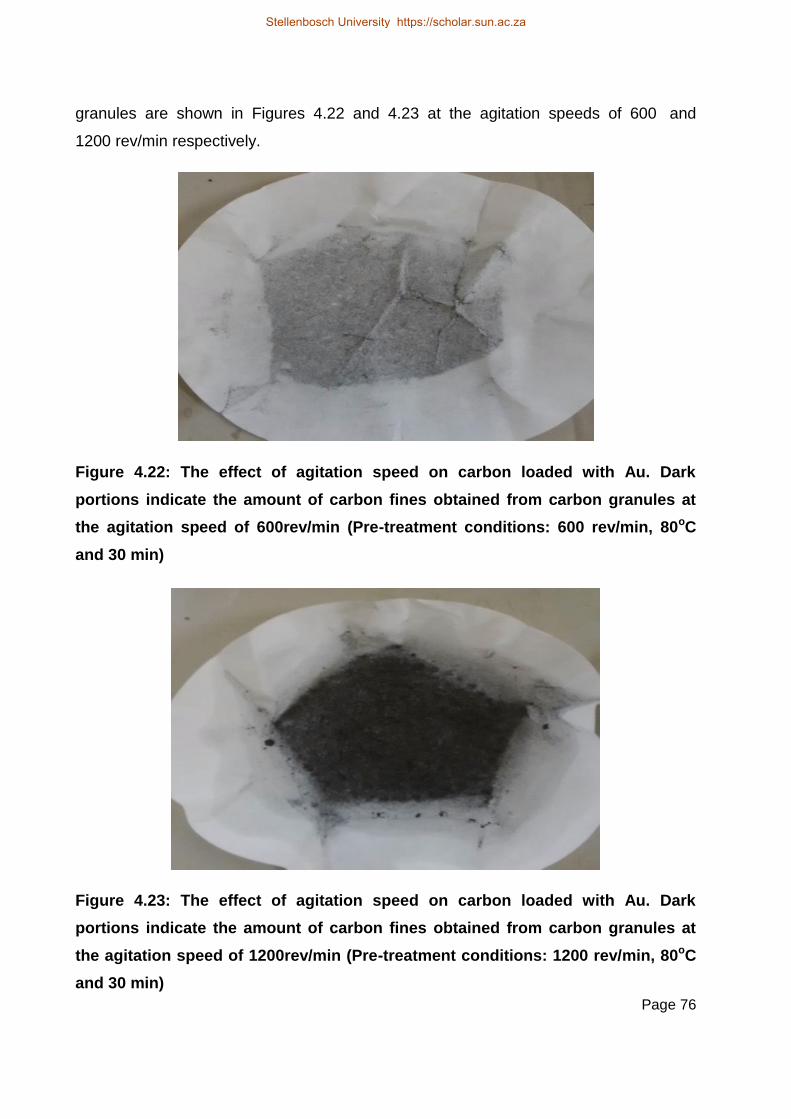
Page 76
granules are shown in Figures 4.22 and 4.23 at the agitation speeds of 600 and
1200 rev/min respectively.
Figure 4.22: The effect of agitation speed on carbon loaded with Au. Dark
portions indicate the amount of carbon fines obtained from carbon granules at
the agitation speed of 600rev/min (Pre-treatment conditions: 600 rev/min, 80oC
and 30 min)
Figure 4.23: The effect of agitation speed on carbon loaded with Au. Dark
portions indicate the amount of carbon fines obtained from carbon granules at
the agitation speed of 1200rev/min (Pre-treatment conditions: 1200 rev/min, 80oC
and 30 min)
Stellenbosch University https://scholar.sun.ac.za

Page 77
As shown in these two Figures, more carbon fines are obtained at 1200 rev/min than at
600 rev/min. The weights of these carbon fines and the Au loss that are possibly
associated with the carbon fines at different temperatures and agitation speed are
shown in Table 4.4. This is based on the assumption that the loading on each 12 g of
activated carbon pre-treated is uniformly loaded with of 0.38 mg/g. An upgrade ratio of
about 8 was estimated at 6BV. Upgrade ratio is ratio of the mass of Au in solution to the
mass of Au on activated carbon (Rogans and McArthur, 2002). The mass of Au
estimated with this upgrade ratio and the estimated gold loss after elution are shown in
Table 4.4.
Table 4.4: Effect of agitation speed at different temperatures on carbon fines
Temperature
oC
Agitation
speed
(rev/min)
carbon
fines (g)
Au (mg) on
AC
Au (mg) in
solution
Estimated loss
during elution
(%)
25 600 0.05 0.02 0.16 0.5
25 1200 0.16 0.06 0.48 1.4
80 600 0.03 0.01 0.08 0.2
80 1200 0.12 0.05 0.4 1.2
It is seen from Table 4.4 that the estimated percentage loss with carbon fines after
elution is insignificant when compared to the loss that was obtained during high
agitation speed as earlier discussed in section 4.5.3. This implies that a separate
mechanism is responsible for Au loss during agitation which is not well understood at
the moment.
A similar indication of carbon fines was also obtained at 600 and 1200 rev/min at 25oC.
However, no significant change in the Au elution recovery was seen with increase in
agitation speed (Figure 4.16). The exact reason for this behaviour is not fully known, but
it is suggested that at this operating temperature (25oC), less CN will be available for
interaction with the carbon surface than at 80oC (Figure 4.4 andFigure 4.6) while
agitation still play its “counter intuitive” role to increase surface area.
Stellenbosch University https://scholar.sun.ac.za

Page 78
Further proof to the opposing effect of agitation was further investigated by measuring
the concentration of CN during different pre-treatment conditions at 15 min interval.
These results are presented in Table 4.5. From these results, the evaporation was
eliminated and it can be seen that there is no significant change in concentration of
CN . The results obtained in Table 4.5 were further used to calculate the solid-liquid
mass transfer coefficient (kSL) of CN using the pre-treatment medium at different
agitation speeds using Equation 2.26. 60 min contact time was used to allow sufficient
data points.
[d(
C
Co)
dt ]= - kSLas 2.26
Table 4.5: Results of CN- (M) measured at different pre-treatment conditions at 15
min time intervals
Conditions Concentration (M) of CN- at 15 min time
interval
Temperature
(oC)
Speed
(rev/min)
t0 t15 t30 t45 t60
25 0 0.52 0.52 0.56 0.56 0.56
25 600 0.56 0.56 0.56 0.56 0.56
25 1200 0.56 0.56 0.56 0.52 0.56
53 0 0.55 0.55 0.56 0.56 0.56
53 600 0.52 0.56 0.52 0.55 0.56
53 1200 0.56 0.56 0.56 0.55 0.56
80 0 0.48 0.56 0.56 0.55 0.56
80 600 0.56 0.56 0.56 0.56 0.56
80 1200 0.60 0.56 0.52 0.56 0.56
The plot of the effects of increasing agitation speed on kSL is shown in Figure 4.24. It is
seen that there is no significant change in kSL from 0 to 1200 rev/min at different
temperatures. This result suggests that pre-treatment in the presence or absence of
agitation is less likely to be controlled by diffusion process than reaction mechanism.
Stellenbosch University https://scholar.sun.ac.za
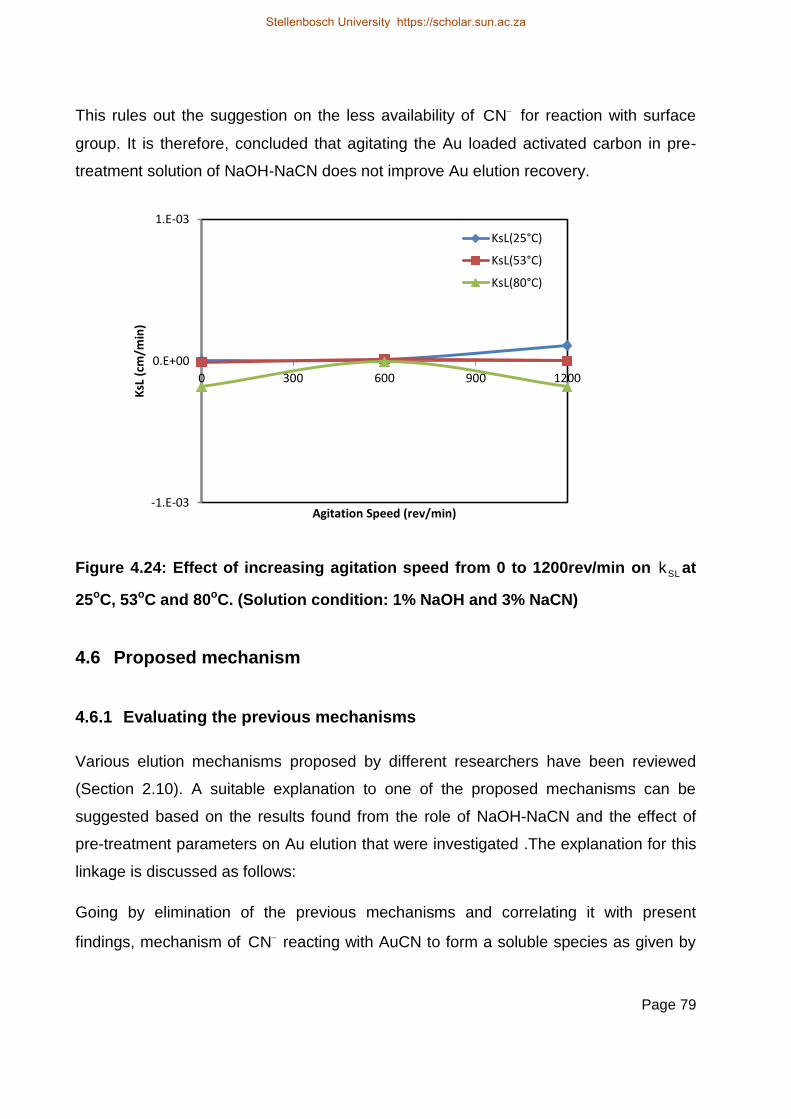
Page 79
This rules out the suggestion on the less availability of CN for reaction with surface
group. It is therefore, concluded that agitating the Au loaded activated carbon in pre-
treatment solution of NaOH-NaCN does not improve Au elution recovery.
Figure 4.24: Effect of increasing agitation speed from 0 to 1200rev/min on SLk at
25oC, 53oC and 80oC. (Solution condition: 1% NaOH and 3% NaCN)
4.6 Proposed mechanism
4.6.1 Evaluating the previous mechanisms
Various elution mechanisms proposed by different researchers have been reviewed
(Section 2.10). A suitable explanation to one of the proposed mechanisms can be
suggested based on the results found from the role of NaOH-NaCN and the effect of
pre-treatment parameters on Au elution that were investigated .The explanation for this
linkage is discussed as follows:
Going by elimination of the previous mechanisms and correlating it with present
findings, mechanism of CN reacting with AuCN to form a soluble species as given by
-1.E-03
0.E+00
1.E-03
0 300 600 900 1200
KsL
(cm
/min
)
Agitation Speed (rev/min)
KsL(25°C)
KsL(53°C)
KsL(80°C)
Stellenbosch University https://scholar.sun.ac.za
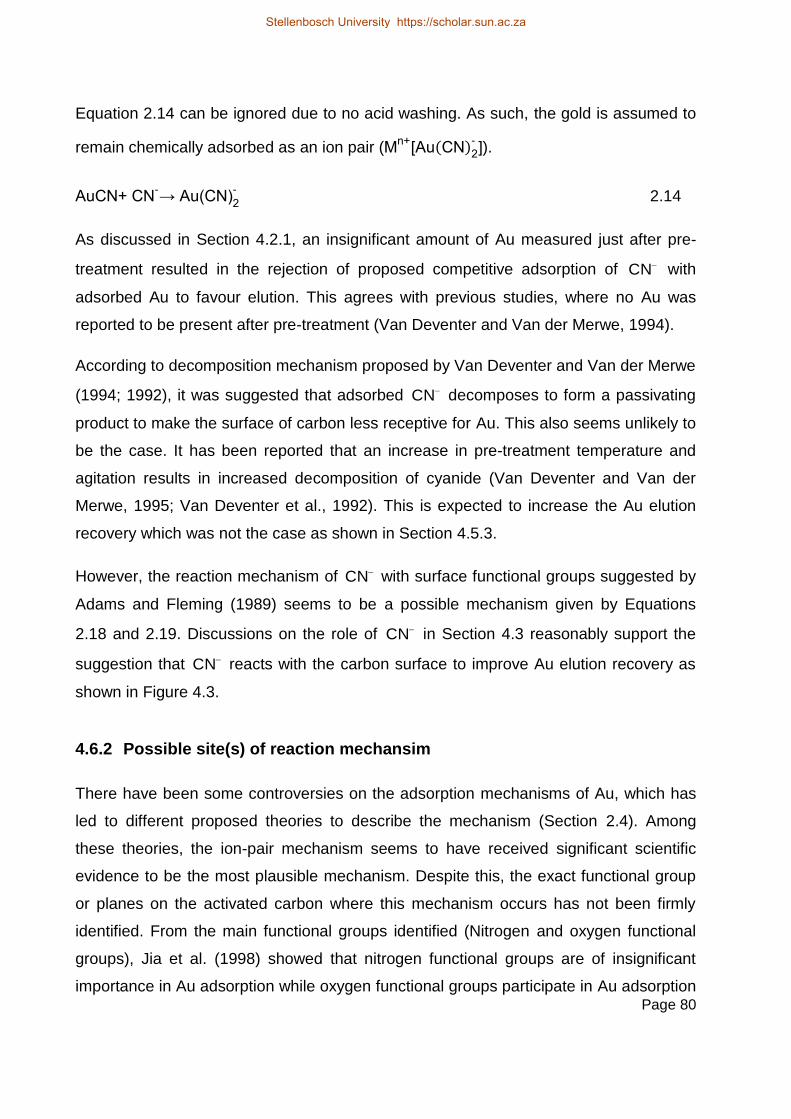
Page 80
Equation 2.14 can be ignored due to no acid washing. As such, the gold is assumed to
remain chemically adsorbed as an ion pair (Mn+
[Au(CN)2-]).
AuCN+ CN-→ Au(CN)
2
- 2.14
As discussed in Section 4.2.1, an insignificant amount of Au measured just after pre-
treatment resulted in the rejection of proposed competitive adsorption of CN with
adsorbed Au to favour elution. This agrees with previous studies, where no Au was
reported to be present after pre-treatment (Van Deventer and Van der Merwe, 1994).
According to decomposition mechanism proposed by Van Deventer and Van der Merwe
(1994; 1992), it was suggested that adsorbed CN decomposes to form a passivating
product to make the surface of carbon less receptive for Au. This also seems unlikely to
be the case. It has been reported that an increase in pre-treatment temperature and
agitation results in increased decomposition of cyanide (Van Deventer and Van der
Merwe, 1995; Van Deventer et al., 1992). This is expected to increase the Au elution
recovery which was not the case as shown in Section 4.5.3.
However, the reaction mechanism of CN with surface functional groups suggested by
Adams and Fleming (1989) seems to be a possible mechanism given by Equations
2.18 and 2.19. Discussions on the role of CN in Section 4.3 reasonably support the
suggestion that CN reacts with the carbon surface to improve Au elution recovery as
shown in Figure 4.3.
4.6.2 Possible site(s) of reaction mechansim
There have been some controversies on the adsorption mechanisms of Au, which has
led to different proposed theories to describe the mechanism (Section 2.4). Among
these theories, the ion-pair mechanism seems to have received significant scientific
evidence to be the most plausible mechanism. Despite this, the exact functional group
or planes on the activated carbon where this mechanism occurs has not been firmly
identified. From the main functional groups identified (Nitrogen and oxygen functional
groups), Jia et al. (1998) showed that nitrogen functional groups are of insignificant
importance in Au adsorption while oxygen functional groups participate in Au adsorption
Stellenbosch University https://scholar.sun.ac.za

Page 81
(Adams, 1989). From the list of oxygen functional group in Section 2.2.1, Adams (1991)
and Adams and Fleming (1989) suggested the possibility of CN reacting with ketones
and aldehyde functional groups given by Equations 2.18 and 2.19, respectively. CN
has been identified to be a strong nucleophile (Solomon, 1992). Aldehydes and ketone
readily go through nucleophilic attack due to the presence of the highly polar carbonyl
group (carbon-oxygen bond: Cδ+=Oδ–) (Brown, 2000-2014). According to McMurry
(1998), carbonyl groups which are one of important groups in organic chemistry are
broadly classified into aldehydes, ketones group, carboxylic acid and their derivative
group. It is not unlikely that carboxylic acid groups also undergo reaction with CN or
OH or both. However, the degree and hierarchy of these nucleophilic reactions was not
substantiated. These reaction mechanisms with regards to the carbonyl groups are
described in the next section.
4.6.3 Reaction mechanisms
In order to suggest a suitable elution mechanism regarding reaction with or modification
of the functional group by CN , it is important to understand the properties and
behaviour of the carbonyl functional group and the composition of the solvent. Going by
this theory and adopting the concept of nucleophilic reaction earlier described in
Section 2.11, the mechanism (Equations 2.18 and 2.19) suggested by Adams (1991)
are satisfied. In addition, by the adoption of the principle of the steps involved in
nucleophilic reaction, the suggested reaction steps for this mechanism as shown in
Equations 4.4–4.9 for both NaCN and NaOH are:
1) the nucleophiles (CN- and OH ) attacks the substrate at Cδ+= Oδ-
2) the substrate gives out one of the double bonds
Additional reactions with carboxylic acid that are being suggested as the elution
mechanisms are further elaborated and shown as follows:
Stellenbosch University https://scholar.sun.ac.za

Page 82
For aldehydes
With NaCN
CR H
Oδ–
δ+
+ Na+ + CN CR R
O-
CN 1
2
- Na+
4.4
With NaOH
CR H
Oδ–
δ+
+ Na+ + OH CR R
O-
OH1
2
- Na+
4.5
For Ketones
With NaCN
CR R
Oδ–
δ+
+ Na+ + CN CR R
O-
CN 1
2
- Na+
4.6
With NaOH
CR R
Oδ–
δ+
+ Na+ + OH CR R
O-
OH1
2
- Na+
4.7
Stellenbosch University https://scholar.sun.ac.za
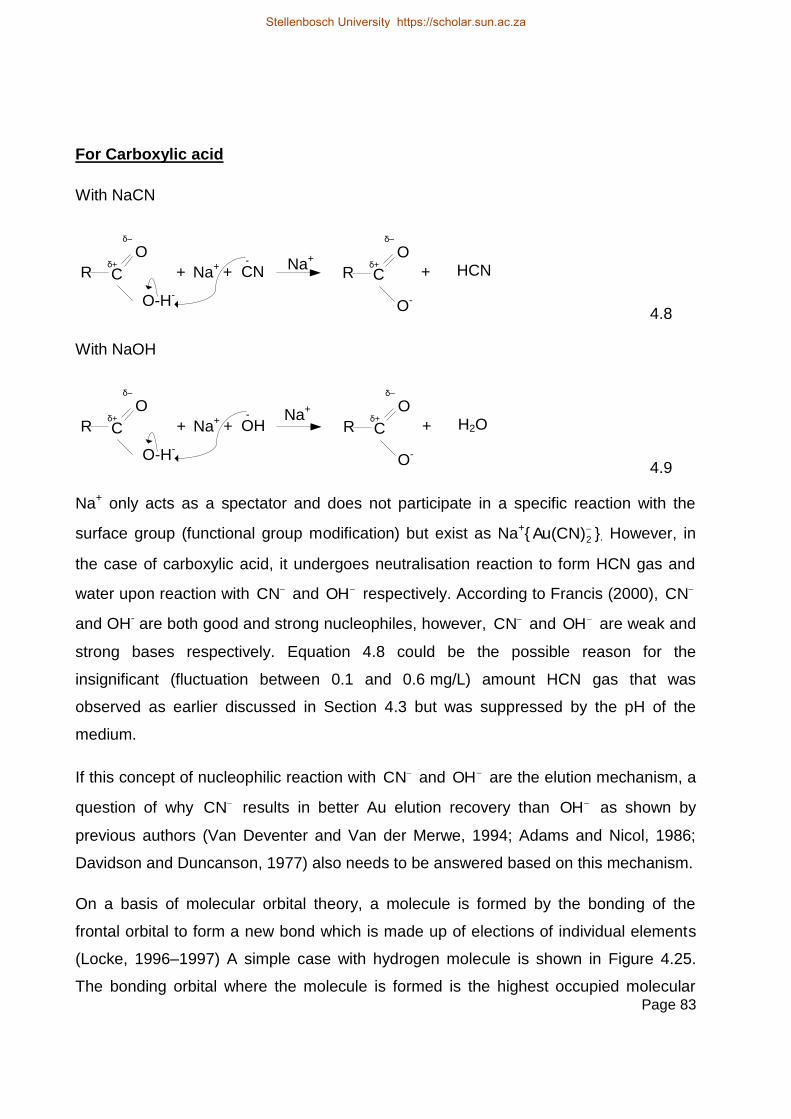
Page 83
For Carboxylic acid
With NaCN
CR
Oδ–
δ+
+ Na+ + CN
O-H-
CR
Oδ–
δ++ HCN
O-
Na+ -
4.8
With NaOH
CR
Oδ–
δ+
+ Na+ + OH
O-H-
CR
Oδ–
δ++ H2O
O-
Na+ -
4.9
Na+ only acts as a spectator and does not participate in a specific reaction with the
surface group (functional group modification) but exist as Na+{
2Au(CN) }. However, in
the case of carboxylic acid, it undergoes neutralisation reaction to form HCN gas and
water upon reaction with CN and OH respectively. According to Francis (2000), CN
and OH- are both good and strong nucleophiles, however, CN and OH are weak and
strong bases respectively. Equation 4.8 could be the possible reason for the
insignificant (fluctuation between 0.1 and 0.6 mg/L) amount HCN gas that was
observed as earlier discussed in Section 4.3 but was suppressed by the pH of the
medium.
If this concept of nucleophilic reaction with CN and OH are the elution mechanism, a
question of why CN results in better Au elution recovery than OH as shown by
previous authors (Van Deventer and Van der Merwe, 1994; Adams and Nicol, 1986;
Davidson and Duncanson, 1977) also needs to be answered based on this mechanism.
On a basis of molecular orbital theory, a molecule is formed by the bonding of the
frontal orbital to form a new bond which is made up of elections of individual elements
(Locke, 1996–1997) A simple case with hydrogen molecule is shown in Figure 4.25.
The bonding orbital where the molecule is formed is the highest occupied molecular
Stellenbosch University https://scholar.sun.ac.za

Page 84
orbital (HOMO) while the orbital where no bond is formed is the lowest unoccupied
molecular orbital (LUMO). The formation of the new bond results in reduction of the
energy level as shown in Figure 4.25.
Molecular Orbital
Atomic Orbital
Energy
1s1s
Atomic Orbital
LUMO
HOMO
σ*
σ
Figure 4.25: Molecular orbital diagram of hydrogen molecule. Redrawn from
Locke (1996–1997)
For ions or molecules formed from different atoms such as carbon monoxide, cyanide,
hydroxide, the energy level of the new bond varies depending on the number or
electrons in the outermost orbital that participate in the bonding (Locke, 1996–1997). In
case of OH and CN , the energy level of OH is lower than CN . CN and OH are
typical examples of species with HOMO, while the carbonyl groups which is an
electrophile represents LUMO species. Furthermore, according to Koopmans’s theory
(NIST, 2013a; Brown, 2000-2004), the ionisation energy of a molecule or atom can be
regarded as the HOMO energy. The ionisation energy of OH and CN is given as
13.017eV and ≈13.6 eV respectively (NIST, 2013b) This indicate that CN and OH
have different HOMO energy levels against a fixed LUMO energy level of the carbonyl
functional group. The difference in the ionisation energy (≈0.6) of these ions seems
insignificant compared to the significant Au elution recovery obtained in the presence of
CN than OH . The level of significance of this difference (≈0.6) that could have
considerably supported this suggestion was not reported in the publication (NIST,
2013b). However, it is suggested that higher ionisation energy of CN compared to
OH possibly accounts for the improved Au elution recovery. This illustration shown in
Stellenbosch University https://scholar.sun.ac.za

Page 85
Figure 4.26 suggests CN will react faster than OH due to this high HOMO energy
level in order to attain stability. Furthermore, Adams (1989) observed that when CN is
added to a NaOH solution, the uptake of Na ions by carbon increases.
CN-
OH-
HOMO Energy
level13.6eV
13eV
Carbonyl
group (LUMO)
Figure 4.26: Illustration of LUMO-HOMO interaction of carbonyl vs CN and OH
4.7 Industrial application
Further experimentation were conducted on Au loaded carbon supplied from Goldplat
Recovery (PTY) Limited in South Africa. This Au loaded activated carbon has gone
through an elution and regeneration step, but significant amounts of Au still remained
loaded on it.
Regeneration after elution aims to burn off organics and restore the activity of activated
carbon carried out in a steam atmosphere at a temperature below 750oC (Grimsley,
1991). Effect of such a high temperature on adsorbed Au suggests decomposition of
cyanide associated with Au. As a result of this, the Au present on the surface of the
carbon surface could be suggested to be present as solid gold [Au]s. According to
Vorobev-desyatovskii et al. (2010), at typical regeneration temperatures, thermal
decomposition to solid Au occurs on the carbon surface according to Equation 4.10.
2 Na[Au(CN)2]→2Aus+(CN)2+2NaCN 4.10
This was confirmed by the SEM analysis of the loaded carbon as shown in Figure 4.27
with the detection spectra shown in Figure 4.28. With this confirmed state of adsorbed
Au present on carbon surface, the reaction of CN together with the mechanism
Stellenbosch University https://scholar.sun.ac.za

Page 86
proposed by Adams (1991) and the ones suggested in this present study, becomes
more important for effective elution to take place. This is being suggested to likely take
place according to Equation 2.8.
AuCN+ CN-→ Au(CN)
2
- 2.8
Figure 4.27: SEM analysis of Goldplat loaded carbon after regeneration in kiln.
Figure 4.28: Visual Spectra of Au detection on carbon surface
Stellenbosch University https://scholar.sun.ac.za
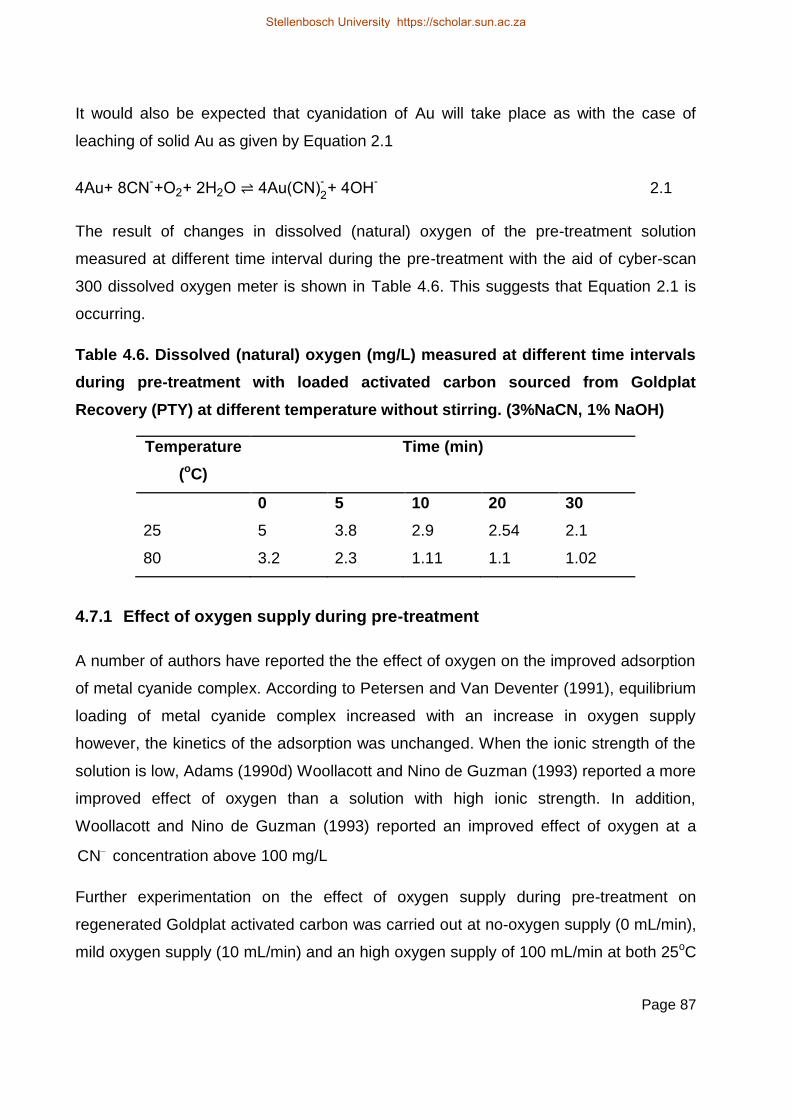
Page 87
It would also be expected that cyanidation of Au will take place as with the case of
leaching of solid Au as given by Equation 2.1
4Au+ 8CN-+O2+ 2H2O ⇌ 4Au(CN)
2
-+ 4OH
- 2.1
The result of changes in dissolved (natural) oxygen of the pre-treatment solution
measured at different time interval during the pre-treatment with the aid of cyber-scan
300 dissolved oxygen meter is shown in Table 4.6. This suggests that Equation 2.1 is
occurring.
Table 4.6. Dissolved (natural) oxygen (mg/L) measured at different time intervals
during pre-treatment with loaded activated carbon sourced from Goldplat
Recovery (PTY) at different temperature without stirring. (3%NaCN, 1% NaOH)
Temperature
(oC)
Time (min)
0 5 10 20 30
25 5 3.8 2.9 2.54 2.1
80 3.2 2.3 1.11 1.1 1.02
4.7.1 Effect of oxygen supply during pre-treatment
A number of authors have reported the the effect of oxygen on the improved adsorption
of metal cyanide complex. According to Petersen and Van Deventer (1991), equilibrium
loading of metal cyanide complex increased with an increase in oxygen supply
however, the kinetics of the adsorption was unchanged. When the ionic strength of the
solution is low, Adams (1990d) Woollacott and Nino de Guzman (1993) reported a more
improved effect of oxygen than a solution with high ionic strength. In addition,
Woollacott and Nino de Guzman (1993) reported an improved effect of oxygen at a
CN concentration above 100 mg/L
Further experimentation on the effect of oxygen supply during pre-treatment on
regenerated Goldplat activated carbon was carried out at no-oxygen supply (0 mL/min),
mild oxygen supply (10 mL/min) and an high oxygen supply of 100 mL/min at both 25oC
Stellenbosch University https://scholar.sun.ac.za

Page 88
and 80oC. The effect of this oxygen supply was observed on Au elution recovery as
shown in Table 4.7.
Table 4.7: Effect of oxygen supply during pre-treatment on elution at 6 BV.
Conditions 3% NaCN, 1% NaOH, no agitation, 30 min
Temperature (oC) Oxygen supply
(mL/min)
% Recovery
at 6bv
25 0 63.80
25 10 60.13
25 100 61.37
80 0 78.80
80 10 60.61
80 100 63.91
From the result shown in Table 4.7 it can be seen that oxygen supply into the pre-
treatment system does not improve the Au elution recovery at both 25oC and 80oC. This
is seen when comparing recovery at no-oxygen (0 mL/min) (≈64 and 80% at 25 and
80oC respectively) with about 60% and 62% at 10 mL/min and 100 mL/min oxygen
supply respectively. Reduced recovery with oxygen supply obtained in Table 4.7
suggest that it supports adsorption of some of metal-cyanide complex on carbon
surface as earlier discussed.
4.7.2 Effect of pre-treatment parameters on goldplat regenerated carbon
Table 4.8 shows the result of recovery of Au at 20 bed volumes of elution at the
selected conditions. The result agrees with findings in Section 4.5.3 regarding decrease
in recovery with increasing agitation speed at high temperature as previously shown in
Figure 4.18. However, contrary to the previous findings in Section 4.5.2, time also now
becomes a factor and when the pre-treatment time is increased from 15 to 45 min, a
significant improvement in recovery was obtained especially at the lower cyanide
concentration of 2% with about 15% increase in Au recovery both in the presence and
absence of agitation.
Stellenbosch University https://scholar.sun.ac.za

Page 89
Table 4.8: Elution recovery at 20 bed volumes, 80oC, different concentration of
cyanide, agitation speed and contact time.
Conditions at 80oC
NaCN conc. 0 rev/min,
15 mins
0 rev/min,
45 mins
1200 rev/min,
15 mins
1200 rev/min,
45 mins
2% 83 97.6 84.9 97.1
4% 92.5 93.1 84.1 95.9
6% 97.8 100 95.9 85.2
The results shown in Table 4.8 becomes increasingly important for industrial plants
where inefficient elution occurs on a regular basis with some plants struggling to elute
their carbon to less than 100 g/t (Fleming et al., 2011). The Au not eluted from the
activated carbon will decompose to solid Au in the regeneration kiln and a longer and
more intense cyanidation pre-treatment step will be required to prevent further build-up
of the Au on the carbon. This will be specifically applicable to industrial plants where
cyanide free elution is practised. In addition to the Au build-up on the carbon, the
reduced carbon activity will also directly lead to lower adsorption and Au losses to the
tailings dam. Fleming et al (2011) stresses this point and showed through modelling
that by increasing the amount of Au on the eluted carbon that is recycled to the last
adsorption tank from 0 to 50 g/t, soluble Au losses increased from 0.003 mg/L to
0.011 mg/L.
4.8 Chapter summary
The ICP result of barren KAu(CN)2 solution after adsorption onto activated carbon from
an initial concentration of 10.6 mg/L showed that more than 99% of Au was adsorbed.
Elution results of the Au loaded activated carbon after pre-treatment in NaOH-NaCN
solution at different pre-treatment conditions was found to show similar elution profiles.
It was shown from the profiles that removal of Na favoured the elution of Au.
Furthermore, the effect of the pre-treatment parameters i.e., pre-treatment temperature,
contact time and agitation speed were discussed. Pre-treatment temperature from 25oC
to 80oC was found to increase Au elution recovery by approximately 12 % which is in
Stellenbosch University https://scholar.sun.ac.za
Page 90
agreement with previous studies (Van Deventer and Van der Merwe,1994). Contact
time from 15 to 45 min showed insignificant changes in Au elution recovery while an
increase in agitation speed from 0 to 1200 rev/min decreased Au elution recovery by
approximately 15% at 80oC.
The most suitable elution mechanism was suggested from the proposed mechanisms of
previous authors. The mechanism where the CN is involved in a specific chemical
reaction at the carbon surface to increase the negative charge density and rendering
the surface less receptive for adsorption (Adams and Fleming, 1989), is more plausible
than the oxidation and hydrolysis of CN to form a decomposed product that improves
elution.
In addition the application of the results found was extended to Goldplat activated
carbon that has gone through regeneration, but with a significant amount of Au on it.
Effect of oxygen supply during pre-treatment on regenerated carbon was found not to
show any significant effect on Au elution recovery at both 10 mL/min and 100 mL/min. It
was also shown that with loaded activated carbon that was thermally regenerated, CN
is required to convert solid Au particle to soluble Au for effective elution which will
require longer pre-treatment times and higher concentrations of CN .
The next chapter presents further discussion on the statistical analysis of the results
and the analysis of possible errors associated with the experiments.
Stellenbosch University https://scholar.sun.ac.za
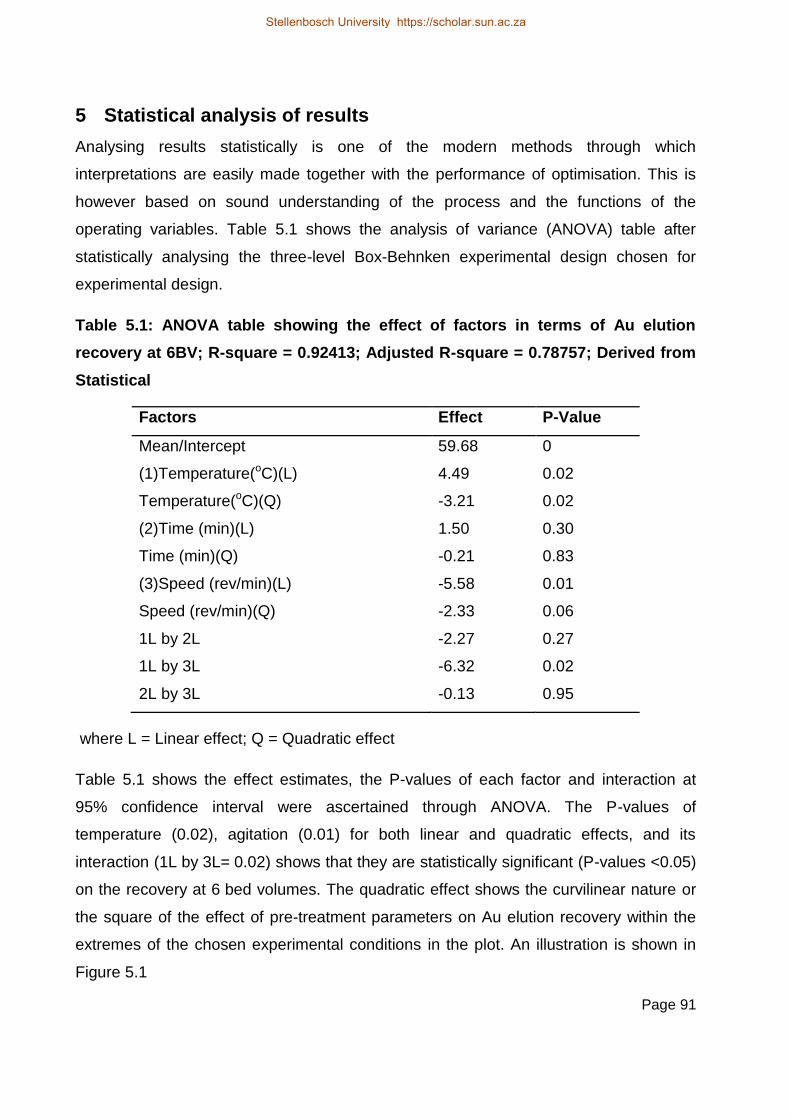
Page 91
5 Statistical analysis of results
Analysing results statistically is one of the modern methods through which
interpretations are easily made together with the performance of optimisation. This is
however based on sound understanding of the process and the functions of the
operating variables. Table 5.1 shows the analysis of variance (ANOVA) table after
statistically analysing the three-level Box-Behnken experimental design chosen for
experimental design.
Table 5.1: ANOVA table showing the effect of factors in terms of Au elution
recovery at 6BV; R-square = 0.92413; Adjusted R-square = 0.78757; Derived from
Statistical
Factors Effect P-Value
Mean/Intercept 59.68 0
(1)Temperature(oC)(L) 4.49 0.02
Temperature(oC)(Q) -3.21 0.02
(2)Time (min)(L) 1.50 0.30
Time (min)(Q) -0.21 0.83
(3)Speed (rev/min)(L) -5.58 0.01
Speed (rev/min)(Q) -2.33 0.06
1L by 2L -2.27 0.27
1L by 3L -6.32 0.02
2L by 3L -0.13 0.95
where L = Linear effect; Q = Quadratic effect
Table 5.1 shows the effect estimates, the P-values of each factor and interaction at
95% confidence interval were ascertained through ANOVA. The P-values of
temperature (0.02), agitation (0.01) for both linear and quadratic effects, and its
interaction (1L by 3L= 0.02) shows that they are statistically significant (P-values <0.05)
on the recovery at 6 bed volumes. The quadratic effect shows the curvilinear nature or
the square of the effect of pre-treatment parameters on Au elution recovery within the
extremes of the chosen experimental conditions in the plot. An illustration is shown in
Figure 5.1
Stellenbosch University https://scholar.sun.ac.za

Page 92
Re
spo
nse
Effect
Quadratic effects
Linear effect
Figure 5.1: Illustration of quadratic effect and linear effect on a response
The positive effect of temperature on the recovery can be seen with the positive value
of 4.49 in the linear effect, which shows that temperature plays a synergistic role during
pre-treatment as earlier explained in Section 4.5.1 on Au recovery. Conversely, the
opposing effect of agitation speed during pre-treatment on Au recovery with a value of
-5.58 can be seen from Table 5.1. This agrees with the discussion in Section 4.5.3,
where it was shown that Au elution recovery decreases with an increase in agitation
speed. Interaction effect of agitation speed and temperature with a value of -6.32
suggests the dominant effect of agitation speed over temperature during pre-treatment
on Au recovery. This resulted in decrease in Au elution recovery (Section 4.5.3).
Likewise the effect of contact time with a low positive value of 1.5 compared to the
effect temperature (4.6) also suggests that it has a beneficial effect on Au recovery.
However, P-value of 0.3 suggests that it is not statistically significant on the process.
This concurs with the discussion in Section 4.5.2, where it was shown that Au recovery
increases with about 2% from 15 min to 30 min and further 5% increase at 45 min at
both 0 and 600 rev/min agitation speed at 25oC. At 80oC, recovery stays fairly constant
at all contact time (Figure 4.12).
Stellenbosch University https://scholar.sun.ac.za
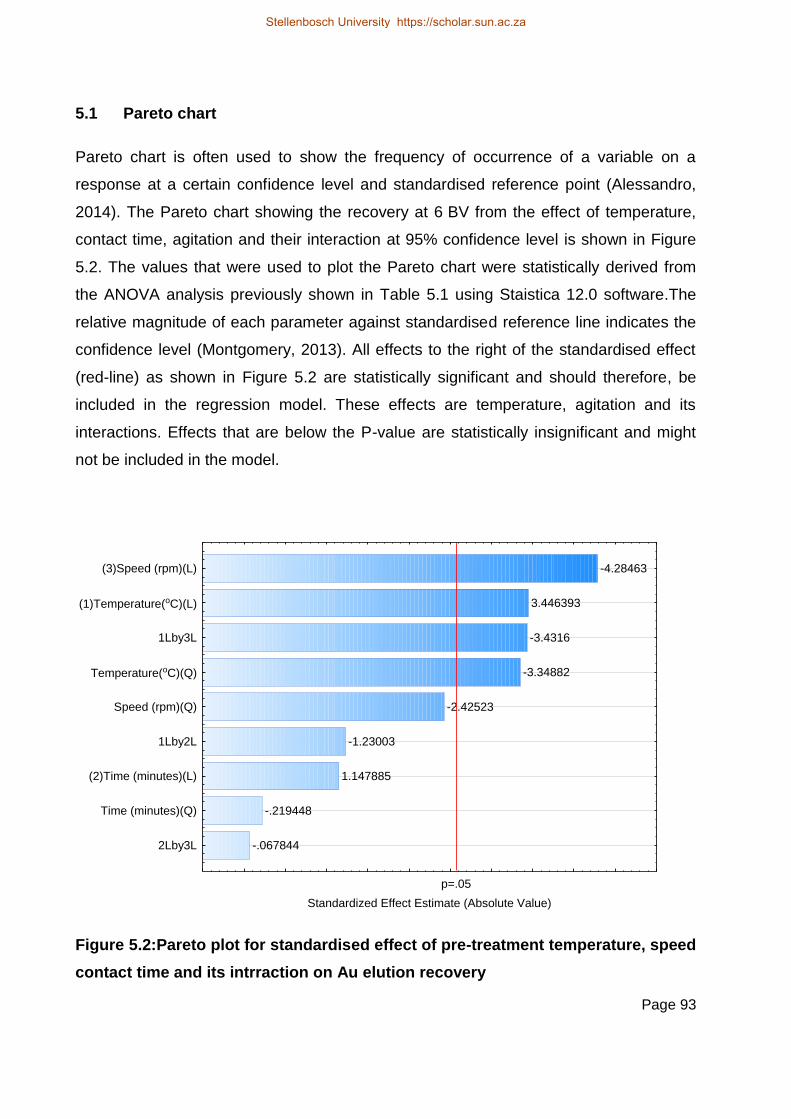
Page 93
5.1 Pareto chart
Pareto chart is often used to show the frequency of occurrence of a variable on a
response at a certain confidence level and standardised reference point (Alessandro,
2014). The Pareto chart showing the recovery at 6 BV from the effect of temperature,
contact time, agitation and their interaction at 95% confidence level is shown in Figure
5.2. The values that were used to plot the Pareto chart were statistically derived from
the ANOVA analysis previously shown in Table 5.1 using Staistica 12.0 software.The
relative magnitude of each parameter against standardised reference line indicates the
confidence level (Montgomery, 2013). All effects to the right of the standardised effect
(red-line) as shown in Figure 5.2 are statistically significant and should therefore, be
included in the regression model. These effects are temperature, agitation and its
interactions. Effects that are below the P-value are statistically insignificant and might
not be included in the model.
-.067844
-.219448
1.147885
-1.23003
-2.42523
-3.34882
-3.4316
3.446393
-4.28463
p=.05
Standardized Effect Estimate (Absolute Value)
2Lby3L
Time (minutes)(Q)
(2)Time (minutes)(L)
1Lby2L
Speed (rpm)(Q)
Temperature(oC)(Q)
1Lby3L
(1)Temperature(oC)(L)
(3)Speed (rpm)(L)
Figure 5.2:Pareto plot for standardised effect of pre-treatment temperature, speed
contact time and its intrraction on Au elution recovery
Stellenbosch University https://scholar.sun.ac.za

Page 94
5.2 Regression model
Statistical experimental designs are carried out to enhance the development of a
predictive model that will assist in predicting other points of interest and optimisation if
required. Second order interaction linear model was derived to predict Au elution
recovery at 6 bed volumes as a function of temperature, agitation speed and contact
time by fitting the experimental data shown in Table 4.1. The effect of statistically
insignificant parameters were ignored to further simplify the model (Equation 5.1) and
reduce noise.
The model given by Equation 5.1 below satisfies data points at 6 bed volumes. A similar
approach can be used to formulate the model for a desired point estimate for other
points of interest.
Y = 62.42 – 0.247x1+ 0.004x12 – 0.002x3 + 0.00001x3
2 – 0.0002x1x3 + ɛ 5.1
Where: Y = % Recovery
x1 = Temperature (oC)
x3 = Agitation speed (rev/min)
ɛ = Experimental error
5.3 Model adequacy test
The adequacy of the regression model to predict observed value was assessed through
the scatter plot of predicted vs observed response. This is shown in Figure 5.3. Other
options that can also be used are predicted vs residual, observed vs residual, residual
vs deleted residual and residual vs case numbers. According to Manual (2004), these
terms are defined as follows:
· Residual = Observed-predicted
√residual mean square
· Deleted residual are outliers that significantly affects the residual
· Case number are the run numbers
Stellenbosch University https://scholar.sun.ac.za
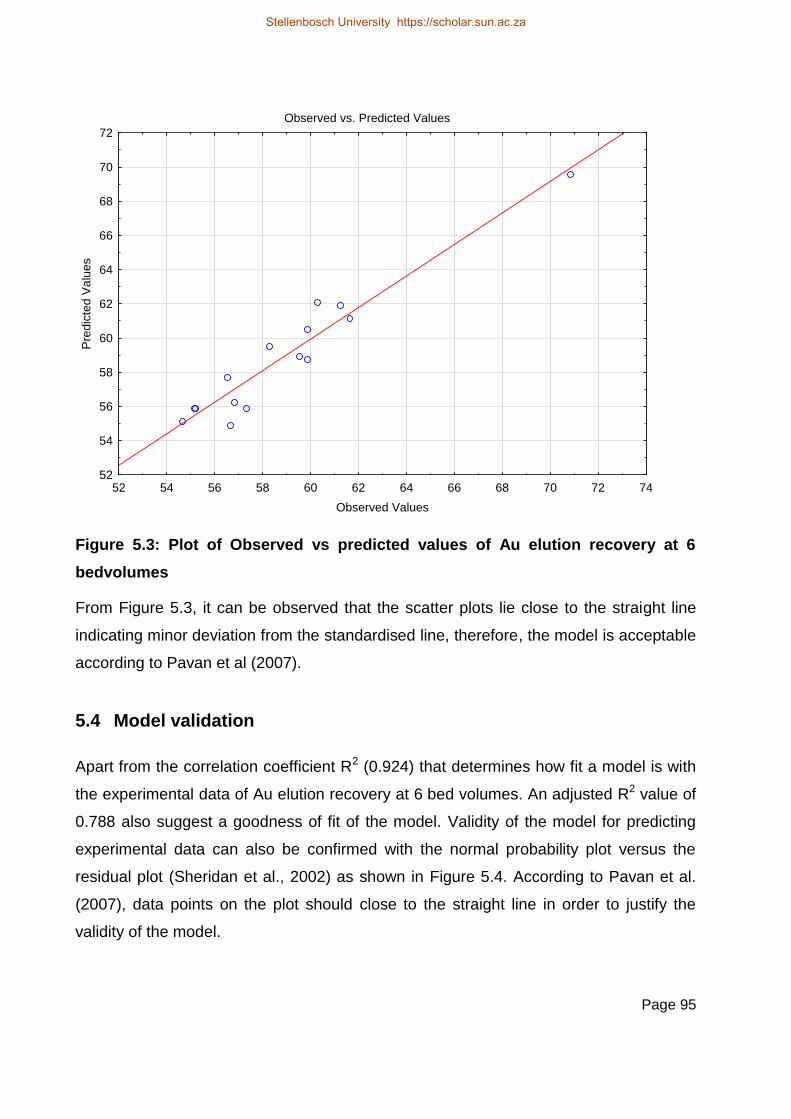
Page 95
Observed vs. Predicted Values
52 54 56 58 60 62 64 66 68 70 72 74
Observed Values
52
54
56
58
60
62
64
66
68
70
72
Pre
dic
ted
Va
lue
s
Figure 5.3: Plot of Observed vs predicted values of Au elution recovery at 6
bedvolumes
From Figure 5.3, it can be observed that the scatter plots lie close to the straight line
indicating minor deviation from the standardised line, therefore, the model is acceptable
according to Pavan et al (2007).
5.4 Model validation
Apart from the correlation coefficient R2 (0.924) that determines how fit a model is with
the experimental data of Au elution recovery at 6 bed volumes. An adjusted R2 value of
0.788 also suggest a goodness of fit of the model. Validity of the model for predicting
experimental data can also be confirmed with the normal probability plot versus the
residual plot (Sheridan et al., 2002) as shown in Figure 5.4. According to Pavan et al.
(2007), data points on the plot should close to the straight line in order to justify the
validity of the model.
Stellenbosch University https://scholar.sun.ac.za
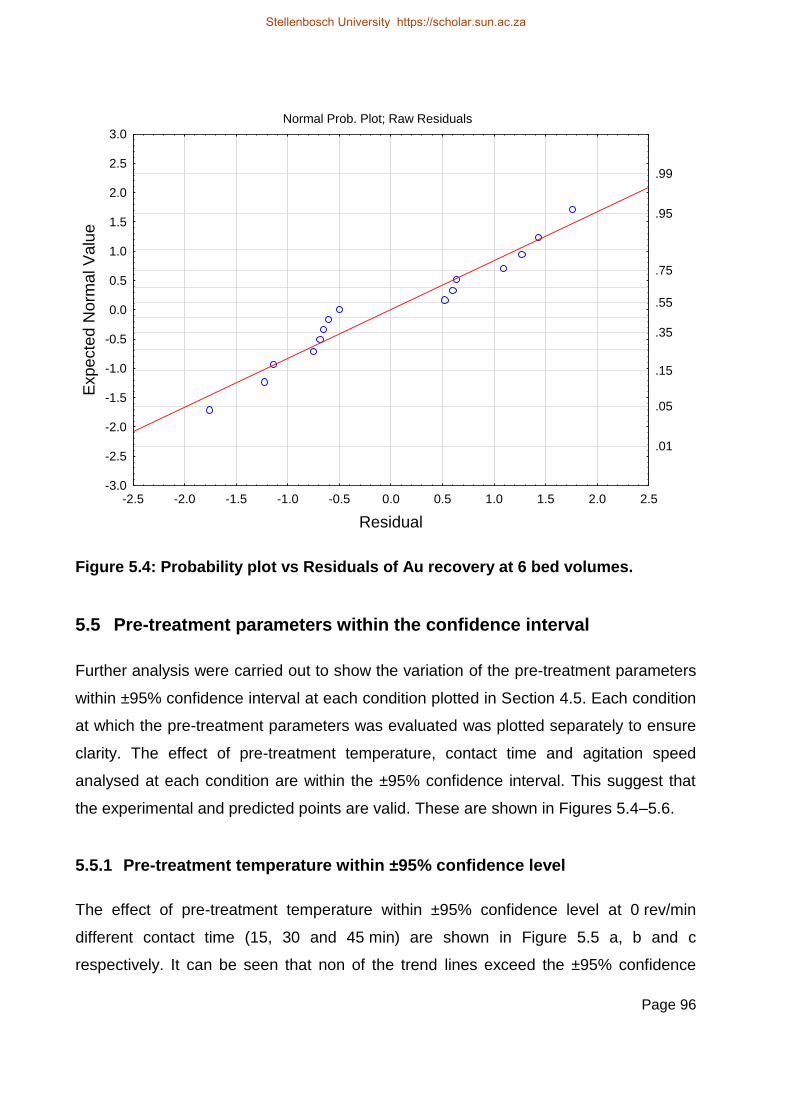
Page 96
Normal Prob. Plot; Raw Residuals
-2.5 -2.0 -1.5 -1.0 -0.5 0.0 0.5 1.0 1.5 2.0 2.5
Residual
-3.0
-2.5
-2.0
-1.5
-1.0
-0.5
0.0
0.5
1.0
1.5
2.0
2.5
3.0
Expecte
d N
orm
al V
alu
e
.01
.05
.15
.35
.55
.75
.95
.99
Figure 5.4: Probability plot vs Residuals of Au recovery at 6 bed volumes.
5.5 Pre-treatment parameters within the confidence interval
Further analysis were carried out to show the variation of the pre-treatment parameters
within ±95% confidence interval at each condition plotted in Section 4.5. Each condition
at which the pre-treatment parameters was evaluated was plotted separately to ensure
clarity. The effect of pre-treatment temperature, contact time and agitation speed
analysed at each condition are within the ±95% confidence interval. This suggest that
the experimental and predicted points are valid. These are shown in Figures 5.4–5.6.
5.5.1 Pre-treatment temperature within ±95% confidence level
The effect of pre-treatment temperature within ±95% confidence level at 0 rev/min
different contact time (15, 30 and 45 min) are shown in Figure 5.5 a, b and c
respectively. It can be seen that non of the trend lines exceed the ±95% confidence
Stellenbosch University https://scholar.sun.ac.za

Page 97
level indicated with the dotted red lines. This suggest that the adopted Box Behnken
model is valid within this confidence limit
0 20 40 60 80 1000
50
100
150a
Temperature (oC)
% R
ec
ov
ery
0 20 40 60 80 1000
50
100
150b
Temperature (oC)
% R
ec
ov
ery
0 20 40 60 80 1000
50
100
150
c
Temperature (oC)
% R
ec
ov
ery
Figure 5.5: Effect of temperature within ±95% confidence level. (a= condition at
15min and 0 rev/min; b= condition at 30 min and 0 rev/min; c= condition at 45 min
and 0 rev/min). Dotted red lines represent ±95%; red thin lines represents trend
line and the black line represents data point of pre-treatment temperature.
5.5.2 Contact time within ±95% confidence level
Similarly, the effect of contact time at different conditions are shown in Figures 5.6 a–i.
None of these effect exceeds the ±95% confidence level (red dotted lines). This
suggests the validity of the model to predict the effect of contact time at 15, 30 and 45
min unders these experimental conditions within the ±95% confidence level.
Stellenbosch University https://scholar.sun.ac.za
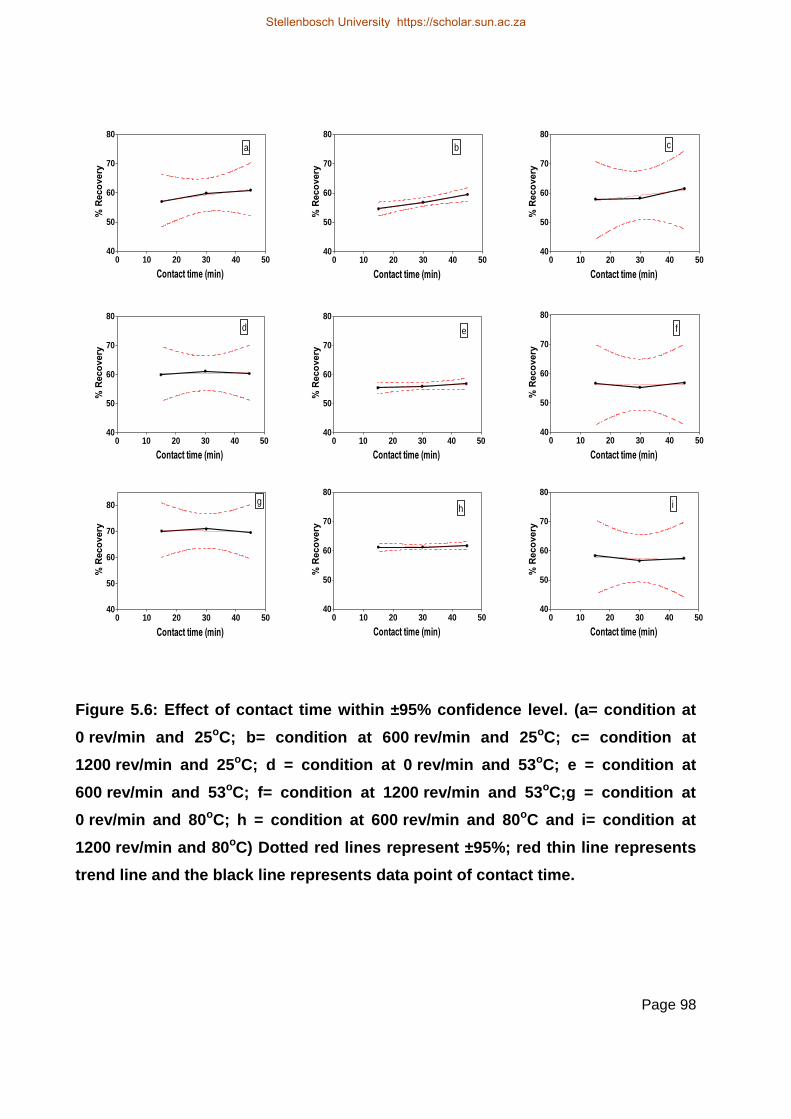
Page 98
0 10 20 30 40 5040
50
60
70
80
a
Contact time (min)
% R
eco
very
0 10 20 30 40 5040
50
60
70
80
b
Contact time (min)
% R
eco
very
0 10 20 30 40 5040
50
60
70
80
c
Contact time (min)
% R
eco
very
0 10 20 30 40 5040
50
60
70
80
d
Contact time (min)
% R
eco
very
0 10 20 30 40 5040
50
60
70
80
e
Contact time (min)
% R
eco
very
0 10 20 30 40 5040
50
60
70
80
f
Contact time (min)
% R
eco
very
0 10 20 30 40 5040
50
60
70
80 g
Contact time (min)
% R
eco
very
0 10 20 30 40 5040
50
60
70
80
h
Contact time (min)
% R
eco
very
0 10 20 30 40 5040
50
60
70
80
i
Contact time (min)
% R
eco
very
Figure 5.6: Effect of contact time within ±95% confidence level. (a= condition at
0 rev/min and 25oC; b= condition at 600 rev/min and 25oC; c= condition at
1200 rev/min and 25oC; d = condition at 0 rev/min and 53oC; e = condition at
600 rev/min and 53oC; f= condition at 1200 rev/min and 53oC;g = condition at
0 rev/min and 80oC; h = condition at 600 rev/min and 80oC and i= condition at
1200 rev/min and 80oC) Dotted red lines represent ±95%; red thin line represents
trend line and the black line represents data point of contact time.
Stellenbosch University https://scholar.sun.ac.za
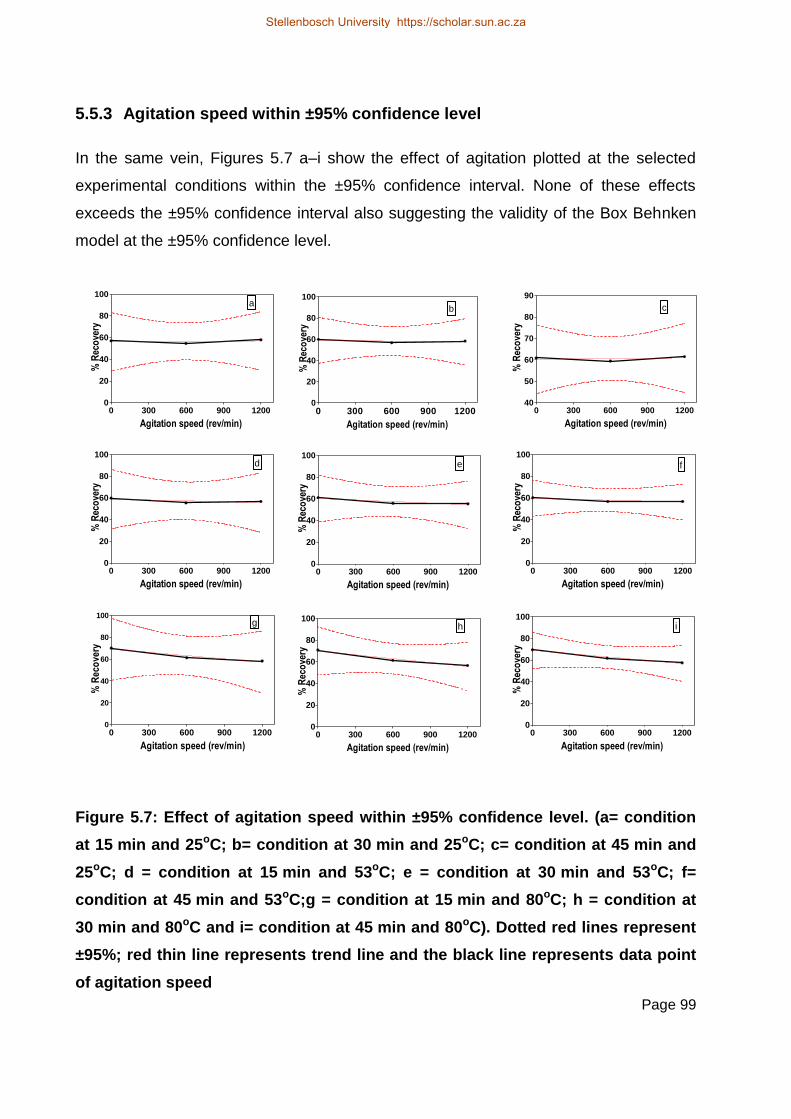
Page 99
5.5.3 Agitation speed within ±95% confidence level
In the same vein, Figures 5.7 a–i show the effect of agitation plotted at the selected
experimental conditions within the ±95% confidence interval. None of these effects
exceeds the ±95% confidence interval also suggesting the validity of the Box Behnken
model at the ±95% confidence level.
0 300 600 900 12000
20
40
60
80
100a
Agitation speed (rev/min)
% R
eco
very
0 300 600 900 12000
20
40
60
80
100
b
Agitation speed (rev/min)
% R
eco
very
0 300 600 900 120040
50
60
70
80
90
c
Agitation speed (rev/min)
% R
eco
very
0 300 600 900 12000
20
40
60
80
100d
Agitation speed (rev/min)
% R
eco
very
0 300 600 900 12000
20
40
60
80
100e
Agitation speed (rev/min)
% R
eco
very
0 300 600 900 12000
20
40
60
80
100
f
Agitation speed (rev/min)
% R
eco
very
0 300 600 900 12000
20
40
60
80
100g
Agitation speed (rev/min)
% R
eco
very
0 300 600 900 12000
20
40
60
80
100h
Agitation speed (rev/min)
% R
eco
very
0 300 600 900 12000
20
40
60
80
100i
Agitation speed (rev/min)
% R
eco
very
Figure 5.7: Effect of agitation speed within ±95% confidence level. (a= condition
at 15 min and 25oC; b= condition at 30 min and 25oC; c= condition at 45 min and
25oC; d = condition at 15 min and 53oC; e = condition at 30 min and 53oC; f=
condition at 45 min and 53oC;g = condition at 15 min and 80oC; h = condition at
30 min and 80oC and i= condition at 45 min and 80oC). Dotted red lines represent
±95%; red thin line represents trend line and the black line represents data point
of agitation speed
Stellenbosch University https://scholar.sun.ac.za
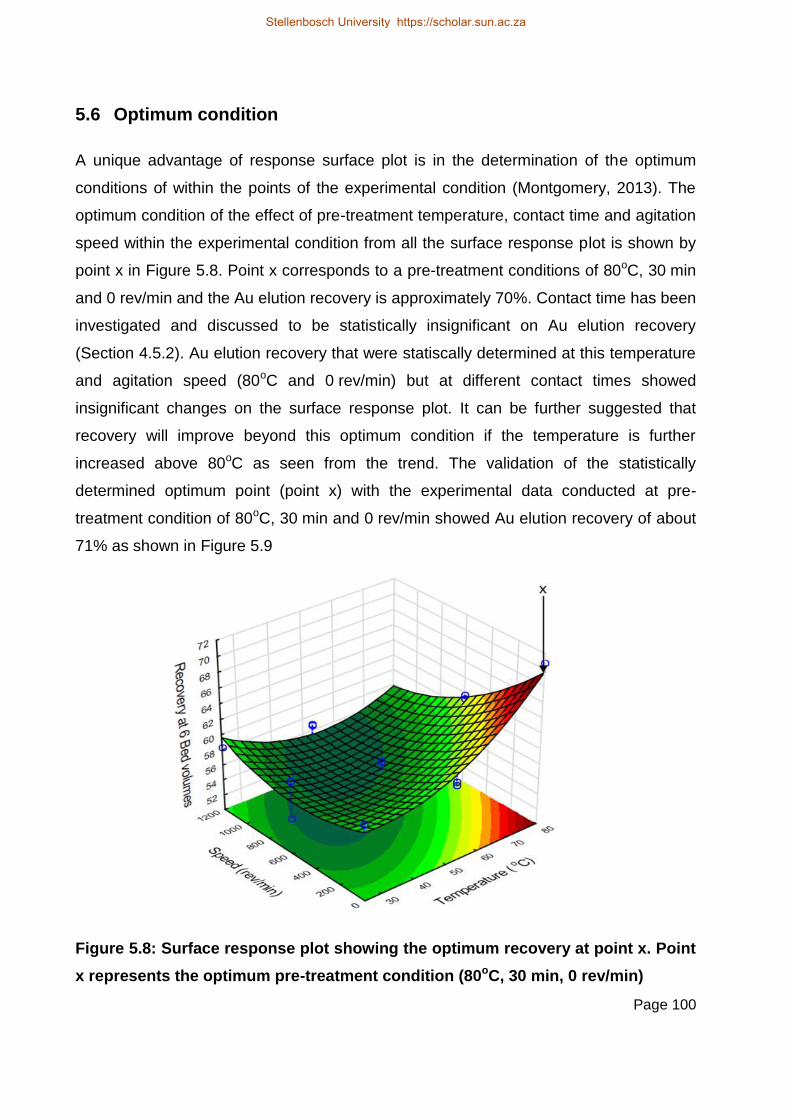
Page 100
5.6 Optimum condition
A unique advantage of response surface plot is in the determination of the optimum
conditions of within the points of the experimental condition (Montgomery, 2013). The
optimum condition of the effect of pre-treatment temperature, contact time and agitation
speed within the experimental condition from all the surface response plot is shown by
point x in Figure 5.8. Point x corresponds to a pre-treatment conditions of 80oC, 30 min
and 0 rev/min and the Au elution recovery is approximately 70%. Contact time has been
investigated and discussed to be statistically insignificant on Au elution recovery
(Section 4.5.2). Au elution recovery that were statiscally determined at this temperature
and agitation speed (80oC and 0 rev/min) but at different contact times showed
insignificant changes on the surface response plot. It can be further suggested that
recovery will improve beyond this optimum condition if the temperature is further
increased above 80oC as seen from the trend. The validation of the statistically
determined optimum point (point x) with the experimental data conducted at pre-
treatment condition of 80oC, 30 min and 0 rev/min showed Au elution recovery of about
71% as shown in Figure 5.9
Figure 5.8: Surface response plot showing the optimum recovery at point x. Point
x represents the optimum pre-treatment condition (80oC, 30 min, 0 rev/min)
Stellenbosch University https://scholar.sun.ac.za

Page 101
Figure 5.9: Optimum condition for validation of statistically determined optimum
condition. pre-treatment condition (80oC, 30 min, 0 rev/min)
5.7 Experimental error and reproducibility
A unique advantage of Box-Behnken experimental design is the efficiency in the
number of runs required compared to a full factorial and composite design
(Montgomery, 2013). This allows the formation of appropriate regression model to
estimate the combined effects of the parameters that are not experimentally conducted
(Section 5.2). In order to minimise the error and ensure reproducibility of the
experiments, each run of the experiments was replicated three times, giving a total of
45 runs for the elution experiment. The reproducibility is expressed as percentage
coefficient of variation (CR) given by Equation 5.2. The significance of the error with
respect to the mean value was further statistically analysed using Descriptive Duncan
analysis, Statistical 12 software. The error bar for each run indicates the standard error.
CR= SD
AV*100% 5.2
Where: CR = Coefficient of variation
SD = Standard deviation
AV= Average value of concentration of three trials
0
10
20
30
40
50
60
70
80
0 1 2 3 4 5 6 7
% R
eco
very
Bed volumes
Stellenbosch University https://scholar.sun.ac.za

Page 102
According to Chowdhury et al (2012), and as a general rule, an experiment can be
regarded to be reproducible, if the CR is less than 10 percent. The experimental error,
statistical significance and reproducibility were carried out for both CN- study and
elution experiments.
5.7.1 Cyanide loss study
Figures 5.10–5.12 show the column plot of the CN study of average concentration of
CN and Na+ at each sampling time both in the presence and absence of activated
carbon. The value of the percentage of CR at each sampling point is shown on each
bar after three trials which are less than 10% confirms the behaviour at 25oC and 80oC
previously discussed in Section 4.4 where no significant changes occurred at 25oC
when compared to 80oC. The calculated CR according to Equation 5.2 after three trials
are shown in Tables 5.2–5.5 for studies in the absence of activated carbon.
Figure 5.10: Reproducibility of CN- and Na+ in the absence of AC. Values shows
coefficient of variation
0
5
10
15
20
25
30
0 15 30 45 60
Avera
ge c
onc (
g/L
)
Time (minutes)
25°C (CNˉ)
80°C (CNˉ)
25°C (Na⁺)
80°C (Na⁺)
0.8
1
2.2
2
2.1
7
1.3
1
1.3
6
2.8
7
3.2
5
3.3
6
3.2
8 3.0
2
0.3
4
0.6
5
0.6
5
0.6
9
0.4
7
1.0
3
2.6
2
2.5
8
1.4
3 1.3
2
Stellenbosch University https://scholar.sun.ac.za
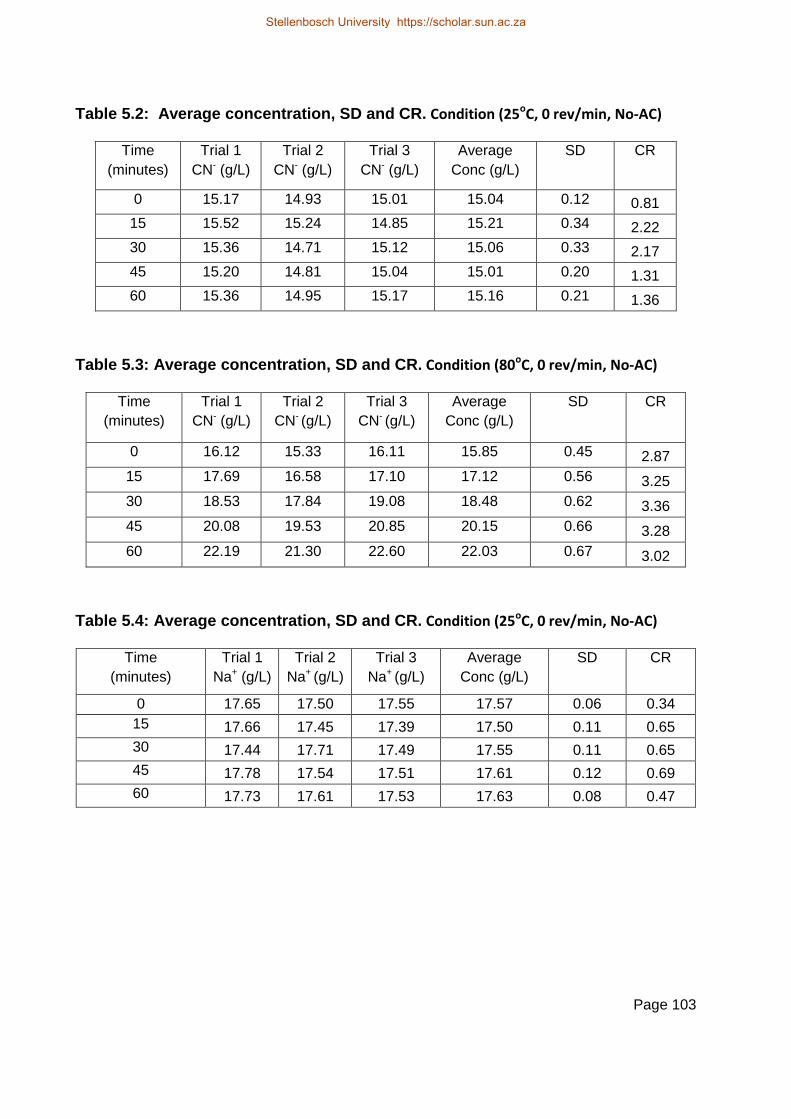
Page 103
Table 5.2: Average concentration, SD and CR. Condition (25oC, 0 rev/min, No-AC)
Time
(minutes)
Trial 1
CN- (g/L)
Trial 2
CN- (g/L)
Trial 3
CN- (g/L)
Average
Conc (g/L)
SD CR
0 15.17 14.93 15.01 15.04 0.12 0.81
15 15.52 15.24 14.85 15.21 0.34 2.22
30 15.36 14.71 15.12 15.06 0.33 2.17
45 15.20 14.81 15.04 15.01 0.20 1.31
60 15.36 14.95 15.17 15.16 0.21 1.36
Table 5.3: Average concentration, SD and CR. Condition (80oC, 0 rev/min, No-AC)
Time
(minutes)
Trial 1
CN- (g/L)
Trial 2
CN- (g/L)
Trial 3
CN- (g/L)
Average
Conc (g/L)
SD CR
0 16.12 15.33 16.11 15.85 0.45 2.87
15 17.69 16.58 17.10 17.12 0.56 3.25
30 18.53 17.84 19.08 18.48 0.62 3.36
45 20.08 19.53 20.85 20.15 0.66 3.28
60 22.19 21.30 22.60 22.03 0.67 3.02
Table 5.4: Average concentration, SD and CR. Condition (25oC, 0 rev/min, No-AC)
Time
(minutes)
Trial 1
Na+ (g/L)
Trial 2
Na+ (g/L)
Trial 3
Na+ (g/L)
Average
Conc (g/L)
SD CR
0 17.65 17.50 17.55 17.57 0.06 0.34
15 17.66 17.45 17.39 17.50 0.11 0.65
30 17.44 17.71 17.49 17.55 0.11 0.65
45 17.78 17.54 17.51 17.61 0.12 0.69
60 17.73 17.61 17.53 17.63 0.08 0.47
Stellenbosch University https://scholar.sun.ac.za
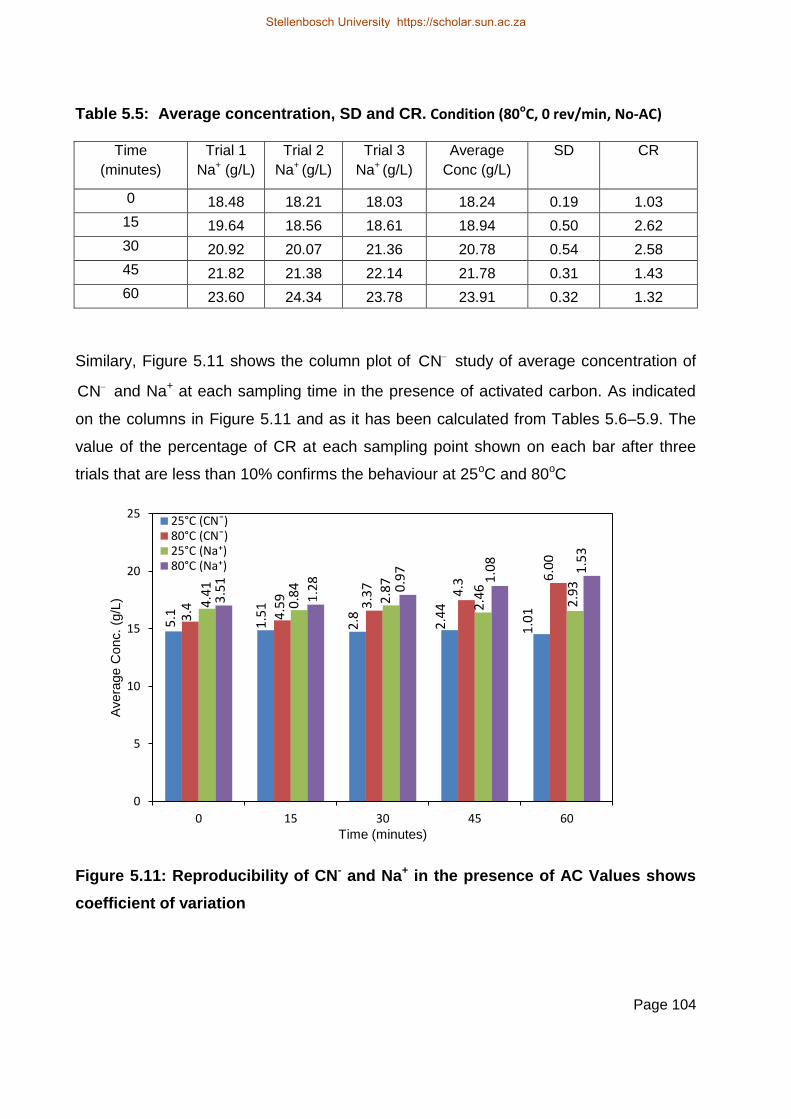
Page 104
Table 5.5: Average concentration, SD and CR. Condition (80oC, 0 rev/min, No-AC)
Time
(minutes)
Trial 1
Na+ (g/L)
Trial 2
Na+ (g/L)
Trial 3
Na+ (g/L)
Average
Conc (g/L)
SD CR
0 18.48 18.21 18.03 18.24 0.19 1.03
15 19.64 18.56 18.61 18.94 0.50 2.62
30 20.92 20.07 21.36 20.78 0.54 2.58
45 21.82 21.38 22.14 21.78 0.31 1.43
60 23.60 24.34 23.78 23.91 0.32 1.32
Similary, Figure 5.11 shows the column plot of CN study of average concentration of
CN and Na+ at each sampling time in the presence of activated carbon. As indicated
on the columns in Figure 5.11 and as it has been calculated from Tables 5.6–5.9. The
value of the percentage of CR at each sampling point shown on each bar after three
trials that are less than 10% confirms the behaviour at 25oC and 80oC
Figure 5.11: Reproducibility of CN- and Na+ in the presence of AC Values shows
coefficient of variation
0
5
10
15
20
25
0 15 30 45 60
Avera
ge C
onc.
(g/L
)
Time (minutes)
25°C (CNˉ) 80°C (CNˉ) 25°C (Na⁺) 80°C (Na⁺)
5.1
1.5
1
2.8 2.4
4
1.0
1
3.4 4.5
9 4.3
3.3
7 6
.00
4.4
1
0.8
4
2.8
7
2.4
6
2.9
3
3.5
1
1.2
8
0.9
7
1.0
8
1.5
3
Stellenbosch University https://scholar.sun.ac.za
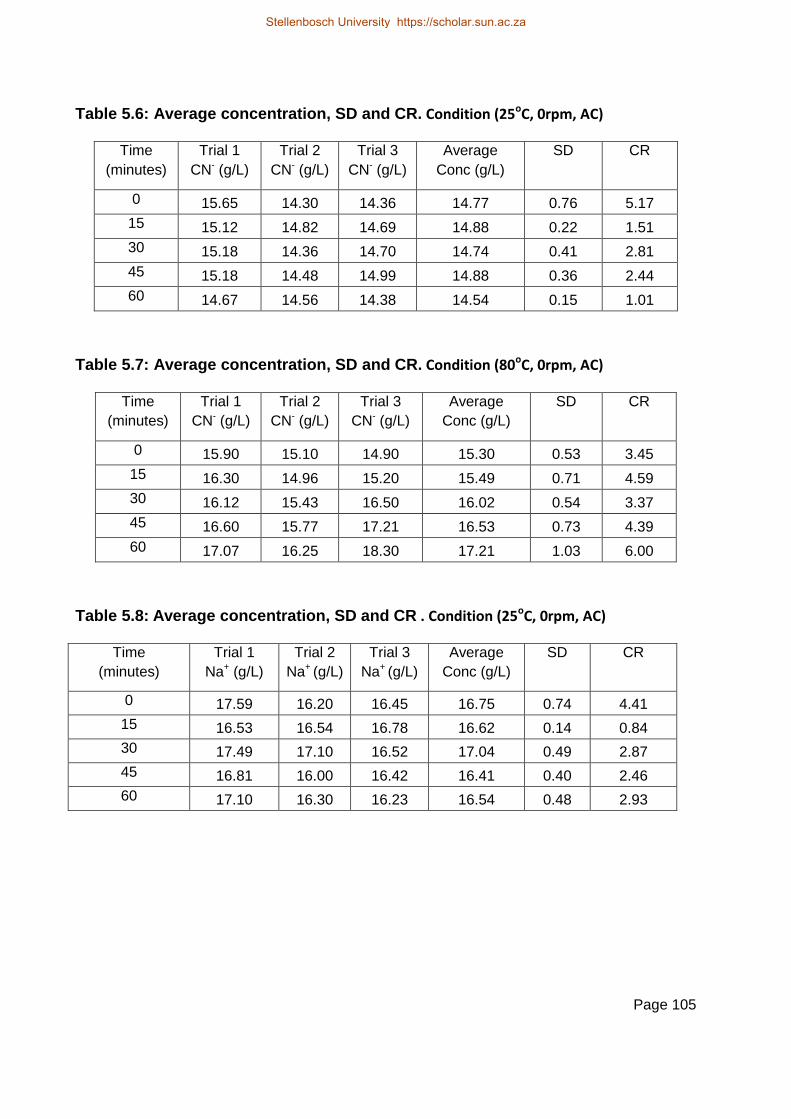
Page 105
Table 5.6: Average concentration, SD and CR. Condition (25oC, 0rpm, AC)
Time
(minutes)
Trial 1
CN- (g/L)
Trial 2
CN- (g/L)
Trial 3
CN- (g/L)
Average
Conc (g/L)
SD CR
0 15.65 14.30 14.36 14.77 0.76 5.17
15 15.12 14.82 14.69 14.88 0.22 1.51
30 15.18 14.36 14.70 14.74 0.41 2.81
45 15.18 14.48 14.99 14.88 0.36 2.44
60 14.67 14.56 14.38 14.54 0.15 1.01
Table 5.7: Average concentration, SD and CR. Condition (80oC, 0rpm, AC)
Time
(minutes)
Trial 1
CN- (g/L)
Trial 2
CN- (g/L)
Trial 3
CN- (g/L)
Average
Conc (g/L)
SD CR
0 15.90 15.10 14.90 15.30 0.53 3.45
15 16.30 14.96 15.20 15.49 0.71 4.59
30 16.12 15.43 16.50 16.02 0.54 3.37
45 16.60 15.77 17.21 16.53 0.73 4.39
60 17.07 16.25 18.30 17.21 1.03 6.00
Table 5.8: Average concentration, SD and CR . Condition (25oC, 0rpm, AC)
Time
(minutes)
Trial 1
Na+ (g/L)
Trial 2
Na+ (g/L)
Trial 3
Na+ (g/L)
Average
Conc (g/L)
SD CR
0 17.59 16.20 16.45 16.75 0.74 4.41
15 16.53 16.54 16.78 16.62 0.14 0.84
30 17.49 17.10 16.52 17.04 0.49 2.87
45 16.81 16.00 16.42 16.41 0.40 2.46
60 17.10 16.30 16.23 16.54 0.48 2.93
Stellenbosch University https://scholar.sun.ac.za

Page 106
Table 5.9: Average concentration, SD and CR . Condition (80oC, 0rpm, AC)
Time
(minutes)
Trial 1
Na+ (g/L)
Trial 2
Na+ (g/L)
Trial 3
Na+ (g/L)
Average
Conc (g/L)
SD CR
0 17.96 16.91 16.91 17.26 0.61 3.51
15 16.85 17.23 17.23 17.10 0.22 1.28
30 17.76 18.00 18.10 17.95 0.17 0.97
45 18.74 18.90 18.50 18.71 0.20 1.08
60 19.59 19.90 19.30 19.60 0.30 1.53
5.7.2 Elution
In the same vein, the estimated CR for elution process which are less than 10 percent
for each run are shown in the column plot in Figure 5.12. Duncan analysis of the error
that might be associated with elution shown in Figure 5.13 with the error bar indicating
the standard error. The data used for the estimation of these values for each run are
shown in Table 5.10
Figure 5.12: Reproducibility plot of elution experiment. Value on each column
indicate coefficient of variation.
0
10
20
30
40
50
60
70
80
% R
eco
very
at
6 B
V
Run
7.2
3.0
6
10
.0 5.9
3
4.7
1 8
.7
2.3
6.5 4
.7 1.9
3.7
7
6.6
5.8
0
7.9
0
4.3
7
Stellenbosch University https://scholar.sun.ac.za
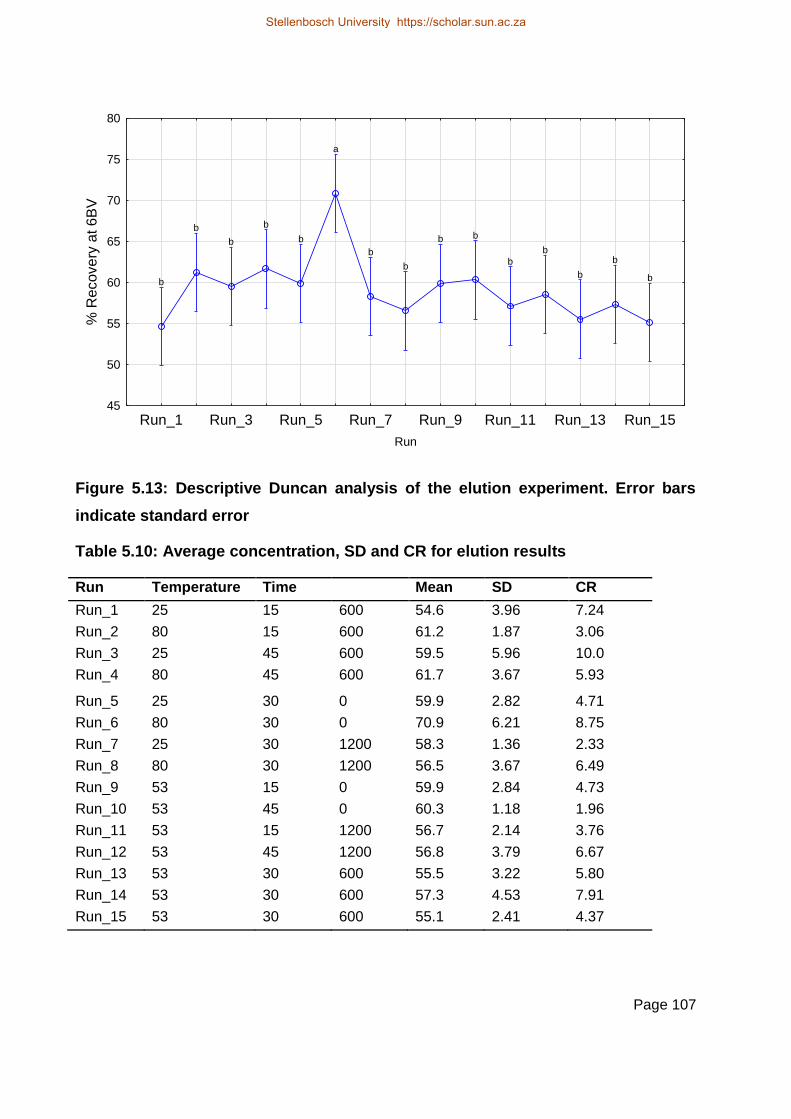
Page 107
Run_1 Run_3 Run_5 Run_7 Run_9 Run_11 Run_13 Run_15
Run
45
50
55
60
65
70
75
80
% R
eco
ve
ry a
t 6
BV
a
bbbbbb
bbbb
bb bb
Figure 5.13: Descriptive Duncan analysis of the elution experiment. Error bars
indicate standard error
Table 5.10: Average concentration, SD and CR for elution results
Run Temperature Time Mean SD CR
Run_1 25 15 600 54.6 3.96 7.24
Run_2 80 15 600 61.2 1.87 3.06
Run_3 25 45 600 59.5 5.96 10.0
Run_4 80 45 600 61.7 3.67 5.93
Run_5 25 30 0 59.9 2.82 4.71
Run_6 80 30 0 70.9 6.21 8.75
Run_7 25 30 1200 58.3 1.36 2.33
Run_8 80 30 1200 56.5 3.67 6.49
Run_9 53 15 0 59.9 2.84 4.73
Run_10 53 45 0 60.3 1.18 1.96
Run_11 53 15 1200 56.7 2.14 3.76
Run_12 53 45 1200 56.8 3.79 6.67
Run_13 53 30 600 55.5 3.22 5.80
Run_14 53 30 600 57.3 4.53 7.91
Run_15 53 30 600 55.1 2.41 4.37
Stellenbosch University https://scholar.sun.ac.za
Page 108
5.8 Chapter Summary
The P-values of 0.02, 0.01,and 0.02 for temperature, agitation speed and their
combined effect in the ANOVA result showed these factors are statistically significant
on Au elution recovery. The positive and negative effects of temperature and agitation
speed was seen with values of 4.49 and -5.58 respectively. Regression model was
formulated to enable prediction of points that are not conducted experimentally. The
regression model was validated using probability plot vs residuals plot.
Surface response plot of the pre-treatment parameters and its interactions concurred
with the metallurgical explanations given in chapter 5.
Reproducibility of CN study and elution experiment with CR less than 10% indicate
that the experiment is reproducible. The insignificance of the standard error also
showed that the error is minimal.
The overvall thesis summary and conclusion is given in the next chapter.
Stellenbosch University https://scholar.sun.ac.za

Page 109
6 Conclusions and Recommendations
6.1 Conclusions
The variabilities and non-standard guidelines of pre-treatment parameters i.e., pre-
treatment temperature and contact time that exist in Au elution process has been
reported. Several elution mechanisms have been studied. One of such is the
decomposition of CN on carbon surface which passivates carbon surface and
ultimately improved Au elution recovery. Furthermore decomposition of CN as a result
of agitation at different speeds have been reported. However, the effect on Au elution
recovery has not been investigated. Due to this variabily of the pre-treatment
paramenets and the lack of understanding of the effect of agitation on elution process,
this study investigated the effects of temperature, contact time and agitation speed
during pre-treatment on the elution of Au from activated carbon. Furthermore, the study
on the role of NaOH-NaCN during the pre-treatment step assisted in the suggestion of
suitable pre-treatment mechanism. The results of this investigation is as follows:
· Elution results showed that Au elution recovery increased by approximately 15%
after 6 BVs as the pre-treatment temperature increased from 25°C to 80°C. This
is in agreement with the work of previous researchers
· At 25oC, an increase in Au elution recovery of about 4% was seen from 15 min to
45 min, while at the 53oC and 80oC increase in the pre-treatment time had
insignificant effect on the Au elution recovery. It was suggested that an increase
in temperature minimises the effect of contact time on the overall recovery, which
agrees with the findings of Bailey (1991).
· Agitation of the pre-treatment solution on the other hand showed no significant
change from 0–1200 rev/min at 25oC, 6% decrease at 53oC and about 10%
decrease in Au elution recovery was noticed at 80°C indicating an antagonistic
effect of agitation. Evaluations of kSL at 0 , 600 and 1200 rev/min showed
insignificant change in kSL
· Proposed elution mechanisms were reviewed from several authors and related
to the findings from this study. The mechanism where the CN is involved in a
Stellenbosch University https://scholar.sun.ac.za

Page 110
specific chemical reaction at the carbon surface to increase the negative charge
density and rendering the surface less receptive for adsorption (Adams and
Fleming, 1989) best explained the possible elution mechanism.
· In the case where loaded activated carbon was thermally regenerated as in the
case of Au loaded carbon supplied from Goldplat Recovery (PTY), CN is
required to convert solid Au particle to soluble Au(CN)2
- which will require longer
pre-treatment times and higher concentrations of CN .
· Finally, the relevance of this research was shown to be applicable to Au plants
where a significant amount of Au still remains on carbon after elution, especially
where cyanide-free elution is being practised. in order to minimise Au loss with
the tailings.
From this study, it is suggested that gold plant continue to operate at high pre-treatment
temperature and not adopt agitation into the pre-treatment process. A longer contact
time is suggested when Au adsorbed on activated carbon remained adsorbed as solid
Au.
6.2 Recommendations
· To use a pilot plant experiment to further investigate regenerated Au loaded
activated carbon in order to determine optimum cyanide consumption under the
effect of the pre-treatment parameters.
· This present study will provide a solid framework to investigate the possible
elution mechanisms of PGMs, following the recent feasibility study by Snyders et
al. (2013) on using activated carbon in the adsorption and elution of platinum
group metals (PGMs) in a similar approach to Au.
Stellenbosch University https://scholar.sun.ac.za

Page 111
7 References
Adams, M., 1989. Chemistry of CIP process. PhD Thesis. Witwatersrand University,
Johannesburg, South Africa.
Adams, M., 1990a. The chemical behaviour of cyanide in the extraction of gold. 2.
Mechanisms of cyanide loss in the carbon-in-pulp process. Journal of the South
African Institute of Mining and Metallurgy, vol. 90, no. 3, pp.67-73.
Adams, M.,1990b. The chemical behaviour of cyanide in the extraction of gold. I.
Kinetics of cyanide loss in the presence and absence of activated carbon.
Journal of the South African Institute of Mining and Metallurgy, vol. 90, no.2,
pp.37-44.
Adams, M., 1990c. Kinetics of elution of gold from activated carbon by Zadra method.
Transactions of the Institution of Mining and Metallurgy Section C: Mineral
Processing and Extractive metallurgy, vol. 99, pp.C71-C79.
Adams, M., 1990d. The mechanism of adsorption of aurocyanide onto activated carbon,
1.Relation between the effects of oxygen and ionic strength. Hydrometallurgy,
vol. 25, no.2, pp.171-184.
Adams, M.D., 1991. Chemistry of adsorption and elution of gold on activated carbon,
Recent developments in In-Pulp technology. The South African Institute of
Mining and Metallurgy, pp. 1–64, (7–8 October).
Adams, M., 1994. Removal of cyanide from solution using activated carbon. Minerals
Engineering, vol.7, no.9, pp.1165-1177.
Adams, M.D and Nicol, M.J, 1986. The kinetics of the elution of gold from activated
carbon, Gold 100. Proceedings of the International Conference on Gold. The
South African Institute of Mining and Metallurgy, vol.,2, pp. 111-121
Adams, M. D., 2005. Developments in mineral processing. Advances in gold ore
processing. Elsevier.
Stellenbosch University https://scholar.sun.ac.za

Page 112
Adhoum, N., Monser, L. 2002. Removal of cyanide from aqueous solution using
impregnated activated carbon. Chemical Engineering and Processing: Process
Intensification, vol.41, no.1, pp.17-21.
Alessandro, D.B., 2014. Wiley StatsRef: Statistics reference online. Available online:
http://onlinelibrary.wiley.com/doi/. Accessed: 18 Nov 2015.
Atiemo-Obeng, V.A., Penney, W.R., Armenante P., 2004. Solid–liquid mixing.
Handbook of industrial mixing: Science and practice, pp. 543–584.
Aylmore, M., Adams M., 2005. Alternative lixiviants to cyanide for leaching of gold.
Advances in Gold Ore Processing. Elsevier, pp. 501-540.
Bailey, P., 1987. Application of activated carbon to gold recovery. South African
Institute of Mining and Metallurgy, The Extractive Metallurgy of Gold in South
Africa., vol.1, pp. 379-614.
Bailey, P., Stanley, G., 1987. The Extractive Metallurgy of Gold in South Africa. The
South African Institute of Mining and Metallurgy, vol.1, pp. 379-449.
Bansal, R. C., Goyal, M., 2005. Activated carbon adsorption and environment:
adsorptive removal of organic from water. Activated Carbon Adsorption. Taylor
and Francis, Boca Raton, pp. 297–372
Bard, A. J., Parsons, R., Jordan, J., 1985. Standard potentials in aqueous solution.
Monograph in Electro analytical Chemistry and Electrochemistry.
Barnes, D., Wright, P., Graham, S., Jones-Watson, E., 2000. Techniques for the
determination of cyanide in a process environment: a review. Geostand.
Newsletter vol 24, pp.183–195
Boshoff, P., 1994. Cyanide-free AARL elutions are feasible. Minerals Engineering,
vol.7, no.2, pp. 251-264.
Brown, P., 2000-2014. Revising Advanced Level Organic Chemistry. Available online:
http://www.docbrown.info/page06/OrgMechs3b.htm#. Accessed: 07 April 2015.
Stellenbosch University https://scholar.sun.ac.za

Page 113
Bruce, A., Patricia, E., 2007. Chemistry: Principles, Patterns, and Applications.
First Edition. Recording for the Blind and Dyslexic.
Bunney, K., Jeffrey, M., Pleysier, R., Breuer, P., 2010. Selective elution of gold, silver
and mercury cyanide from activated carbon. Minerals and Metallurgical
Processing Journal, vol.27, no.4, pp. 205-211.
Buson, G., Ngandu, D., Le Roux, J., Rogans, E., 1999. The west driefontein
reclamation carbon-in-pulp plant; pilot plant testwork, design, commissioning
and optimisation. Journal of the South African Institute of Mining and
Metallurgy, vol.99, no.2, pp. 63- 67.
Cho, E. H., Dixon, S. N., Pitt, C. H., 1979. The kinetics of gold cyanide adsorption on
activated charcoal. Metallurgical Transactions B, vol.10, no.2, pp.185-189.
Cho, E. H., Pitt, C. H., 1979. The adsorption of silver cyanide on activated charcoal.
Metallurgical Transactions B, vol.10, no. 2, pp.159-164.
Chowdhury, Z., Khalid, K., Ahmad, A., Khan, R., Zain, S., 2012. Application of response
surface methodology (rsm) for optimising production condition for removal of pb
(II) and cu (II) onto kenaf fiber based activated carbon. Research Journal of
Applied Sciences, Engineering and Technology, vol.4, no.5, pp. 458-465.
Conradie, P., Johns, M., Fowles, R., 1995. Elution and electrowinning of gold from gold-
selective strong-base resins. Hydrometallurgy, vol. 37, no. 3, pp. 349-366.
Cook, R., Crathorne, E., Monhemius, A., Perry, D., 1989. An XPS study of the
adsorption of gold (I) cyanide by carbons. Hydrometallurgy, vol. 22, no. 1, pp.
171-182.
Couper, J. R., Penney, W. R., Fair, J. R., 2009. Chemical process equipment revised
2nd Edition: Selection and design Gulf Professional Publishing.
Davidson, R.J., Baily, P.R., 1991. Carbon Elution. Recent developments in In-Pulp
technology. The South African Institute of Mining and Metallurgy, pp. 1-35, (7–8
October).
Stellenbosch University https://scholar.sun.ac.za

Page 114
Davidson, R. J., 1993. Innovations in Gold Extraction. PhD thesis, Department of
Chemistry, Rhodes University Grahamstown, South Africa.
Davidson, R., Scholtz, F., Greenhalgh, P., Riley, R., 1990. Continuous elution of gold
from activated carbon. Randol Gold Forum '90, Squaw Valley Inn, pp.263-267.
Davidson, R., 1974. The mechanism of gold adsorption on activated charcoal. Journal
of the South African Institute of Mining and Metallurgy, vol.75, no.4, pp.67-76.
Davidson, R., Douglas, W., Tumitty, J., 1982. The selection of granular activated carbon
for use in a carbon-in-pulp operation. Australia. Institute of Mining and
Metallurgy. Symp. Carbon-in-Pulp Technology for the Extraction of Gold,
Melbourne, pp. 199- 218.
Davidson, R., Duncanson, D., 1977. The elution of gold from activated carbon using
deionised water. Journal of the South African Institute of Mining and Metallurgy,
vol. 77, no. 12, pp. 254-226.
Davidson, R., Schmidt, C., 1986. A review of the AARL process for the elution of gold
from activated carbon. 13th CMMI Congress, vol. 4, pp. 215-225.
Davidson, R., Vereonese, V.,1979. Further studies on the elution of gold from activated
carbon using water as the eluant. Journal of the South African Institute of Mining
and Metallurgy, vol. 79, no. 15, pp. 437-445.
Deveci, H., Yazıcı, E., Alp, I., Uslu, T., 2006. Removal of cyanide from aqueous
solutions by plain and metal-impregnated granular activated carbons.
International Journal of Mineral Processing, vol. 79 no. 3, pp. 198-208.
Dippenaar, A., Proudfoot, M., 2005. The performance of the AAC pump cell circuits at
the Gold Fields Limited Driefontein and Kloof Operations, Proceedings of the
2005. Randol Innovative Metallurgy Forum.
Dixon, S., Cho, E., Pitt, C., 1976. The interaction between gold cyanide, silver cyanide,
and high surface area charcoal. Fundamental Aspects of Hydrometallurgical
Processes. Conference Proceeding.
Stellenbosch University https://scholar.sun.ac.za
Page 115
Doraiswamy, L.K. and Sharma, M.M., 1984. Heterogeneous reactions: analysis,
examples, and reactor design. John Wiley and Sons, vol.1, pp.538, vol.2,
pp.374
Edmands, H., 1917. The application of charcoal to the precipitation of gold from its
solution in cyanide: Transactions of the Institution of Mining and Metallurgy
vol. 27, pp.1917-1918.
Filmer, A., 1982. The electrowinning of gold from carbon-in-pulp eluates. Carbon-in-
Pulp Technology for the Extraction of Gold, pp. 49-66.
Fleming, C., 1981. Alternative processes to filtration: Carbon-in-pulp and resin-in-pulp in
the metallurgical industry. Hydrometallurgy, vol. 81, pp. 1981.
Fleming, C. (1992). Hydrometallurgy of precious metals recovery. Hydrometallurgy, vol.
30, no. 1, pp. 127-162.
Fleming, C.A., Mezei, A., Bourricaudy, E., Canizares, M., Ashbury M., 2011. Factors
Influencing the Rate of Gold Cyanide Leaching and Adsorption on Activated
Carbon, and their Impact on the Design of CIL and CIP Circuits. Minerals
Engineering, vol. 24, no.6. pp. 484–494
Fleming, C., Nicol, M., 1984. The absorption of gold cyanide onto activated carbon.III.
factors influencing the. Journal of the South African Institute of Mining and
Metallurgy, pp. 85.
Fogler, H. S.,1999. Elements of chemical reaction engineering (3rd Edition) 0-13-
531708-8
Free, M. L. (2013). Hydrometallurgy: Fundamentals and applications John Wiley and
Sons.
Garten, V., Weiss, D., Willis, J., 1957. A new interpretation of the acidic and basic
structures in carbons. I. lactone groups of the ordinary and fluorescein types in
carbons. Australia Journal of Chemistry, vol. 10, no. 3, pp. 295-308.
Stellenbosch University https://scholar.sun.ac.za

Page 116
Gavin, H., Monhemius, A., 2006. Alternatives to cyanide in the gold mining industry:
what prospects for the future? Journal of Cleaner Production, vol. 14, no.12-13,
pp.1158-1167.
Gray, D. E.,1999. A Quantitative Study into Carbon-in-Pulp Adsorption Operations, MSc
Thesis, Department of Chemical Engineering, Cape Technikon.
Green, B., 1996. Glossary of terms in quantities and units in Clinical Chemistry
(2nd edition) . pp.50. Available online: http://goldbook.iupac.org/I03180.html
Accessed on 15th September 2015.
Green, M., 1913. The effect of charcoal in gold-bearing cyanide solutions with reference
to the precipitation of gold. Transactions of the Institution of Mining and
Metallurgy, vol.23, pp.1913-1914.
Gross, J., Scott, J.W., 1927. Precipitation of gold and silver from cyanide solution on
Charcoal, US Bureau of Mines, Technical Paper No. 378
Groudev, S., Spasova, I., Ivanov, I, 1996. Two-stage microbial leaching of a refractory
gold-bearing pyrite ore. Minerals Engineering, vol. 9, no. 7, pp. 707-713.
Habashi, F., 2005. A short history of hydrometallurgy. Hydrometallurgy, vol.79, no.1,
pp.15-22.
Hála, J., 2004. IUPAC-NIST solubility data series. 79 Alkali and alkaline earth metal
pseudohalides. Journal of Physical and Chemical Reference Data, vol. 33, no. 1,
pp. 1-176.
Hemrajani, R. R., Tatterson, G. B., 2004. Mechanically stirred vessels. Handbook of
Industrial Mixing: Science and Practice, pp. 345-390.
Hill, C. G., Root, T. W., 2014. Introduction to chemical engineering kinetics and reactor
design John Wiley and Sons.
Ibrado, A., Fuerstenau, D., 1992. Effect of the structure of carbon adsorbents on the
adsorption of gold cyanide. Hydrometallurgy, vol.30, no.1, pp. 243-256.
Stellenbosch University https://scholar.sun.ac.za

Page 117
Ibrado, A., Fuerstenau, D., 1995. Infrared and X-ray photoelectron spectroscopy studies
on the adsorption of gold cyanide on activated carbon. Minerals Engineering, vol.
8, no. 4, pp. 441-458.
International cyanide management code for gold mining industry. Available online:
http://www.cyanidecode.org/cyanide-facts/cyanide-chemistry. Accessed: 12
April 2015
ISU, 2014. How many data points are enough?
(http://www2.phy.ilstu.edu/~wenning/slh/How_Many_Data_Points.pdf.
Accessed 11 Nov 2015
Jeffrey, M., Pleysier, R., Bunney, K., 2009. Elution behaviour of metals from carbon.
Hydrometallurgy Conference, pp. 475-483.
Jia, Y. F., 2000. Adsorption of heavy metal ion species from aqueous solution in
activated carbon. PhD Thesis. University of Newcastle-upon-Tyne
Jones, W., Klauber, C., Linge, H., 1989. The adsorption chemistry of gold (I) dicyanide
on activated carbon. Extended Abstracts and Program, 19th Biennial Conference
on Carbon, Pennsylvania State University, University Park, pp. 38-39.
José, R. P., Guillermo, T.M., Jesús, L.V., Victor, V.V., Gregorio, G.Z., 2013. Copper
recovery from barren solutionby using electroagulation iron process. Advances in
Chemical Engineering and Sciences, Vol 3, pp. 150-156.
Klauber, C., 2004. pH dependence of the Au-CN species adsorbed onto activated
Carbon—Comments. Hyperfine Interactions, vol. 155, no. 1-4, pp. 65-70.
Klauber, C., 1991. X-ray photoelectron spectroscopic study of the adsorption
mechanism of aurocyanide onto activated carbon. Langmuir, vol. 7, no. 10, pp
2153-2159.
Kongolo, K., Bahr, A., Friedl, J., Wagner, F., 1990. 197 au mössbauer study of the gold
species adsorbed on carbon from cyanide solutions. Metallurgical Transactions
B, vol. 21, no. 2, pp. 239-249.
Stellenbosch University https://scholar.sun.ac.za

Page 118
Kuzminykh, V., Tyurin, N., 1968. Effect of the acidity of the cyanide solution on the
adsorption of gold on carbon. Izv. Vyssh. Ucheb. Zaved. Tsved. Metall., vol. 11,
no. 4, pp. 65-70,
La Brooy, S., Linge, H., Walker, G., 1994. Review of gold extraction from ores. Minerals
Engineering, vol. 7, no. 10, pp. 1213-1241.
Laxen, P., Becker, G., Rubin, R., 1979. Developments in the application of carbon-in-
pulp to the recovery of gold from South African. Journal of the South African
Institute of Mining and Metallurgy, pp. 315.
Laxen, P., Fleming, C., Holtum, D., Rubin, R., 1982. A review of pilot-plant testwork
conducted on the carbon-in-pulp process for the recovery of gold, Proceedings
Twelfth CMMI Congress 1982, South African Institute of Mining and Metallurgy,
Johannesburg.
Laxen, P. A., 1984. Carbon-in-pulp processes in South Africa. Hydrometallurgy, vol. 13,
no. 2, pp.169-192.
Liebenberg, S., Deventer, J. V., 1997. Evaluating a dynamic model for the competitive
elution of gold and base metals from activated carbon. Separation Science and
Technology, vol. 32, no.11, pp. 1787-1804.
Lima, L., 2007. Dynamic simulation of the carbon-in-pulp and carbon-in-leach
processes. Brazilian Journal of Chemical Engineering, vol.24, no.4, pp.623-635.
Locke, W., 1996–1997. Introduction to molecular orbital theory. ICSTM department of
chemistry. Available online: http://www.ch.ic.ac.uk/vchemlib/course/mo_theory/
Accessed. 19 Aug. 2015.
Mahapatra, A., 2009. Characterisation of-activated carbon and the effect of organic
fouling on gold adsorption by activated carbon, MSc Thesis, Department of
Metallurgical Engineering, The University of Utah.
Manual, S.E., 2004. Statsoft, Inc. Statistica (data analysis software system), version 7.
Stellenbosch University https://scholar.sun.ac.za
Page 119
Marsden, J.O., House, I.C., 2006. The Chemistry of Gold Extraction (2nd edition). The
Society of Mining, Metallurgy, and Exploration, Inc.
Marsh, H., Reinoso, F. R., 2006. Activated carbon. (2nd Edition). Elsevier.
McDougall, G., 1991. The physical nature and manufacture of activated carbon. Journal
of the South African Institute of Mining and Metallurgy, vol.91, no.4, pp.109-120.
McDougall, G., Fleming, C., 1987. In ion exchange and sorption processin
hydrometallurgy. Society of chemistry and industry. Wiley, Chichester, pp. 56-
126.
McDougall, G., Hancock, R., Nicol, M., Wellington, O., Copperthwaite, R., 1980. The
mechanism of the adsorption of gold cyanide on activated carbon. Journal of the
South African Institute of Mining and Metallurgy, vol.80, no.9, pp.344-356.
McDougall, G. J., Hancock, R. D. (1981). Gold complexes and activated carbon. Gold
Bulletin, vol.14, no.4, pp.138-153.
McGrath, A., Cashion, J., Brown, L., Hall, J., 2002. PH dependence of the Au-CN
species adsorbed onto activated carbon. Industrial applications of the
mössbauer effect. Springer pp. 471-477,
McKay, G., Poots, V. J., 1980. Kinetics and diffusion processes in colour removal from
effluent using wood as an adsorbent. Journal of Chemical Technology and
Biotechnology, vol.30, no.1, pp.279-292.
McMurry, J., 1998. Fundamentals of organic chemistry (4th Edition). Library of
Congress. Cataloging-in-Publication Data.
Menne, D. M., (1991). The adsorption and desorption of aurocyanide from activated
carbon Extractive Metallurgy conference (October 2-4), pp.165-174
Menon, S. (2004). Piping calculations manual (1st Edition) McGraw Hill Professional.
Metalliferous mining – processing, 2010 a. Leaching and adsorption resource book.
Available online: https://rsteyn.files.wordpress.com/2010/07/leaching-adsorption-
basics and example.pdf Accessed: 8 July 2015.
Stellenbosch University https://scholar.sun.ac.za
Page 120
Metalliferous mining – processing, 2010 b. Elution and carbon reactivation resource
book. Available online: https://rsteyn.files.wordpress.com/2010/07/elution-and-
carbon-reactivation-basics.pdf: Accessed: 8 July 2015.
Montgomery, D. C., 2013. Design and analysis of experiments (8th Edition) John Wiley
and Sons.
Moreno-Castilla, C., 2004. Adsorption of organic molecules from aqueous solutions on
carbon materials. Carbon, vol.42, no.1, pp.83-94.
Mt Todd, 2013. Mt todd gold mine. http://www.mttodd.com.au/gold-mining-process.html.
Accessed 7 July 2014
Muir, D., Aziz, M., Hoecker, W., 1988. Cyanide losses under CIP conditions and effect
of carbon on cyanide oxidation. Proceeding of first International Conference of
Hydrometallurgy, International Academic Publishers, Beijing, China, pp.461–465
Mpinga, C.N., 2012. The extraction of precious metals from alkaline cyanided medium
by granular activated carbon. MSc Thesis, Department of Process Engineering,
Stellenbosch University, South Africa.
Nicol, M., 1986. "Elution theory," lecture 14 in C.I.P school lecture notes. South
African Institute of Mining and Metallurgy, South Africa,
NIST, 2013a. National institute of standards and technology database 101. Cccbdb.
Comparison of Koopmans' theorem (HOMO energy approximates ionsation
energy). Available online: http://cccbdb.nist.gov/koopman1.asp Accessed: 7 July
2015.
NIST, 2013b. National institute of standards and technology database 101. Cccbdb.
Calculated adiabatic ionisation energies. Available online :
http://cccbdb.nist.gov/ie1.asp Accessed: 12 April 2015.
Nsimba, E. B., 2009. Cyanide and Cyanide Complexes in the Goldmine Polluted Land
in the East and Central Rand Goldfields. MSc Thesis, Faculty of Science,
University of the Witwatersrand, Johannesburg, South Africa,
Stellenbosch University https://scholar.sun.ac.za

Page 121
Paul, E.L., Atiemo-Obeng V., Kresta, S.M., 2004. Handbook of industrial mixing.
Science and Practice. John Wiley Sons.
Pavan, F. A., Gushikem, Y., Mazzocato, A. C., Dias, S. L., Lima, E. C., 2007. Statistical
design of experiments as a tool for optimising the batch conditions to methylene
blue biosorption on yellow passion fruit and mandarin peels. Dyes and Pigments,
vol.72, no.2, pp.256-266.
Petersen, F.W., Van Deventer, J.S.J., 1991. The influence of pH, dissolved oxygen and
organics on the adsorption of metal cyanides on activated carbon. Chemical
Engineering Science, vol 46, no 12, pp 3053-3065.
Poinern, G.E.J., Senanayake, G., Shah, N., Thi-le, X.N., Parkinson, G.M. and Fawcett,
D., 2011. Adsorption of the aurocyanide, complex on granular activated carbons
derived from macadamia nut shells–A preliminary study. Minerals Engineering,
vol. 24, no. 15, pp. 1694-1702.
Prasad, M., Mensah-Biney, R., Pizarro, R., 1991. Modern trends in gold processing
Overview. Mineral Engineering, vol.4, no.12, pp. 1257-1277.
Ricca, B., D’Amore, G., 1949. The decomposition of alkali cyanide in aqeous solution.
Gazz. Chim. Italy, vol. 79, pp. 308- 317.
Riley, R. P., 1991. Continuous elution. School: Recent Developments in in-Pulp
Technology. The South African Institute of Mining and Metallurgy, pp. 1–32, (7–8
October).
Rogans, J., McArthur†, D., 2002. The evaluation of the AAC Pump-Cell circuits at
Anglogold’s West Wits operations, vol. 102, no. 4, pp. 181-188.
Sağ, Y., Aktay, Y., 2000. Mass transfer and equilibrium studies for the sorption of
chromium ions onto chitin. Process Biochemistry, vol.36, no.1, pp.157-173.
Schoeman, E., Bradshaw, S.M., Akdogan, G. and Eksteen, J.J., 2012. The recovery of
platinum, palladium and gold from a cyanide heap leaches solution, with the use
of ion exchange resins. Proceedings of The South African Institute of Mining and
Metallurgy, Platinum 2012, Johannesburg, South Africa
Stellenbosch University https://scholar.sun.ac.za

Page 122
Sheridan, M., Nagaraj, D., Fornasiero, D., Ralston, J., 2002. The use of a factorial
experimental design to study collector properties of N-allyl-O-alkyl
thionocarbamate collector in the flotation of a copper ore. Minerals Engineering,
vol.15, no.5, pp.333-340.
Snyders, C.A., Mpinga, C.N., Bradshaw, S.M., Akdogan, G. and Eksteen, J.J., 2015.
Determination of the equilibrium and film diffusion constants of the platinum
cyanide anions during elution from activated carbon. Mineral Engineering, vol.
80, pp. 57-68
Snyders, C.A., Mpinga, C.N., Bradshaw, S.M., Akdogan, G. and Eksteen, J.J., 2013.
The application of activated carbon for the adsorption and elution of platinum
group metals from dilute cyanide leach solutions. Journal of the South African
Institute of Mining and Metallurgy, vol.113, no. 5, pp. 381 - 388.
Solomon, G., 1992. Organic chemistry (5th Edition). John Wiley and Sons, Inc.
Stange, W., 1991. The optimisation of the CIP process using mathematical and
economic models. Minerals Engineering, vol.4, no.12, pp.1279-1295.
Stange, W., 1999. The process design of gold leaching and carbon-in-pulp circuits.
Journal of the South African Institute of Mining and Metallurgy, South Africa, vol.
99, no. 1, pp.13-25.
Stanley, G. (1987). The extractive metallurgy of gold in South Africa. South African
Institute of Mining and Metallurgy, vol.2.
Staunton, W. P. (2005). Carbon-in-pulp. Developments in Mineral Processing, no.15,
pp.562-587.
Stavropoulos, G., Skodras, G., Papadimitriou, K., 2015. Effect of solution chemistry on
cyanide adsorption in activated carbon. Applied Thermal Engineering, vol.74,
pp.182-185.
Tsuchida, N., Ruane, M., Muir, D., 1984. Studies on the mechanism of gold adsorption
on carbon. Mintek 50: International Conference on Mineral Science and
Technology, pp. 647-656.
Stellenbosch University https://scholar.sun.ac.za

Page 123
Ur energy, 2013. Available online: http://www.ur-energy.com/2013-news-releases/ur-
energy-provides-photos-of-lost-creek-isr-project-construc.html. Accessed on 8
Nov 2015
Van der Merwe, P., Van Deventer, J., 1988. The influence of oxygen on the adsorption
of metal cyanides on activated carbon. Chemical Engineering Communications,
vol. 65, no.1, pp.121-138.
Van der Merwe, P.F., 1991. Fundamentals of the elution of gold from activated carbon.
PhD Thesis, Department of Process Engineering, Stellenbosch University, South
Africa.
Van Deventer, J.S., 1984. Kinetic model for the adsorption of metal cyanides on
activated charcoal. PhD Thesis, University of Stellenbosch, South Africa.
Van Deventer, J., Liebenberg, S., 2003. The role of cyanide in the multi-component
elution of cyanide complexes from activated carbon. The European Journal of
Mineral Processing and Environmental Protection, vol.3, no.3, pp. 261-269.
Van Deventer, J., 1993. The reversibility of adsorption of gold cyanide on activated
carbon. Metallurgical Transactions B, vol. 24, no. 3, pp. 433-440.
Van Deventer, J., 1994. The mechanism of elution of gold cyanide from activated
carbon. Metallurgical and Materials Transactions B, vol. 25, no. 6, pp. 829-838.
Van Deventer, J., Liebenberg, S., Lorenzen, L., Aldrich, C., 1995. Dynamic modelling of
competitive elution of activated carbon in columns using neural networks.
Minerals Engineering, vol. 8, no. 12, pp. 1489-1501.
Van Deventer, J., Van der Merwe, P., 1995. Kinetic model for the decomposition of
cyanide during the elution of gold from activated carbon. Separation Science and
Technology, vol. 30, no. 6, pp. 883-898.
Van Deventer, J., Van der Merwe, P., 1993. The effect of temperature on the desorption
of gold cyanide from activated carbon. Thermochmica Acta, vol. 221, no.1,
pp.99-113.
Stellenbosch University https://scholar.sun.ac.za
Page 124
Van Deventer, J., Van der Merwe, P., 1994. Factors affecting the elution of gold
cyanide from activated carbon. Minerals Engineering, vol. 7, no.1, pp. 71-86.
Van Deventer, J., Van der Merwe, P., Lorenzen, L. (1992). The role of cyanide in the
elution of gold from activated carbon. International Conference on Extractive
Metallurgy of Gold and Base Metals, Australia Institute of Mining and Metallurgy,
Parkville, Vic., Australia, pp.129-135.
Van Nguyen, N., Lee, J., Kim, S., Jha, M.K., Chung, K., Jeong, J., 2010. Adsorption of
gold (III) from waste rinse water of semiconductor manufacturing industries using
Amberlite XAD-7HP resin. Gold Bulletin, vol. 43, no.3, pp. 200-208.
Vorob’ev-Desyatovskii, N.V, Ibragimova, R.I., Kubyshkin, S.A., Yakovleva, O.A. 2010.
The thermal behaviour of Na[Au(CN)2] and the Gold(I) dicyanaurate
complex adsorbed on the activated carbon surface Russian Journal of
General Chemistry, vol.80, no.11, pp. 2225–2230
Weber, W., Mathews, A., 1976. Effects of external mass transfer and intraparticle
diffusion on adsorption rates in slurry reactors. AAAIChE. Symp. Ser. Water,
vol.73, pp. 91-98.
Woollacot, L.C, Nino de Guzman, G, 1993. The combined influence of oxygen and
cyanide on adsorption isotherms in carbon-based gold extraction systems,
Minerals Engineering, vol. 6, no. 3, pp. 251-265.
Wong, C., Barford, J. P., Chen, G., McKay, G., 2014. Kinetics and equilibrium studies
for the removal of cadmium ions by ion exchange resin. Journal of
Environmental Chemical Engineering, vol. 2, no.1, pp. 698-707.
Yalcin, M., Arol, A. I., 2002. Gold cyanide adsorption characteristics of activated carbon
of non-coconut shell origin. Hydrometallurgy, vol. 63, no. 2, pp. 201-206.
Yannopoulos, J. C., 1991. The extractive metallurgy of gold. Van Nostrand Reinhold.
Zadra, J.B., Engel, A.K., Heinen H.J., 1950. A Process for Recovery of Gold from
Activated Carbon by Leaching and Electrolysis. US Bur. Mines. Rep.Invest. no.
4672
Stellenbosch University https://scholar.sun.ac.za

Page 125
Appendix A: Experimental steps, risks and precautions
Adsorption
S/N Step Risk Precaution(s)
1 Prepare the fresh activated carbon for use:
· Weigh 840g of fresh AC
· Pour in 10liter bucket and rinse with deionised water for 20min
· Pour the water off through sieve and oven dry at 80oC for 24 hours
Stain, Burn, Use rubber gloves, safety glass.
2 Measure 34 litres of buffer solution mixed with 1.5 litres of 200ppm gold solution to dilute to approximate concentration of 9ppm and maintained at pH of 9.5
Spillage which might lead to slipping,
Careful pouring of the buffer solution, Clean immediately in any event of spillage, use rubber gloves
3 Pour 420g of the already oven dried AC into the bottle containing 15 litres of the solution prepared in (2) and with the appropriate lid. ensure that there is no leakage
------------- ----------------
4 Repeat step 2-3 for another water dispensing bottle
Same as above(2 and 3)
Same as above (2 and 3)
5 Place the bottle in the electrical powered roller and switch on the roller for 48hours to achieve pseudo-equilibrium
Electric shock, improper adsorption through mis-alignment on the roller
Avoid naked cables; ensure bottles are well placed on the roller, regular checking of the roller.
6 After 48 hours, switch off the roller and take sample of the liquid with filter-syringe for ICP-MS analysis
electric shock Avoid naked cables and use rubber gloves
7 Decant close to 5 litres of the liquid in a container to rinse the wetted carbon stocked inside the bottle. Pour the AC through a filter paper and use the liquid for rinsing
Stain Use rubber gloves
8 Place the AC in the oven set at 80oC for 24hours to dry off the moisture
Burn Use rubber glove, eye goggle.
Stellenbosch University https://scholar.sun.ac.za

Page 126
9 Use rotary divider (splitter) to thoroughly mix the AC and divide i. Keep each 12g in a small zip-lock for the pre-treatment and elution process.
Pre-treatment
S/N Step Risk Precaution
1 Prepare NaOH-NaCN solution (3%
NaCN and 1%NaOH) at correct
temperature
Contamination
through splash,
inhalation, spillage
and death
Put on PPE and
cyanide detector. call
for emergency in
case of excessive
spillage, work in the
fume cupboard
2 Keep the unused NaOH-NaCN
solution in a locked cupboard and
the quantity to be used in the fume-
hood
Contamination and
inhalation
Put on PPE,
Respirator, work in
the fume cupboard
4 Place the beaker in the water bath
and insert the temperature, pH and
Eh probes
Contamination
Burn (90oC)
Careful insertion,
PPE
5 Carefully pour 12g of the adsorbed
activated into the beaker and gently
lower the stirrer into the beaker.
Ensure the stirrer is not sitting on
any carbon particle to warrant free-
stirring
Splash, burn Safety goggle and
rubber gloves in use.
7 Set the over-head stirrer to the
required speed as defined by the
Reynolds number and switch it on
for the required time as per
experimental plan. Monitor the
temperature, pH and Eh probes.
Take values of pH and Eh every 3
minutes to check for any changes.
Dis-organisation of
the set up and
breakage of beaker
possibly leading to
splash, spillage and
contamination
Ensure that the over-
head stirrer is well
fastened to the retort
stand, avoid contact
of the stirring blade
with the wall of the
beaker. Use safety
googles and gloves
Stellenbosch University https://scholar.sun.ac.za

Page 127
8 After the time is reached, switch off
the stirrer, remove the probes and
clean them with paper tissue, return
the pH and Eh probes into its
respective buffers.
Contamination of the
buffer
Wash and Clean
probes after use
9 Carefully remove lid and the stirrer
and then take samples of the
solution with filter- syringe.
Burn and
contamination
Use rubber gloves,
safety goggle, and
manual single
channel volume
pipette
10 Carefully pour the pretreated
solution into the liquid waste
container while the remaining wet
carbon is poured in a paper towel to
drain the remaining liquid
Burn, contamination,
spillage,
Maintaining focus,
clean with paper
tower, safety goggle
and gloves.
Elution
S/N Steps Risk Precaution
1 Clean the glass column with
acetone and blow air through. Also
wash the water bath thoroughly with
water to prevent contamination of
the eluant
Spillage in the eye.
Contamination of the
column with acetone
Use safety goggle.
Rinse the column
thoroughly with
water after washing
with acetone
2 Set up the temperature controlled
water-bath together with glass
column connected to pipes and
peristaltic pump
Breakage of column
and possibly piercing
and injury. spillage
Careful handling of
the column while
connecting and
disconnecting the
pipes. Paper towel in
place
3 Ensure the water is flowing in and
out of the jacket of the glass column
till 90oC temperature is reached
Burn Use rubber gloves
Stellenbosch University https://scholar.sun.ac.za
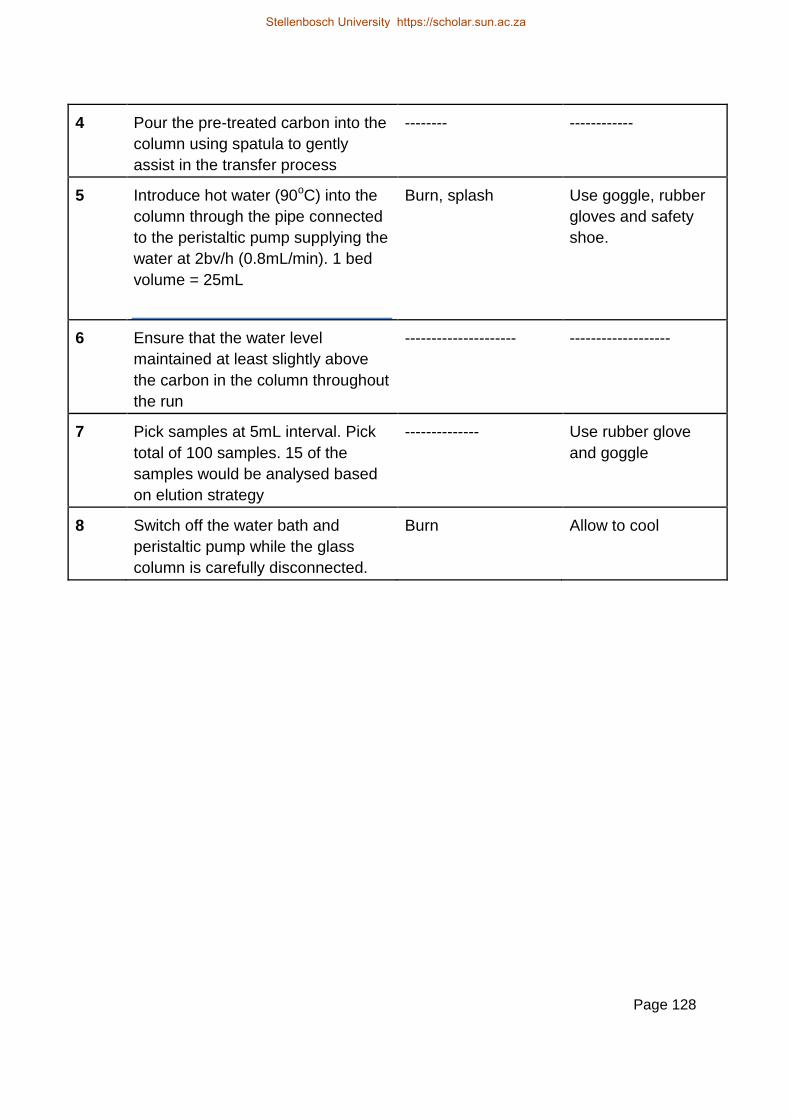
Page 128
4 Pour the pre-treated carbon into the
column using spatula to gently
assist in the transfer process
-------- ------------
5 Introduce hot water (90oC) into the
column through the pipe connected
to the peristaltic pump supplying the
water at 2bv/h (0.8mL/min). 1 bed
volume = 25mL
Burn, splash Use goggle, rubber
gloves and safety
shoe.
6 Ensure that the water level
maintained at least slightly above
the carbon in the column throughout
the run
--------------------- -------------------
7 Pick samples at 5mL interval. Pick
total of 100 samples. 15 of the
samples would be analysed based
on elution strategy
-------------- Use rubber glove
and goggle
8 Switch off the water bath and
peristaltic pump while the glass
column is carefully disconnected.
Burn Allow to cool
Stellenbosch University https://scholar.sun.ac.za
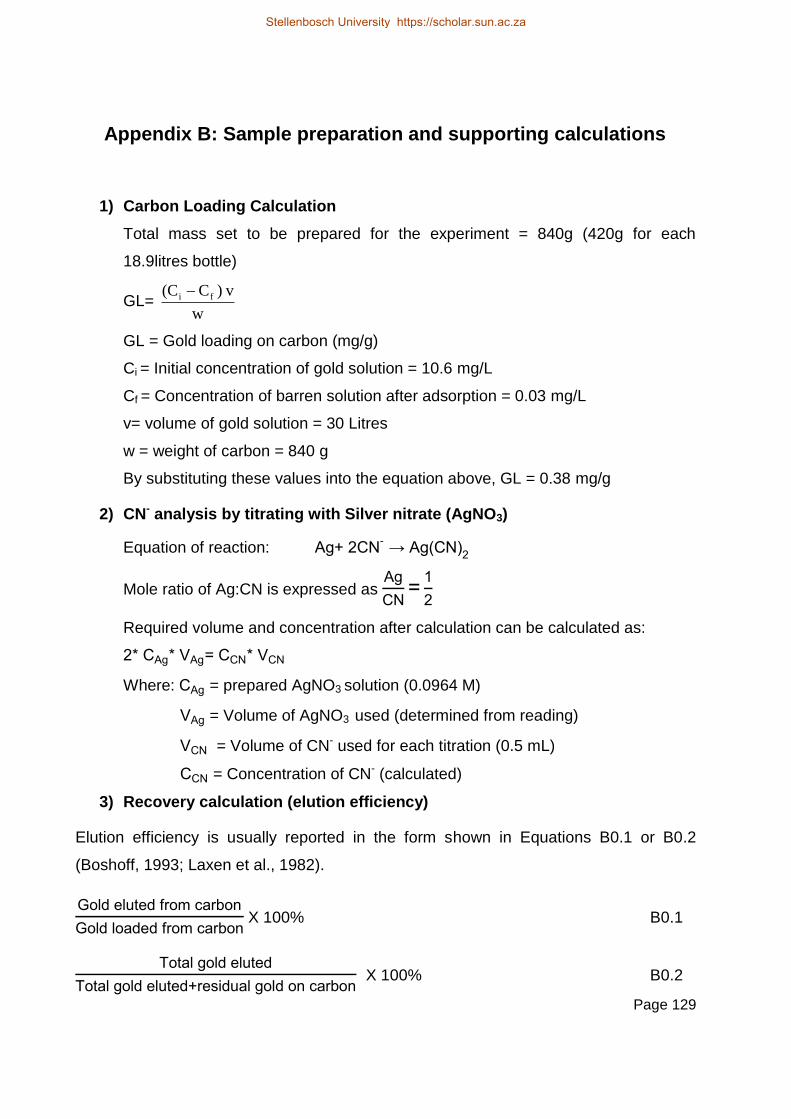
Page 129
Appendix B: Sample preparation and supporting calculations
1) Carbon Loading Calculation
Total mass set to be prepared for the experiment = 840g (420g for each
18.9litres bottle)
GL= w
v)C(C fi
GL = Gold loading on carbon (mg/g)
Ci = Initial concentration of gold solution = 10.6 mg/L
Cf = Concentration of barren solution after adsorption = 0.03 mg/L
v= volume of gold solution = 30 Litres
w = weight of carbon = 840 g
By substituting these values into the equation above, GL = 0.38 mg/g
2) CN- analysis by titrating with Silver nitrate (AgNO3)
Equation of reaction: Ag+ 2CN- → Ag(CN)
2
Mole ratio of Ag:CN is expressed as Ag
CN=
1
2
Required volume and concentration after calculation can be calculated as:
2* CAg* VAg= CCN* VCN
Where: CAg = prepared AgNO3 solution (0.0964 M)
VAg = Volume of AgNO3 used (determined from reading)
VCN = Volume of CN- used for each titration (0.5 mL)
CCN = Concentration of CN- (calculated)
3) Recovery calculation (elution efficiency)
Elution efficiency is usually reported in the form shown in Equations B0.1 or B0.2
(Boshoff, 1993; Laxen et al., 1982).
Gold eluted from carbon
Gold loaded from carbon X 100% B0.1
Total gold eluted
Total gold eluted+residual gold on carbon X 100% B0.2
Stellenbosch University https://scholar.sun.ac.za

Page 130
It is being suggested that these equations will be easily applicable when the history
(amount) of loading of gold on AC is known while an unkown parameter can be
calculated through gold mass balance. In a case where the amount of gold remained on
carbon is not fully acertain as in Section 5.7, the elution efficieny was calculated based
on the maximum gold assay eluted of different elution results of the same set of carbon
originating from the same loading conditions. For instance if carbon A originating from
the same loading condition is pre-treated and eluted at different conditions resulting in
different elution results, the elution efficiency was calculated using B0.3.
Cummlative gold eluted from carbon
Maximum cummlative gold eluted X 100% B0.3
This study adopts Equation 4.7 for the calculation of elution efficiency.
The steps taken to calculate the cumulative gold eluted are shown below. A simple
illustration of these steps are shown at pre-treatment conditions of 25oC, 45 mins and
600 rev/min. Maximum cumulative gold eluted was found at 80oC, 0 rev/min and 30
mins with total mass of 178.51 mg.
Step1
Gold and sodium analysis received from ICP analysis were tabulated on excel sheet as
shown below.
Figure B 1: Step 1. Excel tabulation of ICP analysis of Au and Na
Stellenbosch University https://scholar.sun.ac.za

Page 131
Step 2
Mass of gold eluted at each bed volume was calculated by finding the area under curve.
This was done by calculating the average concentration and multiplying it by the volume
(BV). For instance, the mass of gold eluted at 0.2 and 0.6 bed volume were calculated
as follows:
At 0.2 BV, mass eluted (mg) = (B6+B5)/2*(A6-A5)
At 0.6 BV, mass eluted (mg) = (B7+B6)/2*(A7-A6)
This is done up to 20 BVs. Results obtained are shown in the figure below.
Figure B 2: Step 2. Calcualtion of mass of Au in mg
Step 3
The cummulatve mass was calculated and the percentage of gold elution recovery at
each bed volume was calculated using Equation B0.3. The results generated are shown
below
Stellenbosch University https://scholar.sun.ac.za

Page 132
Figure B 3: Step 3. Au recovery calculation
Stellenbosch University https://scholar.sun.ac.za

Page 133
Appendix C: Results of experimental anaysis
Results presented here are the raw data from ICP_MS analysis of Au and Sodium
concentration for the elution result. The replicate of each condition are presented
together in the same table as shown below. Concentration of free cyanide used for the
kinetic study that was generated through titration is also presented.
Table C. 1. ICP result for pre-treatment condition at 25oC, 600rpm, 45 minutes
Bed volumes Run 33
Run 18
Run3
Au (mg/L) Na (mg/L) Au (mg/L) Na (mg/L) Au (mg/L) Na (mg/L)
0.20 1.501 6393 1.241 1.380 6904
0.60 1.710 8332 1.637 1.830 9843
1.0 5.142 2765 6.413 5.931 3204
1.4 10.72 1159 12.73 14.21 1112
2.0 17.61 640.1 19.71 23.08 547.2
2.4 20.84 491.1 22.34 26.65 382.6
3.0 24.37 395.4 25.90 30.34 295.7
3.6 27.26 285.0 22.79 30.47 235.2
4.0 26.64 262.1 20.65 28.50 211.1
4.6 25.37 234.2 17.38 25.21 190.1
6.0 16.10 159.2 10.45 16.89 136.2
9. 7.140 109.0 3.902 12.15 107.1
11 4.590 88.08 2.083 6.380 97.44
15 1.890 66.34 1.288 2.030 55.13
20 0.7200 51.50 0.2955 0.7200 57.25
Stellenbosch University https://scholar.sun.ac.za
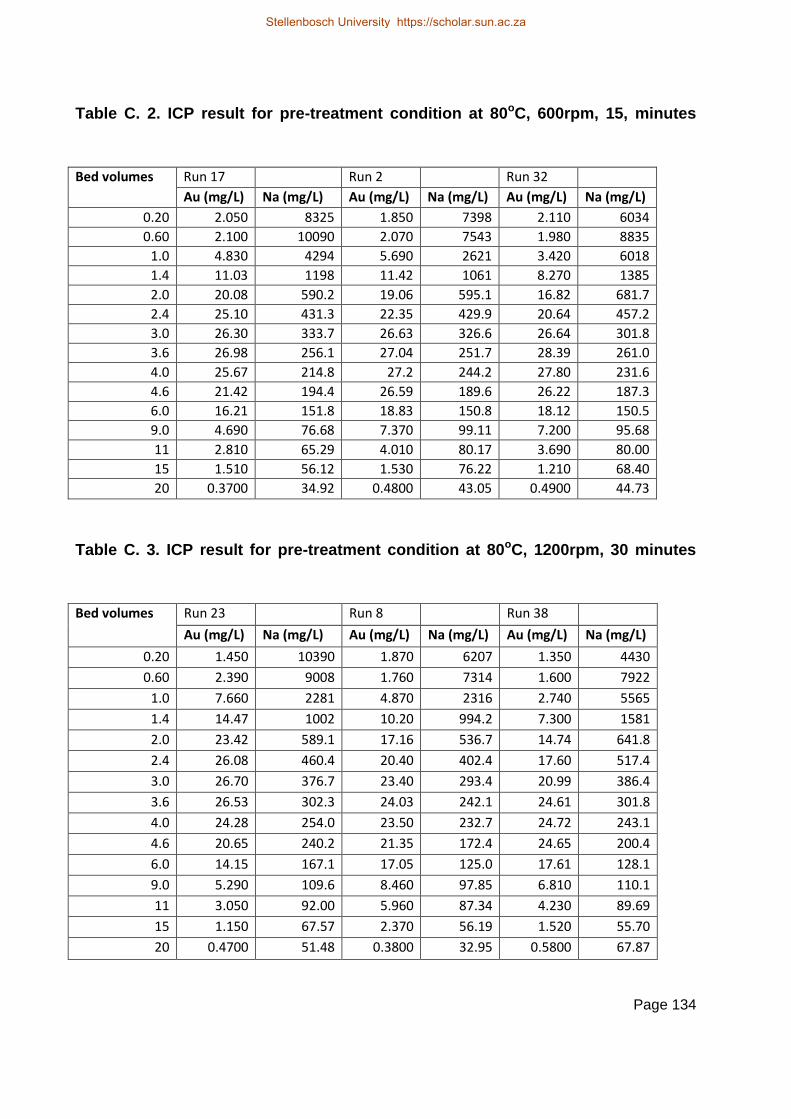
Page 134
Table C. 2. ICP result for pre-treatment condition at 80oC, 600rpm, 15, minutes
Bed volumes Run 17 Run 2 Run 32
Au (mg/L) Na (mg/L) Au (mg/L) Na (mg/L) Au (mg/L) Na (mg/L)
0.20 2.050 8325 1.850 7398 2.110 6034
0.60 2.100 10090 2.070 7543 1.980 8835
1.0 4.830 4294 5.690 2621 3.420 6018
1.4 11.03 1198 11.42 1061 8.270 1385
2.0 20.08 590.2 19.06 595.1 16.82 681.7
2.4 25.10 431.3 22.35 429.9 20.64 457.2
3.0 26.30 333.7 26.63 326.6 26.64 301.8
3.6 26.98 256.1 27.04 251.7 28.39 261.0
4.0 25.67 214.8 27.2 244.2 27.80 231.6
4.6 21.42 194.4 26.59 189.6 26.22 187.3
6.0 16.21 151.8 18.83 150.8 18.12 150.5
9.0 4.690 76.68 7.370 99.11 7.200 95.68
11 2.810 65.29 4.010 80.17 3.690 80.00
15 1.510 56.12 1.530 76.22 1.210 68.40
20 0.3700 34.92 0.4800 43.05 0.4900 44.73
Table C. 3. ICP result for pre-treatment condition at 80oC, 1200rpm, 30 minutes
Bed volumes Run 23 Run 8 Run 38
Au (mg/L) Na (mg/L) Au (mg/L) Na (mg/L) Au (mg/L) Na (mg/L)
0.20 1.450 10390 1.870 6207 1.350 4430
0.60 2.390 9008 1.760 7314 1.600 7922
1.0 7.660 2281 4.870 2316 2.740 5565
1.4 14.47 1002 10.20 994.2 7.300 1581
2.0 23.42 589.1 17.16 536.7 14.74 641.8
2.4 26.08 460.4 20.40 402.4 17.60 517.4
3.0 26.70 376.7 23.40 293.4 20.99 386.4
3.6 26.53 302.3 24.03 242.1 24.61 301.8
4.0 24.28 254.0 23.50 232.7 24.72 243.1
4.6 20.65 240.2 21.35 172.4 24.65 200.4
6.0 14.15 167.1 17.05 125.0 17.61 128.1
9.0 5.290 109.6 8.460 97.85 6.810 110.1
11 3.050 92.00 5.960 87.34 4.230 89.69
15 1.150 67.57 2.370 56.19 1.520 55.70
20 0.4700 51.48 0.3800 32.95 0.5800 67.87
Stellenbosch University https://scholar.sun.ac.za
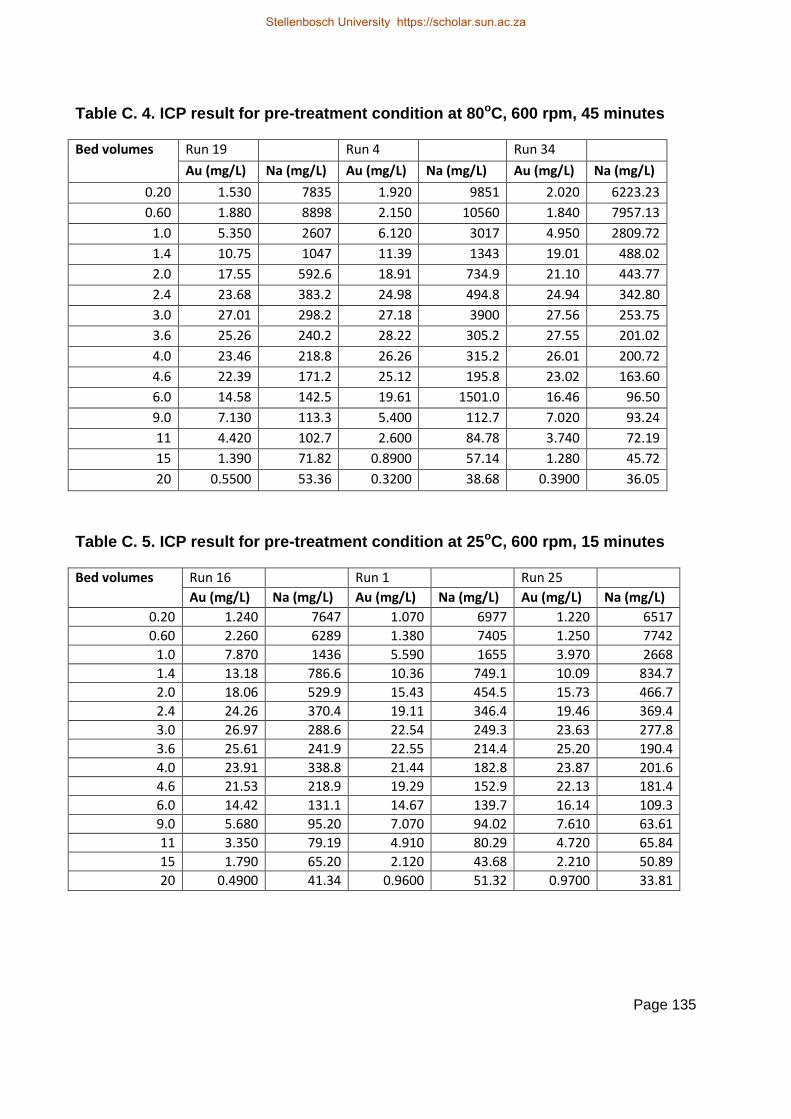
Page 135
Table C. 4. ICP result for pre-treatment condition at 80oC, 600 rpm, 45 minutes
Bed volumes Run 19 Run 4 Run 34
Au (mg/L) Na (mg/L) Au (mg/L) Na (mg/L) Au (mg/L) Na (mg/L)
0.20 1.530 7835 1.920 9851 2.020 6223.23
0.60 1.880 8898 2.150 10560 1.840 7957.13
1.0 5.350 2607 6.120 3017 4.950 2809.72
1.4 10.75 1047 11.39 1343 19.01 488.02
2.0 17.55 592.6 18.91 734.9 21.10 443.77
2.4 23.68 383.2 24.98 494.8 24.94 342.80
3.0 27.01 298.2 27.18 3900 27.56 253.75
3.6 25.26 240.2 28.22 305.2 27.55 201.02
4.0 23.46 218.8 26.26 315.2 26.01 200.72
4.6 22.39 171.2 25.12 195.8 23.02 163.60
6.0 14.58 142.5 19.61 1501.0 16.46 96.50
9.0 7.130 113.3 5.400 112.7 7.020 93.24
11 4.420 102.7 2.600 84.78 3.740 72.19
15 1.390 71.82 0.8900 57.14 1.280 45.72
20 0.5500 53.36 0.3200 38.68 0.3900 36.05
Table C. 5. ICP result for pre-treatment condition at 25oC, 600 rpm, 15 minutes
Bed volumes Run 16 Run 1 Run 25
Au (mg/L) Na (mg/L) Au (mg/L) Na (mg/L) Au (mg/L) Na (mg/L)
0.20 1.240 7647 1.070 6977 1.220 6517
0.60 2.260 6289 1.380 7405 1.250 7742
1.0 7.870 1436 5.590 1655 3.970 2668
1.4 13.18 786.6 10.36 749.1 10.09 834.7
2.0 18.06 529.9 15.43 454.5 15.73 466.7
2.4 24.26 370.4 19.11 346.4 19.46 369.4
3.0 26.97 288.6 22.54 249.3 23.63 277.8
3.6 25.61 241.9 22.55 214.4 25.20 190.4
4.0 23.91 338.8 21.44 182.8 23.87 201.6
4.6 21.53 218.9 19.29 152.9 22.13 181.4
6.0 14.42 131.1 14.67 139.7 16.14 109.3
9.0 5.680 95.20 7.070 94.02 7.610 63.61
11 3.350 79.19 4.910 80.29 4.720 65.84
15 1.790 65.20 2.120 43.68 2.210 50.89
20 0.4900 41.34 0.9600 51.32 0.9700 33.81
Stellenbosch University https://scholar.sun.ac.za

Page 136
Table C. 6. ICP result for pre-treatment condition at 53oC, 0rpm, 15 minutes
Bed volumes Run 9 Run 24 Run 39
Au (mg/L) Na (mg/L) Au (mg/L) Na (mg/L) Au (mg/L) Na (mg/L)
0.20 1.750 6394 1.510 6389 1.320 7368
0.60 1.620 8526 1.510 9003 1.690 8398
1.0 6.670 1793 3.940 3822 7.720 1536
1.4 12.72 862.2 10.15 1152 13.30 744.4
2.0 18.89 470.3 16.44 546.1 19.15 465.2
2.4 22.57 383.3 21.28 386.3 23.42 389.9
3.0 27.01 263.7 26.45 303.1 25.89 304.1
3.6 27.69 250.1 26.47 231.6 26.37 235.0
4.0 27.25 205.2 24.72 195.6 24.96 191.3
4.6 24.45 180.2 21.34 181.3 23.23 190.1
6.0 17.02 143.0 16.94 139.3 17.07 169.3
9.0 8.280 93.35 7.980 92.14 7.940 118.4
11 5.590 89.94 4.640 66.52 4.510 51.01
15 1.640 50.17 1.750 61.28 1.420 62.38
20 0.6600 43.98 0.5000 30.74 0.4700 33.14
Table C. 7. ICP result for pre-treatment condition at 25oC, 0rpm, 30 minutes
Bed volumes Run 35 Run 5 Run 20
Au (mg/L) Na (mg/L) Au (mg/L) Na (mg/L) Au (mg/L) Na (mg/L)
0.20 1.440 5907 1.360 6436 1.210 7389
0.60 1.570 7802 1.630 8174 1.470 8615
1.0 4.260 2996 5.290 2639 5.170 2654
1.4 10.11 1006 8.550 802.7 12.21 913.7
2.0 15.81 455.9 19.35 493.4 19.52 413.6
2.4 21.10 394.0 23.12 376.6 21.20 333.2
3.0 25.72 278.0 27.60 307.1 23.12 288.8
3.6 26.89 244.7 29.45 240.1 24.33 215.5
4.0 25.66 222.1 28.10 203.1 24.67 258.8
4.6 23.98 175.6 26.07 165.0 23.06 141.7
6.0 18.67 152.3 17.80 107.7 17.24 122.9
9.0 8.000 101.6 5.600 50.94 7.620 108.6
11 4.040 86.49 3.980 66.97 4.750 61.03
15 1.610 43.89 1.250 32.46 2.300 59.06
20 0.5700 62.56 0.4900 22.29 1.010 58.63
Stellenbosch University https://scholar.sun.ac.za
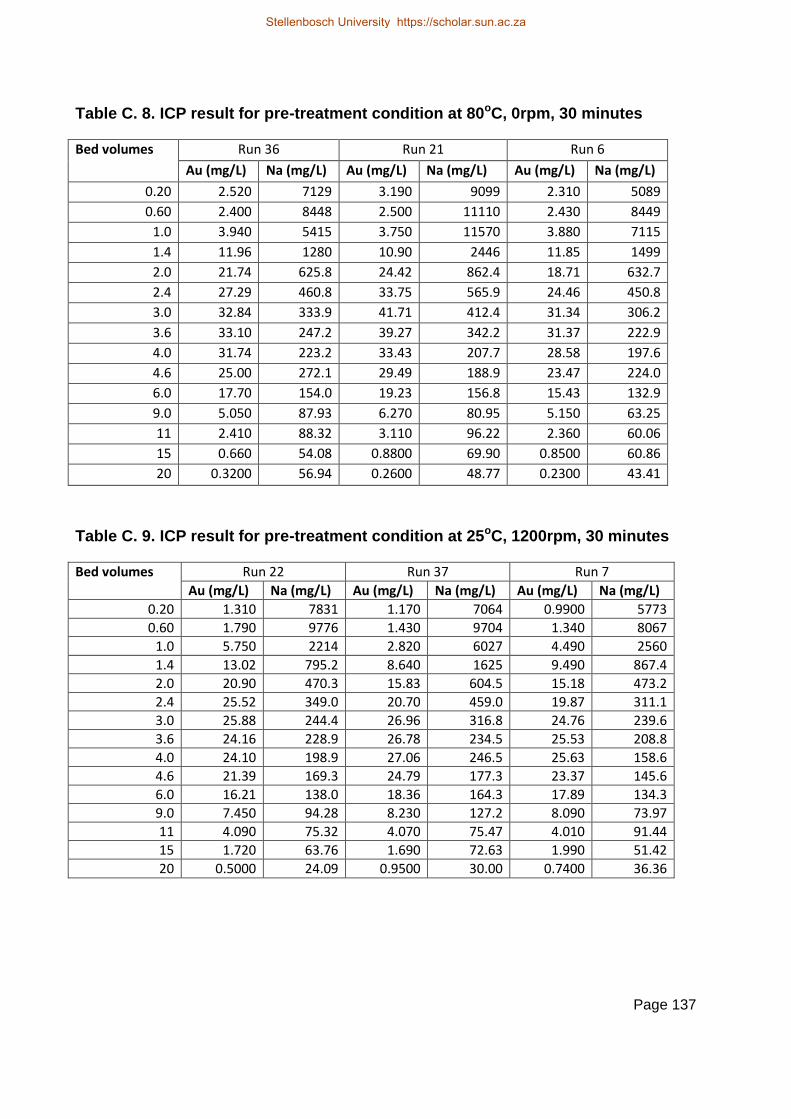
Page 137
Table C. 8. ICP result for pre-treatment condition at 80oC, 0rpm, 30 minutes
Bed volumes Run 36 Run 21 Run 6
Au (mg/L) Na (mg/L) Au (mg/L) Na (mg/L) Au (mg/L) Na (mg/L)
0.20 2.520 7129 3.190 9099 2.310 5089
0.60 2.400 8448 2.500 11110 2.430 8449
1.0 3.940 5415 3.750 11570 3.880 7115
1.4 11.96 1280 10.90 2446 11.85 1499
2.0 21.74 625.8 24.42 862.4 18.71 632.7
2.4 27.29 460.8 33.75 565.9 24.46 450.8
3.0 32.84 333.9 41.71 412.4 31.34 306.2
3.6 33.10 247.2 39.27 342.2 31.37 222.9
4.0 31.74 223.2 33.43 207.7 28.58 197.6
4.6 25.00 272.1 29.49 188.9 23.47 224.0
6.0 17.70 154.0 19.23 156.8 15.43 132.9
9.0 5.050 87.93 6.270 80.95 5.150 63.25
11 2.410 88.32 3.110 96.22 2.360 60.06
15 0.660 54.08 0.8800 69.90 0.8500 60.86
20 0.3200 56.94 0.2600 48.77 0.2300 43.41
Table C. 9. ICP result for pre-treatment condition at 25oC, 1200rpm, 30 minutes
Bed volumes Run 22 Run 37 Run 7
Au (mg/L) Na (mg/L) Au (mg/L) Na (mg/L) Au (mg/L) Na (mg/L)
0.20 1.310 7831 1.170 7064 0.9900 5773
0.60 1.790 9776 1.430 9704 1.340 8067
1.0 5.750 2214 2.820 6027 4.490 2560
1.4 13.02 795.2 8.640 1625 9.490 867.4
2.0 20.90 470.3 15.83 604.5 15.18 473.2
2.4 25.52 349.0 20.70 459.0 19.87 311.1
3.0 25.88 244.4 26.96 316.8 24.76 239.6
3.6 24.16 228.9 26.78 234.5 25.53 208.8
4.0 24.10 198.9 27.06 246.5 25.63 158.6
4.6 21.39 169.3 24.79 177.3 23.37 145.6
6.0 16.21 138.0 18.36 164.3 17.89 134.3
9.0 7.450 94.28 8.230 127.2 8.090 73.97
11 4.090 75.32 4.070 75.47 4.010 91.44
15 1.720 63.76 1.690 72.63 1.990 51.42
20 0.5000 24.09 0.9500 30.00 0.7400 36.36
Stellenbosch University https://scholar.sun.ac.za

Page 138
Table C. 10. ICP result for pre-treatment condition at 53oC, 0rpm, 45 minutes
Bed volumes Run 40 Run 31 Run 10
Au (mg/L) Na (mg/L) Au (mg/L) Na (mg/L) Au (mg/L) Na (mg/L)
0.20 1.480 3913 1.830 5846 2.020 5446
0.60 1.950 7971 1.770 7757 1.910 9045
1.0 2.710 5887 3.020 5036 5.060 3371
1.4 8.740 1406 9.640 1262 10.62 1217
2.0 16.89 6230 16.38 646.6 17.71 572.3
2.4 20.38 422.8 21.36 442.0 22.10 451.2
3.0 26.13 338.1 26.21 349.1 26.59 301.5
3.6 27.37 287.3 27.94 267.8 27.98 250.5
4.0 25.64 252.5 27.58 244.9 26.62 196.8
4.6 24.87 198.4 26.20 187.9 24.48 179.3
6.0 18.34 157.2 18.53 158.2 17.92 141.7
9.0 7.930 123.9 6.510 100.2 5.460 78.94
11 4.830 104.1 4.040 75.64 3.300 75.19
15 1.502 53.92 1.000 32.04 1.310 73.20
20 0.4400 62.80 0.8000 34.01 0.6600 40.77
Table C. 11. ICP result for pre-treatment condition at 53oC, 1200rpm, 15 minutes
Bed volumes Run 26 Run 11 Run 41
Au (mg/L) Na (mg/L) Au (mg/L) Na (mg/L) Au (mg/L) Na (mg/L)
0.20 1.380 6884 1.370 3987 1.090 7640
0.60 1.470 9430 1.550 7732 1.300 9779
1.0 2.970 5094 3.350 3830 4.660 2817
1.4 8.530 1317 8.570 1158 10.12 937.6
2.0 16.63 527.5 15.33 562.5 17.32 511.3
2.4 21.25 443.9 24.64 344.0 21.33 380.2
3.0 23.42 286.1 25.52 290.2 25.49 299.4
3.6 24.57 258.8 28.52 209.3 26.60 227.9
4.0 24.57 193.8 26.75 176.4 26.53 207.0
4.6 22.07 163.7 24.02 160.1 24.75 179.5
6.0 16.41 125.0 14.83 104.7 15.22 113.2
9.0 7.120 87.20 8.930 87.51 7.770 75.75
11 4.490 62.13 5.040 68.66 4.570 79.86
15 1.770 39.84 2.030 61.74 1.570 70.87
20 0.7200 28.62 0.700 32.70 0.7000 40.84
Stellenbosch University https://scholar.sun.ac.za

Page 139
Table C. 12. ICP result for pre-treatment condition at 53oC, 1200rpm, 45minutes
Bed volumes Run 42 Run 12 Run 27
Au (mg/L) Na (mg/L) Au (mg/L) Na (mg/L) Au (mg/L) Na (mg/L)
0.20 1.470 5944 1.350 6551 1.400 6095
0.60 1.610 9948 1.360 10240 1.730 9837
1.0 3.280 6321 2.820 6457 2.800 7854
1.4 8.080 1322 8.780 1575 10.85 1538
2.0 15.96 633.7 16.01 639.0 17.18 598.4
2.4 18.28 411.1 21.17 874.9 23.25 512.6
3.0 23.28 297.4 23.99 382.8 25.36 274.8
3.6 23.81 225.8 28.84 323.4 26.14 230.7
4.0 23.72 194.4 32.94 290.3 25.44 214.3
4.6 23.32 178.3 25.78 202.9 23.73 207.5
6.0 17.90 133.5 20.51 130.1 18.84 129.7
9.0 9.010 87.86 9.200 78.78 8.590 106.5
11 5.780 74.70 5.580 65.37 4.900 75.90
15 2.230 43.43 2.130 59.01 1.600 51.58
20 0.9100 36.38 0.6800 28.85 0.6300 46.46
Table C. 13. ICP result for pre-treatment condition at 53oC, 600rpm, 30minutes
Run 29 Run 45 Run 28
Bed volumes Au (mg/L) Na (mg/L) Au (mg/L) Na (mg/L) Au (mg/L) Na (mg/L)
0.20 1.560 5543 1.720 6719 1.350 7194
0.60 1.930 9539 1.820 8427 1.330 9726
1.0 6.710 2432 7.200 1708 3.910 2982
1.4 10.49 916.2 12.86 911.9 8.710 1147
2.0 17.57 511.4 18.60 490.1 16.22 546.8
2.4 23.15 380.2 23.74 395.0 20.18 415.8
3.0 24.45 306.5 27.30 342.4 22.99 322.0
3.6 24.38 209.9 26.46 289.2 23.75 260.0
4.0 23.68 204.0 24.71 252.3 22.48 243.4
4.6 20.01 185.5 20.85 218.0 21.18 219.8
6.0 13.57 125.4 15.55 177.3 15.77 143.0
9.0 5.380 77.55 5.506 103.2 7.660 94.75
11 3.570 74.61 3.120 83.32 4.550 87.19
15 1.610 55.70 1.440 69.55 2.040 65.80
20 0.6700 46.43 0.3700 47.88 0.8000 54.26
Stellenbosch University https://scholar.sun.ac.za

Page 140
Table C. 14. . ICP result for pre-treatment condition at 53oC, 600rpm, 30minutes
Run 43 Run 15 Run 44
Bed volumes Au (mg/L) Na (mg/L) Au (mg/L) Na (mg/L) Au (mg/L) Na (mg/L)
0.20 1.230 4509 1.720 5240 1.360 7026
0.60 1.410 7964 1.950 8383 1.470 9758
1.0 2.870 4106 2.450 7512 3.920 3999
1.4 7.950 1115 7.960 1476 9.850 1057
2.0 14.03 602.4 16.33 808.6 17.41 497.9
2.4 19.16 369.0 20.33 595.2 21.59 420.4
3.0 19.29 389.9 24.88 339.1 25.99 295.9
3.6 23.38 271.5 28.84 258.4 27.75 255.2
4.0 24.41 203.1 28.40 237.1 26.46 195.8
4.6 22.60 182.6 26.09 228.6 24.34 165.9
6.0 17.63 159.2 19.60 150.8 17.08 122.7
9.0 9.270 115.1 10.35 121.2 6.800 110.4
11 5.380 90.79 5.370 67.29 3.560 62.54
15 2.050 61.71 1.810 46.72 1.550 55.38
20 0.6900 62.17 0.5400 60.86 0.5900 47.54
Table C. 15. . ICP result for pre-treatment condition at 53oC, 600rpm, 30minutes
Run 30 Run 13 Run 14
Bed volumes Au (mg/L) Na (mg/L) Au (mg/L) Na (mg/L) Au (mg/L) Na (mg/L)
0.20 1.050 5182 1.200 8019 1.230 3659
0.60 1.220 7587 1.470 8130 1.320 8185
1.0 1.660 6706 5.380 1817 3.430 4393
1.4 7.180 1424 9.880 816.4 8.270 1195
2.0 15.11 526.0 16.88 435.1 14.71 565.1
2.4 20.11 390.2 22.33 367.6 18.30 417.1
3.0 21.37 349.9 23.42 246.7 22.73 303.2
3.6 24.84 226.5 23.53 233.6 25.67 232.7
4.0 24.05 193.4 23.84 186.1 24.54 217.7
4.6 21.88 171.7 23.88 182.2 25.03 191.3
6.0 16.88 134.8 18.10 118.7 18.65 151.4
9.0 8.400 87.11 8.000 70.51 8.600 76.17
11 4.660 47.76 4.400 61.16 5.080 34.36
15 2.709 38.14 2.010 37.89 2.280 72.44
20 1.000 34.10 0.7600 45.89 0.8900 47.15
Stellenbosch University https://scholar.sun.ac.za

Page 141
Table C. 16. ICP result of oxygen supply experiment. Pre-treatment condition:
3%NaCN, 1%NaOH, 25oC,0 rpm and 30minutes
Bed volumes 0mL/min 10mL/min 100mL/min
Au (mg/L) Na (mg/L) Au (mg/L) Na (mg/L) Au (mg/L) Na (mg/L)
0.20 20.29 8396 17.09 9305 18.08 9201
0.60 29.87 7225 28.90 6327 30.68 5623
1.0 89.76 1628 62.51 2199 56.49 2441
1.4 129.9 691.1 108.1 782.7 97.74 952.2
2.0 113.2 382.2 107.3 408.7 107.9 461.8
2.4 94.53 300.8 90.77 310.7 95.34 341.4
3.0 68.26 216.5 71.00 261.1 74.46 235.4
3.6 50.97 177.5 53.65 211.3 55.60 177.9
4.0 41.62 150.7 46.78 238.8 47.95 146.8
4.6 33.62 122.8 36.17 148.7 39.37 134.5
6.0 21.59 80.98 20.53 79.89 26.43 90.05
9.0 11.92 47.72 10.69 46.37 14.05 40.13
11 9.661 27.58 9.965 28.65 10.46 25.14
15 4.654 15.99 5.964 14.68 5.962 13.88
20 2.365 6.549 1.965 7.747 2.669 7.697
Table C. 17. ICP result of oxygen supply experiment at different flow rates. Pre-
treatment condition: 3%NaCN, 1%NaOH, 80oC,0 rpm and 30minutes
Bed volumes 0mL/min 10/mL/min 100mL/min
Au (mg/L) Na (mg/L) Au (mg/L) Na (mg/L) Au (mg/L) Na (mg/L)
0.20 25.31 11587 19.46 12310 17.46 28980
0.60 50.76 5109 28.21 8212 27.05 17560
1.0 104.5 1734 57.66 2930 83.23 2789
1.4 138.1 932.7 106.5 1019 130.9 1127
2.0 136.9 522.4 117.9 498.3 126.1 620.1
2.4 122.0 409.5 99.27 370.6 110.0 518.7
3.0 90.32 289.3 74.12 281.9 67.72 286.1
3.6 67.19 223.8 54.52 224.5 48.09 213.7
4.0 55.22 192.0 43.57 198.6 39.59 197.8
4.6 42.25 155.7 32.68 169.2 30.24 184.9
6.0 24.74 121.7 17.94 114.8 16.94 128.8
9.0 11.44 50.66 8.058 62.26 6.987 70.08
11 8.239 28.48 5.814 48.62 5.172 59.29
15 5.452 16.32 3.894 29.00 3.452 33.49
20 1.698 8.562 1.862 14.37 2.014 20.15
Stellenbosch University https://scholar.sun.ac.za
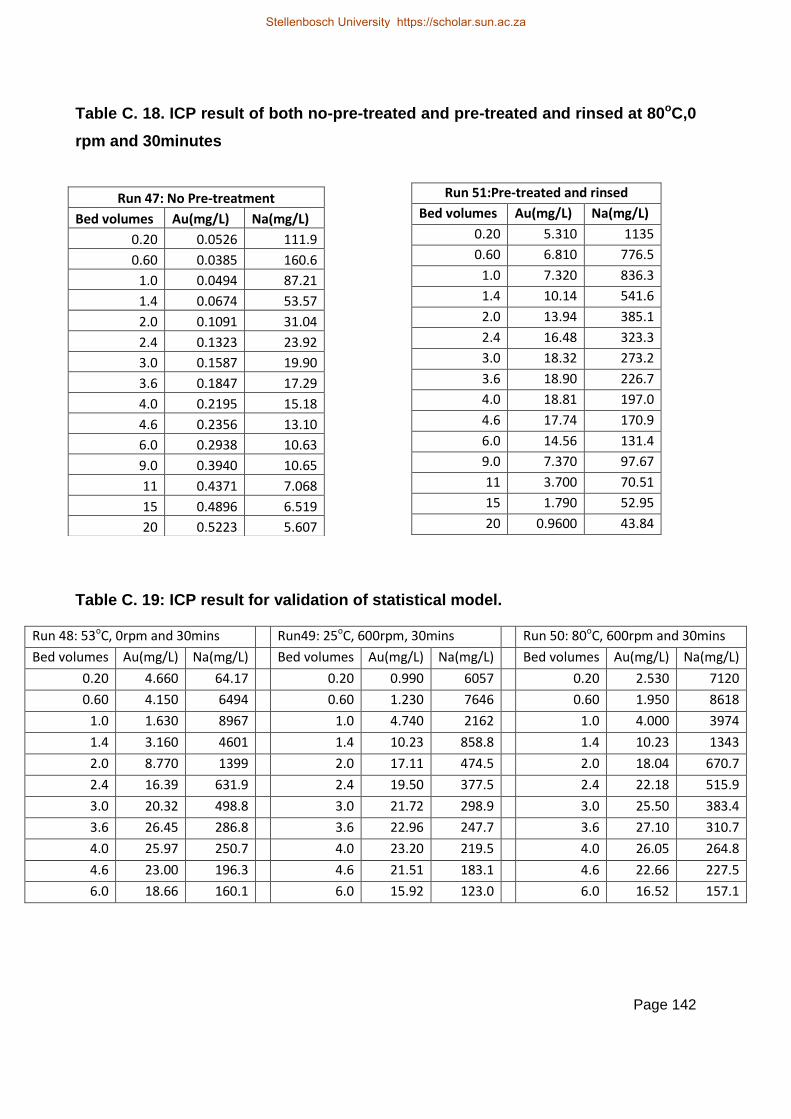
Page 142
Table C. 18. ICP result of both no-pre-treated and pre-treated and rinsed at 80oC,0
rpm and 30minutes
Table C. 19: ICP result for validation of statistical model.
Run 48: 53oC, 0rpm and 30mins Run49: 25oC, 600rpm, 30mins Run 50: 80oC, 600rpm and 30mins
Bed volumes Au(mg/L) Na(mg/L) Bed volumes Au(mg/L) Na(mg/L) Bed volumes Au(mg/L) Na(mg/L)
0.20 4.660 64.17 0.20 0.990 6057 0.20 2.530 7120
0.60 4.150 6494 0.60 1.230 7646 0.60 1.950 8618
1.0 1.630 8967 1.0 4.740 2162 1.0 4.000 3974
1.4 3.160 4601 1.4 10.23 858.8 1.4 10.23 1343
2.0 8.770 1399 2.0 17.11 474.5 2.0 18.04 670.7
2.4 16.39 631.9 2.4 19.50 377.5 2.4 22.18 515.9
3.0 20.32 498.8 3.0 21.72 298.9 3.0 25.50 383.4
3.6 26.45 286.8 3.6 22.96 247.7 3.6 27.10 310.7
4.0 25.97 250.7 4.0 23.20 219.5 4.0 26.05 264.8
4.6 23.00 196.3 4.6 21.51 183.1 4.6 22.66 227.5
6.0 18.66 160.1 6.0 15.92 123.0 6.0 16.52 157.1
Run 47: No Pre-treatment
Bed volumes Au(mg/L) Na(mg/L)
0.20 0.0526 111.9
0.60 0.0385 160.6
1.0 0.0494 87.21
1.4 0.0674 53.57
2.0 0.1091 31.04
2.4 0.1323 23.92
3.0 0.1587 19.90
3.6 0.1847 17.29
4.0 0.2195 15.18
4.6 0.2356 13.10
6.0 0.2938 10.63
9.0 0.3940 10.65
11 0.4371 7.068
15 0.4896 6.519
20 0.5223 5.607
Run 51:Pre-treated and rinsed
Bed volumes Au(mg/L) Na(mg/L)
0.20 5.310 1135
0.60 6.810 776.5
1.0 7.320 836.3
1.4 10.14 541.6
2.0 13.94 385.1
2.4 16.48 323.3
3.0 18.32 273.2
3.6 18.90 226.7
4.0 18.81 197.0
4.6 17.74 170.9
6.0 14.56 131.4
9.0 7.370 97.67
11 3.700 70.51
15 1.790 52.95
20 0.9600 43.84
Stellenbosch University https://scholar.sun.ac.za

Page 143
Titration analysis for CN-
Table C. 20. Titration result at 25oC, 0rpm, No-AC
R1 (25oC, 0rpm) Vol (AgNO3)(mL) CN-(Molar)
Initial conc S1 8.752 0.5830
15mins S2 8.956 0.5970
30mins S3 8.860 0.5910
45mins S4 8.766 0.5840
60mins S5 8.862 0.5910
Table C. 21. Titration result 25oC,600 rpm, No-AC
R2 (25oC, 600rpm) Vol (AgNO3)(mL) CN-(Molar)
Initial conc S1 8.788 0.5860
15mins S2 8.838 0.5890
30mins S3 8.647 0.5760
45mins S4 8.550 0.5700
60mins S5 8.599 0.5730
Table C. 22. Titration result at 25oC, 1200 rpm, No-AC
R3 (25oC, 1200rpm) Vol (AgNO3)(mL) CN-(Molar)
Initial conc S1 8.576 0.5720
15mins S2 8.550 0.5700
30mins S3 8.555 0.5700
45mins S4 8.589 0.5730
60mins S5 8.550 0.5700
Table C. 23. Titration result at 53oC, 0 rpm, No-AC
R4 (53oC, 0rpm) Vol (AgNO3)(ml) CN-(Molar)
Initial conc S1 8.742 0.5830
15mins S2 8.838 0.5890
30mins S3 8.862 0.5910
45mins S4 8.935 0.5960
60mins S5 8.742 0.5830
Stellenbosch University https://scholar.sun.ac.za

Page 144
Table C. 24. Titration result at 53oC, 600 rpm, No-AC
R5 (53oC, 600rpm) Vol (AgNO3)(mL) CN-(Molar)
Initial conc S1 8.732 0.5820
15mins S2 8.951 0.5970
30mins S3 8.550 0.5700
45mins S4 9.170 0.6110
60mins S5 9.201 0.6130
Table C. 25. Titration result at 53oC, 1200 rpm, No-AC
R6 (53oC, 1200rpm) Vol (AgNO3)(mL) CN-(Molar)
Initial conc S1 3.000 0.5840
15mins S2 3.093 0.6020
30mins S3 3.079 0.5990
45mins S4 3.197 0.6220
60mins S5 3.181 0.6190
Table C. 26. Titration result at 80oC, 0 rpm, No-AC
R7 (80oC, 0rpm) Vol (AgNO3)(mL) CN-(Molar)
Initial conc S1 3.186 0.6200
15mins S2 3.496 0.6800
30mins S3 3.662 0.7130
45mins S4 3.969 0.7720
60mins S5 4.385 0.85300
Table C. 27. Titration result at 80oC, 600 rpm, No-AC
R8 (80oC, 600rpm) Vol (AgNO3)(mL) CN-(Molar)
Initial conc S1 3.183 0.6190
15mins S2 3.380 0.6580
30mins S3 3.770 0.7340
45mins S4 4.274 0.8320
60mins S5 4.981 0.9690
Stellenbosch University https://scholar.sun.ac.za

Page 145
Table C. 28. Titration result at 80oC, 1200 rpm, No-AC
R9 (80oC, 1200rpm) Vol (AgNO3)(mL) CN-(Molar)
Initial conc S1 3.093 0.6020
15mins S2 3.187 0.6200
30mins S3 3.592 0.6990
45mins S4 3.881 0.7550
60mins S5 4.097 0.7970
Table C. 29. Titration result at 25oC, 0 rpm, in the presence of AC
R1 (25oC, 0rpm) Vol (AgNO3)(mL) CN-(Molar)
Initial conc S1 3.093 0.6020
15mins S2 2.989 0.5820
30mins S3 3.000 0.5840
45mins S4 3.000 0.5840
60mins S5 2.899 0.5640
Table C. 30. Titration result at 25oC,600 rpm, in the presence of AC
R2 (25oC, 600rpm) Vol (AgNO3)(mL) CN-(Molar)
Initial conc S1 2.989 0.5820
15mins S2 3.000 0.5840
30mins S3 3.000 0.5840
45mins S4 2.885 0.5610
60mins S5 2.899 0.5640
Table C. 31. Titration result at 25oC,1200 rpm, in the presence of AC
R3 (25oC, 1200rpm) Vol (AgNO3)(mL) CN-(Molar)
Initial conc S1 2.971 0.5780
15mins S2 2.885 0.5610
30mins S3 2.788 0.5430
45mins S4 2.881 0.5610
60mins S5 2.897 0.5640
Stellenbosch University https://scholar.sun.ac.za

Page 146
Table C. 32. Titration result at 53oC, 0 rpm, in the presence of AC
R4 (53oC, 0rpm) Vol (AgNO3)(mL) CN-(Molar)
Initial conc S1 2.999 0.5840
15mins S2 2.881 0.5610
30mins S3 2.899 0.5640
45mins S4 2.977 0.5790
60mins S5 2.892 0.5630
Table C. 33. Titration result at 53oC, 600 rpm, in the presence of AC
R5 (53oC, 600rpm) Vol (AgNO3)(mL) CN-(Molar)
Initial conc S1 2.979 0.5790
15mins S2 2.895 0.5630
30mins S3 2.999 0.5840
45mins S4 2.993 0.5820
60mins S5 2.989 0.5820
Table C. 34. Titration result at 53oC, 1200 rpm, in the presence of AC
R6 (53oC, 1200rpm) Vol (AgNO3)(mL) CN-(Molar)
Initial conc S1 2.979 0.5790
15mins S2 2.881 0.5600
30mins S3 2.979 0.5790
45mins S4 2.977 0.5790
60mins S5 2.898 0.5640
Table C. 35. Titration result at 80oC, 0 rpm, in the presence of AC
R7 (80oC, 0rpm) Vol (AgNO3)(mL) CN-(Molar)
Initial conc S1 3.093 0.6020
15mins S2 3.075 0.5980
30mins S3 3.186 0.6200
45mins S4 3.281 0.6380
60mins S5 3.374 0.6570
Stellenbosch University https://scholar.sun.ac.za

Page 147
Table C. 36. Titration result at 80oC, 600 rpm, in the presence of AC
R8 (80oC, 600rpm) Vol (AgNO3)(mL) CN-(Molar)
Initial conc S1 3.186 0.6200
15mins S2 3.289 0.6400
30mins S3 3.594 0.6990
45mins S4 3.972 0.7730
60mins S5 4.669 0.9090
Table C. 37. Titration result at 80oC, 1200 rpm, in the presence of AC
R9 (80oC, 1200rpm) Vol (AgNO3)(mL) CN-(Molar)
Initial conc S1 3 0.5840
15mins S2 3.083 0.6000
30mins S3 3.382 0.6580
45mins S4 3.584 0.6970
60mins S5 3.771 0.7340
Table C. 38. Titration result at 25oC, 0 rpm, in the presence of AC-Au
R1 (25oC, 0rpm) Vol (AgNO3)(mL) CN-(Molar)
Initial conc S1 2.972 0.5780
15mins S2 2.993 0.5820
30mins S3 2.995 0.5830
45mins S4 2.999 0.5840
60mins S5 2.977 0.5790
Table C. 39. Titration result at 25oC, 600 rpm, in the presence of AC-Au
R2 (25oC, 600rpm) Vol (AgNO3)(mL) CN-(Molar)
Initial conc S1 2.977 0.5790
15mins S2 2.999 0.5840
30mins S3 3.075 0.5980
45mins S4 2.978 0.5800
60mins S5 3.000 0.5840
Stellenbosch University https://scholar.sun.ac.za
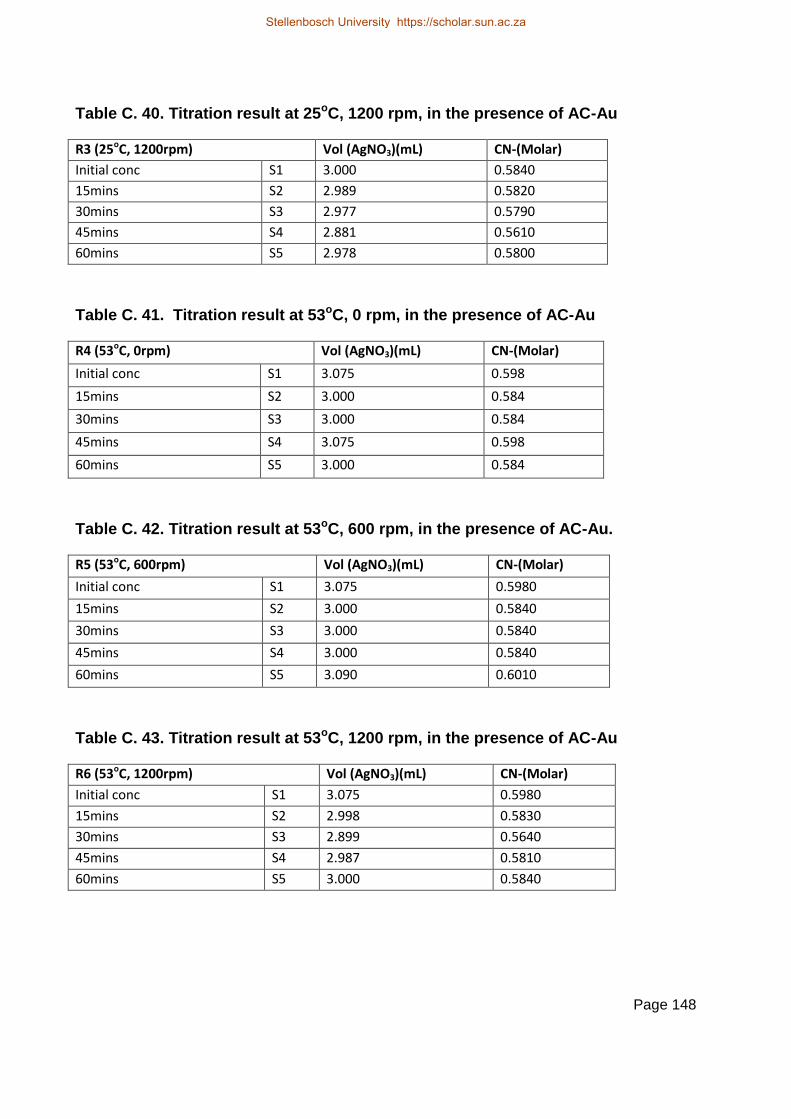
Page 148
Table C. 40. Titration result at 25oC, 1200 rpm, in the presence of AC-Au
R3 (25oC, 1200rpm) Vol (AgNO3)(mL) CN-(Molar)
Initial conc S1 3.000 0.5840
15mins S2 2.989 0.5820
30mins S3 2.977 0.5790
45mins S4 2.881 0.5610
60mins S5 2.978 0.5800
Table C. 41. Titration result at 53oC, 0 rpm, in the presence of AC-Au
R4 (53oC, 0rpm) Vol (AgNO3)(mL) CN-(Molar)
Initial conc S1 3.075 0.598
15mins S2 3.000 0.584
30mins S3 3.000 0.584
45mins S4 3.075 0.598
60mins S5 3.000 0.584
Table C. 42. Titration result at 53oC, 600 rpm, in the presence of AC-Au.
R5 (53oC, 600rpm) Vol (AgNO3)(mL) CN-(Molar)
Initial conc S1 3.075 0.5980
15mins S2 3.000 0.5840
30mins S3 3.000 0.5840
45mins S4 3.000 0.5840
60mins S5 3.090 0.6010
Table C. 43. Titration result at 53oC, 1200 rpm, in the presence of AC-Au
R6 (53oC, 1200rpm) Vol (AgNO3)(mL) CN-(Molar)
Initial conc S1 3.075 0.5980
15mins S2 2.998 0.5830
30mins S3 2.899 0.5640
45mins S4 2.987 0.5810
60mins S5 3.000 0.5840
Stellenbosch University https://scholar.sun.ac.za
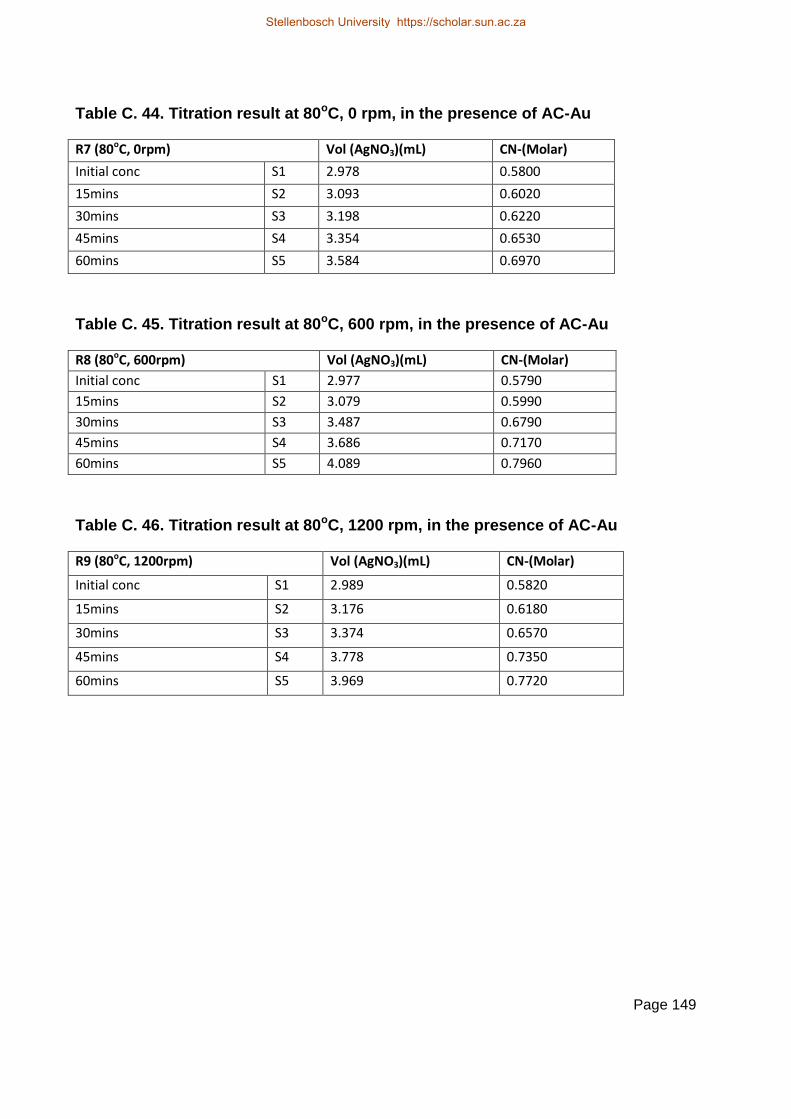
Page 149
Table C. 44. Titration result at 80oC, 0 rpm, in the presence of AC-Au
R7 (80oC, 0rpm) Vol (AgNO3)(mL) CN-(Molar)
Initial conc S1 2.978 0.5800
15mins S2 3.093 0.6020
30mins S3 3.198 0.6220
45mins S4 3.354 0.6530
60mins S5 3.584 0.6970
Table C. 45. Titration result at 80oC, 600 rpm, in the presence of AC-Au
R8 (80oC, 600rpm) Vol (AgNO3)(mL) CN-(Molar)
Initial conc S1 2.977 0.5790
15mins S2 3.079 0.5990
30mins S3 3.487 0.6790
45mins S4 3.686 0.7170
60mins S5 4.089 0.7960
Table C. 46. Titration result at 80oC, 1200 rpm, in the presence of AC-Au
R9 (80oC, 1200rpm) Vol (AgNO3)(mL) CN-(Molar)
Initial conc S1 2.989 0.5820
15mins S2 3.176 0.6180
30mins S3 3.374 0.6570
45mins S4 3.778 0.7350
60mins S5 3.969 0.7720
Stellenbosch University https://scholar.sun.ac.za

Page 150
Appendix D: Pictures of experimental setup
Adsorption
Pre-treatment
Stellenbosch University https://scholar.sun.ac.za
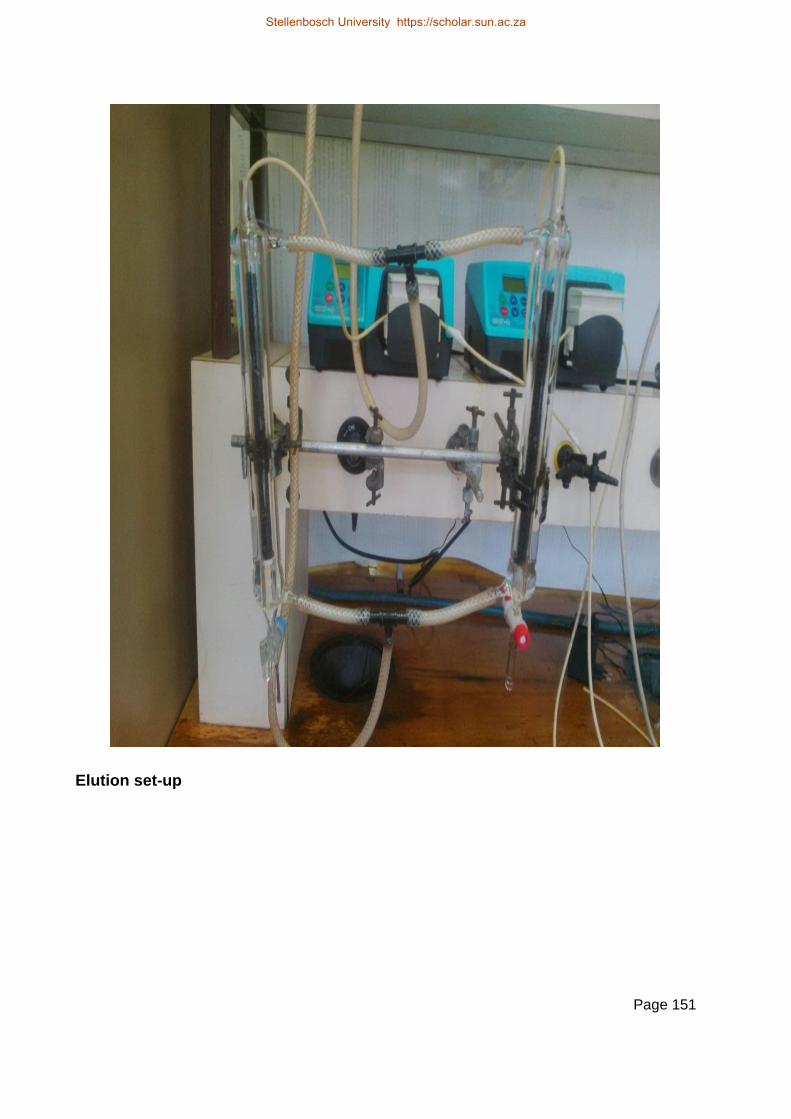
Page 151
Elution set-up
Stellenbosch University https://scholar.sun.ac.za

Page 152
Dissolved oxygen meter and probe
Automatic titrating machime
Stellenbosch University https://scholar.sun.ac.za
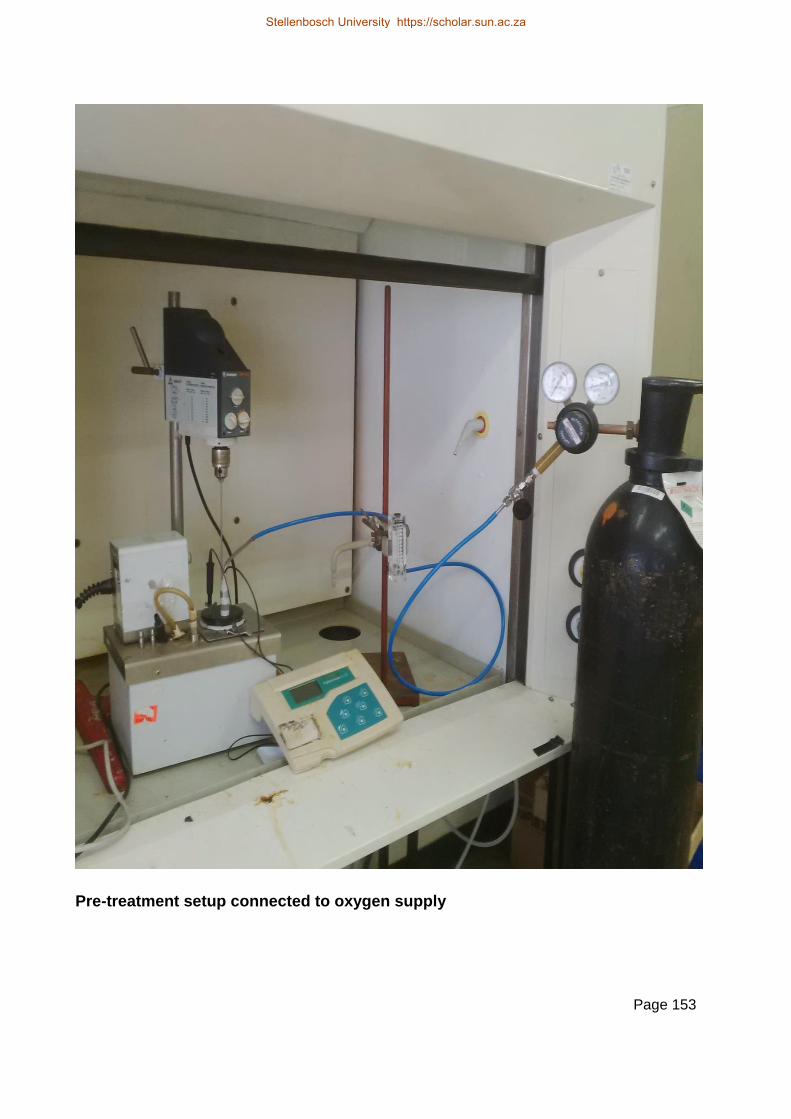
Page 153
Pre-treatment setup connected to oxygen supply
Stellenbosch University https://scholar.sun.ac.za
Page 154
Appendix E: Publication based on this thesis
Non-refereed paper presented at international conference.
· Oladele, T.P., Snyders, C.A., Bradshaw, S.M., 2015. Effect of temperature,
contact time and agitation speed during pre-treatment on elution. Precious
Metals’15, Falmouth, UK, 11-12 May 2015.
Refereed full length paper presented at world gold conference and accepted for
publication SAIMM World gold conference proceedings.
· Oladele, T.P., Snyders, C.A., Bradshaw, S.M., 2015. Effect of temperature,
contact time and agitation speed during pre-treatment on gold elution. World
Gold conference 2015, Johanesburg, South Africa, 28th September-1
October 2015.
Stellenbosch University https://scholar.sun.ac.za