effect of the 6+1 trait writing model on student writing
TRANSCRIPT

EFFECT OF THE 6+1 TRAIT WRITING MODEL ON STUDENT WRITING
ACHIEVEMENT
A Dissertation Presented to
The Faculty of the School Education
Liberty University
In Partial Fulfillment
of the Requirements for the Degree
Doctor of Education
By
Nancy K. DeJarnette
November 2008

iii
Effect of the 6+1 Trait Writing Model on Student Writing Achievement
by Nancy K. DeJarnette
APPROVED:
COMMITTEE CHAIR Jill Jones, Ed.D. COMMITTEE MEMBERS Kathie Morgan, Ed.D. Ann Wyatt, Ph.D. CHAIR, GRADUATE STUDIES Scott B. Watson, Ph.D.

iv
Abstract
Nancy K. DeJarnette. EFFECT OF THE 6+1 TRAIT WRITING MODEL ON
STUDENT WRITING ACHIEVEMENT. (Under the direction of Dr. Jill Jones) School
of Education, November, 2008.
The focus of this study was to determine the difference between teaching the 6+1 Trait
Writing Model to fifth graders and the traditional writing workshop method of teaching
writing on overall student writing achievement according to the data supplied by a
writing rubric. The study involved 8 classes of fifth graders in 2 different schools. One
school provided instruction according to the 6+1 Trait Writing Model, and the other
school provided instruction using the traditional writing workshop method of teaching
writing. It was hypothesized that students receiving instruction using the 6+1 Trait
Writing Model would exhibit greater gains in writing achievement and quality according
to the data supplied by a writing rubric. Significant differences were found in two out of
four component areas on the rubric used for scoring student papers. Results indicated that
the type of method used to teach writing is not as significant as providing structured
instruction as well as time for student writing. Suggestions for further research are also
included.

v
Acknowledgements
This study is dedicated to my wonderful and loving husband Neil who supported
me throughout the graduate education process. Without his help and support watching,
feeding, bathing, and meeting the essential needs of our four small children, none of this
would have been possible. It is dedicated also to my four adorable children, Christian,
Jonah, Anna, and Daniel, who were my biggest cheerleaders and had so much patience
for Mommy having to work endless hours on the computer.
I would like to thank all of my friends and family who were my prayer warriors
throughout this three-and-a-half year process. Your thoughts and prayers were felt and
needed daily! I would like to give special thanks to the following people:
Thanks to Dr. Bonnie Wright, Mr. Jerry Wright, and Dr. Ann Wyatt for all your
expertise and assistance!
Thanks to my parents Dean and Kay Sime who provided for me financially when
financial aid could not! Thanks also for the prayers and encouragement along the way!
Thanks to several memorable professors who had a lasting impact on my
Christian world-view, Dr. Scott Watson, Dr. Chick Holland, Dr. Charles Schneider,
Dr. John Pantana, and Dr. Steve Deckard.
Thanks to my committee chair, Dr. Jill Jones, for her wise counsel and expertise.
Thanks also to my committee members Dr. Kathie Morgan and Dr. Ann Wyatt for
their time and commitment to me.

vi
Table of Contents
Chapter 1: Introduction .....................................................................................................2
Background.......................................................................................................................3
Statement of the Problem..................................................................................................5
Statement of the Hypothesis. ............................................................................................5
Null Hypotheses................................................................................................................5
Professional Significance..................................................................................................6
Overview of Methodology................................................................................................7
Definition of Terms...........................................................................................................8
Chapter 2: Review of Related Literature ..........................................................................9
Writing Development from Past to Present ......................................................................9
Theoretical Framework...................................................................................................11
Process Writing...............................................................................................................13
Writing Workshop ..........................................................................................................14
The Reading-Writing Link..............................................................................................16
The 6+1 Trait Writing Model .........................................................................................18
Measuring Writing Achievement....................................................................................20
Conclusion ......................................................................................................................22
Chapter 3: Methodology .................................................................................................23
Participants......................................................................................................................23
Instruments......................................................................................................................28
Statement of the Hypothesis. ..........................................................................................30

vii
Procedures.......................................................................................................................30
Instructional Units...........................................................................................................31
Raters ..............................................................................................................................33
Analysis of Data..............................................................................................................34
Summary .........................................................................................................................37
Chapter 4: Data Summary Results..................................................................................39
Introduction.....................................................................................................................39
Rubric..............................................................................................................................40
Statistics ..........................................................................................................................41
Summary .........................................................................................................................52
Chapter 5: Results of the Study ......................................................................................54
Statement of the Problem................................................................................................54
Review of Methodology .................................................................................................54
Summary of the Results ..................................................................................................58
Discussion of the Results ................................................................................................60
Relationship to Prior Research........................................................................................62
Implications of the Findings ...........................................................................................65
Limitations of this Study.................................................................................................67
Recommendations for Future Research ..........................................................................68
References.......................................................................................................................69
Appendixes
A Teacher Survey .......................................................................................................76
B Rubric for Scoring Student Writing ........................................................................78

viii
C South Carolina PACT Rubric..................................................................................81
D Unit Outlines ...........................................................................................................83
E Bar Graphs of Pretest and Posttest Means...............................................................88
F School District Permission Paper .............................................................................91
Tables
1 School Demographic Comparisons.........................................................................25
2 Classroom Demographic Comparisons...................................................................27
3 Pretest and Posttest Narrative Writing Prompts......................................................33
4 Sample Excel Spreadsheet Used to Record Student Data ......................................35
5 Cross Tabulation of Composite Student Gains From Pretest to Posttest................42
6 Frequencies: Composite Component Differences ..................................................43
7 Frequencies: Composite Pretest and Posttest Rating Comparisons........................44
8 Component Differences by Method........................................................................45
9 Frequencies: Four Component Pretest Means by Method.......................................46
10 Descriptive Statistics for the Analysis of Covariance (Posttest) ...........................49
11 Tests of Between-Subjects Effects (Main Effects ANCOVA Results) .................50
12 Estimated Marginal Means (Adjusted Means) ......................................................52
13 Component Differences by Method.......................................................................59
Figures
1 Line Graph of Method Comparisons ......................................................................46

2
Chapter 1: Introduction
Inconsistencies in instructional methods for teaching writing abound in
elementary schools across the United States (Graham, MacArthur, & Fitzgerald, 2007).
When elementary school schedules get filled with too many subjects, usually writing is
the first content area to suffer from benign neglect. Finding quality writing instruction
and time committed for writing instruction and practice are rare in elementary schools.
Elementary schools often do not have a designated writing curriculum or a specific
method mandated by the district. There can be inconsistencies within schools and even
from teacher to teacher in the selection and implementation of writing instructional
methods. Both veteran and beginning elementary teachers can feel inadequate when
deciding how to teach writing to their students. In 2008, as a result of the No Child Left
Behind Act (NCLB), most states have adopted demanding writing standards for grades
K-12 (Graham et al.). Teachers are now required to teach writing but rarely are given
instruction on how to do so effectively. The goal of this study was to look at specific
ways in which to improve the overall quality of writing instruction for students.
The 6+1 Trait Writing Model is a writing strategy rather than a published
curriculum. Other writing strategies include Four Square Writing and Writer’s Workshop.
Each educational publisher provides a specific writing curriculum and many of them
incorporate the 6+1 Trait Writing Model. The 6+1 Trait Writing Model is included in
Houghton Mifflin’s Write Source and Maureen Auman’s Step Up to Writing published by
Cambium Learning Company. The 6+1 Trait Writing Model is not used in McGraw
Hill’s Spotlight on Writing nor Scott Foresman’s Grammar and Writing Handbook.
3
This study focused on two specific instructional writing methods for fifth grade
students. Both methods required process writing involving prewriting, drafting, editing,
revision, and publishing. The 6+1 Traits Writing Model provided direct instruction on the
craft of writing, or specific traits, the writing workshop method did not address. The goal
of this study was to determine if teaching the individual traits would improve overall
writing achievement. This researcher’s experience with both writing methods skewed her
expectations towards the benefits of the 6+1 Trait Method. She looked forward to
analyzing the data supplied by the rubric to see how the results compared with research
studies done by experts in the field of writing instruction. A review of the related
literature revealed many such studies.
Background
Effective writing instruction involves more than a teacher asking students to take
out a sheet of paper and write a story about a topic. Writing instruction has taken on new
meaning in education over the past two decades or so. Before the 1990’s, writing
instruction meant something totally different than it does in 2008. Writing instruction
previously referred to a child’s personal handwriting skills or ability to copy information
from a chalkboard. Since the emphasis of writing instruction has changed, many veteran
and novice teachers do not have adequate skills to teach the craft of writing. School
districts do not usually purchase a formal writing curriculum which leaves the choice of
how to teach writing to each individual school or each teacher in the school. This
weakness in instruction can harm schools’ academic ratings now that writing is included
in standardized testing in every state.
4
There are numerous instructional methods available and teachers may approach
the same method in different ways, creating inconsistencies in the methodology for
writing instruction in American elementary schools. This study researched two
previously-tested writing instructional methods to see which method yielded greater
student writing quality and achievement.
Nearly 20 years ago, the Northwest Regional Educational Laboratories [NWREL]
(2002) launched an effort to improve writing in the elementary classroom. This research
identified six traits of good writing. These researchers knew that the writing programs in
the American classrooms were not cutting edge. The goal was to develop a writing
program that went beyond grammar and mechanics and holistic grading. NWREL states,
“They compared reams of student work and discussed the qualities or traits that all ‘good’
writing samples shared. Six traits emerged as the cornerstones of quality writing: ideas,
organization, voice, word choice, sentence fluency, and conventions. Later, presentation
was added to the list” (para.3).
The 6+1 Trait Writing Model is a method of teaching writing and assessing
students’ writing using the distinct vocabulary of a professional writer. The traditional
writing workshop method of instruction focuses on sentence and paragraph structure,
conventions, and organization, emphasizing a beginning, middle, and an end. The 6+1
Trait Writing Model adds emphasis on additional writing skills such as ideas, voice, word
choice, sentence fluency, and presentation. The traits introduce new writing vocabulary to
students that will help give them a vision for what “good writing” looks and sounds like.
This writing model has been shown to help students add depth and style to their writing
that would not normally happen alone.

5
Statement of the Problem
What is the difference between the 6+1 Trait Writing Model and the traditional
writing workshop method of teaching writing on fifth grade student overall writing
achievement as measured by the use of a rubric?
1. Teaching students the individual traits of writing, such as voice, word
choice, and sentence fluency highlights the craft of writing for children and
will improve the quality of writing.
2. Demonstrating the 6+1 traits of writing for children using examples from
literature will also improve the quality of students’ writing.
Statement of the Hypothesis
There will be significantly higher achievement in four component areas (as
determined by the rubric utilized for this study) of the treatment group, following the 6+1
trait writing model, as compared to the control group, following the traditional writing
workshop model.
Null Hypotheses
1. There will be no significant difference in the component area of content
development (as determined by the rubric utilized for this study) of the
treatment group, following the 6+1 trait writing model, as compared to the
control group, following the traditional writing workshop writing model.
2. There will be no significant difference in the component area of organization
(as determined by the rubric utilized for this study) of the treatment group,
following the 6+1 trait writing model, as compared to the control group,
following the traditional writing workshop writing model.

6
3. There will be no significant difference in the component area of voice/word
choice (as determined by the rubric utilized for this study) of the treatment
group, following the 6+1 trait writing model, as compared to the control
group, following the traditional writing workshop writing model.
4. There will be no significant difference in the component area of conventions
(as determined by the rubric utilized for this study) of the treatment group,
following the 6+1 trait writing model, as compared to the control group,
following the traditional writing workshop writing model.
Professional Significance
The significance of this study emphasized the importance of instructional methods
for teaching elementary writing. For many children writing does not come naturally and
can be quite difficult. The 6+1 Trait Writing Model provides direct instruction in the
different crafts of writing. These crafts, or traits, can be taught and emphasized to greatly
improve the quality of students’ writing. This experimental method also closely relates
writing to reading. Examples from children’s literature were used to introduce and teach
each of the individual writing traits. Using children’s literature provides a model for
students and gives them ideas for their own writing. As students study the 6+1 traits in
their reading and writing, the traits become part of their vocabularies which give them the
capability to apply the traits to both reading and writing. Jarmer, Kozol, Nelson, and
Salsberry (2000) discovered that familiarity and emphasis on the traits raise student
achievement scores on writing standardized assessment measures. This study yielded
some useful methodological findings about how the instruction of writing should be
addressed in schools. The 6+1 Trait Writing Model has not been widely used in
7
elementary schools in the Eastern United States; however the results of this study may
bring attention to this writing method.
Overview of Methodology
This study used a quasi-experimental design with cluster sampling. The task of
the experimental writing instructional method was assigned randomly between two
different, but similar, schools. Four fifth grade classes in each of two schools were used
for the study. All students in the study were given a writing pretest that was evaluated by
three raters. The raters were trained by the researcher on the use of the rubric for
evaluation with anchor papers. The anchor papers chosen for training represented each of
the rating levels on the rubric. A pretest consisting of a narrative writing prompt was
given to all students first. Four fifth grade classes in one school were then instructed
according to the 6+1 Trait Writing Model using a writing unit provided by the researcher
for a total of 22 lessons. Four classes in the second school were instructed according to
the traditional writing workshop method using a writing unit provided by the researcher
for a total of 22 lessons. A posttest writing prompt consisting of a narrative writing
prompt was given at the end of the study and was evaluated by the same three raters.
These raters used a blind review process when evaluating students’ writing. The
researcher looked for differences in means between student gains from pretest to posttest
between the two different method groups using an analysis of covariance (ANCOVA).
The complete methodology is provided in chapter 3.

8
Definition of Terms:
• The 6+1 Trait Writing Model: ideas, organization, voice, word choice, sentence
fluency, conventions, presentation
• Ideas: the meaning and development of the message
• Organization: the internal structure of the piece
• Voice: the way the writer brings the topic to life
• Word Choice: the specific vocabulary the writer uses to convey meaning
• Sentence Fluency: the way the words and phrases flow throughout the text
• Conventions: the mechanical correctness of the piece
• Presentation: the overall appearance of the work
• Rubric: a two-dimensional matrix containing criteria and a rating scale in which
• to measure writing
• Process writing: writing instruction involving prewriting, drafting, revision,
• editing, and publication of work
• Writing Workshop: an instructional method that uses process writing

9
Chapter 2: Review of Related Literature
Writing Development From Past to Present
Writing in the elementary classroom consisted of handwriting and grammar
instruction before the 1980’s. Teachers often linked writing instruction to grammar
instruction in the 1960’s. During the 60’s and early 70’s several studies were conducted
on grammar instruction as a way of teaching writing which resulted in conflicting
outcomes. Finally Hillocks (1986) concluded in his study that indeed teaching grammar
did not have measurable positive effects on student writing performance.
Writing instruction came under attack in the mid 1970’s by educators. The
situation was defined as a writing crisis among this country’s youth (Giroux, 1978). This
writing crisis prompted a revision of the ideas of classroom writing and the best way to
teach writing to children. Around this time members of Congress recognized the need for
improvements and funded writing instruction in an amendment to the Elementary and
Secondary Education Act which named writing as a content area. Applebee (1981)
described a trend in educational research that began to focus on writing as a process
rather than an end product. After the publication of Donald Graves’ writing: Teachers
and Children at Work (1983); writing instruction began to take on new meaning in the
eyes of educators. Writing became more of a process rather than a task or product.
Graves introduced the five step process approach known as topic selection, drafting,
revising, editing, and publishing. He suggested allowing children to write as real writers
do. Graves theorized that children want to write, and it was up to the teachers to channel

10
and nurture that innate desire. As a result of Graves’ work, the writing workshop
philosophy began appearing in elementary schools.
Henk, Marinak, Moore, and Mallette (2003) reported that the No Child Left
Behind Act of 2001 brought nationwide attention to the evaluation and assessment of
writing as a separate construct for American children. This Act placed new demands on
American teachers to ensure that all students become successful readers and writers.
In September of 2003, national attention was brought to writing after the
publication of The Neglected “R”: The Need for a Writing Revolution. This report was
published by the National Commission on Writing in America’s Schools and Colleges
and created the Writing Challenge for the nation. This report unveiled a concern that “the
level of writing in the United States is not what it should be” (p. 7). Several
recommendations were made to improve writing in American schools such as increasing
time for writing and applying new technologies when assessing student writing.
Graham and Perin (2007) in a report to Carnegie Corporation of New York titled
Writing Next: Effective Strategies to Improve Writing of Adolescents in Middle and High
Schools wrote about the writing crisis in American schools and offered recommendations
from research. Eleven key elements were identified to assist in improving students
writing. Some of the key elements mentioned that pertain to this study were writing
strategies, prewriting, process writing approach, study of models, and collaborative
writing.
Pritchard (1987) researched the effect of teacher training on a process writing
approach verses no teacher training on student academic writing achievement. This
research revealed a high correlation between teacher quality and student achievement.

11
Cotton & Northwest Regional Educational Lab (1988) reported on what research
says about teacher training and student writing achievement. They concluded from the
research that staff development programs do not necessarily have to follow a specific
model in order to be effective. Training teachers to use a process approach to writing with
ongoing skill-building lessons is essential for effective teacher inservice programs to
improve student writing achievement.
Theoretical Framework
The theoretical framework for a process approach to writing is based on the work
of John Dewey and the progressive theory of education. Progressivism is derived from
the philosophy known as pragmatism. Gutek, (2004) explains that “For Dewey and the
pragmatists, the successful life is one in which individuals and groups encounter, define,
and solve problems. These problems are the challenges that test our abilities and develop
our intelligence. They lead to our ongoing growth and development.” (p. 73). Dewey was
famous for his democratic approach to education (Englund, 2000; Kauchak & Eggen,
2007). Dewey (1916) believed that children learn socially and by exploring the
environment around them. A key principal of the progressive theory is that children have
a natural desire to learn about the world around them (Knight, 1998). “Progressives favor
learning that is process-orientated and allows children to create their own beliefs and
values through reflection on their interactions with the environment” (Gutek, 2004, p.
301). Out of progressivism, came the ‘whole language’ movement in the late 1970’s in
which children’s literature, daily writing activities, and advanced language activities are
used in the classrooms from the beginning of school (Toch, 1992). The 6+1 Trait Writing
Model and a process approach to writing both reflect this philosophy. Teachers choose
12
writing topics and correlate them to children’s literature around things that are of interest
to the students. Making time daily for writing is a high priority.
The theory of Constructivism has its roots in progressivism. Kauchak & Eggen,
(2008) write “Constructivism is consistent with progressivism and its precursor,
pragmatism. All three emphasize concrete experiences, real-world tasks, and the central
role of the individual in determining reality and promoting learning.” (Kauchack &
Eggen, p. 199). Some key principles of the constructivist theory are student learning
involves real-life, authentic tasks, interaction with others, and interaction with an expert
(Slavin, 2006). “Constructivism, like progressivism, emphasizes socially interactive and
process-oriented "hands-on" learning in which students work collaboratively to expand
and revise their knowledge base” (Airasian & Walsh, 1997, pg. 444). The 6+1 Trait
Writing Model and the process approach to writing both involve these three principles as
well. Using children’s literature as a model for writing is a major component of the 6+1
Trait Writing Model. Children learn to write from authentic writers as well as use real
writers’ language. Children interact with expert writers on a daily basis as they read
children’s literature and use it as a model for writing. Teachers carefully choose literature
that effectively models each of the 6+1 traits so that children can identify with the traits
and in turn use them in their own writing. Children also interact with each other during
the writing process as they conference to gain ideas for writing, revising, and editing their
work. Conferencing is a key component of the writing process as children communicate
writing skills and tactics. Writing instruction taught in this manner follows the
constructivism theory as children are involved in real-life learning experiences, create
authentic writing pieces, and interact with peers and experts.

13
Donald Graves (1983) expressed his theory in Writing: Teachers & Children at Work,
Children want to write. They want to write the first day they attend school. This is
no accident. Before they went to school they marked up the walls, pavements,
newspapers with crayons, chalk, pens or pencils…anything that makes a mark.
The child’s marks say ‘I am’. (p. 3)
Encompassing Graves’ theory that children want to write is what makes the process
approach to writing instruction unique. Children love the sense of story expressed in
children’s literature. The 6+1 Traits Writing Model capitalizes on children’s love for
story, uses children’s literature to model story sense and the 6+1 traits, and teaches them
to write in a similar fashion. A strong connection can be seen between children’s love for
reading and for writing stories.
Process Writing
Janet Emig (1971) is credited with developing the process approach to writing.
Williams (2003) reported that the process approach to teaching writing has been
implemented nationwide in classrooms since the late 1970’s. Cotton, & Northwest
Regional Educational Lab (1988) reported that during the 1980’s, the Northwest Regional
Educational Laboratory conducted numerous studies on effective practices for teaching
writing. The studies found that student achievement was higher when a process approach
to writing was taken versus a product approach. The studies also showed that increased
writing time, along with opportunities for writing, increased student achievement in
writing. Patthey-Chavez, Matsumura, and Valdeacutes (2004) discovered that the
Kentucky Education Reform Act resulted in twice as much classroom writing time in

14
1995 as in 1982. This reform not only increased writing time but also focused on a
process approach to writing instruction, changed statewide assessment practices,
increased the diversity of the writing activities, and required teachers to maintain writing
portfolios containing their students’ works.
A process approach to writing breaks the writing task into smaller, manageable
parts for students. The process approach focuses on the entire essay, not just parts of the
essay or strictly grammar. The process approach is a more personal approach to writing
as individuals spend more time on different steps of the process than others.
Lipson et al. (2000) discussed popular writing process models that consist of
planning, drafting, and revising. Planning is an important step of the writing process; it
allows the writers to organize their writing before they even begin. Deatline-Buchman,
and Jitendra (2006) conducted a study that showed increased student writing achievement
as a result of appropriate planning before writing. Planning is a unique and important
facet of the writing process.
Writing Workshop
Lucy Calkins’ book The Art of Teaching Writing (1994) emphasized Graves’
(1983) philosophy and fine-tuned it into a recipe for writing instruction in the elementary
classroom. Calkins introduced new ideas in writing such as the writing workshop
environment, conferencing, mini-lessons, and integrating literature into the writing
curriculum.
Nancy Atwell’s book In the Middle: Writing, Reading, and Learning with
Adolescents (1987) was another seminal influence in the development of the writing
workshop philosophy. Atwell described seven principles for developing student writers

15
which involve making time for writing, students creating their own topics, teacher
response to student writing, and creating time to read.
The reading/writing workshop developed by these three authors is founded upon
the belief that children love to read and write when they have the freedom to choose in a
literacy-based environment. During the following years, many educators embraced this
new approach to writing instruction in the elementary and middle schools. Hughey and
Slack (2001) added pedagogical constructs to the writing workshop by exploring new
concepts such as multiple intelligences and collaborative groups. Lipson, Mosenthal, and
Mekkelsen (1995) conducted a study on the use of process writing by classroom teachers
and found that the use of such pedagogy was almost unanimous statewide. This study led
to a later study by Lipson, Mosenthal, Daniels, and Woodside-Jiron (2000) which
revealed that the process approach to teaching writing meant different things to different
teachers, resulting in a variety of pedagogies. Williams (2003) contended that over the
years so many approaches to teaching writing emerged, teachers were at a loss in
selecting an appropriate method. Many teachers choose the method that they were taught
as students regardless of its proven effectiveness.
Jasmine and Weiner (2007) concluded in a study involving the use of the writing
workshop in a first grade classroom that students’ enthusiasm and confidence in writing
increased. Using the writing workshop with first graders proved to be an effective
instructional method because students chose their own topics, revised and edited their
work with peers and the teacher, and were able to share their writing with the class.
Behymer (2003) related her kindergarteners’ overall literacy improvements to
adding the writer’s workshop to her curriculum. She includes the workshop everyday in

16
her classroom with an emphasis on phonics, conventions, and social interaction. Students
have shown to be very successful in their writing as a result of providing numerous
structured opportunities for writing.
Furr and Bauman (2003) discovered that the writing workshop can become
frustrating for student’s who struggle with reading and writing. The workshop
atmosphere can often leave students to their own devices without expert guidance.
Teachers often focus on independence in the writing workshop rather than support
students with instruction, models, and techniques. Tompkins (2002) also recognized that
struggling readers and writers ‘require a great deal of support’ during the writing process.
Pollington, Wilcox, and Morrison (2001) conducted a study regarding the effects
of writing workshop (writing process) and traditional instructional methods (teacher-
controlled textbooks and worksheets) on intermediate grade students’ self-perception.
Their findings revealed no significant differences between the scores of the two groups.
They concluded that instructional methods are not as important as individual teacher
skill.
The Reading-Writing Link
Stahl and Pagnucco (1996) conducted a study on first grade teachers and their
pedagogical methods of teaching reading and writing. These researchers discovered that
those teachers who used a whole-language approach and taught reading and writing
together had higher student writing achievement. They found that the students’ writing
growth matched their reading growth when they taught both subjects in unison. Calkins
(1994) described a relationship between good writing and reading. She explained that in
order to create an effective writing workshop environment, the teacher needs to fill it

17
with rich and powerful literature. When students learn to listen to authors’ words and
ideas, they tend to apply those skills to their own writing. Jarmer et al. (2000) emphasized
the importance of ‘Reading to write….writing to read’ and helping students make the
connections. They stated that the 6+1 Trait Writing Model helps make adaptation to
literature possible. Students who become immersed in rich literature approach their own
writing in a more meaningful way. Edwards and Maloy (1992) wrote that “the greater
familiarity children have with words, concepts, and genres, the easier it is for them to
think of topics and ideas to write about for themselves. Written language provides models
of sentence structure, conversation, plot, characterization, story line, detail, and suspense”
(pg. 72).
Atwell (1987) stressed the importance of students being engaged in literature. She
asserted that when students read a variety of authors and genres, they become aware of
different techniques and styles they can incorporate into their own writing. Atwell
encouraged the use of borrowing from literature. She declared that “everyone who writes
anything is a borrower because everything we’ve ever read comes into play when we
write” (Atwell, p. 240). As individuals read and write, they develop a literary heritage.
When students are absorbed into the world of literature, it permeates every area of their
lives.
Glenn (2007) found when students are allowed to write narrative text related to
reading, they comprehend written narrative text better. She contended that reading
improves student writing by providing a model which students can emulate. Glenn
discovered that the converse is true as well; allowing students to write on topics of their
choosing will improve their reading comprehension. When reading and writing are taught

18
together, students become better readers and writers and develop better critical thinking
skills.
The 6 + 1 Trait Writing Model
Nearly twenty years ago, the Northwest Regional Educational Laboratories
[NWREL] (2002) launched an effort to improve writing in the elementary classroom. The
researchers identified six traits of good writing. They knew that the writing programs in
the American classrooms were not effective. The goal was to develop a writing program
that went beyond grammar and mechanics and holistic grading. NWREL explains that
they, “compared reams of student work and discussed the qualities or traits that all ‘good’
writing samples shared. Six traits emerged as the cornerstones of quality writing: ideas,
organization, voice, word choice, sentence fluency, and conventions. Later, presentation
was added to the list” (para.3).
Considering the 6+1 Trait Writing Model’s growing popularity, it is surprising
that there has not been more research done on the method to ensure its effectiveness.
Arter, Spandel, Culham, and Pollard (1994) conducted a study very similar to the one
proposed by this researcher. They tested the 6 Trait Writing Model against traditional
methods in six fifth grade classrooms. The teachers in the treatment group received a one
day training session on implementing the 6 traits into their writing lessons as well as
received instructional materials. Teachers in the control group did not receive any
instruction or materials. These teachers provided a process approach to writing for their
students and the researchers monitored their classrooms during the study. The study
consisted of a pretest, instruction over six months, and a posttest. In this study, a 6+1
Trait Writing Model rubric was used to score student papers. These researchers

19
concluded that students in the treatment group (6 Trait Method) received significant gains
in only one out of six areas, the ideas trait. Two other areas approached significance.
However, Jarmer et al. (2000) reported in their study at Jennie Wilson Elementary
School, that after 3 years of implementation of the 6 Trait Writing Method in all the
grades, student standardized test scores increased each consecutive year.
Spandel (2005) wrote in Creating Writers Through 6-Trait Writing Assessment
and Instruction that not only is the 6+1 Trait Writing Model effective in raising student
test scores, but also, more importantly, the model creates “strong and confident writers in
any context for any purpose” (p.11). This method of instruction assists students in
becoming life-long readers and writers. She, too, emphasized the importance of
demonstrating the traits of writing in real literature. Students learn to discover clues about
the writer’s craft in books and then apply it to their own writing. In order for the 6+1
Trait Writing Model to truly be effective in the classroom, teachers need to be trained on
the content and use it daily in their classroom instruction.
Graham, et al. (2007) reported research indicated that students’ writing does not
improve simply through having the desire or the time to write as Hillock asserted in 1986,
but does improve through strategic instruction. He wrote “The rationale behind explicit
strategy instruction is that it purposely gives students the opportunity to learn to do
independently what experts do when completing a task” (pg. 36). The 6+1 Trait Method
provides this strategic instruction in the different crafts, or traits, of writing. The specific
strategies and traits are introduced during group minilessons through literature and
instruction and then reinforced during individual conferencing. These researchers also
wrote that students need a language to talk about their writing. The 6+1 Trait Writing
20
Method is an approach that provides students with a specific composing vocabulary that
real writers use.
Higgins, Miller, and Wegmann (2006) affirmed that the 6+1 Traits fit effectively
into the writing process and make students’ writing more focused and purposeful. The
Traits method integrates assessment with the writing curriculum and students use the
rubric as a tool for revision. Teachers provide instruction on the 6+1 Traits during
minilessons that assist students in the revision process.
Cunningham and Allington (1999) asserted that students are more successful in a
literacy-rich classroom where authentic reading and writing activities take place. They
explained that authentic reading and writing activities involve reading and writing about
real things. The 6+1 Trait Writing Method is characteristic of a literacy-rich environment
due to the fact that many examples of children’s literature are used as models, and
children are given the opportunity to write as real writers do.
Measuring Writing Achievement
There are several ways of measuring writing achievement. One way is through
developing student portfolios. Portfolios are collections of students’ work over a period
of time. The collection is used to demonstrate growth in writing. This method will not be
used in this study other than as a way of collecting and monitoring student works.
A second procedure for measuring student writing achievement is through a
descriptive writing rubric. Loveland (2005) explained that a rubric is a two-dimensional
matrix used to evaluate different facets of a piece of writing. Loveland also emphasized
that rubrics provide an objective assessment tool for a subjective assignment, such as
writing. Rubrics lead to increased performance by students because they provide them

21
with specific criteria in which the assignment will be graded. One of the first educators to
identify specific writing traits and create a measurable rubric was Paul Diederich (1974).
Later, other educators used his ideas to create their own rubric versions using similar
traits such as Murray (1982), Spandel (2005), and Culham (2003). Culham and Wheeler
(2003) designed a rubric that directly correlates with the 6+1 Trait Writing model. In the
Culham and Wheeler rubric, two sets of criteria are on each axis. Across the top axis are
the numbers one through five used for rating each trait. One is the lowest or weakest
score and five is the strongest. Down the left side of the matrix are listed the 6+1 traits of
writing: ideas, organization, voice, word choice, sentence fluency, conventions, and
presentation. Each trait is rated by the teacher.
Schamber & Mahoney (2006) completed a study that showed using rubrics also
developed critical thinking skills in students by teaching them to self-evaluate their own
writing. The rubric provides clear expectations of what a successful paper entails. Using
rubrics during instruction enhances the instruction. “The strength of using rubrics as a
learning situation or as an assessment strategy lies in its success in developing
metacognitive skills; this ability to think about one’s thinking is critical in a world of
continuous change” (Skillings & Ferrell, 2000, para. 22).
Assessing student writing is crucial to developing student writers according to
Anderson (2005). He focused not only on assessment of students’ final works, but also on
assessing students every day. Through the use of teacher conferences, with individual
students as a part of the writing workshop, teachers are able to learn about their students’
writing habits resulting in assessment and instruction throughout the writing process.

22
Conclusion
Writing instruction has undergone major developments over the past 30 years in
American education. Effective writing instruction in the elementary or middle school
classroom requires a process approach to writing. Consistent and meaningful
instructional time needs to be provided daily for quality writing instruction. Instruction
should always include literature to provide examples of good writing, and to help
generate ideas. The 6+1 Trait Writing Model helps students add style and depth to their
writing. By focusing on the different traits, students get a feel for what real writers do.
Using a rubric to assess writing not only offers an objective look at writing, but also helps
students to think critically, self-assess, and shoot towards a target in their writing.

23
Chapter 3: Methodology
Participants
Students and teachers.
The participants for this study were fifth grade teachers and students from two
elementary schools in South Carolina. Four classes at Sweeney Elementary School
received instruction according to the 6+1 Writing Model for 6 weeks. (All names used in
the study have been changed to ensure privacy and professionalism.) There was an
average of 20 students in each class, with class A = 21, B = 19, C = 20, and D = 19. Four
more fifth grade classes at Pearson Elementary School received instruction according to
the writing workshop method. There was an average of 21 students in each class, with
class A = 21, B = 20, C = 21, and D = 21. The total number of students involved at the
beginning of the study was 162 and the total number of students who completed the study
was 131. Several factors such as absenteeism, relocation, insufficient information for
evaluation, or illegibility of writing for evaluation contributed to the loss of students from
start to finish. Method assignment was done randomly with a coin toss. Both schools had
similar demographics of socioeconomic level, enrollment, culture, and parental
involvement. The two schools were located within the same school district. The
participants were the fifth grade teachers and their students. The average age of the fifth
graders was 10. Similar numbers of males and females were present in each school in
which Sweeney Elementary had 46 boys and 33 girls, and Pearson Elementary had 45
boys and 38 girls. Student ability levels ranged from marginally below grade level to
marginally above grade level.
24
Schools.
The South Carolina Department of Education (2006) generates an annual report
card for each school providing specific information about student enrollment and test
scores at each school. The South Carolina standardized test is called the Palmetto
Achievement Challenge Test (PACT). Similarities between the two schools included
similar numbers of students with limited English Proficiency in which Sweeney had 10
students in Grades 3–5 and Pearson had 8. Both schools had a similar percentage of
students who performed below basic on the annual South Carolina standardized test
(PACT) with Sweeney at 20% and Pearson at 17%. PACT testing enrollment of students
in grades 3–5 was similar with Sweeney’s enrollment at 222 students and Pearson’s
enrollment at 231 students. An additional similarity between the schools was the passing
rate of basic or above on the annual South Carolina standardized tests (PACT). Sweeney
had an 80% pass rate and Pearson had an 83% pass rate in grades 3–5.
There were a few differences between the two schools involved in the study.
Pearson had a slightly larger total enrollment of 553 students as compared to Sweeney’s
479 students. Pearson had a considerably larger number of minorities enrolled in grades
3–5 with 30% as compared to Sweeney’s 9%. Sweeney had a slightly larger percentage
of students who received subsidized meals with 53% verses Pearson’s 39%. Refer to
Table 1 for enrollment comparisons between the two schools involved in the study.
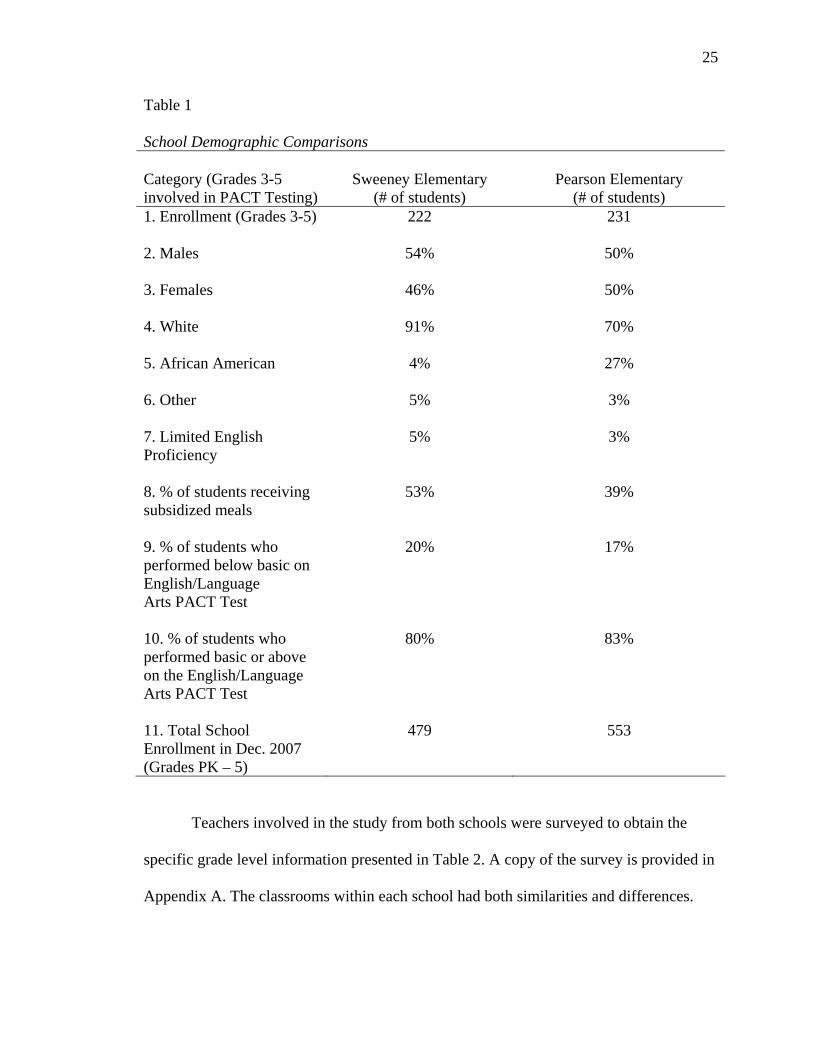
25
Table 1
School Demographic Comparisons Category (Grades 3-5 involved in PACT Testing)
Sweeney Elementary
(# of students)
Pearson Elementary
(# of students) 1. Enrollment (Grades 3-5)
222 231
2. Males
54% 50%
3. Females
46% 50%
4. White
91% 70%
5. African American 4%
27%
6. Other 5% 3%
7. Limited English Proficiency
5% 3%
8. % of students receiving subsidized meals
53% 39%
9. % of students who performed below basic on English/Language Arts PACT Test
20%
17%
10. % of students who performed basic or above on the English/Language Arts PACT Test
80% 83%
11. Total School Enrollment in Dec. 2007 (Grades PK – 5)
479 553
Teachers involved in the study from both schools were surveyed to obtain the
specific grade level information presented in Table 2. A copy of the survey is provided in
Appendix A. The classrooms within each school had both similarities and differences.

26
Both schools also had similar numbers of boys and girls in the classrooms with Sweeney
reported 46 boys and 33 girls, and Pearson reported 45 boys and 38 girls. Another
similarity was the total enrollment and the number of students who were able to finish the
study. Sweeney had 79 students and Pearson had 83 students for total enrollment in fifth
grade. Sweeney had a total of 66 students finish the study as compared to Pearson’s 65.
Completing the study can be defined as those students who completed the pretest, all 6
weeks of instruction, and the posttest.
Differences in the classrooms between the two schools include the number of
years of teaching experience for the teachers. The teachers at Sweeney had a combined
total of 68 years of experience. The teachers at Pearson had a combined total of 35 years
of experience. This difference also was seen in the highest degree held by the teachers at
each school. Three out of four teachers at Sweeney had earned a Master’s Degree in
Elementary Education, whereas only two out of four teachers at Pearson had completed a
Masters degree. Differences were also apparent in how the teachers rated their students’
ability levels. The teachers at Pearson reported 39% of students who were working above
grade level and Sweeney reported only 25%. Pearson reported a greater number of
students working below grade level with 22% students as compared to Sweeney’s below
grade level percentage of 20%. A significant difference between the two schools and the
composition of their classrooms was seen in the total number of minorities present.
Sweeney reported only 10% were minority students among the four fifth grade
classrooms, whereas Pearson reported 26% were minority students among the four
classrooms. Table 2 displays the classroom demographic comparisons between the two
schools.
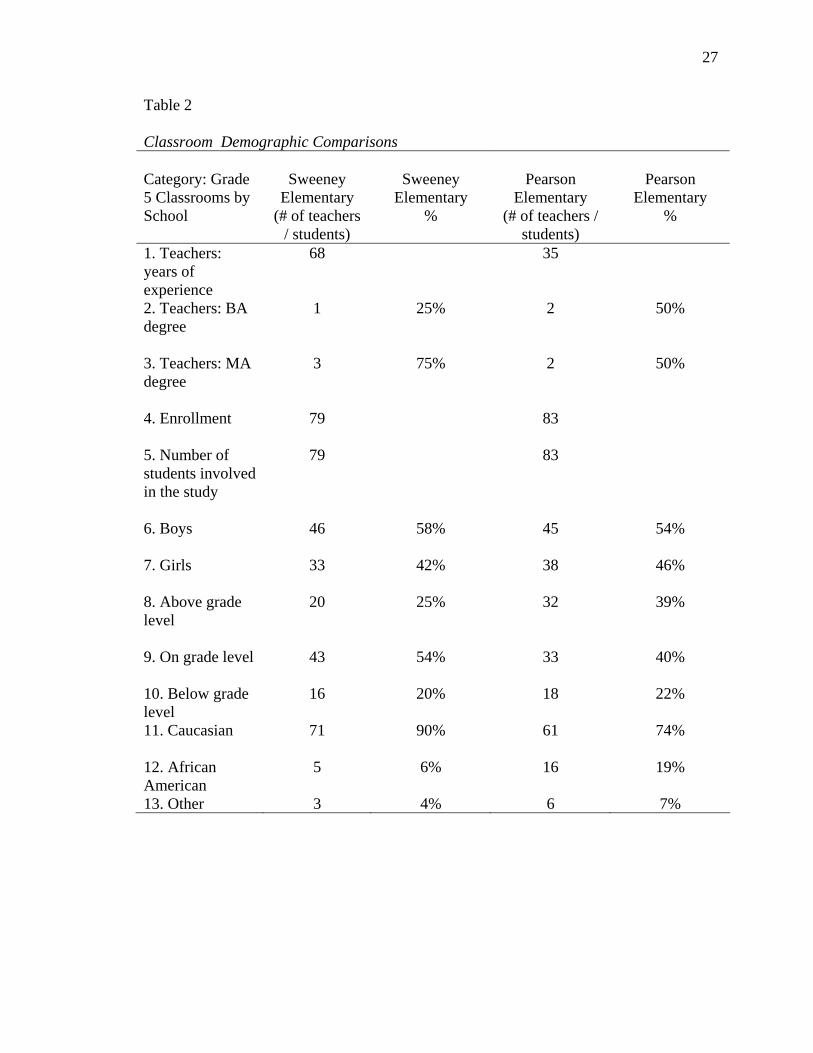
27
Table 2 Classroom Demographic Comparisons Category: Grade 5 Classrooms by School
Sweeney
Elementary (# of teachers
/ students)
Sweeney
Elementary %
Pearson
Elementary (# of teachers /
students)
Pearson
Elementary %
1. Teachers: years of experience
68 35
2. Teachers: BA degree
1 25% 2 50%
3. Teachers: MA degree
3 75% 2 50%
4. Enrollment
79 83
5. Number of students involved in the study
79 83
6. Boys
46 58% 45 54%
7. Girls 33 42% 38
46%
8. Above grade level
20 25% 32 39%
9. On grade level
43 54% 33 40%
10. Below grade level
16 20% 18 22%
11. Caucasian
71 90% 61 74%
12. African American
5 6% 16 19%
13. Other 3 4% 6 7%

28
Instruments
Rubric.
The instrument used to evaluate student progress in writing was a rubric. The
rubric for this study was taken from the South Carolina Palmetto Achievement Challenge
Test (PACT) which is a standards-based accountability measurement of student writing
achievement South Carolina Department of Education (2006). This rubric was chosen
because it includes five out of the six traits from the 6+1 Trait Writing Model, and the
teachers and students involved in the study were familiar with it. The State Department of
Education chose the PACT rubric in 1999 and it has been in use since that time. The Data
Recognition Corporation (DRC) was chosen by the state to administer and score the
PACT testing responses. The DRC used anchor sets and training sets to train the raters.
The training sets were assembled by the DRC in cooperation with the State Department
of Education (SDE). As of 2003, the readers had to qualify by achieving 70% exact
agreement with the consensus scores for each domain on the rubric (South Carolina
Department of Education, 2003).
To ensure reliability, rubrics need to be analytic, topic-specific, and provide
exemplars or rater training according to Jonsson and Svingby (2007). It was also reported
that the more consistent the scores are between raters, the more reliable the assessment is
(Jonsson & Svingby; Moskal & Leydens, 2000). The scoring of the student response for
the PACT writing test consisted of one reader, with 10% receiving a second score by a
second reader to check for reliability. Moskal and Leydens provide the following
definitions for validity and reliability of rubrics. The validity of a rubric rests in the
purpose of the assessment and that the scoring criteria match the objectives. To obtain

29
validity, the rubric should have both content-related evidence and construct-related
evidence. This means the components on the rubric match the instructional goals. The
scoring rubric used for this study is similar to the one used to measure writing
achievement in the South Carolina PACT exam from Grades 3 through 12. It is a five
point rubric measuring four specific writing components. The four components were
content development, organization, voice/word choice, and conventions. The five rating
levels of the rubric from least to greatest were experimenting, emerging, developing,
effective, and strong. This rubric is located in Appendix B. The rubric used for scoring
the South Carolina PACT test is located in Appendix C. The researcher added a fifth
rating level of strong in order to provide more differentiation and growth, the level four
evaluation information for voice was completed which was not provided in the original
rubric, and the word choice component was added to the voice category to match the
constructs of the study. By adding the fifth rating level, using anchor papers as examples
and providing specific rater training, the rubric used in this study met all of the
requirements of reliability and validity stated by Jonsson and Svingby (2007) and Moskal
and Leydens (2000).
The rubric used in the study matched the rubric components with the instructional
goals of the lesson plans. Moskal and Leydens (2000) also define reliability of a rubric as
the consistency of scores. Reliability is achieved through interrater reliability, anchor
papers, and sharing the rubric with students. The reliability of the rubric used in the study
was achieved through using anchor papers to train the raters and providing scoring
practice to achieve interrater reliability. Four anchor papers were presented by the
researcher to the raters during training along with the scoring outcomes for each. The

30
anchor papers represented four out of five of the rating levels on the rubric. After a
discussion on the anchor papers, the raters were given two practice papers to rate using
the rubric. Rater 1 had 95%, rater 2 had 97.5%, and rater 3 had 90% agreement with the
researcher on the practice papers. The rubric was also used during instruction with the
students.
Statement of the Hypothesis
There will be significantly higher achievement in four component areas (as
determined by the rubric utilized for this study) of the treatment group, following the 6+1
trait writing model, as compared to the control group, following the traditional writing
workshop model.
Procedures
The researcher was granted permission by the district Superintendent to conduct
the study in the two schools that were chosen. The two schools were chosen for this study
because they were similar in area, size, student demographics, and proximity. Each
school had four classes of fifth grade students, averaging 20 students in each class. A
coin was flipped to determine which school would be the control group and teach the
traditional approach to writing workshop and which school would teach the manipulated
study or the 6+1 Trait Writing Method. The two methodologies were separated into
different school buildings to help maintain the reliability of the study by preventing
teachers from discussing the content of the instruction. Students were identified by
number rather than name. This coding helped maintain validity when the papers were
scored by the raters. Both groups began with a pretest and ended with a posttest writing
31
assignment using a writing prompt. These were scored using the chosen rubric seen in
Appendix B. The pretest topic and posttest topic were different.
Instructional Units
The researcher wrote lesson plans for a unit of study involving 22 lessons for 6
weeks of instruction according to the Writers Workshop Method. Group A, the control
group, received the traditional method of writing workshop instruction. The teachers in
the control group continued teaching the process approach to writing including
prewriting, drafting, revision, editing, and publication. Students in this group also
received an instructional minilesson each day that addressed specific writing strategies
such as characterization, setting, leads, word choice, imagery, and transitions. Six
literature selections were used during this instructional method to help provide ideas for
writing. Unit outlines along with the literature list for each is provided in Appendix D.
Group B, the independent variable, received writing instruction focusing on the
6+1 Trait Writing Model. Like group A, this group received 22 lessons of instruction for
6 weeks. The unit of study for group B also followed a process approach to writing
including prewriting, drafting, revision, editing, and publication. In addition, this group
received instruction on identifying, using, and applying the 6+1 traits to their writing.
The 6+1 traits consist of ideas, sentence fluency, organization, word choice, voice,
conventions, and presentation. Children’s literature was used extensively in this method.
Seventeen literature selections were used to model and teach each of the six traits and are
provided in Appendix D. Like group A, students in this group also received an
instructional minilesson each day that addressed specific writing strategies such as
characterization, setting, leads, word choice, imagery, and transitions.
32
Before the study began, the researcher provided separate training sessions for both
groups of teachers. The teachers in group A were given the details of the study and
instruction on teaching the writer’s workshop instructional unit. The researcher modeled
teaching a typical lesson for the group. The use of minilessons during instruction was
explained and modeled. Literature selections for instructional use were given to the
teachers at this time.
The teachers in group B also received a training session to provide the details of
the study. The researcher used an instructional PowerPoint presentation to familiarize and
instruct the teachers regarding the 6+1 Trait Writing Model. Each of the 6+1 traits were
explained in detail with examples from the literature was provided. Each teacher received
a class set of the 17 books to be used during their instruction of the 6+1 Trait method. A
typical lesson was modeled for the teachers. Book lists for both methods are provided in
Appendix D.
The previously described writing instructional units with complete lesson plans
were provided by the researcher for the teachers involved in the study. Teachers were
asked not to diverge from the lesson plans provided. All teachers in both groups were
required to set aside an uninterrupted time block for writing instruction of 30-45 minutes
a day, 4 days a week, for 6 weeks. Both groups were given the same narrative writing
prompt for the pretest; and a second narrative writing prompt for the posttest. The pretest
writing prompt was different than the posttest writing prompt. The pretest was given
during lesson 1, and the posttest was given during lesson 24. The pretest and posttest
writing prompts used are displayed in Table 3. The pretest and posttest from both schools
were collected by the researcher and given to three hired raters.

33
Table 3
Pretest and Posttest Narrative Writing Prompts Pretest Prompt Write about the best birthday party ever! This could be a true story
about a wonderful birthday party you have had or one that you attended for someone else. It could also be purely fictional and creative. The choice is up to you!
Posttest Prompt Write about a journey that you have taken. This could be a journey to Grandma’s house, a friend’s house, or a vacation. The story can either be real or completely fictional. The choice is up to you!
Throughout the course of the study, the researcher visited the teachers weekly to
monitor progress, ensure lesson plans were being followed, and to answer questions or
address concerns. At the beginning of each week a new writing topic was introduced to
the writer’s workshop group, and a new trait was introduced to the 6+1 Trait group. At
the conclusion of the study all student writing samples were collected by the researcher to
ensure that lesson plans were followed by the teachers and for use in future research.
Raters
The raters, three pre-service teacher candidates in their senior year, were paid to
evaluate the writing samples. Two of the raters evaluated each student writing sample. To
provide reliability, the third rater was used to evaluate papers that had more than a one-
point discrepancy in any component area given by the first two raters. One rater
evaluated each paper independently using the chosen rubric. The hired raters were not
told the specifics of the study or the identity of the groups.

34
Analysis of Data
Rating procedures.
The students’ writing was scored according to the writing rubric in Appendix B.
The rubric contained four components scored on an ordinal scale of one to five. The four
components chosen for the study consisted of content development, organization,
voice/word choice, and conventions. The five rating levels of the rubric from least to
greatest were experimenting, emerging, developing, effective, and strong. The students
received a score for each component area as well as an overall mean score which was
recorded for statistical analysis.
The rubric used in the study as seen in Appendix B was taken from the South
Carolina Palmetto Achievement Challenge Test (PACT) rubric, which was discussed
earlier in the instruments section and is provided in Appendix C. This study focused on
writing achievement gains in the areas of content development, organization, voice/word
choice, and conventions.
The three raters met on two separate occasions. At the first meeting, the
researcher began with an overview of the chosen rubric. Next, a presentation of four
different anchor papers was displayed while modeling assessment procedures. A fifth
anchor paper was presented and the raters practiced assessing the work. Raters then
compared and discussed their ratings. The raters each took a class set of papers and rated
each according to the rubric. Each student’s work was recorded by the rater in a single
chart, as seen in Table 2. Each rater’s results were unseen by the other raters. After the
completion of a class set, the raters switched sets and started the process again for a
second review. Once a class set had been reviewed and assessed by the first two raters,

35
the researcher tallied the scores, shown in Table 3. The researcher then compared the
scores of the first two raters. If a student’s score in any of the component areas differed
by more than a spread of one, then the third rater assessed the paper using the same
process as the first two raters. During the scoring of the pretests, the third rater was used
51% of the time, and during the scoring of the posttest, she was used 28% of the time.
This use of a third rater ensured the reliability of the assessment process (Jonsson &
Svingby, 2007). After recording all three raters’ scores, the researcher calculated a single
mean score for each student in each component area, as well as a mean holistic score.
These scores were then recorded for the pretest in an Excel spreadsheet for each student
and saved until the final rating. This process continued until all papers had been assessed.
The second meeting of the raters took place after the study concluded. The
researcher reviewed the rubric and anchor sets with the three raters, and the same
assessment process was used. The student data for the post test was recorded in Table 4
for comparison between the two groups.
Table 4 Sample Excel Spreadsheet used to Record Student Data Student # Element Area Pretest Posttest Difference
Content Development
Organization
Voice/Word Choice
Conventions
Mean Score
36
Statistical procedures.
The statistical procedures used in the study compared the mean scores of the two
groups from pretest to posttest. The statistics determined if there were significant gains
with the 6+1 Trait Writing Method (Group B) over the traditional writing method (Group
A) within each writing component and holistically. An ordinal scale of one to five was
used in the writing rubric. After the scores were charted in the Excel document as seen in
Table 3, the difference between each component area from pretest to posttest was
recorded for each student. The mean difference for each student was also calculated. The
data collected was the difference in score for each student from the pretest to the posttest
according to the writing rubric. Two types of data collection were made. The first was
gains made in each of the four rubric component areas. The second was an overall
average score given each student’s paper according to the rubric. It had been
hypothesized that students receiving the 6+1 Trait Writing Model (Group B) instruction
would achieve greater gains from the pretest to the posttest according to the rubric than
those receiving the traditional instructional methods (Group A). The null hypothesis
stated that there would be no difference in improved achievement as measured by the
provided rubric for students in the 6+1 Trait Writing Model group as compared to
students in the traditional writing workshop group.
Differences between the two methods in each component area were recorded as
descriptive data. The software program SPSS for Windows was used to calculate the
statistics needed for this study. An analysis of covariance (ANCOVA) test of significance
for a quasi-experimental design was used to show a difference of means between the two
research groups in each of the four component areas. This test was chosen because a
37
difference in pretest scores existed between the two schools. The 6+1 Trait group
(treatment group) scored higher on the pretest than the writer’s workshop group (control
group). This difference needed to be accounted for in order to determine if one method
yielded a better outcome than the other. The two schools were chosen for the study
because of demographic similarities and similarities in PACT test results. On the
English/Language Arts test, Sweeney and Pearson scored 80% and 83% respectively,
performing basic or above. The researcher does not know why the students in the
treatment group scored higher on the pretest. The ANCOVA test of significance took into
account the differences in pretest scores that existed between the two groups. The
ANCOVA F test evaluated whether the means on the posttest differed for the two method
groups once they were adjusted for the differences on the covariate, or the pretest. Before
the ANCOVA test could be conducted, a Test of the Homogeneity-of-Slopes Assumption
had to be run. In order for the ANCOVA test to be used, the Homogeneity-of-Slopes
Assumption must be accepted, meaning that the slopes of the regression lines were the
same for both groups. Similar regression lines were parallel. Once this was accepted and
determined non-significant with no interaction, then the ANCOVA F test was
successfully conducted. All tests were conducted using alpha = .05.
Summary
Chapter 3 has explained in detail the methodology used in this study on the effect
of different instructional methods on overall student narrative writing achievement for
fifth graders. The selection process for the two schools and the subjects used for the study
were described. Procedures, statistical instruments, and data collection and analysis
documentation were explained. The results and the analysis of the data is included in
38
chapter 4. Chapter 5 contains the summary and discussion of the findings, along with
recommendations for further study.

39
Chapter 4: Data Summary Results
Introduction
The purpose of this study was to identify the difference between the 6+1 Trait
Writing Model and the traditional writing workshop method of teaching writing on fifth
grade student overall writing achievement according to the data supplied by the use of a
writing rubric. The demographics for the two similar schools in the study can be seen in
Table 1, in chapter 3. The subjects for this study were fifth graders from two elementary
schools in South Carolina. Both groups began the study by taking the same writing
pretest containing a single writing prompt. Four classes with an average of 20 students
each from Sweeney Elementary School received instruction according to the 6+1 Writing
Model for 6 weeks. Four more fifth grade classes with an average of 21 students each
from Pearson Elementary School received instruction according to the traditional writing
workshop method. At the conclusion of the instructional period, both groups took the
same writing posttest. The pretest and posttest were assessed by three raters using the
rubric selected for this study. Method assignment was done randomly. Both schools are
located in the same school district and have similar demographics of socioeconomic
level, enrollment, culture, and parental involvement. The subjects were in the fifth grade
with an average age of 10. There were a similar number of males and females. The range
in abilities of students was from marginally below grade level to marginally above grade
level. Table 1 in chapter 3 displays the school demographic comparisons.
The researcher hypothesized that according to the data supplied by the writing
rubric, fifth grade students’ writing would improve one or more points after receiving 6
40
weeks of consistent writing instruction according to the 6+1 Writing Model. Greater
improvement would be noted using the 6+1 Writing Model versus the traditional writing
workshop approach to teaching writing in each of the rubric’s four component areas and
overall.
The null hypotheses stated there would be no significant difference in improved
achievement in the four component areas as measured by the provided rubric for students
in the treatment group, 6+1 Trait Writing Model, as compared to students in the control
group, traditional writing workshop.
An analysis of covariance (ANCOVA) was conducted to explore the impact of the
6 +1 Trait Writing Model on fifth grade students’ writing achievement according to the
data supplied by the rubric. Subjects were divided into two groups, one group received
instruction according to the 6+1 Trait Writing Model, and one group received instruction
according to the traditional writing workshop. All students received instruction in the
four component areas on the rubric; however the 6+1 Trait method provided more
detailed instruction and used numerous models from children’s literature. The traditional
method provided general and non-specific instruction in the four component areas and
used only a minimal amount of children’s literature.
Rubric
The scoring rubric used for this study is a modified version of the South Carolina
PACT exam rubric used to measure writing achievement from Grades 3 through 12. The
rubric chosen for the study consists of five rating levels and four writing components.
The four components chosen for the study consisted of content development,
organization, voice/word choice, and conventions. The researcher added the word choice

41
component to the voice component to ensure content-related evidence for validity of the
rubric. Moskal and Leydens (2000) report content-related evidence is necessary to
provide validity for a rubric, meaning the content of the assessment matches the
assessment tool, or rubric. Word choice reflects voice in writing and this content was
addressed in the unit plans. The five rating levels of the rubric from least to greatest were
experimenting, emerging, developing, effective, and strong. Reliability is achieved
through interrater reliability, anchor papers, and sharing the rubric with students. The
reliability of the rubric used in the study was achieved through using anchor papers to
train the raters and providing scoring practice to achieve interrater reliability. The rubric
was reliable and valid because it was analytical, topic-specific, used exemplars, and
provided rater training (Jonsson & Svingby, 2007; Moskal & Leydens, 2000). This rubric
can be seen in Appendix B.
Statistics
A total of 162 fifth grade students were involved in the study with 131 students
completing the study (N = 131). The traditional writing method group had a total of 65 (n
= 65) and the 6+1 Trait writing method group had a total of 66 (n = 66). The rubric used
to rate student writing used an ordinal scale from one to five, one being the weakest
writing and five being the strongest. The rubric rated students in four component areas:
content development, organization, voice/word choice, and conventions. The researcher
sought to identify differences in gains in each component area in addition to an overall
mean from pretest to posttest for each method group. This chapter presents the research
findings of the study. The first section provides descriptive statistics and the second
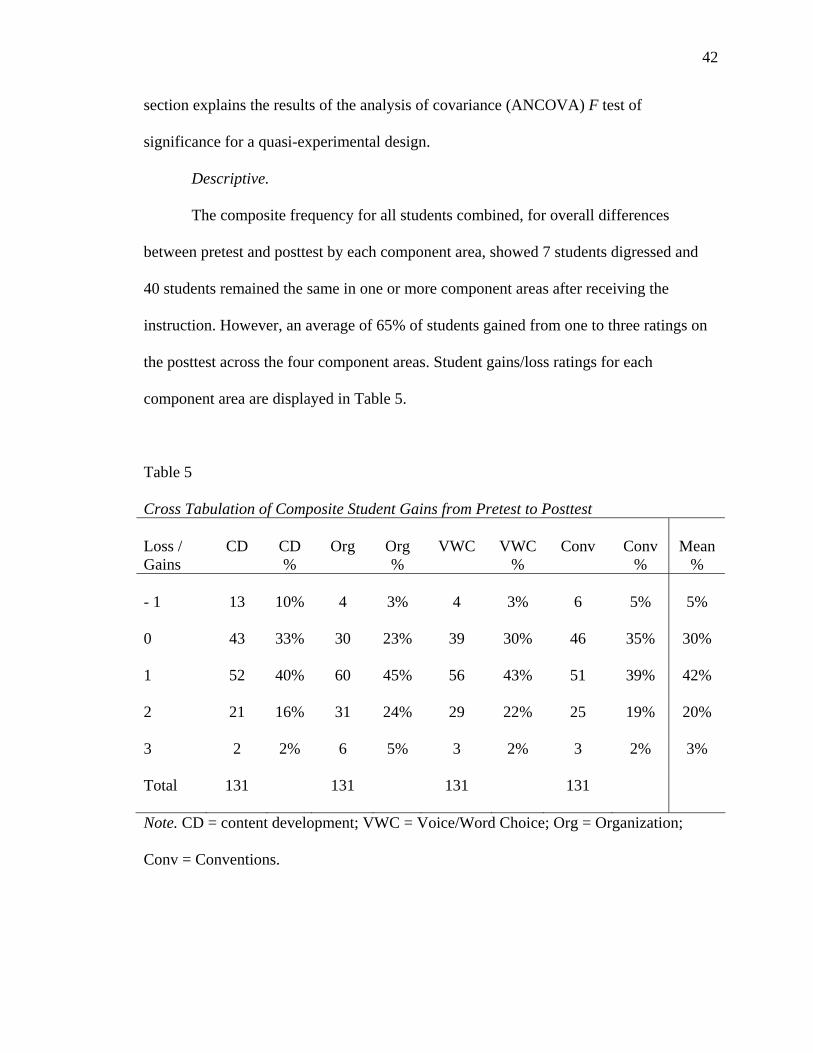
42
section explains the results of the analysis of covariance (ANCOVA) F test of
significance for a quasi-experimental design.
Descriptive.
The composite frequency for all students combined, for overall differences
between pretest and posttest by each component area, showed 7 students digressed and
40 students remained the same in one or more component areas after receiving the
instruction. However, an average of 65% of students gained from one to three ratings on
the posttest across the four component areas. Student gains/loss ratings for each
component area are displayed in Table 5.
Table 5
Cross Tabulation of Composite Student Gains from Pretest to Posttest Loss / Gains
CD
CD %
Org
Org %
VWC
VWC
%
Conv
Conv
%
Mean
% - 1
13
10%
4
3%
4
3%
6
5%
5%
0 43 33% 30 23% 39 30% 46 35% 30%
1 52 40% 60 45% 56 43% 51 39% 42%
2 21 16% 31 24% 29 22% 25 19% 20%
3 2 2% 6 5% 3 2% 3 2% 3%
Total 131 131 131 131
Note. CD = content development; VWC = Voice/Word Choice; Org = Organization;
Conv = Conventions.

43
Overall, the mean gain for content development was .66 with a standard
deviation of .910. The mean gain for organization was 1.03 with a standard deviation of
.868. The mean gain for voice/word choice was .90 with a standard deviation of .840. The
mean gain for conventions was .79 with a standard deviation of .883. The range of the
data suggests that the minimum gain was actually a digression of -1 rating across the four
component areas. The maximum was a gain of 3 ratings across the four component areas.
This data is displayed in Table 6.
Table 6
Frequencies: Composite Component Differences CDDf OrgDf VWCDf ConvDf
N 131 131 131 131
Mean .66 1.03 .90 .79
Std. Deviation .910 .868 .840 .883
Note. CDDf = Content Development Difference; OrgDf = Organization Difference;
VWCDf = Voice/Word Choice Difference; ConvDf = Conventions Difference
The composite frequency for the pretest ratings compared to the posttest ratings
can be seen in Table 7. When looking at the composite mean for the pretest compared to
the posttest, the results show that mean scores increased and the standard deviation gap
narrowed in all four component areas for all students involved in the study. The range
also narrowed in the posttest scores showing that there was a wider spread of scores in
the pretest than in the posttest. In the pretest scores, some students scored the minimum
rating of one in all four components. In the posttest scores, in two out of the four
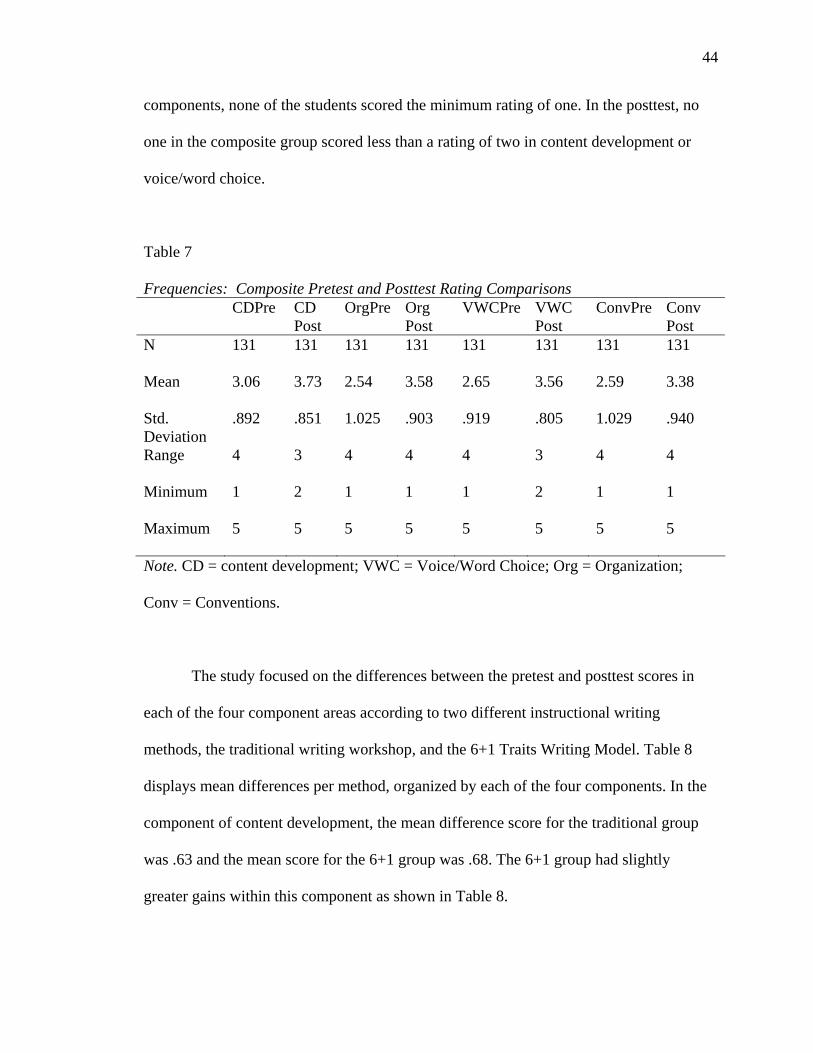
44
components, none of the students scored the minimum rating of one. In the posttest, no
one in the composite group scored less than a rating of two in content development or
voice/word choice.
Table 7
Frequencies: Composite Pretest and Posttest Rating Comparisons CDPre CD
Post OrgPre Org
Post VWCPre VWC
Post ConvPre Conv
Post N 131 131 131 131 131 131 131 131
Mean 3.06 3.73 2.54 3.58 2.65 3.56 2.59 3.38
Std. Deviation
.892 .851 1.025 .903 .919 .805 1.029 .940
Range 4 3 4 4 4 3 4 4
Minimum 1 2 1 1 1 2 1 1
Maximum 5 5 5 5 5 5 5 5
Note. CD = content development; VWC = Voice/Word Choice; Org = Organization;
Conv = Conventions.
The study focused on the differences between the pretest and posttest scores in
each of the four component areas according to two different instructional writing
methods, the traditional writing workshop, and the 6+1 Traits Writing Model. Table 8
displays mean differences per method, organized by each of the four components. In the
component of content development, the mean difference score for the traditional group
was .63 and the mean score for the 6+1 group was .68. The 6+1 group had slightly
greater gains within this component as shown in Table 8.

45
Table 8
Component Differences by Method Method Description CD Org VWC Conv
Mean .63 1.11 1.00 .77 Traditional
Std. Deviation .894 .831 .750 .825
Mean .68 .95 .80 .82 6 + 1
Std. Deviation .931 .902 .915 .943
Note. CD = content development; VWC = Voice/Word Choice; Org = Organization;
Conv = Conventions.
In the organization component, the mean difference score for the traditional group
was 1.11 and for the 6+1 group was .95. The traditional group had greater gains within
this component. In the voice/word choice component, the mean difference score for the
traditional group was 1.00 and for the 6+1 group was .80. The traditional group had
greater gains within this component. In the conventions component, the mean difference
score for the traditional group was .77 and for the 6+1 group was .82. The 6+1 group had
slightly greater gains within this component.
The findings for the individual results for the four different component areas by
method showed that the 6+1 group scored higher means on the pretest and the posttest.
On the pretest and the posttest, the 6+1 group resulted in higher standard deviation scores
in each of the four component areas. These findings can be found in Table 9. Figure 1
displays the component means for the pretest and posttest by method. In Appendix F, the
two graphs display the same information in columns.

46
Table 9
Frequencies: Four Component Pretest Means by Method Method Description CD
Pre CD Post
Org Pre
Org Post
VWC Pre
VWC Post
Conv Pre
Conv Post
Mean 2.78 3.42 2.20 3.31 2.29 3.29 2.26 3.03
N 65 65 65 65 65 65 65 65
Traditional
Std. Deviation
.760 .705 .712 .748 .744 .605 .889 .847
Mean 3.33 4.03 2.88 3.85 3.00 3.82 2.91 3.73
N 66 66 66 66 66 66 66 66
6 + 1
Std. Deviation
.934 .877 1.17 .965 .945 .893 1.063 .904
Note. CD = content development; VWC = Voice/Word Choice; Org = Organization;
Conv = Conventions.
Figure 1
Method Comparisons
0
0.5
1
1.5
2
2.5
3
3.5
4
4.5
CDPre OrgPre VWCPre ConvPre CDPost OrgPost VWcPost ConvPost
Component Pre & Post
Stud
ent M
eans
Traditional6 + 1

47
Figure 1 provides a visual representation of the findings of the study. All subjects
in the study showed growth from pretest to posttest as a result of the instruction in one or
more component areas. The treatment group that received the 6+1 Trait Writing Model
method received higher scores on average in all four component areas on the pretest than
the traditional group. The treatment group also had higher posttest scores at the end of the
study than the traditional group. Upon reviewing the mean gains in each component area
by method in Table 9, the treatment group, 6+1 Trait method, only had greater gains in
two out of the four components, content development and conventions. The traditional
method displayed greater gains from pretest to posttest in the organization and
voice/word choice component areas.
Analysis of Covariance (ANCOVA) Results.
A one-way between-groups analysis of covariance was conducted to compare the
effectiveness of two different writing instructional methods. The treatment group
consisted of the 6+1 Trait Writing Model method of instruction and the control group
consisted of the traditional writing workshop method. Students were given a pretest,
followed by 6 weeks of instruction, and then a posttest. Student writing was scored using
a rubric with four component areas and five rating levels.
The analysis of covariance statistical test was chosen for this study because a
difference existed on the pretest results between the two groups. The treatment group
scored consistently higher on the pretest than the control group. As a result the pretest
scores were considered the covariate in this analysis and were measured prior to the
experimental manipulation. Preliminary checks of the assumptions were conducted to
determine that there were no violations that would influence the outcome of the analysis.
48
The number of students in the control group was 65 and the number of students in
the treatment group was 66. Reported scores are the results of the posttest given at the
conclusion of the study. For the component area of content development, the control
group had a mean score of 3.42 on the rubric with a standard deviation of .705. For the
organization component, the control group had a mean score of 3.31 and a standard
deviation of .748. Under the voice/word choice component the control group had a mean
score of 3.29 and a standard deviation of .605. In the conventions component, the control
group received a mean score of 3.03 and a standard deviation of .847.
In comparison, the treatment group received a mean score of 4.03 and a standard
deviation of .877 for the content development component. For the organization
component, the treatment group received a mean score of 3.85 and a standard deviation
of .965. The treatment group received a mean score of 3.82 and a standard deviation of
.893 in the voice/word choice component area. In the conventions component area the
treatment group received a mean score of 3.73 and a standard deviation of .904. The
treatment group scored on average higher than the control group on both the pretest and
the posttest. This data is displayed in Table 10.

49
Table 10
Descriptive Statistics for the Analysis of Covariance (Posttest) Method Statistic CD Org. VWC Conv.
N 65 65 65 65
Mean 3.42 3.31 3.29 3.03
Traditional
(control)
Std. Deviation .705 .748 .605 .847
N 66 66 66 66
Mean 4.03 3.85 3.82 3.73
6+1
(treatment)
Std. Deviation .877 .965 .893 .904
Before the analysis of covariance was conducted, a test of between-subjects
effects, or homogeneity of slopes, was run. The results of the homogeneity of slopes tests
were not significant for any of the four component areas, (p = .770, .301, .394, .679).
This ensured there was no significant interaction between the treatment and the covariate
(pretest). The results for the homogeneity of slopes were satisfied.
Since the homogeneity of slopes was found not to be significant, the next step was
to proceed with the one-way analysis of covariance (ANCOVA). The purpose of the test
was to determine if the treatment group (6+1 Trait method) achieved greater gains on the
posttest than the control group (writer’s workshop) in any of the four component areas.
The ANCOVA test accounted for the differences in pretest scores that existed between
the two groups. The main effect for content development was found to be significantly
greater gains for the 6+1 Trait method F(1,128) = 8.877, p = .003 (see means in Table
10). Results also indicated that the 6+1 Trait method was significant over the traditional
method for the conventions component F(1,128) = 7.828, p = .006. A strong relationship

50
did exist in these two component areas between the method used and the posttest scores
when pretest scores were adjusted. The voice/word choice component area was not found
to be significant for the treatment method F(1,128) = 3.474, p = .065. The organization
component area was not found to be significant for the method used F(1,128) = 2.473,
p = .118. The effect size for content development and conventions using eta squared
measures a moderate effect at.065 and .058 which are close to .06 (Cohen, 1988). Table
11 displays these results. Organization and voice/word choice components measure a
small effect size at .019 and .026 which are close to .01.
Table 11
Tests of Between-Subjects Effects (Main Effects ANCOVA Results) Source Statistic CD Org. VWC Conv.
df 1 1 1 1
F 8.877 2.473 3.474 7.828
Sig. (p) .003 .118 .065 .006
Eta. Squared .065 .019 .026 .058
Error df 128 128 128 128
R Squared .276 .359 .285 .398
Method
Adjusted R Squared
.265 .349 .274 .389
Note. alpha = .05
Note. CD = content development; VWC = Voice/Word Choice; Org = Organization;
Conv = Conventions.

51
The ANCOVA test used adjusted means to determine F values. Since the pretest
scores between the two method groups were different, it was necessary to use adjusted
means to locate levels of significance. The analysis adjusted the means for both the
treatment and control group so that a fair analysis could be conducted. A comparison of
the actual means in Table 10 to the adjusted means in Table 12 show the adjustment
process brings the means closer together. The ANCOVA analysis tests the relationship
between the pretest scores and the posttest scores while controlling for method using
adjusted means.
The adjusted means used for analysis in the content development component were
(M = 3.524) for the traditional group and (M = 3.924) for the 6+1 group. In the
organization component the adjusted means were (M = 3.473) for the traditional group
and (M = 3.685) for the 6+1 group. The adjusted means for the voice/word choice
component of the rubric were (M = 3.435) for the traditional group and (M = 3.677) for
the 6+1 group. In the conventions component, the adjusted means were (M = 3.191) for
the traditional group and (M = 3.570) for the 6+1 group. Table 12 shows the adjusted
means that were used in the analysis of covariance.

52
Table 12
Estimated Marginal Means (Adjusted Means) Method Statistic CD Org. VWC Conv.
Mean (a) 3.524 3.473 3.435 3.191
Std. Error .093 .093 .089 .094
Lower Bound 3.340 3.289 3.260 3.005
Traditional
95% Confidence Interval Upper Bound 3.707 3.657 3.611 3.376
Mean (a) 3.924 3.685 3.677 3.570
Std. Error .092 .092 .088 .093
Lower Bound 3.741 3.503 3.503 3.386
Upper Bound 4.106 3.868 3.852 3.754
6+1
95% Confidence Interval
(a) Covariates evaluated:
2.59 2.54 2.65 2.59
Note. CD = content development; Org = Organization; VWC = Voice/Word Choice;
Conv = Conventions.
Summary
Descriptive statistics showed that all of the students in the study increased their
writing scores from pretest to posttest as a result of the instruction in one or more
component areas. The descriptive statistics shown in Table 9 also revealed the treatment
group (6+1) scored consistently higher on the pretest than the control group. Because of
the unequal pretest results between the two groups, the researcher conducted an analysis
of covariance (ANCOVA) which has the capability of adjusting for the unequal pretest
scores and offers a fair analysis. The ANCOVA analysis resulted in two out of the four
component areas, content development and conventions, having significant gains for the
treatment group (6+1 Trait method); and the other two component areas, voice/word

53
choice and organization, having greater gains for the control group (writer’s workshop).
Based on these findings, the hypothesis could not be supported. A more detailed
summary and a discussion of the findings are presented in chapter 5.
54
Chapter 5: Results of the Study
The final chapter of this dissertation reviews the problem statement and the
methodology involved in the study. A summary of the results and interpretations of the
findings are provided. Finally, a discussion on the relationship to prior research,
implications of the study, limitations of the study, and suggestions for additional research
are presented.
Statement of the Problem
As was stated in chapter 1, the statement of the problem focused on the effect of
the 6+1 Trait Writing Model on fifth grade overall writing achievement compared to the
traditional writing workshop as measured by a rubric. The purpose of the study was to
determine if the methodology of the 6+1 Trait Writing Model, which heavily emphasizes
modeling from children’s literature with special emphasis on the distinct traits of writing,
would improve overall fifth grade student writing achievement over a period of 6 weeks.
The hypothesis was the 6+1 method would yield greater gains in each of the four
component areas on the rubric from pretest to posttest than the traditional writing
workshop method at the end of the study. The null hypothesis stated that there would be
no difference in achievement between the two method groups after 6 weeks of instruction
in any of the four component areas on the rubric.
Review of the Methodology
The participants for this study were fifth grade teachers and students from two
elementary schools in South Carolina. Four classes with an average of 20 students each
from Sweeney Elementary School received instruction according to the 6+1 Writing

55
Model for 6 weeks. Four additional fifth grade classes with an average of 21 students
each from Pearson Elementary School received instruction according to the writing
workshop method. The total number of students involved at the beginning of the study
was 162 and the total number of students who completed the study was 131. Several
factors such as absenteeism, relocation, insufficient information for evaluation, or
illegibility of writing for evaluation contributed to the loss of students from start to finish.
Method assignment was done randomly with a coin toss. Both schools have similar
demographics of socioeconomic level, enrollment, culture, and parental involvement. The
participants were the fifth grade teachers and their students. The average age of the fifth
graders was 10. Similar numbers of males and females were present in each school in
which Sweeney Elementary had 46 boys and 33 girls, and Pearson Elementary had 45
boys and 38 girls. Student ability levels ranged from marginally below grade level, to
marginally above grade level.
The South Carolina Department of Education (2006) generates an annual report
card for each school providing specific information regarding the student enrollment and
test scores at each school. This report showed that the two schools chosen for this study
were similar in area, size, socioeconomic status, and student bodies. Each school had four
classes of fifth grade students, averaging 20 students in each class. A coin was flipped to
determine which school would receive the traditional approach to writing workshop, and
which school would receive the 6+1 Trait Writing Method. Refer to Table 1 for
enrollment comparisons between the two schools.
The rubric for this study was adapted from the South Carolina Palmetto
Achievement Challenge Test (PACT) which is a standards-based accountability
56
measurement of student achievement. The scoring rubric is modeled after the one used to
measure writing achievement in South Carolina from Grades 3 through 12. It is a five
point rubric measuring four specific writing components, content development,
organization, voice/word choice, and conventions. The five rating levels of the rubric
from least to greatest were experimenting, emerging, developing, effective, and strong.
This rubric can be seen in Appendix B. The original rubric used for scoring the South
Carolina PACT test from which the rubric for the study was taken can be seen in
Appendix C. The researcher added a fifth rating level of strong in order to provide more
differentiation and growth, the level four evaluation information for voice was completed
which was not provided in the original rubric, and the word choice component was added
to the voice category to match the constructs of the study. By adding the fifth rating level
using anchor papers as examples and providing specific rater training, the rubric used in
this study met all of the requirements of reliability and validity stated by Jonsson and
Svingby (2007) and Moskal and Leydens (2000).
The researcher created two different units of instruction, one using the 6+1 Trait
Method and one using the traditional writing workshop method. Each school was
assigned a method. Both groups began with a pretest and ended with a posttest writing
assignment using a writing prompt. These were scored using the chosen rubric seen in
Appendix B. The pretest and posttest topics were different.
Following the pretest, each teacher taught the specific assigned writing
instructional unit for the next 22 lessons. The study concluded when both groups took the
same writing posttest. Student pretest and posttest writing was evaluated according to the
rubric (Appendix B) by three hired raters. The first two raters scored each students’

57
writing, and the third rater scored the writing if the first two differed by more than one
point in any of the four component areas. The researcher then found the mean score for
the students in each of the four rubric component areas and an overall holistic score. The
study focused on pretest to posttest differences and gains between the two method
groups.
To analyze the findings for the study, descriptive statistics produced the gains
made by each student according to the assigned method of instruction. This data was
recorded and compared. The software program SPSS for Windows was used to calculate
the statistics for this study.
An analysis of covariance (ANCOVA) test of significance for a quasi-
experimental design was used to show a difference of means between the two research
groups in each of the four component areas. The ANCOVA F test of significance took
into account the differences in pretest scores that existed between the two groups. The
6+1 Trait group (treatment group) scored higher on the pretest than the writer’s workshop
group (control group). This difference needed to be accounted for to determine if one
method yielded a better outcome than the other. The ANCOVA F test evaluated whether
the means on the posttest differ for the two method groups once they are adjusted for the
differences on the covariate, or the pretest. Before the ANCOVA test was conducted, a
test of the homogeneity-of-slopes assumption was run. In order for the ANCOVA test to
be used, the homogeneity-of-slopes assumption was accepted, meaning that the slopes of
the regression lines were the same for both groups. Similar regression lines were parallel.
Once this was accepted and determined non-significant with no interaction, then the

58
ANCOVA F test was successfully conducted. All tests were conducted using alpha = .05.
These statistical results were presented in chapter 4.
Summary of the Results
The descriptive results of this study indicated that as a whole, all of the student
participants improved their writing scores after receiving the instruction in one or more
component areas. The sample size was 131 students total (N=131). The mean pretest
scores for the composite group were content development = 3.06, organization = 2.54,
voice/word choice = 2.65, and conventions = 2.59. At the end of the study the means
increased for the whole group on the posttest to content development = 3.73, organization
= 3.58, voice/word choice = 3.56, and conventions = 3.38. The mean average for all
students was a one point gain from pretest to posttest. An average of 5% of students had a
decrease in score and an average of 30% remained the same in one or more component
areas. An average of 42% had a one point gain, 20% obtained a two point gain, and 3%
obtained a three point gain. These composite student gains can be seen in Table 5 in
chapter 4.
The result differences by method were split evenly. The mean amount of gain was
calculated by finding the mean difference from pretest to posttest for all subjects
according to method of instruction. The mean difference for the 6+1 Trait Writing Model
group displayed greater gains in the component areas of content development and
conventions. The traditional writing workshop group displayed greater gains in
organization and voice/word choice. The results of these scores by method can be seen in
Table 13 and in greater detail in Table 8.

59
Table 13
Component Differences by Method Method Description Content /
DevelopmentOrganization Voice/
Word Choice Conventions
Trad. Mean .63 1.11 1.00 .77
6 +1 Mean .68 .95 .80 .82
The findings for the individual results for the four different component areas by
method showed the 6+1 group scored higher means on the pretest, and scored higher
means on the posttest. On the pretest and the posttest, the 6+1 group had higher standard
deviation scores in each of the four component areas. These findings are presented in
Table 9 in chapter 4. Figure 1 displays the component means for the pretest and posttest
by method in rows. In Appendix E, the graphs display the same information in columns.
The one-way between-groups analysis of covariance was conducted to compare
the effectiveness of two different writing instructional methods. The results of the
analysis of covariance (ANCOVA) were more helpful in determining what happened in
the study between the two methods since the pretest scores of the two schools were
different. The ANCOVA test used adjusted means to determine F values. As seen in
Figure 1 and Table 9, the 6+1 group consistently scored higher in all four component
areas. This confound, or the difference in pretest scores, impacted the statistical analysis.
The ANCOVA test has the ability to take into account this confound. Prior to the
ANCOVA test, a test of between-subjects effects, or homogeneity-of-slopes test was
conducted. This test revealed that the homogeneity-of-slopes tests were not significant for
any of the four component areas, therefore ensuring no significant interaction between
the treatment and the covariate (pretest). Accepting these results, the ANCOVA test was

60
conducted. The ANCOVA test showed significance in two out of the four component
areas. The area of content development was significant (p = .003) when alpha = .05, and
the component area of conventions also was significant (p = .006) meaning that the 6+1
group achieved higher gains on the posttest as a result of the instruction. The voice/word
choice component was not significant (p = .065) showing that the instructional method
used did not effect outcomes. The component area of organization was not significant
(p = .118) showing that the instructional method used did not effect outcomes. The
ANCOVA test, by taking into account the differences in pretest scores between the two
groups, found two out of four component areas were significant for the 6+1 Trait Writing
Model method.
Discussion of the Results
Interpretation of the Findings.
It is important to note that all student participants in the study increased their
scores from pretest to posttest in one or more component areas as a result of the
instruction. The purpose of this study was to determine if the 6+1 Trait Writing Model
method was superior to the traditional writing workshop in terms of improved student
writing achievement. This study resulted in an even split between the four component
areas on the rubric. The 6+1 method yielded greater gains in two component areas,
content development and conventions. The traditional writing workshop method yielded
greater gains in two other component areas, organization and voice/word choice. Since
the gains are evenly split, the null hypotheses cannot be rejected. However, two out of the
four component areas for this study did indicate a difference in instructional method in
favor of the 6+1 Trait Writing Model.

61
The researcher has several possible explanations for these findings. An obvious
pretest difference between the two schools is identified as the confound. Since the 6+1
group started out higher, they had less room for growth and improvement. The 6+1
method group ended with higher scores in all four component areas. The ANCOVA test
revealed a level of significance in two out of four component areas. The analysis of
covariance test has the ability to account for the differences in pretest scores and use
adjusted means when conducting the analysis. Using the ANCOVA test, a level of
significance was found for two out of four component areas, indicating that the 6+1 Trait
Writing method was more effective in achieving higher student outcomes. Figure 1 and
Table 8 display the differences in pretest and posttest means for both groups.
A second possible explanation for the findings lies in the methodology. The
researcher provided the unit of instruction for both method groups with similar
expectations. The researcher requested that all teachers reserve 30 – 45 minutes a day for
four days each week specifically for writing. Both method groups received detailed
lesson plans from the researcher according to their assigned method. Both method units
included literature (although the 6+1 group had three times more literature to use during
instruction), minilessons on writing technique, and reserved time for writing. Both
method groups were required to complete the same number of writing topics as well as
the same number of instructional lessons. For this study both method groups may have
given writing instruction more time and perhaps a higher quality of instruction than they
have done in the past. If there had been a way to conduct the study while having the
control group continue with normal everyday instruction, it may have been possible that
the 6+1 method would have experienced greater gains. Since the researcher provided

62
both method groups with quality instruction and required time for writing, both groups
experienced achievement gains.
A third possible explanation for the findings is that the rubric data range was too
small. A rubric with a range of six levels of measurement may be better than only five; it
would provide more room for growth as well as prevent a middle measure. A
combination of any of these three possibilities could have impacted the study enough to
explain the findings.
Relationship to Prior Research
Many connections can be made from the results of this study to prior research. To
begin with, the 6+1 Trait Writing Model incorporates a large amount of children’s
literature within the lessons. The theory behind the method is that children learn to write
like real authors and use similar language, thus the six traits of ideas, organization, voice,
word choice, sentence fluency, and conventions become common vocabulary.
Presentation was added later which is the plus one (NWREL, 2002).
Jarmer et al. (2000) emphasized the importance of the reading-writing connection.
They stated that the 6+1 Trait Writing Model helps students make adaptation to literature
possible. When students learn to listen to author’s words and ideas, then they can in turn
apply those ideas to their own writing. Cunningham and Allington (1999) wrote students
are more successful in a literacy-rich classroom where authentic reading and writing
activities take place. They asserted authentic reading and writing activities involve
reading and writing about real things. The 6+1 Trait Writing Model is characteristic of a
literacy-rich environment because a large amount of children’s literature is used as a
model, and children are given the opportunity to write as real writers do.
63
Arter et al. (1994) conducted a similar study to this one involving six classes of
fifth grade students. These researchers concluded that students in the treatment group
(6+1 Trait Method) received significant gains in one out of six trait areas, with two other
areas approaching significance. The current study resulted in significant gains in two out
of four component areas. Jarmer et al. (2000) reported in their study at Jennie Wilson
Elementary School, that after three years of implementation of the 6+1 Trait Writing
Method in all grades, student standardized test scores increased each consecutive year.
Learning to write through the use of literature and the 6+1 Traits not only is
effective in raising test scores but also in creating strong and confident writers. (Spandel,
2005) It is important to demonstrate the writing traits in real literature for children. Using
the 6+1 Trait method in the classroom as part of the daily writing instruction is effective
when teachers are trained in the content and its presentation. Corden (2003) concluded
from his study that providing models for writing through texts helps children to develop
their awareness of how texts are constructed. He also stated that the children in the study
gradually developed a literary language from discussing texts and were able to apply it to
their own writing.
This researcher concluded through the findings of the current study that both
quality instruction and time for writing improve student writing achievement. Graham et
al. (2007) reported research has shown that students’ writing does not improve simply
through having the desire or time to write. They contended strategic quality instruction is
needed as well. In the current study, this researcher provided the treatment and the
control groups with strategic quality instruction through two different methods which
resulted in all student participants achieving writing gains. Higgins, Miller, and

64
Wegmann (2006) concluded from their research that by combining the writer’s
workshop, process writing, and instruction on the 6+1 Traits helps students meet state
standards in writing and develops skills needed to be effective writers.
Cotton & Northwest Regional Educational Lab (1988) reported on what research
says about teacher training and student writing achievement. They concluded from the
research that staff development programs do not necessarily have to follow a specific
model in order to be effective. Training teachers to use a process approach to writing with
ongoing skill-building lessons are essential for effective teacher inservice programs to
improve student writing achievement.
One reason for the success of the 6+1 Trait Writing Model is its use of a
specifically-created rubric encompassing the six traits for the component areas. The study
previously mentioned by Arter et al. (1994) focused on the use of the 6+1 Trait rubric and
its effects on student writing achievement. Teaching students about rubrics and using
them as a guide for their writing does improve writing skills. Schamber and Mahoney
(2006) also completed a study involving the use of rubrics. They determined that using
rubrics develops critical thinking skills in students by teaching them to self-evaluate their
own writing. It provides clear expectations of what a successful paper entails. The rubric
used in the current study was similar to the 6+1 Trait rubric involving four component
areas: content development, organization, voice/word choice, and conventions. This
rubric can be seen in Appendix B. The rubric used in the study was taken from the South
Carolina PACT test rubric which can be seen in Appendix C.
Prior research showed involving the reading-writing connection, using children’s
literature as a model for writing, requiring increased time for writing as well as
65
implementing strategic instruction, and using rubrics lead to increased student writing
achievement. The 6+1 Trait Writing Model method used in the treatment group of this
study included all of these things. These strategies were also included on a smaller scale
in the control group, and as a result, both groups experienced significant gains in
achievement.
Implications of the Findings
Several implications can be drawn from this study. Because of No Child Left
Behind, writing is a tested academic skill in Grades 3-12 in most states. When
instructional time becomes limited in the elementary classroom, writing is usually the
first content area to go. Quality instruction and committed time for writing is difficult to
find in elementary schools. The majority of elementary schools do not have a required
curriculum or specific method adopted by the district. There can be huge inconsistencies
within schools, and even from teacher to teacher, in writing instructional methods. Many
elementary teachers, both veteran and beginning teachers, feel inadequate when it comes
to teaching writing to their students. The goal of this study was to see if the 6+1 Trait
Writing Method increased student writing achievement over time. The results showed
that it did significantly improve writing, but only in two out of four component areas on
the rubric as compared to the traditional writer’s workshop method. However, other
implications can be gathered from the study.
First, in order to improve student achievement in writing, teachers need to provide
reserved time for writing on a daily basis. Teachers need to maximize instructional time
as much as possible so that writing instruction does not get slighted or ignored.

66
The second thing that can be learned from the study is that schools need to choose
a writing curriculum and then train their teachers on how to implement it. Quality
instruction has been proven to increase standardized test scores in writing. When there
are inconsistencies from teacher to teacher and grade level to grade level, students are at a
disadvantage. The quality of writing instruction may not be the same for all students and
some may not receive instruction in writing at all. To prevent this, districts and schools
need to choose a method carefully and implement it. The 6+1 Trait Model has been
proven effective as a method to teach students to write like real writers and to create
authentic writing pieces. The process approach to writing method has also been proven
effective.
A third implication from this study is the fact children learn to write better when
literature is used as a model. This method relies on children’s literature to teach the
individual traits and vocabulary for writing. Children use and adopt a professional
writer’s language when using the 6+1 traits. Children learn about writing from reading
and hearing real books by real authors. From hearing stories, they develop their own
sense of story, plot, characterization, and setting. Children can borrow ideas from
literature to improve their own writing. Many teachers do not realize the impact
children’s literature has on student writing.
The last implication from this study is the value of using a rubric as part of
writing instruction to increase student writing achievement. The rubric in this study was
used as a part of the instruction in both method groups. Providing a rubric during the
instructional phase gives students a goal for writing, provides the elements upon which

67
they will be scored, and assists children in self-evaluating their own writing. Many
teachers do not know the advantages of using a rubric during writing instruction.
Although the null hypotheses could not be rejected in this study, several
implications can be made. Providing time for writing, implementing quality instruction
which includes literature, and using a scoring rubric during instruction all help to increase
student writing achievement. The fact that each of these things were provided for both
groups may have contributed to the inconclusive findings of this study. Both groups
experienced gains in writing achievement.
Limitations of This Study
One limitation in this study was that the researcher provided both method groups
with quality instructional units. The experimental group received a unit and training on
the 6+1 Trait Writing Model, and the control group, the traditional writing workshop,
also received a unit of instruction in a general writing workshop. The study may have
resulted differently had the control group continued with its current writing instruction.
Another limitation, as discussed earlier, was that both groups were required to
provide a specific time for writing, to include children’s literature as a model, and to use
the provided rubric during instruction. These elements have been shown by research to
improve student writing achievement and indeed all students involved in the study
experienced gains from pretest to posttest as a result of the instruction, regardless of
which method was used.
Third, the length of the study may have been too short. Teachers struggled to get
all of the instruction and writing completed within the 6 week time period. The study may
be improved by increasing the instructional time to a semester or an entire year.
68
Finally, the key limitation of this study was the experimental group received
higher scores overall on the pretest. This demonstrated unequal abilities among students
between the two elementary schools, even though the two schools were very similar in
academics and demographics. Because the experimental group scored higher on the
pretest, it had less room for growth on the five point rubric scale. The range of scale used
may not have been great enough. However, the ANCOVA analysis test was able to
account for these differences through the use of adjusted means.
Recommendations for Future Research
One recommendation for future research would be to increase the length of time
for the study to be conducted. A semester or an academic year might yield interesting
results. Another possibility would be to involve a larger sample size and increase the
number of schools involved in the study. In addition to focusing on the instructional
method used, one could study the effect of the instruction on boys versus girls to
determine which gender responded better to each of the methods used. Additional writing
programs and methods could be studied as well, such as, the Step Up To Writing
Program. Finally, a study could be conducted on the effect of providing staff
development and teacher training in writing methods on student writing achievement.

69
References
Airasian, P.W. & Walsh, M.E. (1997). Constructivist cautions. Phi Delta Kappan, 78(6),
444. Retrieved June 24, 2008, from Education Research Complete database.
Anderson, C. (2005). Assessing writers. Portsmouth, NH: Heinemann.
Applebee, A. (1981). Looking at writing. Educational Leadership, 38(6), 458. Retrieved
February 16, 2007, from the Academic Search Premier database.
Arter, J.A., Spandel, V., Culham, R., & Pollard, J. (1994). The impact of training students
to be self-assessors of writing. Paper presented at the American Education
Research Association, New Orleans, LA.
Atwell, N. (1987). In the middle: Writing, reading, and learning with adolescents.
Portsmouth, NH: Heinemann.
Behymer, A. (2003). Kindergarten writing workshop. Reading Teacher, 57(1), 85-88.
Retrieved December 6, 2008, from Academic Search Complete database.
Calkins, L. (1994). The art of teaching writing (2nd ed.). Portsmouth, NH: Heinemann.
Cohen, J. (1988). Statistical power analysis for the behavioral sciences. Hillside, NJ:
Erlbaum.
Corden, R. (2003). Writing is more than ‘exciting’: Equipping primary children to
become reflective writers. Reading, 37(1), 18-26. Retrieved December 6, 2008,
from Academic Search Complete database.
Cotton, K. & Northwest Regional Educational Lab., (1988). Teaching composition:
Research on effective practices. Topical synthesis no. 2. School improvement
research series II. Retrieved February 16, 2007, from http://www.nwrel.org.

70
Culham, R. (2003). 6 + 1 Traits of writing: The complete guide grades 3 and up. New York: Scholastic. Culham, R. & Wheeler, A. (2003). 40 Reproducible forms for the writing traits classroom. New York: Scholastic. Cunningham, P.M. & Allington, R.L. (1999). Classrooms that work: They can all read and write. New York: Addison-Wesley Longman Publishers, Inc. Deatline-Buchman, A. & Jitendra, A. (2006). Enhancing argumentative essay writing of fourth-grade students with learning disabilities. Learning Disability Quarterly, 29(1), 39-54. Retrieved February 16, 2007, from the Academic Search Premier database. Dewey, J. (1916). Democracy and education. New York: Macmillan.
Diederich, P.B. (1974). Measuring growth in English. Urbana, IL: NCTE.
Edwards, S.A. & Maloy, R.W. (1992). Kids have all the write stuff: Inspiring your children to put pencil to paper. New York, NY: Penguin Books. Emig, J. (1971). The composing processes of twelfth graders. Urbana, IL: National Council of Teachers of English. Englund, T. (2000). Rethinking democracy and education: Towards an education of deliberative citizens. Journal of Curriculum Studie, 32(2), 305-313. Retrieved June 23, 2008, from Academic Search Premier database. Furr, D., & Bauman, G. (2003). Struggling readers get hooked on writing. Reading Teacher, 56(6), 518. Retrieved December 6, 2008, from Academic Search Complete database.

71
Giroux, H.A. (1978). Beyond the writing crisis. Journal of Education, 160(4), 40-49. Retrieved January 19, 2008, from the Academic Search Premier database. Glenn, W.J. (2007). Real writers as aware readers: Writing creatively as a means to develop reading skills. Journal of Adolescent & Adult Literacy, 51(1), 10-20. Retrieved March 13, 2008, from Academic Search Premier database. Graham, S., MacArthur, C.A., & Fitzgerald, H. (2007). Best practices in writing instruction. New York: The Guilford Press. Graham, S., & Perin, D. (2007) Writing next: Effective strategies to improve writing of
adolescents in middle and high schools. A Report to Carnegie Corporation of
New York. Washington DC: Alliance for Excellent Education.
Graves, D.H. (1983). Writing: Teachers and children at work. Exeter, NH, and London: Heinemann. Gutek, G.L. (2004). Philosophical and ideological voices in education. New York: Pearson Education, Inc. Henk, W., Marinak, B., Moore, J., & Mallette, M. (2003). The writing observation framework: A guide for refining and validating writing instruction. Reading Teacher, 57(4), 322-333. Retrieved February 11, 2007, from the Academic Search Premier database. Higgins, B., Miller, M. & Wegmann, S. (2006). Teaching to the test…not! Balancing best Practice and testing requirements in writing. Reading Teacher, 60(4), 310-319. Retrieved December 6, 2008 from the Academic Search Premier database. Hillocks, G. (1986). Research on written compositions: New directions for teaching. Urbana, IL: National Conference on Research in English.

72
Hughey, J. B. & Slack, C. (2001). Teaching children to write: Theory into practice. Upper Saddle River, NJ: Merrill.
Jarmer, D., Kozol, M., Nelson, S., & Salsberry, T. (2000). Six-trait writing model
improves scores at Jennie Wilson Elementary. Journal of School Improvement,
1(2), 29-32.
Jasmine, J. & Weiner, W. (2007). The effects of writing workshop on abilities of first
grade students to become confident and independent writers. Early Childhood
Education Journal. 35(2). 131-139. Retrieved December 6, 2008, from the
Academic Search Premier database.
Jonsson, A. & Svingby, G. (2007). The use of scoring rubrics: Reliability, validity and
educational consequences. Educational Research Revie, 2, 130-144.
Kauchack, D.P. & Eggen, P.D. (2007). Learning and teaching research based methods.
New York: Pearson Education, Inc.
Kauchack, D. & Eggen, P. (2008). Introduction to teaching: Becoming a professional.
Upper Saddle River, NJ: Pearson Education, Inc.
Knight, G.R. (1998). Philosophy & education: An introduction in Christian perspective.
Berrien Springs, MI: Andrews University Press.
Lipson, M.Y., Mosenthal, J.H., & Mekkelsen, J.E. (1995). Change: Teachers as agents,
teachers as targets. Paper presented at the annual meeting of the National
Reading Conference, New Orleans, LA.
Lipson, M.Y., Mosenthal, J.H., Daniels, P., & Woodside-Jiron, H. (2000). Process
writing in the classrooms of eleven fifth-grade teachers with different orientations to teaching and learning. The Elementary School Journal. 101.(2). Retrieved
73
February 11, 2007, from the Academic Search Premier database.
Loveland, T. (2005). Writing standards-based rubrics for technology education
classrooms. Technology Teacher, 65(2), 19-30. Retrieved February 17, 2007,
from the Academic Search Premier database.
Moskal, B.M. & Leydens, J.A. (2000). Scoring rubric development: Validity and
reliability. Practicial Assessment, Research & Evaluation, 7(10), 71-81.
Murray, D.M. (1982). Learning by teaching: Selected articles in writing and teaching.
Portsmouth, NH: Boynton/Cook.
National Commission on Writing in America’s Schools and Colleges. (2003). The
neglected “R”: The need for a writing revolution. Princeton, NJ: College Entrance Examination Board.
No Child Left Behind Act of 2001, Pub.L.No. 107-110,115 Stat. 1426(2002). Retrieved February 16, 2007, from http://www.ed.gov/offices/OESE/esea
Northwest Regional Educational Laboratory. (2002). Retrieved February 17, 2007, from: http://www.nwrel.org/.
Patthey-Chavez, G., Matsumura, L., & Valdes, R. (2004). Investigating the process
approach to writing instruction in urban middle schools. Journal of Adolescent &
Adult Literacy, 47(6), 462-477. Retrieved February 11, 2007, from the Academic
Search Premier database.
Pollington, M. Wilcox, B., & Morrison, T. (2001). Self-perception in writing: The effect
of writing workshop and traditional instruction on intermediate grade students.
Reading Psychology, 22(4), 249-265. Retrieved December 6, 2008, from
Academic Search Complete database.

74
Pritchard, R.J. (1987). Effects on student writing of teacher training in the National
Writing Project Model. Written Communication, 4, 51-67.
Schamber, J., & Mahoney, S. (2006). Assessing and improving the quality of group
critical thinking exhibited in the final projects of collaborative learning groups.
JGE: The Journal of General Education, 55(2), 103-137. Retrieved February 17,
2007, from the Academic Search Premier database.
Skillings, M., & Ferrell, R. (2000). Student-generated rubrics: Bringing students into the
assessment process. Reading Teacher, 53(6), 452. Retrieved February 17, 2007,
from the Academic Search Premier database.
Slavin, R.E. (2006). Educational psychology: Theory and practice. New York: Pearson
Education, Inc.
South Carolina Department of Education (2006). Annual school report card. Retrieved
December 7, 2007, from http://ed.sc.gov/topics/assessment/scores/
South Carolina Department of Education (2006). Palmetto Achievement Challenge Tests
(PACT) Rubric information. Retrieved December 7, 2007, from
http://ed.sc.gov/agency/offices/assessment/PACT/ERrubric032204.doc
South Carolina Department of Education (2003). Palmetto Achievement Challenge Tests
(PACT) Technical Reports. Retrieved June 26, 2008, from
http://ed.sc.gov/agency/offices/assessment/publications/index_of_technical_report
s.html
Spandel, V. (2005). Creating writers through 6-trait writing assessment and instruction.
Boston, MA: Pearson Education, Inc.
75
Stahl, S., & Pagnucco, J. (1996). First graders’ reading and writing instruction in
traditional and process-oriented classes. Journal of Educational Research, 89(3),
131. Retrieved February 17, 2007, from the Academic Search Premier database.
Toch, T. (1992). Nu waz for kidz tu lern rdn, rtn. U.S. News & World Report, 113(10),
75. Retrieved June 23, 2008, from Academic Search Complete database.
Tompkins, G. (2002). Struggling readers are struggling writers, too. Reading & Writing
Quarterly, 18(2). 175-193. Retrieved December 6, 2008, from Academic Search
Complete database.
Williams, J.D. (2003). Preparing to teach writing: Research, theory, and practice.
Mahwah, New Jersey: Lawrence Erlbaum Associates, Publishers.

76
Appendix A
Teacher Survey

77
Teacher Survey
1. Teacher’s name:______________________________________
2. Class: _________
3. Including the present, how many years have you been teaching? _________
4. What is your highest degree completed? ____________________________
5. How many students in your class? ___________
6. In your estimation, how many students in your classroom are performing:
_________above grade level
_________on grade level
_________below grade level
7. Please provide your classroom numbers for each of the following:
_________boys _________Caucasian
_________girls _________African-American
_________Other
8. What did you like about the writing curriculum provided? ___________________
__________________________________________________________________
9. What did you dislike about the curriculum? ______________________________
__________________________________________________________________
10. Please explain how you felt the curriculum helped /didn’t help your students’
writing achievement. ________________________________________________

78
Appendix B
Rubric for Scoring Student Writing

79
Rubric for Scoring Student Writing
SCORE
CONTENT/ DEVELOPMENT
ORGANIZATION VOICE/ WORD CHOICE
CONVENTIONS
5**
• Narrow and manageable topic
• Precise, clear, and answers readers’ questions
• Relevant and accurate details
• Shows insight into topic • Exceptional creativity in
plot and supporting details
• Inviting introduction and satisfying sequencing conclusion
• Masterful sequencing • Artful pacing used
for stylistic effect • Structure showcases
the central ideas or theme
• Compelling and engaging
• Takes effective risks
• Reflects interest in and commitment to topic
• Purpose is clear and powerful
• Powerful and engaging words
• Artful use of figurative language
• Words/language create a meaningful picture
• Spelling correct even on more difficult words
• Accurate and creative use of punctuation and capitalization
• Grammar usage contribute to clarity and style
• Sound and creative paragraphing
4
• Presents a clear central idea about the topic
• Developed central idea with specific details
• Sustains focus on central idea throughout the writing
• Writer understands topic
• Has a clear introduction, body, and conclusion.
• Provides a smooth progression of ideas throughout the writing.
• **Uses precise and/or vivid vocabulary appropriate for the topic
• Phrasing is effective, not predictable or obvious
• Varies sentence structure to promote rhythmic reading
Strongly aware of audience and task; tone is consistent and appropriate
• Minor errors in standard written English may be present.
3
• Presents a central idea about the topic
• Develops the central idea but details are general, or the elaboration may be uneven
• Focus may shift slightly, but is generally sustained
• Has an introduction, body, and conclusion.
• Provides a logical progression of ideas throughout the writing.
• **Uses some precise and/or vivid vocabulary appropriate for the topic
• Phrasing is somewhat effective, not predictable or obvious
• Somewhat varies sentence structure to promote rhythmic reading
• Somewhat aware of audience and task; tone is fairly consistent and appropriate
• Errors in standard written English may be present; however, these errors do not interfere with the writer’s meaning.

80
2
• Central idea may be unclear
• Details may be sparse; more information is needed to clarify the central idea
• Focus may shift or be lost causing confusion for the reader
• Attempts an introduction, body, and conclusion; however, one or more of these components could be weak or ineffective.
• Provides a simplistic, repetitious, or somewhat random progression of ideas throughout the writing.
• Uses both general and precise vocabulary
• Phrasing may not be effective, and may be predictable or obvious
• Some sentence variety results in reading that is somewhat rhythmic; may be mechanical
• Aware of audience and task; tone is appropriate
• A pattern of errors in more than one category (e.g., capitalization, spelling, punctuation, sentence formation) of standard written English is present; these errors interfere somewhat with the writer’s meaning.
1
• There is no clear central idea
• Details are absent or confusing
• There is no sense of focus
• Attempts an introduction, body, and conclusion; however, one or more of these components could be absent or confusing.
• Presents information in a random or illogical order throughout the writing.
• Uses simple vocabulary
• Phrasing repetitive or confusing
• There is little sentence variety; reading is monotonous
• There is little awareness of audience and task; tone may be inappropriate
• Frequent and serious errors in more than one category (e.g., capitalization, spelling, punctuation, sentence formation) of standard written English are present; these errors severely interfere with the writer’s meaning.
B OT IS
UR
Blank Off Topic Insufficient amount of original writing to evaluate Unreadable or illegible
For the purposes of scoring Conventions, “interference” is defined as that which would
impede meaning for a reader other than an educator or professional reader.
** Section was changed from the original format and adapted to the needs of the study.
1 = Experimenting
2 = Emerging
3 = Developing
4 = Effective
5 = Strong

81
Appendix C
South Carolina PACT Rubric
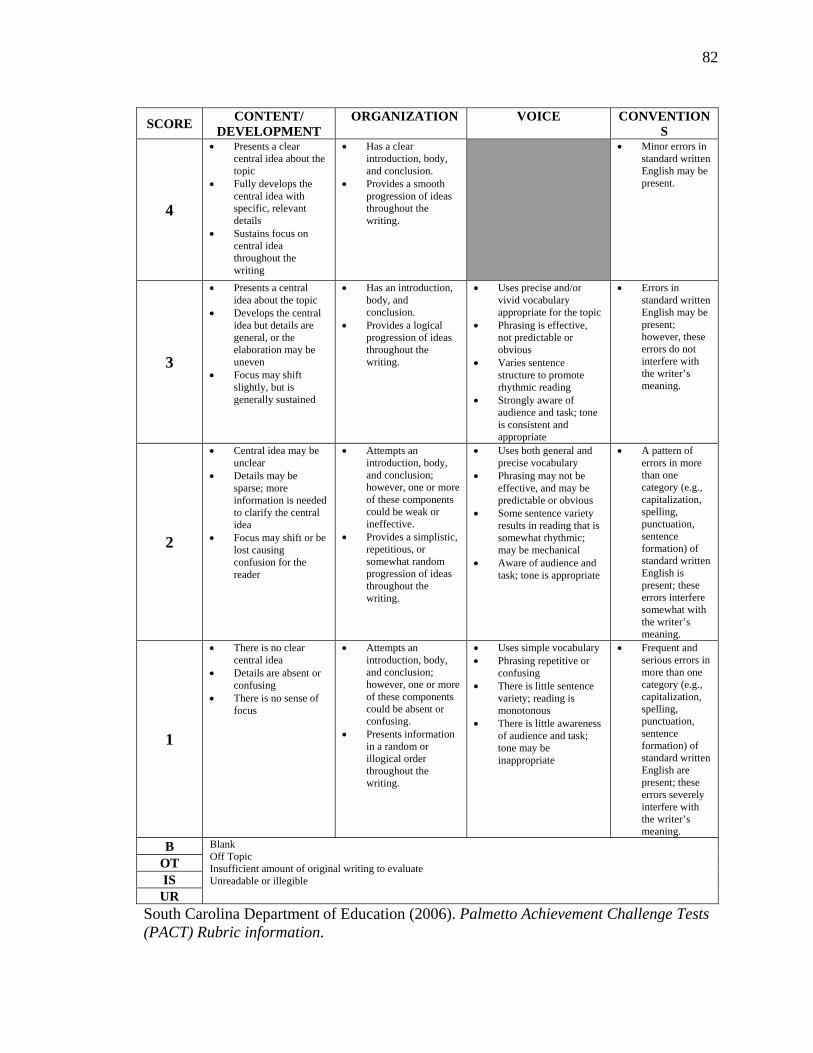
82
South Carolina Department of Education (2006). Palmetto Achievement Challenge Tests (PACT) Rubric information.
SCORE CONTENT/ DEVELOPMENT
ORGANIZATION VOICE CONVENTIONS
4
• Presents a clear central idea about the topic
• Fully develops the central idea with specific, relevant details
• Sustains focus on central idea throughout the writing
• Has a clear introduction, body, and conclusion.
• Provides a smooth progression of ideas throughout the writing.
• Minor errors in standard written English may be present.
3
• Presents a central idea about the topic
• Develops the central idea but details are general, or the elaboration may be uneven
• Focus may shift slightly, but is generally sustained
• Has an introduction, body, and conclusion.
• Provides a logical progression of ideas throughout the writing.
• Uses precise and/or vivid vocabulary appropriate for the topic
• Phrasing is effective, not predictable or obvious
• Varies sentence structure to promote rhythmic reading
• Strongly aware of audience and task; tone is consistent and appropriate
• Errors in standard written English may be present; however, these errors do not interfere with the writer’s meaning.
2
• Central idea may be unclear
• Details may be sparse; more information is needed to clarify the central idea
• Focus may shift or be lost causing confusion for the reader
• Attempts an introduction, body, and conclusion; however, one or more of these components could be weak or ineffective.
• Provides a simplistic, repetitious, or somewhat random progression of ideas throughout the writing.
• Uses both general and precise vocabulary
• Phrasing may not be effective, and may be predictable or obvious
• Some sentence variety results in reading that is somewhat rhythmic; may be mechanical
• Aware of audience and task; tone is appropriate
• A pattern of errors in more than one category (e.g., capitalization, spelling, punctuation, sentence formation) of standard written English is present; these errors interfere somewhat with the writer’s meaning.
1
• There is no clear central idea
• Details are absent or confusing
• There is no sense of focus
• Attempts an introduction, body, and conclusion; however, one or more of these components could be absent or confusing.
• Presents information in a random or illogical order throughout the writing.
• Uses simple vocabulary • Phrasing repetitive or
confusing • There is little sentence
variety; reading is monotonous
• There is little awareness of audience and task; tone may be inappropriate
• Frequent and serious errors in more than one category (e.g., capitalization, spelling, punctuation, sentence formation) of standard written English are present; these errors severely interfere with the writer’s meaning.
B OT IS
UR
Blank Off Topic Insufficient amount of original writing to evaluate Unreadable or illegible

83
Appendix D
Unit Outlines
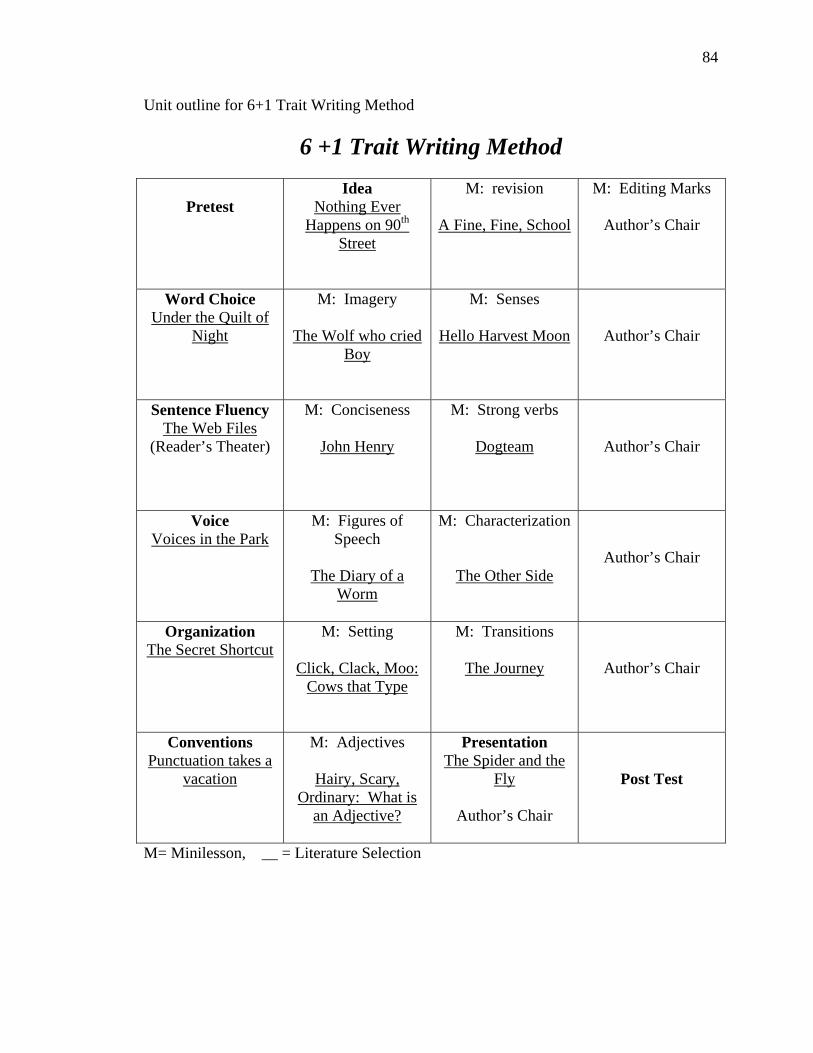
84
Unit outline for 6+1 Trait Writing Method
6 +1 Trait Writing Method
Pretest
Idea Nothing Ever
Happens on 90th Street
M: revision
A Fine, Fine, School
M: Editing Marks
Author’s Chair
Word Choice Under the Quilt of
Night
M: Imagery
The Wolf who cried Boy
M: Senses
Hello Harvest Moon
Author’s Chair
Sentence Fluency The Web Files
(Reader’s Theater)
M: Conciseness
John Henry
M: Strong verbs
Dogteam
Author’s Chair
Voice Voices in the Park
M: Figures of Speech
The Diary of a
Worm
M: Characterization
The Other Side
Author’s Chair
Organization The Secret Shortcut
M: Setting
Click, Clack, Moo: Cows that Type
M: Transitions
The Journey
Author’s Chair
Conventions Punctuation takes a
vacation
M: Adjectives
Hairy, Scary, Ordinary: What is
an Adjective?
Presentation The Spider and the
Fly
Author’s Chair
Post Test
M= Minilesson, __ = Literature Selection

85
Book List for 6+1 Trait Method
Browne, A. (1998). Voices in the park. New York, NY: DK Publishing, Inc.
Cleary, B.P. (2000). Hairy, scary, ordinary what is an adjective? Minneapolis, MN:
Carolrhoda Books, Inc.
Creech, S. (2001). A fine, sine school. China: Joanna Cotler Books.
Cronin, D. (2000). Click, clack, moo: Cows that type. New York, NY: Simon &
Schuster Books for Young Readers.
Cronin, D. (2003). Dairy of a worm. New York, NY: Scholastic, Inc.
DiTerlizzi, T. & Howitt, M. (2002). The spider and the fly. New York, NY: Simon &
Schuster Books for Young Readers.
Fletcher, R. (2003). Hello, harvest moon. New York, NY. Clarion Books.
Hartman, B. (2002). The wolf who cried boy. New York, NY: Puffin Books.
Hopkinson, D. (2002). Under the quilt of night. New York, NY: Aladdin Paperbacks.
Lester, J. (1994). John henry. New York, NY: Puffin Books.
Palatini. M. (2001). The web files. New York, NY: Scholastic, Inc.
Paulson, G. (1993). Dogteam. New York, NY: Dragonfly Books.
Pulver, R. (2003). Punctuation takes a vacation. New York, NY: Holiday House.
Schotter, R. (1997) Nothing ever happens on 90th street. New York, NY: Orchard
Books.
Stewart, S. (2001). The journey. New York, NY: Farrar Straus Giroux.
Teague, M. (1996). The secret shortcut. New York, NY: Scholastic, Inc.
Woodson, J. (2001). The other side. New York, NY: G.P. Putnam’s Sons.
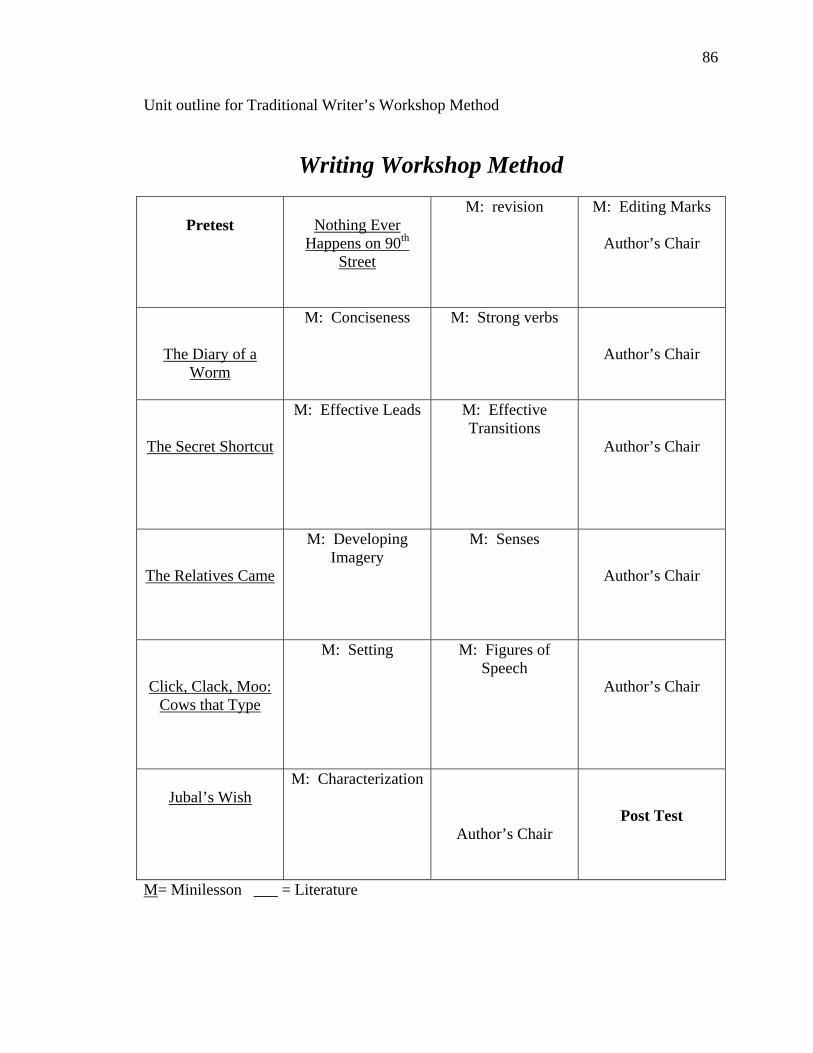
86
Unit outline for Traditional Writer’s Workshop Method
Writing Workshop Method
Pretest
Nothing Ever
Happens on 90th Street
M: revision
M: Editing Marks
Author’s Chair
The Diary of a Worm
M: Conciseness
M: Strong verbs
Author’s Chair
The Secret Shortcut
M: Effective Leads
M: Effective Transitions
Author’s Chair
The Relatives Came
M: Developing Imagery
M: Senses
Author’s Chair
Click, Clack, Moo: Cows that Type
M: Setting
M: Figures of Speech
Author’s Chair
Jubal’s Wish
M: Characterization
Author’s Chair
Post Test
M= Minilesson ___ = Literature

87
Book List for Writer’s Workshop Method
Cronin, D. (2000). Click, clack, moo: Cows that type. New York, NY: Simon &
Schuster Books for Young Readers.
Cronin, D. (2003). Dairy of a worm. New York, NY: Scholastic, Inc.
Rylant, C. (1985). The relatives came. New York, NY: Aladdin Paperbacks.
Schotter, R. (1997) Nothing ever happens on 90th street. New York, NY: Orchard
Books.
Teague, M. (1996). The secret shortcut. New York, NY: Scholastic, Inc.
Wood, A. (2000). Jubal’s wish. New York, NY: The Blue Sky Press.
88
Appendix E
Bar Graphs of Pretest and Posttest Means

89
Bar Graphs of Pretest and Posttest Means
Pretest Means by Method
0
0.5
1
1.5
2
2.5
3
3.5
4
4.5
CDPre OrgPre VWCPre ConvPre
Components
Stud
ent M
eans
Traditional6+1

90
Posttests by Method
0
0.5
1
1.5
2
2.5
3
3.5
4
4.5
CDPost OrgPost VWCPost ConvPost
Components
Stud
ent M
eans
Traditional6 + 1

91
Appendix F
School District Permission Paper

92