effect of the basel accord capital requirements on the...
TRANSCRIPT

Effect of the Basel Accord capital requirements on
the loan-loss provisioning practices of Australian banks
James R. Cummings
Macquarie University
Kassim J. Durrani
University of Sydney
July 2014
This research was funded by the Centre for International Finance and Regulation. The authors gratefully acknowledge comments by Bruce Arnold, Kevin Davis, Guy Eastwood, Chris Gaskell, Gideon Holland, Glenn Homan, Baeho Kim, Adam Lee, Charles Littrell, David Mayes, Jonathan Mott, Christopher Newton, Robert Sharma, Maurice Peat, Heidi Richards, Paul Tattersall, Geoff Warren, Barry Williams and Sue Wright, as well as seminar participants at the Australian Prudential Regulation Authority, Australian Treasury (forthcoming), Japanese Financial Services Agency, Reserve Bank of Australia, Accounting and Finance Association of Australia and New Zealand 2013 Annual Conference, Asian Finance Association 2014 International Conference and the Financial Management Association International 2014 Annual Meeting (forthcoming). Address correspondence to James Cummings, Department of Applied Finance and Actuarial Studies, Faculty of Business and Economics, Macquarie University NSW 2109; telephone +61 2 9850 1169; fax +61 2 9850 9956; email [email protected].

Effect of the Basel Accord capital requirements on
the loan-loss provisioning practices of Australian banks
Abstract
There are two distinct regimes for bank provisioning in Australia: a forward-looking model
for regulatory purposes and an incurred loss model for financial reporting. This study
examines the former using a unique but confidential database. We find evidence that:
(i) regulatory provisions reflect the default risk of banks’ loan portfolios, (ii) banks allocate
part of surplus capital above Basel minimum requirements to pre-fund future credit losses
through provisions (which holds for banks using either external or internal ratings-based
approaches), and (iii) banks allocate part of higher earnings for the same purpose. These
findings suggest that bank managers use their discretion in setting provisions to dampen the
impact of fluctuations in credit market conditions on their lending activities.
JEL classification: G21, G28
Keywords: Commercial banks, Bank regulation, Loan-loss provisions, Bank capital
requirements

1
1. Introduction
In its Basel III reform package, the Basel Committee on Banking Supervision (BCBS) is
seeking to improve the banking sector’s ability to absorb shocks arising from financial and
economic stress, thus reducing the risk of spill-over from the financial sector to the real
economy. A major focus of the reforms is to raise both the quality and size of the regulatory
capital base, as well as to build capital buffers at individual banks that can be used in stressed
economic conditions and to protect banks at times of excess credit growth. The outcome of
these reforms relies upon the timeliness and reliability of banks’ provisioning practices for
loan losses. This follows because provisions (whether they be specific provisions or general
loan-loss reserves) are deducted directly from equity capital via retained earnings.
Consequently, to the extent that a bank’s provisioning levels are inadequate to absorb
expected credit losses in its business, the bank’s capital adequacy will be overstated.
In contrast to previous studies that focus on bank provisioning practices under accounting
standards for reporting to the market (for example, Moyer, 1990; Collins, Shackelford and
Wahlen, 1995; Kim and Kross, 1998; Hasan and Wall, 2004), this study focuses on practices
under prudential standards for reporting to the banking regulator. The change in focus is
important for examining the role of provisioning in supporting the Basel capital requirements,
because our study covers a period when accounting standards in Australia and internationally
moved to an incurred loss model of provisioning. The incurred loss model is problematic for
supervisory review and the market-enforced discipline of banks’ capital adequacy; because it
delays the recognition of losses until financial assets are close to default.1
To address this shortcoming, the Australian banking regulator has maintained a forward-
looking provisioning model to capture expected future credit losses in a bank’s business, by
decoupling its provisioning requirements from Australian accounting standards. The forward-
looking model is consistent with the expected loss approach to provisioning advocated by the
BCBS under Basel III (see paragraphs 23-25 of the Basel III capital rules).2 This study
1 The incurred loss provisioning model is backward-looking, in the sense that it requires that a loss event occurs before a provision can be made (see International Accounting Standards Board, IAS 39 Financial Instruments: Recognition and Measurement, December 2003). 2 A similar approach was proposed by the Turner Review in the United Kingdom. The Review recommended that existing accounting rules for provisioning be augmented by the creation of a non-distributable economic cycle reserve (ECR), which would set aside profit in good years to anticipate losses likely to arise in future. See the UK Financial Services Authority’s publication, The Turner Review: A Regulatory Response to the Global Banking Crisis, released in March 2009.

2
provides a practical test of the forward-looking provisioning model, by examining the
responsiveness of these types of provisions to bank-specific measures of credit risk. Such a
test is not available in many countries, including the United States, which continue to rely on
accounting standards for both financial reporting and prudential review.
Using a confidential dataset, this study investigates the role of the regulatory provisioning
model in supporting the risk-based capital requirements for Australian banks.3 Previous
studies find evidence that bank managers take account of regulatory and market expectations
concerning their capital adequacy and earnings when setting accounting provisions (see
Wahlen, 1994; Robb, 1998; Ahmed, Takeda and Thomas, 1999; Anandarajan, Hasan and
McCarthy, 2007). Since the regulatory provisions examined in this study are not disclosed to
the market as part of a bank’s half year and full year financial results, the bank may have less
incentive to smooth reported earnings or to manage earnings expectations using these
provisions.4 However, the greater discretion afforded to banks when setting regulatory
provisions warrants a closer examination of their quality and their relationship with
regulatory capital under the Basel rules.
In particular, we explore the extent to which banks use the regulatory provisioning model for
risk management, by building a buffer against future credit losses that supports the stability
of the bank capital base. Although regulatory provisions have a direct negative impact on a
bank’s regulatory equity capital in the current period; by providing a loss-absorbing buffer,
the provisions may reduce the extent to which capital is depleted in the event of a future
economic downturn. Consequently, a sufficient provisioning buffer may help alleviate the
extent to which capital requirements act to restrict lending activities as a result of credit
losses realised in future periods. This argument derives from the finding by Beatty and Liao
(2011) that bank lending is less sensitive to regulatory capital constraints during economic
downturns for banks that provision proactively. We argue that this form of risk management
is more likely to be effective if the provisions are drawn from surplus regulatory capital,
because in this case the bank avoids being subjected to greater regulatory and market scrutiny
in the short-term. Therefore, this study tests whether the strength of a bank’s capital base in
3 We thank the Australian Prudential Regulation Authority for allowing us access to the data for this study. 4 Note that the regulatory provisions are reported to the market on a quarterly basis as part of the bank’s Pillar 3 disclosures. However, for listed domestic banks these disclosures are made up to twenty business days after the corresponding financial results.

3
excess of Basel minimum requirements is a relevant factor when the bank raises provisions
against credit exposures.
To our knowledge, this study is the first to examine bank provisioning practices for banks
that use the internal ratings-based (IRB) approach to credit risk under the Basel II capital
framework. Previous research examines bank provisioning in the pre-Basel period before
1989 (for example, Beatty, Chamberlain and Magliolo, 1995) and under the Basel I capital
framework (Ahmed, Takeda and Thomas, 1999; Shrieves and Dahl, 2003; Fonseca and
González, 2008). The Basel II framework was developed to improve the risk-sensitivity of
the capital requirements and provide greater incentives for banks to develop their risk
management capabilities (see paragraphs 5 and 6 of the Basel II capital framework). Under
Basel II, banks that receive approval from the regulator are permitted to use their own risk
assessments in the capital calculations. The IRB approach also establishes a direct linkage
between regulatory provisioning and expected losses derived from the bank’s credit risk
modelling. This study tests whether the adoption of the IRB approach has reduced the
incentives for these banks to drawdown from surplus capital to cover future credit losses.
Based on quarterly data for twenty-two banks operating in Australia from March 2004 to
December 2012, we find that regulatory provisions reflect meaningful information about the
default risk associated with banks’ loan portfolios. We also find evidence that banks use
provisions as a counter-cyclical buffer; allocating higher provisions in periods when their
risk-based capital ratios and earnings are higher than average and adjusting provisions
downwards in periods when these indicators are weaker. Larger banks in our sample maintain
higher provisions than smaller banks, suggesting that larger banks are more closely
monitored by the regulator and the market. For banks that receive approval from the regulator
to use the IRB approach to credit risk, the provisioning behaviour of these banks suggests that
they continue to use surplus regulatory capital for funding both specific provisions and
general reserves after they adopt the IRB approach. Thus, there is no evidence that the greater
alignment of regulatory provisioning requirements with banks’ internal risk assessments has
reduced the incentive for banks to allocate part of surplus capital for covering future loan
losses.

4
2. The impact of bank discretionary behaviour on loan-loss provisions
This section discusses characteristics which may influence a bank’s decision-making for
provisioning. In principle, loan-loss provisions are a buffer to preserve a bank’s solvency by
absorbing existing and estimated future credit losses in its business. To the extent that
provisions reflect the quality of the loan portfolio, they are likely to be susceptible to short-
term fluctuations resulting from changes in macroeconomic conditions and developments in
the solvency of individual counterparties. Provisioning may also be affected by country-
specific circumstances with regard to accounting, regulatory and tax rules and by bank
behaviour with regard to its performance and risk management practices.
The conceptual framework underlying the Basel Accord is that expected future losses will be
covered by provisions, while unexpected future losses will be covered by capital. Despite this
rationale, provisioning practices may be backward-looking if banks mainly set provisions in
response to problem loans. During periods of economic expansion, fewer problem loans are
identified and the level of provisions is usually low. Conversely, during economic downturns
provisions increase because defaults are more widespread across the bank’s lending business.
Using bank-level data from 29 OECD countries, Bikker and Metzemakers (2005) show that
provisioning levels vary significantly with the business cycle. This pattern implies that banks’
buffers need to be restored during downturns, meaning that fewer profits are available to
supplement existing capital, possibly forcing banks to reduce lending.5 However, credit risk
arises when loans are made; not only during a downturn when more defaults are experienced.
In this case, banks may under-provision during periods of economic expansion (Laeven and
Majnoni, 2003). Alternatively, provisioning may be forward-looking if it takes account of the
intrinsic risk which might be estimated to exist in the bank’s loan portfolio regardless of the
stage in the business cycle. This study tests the extent to which regulatory provisions are
influenced by credit risk, measured in relation to both problem loans and overall asset quality.
In addition, the research literature identifies three discretionary actions bank managers may
take when setting provisions. The first action is concerned with capital management. Both
specific provisions and general provisions reduce equity capital via their effect on retained
earnings. Thus, a poorly capitalised bank may be less willing to make loan-loss provisions
5 Beatty and Liao (2011) find that during the period after implementation of Basel risk-based capital regulations, banks with greater delays in expected loss recognition reduce their lending during recessions more than banks with smaller delays.

5
(Kim and Kross, 1998). However, to the extent that general provisions count towards non-
equity regulatory capital, a bank may raise more general provisions to preserve its total
regulatory capital base (Ahmed, Takeda and Thomas, 1999). Reasons for managing the
capital ratio through provisions include the high cost of raising new capital, implicit and
explicit guarantees that make debt funding cheaper and shareholder preferences for dividend
payments. The second action is income smoothing. Bank managers may seek to reduce
earnings variability; to signal lower business risk, reduce funding costs, reduce tax expense or
improve management rewards. Consistent with this prediction, several studies document a
positive relationship between non-discretionary bank earnings and provisions (Greenawalt
and Sinkey, 1988; Ma, 1988; Collins, Shackelford and Wahlen, 1995 for United States banks;
Shrieves and Dahl, 2003 for Japanese banks; Pérez, Salas-Fumás and Saurina, 2008 for
Spanish banks; Hess, Grimes and Holmes, 2009 for Australian banks).6 The third action
occurs when bank managers use provisions to signal their financial strength to investors
(Wahlen, 1994; Beaver, Ryan and Wahlen, 1997; Liu, Ryan and Wahlen, 1997).
Recent studies investigate a counter-cyclical explanation for a bank’s discretionary behaviour
in setting loan-loss provisions (Bikker and Metzemakers, 2005; Bouvatier and Lepetit, 2008).
The counter-cyclical view is that credit risk is built up in a boom and materialises in a
downturn. Favourable conditions associated with an economic expansion could lead to
excessive increases in lending and a relaxation of lending standards. These practices may
result in higher risks, which increase the likelihood of an economic recession. If banks set
aside greater provisions in response to strong earnings, they are likely to increase provisions
at a time when risks are building up in credit markets. In effect, this form of discretionary
behaviour may reduce the pro-cyclicality of bank lending. A similar role may be performed
by the allocation of surplus regulatory capital. For poorly-capitalised Japanese and European
banks respectively, Shrieves and Dahl (2003) and Bouvatier and Lepetit (2008) find a
positive relationship between surplus capital under the Basel I regulatory framework and
loan-loss provisions. The findings of these studies suggest that banks increase provisions
when their regulatory capital ratios improve. In this study, we test whether banks with surplus
regulatory capital and above-average earnings set aside part of these surpluses to cover future
credit losses.
6 In the United States, Beatty, Ke and Petroni (2002) find that publicly listed banks use discretion in their loan-loss provisions to avoid reporting small declines in earnings. Fonseca and González (2008) find that the extent of income smoothing by banks varies from country-to-country depending on investor protection and accounting disclosure, restrictions on bank activities and the extent of official and private supervision.

6
3. Capital adequacy regulation in Australia
In Australia, banks are regulated by the Australian Prudential Regulation Authority (APRA),
which was established in 1998. APRA has the power under federal legislation to set
prudential standards, which underpin its approach to supervising depository institutions. The
prudential standards set out minimum capital, governance and risk management
requirements, which are legally binding.
3.1 Implementation of the Basel Accord capital requirements
Capital adequacy refers to the amount of capital maintained by depository institutions to
absorb unanticipated losses. Prior to 1 January 2008, APRA’s approach to assessing a bank’s’
capital adequacy is based on the Basel I capital framework (the Basel Accord of 1988).7
Under the rules of the Basel Accord, capital for supervisory purposes is considered in two
tiers: tier 1 and tier 2.8 Tier 1 (core capital) comprises the highest quality capital elements. A
bank’s capital base is the sum of its tier 1 and tier 2 capital less any deductions. At least fifty
per cent of a bank’s capital base must be tier 1 capital. Under Basel I, all banks use
standardised risk weights to calculate the capital requirement. The Basel Accord requires that
the ratio of a bank’s capital to risk-weighted assets (referred to as the risk-based capital ratio)
be at least 8 per cent.9
From 1 January 2008 to 31 December 2012, APRA’s approach to assessing a bank’s capital
adequacy is based on the Basel II capital framework.10 An innovation of the revised
framework is the greater use of risk assessments provided by banks’ internal systems as
7 For details of the Basel I capital framework, refer to Basel Committee on Banking Supervision’s publication, International Convergence of Capital Measurement and Capital Standards, released in July 1988. 8 Tier 1 capital is defined as the sum of the book value of equity (paid-up common stock and retained earnings), qualifying non-cumulative perpetual preferred stock and minority interests in the equity of subsidiaries less goodwill and other tangible assets. Tier 2 capital consists of other capital elements that contribute to the overall strength of a bank as a going concern but do not satisfy all of the characteristics of tier 1 capital. Tier 2 capital is the sum of the general reserve for credit losses (up to a maximum of 1.25 per cent of risk-weighted assets), perpetual preferred stock, hybrid capital instruments, perpetual debt, mandatory convertible debt securities, subordinated term debt and intermediate preferred stock. 9 A bank’s risk-weighted assets for credit risk is calculated as the sum of risk-weighted on-balance sheet assets and risk-weighted off-balance sheet credit equivalent amounts. Under Basel I, assets and credit equivalent amounts of off-balance sheet items are assigned to one of several broad risk categories, according to the nature of the obligors, guarantors and collateral. The dollar amount in each risk category is then multiplied by the risk weight associated with that category. The sum of the resulting weighted values from each of the risk categories is the bank’s credit risk-weighted assets. 10 For details of the Basel II capital framework, refer to the Basel Committee on Banking Supervision’s publication, International Convergence of Capital Measurement and Capital Standards: A Revised Framework, revised in June 2006.

7
inputs to capital calculations. In particular, a bank that has received approval from APRA to
use the IRB approach to credit risk is permitted to use its own internal models to quantify the
capital required for credit risk. Aside from this feature, the revised framework retains key
elements of the 1988 capital adequacy framework, including the requirement for banks to
hold total capital equivalent to at least 8 per cent of risk-weighted assets and the definition of
eligible capital.
After the period examined in this study (from 1 January 2013), APRA implemented the Basel
III capital framework.11 This reform package seeks to address lessons from the financial
crisis of 2008-2009, by raising both the quality and quantity of the regulatory capital base.
The new framework establishes a minimum requirement for common equity tier 1 capital
(comprising common shares and retained earnings) of 4.5 per cent of risk-weighted assets and
increases the minimum requirement for tier 1 capital to 6 per cent of risk-weighted assets.
Furthermore, the new framework introduces a conservation buffer for common equity tier 1
capital of 2.5 per cent of risk-weighted assets that can be drawn down in periods of stress and
a countercyclical buffer of between 0 and 2.5 per cent of risk-weighted assets to protect the
banking sector from periods of excess credit growth.
APRA is empowered to impose a range of sanctions should a bank breach minimum capital
requirements and intervenes at an early stage to prevent capital from falling below minimum
levels. If a bank’s capital ratio declines towards the Basel minimum, APRA would
significantly increase its supervisory intensity and require the bank to develop and implement
a plan to restore its capital ratio. In situations where the bank is unable or unwilling to
respond, APRA may resort to the exercise of formal powers under the Banking Act 1959.
These include the power to restrict bank operations and to suspend payments to shareholders.
In more serious cases, it has the power to order a compulsory transfer of the business of a
bank or to revoke a banking licence. Consequently, a bank with capital that APRA considers
to be inadequate is likely to incur greater regulatory costs than a bank with adequate capital.12
11 For details of the Basel III capital framework, refer to the Basel Committee on Banking Supervision’s publication, Basel III: A Global Regulatory Framework for More Resilient Banks and Banking Systems, released in December 2010 and revised in June 2011. 12 This presumption assumes that regulators bestow no favours on commercial banks. If some favours are bestowed on commercial banks, the incentives to respond to regulatory costs are reduced but not eliminated (as noted by Moyer, 1990: 129).

8
3.2 APRA’s forward-looking provisioning model
Australian banks use a forward-looking model of loan-loss provisioning specified by APRA
for regulatory reporting purposes.13 The regulatory model distinguishes between two types of
provisions: specific provisions and a general reserve for credit losses (GRCL) (see Prudential
Standard APS 220 Credit Quality, May 2006).14 Specific provisions are provisions raised
against credit losses that are expected to be realised in the short term (within the next 12-18
months). They include all provisions for impairment assessed by a bank on an individual
basis in accordance with Australian accounting standards and a portion of provisions assessed
on a collective basis which are not eligible to be included in the GRCL.15 The GRCL is a
reserve to cover credit losses that are expected but not certain to arise over the full life of the
all the loans making up the business of the bank.
The evidence required to substantiate the GRCL is less clearly defined than for specific
provisions. In determining whether to raise specific provisions against a loan portfolio, the
bank may consider factors such as the extent of non-compliance of loans with their
contractual terms, the likelihood of loans which are not well secured being subject to
administration or bankruptcy proceedings and internal or external credit ratings suggestive of
a substantial increased risk of potential default. In contrast, the GRCL is to cope with latent
losses for loans that are not currently in breach of contractual terms or exhibiting signs of
distress. Factors relevant to determining the GRCL may include historical loss experience
and recent trends in losses, but must also consider any factors that are likely to cause losses to
differ from historical experience. These factors include amendments to lending policies,
changes in the bank’s risk profile and the impact of changes in economic and credit cycles.
Assessing these factors necessitates the exercise of a range of subjective judgements.
Consequently, the GRCL is potentially influenced by the discretionary behaviours of bank
managers to a greater extent than specific provisions.
13 APRA implemented its forward-looking model from 1 July 2006, when Australian accounting standards moved to an incurred loss model of provisioning consistent with International Financial Reporting Standards (IFRS). The adoption of IFRS meant that provisions for impairment must be based on loss experience and only recognised after an event on which the loss is based has occurred. This was a departure from previous practice under which general provisions were recognised where impairment was considered probable. 14 In this study, we focus on the levels of specific provisions and GRCL rather than the quarterly changes in these measures, because the levels are more important for the financial soundness of the bank. 15 Appendix 1 illustrates the movements in Australian accounting standards provisions used by the banks examined in this study. Appendix 2 illustrates the relationship between the two provisioning models used by Australian banks: the forward-looking model for regulatory purposes and the incurred loss model for reporting to the market.

9
3.3 Treatment of loan-loss provisions under Basel I and Basel II
The level of provisioning and reserves established by a depository institution against potential
credit losses has significant implications for the assessment of its capital adequacy.
Table 1 shows the impact of increasing specific provisions and the GRCL on the risk-based
capital ratios for all banks in the Basel I period and standardised banks in the Basel II period
(panel A) and IRB banks in the Basel II period (panel B).16 For Basel I banks and Basel II
standardised banks (panel A), an increase in either specific provisions or the GRCL always
reduces retained earnings by the after-tax amount of the provision or reserve. Although
specific provisions reduce the amount of risk-weighted assets (RWA), the impact of an
increase in specific provisions on the numerators of the capital ratios (through retained
earnings) outweighs the impact on the denominator and lowers both the tier 1 capital ratio
and the total capital ratio. The GRCL (on an after-tax basis) is eligible to be included in tier 2
capital up to 1.25 per cent of RWA. Consequently, an increase in GRCL decreases the tier 1
capital ratio but leaves the total capital ratio unchanged (provided the bank has not exceeded
the reserving threshold for GRCL).
16 A standardised bank is a bank that is required to apply risk weights to its on-balance sheet assets and off-balance sheet exposures according to the risk classes delineated in the capital standards. An IRB bank is a bank that has approval from the regulator to use its own credit risk models for determining the risk weights.

10
Table 1 Treatment of loan-loss provisions under Basel I and Basel II
Panel A: Basel I banks and Basel II standardised banks
Impact of a one dollar increase in:
Impact of a one dollar increase in: Impact on:
Specific provisions
GRCL
Tier 1 capital ratio Numerator
↓ Retained earnings
↓ Retained earnings Denominator
↓ RWA
No impact on RWA
Net impact
↓ Tier 1 capital ratio
↓ Tier 1 capital ratio
Total capital ratio Numerator
↓ Retained earnings
↓ Retained earnings
↑ GRCL (to a max. of 1.25% of total RWA)
Denominator
↓ RWA
No impact on RWA Net impact ↓ Total capital ratio None
Panel B: Basel II IRB banks
Impact of a one dollar increase in:
Impact of a one dollar increase in:
Impact on:
Step 1: EL defaulted
Step 2: EP defaulted
Step 1: EL non-defaulted
Step 2: EP non-defaulted Tier 1 capital ratio
Numerator
↑ Shortfall in provisions (50%)
↓ Retained earnings
↑ Shortfall in provisions (50%)
↓ Retained earnings
↓ Shortfall in provisions (50%)
↓ Shortfall in provisions (50%)
Denominator
No impact on RWA
No impact on RWA
No impact on RWA
No impact on RWA Net impact
↓ Tier 1 capital ratio
↓ Tier 1 capital ratio
↓ Tier 1 capital ratio
↓ Tier 1 capital ratio
Total capital ratio Numerator
↑ Shortfall in provisions
↓ Retained earnings
↑ Shortfall in provisions
↓ Retained earnings
↓ Shortfall in provisions
↓ Shortfall in provisions
↑ Surplus provisions (to a max. of 0.6% of credit RWA)
Denominator
No impact on RWA
No impact on RWA
No impact on RWA
No impact on RWA Net impact ↓ Total capital ratio None (when in shortfall) ↓ Total capital ratio None

11
For Basel II IRB banks (table 1 panel B), provisioning is a two-step process that is closely
aligned with the bank’s credit risk assessment methodology. In the first step, the IRB bank
must separately estimate the expected losses (EL) for defaulted and non-defaulted exposures
before any tax effects.17 The sum of these two amounts immediately creates a shortfall that is
charged 50 per cent against tier 1 capital and 50 per cent against tier 2 capital. Therefore, the
estimation of the EL effectively decreases both the tier 1 capital ratio and the total capital
ratio of the bank. In the second step, the bank allocates eligible provisions (EP) on an after-
tax basis against the two categories of EL.18 This allocation process further reduces the tier 1
capital ratio, because it reduces retained earnings at the same time that it reduces the shortfall
in provisions being charged in equal amounts against tier 1 and tier 2 capital. Any surplus EP
above EL on non-defaulted exposures up to 0.6 per cent of RWA for credit risk is eligible to
be included in tier 2 capital. Therefore, an increase in EP against EL on non-defaulted
exposures decreases the tier 1 ratio, but leaves the total capital ratio unchanged until the
reserving threshold is reached.
In summary, increasing provisions or reserves for anticipated credit losses always reduces the
tier 1 capital ratio under the rules of the Basel Accord. It also reduces the total capital ratio,
except when a standardised bank increases the GRCL or an IRB bank allocates eligible
provisions against expected losses on non-defaulted exposures within the reserving thresholds
in each of these cases.
17 An IRB-approved bank uses its own credit rating system for estimating expected losses. 18 Eligible provisions are defined as the sum of all provisions (specific provisions and GRCL, partial write-offs and discounts on defaulted assets) that are attributed to exposures treated under the IRB approach.

12
4. Data and sample
This study focuses on 22 banks operating in Australia with at least twelve quarters of relevant
data in the period from March 2004 to December 2012. Table 2 presents the sample banks,
comprising seventeen banks that use the standardised approach to credit risk across the entire
sample period (in panel A) and five banks that receive approval to use the IRB approach to
credit risk in the Basel II period (in panel B).19 Quarterly data are obtained from APRA’s
statistical data collections on the capital base, risk-weighted assets, non-performing loans,
total loans, specific provisions and GRCL, total assets, deposits, shareholders’ equity and
earnings for the sample banks.20
The analysis is restricted to licensed banks which are required to maintain capital in
Australia.21 These include domestic banks and foreign subsidiary banks. Branches of foreign
banks are not required to maintain capital in Australia and these banks are excluded from the
sample.22 Building societies and credit unions apply a provisioning methodology prescribed
by the regulator and these depository institutions are also excluded from the sample.23
19 Macquarie Bank is accredited to use the foundation internal ratings-based (FIRB) approach to credit risk, where the bank must provide its own estimates of probability of default (PD) and maturity (M) and rely on supervisory estimates for loss given default (LGD) and exposure at default (EAD) in determining the capital requirement for a given credit exposure. ANZ Bank, Commonwealth Bank, National Australia Bank and Westpac are accredited to use the advanced internal ratings-based (AIRB) approach to credit risk, where the banks must provide their own estimates of all the credit risk components. 20 We thank David Connolly and Meghann Garry at APRA for helping us extract the data used in this study. 21 Fifty-two observations for banks with tier 1 capital ratios before provisions greater than 30 per cent are excluded from the sample. These banks have little incentive to adjust provisions based on considerations of capital adequacy. 22 Foreign bank branches are not permitted to accept retail deposits from Australian residents. 23 Thirteen observations for one bank using the prescribed provisioning methodology are discarded.

13
Table 2 Sample banks
Panel A: Standardised banks Bank name Bank type
Adelaide Bank Limited Domestic AMP Bank Limited Domestic Arab Bank Australia Limited Foreign subsidiary Bank of Cyprus Australia Limited Foreign subsidiary Bank of Queensland Limited Domestic Bank of Western Australia Ltd Domestic Beirut Hellenic Bank Ltd Foreign subsidiary Bendigo and Adelaide Bank Limited Domestic Citigroup Pty Limited Foreign subsidiary HSBC Bank Australia Limited Foreign subsidiary ING Bank (Australia) Limited Foreign subsidiary Investec Bank (Australia) Limited Foreign subsidiary Members Equity Bank Pty Limited Domestic Rabobank Australia Limited Foreign subsidiary Rural Bank Limited Domestic St.George Bank Limited Domestic Suncorp-Metway Limited Domestic
Panel B: Internal ratings-based banks Bank name Bank type IRB adoption date
Australia and New Zealand Banking Group Limited Domestic 1 January 2008 Commonwealth Bank of Australia Domestic 1 January 2008 Macquarie Bank Limited Domestic 1 January 2008 National Australia Bank Limited Domestic 1 July 2008 Westpac Banking Corporation Domestic 1 January 2008
14
5. Results
5.1 Descriptive statistics
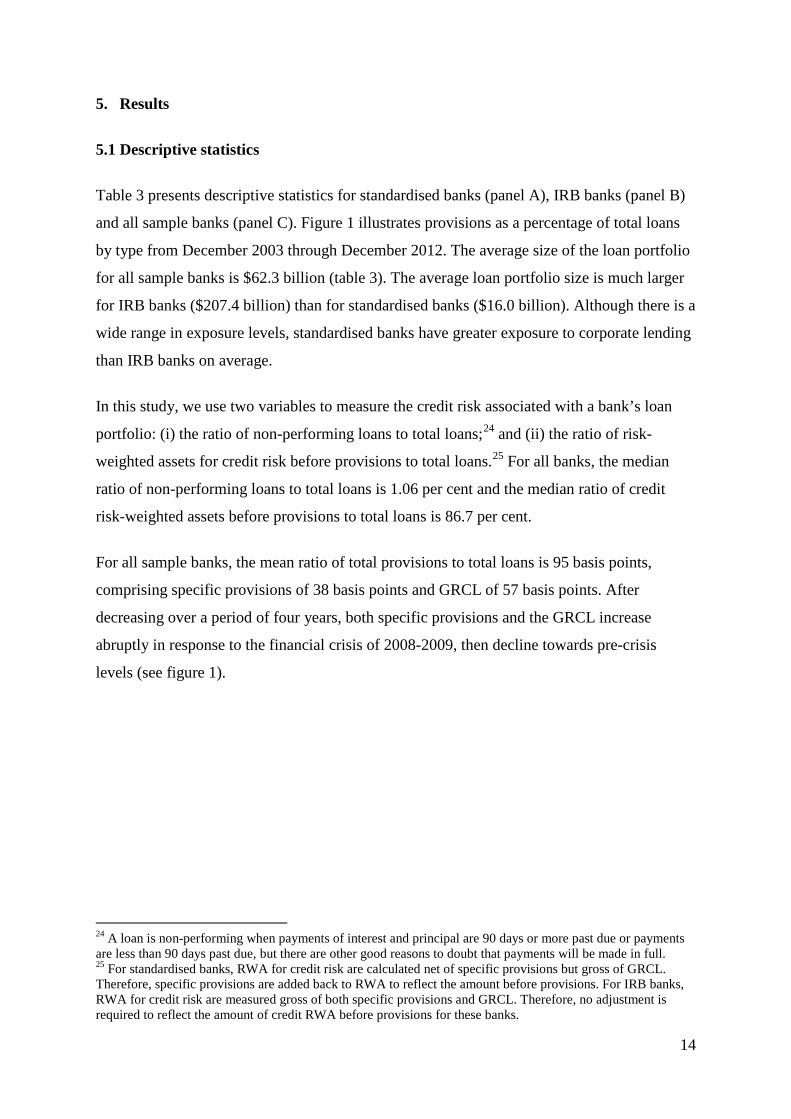
Table 3 presents descriptive statistics for standardised banks (panel A), IRB banks (panel B)
and all sample banks (panel C). Figure 1 illustrates provisions as a percentage of total loans
by type from December 2003 through December 2012. The average size of the loan portfolio
for all sample banks is $62.3 billion (table 3). The average loan portfolio size is much larger
for IRB banks ($207.4 billion) than for standardised banks ($16.0 billion). Although there is a
wide range in exposure levels, standardised banks have greater exposure to corporate lending
than IRB banks on average.
In this study, we use two variables to measure the credit risk associated with a bank’s loan
portfolio: (i) the ratio of non-performing loans to total loans;24 and (ii) the ratio of risk-
weighted assets for credit risk before provisions to total loans.25 For all banks, the median
ratio of non-performing loans to total loans is 1.06 per cent and the median ratio of credit
risk-weighted assets before provisions to total loans is 86.7 per cent.
For all sample banks, the mean ratio of total provisions to total loans is 95 basis points,
comprising specific provisions of 38 basis points and GRCL of 57 basis points. After
decreasing over a period of four years, both specific provisions and the GRCL increase
abruptly in response to the financial crisis of 2008-2009, then decline towards pre-crisis
levels (see figure 1).
24 A loan is non-performing when payments of interest and principal are 90 days or more past due or payments are less than 90 days past due, but there are other good reasons to doubt that payments will be made in full. 25 For standardised banks, RWA for credit risk are calculated net of specific provisions but gross of GRCL. Therefore, specific provisions are added back to RWA to reflect the amount before provisions. For IRB banks, RWA for credit risk are measured gross of both specific provisions and GRCL. Therefore, no adjustment is required to reflect the amount of credit RWA before provisions for these banks.

15
Table 3 Descriptive statistics for sample bank-observations
This table presents the summary statistics for standardised banks (panel A), IRB banks (panel B) and all banks (panel C). The sample period is March 2004 to December 2012. The Basel II Capital Framework is implemented in Australia from 1 January 2008. The tier 1 capital ratio before provisions for standardised banks is calculated as tier 1 capital plus total provisions multiplied by one minus the corporate tax rate, divided by total risk-weighted assets plus specific provisions. The total capital ratio before provisions for standardised banks is calculated as total capital plus total provisions multiplied by one minus the corporate tax rate minus the general reserve for credit losses (to a maximum of 1.25% of total RWA), divided by total risk-weighted assets plus specific provisions. The tier 1 capital ratio before provisions for IRB banks (after Basel II implementation) is calculated as tier 1 capital plus total provisions multiplied by one minus the corporate tax rate plus the shortfall in provisions for credit losses (50%), divided by total risk-weighted assets. The total capital ratio before provisions for IRB banks (after Basel II implementation) is calculated as total capital plus total provisions multiplied by one minus the corporate tax rate plus the shortfall in provisions for credit losses minus surplus provisions on non-defaulted exposures (to a maximum of 0.6% of credit RWA), divided by total risk-weighted assets. EBPT is earnings before provisions and taxes, divided by average assets.
Panel A: Standardised banks, N=564
Data item
Mean
Standard deviation
Lower quartile
Median
Upper quartile
Total loans $mil
16,018
18,715
1,988
9,515
25,106
Loans to households % 56.0
32.9
37.7
61.0
85.6 Loans to corporates %
43.7
32.8
14.4
38.8
61.4
Loans to other %
0.3
0.7
0.0
0.0
0.2 Non-performing loans % 2.06
2.77
0.58
1.00
2.44
RWA for credit risk %
85.5
23.8
69.7
81.2
99.3 Deposits %
17.5
14.9
3.4
15.9
27.1
Specific provisions %
0.41
0.59
0.04
0.14
0.57 GRCL %
0.51
0.35
0.28
0.42
0.65
Total provisions %
0.91
0.83
0.41
0.60
1.18 Tier 1 capital ratio
11.3
4.4
8.4
9.8
12.7
Total capital ratio
13.6
3.9
11.1
12.0
14.9 EBPT % pq 0.33 0.48 0.17 0.27 0.41
16
Table 3 continued Panel B: IRB banks, N=180
Data item
Mean
Standard deviation
Lower quartile
Median
Upper quartile
Total loans $mil
207,428
121,102
152,206
211,672
297,121
Loans to households % 62.6
10.2
58.3
63.3
70.2 Loans to corporates %
36.6
10.3
28.3
36.5
41.3
Loans to other %
0.8
1.1
0.2
0.5
0.7 Non-performing loans % 1.82
2.17
0.69
1.22
1.91
RWA for credit risk %
125.7
77.8
73.8
101.4
124.9 Deposits %
26.8
11.4
18.1
24.8
32.4
Specific provisions %
0.30
0.23
0.12
0.26
0.41 GRCL %
0.77
0.25
0.58
0.72
0.87
Total provisions %
1.07
0.39
0.82
0.97
1.19 Tier 1 capital ratio
10.0
2.2
8.0
10.2
11.8
Total capital ratio
12.9
2.1
11.6
12.9
14.0 EBPT % pq 0.37 0.30 0.27 0.36 0.44
Panel C: All banks, N=744
Data item
Mean
Standard deviation
Lower quartile
Median
Upper quartile
Total loans $mil
62,327
102,602
3,375
12,953
48,581
Loans to households % 57.6
29.2
43.3
63.0
76.9 Loans to corporates %
42.0
29.1
21.7
36.7
55.3
Loans to other %
0.4
0.8
0.0
0.0
0.5 Non-performing loans % 2.00
2.64
0.61
1.06
2.10
RWA for credit risk %
95.3
46.7
70.4
86.7
103.2 Deposits %
19.8
14.7
8.8
18.9
28.7
Specific provisions %
0.38
0.53
0.06
0.17
0.47 GRCL %
0.57
0.35
0.33
0.52
0.78
Total provisions %
0.95
0.75
0.47
0.76
1.18 Tier 1 capital ratio
11.0
4.0
8.3
9.9
12.3
Total capital ratio
13.4
3.6
11.2
12.3
14.5 EBPT % pq 0.34 0.45 0.18 0.30 0.42

17
Figure 1 Regulatory loan-loss provisions by type
This figure plots provisions as a percentage of total loans by type from December 2003 through December 2012. The Basel II Capital Framework is implemented in Australia from 1 January 2008. Numbers in this figure are presented on an asset-weighted basis. A bank’s capital position is measured by the tier 1 capital ratio and the total capital ratio.
Similar to Kim and Kross (1998), we adjust the risk-based capital ratios to eliminate the
influence of loan-loss provisions.26 The mean tier 1 and total capital ratios before provisions
for all sample banks are 11.0 per cent and 13.4 per cent respectively, suggesting that on
average banks have a comfortable buffer above the Basel minimum requirements. Notably,
there is greater variability in the risk-based capital ratios of the standardised banks than in the
capital ratios of the IRB banks.
Table 4 presents the correlations between the variables in our sample. Specific provisions are
positively correlated with GRCL. Banks with greater exposure to corporate lending, more
non-performing loans, higher credit risk-weighted assets, higher risk-based capital ratios and
higher earnings tend to have higher provisions (both specific provisions and GRCL). Banks
with greater exposure to household lending have lower provisions. Banks that fund a greater
proportion of their loan books with deposits have lower specific provisions but higher GRCL.
26 In this way, the risk-based capital ratios used in this study represent the capital ratios faced by the bank before it raises provisions to cover any potential credit losses.
0.0
0.2
0.4
0.6
0.8
1.0
1.2
1.4
2003 2004 2005 2006 2007 2008 2009 2010 2011 2012
Prov
isio
ns (%
of t
otal
loan
s)
Year
Specific
GRCL
Basel I Basel II

18
Table 4 Pearson correlation coefficients for key variables of the sample bank-observations
LOGSIZE is the logarithm of total loans and advances in billions of Australian dollars. LHOUS is loans to households divided by total loans. LCORP is loans to corporations divided by total loans. NPL is non-performing loans divided by total loans. RWAC is the ratio of risk-weighted assets for credit risk to total loans minus 1. DEP is total deposits divided by total loans. SPROV is the ratio of specific provisions to total loans. GRCL is the ratio of general reserve for credit losses to total loans. LLP is the ratio of total provisions to total loans. RT1CAP is the difference between the tier 1 risk-based capital ratio before provisions and the minimum required tier 1 risk-based capital ratio of 4%. RCAPB is the difference between the total risk-based capital ratio before provisions and the minimum required total risk-based capital ratio of 8%. EBPT is earnings before provisions and taxes divided by average assets. ** indicates significance at the 5% level.
LOGSIZE
LHOUS
LCORP
NPL
RWAC
DEP
SPROV
GRCL
LLP
RT1CAP
RCAPB
EBPT
LOGSIZE
1.00 LHOUS
0.40 **
1.00
LCORP
-0.40 **
-1.00 **
1.00 NPL
-0.18 **
-0.35 **
0.36 **
1.00
RWAC
-0.09 **
-0.29 **
0.29 **
0.34 **
1.00 DEP
0.15 **
0.05
-0.05
-0.03
0.29 **
1.00
SPROV
-0.07
-0.25 **
0.26 **
0.81 **
0.21 **
-0.14 **
1.00 GRCL
0.04
-0.33 **
0.32 **
0.45 **
0.50 **
0.17 **
0.44 **
1.00
LLP
-0.03
-0.33 **
0.33 **
0.78 **
0.38 **
-0.02
0.91 **
0.78 **
1.00 RT1CAP
-0.42 **
-0.25 **
0.24 **
0.18 **
0.06
-0.14 **
0.23 **
0.22 **
0.26 **
1.00
RCAPB
-0.45 **
-0.27 **
0.26 **
0.21 **
0.15 **
-0.01
0.23 **
0.31 **
0.31 **
0.93 **
1.00 EBPT 0.07 -0.02 0.02 -0.04 0.09 ** 0.11 ** 0.06 0.09 ** 0.08 ** 0.09 ** 0.07 1.00

19
5.2 The effects of credit risk, capital adequacy and earnings on bank provisioning
5.2.1 All banks
In this subsection, a Tobit regression approach is used to examine the effects of credit risk,
capital adequacy and earnings on loan-loss provisioning practices for all sample banks.
Specifically, a latent variable representing the true provisioning level is regressed on various
bank characteristics including measures of credit risk, risk-based capital ratios before
provisions in excess of minimum regulatory levels and earnings before provisions and taxes.
A conventional Tobit approach allows for the condition that provisions are lower bounded at
zero.
The specification of the Tobit regression is as follows:
titi
titititititi
DEPLOGSIZEEBPTRCAPRWACNPLy
,,3
,2,1,,2,1,
εγ
γγφββα
++
++×+×+×+=∗
(1)
≤
>=
∗
∗∗
0 if 0
0 if
,
,,,
ti
tititi y
yyPROV
where NPLi,t is non-performing loans divided by total loans, RWACi,t is the ratio of risk-
weighted assets for credit risk before provisions to total loans minus 1, RCAPi,t is the
difference between the risk-based capital ratio (the tier 1 capital ratio or the total capital ratio)
before provisions and the minimum required risk-based capital ratio, EBPTi,t is earnings
before provisions and taxes divided by average assets, LOGSIZEi,t is the logarithm of total
loans and advances in billions of Australian dollars, DEPi,t is total deposits divided by total
loans and PROVi,t is the ratio of provisions (specific provisions, GRCL or total provisions) to
total loans. All t-statistics are adjusted for cross-sectional and time-series dependence in the
regression residuals by clustering the standard errors at both the bank and quarter levels (as
suggested by Thompson, 2011).27
27 Gow, Ormazabal and Taylor (2010) find that two-way cluster-robust standard errors produce unequivocally better inferences than other common methods used to address issues of cross-sectional and time-series dependence (including Fama-MacBeth, Newey-West and standard errors clustered along a single dimension) even with as few as 10 clusters.

20
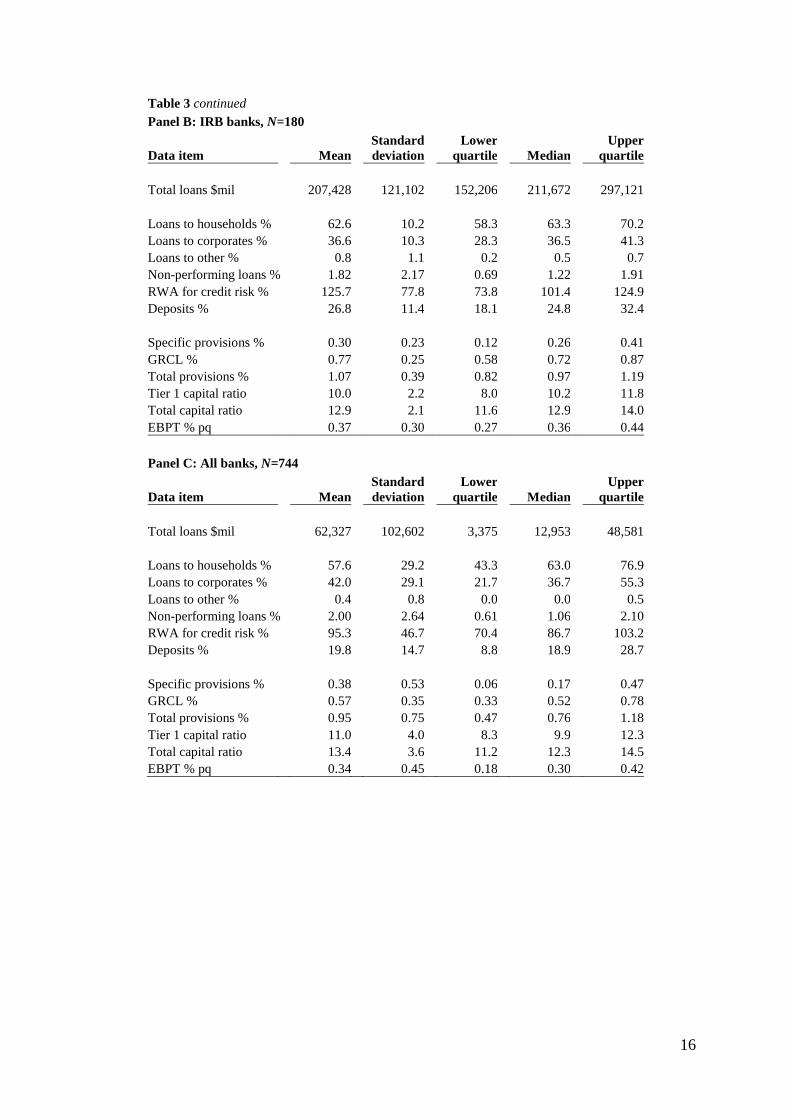
The regression results are presented in table 5. The coefficients on NPL and RWAC are both
expected to be positive since an increase in non-performing loans or risk-weighted assets for
credit risk implies an increase in default risk. Both estimated coefficients are positive and
significant in the regressions for GRCL (columns 3 and 4) and for total provisions (columns 5
and 6). In the regressions for specific provisions (columns 1 and 2), the coefficient on NPL is
positive and highly significant but that on RWAC is statistically insignificant. These results
are consistent with the idea that banks raise specific provisions in response to existing
impairments, whereas they raise the general reserve in response to the likelihood of future
impairments as determined by the inherent quality of the loan portfolio.
Under the Basel rules, if banks with surplus regulatory capital use part of that surplus to boost
provisions, we expect to see positive coefficients on RT1CAP and RCAPB.28 The estimated
coefficients in front of these variables are positive in all six regressions and are statistically
significant in the regressions for the GRCL and for total provisions. These results are
consistent with surplus capital being used to increase provisions, with the surplus mainly
being directed towards funding medium to longer-term credit losses through the GRCL rather
than funding short-term credit losses through specific provisions. The effect of the capital
ratios on bank provisioning practices is economically significant. For example, changing
from a bank at the lower quartile for the tier 1 capital ratio before provisions to a bank at the
upper quartile is associated with an additional 15 basis points in total provisions.
28 Note that, since tier 2 capital is limited to the amount of tier 1 capital, a positive coefficient on RT1CAP also implies a positive coefficient on RCAPB.
21
Table 5 The effects of credit risk, regulatory capital adequacy and earnings on bank provisioning practices
This table examines the effects of credit risk, regulatory capital adequacy and earnings on bank loan-loss provisions. Coefficients are estimated using Tobit regressions. The sample period is March 2004 to December 2012. Specific provisions is the ratio of specific provisions to total loans. GRCL is the ratio of general reserve for credit losses to total loans. Total provisions is the ratio of total provisions to total loans. NPL is non-performing loans divided by total loans. RWAC is the ratio of risk-weighted assets for credit risk to total loans minus 1. RT1CAP is the difference between the tier 1 risk-based capital ratio before provisions and the minimum required tier 1 risk-based capital ratio of 4%. RCAPB is the difference between the total risk-based capital ratio before provisions and the minimum required total risk-based capital ratio of 8%. EBPT is earnings before provisions and taxes divided by average assets. Log size is the logarithm of total loans and advances in billions of Australian dollars. Deposits is total deposits divided by total loans. Robust t-statistics in parentheses are based on standard errors clustered at both the bank and quarter levels. ** indicates significance at the 5% level.
Specific provisions
GRCL
Total provisions Independent variables
(1)
(2)
(3)
(4)
(5)
(6)
Intercept (α)
-0.0017
-0.0015
0.0020 **
0.0018 **
0.0009
0.0008
(-1.25)
(-1.28)
(2.41)
(2.47)
(0.62)
(0.69)
NPL (β1)
0.1701 **
0.1699 **
0.0430 **
0.0416 **
0.2089 **
0.2073 **
(9.32)
(9.65)
(3.43)
(3.50)
(9.28)
(9.99)
RWAC (β2)
-0.0004
-0.0005
0.0028 **
0.0027 **
0.0024 **
0.0022 **
(-1.14)
(-1.24)
(4.58)
(4.36)
(2.62)
(2.39)
RT1CAP (ϕ1)
0.0149
0.0216 **
0.0371 **
(1.00)
(4.03)
(2.33)
RCAPB (ϕ2)
0.0164
0.0313 **
0.0493 **
(1.06)
(4.32)
(2.72)
EBPT (γ1)
0.1079
0.1123
0.0165
0.0177
0.1196 **
0.1250 **
(1.60)
(1.59)
(0.61)
(0.76)
(2.22)
(2.09)
Log size (γ2)
0.0005 **
0.0005 **
0.0004
0.0005 **
0.0008 **
0.0009 **
(2.20)
(2.24)
(1.66)
(2.05)
(2.54)
(2.89)
Deposits (γ3)
-0.0041
-0.0046
0.0015
0.0008
-0.0029
-0.0042
(-1.92)
(-1.94)
(0.63)
(0.32)
(-0.85)
(-1.18)
Pseudo-R2
0.70
0.70
0.41
0.44
0.68
0.69
Banks
22
22
22
22
22
22 Observations
744
744
744
744
744
744
Effect of LQ to UQ change (%)
Tier 1 capital ratio
0.06
0.09
0.15 Total capital ratio 0.06 0.11 0.17

22
The positive relationship between regulatory capital and provisions contrasts with the results
of studies by Ahmed, Takeda and Thomas (1999) and Pérez, Salas-Fumás and Saurina
(2008). Ahmed, Takeda and Thomas document a significantly negative relationship between
regulatory capital and provisions for United States banks under the Basel I framework. Their
finding can be explained by the different treatment of provisions under United States capital
standards; where the before-tax amount of general loan-loss reserves counts as tier 2 capital
up to the threshold of 1.25 per cent of RWA and reduces RWA in excess of the threshold.
Consequently, banks concerned about falling below the Basel minimum requirement for total
capital may have an incentive to increase general provisions. No such incentive exists under
Australian prudential standards in the period for this study (see table 1). Pérez, Salas-Fumás
and Saurina find no evidence of a relationship between regulatory capital and provisions for
Spanish banks in a period spanning pre-Basel and Basel I. In Spain, loan-loss reserves are
counted as neither tier 1 nor tier 2 capital. The lack of a positive relationship between
regulatory capital and provisions in their study can be explained by the prescriptive rules for
provisioning established by the Spanish central bank, that more strictly limit the discretion of
bank managers to alter provisions than in other countries including Australia.
If banks provision more in times when earnings are higher, then we would expect a positive
relation between earnings before provisions and taxes (EBPT) and loan-loss provisions. The
coefficient in front of EBPT is positive and significant in the regressions for total provisions
(in columns 5 and 6 of table 5), but is statistically insignificant in the regressions for specific
provisions and for the GRCL considered separately (in columns 1 to 4). These results suggest
that banks accumulate more provisions when earnings are higher, but with there being no
clear preference for funding short-term or longer-term credit losses in this way. The
significant relationship with total provisions is consistent with Hess, Grimes and Holmes
(2009), who find evidence of a positive relationship between earnings before provisions and
taxes and bad-debt expense for Australian banks.
In addition, larger banks maintain higher provisioning levels (as a percentage of total loans).
The coefficient in front of LOGSIZE is positive and significant in all the regressions, except
in the first regression for the GRCL. This result is consistent with larger banks being more
closely monitored by the regulator and by their bond and stock holders. The proportion of the
loan book funded by deposits does not have a significant impact on provisioning levels.

23
5.2.2 Standardised banks
In this subsection, a Tobit regression approach is used to examine the effects of credit risk,
capital adequacy and earnings on loan-loss provisions for banks that use the standardised
approach to credit risk across the entire the sample period. We also test whether standardised
banks with high levels of GRCL are more capital-sensitive in their provisioning practices. To
test this proposition, we examine whether the coefficients on the excess capital ratios are
larger for banks that have GRCL greater than 1.25 per cent of risk-weighted assets.
For standardised banks, the specification of the Tobit regression is as follows:
titititi
titibtiatititi
DEPLOGSIZEEBPTRCAPRLMTRCAPRWACNPLy
,,3,2,1
,,,,2,1,
εγγγ
φφββα
++++
××+×+×+×+=∗
(2)
≤
>=
∗
∗∗
0 if 0
0 if
,
,,,
ti
tititi y
yyPROV
where RLMTi,t is a zero-one dummy variable which equals one if the GRCL exceeds 1.25 per
cent of total risk-weighted assets before provisions.29
Table 6 presents the regression results for standardised banks. The estimated coefficients on
NPL and RWAC are positive and statistically significant in all six regressions. This suggests
that the regulatory provisions maintained by standardised banks reflect meaningful
assessments of the relative quality of banks’ loans.
The coefficients in front of the main effects of RT1CAP and RCAPB are positive and
significant in the regressions for the GRCL and for total provisions (columns 3 to 6). These
results suggest that standardised banks with GRCL within the reserving threshold make use
of surplus capital for increasing the GRCL. Furthermore, the coefficients in front of the
interaction terms RLMT × RT1CAP and RLMT × RCAPB are positive and significant in the
same regressions. This suggests that the relation between the GRCL and the excess regulatory
capital ratios before provisions is stronger for banks that have general reserves exceeding the
upper-bound, which is consistent with these banks facing a more clear-cut trade-off between
regulatory capital adequacy and reserving for latent credit losses.
29 There are thirteen observations for standardised banks with a GRCL exceeding 1.25 per cent of total risk-weighted assets before provisions.

24
Table 6 The effects of credit risk, regulatory capital adequacy and earnings on the loan-loss provisioning
practices of standardised banks
This table examines the effects of credit risk, regulatory capital adequacy and earnings on loan-loss provisions for banks that use the standardised approach to credit risk across the entire the sample period. Coefficients are estimated using Tobit regressions. The sample period is March 2004 to December 2012. Specific provisions is the ratio of specific provisions to total loans. GRCL is the ratio of general reserve for credit losses to total loans. Total provisions is the ratio of total provisions to total loans. NPL is non-performing loans divided by total loans. RWAC is the ratio of risk-weighted assets for credit risk to total loans minus 1. RT1CAP is the difference between the tier 1 risk-based capital ratio before provisions and the minimum required tier 1 risk-based capital ratio of 4%. RCAPB is the difference between the total risk-based capital ratio before provisions and the minimum required total risk-based capital ratio of 8%. RLMT is a zero-one dummy variable which equals one if the general reserve for credit losses exceeds 1.25% of total RWA before provisions. EBPT is earnings before provisions and taxes divided by average assets. Log size is the logarithm of total loans and advances in billions of Australian dollars. Deposits is total deposits divided by total loans. Robust t-statistics in parentheses are based on standard errors clustered at both the bank and quarter levels. ** indicates significance at the 5% level.
Specific provisions
GRCL
Total provisions Independent variables
(1)
(2)
(3)
(4)
(5)
(6)
Intercept (α)
-0.0027
-0.0023
0.0027 **
0.0026 **
0.0010
0.0010
(-1.34)
(-1.40)
(2.34)
(2.49)
(0.45)
(0.56)
NPL (β1)
0.1698 **
0.1676 **
0.0399 **
0.0371 **
0.2053 **
0.2002 **
(9.84)
(10.31)
(3.38)
(3.12)
(9.76)
(10.16)
RWAC (β2)
0.0034 **
0.0037 **
0.0049 **
0.0053 **
0.0080 **
0.0087 **
(2.15)
(2.39)
(2.81)
(3.10)
(3.18)
(3.50)
RT1CAP (ϕa1)
0.0220
0.0190 **
0.0400 **
(1.32)
(2.91)
(2.11)
RLMT × RT1CAP (ϕb1)
0.0553 **
0.1253 **
0.1842 **
(2.25)
(5.42)
(4.27)
RCAPB (ϕa2)
0.0251
0.0279 **
0.0531 **
(1.43)
(3.73)
(2.59)
RLMT × RCAPB (ϕb2)
0.0575
0.1352 **
0.1965 **
(1.57)
(3.35)
(2.77)
EBPT (γ1)
0.0658
0.0699
0.0039
0.0005
0.0697
0.0691
(1.04)
(1.00)
(0.34)
(0.04)
(1.74)
(1.34)
Log size (γ2)
0.0011 **
0.0012 **
0.0001
0.0003
0.0010 **
0.0013 **
(2.74)
(2.70)
(0.42)
(1.08)
(2.35)
(2.80)
Deposits (γ3)
-0.0037 **
-0.0046 **
0.0020
0.0011
-0.0023
-0.0040
(-2.28)
(-2.62)
(0.97)
(0.58)
(-0.88)
(-1.57)
Pseudo-R2
0.77
0.77
0.54
0.54
0.78
0.78
Banks
17
17
17
17
17
17 Observations
564
564
564
564
564
564
Effect of LQ to UQ change (%)
Tier 1 capital ratio
0.09
0.08
0.17 Total capital ratio 0.10 0.11 0.21
25
Among the standardised banks in our sample, there is no significant relationship between
earnings before provisions and taxes and provisioning levels (based on the estimated
coefficients in front of EBPT in table 6). Larger banks in this group have significantly higher
specific provisions. Standardised banks that fund a greater proportion of their loan books with
deposits have significantly lower specific provisions, suggesting that these banks may receive
slightly less scrutiny of their specific provisions from the market.
5.2.3 Internal ratings-based banks
This section examines the effect of the Basel II capital framework on provisioning practices
for the five Australian banks that receive approval to use the internal ratings-based approach
to credit risk.30 In particular, we test whether the greater alignment of regulatory provisioning
requirements with banks’ internal risk assessments has reduced the incentives for IRB banks
to set aside surplus capital to cover future credit losses. To test this issue, we investigate
whether the coefficients on the excess capital ratios are smaller for these banks after they
adopt the IRB approach to credit risk.
For IRB banks, the Tobit regression is specified as follows:31
tititititie
titidtictitiiti
DEPLOGSIZEEBPTIRBRCAPIRBRCAPRWACNPLy
,,3,2,1,
,,,,2,1,
εγγγφ
φφββα
++++×+
××+×+×+×+=∗
(3)
≤
>=
∗
∗∗
0 if 0
0 if
,
,,,
ti
tititi y
yyPROV
where IRBi,t is a zero-one dummy variable which equals one if the bank has received approval
to use the internal ratings-based approach to credit risk. Bank-specific intercepts capture any
unobserved bank effects not included in the model.32 All t-statistics are adjusted for
30 In this study, we cannot test whether IRB banks exceeding the reserving threshold are more capital-sensitive in their provisioning practices, because there are no observations in our sample for which an IRB bank has surplus provisions on non-defaulted exposures greater than the limit of 0.6 per cent of credit RWA. In fact, there is only one observation for which an IRB bank allocates any surplus EP above EL on non-defaulted exposures. 31 There is a potential endogeneity issue with this specification, because banks that have received IRB approval may use their internal models to estimate credit RWA together with loan-loss provisions. To address this issue, we try removing RWAC and replacing the excess risk-based capital ratio before provisions (RCAP) with the ratio of capital to total assets before provisions. The results are similar. 32 These effects may arise from differences between IRB banks in the way that they measure credit risk.

26
correlation of the regression residuals between banks in each quarter by clustering the
standard errors at the quarter level.33
Table 7 presents the regression results for IRB banks. Consistent with the results for
standardised banks, the estimated coefficients on NPL and RWAC are positive and
statistically significant in all six regressions, suggesting that provisioning practices are based
on sensible assessments of the default risk associated with banks’ lending activities.
The coefficients on RT1CAP and RCAPB are significantly positive, except in the regression
for the impact of the total capital ratio before provisions on the GRCL (column 4).34 These
results suggest that, in the period before they adopt the IRB approach to credit risk, the five
sample banks use surplus regulatory capital for funding both specific provisions and the
GRCL. With respect to the impact of IRB adoption, the coefficients in front of the interaction
terms IRB × RT1CAP and IRB × RCAPB are not significantly negative in any of the
regressions. Moreover, the coefficients on the excess capital ratios after IRB adoption (that is,
the sum of the coefficients on RT1CAP and IRB × RT1CAP and the sum of the coefficients
on RCAPB and IRB × RCAPB) are significantly positive, except in the regression for the
impact of the total capital ratio on the GRCL. These results suggest that banks that receive
approval to use the IRB approach to credit risk continue to allocate surplus regulatory capital
to both specific provisions and the GRCL after they adopt the IRB approach.
Based on the regression results for IRB banks, there is no evidence that these banks
accumulate more regulatory provisions when their earnings are higher.
33 For the analysis in this subsection, we do not cluster the standard errors at the bank level for the five IRB banks in the sample. Thompson (2011: 6) demonstrates that double-clustering is likely to do more harm than good when there are too few clusters along one dimension, because the double-clustered standard error estimates will be excessively noisy. 34 The insignificance of the coefficient on RCAPB in table 7, column 4 is consistent with all banks being allowed to count GRCL within the reserving threshold towards total capital in the Basel I period.

27
Table 7 The effect of the revised Basel capital framework on the loan-loss provisioning practices of IRB banks
This table examines the effect of the revised capital rules on the relation between bank capital adequacy and loan-loss provisions for banks that receive approval to use the IRB approach to credit risk. Coefficients are estimated using Tobit regressions. The sample period is March 2004 to December 2012. The Basel II Capital Framework is implemented in Australia from 1 January 2008. NPL is non-performing loans divided by total loans. RWAC is the ratio of risk-weighted assets for credit risk to total loans minus 1. RT1CAP is the difference between the tier 1 risk-based capital ratio before provisions and the minimum required tier 1 risk-based capital ratio of 4%. RCAPB is the difference between the total risk-based capital ratio before provisions and the minimum required total risk-based capital ratio of 8%. IRB is a zero-one dummy variable which equals one if the bank has received approval to use the IRB approach to credit risk. Robust t-statistics in parentheses are based on standard errors clustered at the quarter level. ** indicates significance at the 5% level.
Specific provisions
GRCL
Total provisions Independent variables
(1)
(2)
(3)
(4)
(5)
(6)
NPL (β1)
0.0439 **
0.0509 **
0.0284 **
0.0289 **
0.0724 **
0.0798 **
(5.57)
(5.95)
(2.34)
(2.57)
(5.47)
(6.33)
RWAC (β2)
0.0017 **
0.0024 **
0.0023 **
0.0023 **
0.0040 **
0.0047 **
(3.57)
(3.70)
(2.62)
(2.36)
(5.35)
(5.10)
RT1CAP (ϕc1)
0.0315 **
0.0497 **
0.0814 **
(2.48)
(2.02)
(5.03)
IRB × RT1CAP (ϕd1)
0.0201
-0.0275
-0.0076
(1.47)
(-1.05)
(-0.43)
ϕc1 + ϕd1
0.0516 **
0.0222 **
0.0738 **
(9.19)
(2.37)
(8.81)
RCAPB (ϕc2)
0.0302 **
0.0190
0.0494 **
(2.92)
(1.00)
(3.36)
IRB × RCAPB (ϕd2)
0.0284 **
-0.0084
0.0198
(2.51)
(-0.44)
(1.46)
ϕc2 + ϕd2
0.0586 **
0.0105
0.0692 **
(5.91)
(0.68)
(4.15)
IRB (ϕe)
0.0002
0.0002
0.0007
0.0002
0.0009
0.0004
(0.36)
(0.49)
(0.67)
(0.25)
(1.01)
(0.47)
EBPT (γ1)
-0.0353
-0.0419
-0.0416
-0.0208
-0.0764
-0.0623
(-1.35)
(-1.52)
(-0.72)
(-0.38)
(-1.56)
(-1.38)
Log size (γ2)
-0.0003
0.0007
-0.0021 **
-0.0015
-0.0024 **
-0.0008
(-0.80)
(1.53)
(-2.79)
(-1.97)
(-3.34)
(-1.06)
Deposits (γ3)
-0.0014
-0.0020 **
0.0007
0.0003
-0.0008
-0.0017
(-1.61)
(-2.05)
(0.47)
(0.18)
(-0.69)
(-1.16)
Bank intercepts Yes Yes Yes Yes Yes Yes
Pseudo-R2
0.90
0.89
0.70
0.69
0.90
0.89 Banks
5
5
5
5
5
5 Observations
180
180
180
180
180
180
Effect of LQ to UQ change (%)
Tier 1 capital ratio Before IRB approval
0.12
0.19
0.31 After IRB approval
0.20
0.08
0.28
Total capital ratio Before IRB approval
0.07
0.05
0.12 After IRB approval 0.14 0.03 0.16

28
5.2.4 Further analysis for internal ratings-based banks
To better understand the incentives facing IRB banks under the revised Basel Accord, we
investigate whether either the expected losses (EL) or eligible provisions (EP) reported by an
IRB bank may be influenced by the strength of the bank’s capital base.
Table 8 reports descriptive statistics for EP and EL reported by IRB banks (panel A), together
with the results of Tobit regressions to examine the impact of capital before provisions on the
ratio of EL to total loans (panel B), the ratio of EP to EL (panel C) and the ratio of EP to total
loans (panel D). In addition to total exposures, the table presents results for defaulted and
non-defaulted exposures. Figure 2 illustrates the progression of EL as a percentage of total
loans by type (panel A) and EP as a percentage of EL and the risk-based capital ratios (panel
B) for the five sample IRB banks through the Basel II period. Numbers in the figure are
presented on an asset-weighted basis.
For the IRB banks, the mean ratio of EL to total loans in the Basel II period is 201 basis
points (table 8, panel A). In comparison, the mean ratio of EP to total loans is 137 basis
points (representing 68.0 per cent of EL).35 Expected losses (especially those on defaulted
exposures) increase in response to the financial crisis of 2008-2009 (figure 2, panel A). As a
percentage of EL, the EP allocated by IRB banks shows a slight upward trend over the Basel
II period (figure 2, panel B). In the same period, IRB banks increased their tier 1 capital ratios
(with a main emphasis on common equity tier 1 capital), in preparation for the more stringent
capital adequacy requirements forthcoming under the Basel III framework.
35 This figure is close to 100 minus the Australian company tax rate of 30 per cent, suggesting that on average IRB banks allocate provisions on a before-tax basis close to total EL. Whereas EL are reported on a before-tax basis, EP are required to be reported on an after-tax basis in the Basel II period.

29
Table 8 The effect of bank capital ratios on eligible provisions under the IRB approach
This table examines the relation between bank capital adequacy and eligible provisions under the internal ratings-based approach to credit risk. The sample period is March 2008 to December 2012. Eligible provisions are reported on an after-tax basis and net of any associated deferred tax assets. Panel A reports summary statistics of eligible provisions and expected losses. Panel B reports the results of regressing the ratio of expected losses to total loans on bank capital ratios before provisions. Panel C reports the results of regressing the ratio of eligible provisions to expected losses on bank capital ratios before provisions. Panel D reports the results of regressing the ratio of eligible provisions to total loans on bank capital ratios before provisions. EPdef is eligible provisions on defaulted exposures. EPnon-def is eligible provisions on non-defaulted exposures. EPtot is total eligible provisions. ELdef is expected losses on defaulted exposures. ELnon-def is expected losses on non-defaulted exposures. ELtot is total expected losses. TL is total loans. NPL is non-performing loans divided by total loans. T1CAPTA is tier 1 capital divided by total assets before provisions. CAPBTA is total capital divided by total assets before provisions. RT1CAP is the difference between the tier 1 risk-based capital ratio before provisions and the minimum required tier 1 risk-based capital ratio of 4%. RCAPB is the difference between the total risk-based capital ratio before provisions and the minimum required total risk-based capital ratio of 8%. EBPT is earnings before provisions and taxes divided by average assets. Robust t-statistics in parentheses are based on standard errors clustered at the quarter level. ** indicates significance at the 5% level.
Panel A: Descriptive statistics, N=98 Data item
Defaulted exposures
Non-defaulted exposures
Total
Eligible provisions Mean %
0.83
0.53
1.37 Median %
0.46
0.47
0.90
Standard deviation %
0.80
0.23
0.98 Expected losses
Mean %
1.13
0.88
2.01 Median %
0.53
0.72
1.28
Standard deviation % 1.30 0.45 1.68
Panel B: Regression of expected losses relative to total loans on bank capital ratios
ELdef / TL
ELnon-def / TL
ELtot / TL
Independent variables
(1)
(2)
(3)
(4)
(5)
(6)
NPL
0.4325 **
0.4415 **
0.0189
0.0273
0.4514 **
0.4688 **
(12.86)
(13.78)
(0.87)
(1.10)
(12.94)
(11.77)
T1CAPTA
0.1832 **
0.1388 **
0.3220 **
(3.13)
(6.14)
(6.13)
CAPBTA
0.1421 **
0.1718 **
0.3140 **
(2.25)
(5.73)
(4.24)
EBPT
0.1184
0.0944
-0.2075
-0.2333
-0.0891
-0.1389
(0.69)
(0.55)
(-1.82)
(-1.79)
(-0.54)
(-0.71)
Bank intercepts Yes Yes Yes Yes Yes Yes
Pseudo-R2
0.97
0.96
0.85
0.86
0.97
0.97 Banks
5
5
5
5
5
5
Observations
98
98
98
98
98
98
Effect of LQ to UQ change (%) Tier 1 capital / TA
0.27
0.20
0.47
Total capital / TA 0.25 0.31 0.56

30
Table 8 continued Panel C: Regression of eligible provisions relative to expected losses on bank capital ratios
EPdef / ELdef
EPnon-def / ELnon-def
EPtot / ELtot Independent variables
(1)
(2)
(3)
(4)
(5)
(6)
RT1CAP
-0.2407
2.9209 **
2.0879 **
(-0.27)
(3.15)
(3.14)
RCAPB
-0.5793
1.6667
0.9361
(-0.38)
(1.34)
(1.06)
EBPT
-1.9831
-1.5461
0.1321
0.0231
-3.8090
-3.6396
(-0.23)
(-0.17)
(0.03)
(0.00)
(-0.70)
(-0.63)
Bank intercepts Yes Yes Yes Yes Yes Yes
Pseudo-R2
0.46
0.46
0.53
0.48
0.55
0.51 Banks
5
5
5
5
5
5
Observations
98
98
98
98
98
98
Effect of LQ to UQ change (%) Tier 1 capital ratio
-0.4
5.2
3.7
Total capital ratio -0.7 2.1 1.2
Panel D: Regression of eligible provisions relative to total loans on bank capital ratios
EPdef / TL
EPnon-def / TL
EPtot / TL
Independent variables
(1)
(2)
(3)
(4)
(5)
(6)
NPL
0.1367 **
0.1488 **
-0.0204
-0.0111
0.1163 **
0.1378 **
(3.52)
(3.28)
(-1.46)
(-0.69)
(2.45)
(2.41)
T1CAPTA
0.2529 **
0.1640 **
0.4169 **
(4.60)
(6.04)
(6.08)
CAPBTA
0.1872 **
0.1790 **
0.3662 **
(2.99)
(5.06)
(4.26)
EBPT
-0.1849
-0.2169
-0.0538
-0.0814
-0.2387
-0.2983
(-1.09)
(-1.10)
(-0.53)
(-0.70)
(-1.02)
(-1.05)
Bank intercepts Yes Yes Yes Yes Yes Yes
Pseudo-R2
0.91
0.88
0.66
0.65
0.89
0.86 Banks
5
5
5
5
5
5
Observations
98
98
98
98
98
98
Effect of LQ to UQ change (%) Tier 1 capital / TA
0.37
0.24
0.61
Total capital / TA 0.33 0.32 0.65

31
Figure 2 Provisioning inputs and capital ratios of Basel II IRB-approved banks Panel A: Expected losses
Panel B: Eligible provisions and capital ratios before provisions
This figure illustrates the progression of provisioning inputs and capital adequacy for the IRB banks, under the Basel II capital framework from March 2008 through December 2012. Panel A plots IRB-expected losses as a percentage of total loans by type. Panel B plots IRB-eligible provisions as a percentage of total expected losses and tier 1 and tier 2 risk-based capital ratios before provisions. Numbers in this figure are presented on an asset-weighted basis.
0.0
0.2
0.4
0.6
0.8
1.0
1.2
1.4
1.6
Exp
ecte
d lo
sses
(% o
f TL
)
Quarter
Defaulted
Non-defaulted
0
5
10
15
20
25
30
0
10
20
30
40
50
60
70
80
90
100C
apita
l (%
of R
WA
)
Elig
ible
pro
visi
ons (
% o
f EL
)
Quarter
Tier 2 capital
Tier 1 capital
Total EP

32
In the regressions to explain the ratio of expected losses to total loans (table 8, panel B),
credit risk is captured by the ratio of non-performing loans to total loans (NPL) together with
bank-specific fixed effects. Because IRB banks use their internal models for estimating both
RWA and EL for credit risk, we deflate capital before provisions by total assets instead of
risk-weighted assets (to avoid using the endogenously determined risk-based capital ratio in
the regressions). The results show that the coefficients on the total asset-based capital ratios
(T1CAPTA and CAPBTA) are positive and significant in all six regressions. In interpreting
these results, we note that all of the Australian IRB banks raised significant amounts of new
capital as a response to severe funding pressures in offshore wholesale markets over 2008 and
2009.36 Over this period, the banks in our sample mostly relied on private placements,
dividend reinvestment plans and, to a lesser extent, share purchase plans. However, the
expected losses of IRB banks did not peak until June 2010 (see figure 2, panel A). In these
circumstances, the regression results suggest that IRB banks did not consider the likelihood
of more adverse conditions until they had rebuilt their capital base. That is, banks may not
have fully revised their estimates for the probability of default (PD) and loss given default
(LGD) associated with credit exposures until they had a sufficient capital buffer to cope with
the stressed conditions and meet the requirements of the Basel III framework.37
In the regressions to explain the ratio of eligible provisions to expected losses (table 8, panel
C), the excess risk-based capital ratios before provisions (RT1CAP and RCAPB) are used as
explanatory variables on the basis that the banks allocate EP against EL independently of the
process for estimating total RWA.38 Noticeably, the estimated coefficient in front of
RT1CAP is positive and statistically significant in the regression for the ratio of EP to EL on
non-defaulted exposures (column 3), implying that banks allocate higher EP against EL on
these exposures when their tier 1 capital ratios are stronger. In economic terms, changing
from an IRB bank at the lower quartile for the tier 1 capital ratio before provisions to an IRB
bank at the upper quartile is associated with an increase in the ratio of EP to EL on non- 36 For example, market statistics show that the four major banks, ANZ Bank, Commonwealth Bank, National Australia Bank and Westpac were among the top five Australian companies for secondary capital raisings over 2008 and 2009, raising a total of $37.8 billion (see the Australian Securities Exchange report, Capital Raising in Australia: Experiences and Lessons from the Global Financial Crisis, ASX Information Paper, 29 January 2010). 37 An alternative explanation is that banks were monitoring developments in the United States subprime lending market, but did not have sufficient evidence to revise loss expectations until the spill-over effects on economic activity were felt in their key lending markets in Australia and abroad. This explanation seems less plausible, given that business confidence as measured by the National Australia Bank decreased at a rapid pace in 2008 and bottomed in early 2009. 38 This assumption is consistent with the two distinct steps by which IRB banks determine their provisioning levels, depicted in table 1, panel B.

33
defaulted exposures of 5.2 per cent. In contrast, the coefficient in front of RCAPB is
statistically insignificant in the regression for non-defaulted exposures (column 4). These
findings are consistent with the allocation of EP against EL reducing the tier 1 capital ratio,
but having no impact on the total capital ratio (see table 1, panel B).
Table 8, panel D examines the combined effect of capital before provisions on the ratio of
eligible provisions to total loans. Following the approach used in panel B, credit risk is
measured by the NPL variable and bank-specific fixed effects and the impact of capital
before provisions is measured by the variables T1CAPTA and CAPBTA, to avoid relying on
endogenous risk estimates. The coefficients in front of T1CAPTA and CAPBTA are positive
and significant in all six regressions, suggesting that IRB banks use surplus regulatory capital
to increase EP on both defaulted and non-defaulted exposures under the Basel II framework.
6. Conclusion
Based on confidential regulatory data collected by APRA, this study examines the loan-loss
provisioning practices of 22 banks operating in Australia in the period from March 2004 to
December 2012. In a departure from accounting standards, APRA administers a forward-
looking provisioning model for the prudential supervision of banks. The model distinguishes
between specific provisions to cover credit losses expected to be realised in the next 12-18
months and a general reserve to cover losses that are expected but not certain to arise over the
full life of all the loans in a bank’s portfolio. The forward-looking model is consistent with
the expected loss approach to provisioning advocated by the Basel Committee on Banking
Supervision in its Basel III reforms.
Analysing provisioning behaviour across the whole sample, we find evidence that: (i)
regulatory provisions reflect meaningful information about the default risk associated with
banks’ loan portfolios, (ii) banks allocate part of surplus capital above Basel minimum
requirements to pre-fund future credit losses through provisions, and (iii) banks accumulate
additional provisions when their earnings are higher. These findings imply that bank
provisioning behaviour has both pro-cyclical and counter-cyclical characteristics: Provisions
are sensitive to cyclical fluctuations in default risk; however, banks adjust provisions to
cushion the impact of cyclical fluctuations in capital adequacy and earnings. We also find
that larger banks maintain higher provisioning levels than smaller banks, suggesting that
larger banks are more closely monitored by regulators and investors.

34
In Australia, most small to medium-sized banks use the standardised approach to credit risk
across the entire sample period. Results of our study suggest that standardised banks with
GRCL within the reserving threshold make use of surplus capital for increasing the GRCL.
Furthermore, a positive relationship between the GRCL and regulatory capital ratios before
provisions is stronger for banks that have general reserves exceeding the upper-bound of 1.25
per cent of RWA, consistent with these banks facing a stricter trade-off between capital
adequacy and reserving for future credit losses. In addition, standardised banks that fund a
greater proportion of their loan books with deposits maintain significantly lower specific
provisions, suggesting that these banks may be less closely monitored by wholesale funding
markets.
Four major banks and one medium-sized bank, Macquarie Bank, received approval to use the
internal ratings-based approach to credit risk with the implementation of the Basel II capital
framework. A feature of Basel II is the greater use of IRB banks’ internal credit risk
assessments as inputs to capital calculations. Our results suggest that these banks continue to
use surplus regulatory capital for replenishing both specific provisions and the GRCL after
they adopt the IRB approach. Thus, there is no evidence that the greater alignment of
regulatory provisioning requirements with banks’ internal risk assessments has discouraged
IRB banks from using surplus capital in this way. Interestingly, an analysis of IRB banks’
expected losses suggests that these banks did not factor in the likelihood of more adverse
conditions during the financial crisis of 2008-2009 until they had reinforced their capital
base. Furthermore, the IRB banks allocated more provisions against expected losses on non-
defaulted exposures when their tier 1 capital ratios before provisions were stronger. These
findings suggest that improving the quality of their capital base in preparation for the more
stringent requirements under Basel III was a greater priority for banks in this period than
bolstering loan-loss provisions.

35
References
Ahmed, A.S., Takeda, C. and Thomas, S. (1999), ‘Bank loan loss provisions: a reexamination
of capital management, earnings management and signaling effects’, Journal of Accounting
and Economics, 28 (1), 1-25.
Anandarajan, A., Hasan, I. and McCarthy, C. (2007), ‘Use of loan loss provisions for capital,
earnings management and signalling by Australian banks’, Accounting and Finance, 47 (3),
357-79.
Beatty, A., Chamberlain, S.L. and Magliolo, J. (1995), ‘Managing financial reports of
commercial banks: The influence of taxes, regulatory capital, and earnings’, Journal of
Accounting Research, 33 (2), 231-61.
Beatty, A.L., Ke, B. and Petroni, K.R. (2002), ‘Earnings management to avoid earnings
declines across publicly and privately held banks’, Accounting Review, 77 (3), 547-70.
Beatty, A. and Liao, S. (2011), ‘Do delays in expected loss recognition affect banks’
willingness to lend?’, Journal of Accounting and Economics, 52 (1), 1-20.
Beaver, W.H., Ryan, S.G. and Wahlen, J.M. (1997), ‘When is “bad news” viewed as “good
news”?’, Financial Analysts Journal, 53 (1), 45-54.
Bikker, J.A. and Metzemakers, P.A.J. (2005), ‘Bank provisioning behaviour and
procyclicality’, Journal of International Financial Markets, Institutions and Money, 15 (2),
141-57.
Bouvatier, V. and Lepetit, L. (2008), ‘Banks’ procyclical behavior: Does provisioning
matter?’, Journal of International Financial Markets, Institutions and Money, 18 (5), 513-26.
Collins, J.H., Shackelford, D.A. and Wahlen, J.M. (1995), ‘Bank differences in the
coordination of regulatory capital, earnings, and taxes’, Journal of Accounting Research, 33
(2), 263-91.
Fonseca, A.R. and González, F. (2008), ‘Cross-country determinants of bank income
smoothing by managing loan-loss provisions’, Journal of Banking and Finance, 32 (2), 217-
28.

36
Gow, I.D., Ormazabal, G. and Taylor, D.J. (2010), ‘Correcting for cross-sectional and time-
series dependence in accounting research’, Accounting Review, 85 (2), 483-512.
Greenawalt, M.B. and Sinkey, J.F. (1988), ‘Bank loan-loss provisions and the income-
smoothing hypothesis: An empirical analysis, 1976-1984’, Journal of Financial Services
Research, 1 (4), 301-18.
Hasan, I. and Wall, L.D. (2004), ‘Determinants of the loan loss allowance: Some cross-
country comparisons’, Financial Review, 39 (1), 129-52.
Hess, K., Grimes, A. and Holmes, M. (2009), ‘Credit losses in Australasian banking’,
Economic Record, 85 (270), 331-43.
Kim, M. and Kross, W. (1998), ‘The impact of the 1989 change in bank capital standards on
loan loss provisions and loan write-offs’, Journal of Accounting and Economics, 25 (1), 69-
99.
Laeven, L. and Majnoni, G. (2003), ‘Loan loss provisioning and economic slowdowns: Too
much, too late?’, Journal of Financial Intermediation, 12 (2), 178-97.
Liu, C., Ryan, S.G. and Wahlen, J.M. (1997), ‘Differential valuation implications of loan loss
provisions across banks and fiscal quarters’, Accounting Review, 72 (1), 133-46.
Ma, C.K. (1988), ‘Loan loss reserves and income smoothing: The experience in the U.S.
banking industry’, Journal of Business Finance and Accounting, 15 (4), 487-97.
Moyer, S.E. (1990), ‘Capital adequacy ratio regulations and accounting choices in
commercial banks’, Journal of Accounting and Economics, 13 (2), 123-54.
Pérez, D., Salas-Fumás, V. and Saurina, J. (2008), ‘Earnings and capital management in
alternative loan loss provision regulatory regimes’, European Accounting Review, 17 (3),
423-45.
Robb, S.W.G. (1998), ‘The effect of analysts’ forecasts on earnings management in financial
institutions’, Journal of Financial Research, 21 (3), 315-31.

37
Shrieves, R.E. and Dahl, D. (2003), ‘Discretionary accounting and the behavior of Japanese
banks under financial duress’, Journal of Banking and Finance, 27 (7), 1219-43.
Thompson, S.B. (2011), ‘Simple formulas for standard errors that cluster by both firm and
time’, Journal of Financial Economics, 99 (1), 1-10.
Wahlen, J.M. (1994), ‘The nature of information in commercial bank loan loss disclosures’,
Accounting Review, 69 (3), 455-78.

38
Appendix A1
Provisioning waterfall for Australian banks
Figure A1.1 illustrates movements in provisions under Australian accounting standards.
Australian accounting standards have been harmonised with International Financial
Reporting Standards (IFRS) from January 2005. The figure shows movements for provisions
assessed on an individual loan basis and for those assessed on a portfolio (collective) basis.
For each data item (for example, new funding for collective provisions), first the asset-
weighted average across all banks for each quarter from March 2004 to December 2012 is
calculated; and then a simple time-series average of the cross-sectional averages is reported.
Numbers in this figure are presented in annual terms.
Figure A1.1 Movements in provisions for impairment
Write-offs: 4 bps pa
Direct write-offs: 3 bps pa
Write-offs: 23 bps pa
Collective provisions Average balance: 65 bps
Individual provisions Average balance: 26 bps
New funding: 20 bps pa
New funding: 18 bps pa
Transfer: 8 bps pa
This figure illustrates movements in Australian accounting standards provisions for all sample banks. The sample period is March 2004 to December 2012. Australian accounting standards have been harmonised with International Financial Reporting Standards (IFRS) from January 2005.

39
Appendix A2
Comparison of the provisioning models used by Australian banks
Figure A2.1 illustrates the relationship between the two provisioning models used by
Australian banks: the forward-looking model specified by APRA and the incurred loss model
for reporting to the market. For each data item, first the asset-weighted average across all
banks for each quarter from September 2006 to December 2012 is calculated; and then a
simple time-series average of the cross-sectional averages is reported.
Requirements for reclassifying accounting provisions as two types of regulatory provisions
are specified in APRA’s Prudential Standard APS 220 Credit Quality, May 2006. All
provisions assessed by a bank on an individual basis under Australian accounting standards
(31 basis points) and a portion of provisions assessed on a collective basis for which losses
are expected to materialise in the short term (6 basis points) are treated as specific provisions
for regulatory purposes. Collective provisions for losses that are expected but not certain to
arise are included in the GRCL (55 basis points). Where the bank does not maintain sufficient
GRCL made up of collective provisions, it is required to establish a reserve against retained
earnings for the additional amount (6 basis points).

40
Figure A2.1 Relationship between accounting provisions and regulatory provisions
Individual provisions
31 bps
Collective provisions
61 bps GRCL 61 bps
Specific provisions
37 bps
Regulatory reporting IFRS reporting
Reserves 6 bps
This figure illustrates the allocation of Australian accounting standards provisions to specific provisions and general reserve for credit losses for regulatory purposes for all sample banks. The sample period is September 2006 to December 2012.