effect of tip-speed constraints on the optimized design of ... · the low tip-speed ratio case...
TRANSCRIPT

NREL is a national laboratory of the U.S. Department of Energy Office of Energy Efficiency & Renewable Energy Operated by the Alliance for Sustainable Energy, LLC This report is available at no cost from the National Renewable Energy Laboratory (NREL) at www.nrel.gov/publications.
Contract No. DE-AC36-08GO28308
Effect of Tip-Speed Constraints on the Optimized Design of a Wind Turbine K. Dykes, A. Platt, Y. Guo, A. Ning, R. King, T. Parsons, D. Petch, and P. Veers National Renewable Energy Laboratory
B. Resor Sandia National Laboratories
Technical Report NREL/TP-5000-61726 October 2014

NREL is a national laboratory of the U.S. Department of Energy Office of Energy Efficiency & Renewable Energy Operated by the Alliance for Sustainable Energy, LLC This report is available at no cost from the National Renewable Energy Laboratory (NREL) at www.nrel.gov/publications.
Contract No. DE-AC36-08GO28308
National Renewable Energy Laboratory 15013 Denver West Parkway Golden, CO 80401 303-275-3000 • www.nrel.gov
Effect of Tip-Speed Constraints on the Optimized Design of a Wind Turbine K. Dykes, A. Platt, Y. Guo, A. Ning, R. King, T. Parsons, D. Petch, and P. Veers National Renewable Energy Laboratory
B. Resor Sandia National Laboratories
Prepared under Task No. WE14.3G01
Technical Report NREL/TP-5000-61726 October 2014

NOTICE
This report was prepared as an account of work sponsored by an agency of the United States government. Neither the United States government nor any agency thereof, nor any of their employees, makes any warranty, express or implied, or assumes any legal liability or responsibility for the accuracy, completeness, or usefulness of any information, apparatus, product, or process disclosed, or represents that its use would not infringe privately owned rights. Reference herein to any specific commercial product, process, or service by trade name, trademark, manufacturer, or otherwise does not necessarily constitute or imply its endorsement, recommendation, or favoring by the United States government or any agency thereof. The views and opinions of authors expressed herein do not necessarily state or reflect those of the United States government or any agency thereof.
This report is available at no cost from the National Renewable Energy Laboratory (NREL) at www.nrel.gov/publications.
Available electronically at http://www.osti.gov/scitech
Available for a processing fee to U.S. Department of Energy and its contractors, in paper, from:
U.S. Department of Energy Office of Scientific and Technical Information P.O. Box 62 Oak Ridge, TN 37831-0062 phone: 865.576.8401 fax: 865.576.5728 email: mailto:[email protected]
Available for sale to the public, in paper, from:
U.S. Department of Commerce National Technical Information Service 5285 Port Royal Road Springfield, VA 22161 phone: 800.553.6847 fax: 703.605.6900 email: [email protected] online ordering: http://www.ntis.gov/help/ordermethods.aspx
Cover Photos: (left to right) photo by Pat Corkery, NREL 16416, photo from SunEdison, NREL 17423, photo by Pat Corkery, NREL 16560, photo by Dennis Schroeder, NREL 17613, photo by Dean Armstrong, NREL 17436, photo by Pat Corkery, NREL 17721.
NREL prints on paper that contains recycled content.

Executive Summary
This study investigates the effect of tip-speed constraints on system levelized cost-of-energy (LCOE). The results indicated that a change in maximum tip-speed from 80 to 100 meters per second (m/s) could produce a 32% decrease in gearbox weight (a 33% reduction in cost), which would result in an overall reduction of 1%–9% in system LCOE depending on the design approach. Three 100-m/s design cases were considered: a low tip-speed ratio/high-solidity rotor design, a high tip-speed ratio/low-solidity rotor design, and a flexible blade design in which a high tip-speed ratio was used along with removing the tip-deflection constraint on the rotor design. In all three cases, the significant reduction in gearbox weight caused by the higher tip-speed and lower overall gear ratio was counterbalanced by increased weights for the rotor and/or other drivetrain components and tower. As a result, the increased costs of either the rotor or drivetrain components offset the overall reduction in turbine costs from downsizing the gearbox. Other system costs were not significantly affected, whereas energy production was slightly reduced in the 100-m/shigh-solidity case and increased in the low-solidity case. This situation resulted in system cost-of-energy reductions moving from the 80-m/s design to the 100-m/s designs of 1.5% for the high tip-speed ratio and 5.5% for the final flexible case (the latter result is optimistic because the impact of deflection of the flexible blade on power production was not modeled). The low tip-speed ratio case actually resulted in a cost of energy increase of 2.1%. Overall, the results demonstrated that there is a trade-off in system design between the maximum tip-speed and the overall wind plant cost-of-energy but also that there are several design trade-offs and design constraints that can limit the benefits of higher tip-speed designs.
Scope
Land-based wind project development has historically limited turbine designs to operate at blade-tip-velocities in the range of 75–80-m/s. The constraint arises from blade-tip aero-acoustic noise generation. The turbine system sound power levels are usually dominated by blade-tip noise when appropriate measures have been taken to mitigate sound emissions and audible tones from the tower head machinery within the nacelle and the power electronic converters often located within the tower base.
The study looks at five overall turbine configurations:
1. A baseline 5- megawatt (MW) reference turbine Jonkman et al. (Feb 2009) with maximum tip-speed of 80-m/s
2. An optimized version with the same 80-m/s tip-speed design constraint
3. An optimized design at 100-m/s maximum tip-speed with a high-solidity rotor
4. An optimized design at 100-m/s maximum tip-speed with a low-solidity rotor
5. An optimized design at 100-m/s maximum tip-speed with a low-solidity rotor where the tip-deflection constraint has been removed (as a proxy for a machine that would operate downwind).
In each of the design cases, a sequential optimization was performed to design the turbine. The rotor was optimized first, then the hub and drivetrain components, and finally the tower. Each turbine design was then used in turbine aero-acoustic noise and overall system cost analyses.
Key Results
The trade-off between maximum allowable tip-speed constraints on turbine design and overall system cost-of-energy was in the range of a few to several percent. The reductions in cost-of-energy would have been more, but the difficulty in packaging sufficient structural strength and stiffness into a lower-solidity rotor, as a result of the higher tip-speed, limited the reductions that could be obtained. Considering only aerodynamics, the increased tip-speed would result in a lower-solidity rotor operating at a higher tip-speed ratio with identical power performance to the reduced tip-speed case. The nontorque loads would be the same, whereas the torque would be reduced. Thus, the system would have a lighter blade and gearbox, and therefore a lighter tower. However, the strength and stiffness constraints for the rotor require that a lower-solidity blade must have increased structural weight. Or alternatively, moving to
i This report is available at no cost from the National Renewable
Energy Laboratory at www.nrel.gov/publications
Effect of Tip Velocity Constraints on the Optimized Design of a Wind Turbine

Table A. Overall Cost Results across the Rour Different Cases
80-m/s Baseline
80-m/s Optimized H
100-m/s igh-Solidity L
100-m/s ow-Solidity
100-m/s Flexible
TCC [$/kilowatt (kW)] 1,793 1,598 1,554 1,569 1,479 BOS [$/kW] 574 557 559 557 550 OPEX [$/kilowatt-hours (kWh)] 0.012 0.012 0.012 0.012 0.012 AEP [megawatt-hours (MWh)/turbine] 20,363 20,242 19,566 20,312 20,312 COE [$/kWh] 0.0624 0.0578 0.0586 0.0570 0.0547 % Reduction from 80-m/s optimized -1.3% 1.5% 5.5% Rotor solidity [%] Rotor tip-speed ratio
5.16 7.55
4.53 8.9
4.6 9.1
3.76 9.9
3.76 9.9
a higher-solidity design to reduce blade weight, which is accompanied by a reduced tip-speed ratio and power production and increased nontorque loads on the drivetrain. The different approaches to rotor design demonstrated the trade-offs in system design between rotor cost and the rest of the turbine costs as well as power production. A summary of high-level cost results for the different cases is provided in Table A.
In the case of the 100-m/s-high-solidity design, the increased rotor thrust loads and blade root bending moments demand a heavier hub, larger low-speed shaft, bigger main bearings, and overall heavier nacelle bedplate. The higher aerodynamic loads and heavier rotor-nacelle assembly (RNA) results in a heavier tower. This configuration did provide lower torque input to the gearbox that reduced overall gearbox size, but the increased loads almost entirely offset the reduced weight of the gearbox so that the overall nacelle weight actually increased slightly from the 80m/s optimized design. The cost of the nacelle, on the other hand, was reduced by 6%. Overall turbine costs were reduced only 3% from the optimized 80-m/s case. Because of the decrease in energy production moving from the 80-m/s optimized design to the 100-m/s-high-solidity design, the cost-of-energy actually increased by 1.3%. This case illustrated the need for a more integrated approach to system design considering overall cost-of-energy as the objective.
It was determined that moving to a lower-solidity, higher tip-speed ratio rotor configuration might improve the system cost-of-energy by allowing for higher energy production and reducing nontorque loads on the drivetrain. Moving to a 100-m/s-low-solidity design did result in a cost-of-energy reduction from the 80-m/s optimized case of 1.5%. The reduction was primarily because of the fact that the new design had thrust loads and blade root bending moments comparable to the 80-m/s design so that the nacelle components were similar in size to the 80-m/s case. This result coupled with the large reduction in gearbox size led to a nacelle that was 2% lighter than the 80-m/s optimized design and a nacelle cost that was 7% less than the 80-m/s optimized design; however, structural modifications were needed for the lower-solidity blade to meet deflection constraints and strength requirements so that the new blade was 9.3% heavier than the 80-m/s optimized blade. The added cost of the blade meant that overall turbine cost reductions were only 2%. However, the high-solidity design had improved aerodynamic efficiency and power capture, resulting in a plant energy production that was higher than the 80-m/s optimized case and an overall reduction in cost-of-energy.
As a final analysis, the 100-m/s-low-solidity design was run in a “flexible” configuration, in which the tip-deflection constraint was removed to mimic a downwind rotor configuration. This approach resulted in lower thrust loads and an overall nacelle that was 5% lighter than the 80-m/s design case. In addition, the removal of the tip-deflection constraint enabled a much more flexible blade design with less structural reinforcement and a mass that was 9.3% lighter than the 80-m/s blade design. The result was a turbine cost that was 7% lower than the 80-m/s case. One caveat here is that the flexible downwind rotor would operate with significant deflection, which could reduce the overall energy production. This effect was not captured in the subsequent annual energy production (AEP) analysis and thus, AEP remained at the same level as the first 100-m/s high tip-speed ratio case. Thus, the resulting overall cost-of-energy reduction of 5.5% from the 80-m/s optimized design case is likely optimistic. Future work should model the effect of blade flexibility on energy capture.
ii This report is available at no cost from the National Renewable
Energy Laboratory at www.nrel.gov/publications

Analysis Limitations and Future Work
The following are the main limitations of the current study:
• Sequential optimization can only capture the impacts of coupled interactions in system design if it is used in an iterative process which can be inefficient. The rotor design is selected without complete information about the downstream effects on other subsystems and overall cost-of-energy. It is possible that an integrated system optimization approach may improve a sequential process, even if the models used are of a lower fidelity. A system optimization may encounter designs that reduce LCOE by more efficiently balancing trade-offs in energy production and cost. If a sequential optimization is used in the future, it is critical to balance the objectives of the rotor design with the rest of the system design.
• Detailed design of the controller for each of the cases was outside the scope of the study. Sophisticated models were used for the rotor design but did not include a suboptimization of the controller design to mitigate against higher loads in the 100-m/s tip-speed cases.
• Higher fidelity and more detailed design-based models are needed for many of the models used. The cost models represent the lowest-fidelity/highest uncertainty models used. The turbine cost model needs to be updated with more data representative of current turbine technologies and costs. The plant cost models for operational expenditures are overly simplistic and the balance-of-station (BOS) cost model is not sufficiently detailed to reflect a design-based/bottom-up approach. Improvements in the accuracy and detail of these models are needed to further explore the impact of tip-speed constraints on system cost.
• Only a single turbine and plant configuration with just two different maximum tip-velocities were considered in the analysis . Future work should assess the impacts of differing site conditions as well as size and class of the turbine design on the effects of tip-speed on system cost-of-energy. This assessment should also be done over a range of tip-velocities. Performing analysis over a range of turbines, sites, and maximum tip-velocities will provide insight as to of potential benefits.
In addition to the caveats above, significant changes to and innovation in the turbine design was outside the scope of this study. Potential innovations in each of the subsytems could take advantage of the higher tip-speed constraint.
• For the rotor, the use of novel materials in the blade design (such as carbon throughout the blade or only near the tip where deflection is the highest) may mitigate against the tip-deflection constraint impacts on the blade weight and cost. However, to explore the use of novel materials, a detailed, design-based blade cost model is necessary to account for the materials and manufacturing costs. Future work could also consider using different airfoil families, such as flat-back airfoils or even thicker airfoils, which may have decreased aerodynamic efficiency but could mitigate against the increased weight of the blades to meet deflection and strength requirements. Another potential research opportunity would be to shift from a three-bladed to a two-bladed rotor configuration
• For the drivetrain, transitioning to higher tip-velocities might create opportunities for novel drivetrain configurations (for example, removing one of the gearbox stages or moving to a medium-speed gearbox/generator or direct-drive configuration).
• For the tower, many innovations are possible through the use of new materials and configurations that would avoid current constraints on design because of logistics considerations related to transportation and installation.
Despite the study limitations, it appears that there is a cost/noise trade-off in the design of wind energy systems. Future work should be conducted to obtain additional insight into this relationship and quanitify the trade-off to better understand the potential cost reductions and the need for research on aero-acoustic noise mitigation strategies.
iii This report is available at no cost from the National Renewable
Energy Laboratory at www.nrel.gov/publications

Table of Contents
1 Overall Background and Introduction . . . . . . . . . . . . . . . . . . . . . . . . . . . . . . . . . . . . 1
2 Study Approach . . . . . . . . . . . . . . . . . . . . . . . . . . . . . . . . . . . . . . . . . . . . . . . . 2
3 Rotor Design Optimization . . . . . . . . . . . . . . . . . . . . . . . . . . . . . . . . . . . . . . . . . . 4 3.1 Rotor Design Overview . . . . . . . . . . . . . . . . . . . . . . . . . . . . . . . . . . . . . . . . . . 5
3.1.1 General Rotor Design Specifications . . . . . . . . . . . . . . . . . . . . . . . . . . . . . . . 5 3.1.1.1 80-m/s Tip-Speed Optimized Design . . . . . . . . . . . . . . . . . . . . . . . . . 5 3.1.1.2 100-m/s Tip-Speed Optimized Designs for Low and High-Solidity . . . . . . . . . 5 3.1.1.3 100-m/s Tip-Speed Optimized Design with a Flexible Blade . . . . . . . . . . . . . 5
3.1.2 Baseline Rotor Blade Design . . . . . . . . . . . . . . . . . . . . . . . . . . . . . . . . . . . 5 3.1.2.1 Airfoils . . . . . . . . . . . . . . . . . . . . . . . . . . . . . . . . . . . . . . . . . 6 3.1.2.2 Aerodynamic Polar Data . . . . . . . . . . . . . . . . . . . . . . . . . . . . . . . 6 3.1.2.3 Materials . . . . . . . . . . . . . . . . . . . . . . . . . . . . . . . . . . . . . . . . 6 3.1.2.4 Blade Root Hardware . . . . . . . . . . . . . . . . . . . . . . . . . . . . . . . . . 6
3.2 Aero-Structural Rotor Design . . . . . . . . . . . . . . . . . . . . . . . . . . . . . . . . . . . . . . . 6 3.2.1 Method . . . . . . . . . . . . . . . . . . . . . . . . . . . . . . . . . . . . . . . . . . . . . . 6
3.2.1.1 Design Variables . . . . . . . . . . . . . . . . . . . . . . . . . . . . . . . . . . . . 7 3.2.1.2 Fitness Function . . . . . . . . . . . . . . . . . . . . . . . . . . . . . . . . . . . . 8
3.2.2 Aero-Structural Optimization Results . . . . . . . . . . . . . . . . . . . . . . . . . . . . . . 8 3.2.3 Discussion of Aero-Structural Design Results . . . . . . . . . . . . . . . . . . . . . . . . . . 9
3.2.3.1 Chord and Twist Distributions . . . . . . . . . . . . . . . . . . . . . . . . . . . . . 10 3.2.3.2 Thickness Distributions . . . . . . . . . . . . . . . . . . . . . . . . . . . . . . . . 10
3.3 Structural Optimization . . . . . . . . . . . . . . . . . . . . . . . . . . . . . . . . . . . . . . . . . . 12 3.3.1 Structural Optimization Method . . . . . . . . . . . . . . . . . . . . . . . . . . . . . . . . . 12
3.3.1.1 Flexible Designs . . . . . . . . . . . . . . . . . . . . . . . . . . . . . . . . . . . . 14 3.3.2 Structural Optimization Results . . . . . . . . . . . . . . . . . . . . . . . . . . . . . . . . . 14
3.4 Overall Rotor Summary and Discussion . . . . . . . . . . . . . . . . . . . . . . . . . . . . . . . . . 15 3.4.1 80-m/s Optimized Design Results . . . . . . . . . . . . . . . . . . . . . . . . . . . . . . . . 15 3.4.2 Airfoil Placement . . . . . . . . . . . . . . . . . . . . . . . . . . . . . . . . . . . . . . . . . 15 3.4.3 Ideal High-Speed Rigid Rotor Design . . . . . . . . . . . . . . . . . . . . . . . . . . . . . . 16 3.4.4 100-m/s Design Results . . . . . . . . . . . . . . . . . . . . . . . . . . . . . . . . . . . . . 16 3.4.5 Flexible Design . . . . . . . . . . . . . . . . . . . . . . . . . . . . . . . . . . . . . . . . . . 18 3.4.6 Limitations of Current Approach . . . . . . . . . . . . . . . . . . . . . . . . . . . . . . . . . 18
3.4.6.1 Controls . . . . . . . . . . . . . . . . . . . . . . . . . . . . . . . . . . . . . . . . 19
4 Turbine Loads Analysis . . . . . . . . . . . . . . . . . . . . . . . . . . . . . . . . . . . . . . . . . . . . 21 4.1 Aero-elastic Modeling with FAST . . . . . . . . . . . . . . . . . . . . . . . . . . . . . . . . . . . . 21
4.1.1 Design Load Cases . . . . . . . . . . . . . . . . . . . . . . . . . . . . . . . . . . . . . . . . 22 4.1.1.1 DLC 1.1 . . . . . . . . . . . . . . . . . . . . . . . . . . . . . . . . . . . . . . . . 22 4.1.1.2 DLC 1.2 . . . . . . . . . . . . . . . . . . . . . . . . . . . . . . . . . . . . . . . . 22 4.1.1.3 DLC 1.3 . . . . . . . . . . . . . . . . . . . . . . . . . . . . . . . . . . . . . . . . 23 4.1.1.4 DLC 1.4 . . . . . . . . . . . . . . . . . . . . . . . . . . . . . . . . . . . . . . . . 23
iv This report is available at no cost from the National Renewable
Energy Laboratory at www.nrel.gov/publications

4.1.1.5 DLC 1.5 . . . . . . . . . . . . . . . . . . . . . . . . . . . . . . . . . . . . . . . . 24 4.1.1.6 DLC 2.3 . . . . . . . . . . . . . . . . . . . . . . . . . . . . . . . . . . . . . . . . 24 4.1.1.7 DLC 6.1 . . . . . . . . . . . . . . . . . . . . . . . . . . . . . . . . . . . . . . . . 24 4.1.1.8 DLC 6.2 . . . . . . . . . . . . . . . . . . . . . . . . . . . . . . . . . . . . . . . . 24 4.1.1.9 DLC 6.4 . . . . . . . . . . . . . . . . . . . . . . . . . . . . . . . . . . . . . . . . 24 4.1.1.10 DLC 7.1 . . . . . . . . . . . . . . . . . . . . . . . . . . . . . . . . . . . . . . . . 24
4.1.2 Post-Processing Methodology . . . . . . . . . . . . . . . . . . . . . . . . . . . . . . . . . . 25 4.2 Aero-Elastic Loads Analysis Results . . . . . . . . . . . . . . . . . . . . . . . . . . . . . . . . . . . 25
5 Drivetrain Design . . . . . . . . . . . . . . . . . . . . . . . . . . . . . . . . . . . . . . . . . . . . . . . 29 5.1 Study Approach Using System Engineering Drivetrain Sizing Tool . . . . . . . . . . . . . . . . . . . 29
5.1.1 Description of Selected Drivetrain Configurations . . . . . . . . . . . . . . . . . . . . . . . . 31 5.1.1.1 Gearbox . . . . . . . . . . . . . . . . . . . . . . . . . . . . . . . . . . . . . . . . 31 5.1.1.2 Main Bearing . . . . . . . . . . . . . . . . . . . . . . . . . . . . . . . . . . . . . 31
5.2 Design Loads for Sizing the Drivetrain . . . . . . . . . . . . . . . . . . . . . . . . . . . . . . . . . . 32 5.2.1 80-m/s Baseline Design . . . . . . . . . . . . . . . . . . . . . . . . . . . . . . . . . . . . . 33 5.2.2 80-m/s Optimized Design . . . . . . . . . . . . . . . . . . . . . . . . . . . . . . . . . . . . 33 5.2.3 100-m/s Optimized Designs . . . . . . . . . . . . . . . . . . . . . . . . . . . . . . . . . . . 34
5.3 Discussions of Drivetrain Designs . . . . . . . . . . . . . . . . . . . . . . . . . . . . . . . . . . . . 37 5.3.1 Comparison between NREL Baseline Drivetrain Against REpower Design . . . . . . . . . . 37 5.3.2 Weight and Cost Benefit for Drivetrains with Higher Tip-Velocities . . . . . . . . . . . . . . 37
6 Tower Design . . . . . . . . . . . . . . . . . . . . . . . . . . . . . . . . . . . . . . . . . . . . . . . . . . 40 6.1 Approach: TowerSE Model . . . . . . . . . . . . . . . . . . . . . . . . . . . . . . . . . . . . . . . . 40 6.2 Tower Optimization Results . . . . . . . . . . . . . . . . . . . . . . . . . . . . . . . . . . . . . . . 41
7 System Cost and Noise Analysis . . . . . . . . . . . . . . . . . . . . . . . . . . . . . . . . . . . . . . . 42 7.1 Study Approach: Turbine Noise and Plant Cost Models . . . . . . . . . . . . . . . . . . . . . . . . . 42
7.1.1 Cost of Energy Analysis Tools . . . . . . . . . . . . . . . . . . . . . . . . . . . . . . . . . . 42 7.1.2 Turbine Noise Analysis . . . . . . . . . . . . . . . . . . . . . . . . . . . . . . . . . . . . . . 43
7.2 LCOE Analysis Results . . . . . . . . . . . . . . . . . . . . . . . . . . . . . . . . . . . . . . . . . . 44 7.3 Noise Analysis Results . . . . . . . . . . . . . . . . . . . . . . . . . . . . . . . . . . . . . . . . . . 48 7.4 Discussion of LCOE and Noise Results . . . . . . . . . . . . . . . . . . . . . . . . . . . . . . . . . 49
8 Result Discussion and Future Work . . . . . . . . . . . . . . . . . . . . . . . . . . . . . . . . . . . . . 50 8.1 Lessons Learned and Future Work . . . . . . . . . . . . . . . . . . . . . . . . . . . . . . . . . . . . 51
References . . . . . . . . . . . . . . . . . . . . . . . . . . . . . . . . . . . . . . . . . . . . . . . . . . . . . 52
A Tables of Turbine Loads . . . . . . . . . . . . . . . . . . . . . . . . . . . . . . . . . . . . . . . . . . . . 55 A.1 Loads by DLC . . . . . . . . . . . . . . . . . . . . . . . . . . . . . . . . . . . . . . . . . . . . . . . 55 A.2 Damage Equivalent Tower Loads . . . . . . . . . . . . . . . . . . . . . . . . . . . . . . . . . . . . . 57 A.3 Extreme Tower Loads . . . . . . . . . . . . . . . . . . . . . . . . . . . . . . . . . . . . . . . . . . . 62 A.4 Low-Speed Shaft Loads . . . . . . . . . . . . . . . . . . . . . . . . . . . . . . . . . . . . . . . . . . 64
v This report is available at no cost from the National Renewable
Energy Laboratory at www.nrel.gov/publications

List of Figures
Figure 1. Flow diagram of the analysis set-up used for the tip-speed study . . . . . . . . . . . . . . . . . . 2
Figure 2. Pareto fronts showing the sets of noninferior designs . . . . . . . . . . . . . . . . . . . . . . . . 9
Figure 3. Pareto fronts expressed in terms of approximate system cost . . . . . . . . . . . . . . . . . . . . 9
Figure 4. Chord and twist distributions of selected blade designs . . . . . . . . . . . . . . . . . . . . . . . 10
Figure 5. Airfoil t/c versus blade span . . . . . . . . . . . . . . . . . . . . . . . . . . . . . . . . . . . . . 11
Figure 6. Airfoil thickness versus blade span . . . . . . . . . . . . . . . . . . . . . . . . . . . . . . . . . . 11
Figure 7. Weight of material per layup component . . . . . . . . . . . . . . . . . . . . . . . . . . . . . . . 15
Figure 8. Illustration of turbine control regions showing three different rotor design approaches . . . . . . . 17
Figure 9. Comparison of the maximum loads on the yaw bearing and low-speed shaft for all optimized rotor designs. The values shown in this plot correspond to Table 10 and are normalized to the baseline 80-m/s rotor design. . . . . . . . . . . . . . . . . . . . . . . . . . . . . . . . . . . . . . . . . . . . . . . 26
Figure 10. Comparison of the maximum loads on the yaw bearing and low-speed shaft for 100-m/s rotor designs. The values shown in this plot correspond to Table 10 and are normalized to the optimized 80m/s rotor design. . . . . . . . . . . . . . . . . . . . . . . . . . . . . . . . . . . . . . . . . . . . . . . . 26
Figure 11. DriveSE calculation flow chart . . . . . . . . . . . . . . . . . . . . . . . . . . . . . . . . . . . . 29
Figure 12. REpower 5-MW turbine drivetrain [(Giese, 2013)] . . . . . . . . . . . . . . . . . . . . . . . . . 31
Figure 13. Main shaft and main bearing assembly [(Svenska Kullagerfabriken AB (SKF), 2013)] . . . . . . 32
Figure 14. Gearboxes of the (a) 80-m/s tip-speed design and the (b) 100-m/s tip-speed design . . . . . . . . 35
Figure 15. Main shaft of (a) baseline design, (b) 80-m/s optimized design, (c) 100-m/s-high-solidity design, (d) 100-m/s-low-solidity design, and (d) 100-m/s flexible design. . . . . . . . . . . . . . . . . . . . . . . 36
Figure 16. From the Top to Bottom, Nacelles of the Baseline Design, 80-m/s Optimized Design, 100-m/sHigh-Solidity Design, 100-m/s-Low-Solidity Design, and 100-m/s Flexible Design. Illustrated by Taylor
Figure 19. Utilization for the baseline and three optimized point designs Utilization less than nne is accept-
Figure 23. Total aero-acoustic sound pressure level (SPL) curves for four different analysis cases at the base
Parsons (NREL). . . . . . . . . . . . . . . . . . . . . . . . . . . . . . . . . . . . . . . . . . . . . . . . 38
Figure 17. Gearbox weight variation with rotor RPM . . . . . . . . . . . . . . . . . . . . . . . . . . . . . . 39
Figure 18. Two varieties of compound planetary gears. Illustrated by Yi Guo (NREL). . . . . . . . . . . . . 39
able. . . . . . . . . . . . . . . . . . . . . . . . . . . . . . . . . . . . . . . . . . . . . . . . . . . . . . . 41
Figure 20. Power curves for four different analysis cases . . . . . . . . . . . . . . . . . . . . . . . . . . . . 45
Figure 21. Rotor speed curves for four different analysis cases . . . . . . . . . . . . . . . . . . . . . . . . . 46
Figure 22. Thrust curves for four different analysis cases . . . . . . . . . . . . . . . . . . . . . . . . . . . . 46
of the tower . . . . . . . . . . . . . . . . . . . . . . . . . . . . . . . . . . . . . . . . . . . . . . . . . . 48
Figure 24. Noise surface plots at the base of the tower for the 80-m/s baseline and 100-m/s optimized designs 49
vi This report is available at no cost from the National Renewable
Energy Laboratory at www.nrel.gov/publications

Figure 25. Overview of the maximum loads for the 80-m/s rotor designs. For each variable, the magnitudes of the values have been normalized to the largest value found. . . . . . . . . . . . . . . . . . . . . . . . . 55
Figure 26. Overview of the maximum loads for the 100-m/s stiff blade rotor designs. For each variable, the magnitude of the values have been normalized to the largest value found. . . . . . . . . . . . . . . . . . . 56
Figure 27. Overview of the maximum loads from each DLC for the flexible 100-m/s low-solidity rotor. For each variable, the magnitude of the values have been normalized to the largest value found. . . . . . . . . 56
vii This report is available at no cost from the National Renewable
Energy Laboratory at www.nrel.gov/publications

List of Tables
Table A. Overall Cost Results across the Rour Different Cases . . . . . . . . . . . . . . . . . . . . . . . . . ii
Table 1. Model Input-Output Relationships Necessary for Study . . . . . . . . . . . . . . . . . . . . . . . 3
Table 2. Airfoil Names and Maximum Thickness Ratios . . . . . . . . . . . . . . . . . . . . . . . . . . . . 6
Table 3. Strengths and Weaknesses of Individual Tools . . . . . . . . . . . . . . . . . . . . . . . . . . . . 7
Table 4. Summary of Rotor Performance Parameters . . . . . . . . . . . . . . . . . . . . . . . . . . . . . 12
Table 5. IEC Design Load Cases Used to Drive Rotor Design . . . . . . . . . . . . . . . . . . . . . . . . . 14
Table 6. Summary of Rotor Designs . . . . . . . . . . . . . . . . . . . . . . . . . . . . . . . . . . . . . . 20
Table 7. Differences between NREL 5-MW Controller Constants for the 80-m/s and 100-m/s Configurations . . . . . . . . . . . . . . . . . . . . . . . . . . . . . . . . . . . . . . . . . . . . . . . . . . . . . . 21
Table 8. Damping Coefficients for the Blades and Tower. . . . . . . . . . . . . . . . . . . . . . . . . . . . 22
Table 9. Summary of IEC Design Load Cases Performed . . . . . . . . . . . . . . . . . . . . . . . . . . . 23
Table 10. Maximum Loads on the Yaw Bearing and Low Speed Shaft (LSS) for All Five Rotor Designs . . . 25
Table 11. Comparison of the Maximum Forces and Moments at the Yaw Bearing at the Top of the Tower for All Five Rotor Designs (The tables from which these results are extracted can be found in Appendix A.3) 27
Table 12. Comparison of the Minimum and Maximum Forces and Moments on the LSS for All Five Rotor Designs (The tables from which these results are extracted can be found in Appendix A.4) . . . . . . . . 28
Table 13. Maximum Ranges for Slopes and Transverse Deflections . . . . . . . . . . . . . . . . . . . . . . 30
Table 14. von Mise Stress kpsi of LSS at the Upwind Main Bearing Location . . . . . . . . . . . . . . . . . 32
Table 15. Gearbox Transmitted Torque, Speed Ratio, and Weight per Gear Stage for the Baseline Design . . 33
Table 16. LSS Dimension and Weight for the Baseline Design . . . . . . . . . . . . . . . . . . . . . . . . . 33
Table 17. Main Bearing Dimensions and Weights for the Baseline Design . . . . . . . . . . . . . . . . . . . 33
Table 18. Gearbox Transmitted Torque, Speed Ratio, and Weight per Gear Stage for the Baseline Design . . 34
Table 19. LSS Dimension and Weight for the 80-m/s Optimized Design . . . . . . . . . . . . . . . . . . . . 34
Table 20. Main Bearing Dimension and Weight for the 80-m/s Optimized Design . . . . . . . . . . . . . . . 34
Table 21. Gearbox-Transmitted Torque, Speed Ratio, and Weight per Gear Stage for the Increased Tip-Speed Design . . . . . . . . . . . . . . . . . . . . . . . . . . . . . . . . . . . . . . . . . . . . . . . . . 35
Table 22. LSS Dimension and Weight for the 100-m/s-High-Solidity Blade Design . . . . . . . . . . . . . . 35
Table 23. Main Bearing Dimension and Weight for the 100-m/s Optimized Design . . . . . . . . . . . . . . 35
Table 24. Baseline Design Component Weight and REpower Data Comparison . . . . . . . . . . . . . . . . 37
Table 25. Design Component Weight Comparison . . . . . . . . . . . . . . . . . . . . . . . . . . . . . . . . 37
Table 26. Tower Mass and Dimension Comparisons Between Baseline and Optimized Designs . . . . . . . . 41
Table 27. Masses for Wind Turbine, Subsystems, and Individual Components (tons) . . . . . . . . . . . . . 43
viii This report is available at no cost from the National Renewable
Energy Laboratory at www.nrel.gov/publications

Table 28. Overall Cost Results Across the Four Different Cases with AEP Calculations via a Weibull Distribution . . . . . . . . . . . . . . . . . . . . . . . . . . . . . . . . . . . . . . . . . . . . . . . . . . . . . 44
Table 29. Overall Cost Results Across the Four Different Cases with AEP Calculations via OpenWind . . . . 45
Table 30. Overall Cost Results Across the Five Different Cases (in 1,000 USD) . . . . . . . . . . . . . . . . 47
Table 31. Damage Equivalent Fatigue Moments for All Tower Nodes for the Baseline Rotor Design . . . . . 57
Table 32. Damage Equivalent Fatigue Moments for All Tower Nodes for the Optimized 80-m/s Rotor Design 58
Table 33. Damage Equivalent Fatigue Moments for All Tower Nodes for the Optimized 100-m/s High-Solidity Rotor Design . . . . . . . . . . . . . . . . . . . . . . . . . . . . . . . . . . . . . . . . . . . . 59
Table 34. Damage Equivalent Fatigue Moments for All Tower Nodes for the Optimized 100-m/s Low-Solidity Rotor Design . . . . . . . . . . . . . . . . . . . . . . . . . . . . . . . . . . . . . . . . . . . . 60
Table 35. Damage Equivalent Fatigue Moments for All Tower Nodes for the Optimized Flexible Low-Solidity 100-m/s Rotor Design . . . . . . . . . . . . . . . . . . . . . . . . . . . . . . . . . . . . . . . . . . . . 61
Table 36. The Maximum and Minimum Forces and Moments at the Yaw Bearing for the Baseline Rotor Design . . . . . . . . . . . . . . . . . . . . . . . . . . . . . . . . . . . . . . . . . . . . . . . . . . . . . 62
Table 37. The Maximum and Minimum Forces and Moments at the Yaw Bearing for the 80-m/s Rotor Design 62
Table 38. The Maximum and Minimum Forces and Moments at the Yaw Bearing for the High-Solidity 100m/s Rotor Design . . . . . . . . . . . . . . . . . . . . . . . . . . . . . . . . . . . . . . . . . . . . . . . 63
Table 39. The Maximum and Minimum Forces and Moments at the Yaw Bearing for the Low-Solidity 100m/s Rotor Design . . . . . . . . . . . . . . . . . . . . . . . . . . . . . . . . . . . . . . . . . . . . . . . 63
Table 40. The Maximum and Minimum Forces and Moments at the Yaw Bearing for the Flexible Low-Solidity 100-m/s Rotor Design . . . . . . . . . . . . . . . . . . . . . . . . . . . . . . . . . . . . . . . . 63
Table 41. Maximum and Minimum Moments and Forces Acting on the LSS for the Baseline Rotor Design . 64
Table 42. Maximum and Minimum Moments and Forces Acting on the LSS for the Optimized 80-m/s Rotor Design . . . . . . . . . . . . . . . . . . . . . . . . . . . . . . . . . . . . . . . . . . . . . . . . . . . . . 64
Table 43. Maximum and Minimum Moments and Forces Acting on the LSS for the Optimized High-Solidity 100-m/s Rotor Design . . . . . . . . . . . . . . . . . . . . . . . . . . . . . . . . . . . . . . . . . . . . 65
Table 44. Maximum and Minimum Moments and Forces Acting on the LSS for the Optimized Low-Solidity 100-m/s Rotor Design . . . . . . . . . . . . . . . . . . . . . . . . . . . . . . . . . . . . . . . . . . . . 65
Table 45. Maximum and Minimum Moments and Forces Acting on the LSS for the Optimized Flexible Low-Solidity 100-m/s Rotor Design . . . . . . . . . . . . . . . . . . . . . . . . . . . . . . . . . . . . . 65
ix This report is available at no cost from the National Renewable
Energy Laboratory at www.nrel.gov/publications

1 Overall Background and Introduction
This project investigates the effect of maximum allowable tip-speed on wind turbine design and overall impacts on levelized cost-of-energy (LCOE) for a 500-megawatt (MW) land-based wind plant using different turbine designs. Land-based wind project development has historically constrained turbine designs to operate at blade-tip-velocities in the range of 75–80-meters per second (m/s). This constraint arises from blade-tip aero-acoustic noise generation. The turbine system sound power levels are usually dominated by blade-tip and other aeroacoustic noise when appropriate measures have been taken to mitigate sound emissions and audible tones from the tower head machinery within the nacelle and the power electronic converters often located within the tower base.
If the acoustic (tip-speed) barrier is removed (as is often assumed in offshore applications), it is possible to reduce drivetrain costs by reducing drivetrain torque capacity. Further aero-acoustic research may be required to overcome the barrier to increasing tip-velocities for land-based turbines while maintaining a similar sound power emission as the tip-speed-constrained designs. Aero-acoustic research work may include investigating both blade-tip noise reduction and the low-frequency acoustic “thump” as downwind blades pass through the “tower wind shadow.” Downwind rotors are expected to have an inherent system mass advantage as the blades are not as constrained by deflection as upwind rotors are. More flexible blades may reduce blade, drivetrain, and tower loads and may help reduce system mass and improve LCOE when the acoustic barriers are removed.
Trade-offs in system design between different objectives such as noise and system cost lend themselves to a multidisciplinary design, analysis and optimization (MDAO) approach. MDAO has a long history of use with aerospace and automotive technologies and is increasingly being applied to wind energy research and development (Dykes and Meadows, 2011). Several recent studies have explored multidisciplinary optimization of wind turbine subsystems focusing on the rotor (Bottasso et al., 2013; Fuglsang and Madsen, 1999; Ning et al., In press; Vasjaliya and Gangadharan, 2013), the drivetrain (Hall and Chen, 2013) or the support structures (Ma and Meng, 2014; Nicholson et al.). One study looked at optimized design of turbine rotors for reduced aero-acoustic noise (Lee et al., 2013) and conversely, another study has investigated optimized design of the rotor if noise constraints are relaxed (i.e., turbines placed very far offshore) (Jamieson, 2009). Additional work focused on optimizing the entire wind turbine using high fidelity models and dynamic simulations (Ashuri, 2012; Bottasso et al., 2012; Petrone et al., 2009). The work highlighted in this report builds off of the latter set of studies to investigate optimization of the entire turbine design using models of multiple levels of fidelity for the rotor, drivetrain, and tower. Also considered is the effect of relaxing noise constraints in turbine design by looking at optimized design of the turbine for increased maximum allowable tip-speed.
To better understand the potential of system cost-of-energy (COE) reductions caused by increased maximum allowable tip-velocities (enabled by some unspecified innovation in aero-acoustic noise mitigation technology or remote siting of wind turbines), this study uses a MDAO approach for the following five overall turbine configurations:
1. A baseline 5-MW reference turbine (Jonkman et al., Feb 2009) with maximum tip-speed at 80-m/s
2. An optimized version of the reference turbine with the same 80-m/s-tip-speed design constraint
3. An optimized design of the reference turbine at 100-m/s maximum tip-speed with a high-solidity rotor
4. An optimized design of the reference turbine at 100-m/s maximum tip-speed with a low-solidity rotor
5. An optimized design of the reference turbine at 100-m/s maximum tip-speed with a low-solidity rotor in which the tip-deflection constraint has been removed (as a proxy for a machine that would operate downwind).
In each of the design cases mentioned above, a sequential optimization was performed to design the turbine. The rotor was optimized first, then the hub and drivetrain components, and finally the tower. Each turbine design was then used in aero-acoustic noise and overall system cost analyses. Study results corroborate the trade-off that exists between turbine noise (or maximum allowable tip-speed) and the wind plant LCOE.
1 This report is available at no cost from the National Renewable
Energy Laboratory at www.nrel.gov/publications

2 Study Approach
This study compared the LCOE of three 500-MW land-based projects using turbine configurations derived from the National Renewable Energy Laboratory’s (NREL’s) 5-MW baseline turbine (Jonkman et al., Feb 2009). Although this turbine has never been fully designed or built, it is nonetheless useful as a reference design for studies like this. It is a conventional, three-bladed, upwind, variable-speed design that includes a controller for blade pitching and speed, as described by (Jonkman et al., Feb 2009) and (Jonkman, Nov 2007). Originally developed as an offshore turbine for exploring various floating platform designs, the turbine can be used in land-based studies as well. The first variant in this investigation utilizes the 5-MW NREL baseline design for the blades and tower. Up until now, there has never been a full design of the individual components of the hub and drivetrain systems of the baseline design. This study uses simple sizing models to estimate the mass of individual components in the hub and nacelle. The component masses for the turbine are used to determine the cost of the turbine in an overall COE model, and four optimized turbine variants are explored. The first optimization involves a redesign of the baseline turbine with the maximum tip-speed kept consistent with the original baseline reference model at 80-m/s. The NREL 5-MW turbine is heavier than real turbines of the same rating and class. It was not developed through a detailed optimization process, but adapted from a 6-MW design that did not include re-optimization of the different subsystems. Thus, to ensure a fair comparison to an optimized design at a higher tip-speed, the baseline turbine was optimized first. This step was followed by optimizing the same baseline turbine but at the 100-m/s maximum tip-speed for the three cases: a high-solidity/low tip-speed ratio rotor design, a low-solidity/high tip-speed ratio rotor design, and a low-solidity/high tip-speed ratio rotor design with the tip-deflection constraint removed to serve as a proxy for a downwind case. Each optimization involved a sequential process as illustrated in Figure 1.
Figure 1. Flow diagram of the analysis set-up used for the tip-speed study
2 This report is available at no cost from the National Renewable
Energy Laboratory at www.nrel.gov/publications

This process was used for each of the design variants and maps to the chapters of this report. Rotor aero-structural optimization was first performed using a set of lower fidelity models to create a Pareto front of designs on a two-dimensional grid with trade-offs for energy production versus blade weight (as a rough proxy for system cost). Out of this Pareto front, a single design was selected and a detailed structural optimization process using high-fidelity models was used to design the structural layup. The exception to this was the 100-m/s downwind/flexible case that used the same aerodynamic design from the aero-structural optimization for the upwind case and then followed with detailed structural optimization. The aero-structural optimization process is described in detail in Chapter 3. Once the blade design was finalized, the next step was to perform final loads analysis. During the process, various International Electrotechnical Commission (IEC) design load cases were assessed as specified in Chapter 4. The results of the loads analysis and overall rotor mass properties were then provided as input to the hub and nacelle design. We used optimization to size the gearbox and low-speed shaft and to select the main bearings and simple sizing models for the rest of the hub and drivetrain components (including: hub, pitch system, and bedplate). The rotor and nacelle mass properties as well as the results from the loads analyses are then provided as input for the tower optimization.
After the entire turbine was optimized, the resulting weights of individual components as well as overall turbine performance properties were used as input to a system cost model and turbine noise analysis. The overall results were compared to evaluate the trade-offs between system tip-speed and noise and overall system LCOE. The overall study input-output relationships between different analysis steps are provided in Table 1.
Table 1. Model Input-Output Relationships Necessary for Study
3 This report is available at no cost from the National Renewable
Energy Laboratory at www.nrel.gov/publications

3 Rotor Design Optimization
This chapter investigates rotor design optimization in which the maximum allowable tip-speed was increased from 80-m/s to 100-m/s. Because 80-m/s is a characteristic design tip-speed of many commercial turbines, switching to 100-m/s presents a significant increase in rotor speed (which, for a fixed generator speed, reduces the gearbox ratio and torque) and a corresponding increase in aero-acoustic noise.
We used a comprehensive set of wind turbine blade and rotor design tools to provide a detailed aero-structural optimization that included a variety of design constraints. Rotor designs for this work were created using a two-step process. First, we used an aero-structural optimization process was used to identify the blade geometry that yields the highest annual energy production (AEP) for the potentially lightest blade structural design. Second, we used the most promising simplified blade structural designs from the first optimization to initialize a detailed structural optimization in which spar-cap, panels, and trailing-edge reinforcements were sized so that the blades complied with design standards. The targeted outcomes of the analysis include aerodynamic-structural rotor designs that:
• Were as light as possible (assuming weight is closely related to cost),
• Met a consistent set of design criteria (which will be described), and
• Captured as much energy as possible.
More detailed discussion of the rotor designs in this report can be found in (Resor et al., 2014).
The following considerations were outside the scope of work for the current study. Inclusion of these considerations as design intermediate variables required more verification and validation of the integrated tools than was available at the time of the investigation. Each is an important area for future work.
• Rotor size. A complete investigation would include effects of rotor size. Tip-speed increases on commercial turbines are driven by the need for larger swept area while allowing only minimal changes to the rest of the turbine system. In these cases, potential increases in rotor cost associated with increased blade size are offset by increased energy capture by the larger swept rotor area.
• Turbine wind speed class. Turbine wind speed class was not changed for this work. The turbine class for these designs is IEC I-B. Investigations at lower turbine classes could exhibit different results.
• Blade materials. Comparison studies on the use of carbon fiber in blade design versus fully carbon fiber blades were not included in this work. All blade designs in this work were made of glass fiber, with foam core panels, and carbon fiber spar-caps.
• Innovative airfoils. Innovative airfoils (e.g., flatback airfoils) were not included as design options in this work. Table 2 summarizes the airfoils that are commonly used in modern commercial rotors.
• Aero-elastic tailoring. Aero-elastic tailoring (e.g., bend-twist coupling of the blade) was not considered. Aero-elastic tailoring is a rotor design feature that enables a larger swept area with minimal cost to the system in terms of increased rotor loads. The implementation of this type of tailoring requires more verification and validation than was completed with the framework of tools at the time of the investigation.
• Two-bladed rotor. There can be potentially large benefits to reducing rotor solidity by decreasing the number of blades.
• Controls. Rotor controls are an important element of mitigating turbine loads during dynamic loading scenarios. The investigation only included tuning of the Region 2 control constant. Region 2 control is primarily driven by torque constant which is meant to govern the rotor speed in a way that tracks the desired rotor performance. Implementation of tuned constants for Region 2.5 and Region 3 is more complicated and was not automated in the optimization framework used for this investigation.
4 This report is available at no cost from the National Renewable
Energy Laboratory at www.nrel.gov/publications

3.1 Rotor Design Overview
3.1.1 General Rotor Design Specifications
3.1.1.1 80-m/s Tip-Speed Optimized Design
The 5-MW NREL reference model was used as the first case for the full system cost analysis in this study. However, the model was not based on a design optimization process. To ensure a fair assessment of the cost impacts of different tip-velocities, we produced an optimized 80-m/s design starting from the 5-MW NREL reference model. The rotor was redesigned using the approach detailed in this section. The baseline rotor blade was redesigned to find a more optimal airfoil schedule, chord distribution, and twist distribution for a three-bladed rotor. The redesign included tightly coupled effects of blade aerodynamic geometry and structural design. The generator speed control constants were re-computed to align with the new rotor performance but the blade pitch controller remained unchanged from the 5-MW reference model. Both the fine pitch setting in Region 2 (operational region below rated power) as well as the Region 3 (operational region at rated power) time constants for the pitch controller were unchanged from the baseline values.
3.1.1.2 100-m/s Tip-Speed Optimized Designs for Low and High-Solidity
The second turbine variant used all of the 5-MW NREL reference model components with the exception of the rotor and modified gearbox ratio. The baseline rotor blade was redesigned to find the optimal airfoil schedule, chord distribution, and twist distribution for a tip-speed increase of 25% to 100-m/s for a three-bladed rotor. Generator speed control constants were re-computed to align with the new rotor performance but the blade pitch controller remained unchanged from the 80-m/s 5-MW reference model. Both the fine pitch setting in Region 2 as well as the Region 3 time constants for the pitch controller were unchanged from baseline values. The drivetrain input speed increased accordingly and the torque capacity was reduced by a proportionate amount. A significant cost saving for the drivetrain was anticipated for this configuration by virtue of the torque reduction.
In performing these designs, we pursued two different approaches. One optimal design, referred to as Design 100 high-solidity (or low tip-speed-ratio), was essentially the same as the optimized 80 m/s tip-speed design, referred to as Design 80, in terms of solidity and tip-speed-ratio. This design simply operated at higher rotor speeds. The other design, Design 100 low-solidity (or high tip-speed-ratio), exhibited a higher design tip-speed-ratio and lower-solidity. Both designs are included in this report because they demonstrated an important comparison of isolated component design versus component design in a more system-integrated fashion.
3.1.1.3 100-m/s Tip-Speed Optimized Design with a Flexible Blade
The last turbine configuration used the same aerodynamic design and control constants as the low-solidity 100-m/s design, but eliminated the blade deflection constraint during structural optimization. This configuration was a crude represenation of a downwind rotor or of an upwind rotor with very high pre-bend and/or coning; however, no tower shadow or upwind blade deflection was considered.
3.1.2 Baseline Rotor Blade Design
The starting point for rotor structural designs was the Sandia 61.5 meter blade concept (Resor, 2013). This concept represents the exact aerodynamic design of the NREL 5-MW reference turbine and includes a layup that was created to meet basic IEC design standards while matching the basic mass properties of the original NREL 5-MW reference turbine blades. The current work improved that rotor by seeking a new optimal aerodynamic and structural design.
5 This report is available at no cost from the National Renewable
Energy Laboratory at www.nrel.gov/publications

3.1.2.1 Airfoils
The original NREL 5-MW reference rotor design utilized a combination of Delft University (DU) and National Advisory Committee for Aeronautics (NACA) airfoils. For simplicity, the new aero-structural optimized rotors utilized the same airfoil family, including shapes and polar data; however, the optimized rotors allowed for the relocation of the airfoils to achieve new optimal thickness distributions as determined by the optimization tool. The reported NREL 5-MW airfoils and nominal airfoil thicknesses are shown in Table 2.
Table 2. Airfoil Names and Maximum Thickness Ratios
Airfoil Name t/c Ratio
DU99-W-405 40% DU99-W-350 35% DU97-W-300 30%
DU91-W2-250 25% DU93-W-210 21% NACA 64-618 18%
3.1.2.2 Aerodynamic Polar Data
Airfoil polar data from the official file archive for the NREL 5-MW reference turbine were used without modification. Lift- and drag-coefficient values were corrected for rotational stall delay using AirfoilPrep (Hansen, 2014). Drag-coefficient values were corrected using the Viterna method for 0- to 90-degree (deg) angle of attack using AirfoilPrep. Polar data were not re-computed for the change in Reynolds numbers associated with the increase in rotor speed in this investigation. The polar data were based on Re = 7 million. Computing polar data at additional Reynolds numbers was outside the scope of this work.
3.1.2.3 Materials
The material properties used in this blade model are the same as those used in both the Sandia 100- m blade design (Griffith and Ashwill, 2011) and in the Sandia 61.5- m structural concept (Resor, 2013). Those reports contain a detailed record of material choices and derivation of mechanical properties. The designs in this investigation were constructed of glass fiber with foam core panels and carbon fiber spar-caps similar to the 61.5- m structural concept.
3.1.2.4 Blade Root Hardware
Blade root hardware (i.e., carrots, t-bolts, and embedded studs) was not included in this simplified structural model. The root diameter and root buildup material and layer schedule were the same for all designs.
3.2 Aero-Structural Rotor Design
3.2.1 Method
We combined the following three publicly available tools from the wind energy community to perform the initial aero-structural optimization:
• HARP_Opt (Sale, 2013b) is an aero-structural rotor design optimization suite that is based on the use of genetic algorithms to find rotor designs exhibiting the most effective combinations of rotor loads, which translate to blade weight, and energy capture.
6 This report is available at no cost from the National Renewable
Energy Laboratory at www.nrel.gov/publications

• Co-Blade (Sale, 2013a) is a cross-section-based structural analysis tool that is ideally suited for integration with wind blade optimization.
• NuMAD (Berg et al., 2013) brings a framework for managing blade layup components during optimization as well as performing high-fidelity wind blade structural analyses.
Each tool has its strengths and weaknesses with respect to the overall optimization process used here. Strengths of each tool were combined for this work as summarized in Table 3.
Table 3. Strengths and Weaknesses of Individual Tools
Publicly available tool Strength Weakness
HARP_Opt v2.00.00 A multiobjective rotor optimization tool geared to maximize AEP while minimizing blade mass.
Structural representation of blades is limited to a shell of uniform wall thickness.
Co-Blade v1.23.00 A computationally efficient structural design and analysis tool based on two-dimensional cross-section analysis.
Buckling computations are fast, but uncertainty on the level of conservatism may be high.
NuMAD v2.1 A blade structure design tool that includes the ability to represent blade layup and architecture parametrically in an optimization framework and to use ANSYS for high-fidelity buckling analysis.
Requires time-intensive buckling computations in ANSYS.
3.2.1.1 Design Variables
In this work there were 20 total design variables available to the multiobjective genetic algorithm. Each of the variables were modified during optimization. The bounds of these design variables were set by the user. Narrow bounds enabled quicker convergence on solutions. Wide bounds enabled exploration of a larger design space.
• Five points shaped the entire chord distribution
• Five points shaped the entire twist distribution
• Eight airfoil locations; a variable represented the airfoil location for each of the following airfoil thicknesses: 18%, 21%, 21%, 25%, 25%, 30%, 35%, and 40%
• Two points shaped the distribution of materials in the spar-cap.
Details of how the chord, twist, and thickness distributions were defined are found in HARP_Opt documentation. Bezier functions were used to create smooth distributions of chord and twist with only five control points provided for each. Spanwise location of these chord and twist control points was fixed. The magnitude of the control points was set through the design variables. Thickness distribution was determined by placement of airfoils at spanwise locations given by design variables. Note that the user must decide beforehand what airfoil family to use. The current work used the airfoil family described in Table 2.
Bounds on the design variables were set by the user. The bounds on chord design variables used in this work were set so that it was not possible for the maximum chord to be greater than the maximum chord of the original baseline blade. Larger chord was not allowed during this investigation because of the potential effects on transportation logistics, which was outside the scope of the study.
7 This report is available at no cost from the National Renewable
Energy Laboratory at www.nrel.gov/publications

Reference (Resor et al., 2014) contains the complete listing of HARP_Opt input parameters used for each of the rotor optimizations.
3.2.1.2 Fitness Function
The genetic algorithm we used included a multiobjective fitness function F(x) to assess the quality of the blade design represented by the set of design variables.
F(x) = [F1(x),F2(x)] (3.1)
In general, the relative importance of the objectives is not known until the system’s best capabilities are determined and tradeoffs between the objectives are fully understood. Otherwise, one might find ways to combine the two objectives into one, thus eliminating the need for multiobjective optimization. In this case, one might use a metric such as blade mass per AEP, blade cost per AEP, or even system cost per AEP as a single objective for minimization. Each of these metrics drives towards low-wind-energy LCOE, though this work will show that system cost per AEP is probably the most useful. For a comparison of how the choice of objective function influences overall rotor design see (Ning et al., In press). There is value, however, in keeping objectives separate in a study to learn about the characteristics of all candidates on the Pareto front and to consider designs in the interior space near the Pareto front that may have desirable traits.
The two dimensions of the fitness function were as follows
F1(x) = AEP(x) ∗ (−1) (3.2)
F2(x) = M(x) ∗ P (3.3)
δ (x) , if δ (x) > δtarget δtarget P = (3.4)
1, otherwise
where x is the set of design variables, AEP is the product of the power curve and wind speed distribution, M is the blade mass, and P is a penalty. The quantity M ∗ P is referred to as the penalized blade mass. The penalty (P > 1) arises when the target blade deflection, δtarget , is exceeded by the computed deflection for the design δ (x). For example, if blade-tip-deflection is to be no greater than 3 meters and a 15,000-kg blade design exhibits a maximum deflection under a load of 3.3-m, then the penalty (P) is computed as 1.1 and the objective F2(x), penalized blade mass, is 16,500-kg. In this way, designs violating the tip-deflection criteria were not simply thrown away, but guided the optimizer toward a better solution where P is very close to one.
3.2.2 Aero-Structural Optimization Results
Approximately 30,000 designs were evaluated for each rotor (200 generations each with a population of 150). The results are summarized by Pareto fronts as shown in Figure 2. A Pareto front represents the collection of noninferior designs that are identified in the space of design variables. A noninferior design is one that cannot experience improvement in one design objective without degrading another design objective. The collection of noninferior designs is known as the Pareto front.
High AEP candidates exhibited high blade mass, which is indicative of the high loading required to capture higher AEP. Low AEP candidates exhibited lower blade mass, which is indicative of less loading.
8 This report is available at no cost from the National Renewable
Energy Laboratory at www.nrel.gov/publications

Manual manipulation of the design variable bounds related to chord distribution and definition of the tip-deflection target leads the optimization toward two different strategies for a high velocity rotor: 1) design with the same operating tip-speed ratio and higher rotor solidity as the 80-m/s rotor (high-solidity rotor) or, 2) design with higher operating tip-speed ratio and lower rotor solidity as the 80-m/s rotor (low-solidity rotor).
The best strategy could not be determined until the full system design and cost analysis was performed and final LCOE values were computed; both of the design strategies propagated forward to the subsequent stages of the system analysis. It is important to note that the rotor tip-speed-ratio was not a design variable in this process. Instead, the rotor tip-speed-ratio was a side effect of the overall optimization using the design variables described above.
Crude assumptions regarding system cost per kilowatt rating and blade cost per kilogram were used to convert blade mass to approximate system cost. Approximate system cost Paretos are shown in Figure 3. Candidates for lowest cost-of-energy can be selected from the Pareto front using a smallest slope tangent line passing from the origin to candidates on the Pareto front. The approach shows graphically that the higher AEP candidates were preferred to the lowest cost design candidates.
2.44 2.46 2.48 2.5 2.52 2.54 2.56
x 107
1.4
1.45
1.5
1.55
1.6
1.65
1.7
1.75
1.8x 10
4
AEP (kW*hr/yr)
Bla
de m
ass (
kg)
80 m/s
2.44 2.46 2.48 2.5 2.52 2.54 2.56
x 107
1.4
1.45
1.5
1.55
1.6
1.65
1.7
1.75
1.8x 10
4
AEP (kW*hr/yr)
Bla
de m
ass (
kg)
100 m/s low TSR
2.44 2.46 2.48 2.5 2.52 2.54 2.56
x 107
1.4
1.45
1.5
1.55
1.6
1.65
1.7
1.75
1.8x 10
4
AEP (kW*hr/yr)
Bla
de m
ass (
kg)
100 m/s high TSR
Figure 2. Pareto fronts showing the sets of noninferior designs. Points shown only for designs that meet tip-deflection requirement, P = 1
2.44 2.46 2.48 2.5 2.52 2.54 2.56
x 107
5.95
6
6.05
6.1
6.15x 10
6
AEP (kW*hr/yr)
Syste
m c
ost (a
ppro
x.$
)
80 m/s
2.44 2.46 2.48 2.5 2.52 2.54 2.56
x 107
5.95
6
6.05
6.1
6.15x 10
6
AEP (kW*hr/yr)
Syste
m c
ost (a
ppro
x.$
)
100 m/s low TSR
2.44 2.46 2.48 2.5 2.52 2.54 2.56
x 107
5.95
6
6.05
6.1
6.15x 10
6
AEP (kW*hr/yr)
Syste
m c
ost (a
ppro
x.$
)
100 m/s high TSR
Figure 3. Pareto fronts expressed in terms of approximate system cost
3.2.3 Discussion of Aero-Structural Design Results
Table 4 summarizes important rotor performance parameters for selected designs. Additional detailed plots and discussion of aerodynamic performance parameters are found in the detailed rotor design report associated with this work (Resor et al., 2014).
9 This report is available at no cost from the National Renewable
Energy Laboratory at www.nrel.gov/publications

3.2.3.1 Chord and Twist Distributions
During the study, all Pareto optimal designs tended toward a lower-solidity than the original reference turbine. This tendency is expected because the original NREL 5-MW reference blade was a clipped-tip version of a 63- m blade. The solidity of the original reference 5-MW rotor was probably higher than what is optimal; lower-solidity values for all designs in this study was not surprising.
Figure 4 shows chord and twist distributions of single blade designs selected from the Pareto fronts that are based on the potential for lowest system cost per energy capture as shown in Figure 3. The similarity between the 80m/s optimized design and the 100-m/s-high-solidity design is evident. The data in the distributions shown here represent the points that defined the blade geometry in NuMAD.
3.2.3.2 Thickness Distributions
Figures 5 and 6 show the airfoil thickness-to-chord (t/c) ratio and the airfoil absolute thickness of selected designs. The results do not show large modifications to the airfoil t/c distribution; however, the decrease in blade thickness for the low-solidity, high-tip-speed-ratio design is quite noticeable.
0 20 40 60 800.5
1
1.5
2
2.5
3
3.5
4
4.5
Blade span (m)
Chord
(m
)
0 20 40 60 80−2
0
2
4
6
8
10
12
Blade span (m)
Bla
de tw
ist (d
eg)
80 m/s optimized
100 m/s high solidity
100 m/s low solidity
Figure 4. Chord and twist distributions of selected blade designs
10 This report is available at no cost from the National Renewable
Energy Laboratory at www.nrel.gov/publications

0 10 20 30 40 50 60 70
0.180.21
0.25
0.3
0.35
0.4
1
Blade span (m)
Airfo
il t/c r
atio
SNL 61.5 m blade reference
80 m/s optimized
100 m/s high solidity
100 m/s low solidity
Figure 5. Airfoil t/c versus blade span. Ordinate scale is linear and ordinate labels correspond to thicknesses of specific airfoils.
0 10 20 30 40 50 60 700
0.5
1
1.5
2
2.5
3
3.5
Blade span (m)
Bla
de m
ax thic
kness (
m)
SNL 61.5 m blade reference
80 m/s optimized
100 m/s high solidity
100 m/s low solidity
Figure 6. Airfoil thickness versus blade span
11 This report is available at no cost from the National Renewable
Energy Laboratory at www.nrel.gov/publications

Table 4. Summary of Rotor Performance Parameters
tip-speed-ratio Cp,max Rotor CT Rotor Solidity (%)
Baseline NREL 5-MW Reference Design (Jonkman et al., Feb 2009) 7.55 0.482 - 5.16 80-m/s Optimized Design 8.9 0.499 0.743 4.53
100-m/s High-Solidity Design 9.1 0.493 0.720 4.60 100-m/s Low-Solidity Design 9.9 0.503 0.761 3.76
3.3 Structural Optimization
Only a preliminary representation of the blade layup was used in the aero-structural optimizations. We estimated foam thicknesses and thicknesses of reinforcements. The spar-cap was crudely defined. After aero-structural optimization, the selected designs proceeded to detailed structural optimization. The goals of the structural optimization process include:
• Panel sizing. Determine the thickness of aft panels, especially near the maximum chord where panel span is the greatest. The thickness of these panels determines their resistance to buckling.
• Spar-cap sizing. Determine both the width (constant width) and spanwise layer schedule for the spar-cap. The spar-cap design affects the overall blade flapwise stiffness and flapwise frequency.
• Trailing-edge reinforcement sizing. The amount of trailing-edge reinforcing material is used to affect the edge stiffness and blade-frequency.
The layup schedule for the root buildup remained constant throughout the study. Optimization of the root buildup is worthwhile but was reserved for future work because all of the design cases interface with the same hub hardware.
3.3.1 Structural Optimization Method
A simple genetic algorithm was used to manage the structural optimization process. The optimization goal was to minimize the penalized blade mass, Fstruc.
Fstruc(x) = M(x) ∗ Pδ ∗ Pbuckle ∗ Pf atigue ∗ Pf lap ∗ Pedge/ f lap (3.5)
Penalties P are applied to the blade mass M for exceeding:
• Tip-deflection criteria, Pδ
• Buckling criteria, Pbuckle
• 20-year fatigue damage, Pf atigue
• Flap-frequency criteria, Pf lap
• Edge-flap-frequency spacing criteria, Pedge/ f lap
δ (x) , if δ (x) > δtarget δtarget Pδ = (3.6)1, otherwise
Fcr,target if Fcr(x) < Fcr,target Fcr(x) ,
Pbuckle = (3.7)1, otherwise
12 This report is available at no cost from the National Renewable
Energy Laboratory at www.nrel.gov/publications

D20(x), if D20(x) > 1Pf atigue = (3.8)
1, otherwise
f f lap,target , if f f lap(x) < f f lap,target Pf lap = f f lap(x) (3.9)1, otherwise
redge/ f lap,target if redge/ f lap(x) < redge/ f lap,target redge/ f lap(x) ,
=Pedge/ f lap (3.10)1, otherwise
Where Fcr is the computed critical buckling load, D20 is the computed 20-year fatigue damage, f f lap is the blade flapwise first natural frequency, redge/ f lap is the ratio of blade edgewise first natural frequency to flapwise first natural frequency.
δtarget is the minimum allowable blade-tip-deflection to meet tower clearance requirements, including safety factors. Fcr,target is the minimum allowable buckling load, including safety factors. f f lap,target is set 10% above the rotor 3P frequency. redge/ f lap,target is set at 1.30. Criteria for f f lap,target and redge/ f lap,target were specified in IEC standards, but are often common practice in blade design; however, these criteria may be relaxed for modern blade design as blades become lighter and flexible. These decisions require high confidence in aero-structural dynamic interactions of the system.
Design variables, x, in the optimization included:
• Panel foam thicknesses in the aft panels (2 variables)
• Spar-cap thicknesses at the 20% and the 50% span (2 variables)
• Spar-cap width (1 variable)
• Maximum thickness of trailing-edge reinforcement (1 variable).
FAST and AeroDyn were used to perform aeroelastic simulations to evaluate the above criteria with respect to IEC design load cases. FAST was used to compute δ (x) as maximum blade-tip out-of-plane deflection (i.e., the maximum of FAST channels OoPDeflN). This approach was conservative because it included tip-deflections at azimuth angles that were far from the tower.
Table 5 summarizes the design load cases that were considered during rotor design.
13 This report is available at no cost from the National Renewable
Energy Laboratory at www.nrel.gov/publications

Table 5. IEC Design Load Cases Used to Drive Rotor Design
DLC 1.2 (NTM) Fatigue damage evaluation during normal power production in normal turbulence
DLC 1.3 (ETM) Ultimate loads evaluation during normal power production in extreme turbulence
DLC 1.4 (ECD) Ultimate loads evaluation during normal power production with an extreme coherence gust with change in wind direction
DLC 1.5 (EWS) Ultimate loads evaluation during normal power production with the presence of extreme wind shear
DLC 6.1 (EWM50) Ultimate loads evaluation while in a parked configuration during a 50-year extreme steady wind event
DLC 6.3 (EWM01) Ultimate loads evaluation while in a parked configuration during a 1-year extreme steady wind event with extreme yaw misalignment
More detail on the above analyses can be found in the full rotor design report (Resor et al., 2014).
3.3.1.1 Flexible Designs
Additional structural designs quantify the effects of removing the tip-deflection constraint from the design process on the 100-m/s tip-speed blade. These blades are referred to here as “flexible” blades. During the study the flexible blades crudely represented the design of an upwind rotor with unconventionally high upwind prebend or a downwind rotor. Cyclic once-per-revolution, or 1-period (1P), loads caused by tower shadow were not considered in this work.
Tip-deflection was the driver for spar-cap sizing. With the tip-deflection constraint removed, the layup design was driven by a combination of fatigue criteria, structural frequency criteria, and panel-buckling criteria. With a lighter spar-cap, the blade became lighter and cheaper.
3.3.2 Structural Optimization Results
Figure 7 contains a summary of the layup design results for all designs. More detailed information is provided in (Resor et al., 2014). Notable observations regarding the layup designs include the following:
• The root buildup material was quite heavy. The weight of the root material was represented by green bars, which also included the weight of skin material. Optimization of root buildup material was not a topic in this work.
• The weight of gelcoat was small, almost negligible, and was barely visible on this chart next to the other components.
• The spar-cap weight for the 100-m/s-low-solidity design was nearly twice that of any other blade design.
• The amount of core material needed in the low-solidity designs was less than high-solidity designs. Buckling criteria was met with less material as the unsupported panel length decreased.
14 This report is available at no cost from the National Renewable
Energy Laboratory at www.nrel.gov/publications

• The amount of shear web material needed in the low-solidity designs was less than the high-solidity designs.The difference in solidity translates to thinner airfoils and shorter shear webs.
• The amount of trailing-edge reinforcement material used in the 100-m/s-high-solidity design appeared high inrelation to the amount of spar-cap material that was used in the same design. In fact, results showed that thespacing of flap and edge frequency for this design was high, implying too much trailing-edge reinforcement.The trailing-edge reinforcement material contributed to the aft panel stiffness and therefore added to bucklingrequirements.
Figure 7. Weight of material per layup component
3.4 Overall Rotor Summary and Discussion
This section discusses the outcomes of baseline rotor optimization, placement of airfoils to balance structural and aerodynamic efficiency, ideal rotor design for high-speed rotors, and structural limitations that prevent the achievement of aerodynamically optimal high-speed rotors. Table 6 summarizes the outcomes for each rotor design.
3.4.1 80-m/s Optimized Design Results
The optimized 61.5- m blades for the 5-MW rotor were different in several ways from the original 5-MW reference model baseline: the solidity was lower, the design tip-speed-ratio for optimal Cp was higher, and the blade mass was lower. The optimized design was stiffness-driven in that the requirement for maximum out-of-plane blade deflection was active, while the requirements for fatigue and blade-flap-frequency were not active. The blade weight was also affected by the sizing of sandwich structures in the aft panels to meet buckling requirements.
3.4.2 Airfoil Placement
The optimization allowed modification of the blade thickness distribution to explore the design space. Utilizingthe thickest airfoils outboard on the blade is advantageous because it maximizes structural efficiency. Initial expectations were that the low-solidity rotor design would take advantage of the structural efficiency by locating thick airfoils
15 This report is available at no cost from the National Renewable
Energy Laboratory at www.nrel.gov/publications

further outboard; however, use of thicker airfoils outboard incurred the cost of increased blade drag, decreased blade lift-to-drag ratio, and decreased rotor AEP. Additionally, results for all designs showed that use of the chosen family of thick airfoils outboard was not a viable strategy for high-speed rotors. In fact, if higher performing, thicker airfoils were developed, they would not only improve the structural efficiency of high-speed rotors but also the lower-speed rotors. High-performing thick airfoils would enable more effective rotor systems across the entire design space.
3.4.3 Ideal High-Speed Rigid Rotor Design
Explanation of an ideal scenario for aerodynamic design of a high-tip-speed rotor is needed to frame the results of this investigation. From a purely aerodynamic perspective, an increase in tip-speed from the baseline 80-m/s to 100-m/s would translate to an increase in rotor design tip-speed-ratio of 100/80, or 25%. Using this straightforward approach, the aerodynamic rotor loads on the rest of the turbine system remain unchanged, with the exception of the 20% decrease in rotor torque. In this scenario, the design tip-speed-ratio increases; it increases from a value of 8.9 for the baseline Design 80 to 8.9 ∗ 1.25 = 11.125. The airfoil design lift-coefficients remain unchanged; their optimal values are unchanged. Therefore, the rotor solidity decreases—from 4.53% for the baseline design 80-m/s to 4.53/1.25 = 3.624%.
The rotor performance, in terms of Regions 2, 2.5, and 3, for the nominal rotor and ideal high-speed rotor are shown in Figure 8 as solid and dotted lines, respectively. Region 2 is blue; Region 2.5 is green; Region 3 is red. The curves for these two designs are identical, with the exception of tip-speed-ratio, tip-speed, and rotor torque. Curves in Figure 8 are generated using simple relationships and are meant only to illustrate the magnitude of quasi-static loads and performance characteristics; the curves do not represent dynamic aero-servo-elastic events.
A third set of curves, dashed, are also shown in Figure 8. The dashed curves represent the characteristics of a rotor with tip-speed-ratio equal to the baseline while operating to the higher rotor speed. The rotor power plot shows that this rotor exhibits a higher AEP with the cost of the increased thrust load. Because it operates at the lower tip-speedratio, this rotor reaches rated torque almost simultaneously with reaching maximum rotor speed. Energy capture is maximized because the extent of Region 2.5 is minimized. There is a careful balance to maintain; Region 2.5 offers important load-limiting capabilities for the peak rotor loads and thrust loads increase accordingly.
The optimal high-speed designs in this investigation did not represent the ideals of the high-speed rotor because the design problem even within just the rotor subsystem is multidisciplinary, involving both aerodynamics and structures. Structures are adversely affected by the low-solidity of the ideal high-speed rotor design. As the ideal rotor solidity and blade thickness decrease with increased rotor speed, the blades’ spar-caps become disproportionately heavy because they are stiffness-driven. Even though the decrease in solidity also results in lighter weight blade skins, the overall blade weight increases because of the larger spar-caps.
Blade thickness decreases as the rotor solidity decreases for a given number of blades. One solution is to pursue a rotor with fewer blades, thus increasing the thickness and structural efficiency of the individual blades; however, the number of blades was held constant in this study. Another solution is to increase structural efficiency by utilizing thick airfoils at outboard locations. However, this was not seen as a viable option, as described above in Section 3.4.2. A third solution is to utilize an airfoil family that exhibits lower design lift-coefficients. However, the airfoil lift-to-drag ratio along with the rotor performance coefficient typically suffer as lift-coefficients decrease. Still, an approximation of the third approach was a path taken by the aero-structural optimization and is discussed in the detailed rotor design report by (Resor et al., 2014).
3.4.4 100-m/s Design Results
The two optimal high-speed designs documented in this report represent two approaches. One maps directly to the dashed curves of Figure 8 and the other maps to an intermediate between dashed curves and dotted curves in Figure 8.
16 This report is available at no cost from the National Renewable
Energy Laboratory at www.nrel.gov/publications

0 10 20 300
2
4
6x 10
6
Ro
tor
po
we
r (W
)
Wind speed (m/s)0 10 20 30
0
50
100
Tip
ve
locity (
m/s
)
Wind speed (m/s)
0 10 20 300
2
4
6x 10
4
Ge
ne
rato
r T
orq
ue
(N
m)
Wind speed (m/s)0 10 20 30
0
2
4x 10
6
Ro
tor
torq
ue
(N
m)
Wind speed (m/s)
0 10 20 300
5
10
15
TS
R (
−)
Wind speed (m/s)0 10 20 30
0
0.5
1
CP (
−)
Wind speed (m/s)
0 10 20 300
2
4
6x 10
5
Ro
tor
thru
st
(N)
Wind speed (m/s)400 600 800 1000 12000
2
4
6x 10
4
Generator speed (RPM)
Ge
ne
rato
r to
rqu
e (
Nm
)
Figure 8. Illustration of turbine control regions showing three different rotor design approaches: solid–low-speed, high-solidity, low tip-speed-ratio; dotted–high-speed, low-
solidity, high tip-speed-ratio; dashed–high-speed, high-solidity, low tip-speed-ratio
• Design 100 low tip-speed-ratio. A design roughly equivalent to the dashed curves in Figure 8. Its solidity was roughly equivalent to the solidity of Design 80; however, its thrust loads were highest. Still, it was the lightest weight of the high-speed designs because its high-solidity allowed for a thick blade and lighter weight spar-caps. Finally, because its thrust loads were the highest, it had the most adverse effect on the sizing of the rest of the system.
• Design 100 high tip-speed-ratio. A design anticipated to match the dotted curves in Figure 8. However, it ultimately lies in the intermediate space between the dashed curves and dotted curves because it is subject to the compromises discussed in Section 3.4.3. Its solidity was the lowest, but not as low as was anticipated for
17 This report is available at no cost from the National Renewable
Energy Laboratory at www.nrel.gov/publications

the ideal aerodynamic design. Its thrust loads were increased above the baseline, but not as high as the high-speed high-solidity design. It was the heaviest of the high-speed designs because its lower-solidity and lower blade thickness required much heavier spar-caps to meet the stiffness requirements. Because its thrust loads were only moderately higher than Design 80, it had a much smaller adverse effect on the sizing of the rest of the system.
Benefits for the overall turbine in terms of decreased torque were experienced with both high-speed designs. Full system sizing and cost analysis are provided later in this report and help quantify the costs and benefits of each full system design.
3.4.5 Flexible Design
The blade deflection requirement was removed from the layup design process for the low-solidity design. The process led to a design driven by the flapwise frequency requirement, closely followed by spar-cap fatigue. The blade weight of this design was the lowest of all the designs. Blade-tip-deflection under operational load for this rotor was quite high; simulations estimated regular deflections in excess of 8 meters at rated wind speed. In future work, special considerations should be included when computing the AEP of highly flexible rotors because of the loss of swept area at rated wind speed.
3.4.6 Limitations of Current Approach
This work has uncovered several ways in which aerodynamics and structural models can be combined to enable more efficient and realistic rotor design. Additional discussion is provided in the detailed rotor design report associated with this work (Resor et al., 2014). However, we observed the following high-level limitations of the current approach.
Computation of the appropriate blade-tip-deflection target, δtarget , is rather crude in the current implementation of the models used in this analysis. A computationally efficient approach is needed that allows for better estimation of dynamic aeroelastic loads and structural responses directly in the loop with the aerodynamic optimization.
Translation of blade materials into blade materials cost through the use of an appropriate cost model would be advantageous throughout the design process. Instead of seeking Pareto optimal designs in terms of mass and AEP (Figure 2), the process should seek Pareto optimal designs in terms of cost and AEP (Figure 3). It is possible for the lightest blade to be the more expensive blade to produce, simply in terms of materials. This is especially true when high price materials such as carbon fiber are involved.
A slightly higher-fidelity structural model should be used during the aero-structural design process. This is a task that is currently possible, but implementing additional design variables and analysis checks during the optimization loop will increase optimization time. Furthermore, there are significant discrepancies in estimated blade mass when examining the masses provided in Table 6 and in Figure 2. The largest contributor to the discrepancy is the failure to adequately include the edge-stiffening material in the aero-structural optimization stage of the work. Requirements governing edge stiffness, either frequency or fatigue, must be included from the beginning when changes in blade solidity are an important element of the design choices.
A secondary effect on blade mass is the sizing of the core material in the blade panels. Computationally fast and accurate buckling models must be implemented to include these effects in the aero-structural optimization loop. Additionally, this optimization loop does not include analysis of parked loads on the blade planform during extreme winds. These loads typically drive the sizing of the core in blade panels. In general, including parked storm loads in the loads analysis may encourage blades with lower-solidity.
More careful definition of structural and aerodynamic design variables is needed in future tools. For example, the rotor tip-speed-ratio is not a design variable in this work, but an outcome of the various combinations of chord and twist with design variables described earlier.
18 This report is available at no cost from the National Renewable
Energy Laboratory at www.nrel.gov/publications

3.4.6.1 Controls
The influence of controls design on the study results needs to be mentioned. Controls were intentionally left outside the scope of the current study to focus the work package on a preliminary study. The exception to this limitation was the adjustments to controls parameters related to variable-speed control in Region 2 to enable tracking of maximum rotor Cp. It is clear now that investigation into the controls schemes used for these turbine designs is needed.
The rotor designs in this work are largely driven by blade-tip-deflection. The design load cases that typically produce the highest blade-tip-deflections are the extreme coherent gust with direction change (IEC DLC 1.4, ECD) and operation in extreme turbulence (IEC DLC 1.3, ETM). These design load cases are dynamic events in which controller design is actually quite important. Furthermore, the driving loads and responses are experienced in the vicinity of rated wind speed, where speed and pitch control are active simultaneously.
Additionally, more advanced aspects of setting Region 2 and 2.5 controls should be examined. The rotor operates at maximum efficiency only in Region 2. Depending on rated wind speed, rated generator torque, and desired tip-speed ratio, the range of Region 2 wind speeds can be quite small. It would be beneficial to have the ability to make changes in controller parameters that enable lower loads in exchange for decreased rotor Cp.
19 This report is available at no cost from the National Renewable
Energy Laboratory at www.nrel.gov/publications

Table 6. Summary of Rotor Designs
Design 80 Design 100 Design 100 Design 100 High tip-speed- Low tip-speed-ratio High tip-speedratio ratio
flexible
IEC Turbine Class I-B I-B I-B I-B
Blade Length (m) 61.5 61.5 61.5 61.5
Estimated max 933 1,059 1,148 1,007 characteristic rotor DLC1.3, ETM DLC1.3, ETM DLC1.3, ETM DLC1.3, ETM thrust (kN) and DLC
Spar-cap width (mm) Max Trailing-Edge (TE) panel thickness (mm) Max spar-cap thickness (#) Max TE-reinf thickness (#)
575 587 496 553
68 30 57 26
90 196 120 124
47 122 58 80
Max characteristic 7.05 7.02 6.99 11.19 OoPDefl (m) and DLC
DLC1.4, ECD DLC1.4, ECD DLC1.4, ECD DLC1.4, ECD
<7.07 req’d
Min blade fatigue life (yrs) >20 req’d and location
17,788 Spar-cap
111,682 TE reinf.
4,371 Spar-cap
2141 Spar-cap
Buckle >1.62 req’d driving DLC
1.64 50yrEWM 1.67 50yrEWM 2.50 ETM
1.62 50yrEWM 1.67 50yrEWM
Blade mass (kg, ANSYS computed)
16,097 17,590 16,423 14,607
Span-wise Center of Gravity (CG) location (m)
17.762 20.088 18.712 17.404
1st flap freq. (Hz) >0.67 req’d for Design 80 >0.83 req’d for Design 100
0.95 0.86 0.95 0.89
1st edge freq. (Hz) 1.24 1.12 1.24 1.21
Edge/flap ratio >1.30 req’d
1.3 1.3 1.3 1.36
20 This report is available at no cost from the National Renewable
Energy Laboratory at www.nrel.gov/publications

4 Turbine Loads Analysis
In addition to the loads analysis performed during the rotor design described in Chapter 3, a comprehensive loads analysis using FAST1 was performed on each of the designs. This analysis was used to provide a final check on the rotor design loads and to run additional load cases used in the hub, nacelle, and tower design processes. The DLC’s assessed required either turbulent wind conditions in 10-minute or 1-hour simulations, or nonturbulent wind conditions with higher wind speeds but shorter simulations. The latter were used in the rotor optimization process where iterative analysis favored computationally efficient loads analysis. Here, the computationally more expensive turbulent winds were used as they have a greater potential to excite modes of the blades and tower that could drive the design of the tower and gearbox.
4.1 Aero-elastic Modeling with FAST
For the modeling work presented in this paper, we performed loads analysis on the five different rotor design cases. For all five rotor designs, the tower and nacelle properties used in the loads analysis were identical. The tower and nacelle properties were refined after the loads analysis was complete. Ideally, a second iteration of the loads analysis should be performed with the new nacelle, gearbox, and tower masses to refine the overall design further.
To change the tip-speed from 80-m/s in the first two turbine rotor designs to the 100-m/s tip-speed in the latter three rotor designs, it was necessary to change several constants in the controller algorithm to match the generator power curves across all designs. For the baseline NREL 5-MW design with the original blades, the controller distributed with FAST was used without any modification. Controller parameters were modified for the optimized blade designs as summarized in Table 7. The gearbox ratio was also changed from 97.0 in the 80-m/s designs to 77.4081 for the 100-m/s designs to keep the generator operational speed the same.
Table 7. Differences between NREL 5-MW Controller Constants for the 80-m/s and 100-m/s Configurations
FAST Variable 80-m/s 80-m/s 100-m/s 100-m/s 100-m/s Parameter Name Baseline Optimized High-Solidity Low-Solidity Flexible
Pitch control time-step (seconds) PC_DT 0.00125 0.00010 0.00010 0.00010 0.00010
Speed control time-step (seconds) VS_DT 0.00125 0.00010 0.00010 0.00010 0.00010
Region 2 torque constant (N-m/(rad/s)2) VS_Rgn2K 2.332287 1.5670207 2.9369767 2.3396230 2.3396230
Note: The values for the 80-m/s baseline configuration exactly match those listed in Appendix C of the NREL5-MW definition document by (Jonkman et al., Feb 2009). Values that changed
because of rounding or remain unchanged from the baseline configuration are not shown.
In addition to the modifications listed earlier, it was necessary to increase the damping coefficients of both the blades and tower in all designs to avoid numerical instability. This instability is thought to arise from the way dynamic stall of the blades is computed using FAST and results in a coupling of tower modes to blade modes, which is most likely a numerical artifact that would not be present in a real turbine. This effect is discussed in detail in (Bir and Jonkman, 2007) and (Jonkman, Nov 2007). The instability was most pronounced in parked conditions with yaw errors of ±8, ±20, and ±40 degrees and would lead to a four-fold increase in blade root bending moments in the worst case. For the baseline blade design, a tower damping coefficient of 5% was sufficient to avoid instability within
1We performed a complete loads analysis using a slightly modified FAST v7.02.00d-bjj with the NWTC Library v1.07.02a-mlb, AeroDyn v13.00.02a-bjj, and InflowWind v1.02.00c-bjj. This version of FAST was modified to allow for forces from 33 tower and 17 blade locations to be output. Because the controller does not provide yaw control, the yaw degree of freedom was fixed for all simulations.
21 This report is available at no cost from the National Renewable
Energy Laboratory at www.nrel.gov/publications

the simulations. The tower damping was reduced in the optimized designs to 2%. The values for the blade and tower damping coefficients in all three rotor designs is summarized in Table 8.
Table 8. Damping Coefficients for the Blades and Tower.
Rotor Design Blade Tower
Baseline 80-m/s 5.0% 5.0% Optimized 80-m/s 5.0% 2.0% Optimized 100-m/s High-Solidity 5.0% 2.0% Optimized 100-m/s Low-Solidity 5.0% 2.0% Optimized 100-m/s Flexible 5.0% 2.0%
The turbulent wind conditions used during the simulations were created using TurbSim following the guidelines given in the IEC 61400-1 standard from the (International Electrotechnical Commission (IEC), Aug 2005) for a class 1B turbine. These wind fields were created as 27 x 27 grids spanning 145-m x 145-m, which is sufficiently large enough so that all blade elements would be within the wind field regardless of yaw angle or tower deflection. A class B Kaimal turbulence spectrum, as described in the third edition of the IEC 61400-1, was used. A time step of 0.05 seconds and a up-flow angle of 8-degrees was used for all turbulent winds.
The extreme wind shear (EWS) and extreme operating gust (EOG) wind conditions were modeled using nonturbulent winds with a shear exponent of 0.2 and an up-flow angle of 8-degrees. These conditions match the IEC 61400-1 description for such events. The same set of wind files was used in the evaluation of all three rotor designs.
4.1.1 Design Load Cases
Table 9 summarizes the load cases that were performed as part of the analysis of each rotor design. There are a few design load cases that are typically performed in a loads analysis but were omitted from this study DLC 1.4 involves an extreme coherent gust with a direction change and was initially omitted since the controller used by the NREL 5MW turbine does not have yaw control, but was added in later rotor design evaluations. The other notable omission is DLC 6.3 which is a subset of yaw errors explored by DLC 6.2, but with a slightly larger safety factor and a 1-year return period rather than 50-year return period. This case was ignored since DLC 6.2 covers more extreme yaw errors with a higher wind-speed. The following summarizes in detail the various design load cases in detail.
4.1.1.1 DLC 1.1
DLC 1.1 examines the operation of a wind turbine during normal operating conditions with 10-minute simulations. A range of wind speeds are considered, from cut-in to cut-out. For this analysis, 11 different wind speeds were simulated from 3–25-m/s in 2- m/s steps using the midpoint of each bin. Six different normal turbulent winds were used at each wind speed with different starting seeds. For each of the load cases, a safety factor was applied to the resulting loads as shown in Table 9. For DLC 1.1, a value of 1.35 is prescribed in the IEC standard with extrapolation. Rather than extrapolate the results, a larger partial safety factor of 1.5 was chosen.
4.1.1.2 DLC 1.2
DLC 1.2 is exactly the same as DLC 1.1, but analyzed for fatigue The results from DLC 1.1 were analyzed using MLife (Hayman, 2012b).
22 This report is available at no cost from the National Renewable
Energy Laboratory at www.nrel.gov/publications

Table 9. Summary of IEC Design Load Cases Performed
gf
Sim length
(s)
Wind
Cond. V (m/s) Shear Exp. Yaw Error
Partial Safety
Factor
1.1 600 NTM4, 6, 8, 10, 12,
14, 16, 18, 20, 22, 240.2 0 1.5 Safety factor of 1.5 is used instead of extrapolation.
1.2 600 NTM4, 6, 8, 10, 12,
14, 16, 18, 20, 22, 240.2 0 1.0 Fatigue case.
1.3 600 1ETM4, 6, 8, 10, 12,
14, 16, 18, 20, 22, 240.2 0 1.35
1.4 60 ECDVhub = Vr +/-2 m/s
and Vr0.2 0 1.35
At rated, 2 m/s below, and 2 m/s above; both a
positive and negative direction change for the gust.
1.5 60 EWS4, 6, 8, 10, 12,
14, 16, 18, 20, 22, 240.2 0 1.35 11 wind speeds, vertical/horizontal gust, gust +/-.
2.3 60 EOGVhub = Vr +/-2 m/s
and Vout0.2 0 1.1
6.1 3600EWM
50 yr.
recurr.
47.50 0.11 352, 0, 8 1.35 All blades feathered.
6.2 3600EWM
50 yr.
reccur.
47.50 0.110-360 (20
deg steps)1.1
Loss of electrical network - Idling; all blades
feathered; loss of yaw control; yaw errors up to +/-
180°
6.4 600 NTM
4, 6, 8, 10, 12, 14,
16, 18, 20, 22, 24, 26,
28, 30, 32, 34
0.2 0 1.0 Fatigue case.
7.1 3600EWM
1 yr.
recurr.
38.00 0.11 352, 0, 8 1.1Idling; blade 1 stuck at highest static-rotor torque
pitch angle , blades 2 and 3 feathered
Comments
Wind Info
DLC
Note: The partial safety factor listed was applied during post-processing See descriptions below for full explanations of the conditions for each load case.
4.1.1.3 DLC 1.3
This design load case performs the same simulations as DLC 1.1, except that it uses the extreme turbulent model winds (ETM) instead.
4.1.1.4 DLC 1.4
This design load case evaluates the effects of an extreme coherent gust with a direction change event (ECD). A total of six simulations were performed including three wind-speeds: at rated, 2-m/s below rated, and 2-m/s above rated. For each wind-speed, a positive and negative direction change was evaluated (International Electrotechnical Commission (IEC), Aug 2005). Because deterministic winds were used, the simulations were only run for 60seconds after the startup transients damped out.
DLC 1.4 was performed only on the optimized 80-m/s and low-solidity 100-m/s rotor designs. This DLC was not performed on either the baseline 80-m/s design or the high-solidity 100-m/s design. Because this DLC is only a
23 This report is available at no cost from the National Renewable
Energy Laboratory at www.nrel.gov/publications

design driver for the blade deflections (covered under the blade design process) and not for the tower or drivetrain loads, it was not necessary to re-evaluate the design load case iterations with it.
4.1.1.5 DLC 1.5
This design load case examines the operation of a wind turbine during a transient EWS event. The mean wind speeds for this load case follow those of DLC 1.1 and DLC 1.3. The wind for this case has no turbulence and a transient shear profile as given in equations 26 and 27 of the IEC 61400-1 standard (International Electrotechnical Commission (IEC), Aug 2005). Because deterministic winds were used, the simulations were only 60 seconds long.
A total of 44 simulations were run for this case, which included a combination of 11 different wind speeds, with transient shear events in both the horizontal and vertical directions with both positive and negative values.
4.1.1.6 DLC 2.3
This design load case examines the operation of a wind turbine with an electrical fault during an EOG, which is defined as the loss of generator torque. This condition is modeled by turning off the generator at time t, and 0.2seconds later all the blades are pitched to feather at 8.0-degrees/second. The wind conditions for this include nonturbulent gusts at cutout, and at 2-m/s above and below rated wind speed. The occurrence of the gust is defined in Eq 17 of the IEC 61400-1 standard and peaks at 60-seconds into the simulation. The time t of the generator cutout is swept through the gust peak by incrementing t by 2-seconds with each simulation. A total of 6 simulations was used for each of the three wind speeds evaluated.
4.1.1.7 DLC 6.1
DLC 6.1 examines a parked turbine under 50-year extreme conditions with turbulent extreme wind model (EWM) winds. Using the IEC standard for a class I wind turbine, Vref = 50-m/s From Eq 14 of the IEC 61400-1 standard, V50 = Vref at the hub height. One-hour simulations with a lower average wind-speed of 47.5-m/s were used instead of 10-minute simulations at 50-m/s yielding the same maximum wind-speed statistics. A total of 18 simulations were run encompassing three different yaw angles (-8, 0, and 8-degrees), and with six different wind seeds for each yaw error.
4.1.1.8 DLC 6.2
This set of simulations examines a parked wind turbine with the 50-year extreme conditions used in DLC 6.1 along with a loss of the electrical system, which is modeled here as the loss of the yaw control. Simulations were run for yaw errors ranging from -180 to 180-degrees in 20-degree steps. A total of 108 simulations were run for this load case encompassing 18 different yaw errors with six wind seeds each.
4.1.1.9 DLC 6.4
This fatigue design load case simulates a turbine under parked conditions for normal turbulent winds up to 70% of Vref. A total of 96 simulations encompassing 16 wind speeds with six wind seeds each were run. The results were then post-processed using MLife as described below.
4.1.1.10 DLC 7.1
This DLC examines a parked wind turbine under 1-year extreme conditions with a fault where blade one is stuck at 0◦ while the others are feathered to 90◦. The same wind conditions as used in DLC 6.3 are used here, except that the
24 This report is available at no cost from the National Renewable
Energy Laboratory at www.nrel.gov/publications

yaw errors are less severe at -8, 0, and 8-degrees. A total of 18 simulations were run with six different wind seeds for each yaw error.
4.1.2 Post-Processing Methodology
After all simulations for a particular rotor design were run, the FAST output for the ultimate strength design load cases was post-processed using MExtremes (v1.00.00h-gjh) (Hayman, 2012a) to find the largest loads for various outputs across all simulations. Safety factors were applied according to Table 9 for all forces and moments prior to comparison. These values are summarized for each of the rotor designs in Section 4.2.
The FAST output for the fatigue DLCs of 1.2 and 6.4 were post-processed using MLife (v1.00.00f-gjh) (Hayman, 2012b) to calculate the damage equivalent loads (DELs) for each of the tower nodes. For this, we used a Weibull distribution with a mean wind speed of 10-m/s and shape factor of two. The DEL was calculated at 1-Hz with zero mean, a Wöhler exponent of 4, and the Goodman correction. A one-sided amplitude was reported. Safety factors were applied afterwards, as described in Chapter 6. Tables of the DELs used in the tower designs for the 80-m/s and 100-m/s rotors are in Appendix A.
4.2 Aero-Elastic Loads Analysis Results
After the simulations in the loads analysis were completed, the results were post-processed to extract the maximum loads and moments on various parts and locations of the turbine. These values were then used to design the tower and gearbox assembly presented in Chapter 5 and Chapter 6. A summary of the resulting loads follows in this section. Additional tables of maximum loads and figures detailing the contributing design load cases are located in Appendix A.
Table 10. Maximum Loads on the Yaw Bearing and Low Speed Shaft (LSS) for All Five Rotor Designs
FAST Output 80- m/s 80- m/s 100- m/s 100- m/s 100- m/s Description Variable Units Baseline Optimized High-Solidity Low-Solidity Flexible
Yaw bearing lateral force YawBrFMxy (kN) 1, 437.9 1, 352.8 1,564.7 1, 507.5 1,384.8 Rotor thrust RotThrust (kN) 1, 506.6 1, 360.5 1,605.2 1, 491.8 1,433.6 LSS side-to-side force LSShftFys (kN) 1, 119.8 1, 056.8 1,017.7 880.44 912.23 LSS vertical load LSShftFzs (kN) 1, 761.0 1, 636.5 1,668.0 1, 719.0 1,5783.0
Yaw bearing combined xy moment YawBrMMxy (kN·m) 17, 032 17, 218 18,817 16, 067 15,996 Rotor torque RotTorq (kN·m) 7, 836.0 8, 040.0 6,219.0 6, 184.5 6,210.0 LSS moment about the y axis LSSGagMys (kN·m) 16, 665 14, 619 15,498 14, 391 13,743 LSS moment about the z axis LSSGagMzs (kN·m) 14, 607 14, 202 15,066 13, 261 12,355 LSS combined yz moment LSSGagMMyz (kN·m) 17, 433 14, 910 16,412 14, 864 14,071 Note: The values reported are the maximum absolute values. The x axis is along the LSS and the z axis is in the vertical plane along the shaft.
25 This report is available at no cost from the National Renewable
Energy Laboratory at www.nrel.gov/publications

0.8
0.9
1
1.1
Normalized
valu
e
Relative to basel ine 80 m/s
Yaw
BrFMxy
RotThru st
LSSh ftFy s
LSSh ftFz s
Yaw
BrM
Mxy
RotTorq
LSSGagMy s
LSSGagMzs
LSSGagMMy z
80 m/s Optim iz ed100 m/s H igh - Sol id i ty100 m/s L ow - Sol id i ty100 m/s F le x ib le
Figure 9. Comparison of the maximum loads on the yaw bearing and low-speed shaft for all optimized rotor designs. The values shown in this plot correspond to Table 10 and are normalized to the baseline 80-m/s rotor design.
0.8
0.9
1
1.1
Normalized
valu
e
Relative to optimized 80 m/s
Yaw
BrFMxy
RotThru st
LSSh ftFy s
LSSh ftFz s
Yaw
BrM
Mxy
RotTorq
LSSGagMy s
LSSGagMzs
LSSGagMMy z
100 m/s H igh - Sol id i ty100 m/s L ow - Sol id i ty100 m/s F le x ib le
Figure 10. Comparison of the maximum loads on the yaw bearing and low-speed shaft for 100-m/s rotor designs. The values shown in this plot correspond to Table 10 and are normalized to the optimized 80-m/s rotor design.
26 This report is available at no cost from the National Renewable
Energy Laboratory at www.nrel.gov/publications

Table 10 and Figure 9 provide an overview of the absolute value of the maximum forces and moments on the yaw bearing and LSS for each rotor design. In both the table and plot, the absolute maximums of the loads are presented after the application of the appropriate safety factors for each design load case. Tables 11 to 12 provide additional details on the yaw bearing and LSS loads. In Figure 9, the loads have been normalized to the baseline rotor (not shown). The optimized 80-m/s rotor design yielded a slight increase in rotor torque (RotTorq). It also yielded significant decreases in the thrust loading on the tower top (YawBrFMxy) and loads on the LSS which will lead to weight savings in the gearbox and tower.
Compared to the baseline design, the high-solidity 100-m/s rotor design resulted in a modest reduction in LSS loads, except for the moment about the shaft z-axis that increased slightly. The low-solidity and flexible 100-m/s rotor designs resulted in more significant reductions in LSS loads. In both the high- and low-solidity 100-m/s rotor designs, the thrust loading on the tower top increased over the baseline design.
Compared to the optimized 80-m/s rotor design (Figure 10), the 100-m/s rotor designs produced higher thrust loads both at the rotor and yaw bearing. The LSS moments (LSSGagMys, LSSGagMzs, and LSSGagMMyz) for the high-solidity design are on the order of 7%–10% larger than the optimized 80-m/s design. For the low-solidity and flexible 100-m/s design, the shaft moments decreased somewhat. The impact of these loads on the drivetrain design is discussed in detail in Chapter 5.
Table 11. Comparison of the Maximum Forces and Moments at the Yaw Bearing at the Top of the Tower for All Five Rotor Designs (The tables from which these results are extracted can be found in Appendix A.3)
FAST Output 80- m/s 80- m/s 100- m/s 100- m/s 100- m/s Variable Type Units Baseline Optimized High-Solidity Low-Solidity Flexible
YawBrFxp Min (kN) −1,163.8 −1,004.4 −1, 403.6 −1,287.0 −1,199.0 YawBrFxp Max (kN) 1,437.8 1,352.7 1, 564.7 1,503.9 1,384.8 YawBrFyp Min (kN) −1,265.0 −1,314.5 −1, 261.7 −1,094.7 −1,112.1 YawBrFyp Max (kN) 1,122.0 1,111.0 1, 047.3 1,043.2 1,000.8
YawBrFMxy Max (kN) 1,437.9 1,352.8 1, 564.7 1,507.5 1,3848
YawBrMxp Min (kNm) −2,876.9 −3,080.7 −2, 403.0 −2,139.5 −2,278.1 YawBrMxp Max (kNm) 8,437.5 8,176.5 6, 624.0 6,534.0 6,609.0 YawBrMyp Min (kNm) −13,189.0 −11,088 −12, 437.5 −11,591 −9,602.5 YawBrMyp Max (kNm) 16,092.0 16,349 18, 225.0 15,363 15,309
YawBrMMxy Max (kNm) 17,031.8 17,218 18, 817.1 16,067 15,996
Table 11 shows a comparison of the ultimate loads at the top of the tower for each of the five rotor designs. The force YawBrFMxy is the square root of the sum of the squares of YawBrFxp and YawBrFyp, which are the forces in the x and y directions, respectively, at the yaw bearing in the nonrotating tower top coordinate system. The moment YawBrMMxy is similarly the combined moment about the x and y tower top axis.
27 This report is available at no cost from the National Renewable
Energy Laboratory at www.nrel.gov/publications
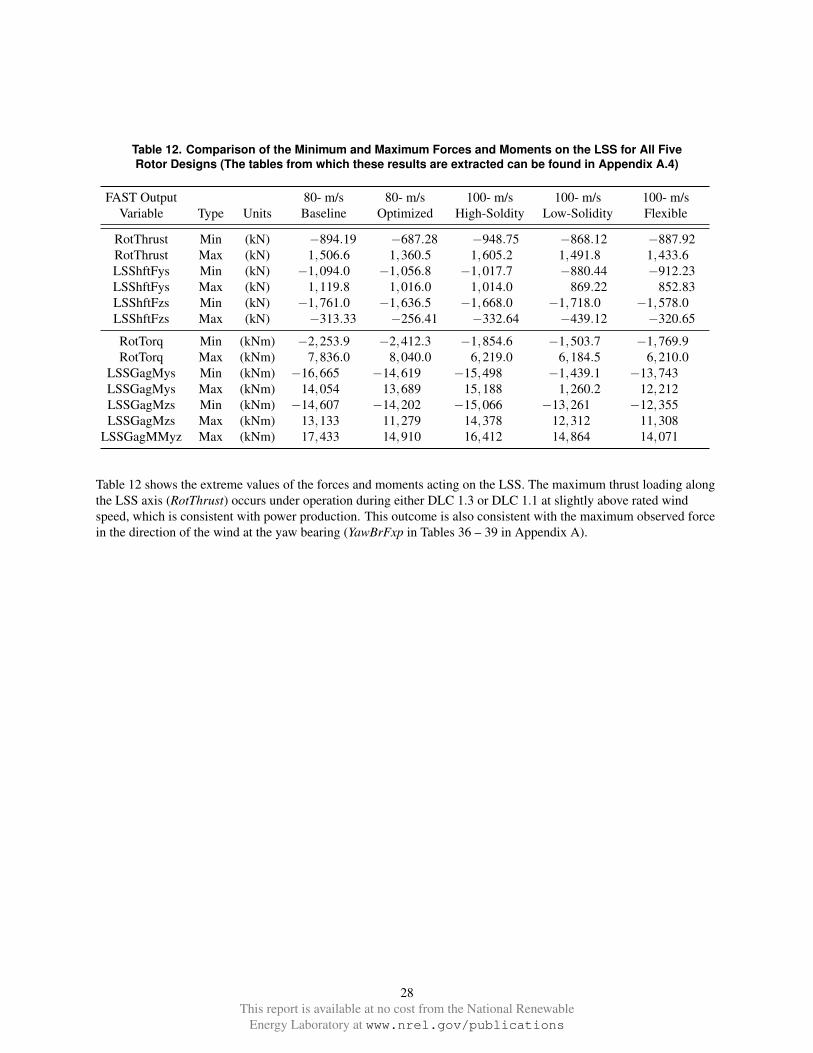
Table 12. Comparison of the Minimum and Maximum Forces and Moments on the LSS for All Five Rotor Designs (The tables from which these results are extracted can be found in Appendix A.4)
FAST Output 80- m/s 80- m/s 100- m/s 100- m/s 100- m/s Variable Type Units Baseline Optimized High-Soldity Low-Solidity Flexible
RotThrust Min (kN) −894.19 −687.28 −948.75 −868.12 −887.92 RotThrust Max (kN) 1,506.6 1,360.5 1,605.2 1,491.8 1,433.6 LSShftFys Min (kN) −1,094.0 −1,056.8 −1,017.7 −880.44 −912.23 LSShftFys Max (kN) 1,119.8 1,016.0 1,014.0 869.22 852.83 LSShftFzs Min (kN) −1,761.0 −1,636.5 −1,668.0 −1,718.0 −1,578.0 LSShftFzs Max (kN) −313.33 −256.41 −332.64 −439.12 −320.65
RotTorq Min (kNm) −2,253.9 −2,412.3 −1,854.6 −1,503.7 −1,769.9 RotTorq Max (kNm) 7,836.0 8,040.0 6,219.0 6,184.5 6,210.0
LSSGagMys Min (kNm) −16,665 −14,619 −15,498 −1,439.1 −13,743 LSSGagMys Max (kNm) 14,054 13,689 15,188 1,260.2 12,212 LSSGagMzs Min (kNm) −14,607 −14,202 −15,066 −13,261 −12,355 LSSGagMzs Max (kNm) 13,133 11,279 14,378 12,312 11,308
LSSGagMMyz Max (kNm) 17,433 14,910 16,412 14,864 14,071
Table 12 shows the extreme values of the forces and moments acting on the LSS. The maximum thrust loading along the LSS axis (RotThrust) occurs under operation during either DLC 1.3 or DLC 1.1 at slightly above rated wind speed, which is consistent with power production. This outcome is also consistent with the maximum observed force in the direction of the wind at the yaw bearing (YawBrFxp in Tables 36 – 39 in Appendix A).
28 This report is available at no cost from the National Renewable
Energy Laboratory at www.nrel.gov/publications

5 Drivetrain Design
5.1 Study Approach Using System Engineering Drivetrain Sizing Tool
This Chapter investigates the geared drivetrain design for the 80-m/s baseline, 80-m/s optimized, 100-m/s-highsolidity, 100-m/s-low-solidity, and 100-m/s flexible designs. This study uses an improved systems engineering drivetrain sizing tool, DriveSE (Guo et al., forthcoming), HubSE (Parsons et al., forthcoming) and Nacelle SE (Parsons et al., forthcoming), to optimize the gearbox, LSS and main bearing designs and to size the rest of the hub and nacelle components. DriveSE consists of a series of interacting mathematical models of drivetrain subcomponents as shown in Figure 11. At the moment, DriveSE contains only the major load-bearing components including the LSS, main bearings, gearbox, bedplate, and yaw system. The rest of the components for the hub and nacelle system are sized using HubSE and NacelleSE, which are primarily based on empirical data. Master routines in HubSE and NacelleSE interface with other wind turbine components, namely, the rotor and tower. At this top level, design criteria on allowable stress and deflection are inherently included for individual drivetrain subcomponents. These design criteria, together with the minimum weight objective for suboptimizations, are used to determine the subcomponent dimensions. The key model inputs are the aerodynamic rotor loads (torque and nontorque), gravity loads, the gearbox speed ratio, and the gearbox configuration. The outputs of DriveSE, HubSE, and NacelleSE fall into two categories: system outputs and subcomponent outputs. The system outputs are the weight, moments of inertia, and center of gravity of the entire hub and nacelle assemblies, which are used as input to the tower design. The subcomponent outputs include the dimension and weight of each individual subcomponent along with the gearbox stage ratio and stage volume, which are preliminary design parameters for these subcomponents. The mass outputs of all the individual components are then used in a turbine cost model as part of an overall system cost analysis.
Figure 11. DriveSE calculation flow chart
DriveSE designs the gearboxes for the minimum weight by optimizing the stage-speed ratio based on requirements described in [(AGMA, 2000, 2010; International Standards Organization (ISO), 1996a,b, 2012)]. The model requires the following input set (at minimum): the transmitted torque, overall speed ratio, stage number, and gearbox configuration. The gearbox model outputs the weight, volume, and speed ratio of gearbox stages. These parameters are crucial for gearbox component design and drivetrain cost analysis.
The main shaft is assumed to be tapered to reduce its weight. The tapered angle is designed based on the rotor loads applied to the shaft. The inputs for the main shaft and main bearing design are the rotor aerodynamic and gravity loads. The main shaft design uses the distortion energy failure theory to determine outer diameters at the
29 This report is available at no cost from the National Renewable
Energy Laboratory at www.nrel.gov/publications

main bearings. A peak load safety factor of 2.5 (AGMA, 2008) is applied. The upwind main bearing is designed at the upwind end of the main shaft. The shaft length is optimized based on the angular deflection limitations (shown in Table 13) imposed by the main bearings. As such, the downwind main bearing is positioned when the shaft’s deflection meets the design thresholds in Table 13. Besides the shaft dimensions, the shaft model also calculates main bearing loads for the selected main bearings. Main bearings are picked out of the SKF bearing database. The selection criteria are based on shaft geometry and load capacity. As a final step, when main bearings are selected, shaft dimensions will be updated by the bearing bore diameters. Model details of those components inside the nacelle can be found in (Guo et al., forthcoming).
Table 13. Maximum Ranges for Slopes and Transverse Deflections
Misalignment Tapered roller 0.0005-0.0012 rad Cylinder roller 0.0008-0.0012 rad Deep-groove ball 0.001-0.003 rad Spherical ball 0.026-0.052 rad Self-align ball 0.026-0.052 rad Uncrowned spur gear <0.0005 rad
Transverse Deflections Spur gears with P < 10 0.010 inch Spur gears with 11 < P < 19 0.005 inch Spur gears with 20 < P < 50 0.003 inch
DriveSE determines the appropriate bedplate sizes by modeling the bedplate as two parallel I-beams and separately treating the upwind and downwind sections. The upwind section is assumed to be made of ductile cast iron, whereas the downwind section is steel. Static point loads from the nacelle components are superimposed on the bedplate structure at the center of mass of each component, and rotor aerodynamic loads are superimposed on the upwind bedplate section as well. The upwind and downwind bedplate sections are individually sized to meet deflection and bending stress constraints.
The yaw system is composed of a friction plate yaw bearing at the nacelle tower interface and several yaw motors. The friction plate bearing is treated as a steel annulus and is sized according to the tower-top and rotor diameters. The motors are assumed to be a common design and the number of motors is a function of the rotor diameter (if not specified by the user).
The hub is modeled entirely of scaling arguments because of its geometric complexity, and will be refined in future studies. The current implementation treats the hub as a thin-walled ductile cast iron cylinder with holes for blade root openings and LSS flange. The hub outer dimensions and thickness scale with the rotor diameter and blade root thickness.
The rest of the drivetrain, hub system, and nacelle components are sized using the empirically-based HubSE and NacelleSE component models. Work is ongoing to update both the physics and data underlying the full set of hub and nacelle component models.
30 This report is available at no cost from the National Renewable
Energy Laboratory at www.nrel.gov/publications

Figure 12. REpower 5-MW turbine drivetrain [(Giese, 2013)]
5.1.1 Description of Selected Drivetrain Configurations
5.1.1.1 Gearbox
Geared drivetrains, the most prevalent design used for land-based wind turbines (and which are also used in offshore wind turbines), consist of a main shaft, main bearing(s), gearbox, generator coupling, and generator. Across various manufacturers, different rotor supports and bearing configurations are used and can be grouped into four categories: 1) three-point suspension, 2) two-main-bearing suspension (or four-point suspension), 3) integrated drivetrain, and 4) torque-only drivetrain. With three-point suspension, the rear main bearing of the two main shaft bearings is integrated into the gearbox at the planetary stage. The two-main-bearing suspension uses two separate main bearings that ideally carry all the nontorque loads from the rotor and transmit them o the tower through the bedplate. The integrated drivetrain has the main bearings integrated into the gearbox and the nontorque loads are transmitted through the gearbox housing. The torque-only drivetrain uses a set of flexible couplings to connect the rotor to the main shaft (also called torque shaft), thus eliminating most nontorque loads from the drivetrain including the rotor overhang weight. Among all of these drivetrain configurations, the three-point suspension drivetrain (historically the most common configuration) is highly sensitive to nontorque loads. The four-point suspension drivetrain has become a popular configuration because of the reduced sensitivity to nontorque loads. In this study, we selected the four-point suspension as the drivetrain configuration.
Gearbox weight relies on input torque, planetary gear configuration, drivetrain configuration, and so on. The redesigned gearboxes for the optimized designs at 80-m/s and 100-m/s are able to achieve further weight reduction by using more planet counts per planetary gear stage and flexpin designs. Larger numbers of planet gears increase the torque density of planetary geartrains and there can be as many as eight planet gears per planetary gear stage; however, the gearbox sensitivity to manufacturing and assembly tolerances increases with the number of planet gear counts, as does the overall gearbox cost. In this study, four planet gears were used per planetary gear stage. Hick’s flexpin technique (Montestruc, 2011) can improve planetary load sharing with a larger (more than three) planets, resulting in higher torque density and reduced gearbox size and mass. In addition, flexpins can alleviate planet bearing misalignment caused by the pin deformation of a cantilevered carrier. The misalignment caused by a cantilevered pin of the carrier is offset by the misalignment of a sleeve cantilevered from the opposite end of the pin. The planet bearings, therefore, stay parallel to the carrier rotational axis while the carrier itself tilts. This flexpin technique was used in all optimized designs.
5.1.1.2 Main Bearing
Among all the rotor loads in different directions, bending moments and thrust loads have the dominant effects on main bearing sizes. The upwind bearing carries the majority of bending moments whereas the downwind bearing carries the thrust loads and a small portion of bending moments. The upwind bearing must tolerate the shaft axial motion and misalignment caused by the rotor system flexibility. Having the downwind bearing on the downwind shaft end constrains the shaft misalignment at the gearbox that has a negative effect on gearbox performance. Shaft
31 This report is available at no cost from the National Renewable
Energy Laboratory at www.nrel.gov/publications

misalignment can disturb gear tooth load distribution and cause edge loading (a source for gear tooth pitting). The main bearing types follow the REpower 5-MW drivetrain design (Giese, 2013): CARB toroidal and spherical roller bearings (SRBs) are selected for the upwind and downwind bearings as shown in Figure 13. Although these bearings are selected to match the REpower baseline, SRBs have a significant axial end play and allow drivetrain axial motions. These axial motions are anticipated to negatively impact the reliability of drivetrain rotating mechanical components.
CARB
SRB
Figure 13. Main shaft and main bearing assembly [(Svenska Kullagerfabriken AB (SKF), 2013)]
5.2 Design Loads for Sizing the Drivetrain
The results of the loads analysis for the five rotor designs were used to size the drivetrain components for each case. The input loads applied to the drivetrain are calculated through load analyses of the entire wind turbine system. The drivetrain designs discussed below are driven by ultimate loads or stresses found through a series of load analyses. For example, the gearbox design torque is 150% of the rated (highest torque for DLC 1.3). The main shaft is designed to tolerate the highest stresses seen in all of the load cases. The von Mise stresses of the main shaft are calculated from the combined rotor loads and moments, where the maximum stress is located at the upwind main bearing location for the considered drivetrain configuration. As shown in Table 14, the main shaft bending moment around y caused the highest stresses on the main shaft for all five designs, assuming the shaft outer diameters are all the same (1- m). The drivetrain designs in this work are governed by the loads or stresses generated by this load case.
Table 14. von Mise Stress kpsi of LSS at the Upwind Main Bearing Location
80-m/s 80-m/s 100-m/s 100-m/s 100-m/s Baseline Optimized High-Solidity Low-Solidity Flexible
1. Thrust, min 9.38 9.78 8.96 10.90 8.91 2. Thrust, max 11.38 13.70 11.10 10.37 12.46 3. Rotor Force in y, min 14.68 14.68 15.12 13.92 12.90 4. Rotor Force in y, max 3.83 3.83 3.64 6.90 6.37 5. Rotor Force in z, min 15.11 16.09 19.70 17.95 16.56 6. Rotor Force in z, max 12.70 10.98 10.10 5.44 5.23 7. Torque, min 10.66 7.06 7.88 5.50 7.01 8. Torque, max 20.65 15.64 10.73 17.06 9.90 9. Bending moment around y, min 30.58 27.27 30.30 28.97 27.27 10. Bending moment around y, max 23.12 21.49 23.19 19.53 18.96 11. Bending moment around z, min 27.47 26.85 28.32 25.53 23.40 12. Bending moment around z, max 26.95 23.07 27.99 23.94 21.81
32 This report is available at no cost from the National Renewable
Energy Laboratory at www.nrel.gov/publications
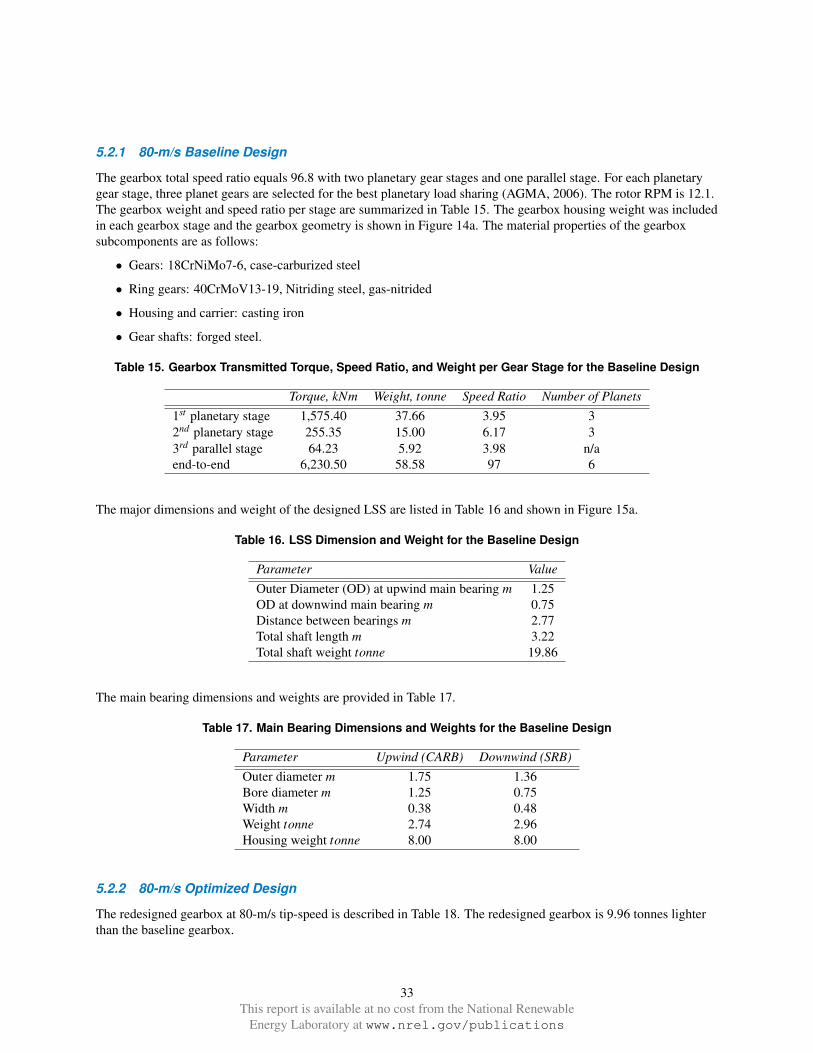
5.2.1 80-m/s Baseline Design
The gearbox total speed ratio equals 96.8 with two planetary gear stages and one parallel stage. For each planetary gear stage, three planet gears are selected for the best planetary load sharing (AGMA, 2006). The rotor RPM is 12.1. The gearbox weight and speed ratio per stage are summarized in Table 15. The gearbox housing weight was included in each gearbox stage and the gearbox geometry is shown in Figure 14a. The material properties of the gearbox subcomponents are as follows:
• Gears: 18CrNiMo7-6, case-carburized steel
• Ring gears: 40CrMoV13-19, Nitriding steel, gas-nitrided
• Housing and carrier: casting iron
• Gear shafts: forged steel.
Table 15. Gearbox Transmitted Torque, Speed Ratio, and Weight per Gear Stage for the Baseline Design
Torque, kNm Weight, tonne Speed Ratio Number of Planets 1st planetary stage 1,575.40 37.66 3.95 3 2nd planetary stage 255.35 15.00 6.17 3 3rd parallel stage 64.23 5.92 3.98 n/a end-to-end 6,230.50 58.58 97 6
The major dimensions and weight of the designed LSS are listed in Table 16 and shown in Figure 15a.
Table 16. LSS Dimension and Weight for the Baseline Design
Parameter Value Outer Diameter (OD) at upwind main bearing m 1.25 OD at downwind main bearing m 0.75 Distance between bearings m 2.77 Total shaft length m 3.22 Total shaft weight tonne 19.86
The main bearing dimensions and weights are provided in Table 17.
Table 17. Main Bearing Dimensions and Weights for the Baseline Design
Parameter Upwind (CARB) Downwind (SRB) Outer diameter m 1.75 1.36 Bore diameter m 1.25 0.75 Width m 0.38 0.48 Weight tonne 2.74 2.96 Housing weight tonne 8.00 8.00
5.2.2 80-m/s Optimized Design
The redesigned gearbox at 80-m/s tip-speed is described in Table 18. The redesigned gearbox is 9.96 tonnes lighter than the baseline gearbox.
33 This report is available at no cost from the National Renewable
Energy Laboratory at www.nrel.gov/publications

Table 18. Gearbox Transmitted Torque, Speed Ratio, and Weight per Gear Stage for the Baseline Design
Torque, kNm Weight, tonne Speed ratio Number of planets 1st planetary stage 1,626.43 29.02 3.83 4 (w/flexpins) 2nd planetary stage 262.12 13.43 6.20 4 (w/flexpins) 3rd parallel stage 64.39 6.17 4.07 n/a end-to-end 6,230.50 48.62 97 8
The major dimensions and weight of the LSS are listed in Table 19 and shown in Figure 15b.
Table 19. LSS Dimension and Weight for the 80-m/s Optimized Design
Parameter Value OD at upwind main bearing m 1.00 OD at downwind main bearing m 0.63 Distance between bearings m 2.65 Total shaft length m 3.06 Total shaft weight tonne 16.12
Note that the new shaft length is 3.06 m compared to the baseline value of 3.22 m.
The dimensions of main bearings are listed in Table 20.
Table 20. Main Bearing Dimension and Weight for the 80-m/s Optimized Design
Parameter Upwind (CARB) Downwind (SRB) Outer diameter m 1.42 1.03 Bore diameter m 1.00 0.63 Width m 0.375 0.35 Weight tonne 1.57 1.05 Housing weight tonne 4.58 3.11
5.2.3 100-m/s Optimized Designs
This section summarizes three drivetrain designs with blades operating at 100 m/s tip-speed, including 1) optimized high-solidity blades, 2) optimized low-solidity blades, and 3) flexible blades.
Gearbox speed ratio and transmitted torque are decisive design parameters for gearboxes. With the increased tip-speed, the gearbox speed ratio is reduced from 96.8 to 77.4 and rated torque is decreased from 4,154- kNm to 3,328kNm. The rotor RPM is 15.1. The blade designs at 100-m/s tip-speed do not affect significantly the gearbox torque and speed. Therefore, only one gearbox design is used throughout this section. The gearbox design parameters are shown in Table 21. Significant gearbox size reduction is achieved at higher tip-speed than lower tip-speed, as shown in Figure 14.
34 This report is available at no cost from the National Renewable
Energy Laboratory at www.nrel.gov/publications

Table 21. Gearbox-Transmitted Torque, Speed Ratio, and Weight per Gear Stage for the Increased Tip-Speed Design
Torque, kNm Weight, tonne Speed Ratio Number of Planets 1st planetary stage 1,328.42 22.80 3.76 4 (w/flexpins) 2nd planetary stage 227.24 10.20 5.84 4 (w/flexpins) 3rd parallel stage 64.50 4.86 3.52 n/a end-to-end 5,024.40 37.9 77.4 8
(a) (b)
Figure 14. Gearboxes of the (a) 80-m/s tip-speed design and the (b) 100-m/s tip-speed design
The main shaft and main bearing designs highly rely on the rotor aerodynamic loads, the nontorque loads. Therefore, the blade parameters signficantly affect the main shaft and main bearing designs. The major dimensions and weight of the low-speed shafts of all three designs are listed in Table 22 and shown in Figure 15.
Table 22. LSS Dimension and Weight for the 100-m/s-High-Solidity Blade Design
Parameter 100-m/s High-Solidity 100-m/s Low-Solidity 100-m/s Flexible OD at upwind main bearing m 1.25 1.00 1.00 OD at downwind main bearing m 0.60 0.67 0.63 Distance between bearings m 2.80 2.75 2.65 Total shaft length m 3.23 3.18 3.06 Total shaft weight tonne 22.86 17.38 16.11
The dimensions of the main bearings of all three designs are listed in Table 23.
Table 23. Main Bearing Dimension and Weight for the 100-m/s Optimized Design
Parameter Upwind Downwind Upwind Downwind Upwind Downwind High-solidity High-solidity Low-solidity Low-solidity Flexible Flexible
Outer diameter m 1.75 1.22 1.42 1.28 1.00 1.22 Bore diameter m 1.25 0.60 1.00 0.67 1.00 0.63 Width m 0.38 0.44 0.38 0.48 0.38 0.35 Weight tonne 2.74 0.72 1.57 1.40 1.57 1.05
35 This report is available at no cost from the National Renewable
Energy Laboratory at www.nrel.gov/publications

1.5 2 2.5 3 3.5 4 4.5 5 5.5−0.8
−0.6
−0.4
−0.2
0
0.2
0.4
0.6
Distance from Hub Center, mM
ain
Sh
aft
OD
, m
Downwind Main BearingUpwind Main Bearing
(a)
1.5 2 2.5 3 3.5 4 4.5 5 5.5−0.8
−0.6
−0.4
−0.2
0
0.2
0.4
0.6
0.8
Distance from Hub Center, m
Ma
in S
ha
ft O
D, m
Downwind Main BearingUpwind Main Bearing
(b)
1.5 2 2.5 3 3.5 4 4.5 5 5.5−0. 8
−0. 6
−0. 4
−0. 2
0
0.2
0.4
0.6
0.8
Distance from Hub Center, m
Ma
in S
ha
ft O
D, m
Downwind Main Bearing
Upwind Main Bearing
(c)
Downwind Main BearingUpwind Main Bearing
1.5 2 2.5 3 3.5 4 4.5 5 5.5−0. 8
−0. 6
−0. 4
−0. 2
0
0.2
0.4
0.6
0.8
Distance from Hub Center, m
Ma
in S
ha
ft O
D, m
(d)
1.5 2 2.5 3 3.5 4 4.5 5 5.5−0. 8
−0. 6
−0. 4
−0. 2
0
0.2
0.4
0.6
0.8
Distance from Hub Center, m
Ma
in S
ha
ft O
D, m
Downwind Main Bearing
Upwind Main Bearing
(e)
Figure 15. Main shaft of (a) baseline design, (b) 80-m/s optimized design, (c) 100-m/shigh-solidity design, (d) 100-m/s-low-solidity design, and (d) 100-m/s flexible design.
36 This report is available at no cost from the National Renewable
Energy Laboratory at www.nrel.gov/publications

5.3 Discussions of Drivetrain Designs
5.3.1 Comparison between NREL Baseline Drivetrain Against REpower Design
The designed baseline drivetrain is compared against the REpower design for key component weights as shown in Table 24. The available industry data is collected from (Giese, 2013; Svenska Kullagerfabriken AB (SKF), 2013; Svenska Kullagerfabriken AB (SKF)). The NREL baseline drivetrain weights agree with REpower’s design within a difference of 13% (the baseline design is lighter).
Table 24. Baseline Design Component Weight and REpower Data Comparison
Component, tonne Baseline 5MW REpower 5MW Difference % Main shaft with flange 23.8 27.2 -12.4 Main bearings (without housing) 5.7 6.0 -5.3 Gearbox 55.7 63.0 -11.6
5.3.2 Weight and Cost Benefit for Drivetrains with Higher Tip-Velocities
Table 25. Design Component Weight Comparison
80-m/s 80-m/s 100-m/s 100-m/s 100-m/s Baseline Optimized High-Solidity Low-Solidity Flexible
Main shaft with flange 23.8 16.1 22.9 17.4 16.1 Main bearings with housing 16.4 10.4 13.7 11.8 10.4 Gearbox 55.7 48.6 37.9 37.9 37.9 Generator 16.7 16.7 16.7 16.7 16.7 Bedplate 76.5 71.6 77.3 74.8 72.4 Other 44.2 43.6 44.3 44.0 42.9 Nacelle 233.3 207.0 212.7 202.5 197.1
Comparison of the weights for the different designs and the REpower machine are provided in Table 25 and shown in Figure 16. When blade-tip-speed increases from 80-m/s to 100-m/s, the gearbox weight drops 32.6% and 22.0% compared to the baseline and redesigned gearboxes at the 80-m/s tip-speed. The LSS of the 80-m/s optimized design is smaller than the baseline and 100-m/s high-solidity designs. The main shaft and bearing assembly weight of the 80-m/s optimized and 100-m/s flexible designs are the lightest compared to the 100-m/s optimized designs. This increased weight is a result of the fact that the new 100-m/s blades are operating at a higher tip-speed causing greater aerodynamic nontorque loads to be transmitted to the drivetrain (compared to the 80-m/s optimized design and the flexible design case). Therefore, the main shaft dimensions are expanded to carry these high loads. For the same reason, the hub and bedplate weights of the 100-m/s optimized design do not decrease much compared to the baseline design. The overall nacelle weight of 100-m/s optimized high-solidity, low-solidity, and flexible rotor designs decreases moderately by 8.8%, 13.2%, and 15.5%, compared to the baseline design. When assessing various drivetrain design options, it appears that the nontorque input rotor loads significantly affect the structural components of the drivetrain, particularly the main shaft and bedplate. To reduce the drivetrain overall weight and cost, it is important to limit the nontorque rotor loads when the tip-speed is increased.
37 This report is available at no cost from the National Renewable
Energy Laboratory at www.nrel.gov/publications

Figure 16. From the Top to Bottom, Nacelles of the Baseline Design, 80m/s Optimized Design, 100-m/s-High-Solidity Design, 100-m/s-Low-Solidity Design, and 100-m/s Flexible Design. Illustrated by Taylor Parsons (NREL).
38 This report is available at no cost from the National Renewable
Energy Laboratory at www.nrel.gov/publications

Gearbox weight at various rotor RPMs is shown in Figure 17. Higher tip-speed has a significant effect on gearbox weight by reducing speed ratio and torque. Gearbox size also decreases with the increased of number of planet gears per planetary gear stage. The flexpin design reduces the effects on rotor nontorque loads on the gearbox. As such, the gearbox is anticipated to have improved reliability and serviceability. With further reduction of the speed ratio, one gear stage can be removed from the design, which can greatly reduce gearbox weight. Another benefit is that the smaller gear ratio provides opportunities for innovative gearbox and drivetrain designs. For instance, design options of a single-stage compound planetary gear (shown in Figure 18) or a medium-speed gearbox design with classical planetary configurations and an innovative generator can be explored. Future work may explore these innovative aspects of geared drivetrain designs. In this study, the generator design was assumed to be unchanged when rotor tip-speed varied. In subsequent work, the various generator designs and their dependency on rotor design will be explored.
10 12 14 16 18 2020
40
60
80
Rotor RPM
Ge
arb
ox
we
igh
t, t
on
ne
60
80
100
120
70
90
110
Ge
arb
ox
spe
ed
ra
tio
Gearbox weight: 4−planet w/ �ex pins
Gearbox weight: 3−planet
Speed ratio
80m/s Tip Speed
100m/s Tip Speed
Figure 17. Gearbox weight variation with rotor RPM
Sun
Carrier
Ring
Planet 1
Planet 2
Sun
Carrier
Ring
Planet 1Planet 2
Figure 18. Two varieties of compound planetary gears. Illustrated by Yi Guo (NREL).
39 This report is available at no cost from the National Renewable
Energy Laboratory at www.nrel.gov/publications

6 Tower Design
6.1 Approach: TowerSE Model
The tower structural analysis for this study was based on beam-finite-element analysis with 20 beam elements along the tower. It was assumed that the driving load cases for structural strain represented the operational condition IEC DLC 1.3 with extreme turbulence, and the parked case IEC DLC 6.2. At both design conditions, the tower-top loads that corresponded to the wind speed and yaw angle for maximum thrust were used. The worst-case tower-top aerodynamic loads were provided from the FAST analysis described in Section 4. Wind loading on the tower was analyzed using a simple power-law profile, with drag-coefficients for the two-dimensional flow around a cylinder. Hoop stress was estimated using the methodology described by the (European Committee for Standardisation, 1993) for a tapered cylinder. The axial, shear, and hoop stress along the downwind side of the tower were combined into an equivalent von Mises stress. It was assumed that the tower was of steel construction with standard stiffness properties and a yield stress of 345- megaPascals (MPa).
Shell buckling was estimated using the methodology described by the (European Committee for Standardisation, 1993) for a tapered cylinder. It was assumed that the tower was reinforced every 30 m. Global buckling was estimated using the methodology specified by (Germanischer Lloyd, 2005).
Tower frequencies were constrained to be 10% higher than the rotor rotation frequency at rated conditions. In computing the frequency response of the tower, the RNA was treated as a rigid object offset from the tower-top with mass properties supplied from the rotor and nacelle analyses.
A rainflow counting analysis was used to provide damage-equivalent bending moments along the tower. Fatigue damage for a 20-year life was assessed at each station along the tower, assuming a cycle frequency of 1 Hz. Although the fatigue-induced stress was computed based on the changing tower dimensions, it was assumed that the aerodynamic loading did not change appreciably during the tower redesign.
Earlier the tower geometry was described as two linearly lofted sections. The location of the break was a design variable; other design variables included the tower diameter and shell thickness at the tower top, break, and base.
A minimum tower diameter of 3.87 m was prescribed to connect the nacelle and yaw bearing. To promote weldability of the tower sections, the diameter-to-thickness ratio was constrained to be greater than 120. For manufacturability, the tower-top diameter could not be smaller than 40% of the tower-base diameter. The optimizations were done using SNOPT (Gill et al., 2005) with finite-differencing The change in tower-top and bottom diameters will have an impact on blade-tower clearance; however, for the purpose of this study, the effect is assumed to be negligible. The 74 inequality constraints are summarized as:
f0 ≥ 1.1 Ωmax
σV M 1.3 ≤ σy
σV M 6.2 ≤ σy
shell buckling1.3 ≤ 0 shell buckling6.2 ≤ 0
(6.1)tower buckling1.3 ≤ 0 tower buckling6.2 ≤ 0
damage ≤ 1 dtop ≥ 0.4 dbase
d/t ≥ 120
40 This report is available at no cost from the National Renewable
Energy Laboratory at www.nrel.gov/publications

6.2 Tower Optimization Results
Figure 19 shows a comparison of the utilization for the baseline design and the three optimized point designs. The baseline clearly has a large margin for all constraints, which allows for significant mass reductions for the optimized designs. The 80-m/s design was driven by shell buckling at the extreme load along the bottom-half of the tower, and both shell and global buckling at the maximum operational load along the top-half of the tower. The 100-m/s designs were all driven by buckling at the maximum operational loading condition. Weldability, manufacturability, and resonance constraints were not active for any of the designs. The 100-m/s designs had higher operational peak thrust loads, leading to increased buckling loads . The net result was that switching from the 80-m/s design to the 100-m/s design resulted in a 2.0% heavier tower for the high-solidity design and a 3.4% heavier tower for the low-solidity design. For the flexible case, where the rotor deflection constraint is ignored, the tower mass actually decreases by 1.2%. A summary of the mass and dimensions of the three optimized designs in comparison to the baseline tower is shown in Table 26.
0.0 0.2 0.4 0.6 0.8 1.0baseline
0
10
20
30
40
50
60
70
80
90
loca
tion
alon
g to
wer
(m)
0.0 0.2 0.4 0.6 0.8 1.080 m/s
0
10
20
30
40
50
60
70
80
90stress (DLC 1.3)stress (DLC 6.2)shell buckling (DLC 1.3)shell buckling (DLC 6.2)global buckling (DLC 1.3)global buckling (DLC 6.2)fatigue damage
0.0 0.2 0.4 0.6 0.8 1.0100 m/s high-solidity
0
10
20
30
40
50
60
70
80
90
0.0 0.2 0.4 0.6 0.8 1.0100 m/s low-solidity
0
10
20
30
40
50
60
70
80
90
0.0 0.2 0.4 0.6 0.8 1.0100 m/s flexible
0
10
20
30
40
50
60
70
80
90
Figure 19. Utilization for the baseline and three optimized point designs Utilization less than nne is acceptable.
Table 26. Tower Mass and Dimension Comparisons Between Baseline and Optimized Designs
mass (kg) z̄break dbase (m) dbreak (m) dtop (m) tbase (m) tbreak (m) ttop (m)
Baseline 349,487 0.5 6.0 4.935 3.87 0.0351 0.0299 0.0247 80-m/s design 265,684 0.75 6.439 5.024 4.362 0.02330 0.01921 0.01800 100-m/s high-solidity 271,044 0.631 7.088 4.910 4.802 0.02174 0.02181 0.01552 100-m/s low-solidity 274,835 0.618 7.040 5.045 4.957 0.02178 0.02183 0.01595 100-m/s flexible 262,567 0.609 6.780 4.991 4.919 0.02124 0.02128 0.01593
41 This report is available at no cost from the National Renewable
Energy Laboratory at www.nrel.gov/publications

7 System Cost and Noise Analysis
In this chapter, we aggregate the results from the previous sections to evaluate system cost-of-energy (COE) and turbine noise production. The goal of the overall study is to explore the trade-offs in system cost and noise that are expected through increasing the rotor maximum allowable tip-speed. The general approach and analysis for both system cost and noise will be provided followed by an explicit look at the trade-offs found within this study and future work that is necessary to explore the topic in more detail.
7.1 Study Approach: Turbine Noise and Plant Cost Models
7.1.1 Cost of Energy Analysis Tools
For overall COE analysis, five inputs are needed: turbine capital costs (TCC), balance-of-station (BOS) costs, operational expenditures (OPEX), annual energy production (AEP), and financing. The following models were used for each COE component:
• TCC: A newly developed model for TCC based on component masses (Dykes, forthcoming)
• BOS: An NREL land-based wind project BOS cost model that has not yet been published
• OPEX: The NREL Cost and Scaling Model (NREL CSM) (Fingersh et al., 2006)
• AEP: The NREL CSM Weibull-based AEP model was used for the energy production analysis. AEP was also computed using OpenWind and its Deep-Array Wake Eddy Viscosity Model (Robinson, 2012) to explore the impact of the combination of changes in power and thurst curves on plant energy production through their impact on array losses.
The use of the new models for BOS and TCC are important for this study because of the limitations of the NREL CSM in those two areas. The original CSM determines the sizes and related costs of a specific turbine using a few input parameters (i.e., rotor diameter, rated power, hub height) ,which are fixed in this study even though turbine loading and component sizing is changing. As discussed earlier and summarized in Table 27, the mass of all of the major components and subsystems of the turbine changes for each design.
The new TCC model (Dykes, forthcoming) uses the individual component masses for the turbine to evaluate the costs of individual components and then add factors for other costs such as the subassembly of the hub and nacelle and engineering and overhead, as well as profit mark-ups from the original equipment manufacturer to the project developer. Thus, the new model improves the senstivity of turbine capital costs to a number of parameters beyond those that were used in the NREL CSM.
The other model that has been replaced is the BOS model. The previous BOS model was entirely dependent on machine rating, which did not change in this study. The new BOS model depends on several machine design factors including machine rating, rotor diameter, and RNA mass. Thus, design changes that affect component masses will also result in a change to BOS. For more detail on the comparison between NREL CSM and the new cost models, see (Dykes et al., 2014).
Two methods are used for AEP calculations. The NREL CSM ener production model takes the power curve from each of the three cases and calculates site energy production using a Weibull distribution and simple assumptions about array losses and turbine availability. The site’s wind resource characteristics are based off of data for real land-based wind sites. The land-based wind data is from a typical land-based site instrumented with MEASNET-calibrated sensors at 40 and 50-m above ground. Key values of wind speed, direction, and turbulence intensity were quality controlled using standard filters for icing and sensor errors. The mean wind speed of the series at 50 m was 8.3-m/s. The Weibull shape parameter for the series was 2.14 and the scale parameter was 9.42-m/s. The scale parameter was scaled from 50 to 90 m using a wind shear exponent of 0.143 for flat terrain. The wind was predominantly from the southwest direction. The 2011Costo fWindEnergyReview (Tegen et al., 2013) reported
42 This report is available at no cost from the National Renewable
Energy Laboratory at www.nrel.gov/publications

Table 27. Masses for Wind Turbine, Subsystems, and Individual Components (tons)
Turbine
80-m/s Baseline
692.4
80-m/s Optimized
521.5
100-m/s High-Solidity
529.1
100-m/s Low-Solidity
526.4
100-m/s Flexible
496.3 Rotor 109.6 98.7 99.9 104.2 92.7 Single blade 17.7 16.1 16.4 17.6 14.6 Hub 38.4 34.1 34.1 34.1 34.1 Pitch system 16.2 14.5 14.7 15.5 13.0 Spinner 1.8 1.8 1.8 1.8 1.8 Nacelle 233.3 207.0 212.7 202.5 197.1 Main shaft with flange 23.8 16.1 22.9 17.4 15.5 Main bearings with housing 16.4 10.4 13.7 11.8 11.8 Gearbox 55.7 48.6 37.9 37.9 37.9 Generator 16.7 16.7 16.7 16.7 16.7 Bedplate 76.5 71.5 77.3 74.8 72.4 Other 44.2 43.6 44.3 44.0 42.9 Tower 349.5 265.7 271.0 274.8 262.6 Note: the "other" line-item includes the high-speed shaft, coupling, mechanical brake, yaw system, heating, ventilating, and air conditioning equipment, and other miscellaneous equipment.
turbine availability of 0.98, so this value was used in the current study. Array losses were an input to this model and they were calibrated to the baseline losses using an OpenWind analysis for the site (8.9%). A second AEP analysis was done using OpenWind and the same land-based data set. The data were imported into OpenWind and used in a flat plane to calculate a wind resource grid at 90 meters above the plane. As a result, topographic effects were ignored in the study to further isolate the contributions to changes in energy production stemming from changing thrust and power curves.
The OPEX model for the NREL CSM uses AEP as input proxy for loads on the turbine to estimate overall costs for replacements and operation and maintenance. The results from the four models feed the overall financing model, which in this case also uses the NREL CSM and its simple cost-of-energy equation given by:
FR(TCC + BOS)+(1 − T )OPEX COE = (7.1)
AEP
Where FR is the financing rate and T is the tax deduction rate on OPEX (0.095 and 0.4, respectively, as in (Tegen et al., 2013)).
7.1.2 Turbine Noise Analysis
Noise from a nearby wind plant can have adverse impacts on local communities. As a result, a key aspect of this study looked at the trade-offs in COE and aero-acoustic noise caused by increased wind turbine operating tip-velocities. A full noise model for the plant that includes both mechanical and aerodynamic sources of noise is beyond the scope of the current effort; however, this study uses a turbine noise model based on FAST’s built-in semiempirical aero-acoustic analysis routines. The analysis turns off all FAST analysis degrees of freedom except for the computations for aerodynamic forces and noise. The model provides results for aero-acoustic noise from the following sources: turbulent boundary layer trailing-edge, separated flow, laminar boundary layer vortex shedding, tip vortex formation, and turbulent inflow (Moriarty and Migliore, 2003). In this case, noise caused by the laminar boundary layer vortex shedding was excluded because we are using a large multimegawatt turbine in which this noise source is less relevant (Moriarty and Migliore, 2003). In addition, (Moriarty and Migliore, 2003) found that turbulent inflow dominated noise production in the model, whereas real data indicated that other sources of noise are
43 This report is available at no cost from the National Renewable
Energy Laboratory at www.nrel.gov/publications

also significant contributors to overall aero-acoustic noise. Still, using this model will provide some insight into the difference in noise levels from rotors operating at various tip-velocities because of the aero-acoustic noise sources noted above. We ran the analysis with steady winds so that noise caused by turbulent inflow was also excluded. In the model, each operating wind speed is run as an independent case and the noise output is computed at the base of the wind turbine tower both for a frequency-averaged total sound pressure level as well as a time-averaged sound pressure level by frequency. Although this process excludes various important factors necessary for thorough noise analysis, it does provide some indication of how the turbine aero-acoustic noise changes between the three cases.
7.2 LCOE Analysis Results
The results of the cost analysis for each case are presented in Table 28. The analysis was also peformed using Open-Wind for AEP estimation. The results for this second analysis are provided in 29.
The study hypothesis was that the overall cost-of-energy for a wind plant could be reduced if the maximum allowable operating tip-speed for the wind turbine was increased. This outcome, it was suspected, would reduce loads on the gearbox through reduction in torque—whereas other loads would remain similar, thus achieving overall system cost reductions. The analysis results do show a cost reduction primarily caused by the change in the gearbox cost relative to the rest of the system cost changes. Using the Weibull AEP model, a 1.5% reduction in cost is seen moving from the design optimized at 80-m/s to the low-solidity design optimized for 100-m/s. The first 100-m/s optimized design with the high-solidity rotor actually results in a cost increase of 1.3%. The turbine capital costs for the low- and high-solidity 100-m/s designs are similar, with the former having a slightly heavier drivetrain and the latter having a slightly heavier rotor and tower. The cost of the nacelle is higher for the high-solidity design because of the larger-sized LSS, main bearings, and bedplate as a result of higher aerodynamic loads from the rotor.; however, the low-solidity design has a much heavier blade (and pitch system) because of the need to maintain the structural integrity of the design. These higher loads and heavier RNA mass result in an increased tower mass as well. Because of the sensitivity of the model to rotor and tower cost compared to drivetrain cost, the turbine costs are actually higher for the low-solidity design case; however, there is improved energy capture in the design for the low-solidity case, which reduces its overall COE so that the design results in a cost reduction from the 80 m/s case compared to the cost increase of the high-solidity design. Using this sequential approach of optimization it was difficult to assess how the upstream selection of the rotor design would affect the downstream sizing of the nacelle components and overall system cost and energy capture. Still, given these limitations, the low-solidity design appeared to be a better overall design from a system COE perspective.
Including the openWind flow model with turbine-wake interactions in the AEP calculation, the results were very similar, though the high-solidity case showed even worse performance compared to the 80-m/s design case with a 2.1% increase in COE. The power, speed, and thrust curves for each of the four cases are included in Figure 20, Figure 21, and Figure 22 (the flexible 100-m/s case for low-solidity had the same power, speed, and thrust profiles as the inflexible case; a more rigorous approach would take into account the deflection effects on the performance of the flexible rotor but it was excluded from this study here for simplicity).
Table 28. Overall Cost Results Across the Four Different Cases with AEP Calculations via a Weibull Distribution
80-m/s Baseline
80-m/s Optimized H
100-m/s igh-Solidity L
100-m/s ow-Solidity
100-m/s Flexible
TCC [$/kW] 1,793 1,598 1,554 1,569 1,479 BOS [$/kW] 574 557 559 557 550 OPEX [$/kWh] 0.012 0.012 0.012 0.012 0.012 AEP [MWh/turbine] 20,363 20,242 19,566 20,312 20,312 COE [$/kWh] 0.0624 0.0578 0.0586 0.0570 0.0547 % Reduction from 80-m/s optimized -1.3% 1.5% 5.5%
44 This report is available at no cost from the National Renewable
Energy Laboratory at www.nrel.gov/publications

Table 29. Overall Cost Results Across the Four Different Cases with AEP Calculations via OpenWind
80-m/s Baseline
80-m/s Optimized H
100-m/s igh-Solidity L
100-m/s ow-Solidity
100-m/s Flexible
TCC [$/kW] 1,793 1,598 1,554 1,569 1,479 BOS [$/kW] 574 557 559 557 550 OPEX [$/kWh] 0.012 0.012 0.012 0.012 0.012 AEP [MWh/turbine] 19,044 18,967 18,191 19,027 19,026 COE [$/kWh] 0.0664 0.0614 0.0626 0.0604 0.0580 % Reduction from 80-m/s optimized -2.1% 1.5% 5.5%
Figure 20. Power curves for four different analysis cases
45 This report is available at no cost from the National Renewable
Energy Laboratory at www.nrel.gov/publications

Figure 21. Rotor speed curves for four different analysis cases
Figure 22. Thrust curves for four different analysis cases
46 This report is available at no cost from the National Renewable
Energy Laboratory at www.nrel.gov/publications

The increased speed, thrust, and power for the 100-m/s cases from the 80-m/s optimized design cases resulted in larger wakes that increased overall plant energy production losses. The array losses increased from 8.8% in the 80-m/s design case to 9.2% for the 100-m/s-high-solidity design case, but only 8.9% for the 100-m/s-low-solidity design. These small increases did have some impact on overall COE reduction. Generally, the energy production estimates from OpenWind were lower than those from the Weibull distribution model, which means that the COE reductions were generally lower in the former case than the latter. Still, even with the introduction of the change in array losses from one configuration to the next, COE was reduced when moving from the 80-m/s to the 100-m/s design case and the original study hypothesis of increased tip-speed reducing cost-of-energy was upheld for both the low- and high-solidity designs. However, there were several limitations to the analysis that prohibit drawing a firm conclusion that higher tip-velocities reduce system cost.
First, there were some caveats to the models themselves. The machine used in this study was based on the NREL 5-MW reference turbine (Jonkman et al., Feb 2009)—a very large turbine for land-based projects. The turbine costs were high relative to the balance-of-station costs. Using a land-based balance-of-station (BOS) model calibrated with data for projects using turbines in the approximately 2 MW range is problematic when changing to a 5-MW turbine. The BOS costs were potentially low relative to the turbine capital costs (TCCs) and further work should investigate BOS costs for land-based projects with very large turbines. The turbine capital costs themselves agreed with values reported for turbines of this size that are in production for offshore applications in Europe (Tegen et al., 2013) so it is likely that the BOS costs are too low and should have been increased. This increase would have reduced the impact that the change in TCC had on overall COE. The main source of the cost reduction was through gearbox cost so reducing the influence of TCC on the overall COE equation would have reduced the overall impact of the higher tip-speed on system cost reductions.
Second, for the TCC model iteslf, we saw that the gearbox cost was much more sensitive to its mass than some of the other components (such as the LSS, main bearings, and bedplate). The overall mass of the nacelle was only 4.5 tons lighter, as seen in Table 27 moving from the 80-m/s to the 100-m/s optimized case; however, the cost of the nacelle was reduced by over $175,000, or 6%, as can be seen in Table 30 because of the large reduction in gearbox cost as compared to the modest increases in costs for other components. Therefore, care should be taken when concluding that significant COE reductions are made by relaxing the tip-speed constraint; all of the cost models need significant improvement to accurately assess the impact.
Table 30. Overall Cost Results Across the Five Different Cases (in 1,000 USD)
Turbine
80-m/s Baseline $8,966
80-m/s Optimized
$7,992
100-m/s High-Solidity
$7,771
100-m/s Low-Solidity
$7,843
100-m/s Flexible $7,392
Rotor $1,521 $1,350 $1,374 $1,458 $1,220 Single blade $226 $233 $237 $254 $212 Hub $228 $203 $203 $203 $203 Pitch system $514 $438 $448 $483 $371 Spinner $11 $11 $11 $11 $11 Nacelle $3,397 $3,143 $2,965 $2,917 $2,895 Main shaft with flange $148 $107 $143 $113 $107 Main bearings with housing $98 $62 $82 $71 $62 Gearbox $1,257 $1,094 $845 $845 $845 Generator $452 $452 $452 $452 $452 Bedplate $126 $120 $127 $124 $121 Other $1,315 $1,308 $1,318 $1,313 $1,310 Tower $830 $631 $643 $653 $623
47 This report is available at no cost from the National Renewable
Energy Laboratory at www.nrel.gov/publications

7.3 Noise Analysis Results
The higher tip-speed is a key driver for aero-acoustic noise production. Figure 20, Figure 21, Figure 22, and Figure 23 show power, rotor speed, thrust, and noise curve results for the three different cases of the 80-m/s tipspeedbaseline 5-MW reference design, 80-m/s tip-speed optimized design, and 100-m/s tip-speed optimized designs for both the high- and low-solidity cases. Again, the results were for aero-acoustic noise only and there were some limitations to the analysis as noted in the original work (Moriarty and Migliore, 2003). The results showed a definite increase in overall noise as tip-speed is increased, which reflects moving from sound pressure levels typical of “loud conversation” (60- dB[A]) to noise level charactistics of being “inside a factory” (70-dB[A]) (Wagner et al., 1996). The magnitude here for each case should be considered carefly but the trade-off of increased tip-speed and aero-acoustic noise is present as expected.
Figure 23. Total aero-acoustic sound pressure level (SPL) curves for four different analysis cases at the base of the tower
The above results are maximum values in time that have been frequency-averaged. Inspection of the different contributing factors to the noise production revealed that the main sources came from trailing-edge noise and noise from separated flow/stall for low frequencies (under 400 Hz). More work is necessary to fully explore the reasons for these model results. It is also possible that the accuracy of the model predictions at low-frequency values and high angles of attack are questionable. In addition, the turbulent inflow noise was another important contributing factor to the noise and should be explored in subsequent work. Finally, the noise performance of the 100-m/s downwind/flexible rotor configuration was the same as the upwind configuration. The lack of a true downwind configuration meant that there was no accounting for noise introduced by rotor interaction with tower wake in the FAST noise model. Additional work is needed to explore that impact on the overall turbine noise profile.
Additional information about the noise from the turbine can be seen iby looking at the time-averaged noise output by 1/3-octave frequency band. Figure 24 is a surface plot of sound pressure level by the 1/3-octave frequency band by wind speed for both the 80-m/s and 100-m/s optimized designs. The plot here shows the significant differences caused by increased tip-speed moving from the 80-m/s to the 100-m/s optimized design across the entire range of 1/3-octave frequency bands. The high sound pressure levels at low frequencies for the 100-m/s design are readily
48 This report is available at no cost from the National Renewable
Energy Laboratory at www.nrel.gov/publications

apparent (reaching near 70-dB[A] for the lowest frequency at the highest wind speeds).
Figure 24. Noise surface plots at the base of the tower for the 80-m/s baseline and 100-m/s optimized designs
7.4 Discussion of LCOE and Noise Results
The noise analysis and COE analysis illustrate the trade-offs between design tip-speed and noise on one hand and overall system cost on the other. Though there are limitations to both the cost and noise models used in the analysis, the trade-off is evident. The study showed a potential 4% reduction in system cost-of-energy moving from an 80-m/s operating tip-speed optimized design to a 100-m/s operating tip-speed optimized design; however, this increase in speed resulted in a 10- dB(A) increase in the total sound pressure level because of aero-acoustic sources at rated operating speeds. Thus, the models demonstrate that a trade-off is present. However, further development of both the turbine and plant cost models as well as plant performance models for energy production and noise are necessary to explore the relationship of the trade-off and to improve the accuracy of the trade-off characterization. It is important to note that the rotors in this study were designed without regard to noise considerations, with the exception of the tip-speed constraints. As will be discussed, aero-acoustic noise can be addressed in rotor design through various measures and additional research is needed to investigate these opportunities.
49 This report is available at no cost from the National Renewable
Energy Laboratory at www.nrel.gov/publications

8 Result Discussion and Future Work
This study corroborated the hypothesis of a trade-off between aero-acoustic noise (characterized by maximum allowable tip-speed constraints on turbine design) and overall system cost-of-energy. However, this trade-off between tip-speed and cost-of-energy was less pronounced than expected, primarily because of the difficulty in packaging sufficient structural strength and stiffness into a lower-solidity rotor that could ideally be coupled with a higher tip-speed design. For an ideal rigid rotor, the increased tip-speed would result in a lower-solidity rotor operating at a higher tip-speed-ratio (TSR), with power performance identical to the reduced tip-speed case. The nontorque loads would be the same whereas the torque would be reduced. Thus, the system would have a lighter blade and gearbox, and therefore a lighter tower. In reality however, the strength and stiffness requirements for the rotor design mean that a lower-solidity blade must be reinforced structurally, thereby becoming much heavier, or vice versa, moving to a higher-solidity design to reduce blade weight is accompanied by a reduced TSR and power production and increased nontorque loads on the drivetrain. The different approaches to rotor design demonstrated the trade-offs in system design between cost of the rotor and the rest of the turbine costs as well as power production.
In the case of the 100-m/s-high-solidity design, the increased rotor thrust loads and bending moments demand a heavier hub, larger LSS, larger main bearings, and overall heavier nacelle bedplate. Furthermore, the higher aerodynamic loads and heavier RNA results in a heavier tower. This configuration did provide lower torque input to the gearbox that reduced overall gearbox size; however, the increased loads almost entirely offset the reduced weight of gearbox so that the overall nacelle weight actually increased slightly from the 80-m/s optimized design. The nacelle cost, on the other hand, was reduced by 6%. Overall turbine costs were reduced only 3% from the optimized 80-m/s case. Because of the decrease in energy production moving from the 80-m/s optimized design to the 100-m/shigh-solidity design case, the cost-of-energy actually increased by 1.3%. This case illustrated the need for a more integrated approach to system design considering overall COE as the objective.
It was determined that moving to a low-solidity rotor configuration might improve the system COE by allowing for higher energy production and reducing nontorque loads on the drivetrain. Moving to a 100-m/s-low-solidity design did result in a COE reduction from the 80-m/s optimized case of 1.5%. The reduction was primarily caused by the fact that the new design had thrust loads and bending moments comparable to the 80-m/s design so that the nacelle components were similar in size to the 80-m/s case. This result coupled with the large reduction in gearbox size led to a nacelle that was 2% lighter than the 80-m/s optimized design case and a nacelle cost that was 7% less than the 80-m/s optimized design; however, structural modifications were needed for the lower-solidity blade to meet deflection constraints and strength requirements so that the new blade was 9.3% heavier than the 80-m/s optimized blade. The added cost of the blade meant that overall turbine cost reductions were only 2%. Thus, the high-solidity design would have performed better overall except for the fact that the new design had improved aerodynamic efficiency and power capture. These improvements resulted in a plant energy production that was higher than the 80-m/s optimized case, which resulted in a system COE reduction.
As a final analysis, the 100-m/s-low-solidity design was run in a flexible configuration in which the tip-deflection constraint was removed to mimic a downwind rotor configuration. This resulted in lower thrust loads and an overall nacelle that was 5% lighter than the 80-m/s design case. In addition, the removal of the tip-deflection constraint enabled a much more flexible blade design with less structural reinforcement and a mass of 9.3% lighter than the 80-m/s blade design. The result was a turbine cost that was 7% lower than the 80-m/s case. One caveat here is that the flexible downwind rotor would operate with significant deflection, which could reduce the overall energy production. Because the model itself was not actually downwind, this effect was not captured in the subsequent energy production analysis and thus, the AEP remained at the same level as the first 100-m/s low-solidity case. Thus, the resulting overall COE reduction of 5.5% from the 80-m/s optimized design case is likely optimistic. Future work should model an actual downwind design that can accurately reflect machine operation and energy production.
50 This report is available at no cost from the National Renewable
Energy Laboratory at www.nrel.gov/publications

8.1 Lessons Learned and Future Work
There are several lessons learned in this study that merit consideration. First, the rotor design was selected without complete information about the downstream effects on other subsystems and overall cost-of-energy. It is difficult to couple complex models into a holistic optimization and so in this analysis, a sequential approach was taken where proxies of weight and blade cost were used for overall system cost in selecting the optimal designs. It is likely that an integrated system optimization approach would improve upon the sequential process even if the models used are of a lower-fidelity. A system optimization may produce designs that reduce LCOE by more efficiently balancing trade-offs in energy production and cost. It is critical, however, that results of lower-order model simulations be crosschecked by higher fidelity models for overall design integrity. There was also a need for more thorough examination of some of the internal optimization processes. Sophisticated models were used for the rotor design but did not include a suboptimization of the controller design. More complete controller tuning for the 100-m/s cases might have mitigated the higher loads.
In addition, all of the analysis results above hinge on the fidelity of the models used in the study. The fidelity of the rotor models used was relatively high while the cost model fidelity was quite low. Even with the detailed rotor model, complexity arises because the scope of the project did not include the redesign of the controller for each turbine case and certain aspects of the design (i.e., the materials used and the airfoil families) were fixed. Even though the structural optimization used high-fidelity models, the aero-structural optimization did not. In the future, the aero-structural optimization could directly include the higher-fidelity structural models for improved results from an integrated rotor aero-structural perspective. The hub and nacelle models used were relatively simple compared to the blade model because they do not enable the exploration of innovative drivetrain designs that could be made possible in the lower-torque scenario. The cost models represent the lowest-fidelity models used in the study. The turbine cost model represents outdated technology and data whereas the plant cost models for a land-based project are based on smaller turbines and are not tuned to the scale (5-MW) used in this study. Improvement is necessary in the cost models to properly assess the impact of tip-speed constraints on overall system cost. Furthermore, noise models that characterize not just aero-acoustic noise, but overall turbine and plant noise are needed to explore the impact of the tip-speed design changes on noise impacts.
Next, there are innovative ways to approach the design of a turbine for higher tip-velocities that were outside the scope of this study. The use of novel materials in the blade design (such as carbon throughout the blade or only near the tip where deflection is the highest) may mitigate against the tip-deflection constraint impacts on the blade weight and cost. However, to explore the use of novel materials, a detailed, design-based blade cost model that can account for the materials and manufacturing costs is necessary. Future work could also consider using different airfoil families, such as flat-back airfoils or thicker airfoils, that may have decreased aerodynamic efficiency but may serve to mitigate against the increased weight of the blades to meet deflection and strength requirements. For the drivetrain, moving to higher tip-velocities might create opportunities for novel drivetrain configurations (i.e., where one of the gearbox stages is removed or even moving to a medium-speed gearbox/generator or direct-drive configuration). For the tower, many innovations are possible through the use of new materials and configurations that would avoid current design constraints caused by logistics considerations involving transportation and installation; however, models that are capable of novel configurations for such innovations are necessary.
Finally, only a single turbine and plant configuration with just two different maximum tip-velocities were considered in the analysis. Future work should assess the impacts of differing site conditions and size and class turbines on the effects of tip-speed on system COE over a range of tip-velocities. It is likely that the effects of increased tip-speed would be different for an offshore class 6 or higher site with a larger-scale turbine of 5 MW or more as compared to a low-wind land-based class 2 site with a turbine in the 2 MW range. Performing analysis over a range of turbines, sites, and maximum tip-velocities will provide insight into the different potential benefits.
Despite the study limitations, however, it appears that there is a cost/noise trade-off in the design of wind energy systems. Future work should focus on building additional insight into the relationship and quanitify that trade-off to better understand the potential cost reductions and the need for research on aero-acoustic noise mitigation strategies.
51 This report is available at no cost from the National Renewable
Energy Laboratory at www.nrel.gov/publications

References
AGMA (2000). AGMA Information Sheet: Geometry Factors for Determing the Pitting Resistance and Bending Strength of Spur, Helical and Herringbone Gear Teeth. AGMA.
——— (2006). ANSI/AGMA 6123 B06(2), Design Manual for Enclosed Epicyclic Gear Drives. AGMA.
——— (2008). ANSI/AGMA 6001-E08: Design and Selection of Components for Enclosed Gear Drives. AGMA.
——— (2010). ANSI/AGMA/AWEA 6006-A03: Standard for Design and Specifications of Gearboxes for Wind Turbines. AGMA.
Ashuri, T. (2012). Beyond Classical Upscaling: Integrated Aeroservoelastic Design and Optimization of Large Offshore Wind Turbines. Delft University of Technology.
Berg, J.; Resor, B.; Owens, B.; Laird, D. (2013). Numerical Manufacturing and Design Tool (NuMAD) for Wind Turbine Blades (v2.0). Sandia National Laboratories. Accessed July 21, 2014: http://energy.sandia. gov/?page_id=2238.
Bir, G.; Jonkman, J. (2007). “Aeroelastic Instabilities of Large Offshore and Onshore Wind Turbines.” Journal of Physics: Conference Series 75(1); p. 012,069. Accessed July 21, 2014: http://stacks.iop.org/ 1742-6596/75/i=1/a=012069.
Bottasso, C.; Campagnolo, F.; Croce, A. (2012). “Multi-disciplinary constrained optimization of wind turbines.” Multibody System Dynamics 27.
Bottasso, C.; Campagnolo, F.; Croce, A.; Dilli, S.; Fualdoni, M.; Nielsen, B. (2013). “Structural optimization of wind turbine rotor blades by multilevel sectional/multibody/3D-FEM analysis.” Multibody System Dynamics .
Dykes, K. (forthcoming). Turbine_CostsSE User Guide. NREL/TP-5XXX-XXXXX, National Renewable Energy Laboratory.
Dykes, K.; Meadows, R. (2011). Applications of Systems Engineering to the Research, Design and Development of Wind Energy Systems. NREL/TP-5000-52616, National Renewable Energy Laboratory.
Dykes, K.; Ning, A.; King, R.; Graf, P.; Scott, G.; Veers, P. (2014). Sensitivity Analysis of Wind Plant Performance to Key Turbine Design Parameters: A Systems Engineering Approach. NREL/CP-5000-60920, National Renewable Energy Laboratory. Accessed July 21, 2014: http://www.nrel.gov/docs/fy14osti/60920.pdf.
European Committee for Standardisation (1993). Eurocode 3: Design of Steel Structures—Part 1-6: General rules— Supplementary rules for the shell structures. EN 1993-1-6: 20xx.
Fingersh, L.; Hand, M.; Laxson, A. (2006). Wind Turbine Design Cost and Scaling Model. NREL/TP-50040566, National Renewable Energy Laboratory. Accessed July 21, 2014: http://www.nrel.gov/docs/ fy07osti/40566.pdf.
Fuglsang, P.; Madsen, H. (1999). “Optimization method for wind turbine rotors.” Journal of Wind Engineering and Industrial Aerodynamics 80.
Germanischer Lloyd (2005). Guideline for the Certification of Offshore Wind Turbines. IV – Part 2, Chapter 6.
Giese, N. (2013). REpower Offshore Turbines and UK Market,. Accessed July 21, 2014: http://www. windcomm.de/Downloads/Vortraege_Flyer_Infos/PresentationREpower.pdf.
Gill, P.; Murray, W.; Saunders, M. (2005). “SNOPT: An SQP algorithm for large-scale constrained optimization.” SIAM review 47(1); pp. 99–131.
52 This report is available at no cost from the National Renewable
Energy Laboratory at www.nrel.gov/publications

Griffith, D.; Ashwill, T. (2011). The Sandia 100-meter All-glass Baseline Wind Turbine Blade: SNL100-00. SAND2011-3779, Sandia National Laboratories.
Guo, Y.; King, R.; Dykes, K.; Parson, T.; Veers, P. (forthcoming). System Engineering: A Simple Analytical Formulation to Size Wind Turbine Drivetrains for Minimizing LCOE. NREL/TP-5XXX-XXXXX, National Renewable Energy Laboratory.
Hall, J.; Chen, D. (2013). “Dynamic optimization of drivetrain gear ratio to maximize wind turbine power generation – part 1: system model and control framework.” Journal of Dynamic Systems, Measurement and Control 135.
Hansen, C. (2014). NWTC Computer-Aided Engineering Tools (AirfoilPrep by Dr Craig Hansen). Accessed July 21, 2014: http://wind.nrel.gov/designcodes/preprocessors/airfoilprep/.
Hayman, G. (2012a). NWTC Design Codes MExtremes (v1.00). National Renewable Energy Laboratory. Accessed July 21, 2014: http://wind.nrel.gov/designcodes/postprocessors/mextremes/.
——— (2012b). NWTC Design Codes MLife (v1.00). Accessed July 21, 2014: http://wind.nrel.gov/ designcodes/postprocessors/mlife/.
International Electrotechnical Commission (IEC) (Aug 2005). Wind turbines – Part 1: Design requirements. 614001, Geneva, Switzerland.
International Standards Organization (ISO) (1996a). ISO 6336: Calculation of Load Capacity of Spur and Helical Gears: Part 2: Calculation of Surface Durability (Pitting). ISO.
——— (1996b). ISO 6336: Calculation of Load Capacity of Spur and Helical Gears: Part 3: Calculation of Load Capacity of Spur and Helical Gears. ISO.
——— (2012). IEC/FDIS 61400-4: Design Requirements for Wind Turbine Gearboxes. ISO.
Jamieson, P. (2009). “Light-weight, high-speed rotors for offshore.” EWEA Offshore Wind Energy Conference Proceedings Accessed July 21, 2014: http://proceedings.ewea.org/offshore2009/allfiles2/ 274_EOW2009presentation.pdf.
Jonkman, J. (Nov 2007). Dynamics Modeling and Loads Analysis of an Offshore Floating Wind Turbine. TP-50041958, National Renewable Energy Laboratory, Golden, Colorado.
Jonkman, J.; Butterfield, S.; Musial, W.; Scott, G. (Feb 2009). Definition of a 5-MW Reference Wind Turbine for Offshore System Development. TP-500-38060, National Renewable Energy Laboratory, Golden, Colorado.
Lee, S.; Ryi, J.; Choi, J. (2013). “Optimization design of prestressed concrete wind-turbine tower.” Journal of Mechanical Science and Technology 27.
Ma, H.; Meng, R. (2014). “Optimization design of prestressed concrete wind-turbine tower.” Science China Technological Sciences .
Montestruc, A. (2011). “Influence of planet pin stiffness on load sharing in planetary gear drives.” Journal of Mechanical Design 133(014501-1).
Moriarty, P.; Migliore, P. (2003). Semi-Empirical Aeroacoustic Noise Prediction Code for Wind Turbines. NREL/TP500-34478, National Renewable Energy Laboratory, Golden, Colorado.
Nicholson, J.; Arora, J.; Goyal, D.; Tinjum, J. (). “Multi-Objective Structural Optimization of Wind Turbine Tower and Foundation Systems using Isight: A Process Automation and Design Exploration Software.” Proceedings of the 10th World Congress on Structural and Multidisciplinary Optimization Accessed July 21, 2014: http:// www2.mae.u{fl.edu/mdo/Papers/5423.pdf}, Year = May 19-24, 2013, Address = Orlando, Florida, Bdsk-Url-1 = .
53 This report is available at no cost from the National Renewable
Energy Laboratory at www.nrel.gov/publications

Ning, A.; Damiani, R.; Moriarty, P. (In press). “Objectives and Constraints for Wind Turbine Optimization.” Journal of Solar Energy Engineering .
Parsons, T.; Guo, Y.; King, R.; Dykes, K. (forthcoming). HubSE and NacelleSE User Guide. NREL/TP-5XXXXXXXX, National Renewable Energy Laboratory.
Petrone, G.; de Nicola, C.; Quagliarella, D.; Witteveen, J.; Axerio-Cilies, J.; Iaccarino, G. (2009). “Wind Turbine Optimization Under Uncertainty with High Performance Computing.” Proceedings of the 29th AIAA Applied Aerodynamics Conference Accessed July 21, 2014: http://www.stanford.edu/group/uq/pdfs/ conferences/AIAA-2011-3806.pdf.
Resor, B. (2013). Definition of a 5MW/61.5m Wind Turbine Blade Reference Model. SAND2013-2569, Sandia National Laboratories.
Resor, B.; Maniaci, D.; Berg, J.; Richards, P. (2014). Effects of Increasing Tip Velocity on Wind Turbine Rotor Design [draft]. SAND2014-3136, Sandia National Laboratories.
Robinson, N. (2012). OpenWind User Manual. AWS Truepower. Accessed July 21, 2014: http://www. awsOpenWind.org/downloads/documentation/OpenWindUserManual.pdf.
Sale, D. (2013a). Co-Blade v1.20.00. Accessed July 21, 2014: https://code.google.com/p/co-blade/.
——— (2013b). NWTC Design Codes HARP_Opt (v2.00.00). National Renewable Energy Laboratory. Accessed July 21, 2014: http://wind.nrel.gov/designcodes/simulators/HARP_Opt/.
Svenska Kullagerfabriken AB (SKF) (2013). SKF Self-aligning Bearing Solution for Wind Turbines. Accessed July 21, 2014: http://www.skf.com/binary/21-75312/Self-aligning-bearings_EN.pdf.
Svenska Kullagerfabriken AB (SKF), Journal = Power Transmission Engineering, T..C.H..A.V...Y...B.U...w. () .
Tegen, S.; Lantz, E.; Hand, M.; Maples, B.; Smith, A.; Schwabe, P. (2013). 2011 Cost of Wind Energy Review. NREL/TP-5000-56266, National Renewable Energy Laboratory. Accessed July 21, 2014: 2011CostofWindEnergyReview.
Vasjaliya, N.; Gangadharan, S. (2013). “Aero-structural design optimization of composite wind turbine blade.” Proceedings of the 10th World Congress on Structural and Multidisciplinary Optimization Accessed July 21, 2014: http://www2.mae.ufl.edu/mdo/Papers/5265.pdf.
Wagner, S.; Bareiss, R.; Guidati, G. (1996). Wind Turbine Noise. Springer-Verlag Berlin.
54 This report is available at no cost from the National Renewable
Energy Laboratory at www.nrel.gov/publications

A Tables of Turbine Loads
A.1 Loads by DLC
Figures 25 to 27 give an overview of the loads produced by each rotor design. In each plot, the maximum instantaneous absolute value from each design load case (DLC) is plotted for each variable. The values have been normalized to facilitate side-by-side comparison. In the first four designs, the maximum loads are dominated by DLC 1.3. For the flexible 100-m/s design, DLC 1.1, 1.4, 2.3, and 6.2 also contribute.
0
0.2
0.4
0.6
0.8
1
Normalized
valu
e
80 m/s Basel ine
RootM
Mxy
RootM
xb
RootM
yb
TwrBsFMxy
TwrBsM
Mxy
TwrBsM
z t
Yaw
BrFMxy
Yaw
BrM
Mxy
Yaw
BrM
zp
LSSGagMMy z
LSSGagMy s
LSSGagMzs
RotTorq
RotThru st
LSSh ftFy s
LSSh ftFz s
DLC 1.1DLC 1.3DLC 1.5DLC 2.3DLC 6.1aDLC 6.2aDLC 7.1a
0
0.2
0.4
0.6
0.8
1
Normalized
valu
e
80 m/s Optimized
RootM
Mxy
RootM
xb
RootM
yb
TwrBsFMxy
TwrBsM
Mxy
TwrBsM
z t
Yaw
BrFMxy
Yaw
BrM
Mxy
Yaw
BrM
zp
LSSGagMMy z
LSSGagMy s
LSSGagMzs
RotTorq
RotThru st
LSSh ftFy s
LSSh ftFz s
DLC 1.1DLC 1.3DLC 1.4DLC 1.5DLC 2.3DLC 6.1aDLC 6.2aDLC 7.1a
0
0.2
0.4
0.6
0.8
1
Normalized
valu
e
80 m/s Optimized
RootM
Mxy
RootM
xb
RootM
yb
TwrBsFMxy
TwrBsM
Mxy
TwrBsM
z t
Yaw
BrFMxy
Yaw
BrM
Mxy
Yaw
BrM
zp
LSSGagMMy z
LSSGagMy s
LSSGagMzs
RotTorq
RotThru st
LSSh ftFy s
LSSh ftFz s
DLC 1.1DLC 1.3DLC 1.4DLC 1.5DLC 2.3DLC 6.1aDLC 6.2aDLC 7.1a
(a) Baseline 80-m/s rotor design (b) Optimized 80-m/s rotor design.
Figure 25. Overview of the maximum loads for the 80-m/s rotor designs. For each variable, the magnitudes of the values have been normalized to the largest value found.
55 This report is available at no cost from the National Renewable
Energy Laboratory at www.nrel.gov/publications

0
0.2
0.4
0.6
0.8
1
Normalized
valu
e
100 m/s High-Sol idi ty
RootM
Mxy
RootM
xb
RootM
yb
TwrBsFMxy
TwrBsM
Mxy
TwrBsM
z t
Yaw
BrFMxy
Yaw
BrM
Mxy
Yaw
BrM
zp
LSSGagMMy z
LSSGagMy s
LSSGagMzs
RotTorq
RotThru st
LSSh ftFy s
LSSh ftFz s
DLC 1.1DLC 1.3DLC 1.5DLC 2.3DLC 6.1aDLC 6.2aDLC 7.1a
0
0.2
0.4
0.6
0.8
1
Normalized
valu
e
100 m/s Low-Sol idi ty
RootM
Mxy
RootM
xb
RootM
yb
TwrBsFMxy
TwrBsM
Mxy
TwrBsM
z t
Yaw
BrFMxy
Yaw
BrM
Mxy
Yaw
BrM
zp
LSSGagMMy z
LSSGagMy s
LSSGagMzs
RotTorq
RotThru st
LSSh ftFy s
LSSh ftFz s
DLC 1.1DLC 1.3DLC 1.4DLC 1.5DLC 2.3DLC 6.1aDLC 6.2aDLC 7.1a
0
0.2
0.4
0.6
0.8
1
Normalized
valu
e
100 m/s Low-Sol idi ty
RootM
Mxy
RootM
xb
RootM
yb
TwrBsFMxy
TwrBsM
Mxy
TwrBsM
z t
Yaw
BrFMxy
Yaw
BrM
Mxy
Yaw
BrM
zp
LSSGagMMy z
LSSGagMy s
LSSGagMzs
RotTorq
RotThru st
LSSh ftFy s
LSSh ftFz s
DLC 1.1DLC 1.3DLC 1.4DLC 1.5DLC 2.3DLC 6.1aDLC 6.2aDLC 7.1a
(a) Optimized high-solidity (b) Optimized low-solidity 100-m/s rotor design 100-m/s rotor design
Figure 26. Overview of the maximum loads for the 100-m/s stiff blade rotor designs. For each variable, the magnitude of the values have been normalized to the largest value found.
0
0.2
0.4
0.6
0.8
1
Normalized
valu
e
100 m/s Flexible
RootM
Mxy
RootM
xb
RootM
yb
TwrBsFMxy
TwrBsM
Mxy
TwrBsM
z t
Yaw
BrFMxy
Yaw
BrM
Mxy
Yaw
BrM
zp
LSSGagMMy z
LSSGagMy s
LSSGagMzs
RotTorq
RotThru st
LSSh ftFy s
LSSh ftFz s
DLC 1.1DLC 1.3DLC 1.4DLC 1.5DLC 2.3DLC 6.1aDLC 6.2aDLC 7.1a
Figure 27. Overview of the maximum loads from each DLC for the flexible 100-m/s low-solidity rotor. For each variable, the magnitude of the values have been normalized to the largest value found.
56 This report is available at no cost from the National Renewable
Energy Laboratory at www.nrel.gov/publications

A.2 Damage Equivalent Tower Loads
To design the tower, the damage equivalent loads (DELs) were calculated using DLC 1.2 and DLC 6.4, as discussed in Section 4.1.2. The values listed as MMxy (combined moments about x and y axes) are calculated at each time step prior to the calculation of the DELs. These values do not include wind loading on the tower.
Table 31. Damage Equivalent Fatigue Moments for All Tower Nodes for the Baseline Rotor Design
Node Height Fraction Height Mxt Myt MMxy (-) (-) (m) (kN·m) (kN·m) (kN·m)
TwrBs 0.00 0.00 2.0956E+003 7.5134E+003 7.3655E+003 TwH01 0.02 1.33 2.0594E+003 7.3809E+003 7.2399E+003 TwH02 0.05 3.98 1.9874E+003 7.1338E+003 6.9946E+003 TwH03 0.08 6.64 1.9174E+003 6.8872E+003 6.7496E+003 TwH04 0.11 9.29 1.8455E+003 6.6388E+003 6.5051E+003 TwH05 0.14 11.95 1.7730E+003 6.3922E+003 6.2572E+003 TwH06 0.17 14.60 1.7014E+003 6.1481E+003 6.0156E+003 TwH07 0.20 17.26 1.6317E+003 5.9062E+003 5.7691E+003 TwH08 0.23 19.91 1.5620E+003 5.6533E+003 5.5311E+003 TwH09 0.26 22.56 1.4930E+003 5.4145E+003 5.2909E+003 TwH10 0.29 25.22 1.4243E+003 5.1796E+003 5.0553E+003 TwH11 0.32 27.87 1.3587E+003 4.9464E+003 4.8212E+003 TwH12 0.35 30.53 1.2966E+003 4.7192E+003 4.5975E+003 TwH13 0.38 33.18 1.2365E+003 4.4937E+003 4.3842E+003 TwH14 0.41 35.84 1.1793E+003 4.2797E+003 4.1698E+003 TwH15 0.44 38.49 1.1228E+003 4.0683E+003 3.9643E+003 TwH16 0.47 41.15 1.0657E+003 3.8677E+003 3.7621E+003 TwH17 0.50 43.80 1.0099E+003 3.6650E+003 3.5629E+003 TwH18 0.53 46.46 9.5636E+002 3.4661E+003 3.3629E+003 TwH19 0.56 49.11 9.0149E+002 3.2603E+003 3.1677E+003 TwH20 0.59 51.76 8.4709E+002 3.0629E+003 2.9704E+003 TwH21 0.62 54.42 7.9179E+002 2.8737E+003 2.7781E+003 TwH22 0.65 57.07 7.3877E+002 2.6834E+003 2.5901E+003 TwH23 0.68 59.73 6.8598E+002 2.4992E+003 2.4005E+003 TwH24 0.71 62.38 6.3253E+002 2.3208E+003 2.2168E+003 TwH25 0.74 65.04 5.8079E+002 2.1502E+003 2.0351E+003 TwH26 0.77 67.69 5.2972E+002 1.9859E+003 1.8587E+003 TwH27 0.80 70.35 4.8072E+002 1.8342E+003 1.6877E+003 TwH28 0.83 73.00 4.3281E+002 1.6958E+003 1.5182E+003 TwH29 0.86 75.66 3.9096E+002 1.5721E+003 1.3568E+003 TwH30 0.89 78.31 3.5462E+002 1.4713E+003 1.1946E+003 TwH31 0.92 80.96 3.2373E+002 1.4009E+003 1.0255E+003 TwH32 0.96 83.62 3.0161E+002 1.3626E+003 8.4662E+002 TwH33 0.99 86.27 2.8899E+002 1.3610E+003 6.6646E+002 YawBr 1.00 87.60 2.8561E+002 1.3729E+003 5.9784E+002
57 This report is available at no cost from the National Renewable
Energy Laboratory at www.nrel.gov/publications

Table 32. Damage Equivalent Fatigue Moments for All Tower Nodes for the Optimized 80-m/s Rotor Design
Node Height Fraction Height TwrBsMxt TwrBsMyt TwrBsMMxy (-) (-) (m) (kN·m) (kN·m) (kN·m)
TwrBs 0.000 0.000 2.6589E+003 8.0625E+003 6.8333E+003 TwH01 0.015 1.327 2.6107E+003 7.9292E+003 6.7074E+003 TwH02 0.045 3.982 2.5123E+003 7.6579E+003 6.4693E+003 TwH03 0.076 6.636 2.4151E+003 7.3946E+003 6.2231E+003 TwH04 0.106 9.291 2.3203E+003 7.1259E+003 5.9862E+003 TwH05 0.136 11.945 2.2263E+003 6.8595E+003 5.7480E+003 TwH06 0.167 14.600 2.1300E+003 6.5978E+003 5.5024E+003 TwH07 0.197 17.255 2.0350E+003 6.3314E+003 5.2685E+003 TwH08 0.227 19.909 1.9385E+003 6.0661E+003 5.0312E+003 TwH09 0.258 22.564 1.8478E+003 5.8022E+003 4.8023E+003 TwH10 0.288 25.218 1.7596E+003 5.5464E+003 4.5821E+003 TwH11 0.318 27.873 1.6759E+003 5.2949E+003 4.3665E+003 TwH12 0.348 30.527 1.6004E+003 5.0528E+003 4.1615E+003 TwH13 0.379 33.182 1.5304E+003 4.8178E+003 3.9747E+003 TwH14 0.409 35.836 1.4661E+003 4.5895E+003 3.7924E+003 TwH15 0.439 38.491 1.4000E+003 4.3643E+003 3.6172E+003 TwH16 0.470 41.145 1.3367E+003 4.1446E+003 3.4409E+003 TwH17 0.500 43.800 1.2718E+003 3.9222E+003 3.2669E+003 TwH18 0.530 46.455 1.2066E+003 3.6998E+003 3.0973E+003 TwH19 0.561 49.109 1.1408E+003 3.4783E+003 2.9265E+003 TwH20 0.591 51.764 1.0749E+003 3.2616E+003 2.7568E+003 TwH21 0.621 54.418 1.0074E+003 3.0471E+003 2.5874E+003 TwH22 0.652 57.073 9.3987E+002 2.8313E+003 2.4201E+003 TwH23 0.682 59.727 8.7241E+002 2.6235E+003 2.2521E+003 TwH24 0.712 62.382 8.0360E+002 2.4208E+003 2.0943E+003 TwH25 0.742 65.036 7.3500E+002 2.2246E+003 1.9322E+003 TwH26 0.773 67.691 6.6684E+002 2.0348E+003 1.7763E+003 TwH27 0.803 70.345 6.0054E+002 1.8553E+003 1.6243E+003 TwH28 0.833 73.000 5.3594E+002 1.6914E+003 1.4762E+003 TwH29 0.864 75.655 4.7374E+002 1.5460E+003 1.3314E+003 TwH30 0.894 78.309 4.1828E+002 1.4304E+003 1.1873E+003 TwH31 0.924 80.964 3.7197E+002 1.3479E+003 1.0365E+003 TwH32 0.955 83.618 3.3748E+002 1.3019E+003 8.7113E+002 TwH33 0.985 86.273 3.1608E+002 1.2960E+003 6.9104E+002 YawBr 1.000 87.600 3.1114E+002 1.3063E+003 6.1050E+002
58 This report is available at no cost from the National Renewable
Energy Laboratory at www.nrel.gov/publications

Table 33. Damage Equivalent Fatigue Moments for All Tower Nodes for the Optimized 100-m/s High-Solidity Rotor Design
Node Height Fraction Height TwrBsMxt TwrBsMyt TwrBsMMxy (-) (-) (m) (kN·m) (kN·m) (kN·m)
TwrBs 0.000 0.000 2.2673E+003 7.2287E+003 7.2021E+003 TwH01 0.015 1.327 2.2219E+003 7.0933E+003 7.0667E+003 TwH02 0.045 3.982 2.1352E+003 6.8250E+003 6.8070E+003 TwH03 0.076 6.636 2.0470E+003 6.5572E+003 6.5446E+003 TwH04 0.106 9.291 1.9603E+003 6.2958E+003 6.2841E+003 TwH05 0.136 11.945 1.8733E+003 6.0388E+003 6.0260E+003 TwH06 0.167 14.600 1.7869E+003 5.7830E+003 5.7656E+003 TwH07 0.197 17.255 1.7001E+003 5.5318E+003 5.5178E+003 TwH08 0.227 19.909 1.6151E+003 5.2855E+003 5.2638E+003 TwH09 0.258 22.564 1.5338E+003 5.0439E+003 5.0219E+003 TwH10 0.288 25.218 1.4554E+003 4.8000E+003 4.7785E+003 TwH11 0.318 27.873 1.3832E+003 4.5689E+003 4.5488E+003 TwH12 0.348 30.527 1.3212E+003 4.3592E+003 4.3426E+003 TwH13 0.379 33.182 1.2703E+003 4.1712E+003 4.1550E+003 TwH14 0.409 35.836 1.2197E+003 3.9979E+003 3.9812E+003 TwH15 0.439 38.491 1.1704E+003 3.8284E+003 3.8121E+003 TwH16 0.470 41.145 1.1195E+003 3.6576E+003 3.6407E+003 TwH17 0.500 43.800 1.0690E+003 3.4968E+003 3.4724E+003 TwH18 0.530 46.455 1.0175E+003 3.3360E+003 3.3041E+003 TwH19 0.561 49.109 9.6522E+002 3.1716E+003 3.1445E+003 TwH20 0.591 51.764 9.1202E+002 3.0038E+003 2.9826E+003 TwH21 0.621 54.418 8.5785E+002 2.8441E+003 2.8129E+003 TwH22 0.652 57.073 8.0329E+002 2.6866E+003 2.6505E+003 TwH23 0.682 59.727 7.4826E+002 2.5311E+003 2.4915E+003 TwH24 0.712 62.382 6.8981E+002 2.3795E+003 2.3322E+003 TwH25 0.742 65.036 6.3156E+002 2.2327E+003 2.1772E+003 TwH26 0.773 67.691 5.7239E+002 2.0837E+003 2.0217E+003 TwH27 0.803 70.345 5.1280E+002 1.9452E+003 1.8605E+003 TwH28 0.833 73.000 4.5373E+002 1.8164E+003 1.7075E+003 TwH29 0.864 75.655 3.9629E+002 1.7026E+003 1.5531E+003 TwH30 0.894 78.309 3.4191E+002 1.6116E+003 1.3992E+003 TwH31 0.924 80.964 2.9551E+002 1.5387E+003 1.2340E+003 TwH32 0.955 83.618 2.5933E+002 1.5031E+003 1.0469E+003 TwH33 0.985 86.273 2.3815E+002 1.4950E+003 8.4139E+002 YawBr 1.000 87.600 2.3281E+002 1.5046E+003 7.4724E+002
59 This report is available at no cost from the National Renewable
Energy Laboratory at www.nrel.gov/publications

Table 34. Damage Equivalent Fatigue Moments for All Tower Nodes for the Optimized 100-m/s Low-Solidity Rotor Design
Node Height Fraction Height Mxt Myt MMxy (-) (-) (m) (kN·m) (kN·m) (kN·m)
TwrBs 0.000 0.000 2.0801E+003 6.7515E+003 6.7244E+003 TwH01 0.015 1.327 2.0408E+003 6.6312E+003 6.6052E+003 TwH02 0.045 3.982 1.9616E+003 6.3902E+003 6.3611E+003 TwH03 0.076 6.636 1.8843E+003 6.1523E+003 6.1179E+003 TwH04 0.106 9.291 1.8063E+003 5.9050E+003 5.8770E+003 TwH05 0.136 11.945 1.7272E+003 5.6657E+003 5.6440E+003 TwH06 0.167 14.600 1.6516E+003 5.4317E+003 5.4091E+003 TwH07 0.197 17.255 1.5755E+003 5.1919E+003 5.1735E+003 TwH08 0.227 19.909 1.5001E+003 4.9596E+003 4.9373E+003 TwH09 0.258 22.564 1.4263E+003 4.7349E+003 4.7056E+003 TwH10 0.288 25.218 1.3546E+003 4.5062E+003 4.4801E+003 TwH11 0.318 27.873 1.2873E+003 4.2944E+003 4.2677E+003 TwH12 0.348 30.527 1.2279E+003 4.0987E+003 4.0738E+003 TwH13 0.379 33.182 1.1764E+003 3.9245E+003 3.9002E+003 TwH14 0.409 35.836 1.1288E+003 3.7597E+003 3.7332E+003 TwH15 0.439 38.491 1.0802E+003 3.5960E+003 3.5675E+003 TwH16 0.470 41.145 1.0318E+003 3.4369E+003 3.4066E+003 TwH17 0.500 43.800 9.8451E+002 3.2786E+003 3.2502E+003 TwH18 0.530 46.455 9.3498E+002 3.1250E+003 3.0902E+003 TwH19 0.561 49.109 8.8588E+002 2.9661E+003 2.9348E+003 TwH20 0.591 51.764 8.3583E+002 2.8157E+003 2.7774E+003 TwH21 0.621 54.418 7.8575E+002 2.6619E+003 2.6284E+003 TwH22 0.652 57.073 7.3473E+002 2.5160E+003 2.4748E+003 TwH23 0.682 59.727 6.8316E+002 2.3658E+003 2.3187E+003 TwH24 0.712 62.382 6.3124E+002 2.2216E+003 2.1699E+003 TwH25 0.742 65.036 5.7837E+002 2.0786E+003 2.0169E+003 TwH26 0.773 67.691 5.2531E+002 1.9394E+003 1.8670E+003 TwH27 0.803 70.345 4.7225E+002 1.8126E+003 1.7196E+003 TwH28 0.833 73.000 4.2048E+002 1.6887E+003 1.5693E+003 TwH29 0.864 75.655 3.7084E+002 1.5813E+003 1.4216E+003 TwH30 0.894 78.309 3.2510E+002 1.4872E+003 1.2715E+003 TwH31 0.924 80.964 2.8496E+002 1.4221E+003 1.1103E+003 TwH32 0.955 83.618 2.5399E+002 1.3848E+003 9.2142E+002 TwH33 0.985 86.273 2.3501E+002 1.3757E+003 7.1202E+002 YawBr 1.000 87.600 2.3064E+002 1.3843E+003 6.2877E+002
60 This report is available at no cost from the National Renewable
Energy Laboratory at www.nrel.gov/publications

Table 35. Damage Equivalent Fatigue Moments for All Tower Nodes for the Optimized Flexible Low-Solidity 100-m/s Rotor Design
Node Height Fraction Height Mxt Myt MMxy (-) (-) (m) (kN·m) (kN·m) (kN·m)
TwrBs 0.000 0.000 2.0886E+003 6.3821E+003 6.3682E+003 TwH01 0.015 1.327 2.0492E+003 6.2681E+003 6.2538E+003 TwH02 0.045 3.982 1.9674E+003 6.0424E+003 6.0290E+003 TwH03 0.076 6.636 1.8881E+003 5.8080E+003 5.7962E+003 TwH04 0.106 9.291 1.8070E+003 5.5755E+003 5.5650E+003 TwH05 0.136 11.945 1.7288E+003 5.3469E+003 5.3328E+003 TwH06 0.167 14.600 1.6518E+003 5.1226E+003 5.1063E+003 TwH07 0.197 17.255 1.5741E+003 4.8995E+003 4.8834E+003 TwH08 0.227 19.909 1.4992E+003 4.6786E+003 4.6599E+003 TwH09 0.258 22.564 1.4262E+003 4.4612E+003 4.4476E+003 TwH10 0.288 25.218 1.3543E+003 4.2501E+003 4.2382E+003 TwH11 0.318 27.873 1.2899E+003 4.0479E+003 4.0342E+003 TwH12 0.348 30.527 1.2315E+003 3.8678E+003 3.8495E+003 TwH13 0.379 33.182 1.1792E+003 3.7059E+003 3.6893E+003 TwH14 0.409 35.836 1.1311E+003 3.5528E+003 3.5376E+003 TwH15 0.439 38.491 1.0819E+003 3.3971E+003 3.3799E+003 TwH16 0.470 41.145 1.0348E+003 3.2489E+003 3.2291E+003 TwH17 0.500 43.800 9.8777E+002 3.0980E+003 3.0775E+003 TwH18 0.530 46.455 9.3947E+002 2.9572E+003 2.9383E+003 TwH19 0.561 49.109 8.8965E+002 2.8052E+003 2.7882E+003 TwH20 0.591 51.764 8.4028E+002 2.6582E+003 2.6374E+003 TwH21 0.621 54.418 7.8958E+002 2.5174E+003 2.4899E+003 TwH22 0.652 57.073 7.3889E+002 2.3684E+003 2.3462E+003 TwH23 0.682 59.727 6.8700E+002 2.2295E+003 2.1969E+003 TwH24 0.712 62.382 6.3481E+002 2.0878E+003 2.0498E+003 TwH25 0.742 65.036 5.8159E+002 1.9438E+003 1.9026E+003 TwH26 0.773 67.691 5.2774E+002 1.8100E+003 1.7601E+003 TwH27 0.803 70.345 4.7509E+002 1.6797E+003 1.6195E+003 TwH28 0.833 73.000 4.2300E+002 1.5583E+003 1.4786E+003 TwH29 0.864 75.655 3.7360E+002 1.4422E+003 1.3363E+003 TwH30 0.894 78.309 3.2692E+002 1.3450E+003 1.1960E+003 TwH31 0.924 80.964 2.8621E+002 1.2675E+003 1.0510E+003 TwH32 0.955 83.618 2.5547E+002 1.2204E+003 8.8745E+002 TwH33 0.985 86.273 2.3639E+002 1.1984E+003 6.9489E+002 YawBr 1.000 87.600 2.3149E+002 1.2004E+003 6.0040E+002
61 This report is available at no cost from the National Renewable
Energy Laboratory at www.nrel.gov/publications

A.3 Extreme Tower Loads
The forces and moments at the top of the tower are needed for the tower design. They are measured at the yaw bearing in the tower top coordinates. This coordinate system moves with the tower-top. These forces and moments were extracted from the ultimate strength load cases listed in Table 9 after the appropriate safety factor for each design load case had been applied.
The tables show maximum and minimum observed values for the forces (upper half of table) and moments (lower half of table) across all of the ultimate loads cases. Information about a specific simulation is contained within the file name. For example, the file name DLC6.2a_0080_Land_47.50V0_020ny_S04.out indicates the design load case (DLC 6.2), simulation number within the load case (80), nominal wind speed (47.5 m/s at hub height), nacelle yaw (20-degrees), and the seed number of the wind file used (04). The highlighted numbers indicate the maximum for that particular FAST parameter. The other numbers on a given row indicate the instantaneous value of the other parameters at the time of the maximum or minimum.
Table 36. The Maximum and Minimum Forces and Moments at the Yaw Bearing for the Baseline Rotor Design
YawBrFxp YawBrFyp YawBrFzp YawBrFMxy YawBrMxp YawBrMyp YawBrMzp YawBrMMxy WindVxi Time
Parameter Type File Name (kN) (kN) (kN) (kN) (kN·m) (kN·m) (kN·m) (kN·m) (m/s) (s)
YawBrFxp Minimum DLC2.3_0003_Land_EOGR-2.0_S03.out - 1.1638E+03 2.6081E+01 - 3.6663E+03 1.1641E+03 - 1.4652E+03 - 2.3760E+03 - 1.1979E+03 2.7914E+03 8.28 67.65
YawBrFxp Maximum DLC1.3_0043_18.0V0_S01.out 1.4378E+03 - 1.9143E+01 - 4.7075E+03 1.4379E+03 6.1790E+03 2.3085E+03 1.4108E+03 6.5961E+03 14.22 316.75
YawBrFyp Minimum DLC6.2a_0064_Land_47.5V0_020ny_S04.out 3.6938E+02 - 1.2650E+03 - 3.1790E+03 1.3178E+03 4.1866E+03 - 4.9643E+02 9.3159E+03 4.2159E+03 70.37 2089.80
YawBrFyp Maximum DLC6.2a_0080_Land_47.5V0_340ny_S05.out 3.6190E+02 1.1220E+03 - 3.4463E+03 1.1789E+03 - 1.5290E+03 5.5308E+03 - 4.3978E+03 5.7383E+03 54.49 3616.85
YawBrFzp Minimum DLC1.1_0028_Land_12.0V0_S04.out 1.1046E+03 4.6995E+01 - 5.3400E+03 1.1056E+03 6.6945E+03 2.3175E+03 5.8665E+03 7.0843E+03 9.78 461.95
YawBrFzp Maximum DLC6.2a_0063_Land_47.5V0_000ny_S04.out 1.3376E+02 9.5942E+01 - 2.9205E+03 1.6461E+02 - 1.7446E+02 6.6000E+03 1.5092E+03 6.6023E+03 67.89 2089.95
YawBrFMxy Minimum DLC6.2a_0099_Land_47.5V0_000ny_S06.out - 2.8677E-03 1.2958E-01 - 3.4661E+03 1.2961E-01 5.5418E+02 1.2210E+03 5.2503E+02 1.3409E+03 41.55 2831.40
YawBrFMxy Maximum DLC1.3_0043_18.0V0_S01.out 1.4378E+03 - 1.9143E+01 - 4.7075E+03 1.4379E+03 6.1790E+03 2.3085E+03 1.4108E+03 6.5961E+03 14.22 316.75
YawBrMxp Minimum DLC6.1a_0007_Land_47.5V0_352ny_S03.out 2.4408E+02 4.9761E+02 - 4.2674E+03 5.5425E+02 - 2.8769E+03 2.4017E+03 - 1.9670E+03 3.7476E+03 46.18 1358.25
YawBrMxp Maximum DLC1.1_0055_Land_22.0V0_S01.out 6.1515E+02 - 5.0895E+01 - 5.3220E+03 6.1725E+02 8.4375E+03 3.5670E+03 1.0658E+04 9.1605E+03 16.39 520.80
YawBrMyp Minimum DLC7.1a_0001_Land_38.0V0_352ny_S01.out 5.8234E+02 1.5862E+02 - 3.4925E+03 6.0356E+02 - 1.6500E+03 - 1.3189E+04 2.4750E+03 1.3292E+04 54.02 3309.65
YawBrMyp Maximum DLC1.3_0063_24.0V0_S03.out 4.1256E+02 - 8.7318E+01 - 4.6629E+03 4.2170E+02 5.0531E+03 1.6092E+04 - 4.0568E+03 1.6867E+04 28.80 398.25
YawBrMzp Minimum DLC1.3_0063_24.0V0_S03.out 1.6268E+02 1.0836E+02 - 4.4348E+03 1.9546E+02 2.8377E+03 1.4526E+03 - 1.5026E+04 3.1879E+03 32.40 339.60
YawBrMzp Maximum DLC1.3_0039_16.0V0_S03.out 1.2871E+03 8.6481E+01 - 4.8128E+03 1.2900E+03 7.2927E+03 3.6086E+02 1.2590E+04 7.3016E+03 12.98 594.30
YawBrMMxy Minimum DLC2.3_0013_Land_EOGO_S01.out 1.6588E+02 8.3622E+00 - 3.6685E+03 1.6609E+02 - 2.4200E+00 - 8.7252E-02 1.4806E+02 2.4216E+00 24.76 76.95
YawBrMMxy Maximum DLC1.1_0063_Land_24.0V0_S03.out 3.7545E+02 - 1.3725E+02 - 5.2215E+03 3.9975E+02 7.1355E+03 1.5465E+04 1.4897E+03 1.7032E+04 22.83 61.90
Table 37. The Maximum and Minimum Forces and Moments at the Yaw Bearing for the 80-m/s Rotor Design
YawBrFxp YawBrFyp YawBrFzp YawBrFMxy YawBrMxp YawBrMyp YawBrMzp YawBrMMxy WindVxi Time
Parameter Type File Name (kN) (kN) (kN) (kN) (kN·m) (kN·m) (kN·m) (kN·m) (m/s) (s)
YawBrFxp Minimum DLC2.3_0003_Land_EOGR-2.0_S03.out - 1.0044E+03 8.7945E+00 - 3.6465E+03 1.0044E+03 - 1.7688E+03 - 5.2151E+03 - 2.3034E+03 5.5069E+03 9.10 67.10
YawBrFxp Maximum DLC1.3_0043_18.0V0_S01.out 1.3527E+03 1.6200E+01 - 4.6845E+03 1.3528E+03 6.2262E+03 3.9771E+03 4.2930E+03 7.3880E+03 13.48 316.25
YawBrFyp Minimum DLC6.2a_0010_Land_47.5V0_020ny_S01.out 3.0921E+02 - 1.3145E+03 - 3.4496E+03 1.3504E+03 3.8313E+03 - 2.7863E+03 6.1600E+03 4.7373E+03 61.75 174.40
YawBrFyp Maximum DLC6.2a_0062_Land_47.5V0_340ny_S04.out 4.1448E+02 1.1110E+03 - 3.4639E+03 1.1858E+03 - 6.6550E+02 5.3064E+03 - 4.4363E+03 5.3480E+03 66.70 2089.40
YawBrFzp Minimum DLC1.1_0028_Land_12.0V0_S04.out 9.1755E+02 1.7595E+00 - 5.2050E+03 9.1755E+02 6.5595E+03 3.5070E+03 9.1275E+03 7.4382E+03 10.36 464.95
YawBrFzp Maximum DLC6.2a_0010_Land_47.5V0_020ny_S01.out 1.7314E+02 - 6.0159E+02 - 2.8446E+03 6.2601E+02 1.1605E+03 1.5246E+03 7.2523E+03 1.9160E+03 66.52 1757.35
YawBrFMxy Minimum DLC6.2a_0099_Land_47.5V0_000ny_S06.out - 4.8708E-02 5.2459E-02 - 3.4001E+03 7.1585E-02 - 2.6807E+01 1.4927E+03 9.0398E+02 1.4929E+03 35.78 2196.65
YawBrFMxy Maximum DLC1.3_0043_18.0V0_S01.out 1.3527E+03 1.6200E+01 - 4.6845E+03 1.3528E+03 6.2262E+03 3.9771E+03 4.2930E+03 7.3880E+03 13.48 316.25
YawBrMxp Minimum DLC6.1a_0001_Land_47.5V0_352ny_S01.out 5.4878E+01 5.9063E+02 - 4.0932E+03 5.9317E+02 - 3.0807E+03 3.8084E+03 - 2.9363E+03 4.8984E+03 55.36 1636.10
YawBrMxp Maximum DLC1.1_0063_Land_24.0V0_S03.out 6.9435E+02 - 1.9995E+00 - 5.1825E+03 6.9435E+02 8.1765E+03 - 1.1719E+03 5.4090E+03 8.2601E+03 16.87 364.15
YawBrMyp Minimum DLC7.1a_0001_Land_38.0V0_352ny_S01.out 5.3757E+02 1.3409E+02 - 3.4364E+03 5.5404E+02 - 1.5389E+03 - 1.1088E+04 1.4410E+03 1.1194E+04 54.03 3309.45
YawBrMyp Maximum DLC1.3_0065_24.0V0_S05.out 2.9471E+02 - 1.0874E+02 - 4.4658E+03 3.1413E+02 5.4027E+03 1.6349E+04 - 1.2687E+03 1.7218E+04 29.01 70.70
YawBrMzp Minimum DLC1.3_0063_24.0V0_S03.out 2.5690E+02 7.8165E+01 - 4.3511E+03 2.6853E+02 3.3696E+03 1.6646E+03 - 1.5039E+04 3.7583E+03 32.51 339.30
YawBrMzp Maximum DLC1.3_0063_24.0V0_S03.out 5.9414E+02 - 1.9940E+02 - 4.7075E+03 6.2670E+02 7.1321E+03 6.8918E+03 1.0839E+04 9.9178E+03 18.57 273.55
YawBrMMxy Minimum DLC6.2a_0091_Land_47.5V0_200ny_S06.out 1.6841E+02 - 2.4024E+02 - 3.6773E+03 2.9339E+02 7.7572E-01 - 3.3407E+00 - 1.7391E+03 3.4296E+00 46.00 1956.10
YawBrMMxy Maximum DLC1.3_0065_24.0V0_S05.out 2.9471E+02 - 1.0874E+02 - 4.4658E+03 3.1413E+02 5.4027E+03 1.6349E+04 - 1.2687E+03 1.7218E+04 29.01 70.70
62 This report is available at no cost from the National Renewable
Energy Laboratory at www.nrel.gov/publications

Table 38. The Maximum and Minimum Forces and Moments at the Yaw Bearing for the High-Solidity 100-m/s Rotor Design
YawBrFxp YawBrFyp YawBrFzp YawBrFMxy YawBrMxp YawBrMyp YawBrMzp YawBrMMxy WindVxi Time
Parameter Type File Name (kN) (kN) (kN) (kN) (kN·m) (kN·m) (kN·m) (kN·m) (m/s) (s)
YawBrFxp Minimum DLC2.3_0005_Land_EOGR-2.0_S05.out - 1.4036E+03 1.9536E+01 - 3.6168E+03 1.4037E+03 - 1.6137E+03 - 4.4638E+03 - 4.1756E+03 4.7465E+03 9.3090E+00 7.0950E+01
YawBrFxp Maximum DLC1.3_0042_16.0V0_S06.out 1.5647E+03 - 6.6434E+00 - 4.6278E+03 1.5647E+03 4.3160E+03 - 5.4689E+02 - 5.9643E+03 4.3505E+03 1.7840E+01 2.0245E+02
YawBrFyp Minimum DLC6.2a_0100_Land_47.5V0_020ny_S06.out 2.7621E+02 - 1.2617E+03 - 3.4243E+03 1.2916E+03 4.2922E+03 - 2.7478E+03 6.7034E+03 5.0964E+03 6.2460E+01 1.2375E+03
YawBrFyp Maximum DLC6.2a_0080_Land_47.5V0_340ny_S05.out 3.4584E+02 1.0473E+03 - 3.3792E+03 1.1029E+03 - 7.6076E+02 5.6925E+03 - 4.3934E+03 5.7431E+03 5.4490E+01 3.6169E+03
YawBrFzp Minimum DLC1.1_0031_Land_14.0V0_S01.out 1.3083E+03 - 1.7775E+01 - 5.2395E+03 1.3084E+03 5.7180E+03 3.1260E+03 4.8465E+03 6.5167E+03 1.0330E+01 3.1005E+02
YawBrFzp Maximum DLC6.2a_0100_Land_47.5V0_020ny_S06.out 2.2143E+02 - 4.5100E+02 - 2.9282E+03 5.0243E+02 9.1740E+02 1.7347E+03 6.6121E+03 1.9623E+03 5.4670E+01 7.3855E+02
YawBrFMxy Minimum DLC1.3_0001_04.0V0_S01.out - 8.3200E-02 6.6690E-02 - 4.5509E+03 1.0663E-01 7.8313E+01 1.1702E+02 9.2273E+02 1.4081E+02 2.1490E+00 2.2950E+02
YawBrFMxy Maximum DLC1.3_0042_16.0V0_S06.out 1.5647E+03 - 6.6434E+00 - 4.6278E+03 1.5647E+03 4.3160E+03 - 5.4689E+02 - 5.9643E+03 4.3505E+03 1.7840E+01 2.0245E+02
YawBrMxp Minimum DLC6.1a_0013_Land_47.5V0_352ny_S05.out 1.9062E+02 7.9650E+02 - 4.1161E+03 8.1899E+02 - 2.4030E+03 3.8003E+03 - 1.8455E+03 4.4963E+03 4.5800E+01 3.2306E+03
YawBrMxp Maximum DLC1.1_0055_Land_22.0V0_S01.out 8.8860E+02 - 6.4155E+01 - 5.2200E+03 8.9091E+02 6.6240E+03 3.6975E+03 9.8175E+03 7.5861E+03 1.8510E+01 5.2140E+02
YawBrMyp Minimum DLC1.3_0046_18.0V0_S04.out 7.0281E+02 6.2154E+01 - 4.6265E+03 7.0555E+02 5.2070E+03 - 1.2438E+04 2.8701E+03 1.3484E+04 1.1770E+01 3.8770E+02
YawBrMyp Maximum DLC1.3_0063_24.0V0_S03.out 2.2788E+02 - 1.9494E+02 - 4.3497E+03 2.9988E+02 4.2134E+03 1.8225E+04 - 6.1209E+03 1.8706E+04 3.1840E+01 5.2925E+02
YawBrMzp Minimum DLC1.3_0063_24.0V0_S03.out 1.8104E+02 5.9616E+01 - 4.3781E+03 1.9060E+02 2.2532E+03 1.0051E+03 - 1.5485E+04 2.4672E+03 3.2040E+01 3.3975E+02
YawBrMzp Maximum DLC1.3_0039_16.0V0_S03.out 1.0733E+03 5.8239E+00 - 4.7129E+03 1.0733E+03 5.5053E+03 1.0541E+03 1.4121E+04 5.6053E+03 1.3910E+01 5.9250E+02
YawBrMMxy Minimum DLC1.3_0006_04.0V0_S06.out 1.1457E+02 - 9.8510E+00 - 4.5549E+03 1.1500E+02 1.3029E+00 6.1533E-01 - 1.5471E+03 1.4409E+00 2.6200E+00 4.9375E+02
YawBrMMxy Maximum DLC1.3_0063_24.0V0_S03.out 5.2677E+02 - 2.7877E+02 - 4.3497E+03 5.9599E+02 4.9383E+03 1.8158E+04 - 4.1499E+03 1.8817E+04 3.4170E+01 5.3050E+02
Table 39. The Maximum and Minimum Forces and Moments at the Yaw Bearing for the Low-Solidity 100-m/s Rotor Design
YawBrFxp YawBrFyp YawBrFzp YawBrFMxy YawBrMxp YawBrMyp YawBrMzp YawBrMMxy WindVxi Time
Parameter Type File Name (kN) (kN) (kN) (kN) (kN·m) (kN·m) (kN·m) (kN·m) (m/s) (s)
YawBrFxp Minimum DLC2.3_0005_Land_EOGR-2.0_S05.out - 1.2870E+03 3.4694E+01 - 3.6905E+03 1.2875E+03 - 1.2320E+03 - 6.1061E+03 - 3.1163E+03 6.2291E+03 9.31 70.95
YawBrFxp Maximum DLC1.3_0046_18.0V0_S04.out 1.5039E+03 - 1.0406E+02 - 4.6953E+03 1.5075E+03 4.9666E+03 4.3214E+03 - 5.4823E+02 6.5834E+03 16.14 147.15
YawBrFyp Minimum DLC6.2a_0010_Land_47.5V0_020ny_S01.out 2.5740E+02 - 1.0947E+03 - 3.4045E+03 1.1246E+03 3.7653E+03 - 1.5466E+03 7.2776E+03 4.0706E+03 64.87 1757.45
YawBrFyp Maximum DLC6.2a_0062_Land_47.5V0_340ny_S04.out 2.8193E+02 1.0432E+03 - 3.4947E+03 1.0807E+03 - 1.8414E+03 3.3308E+03 - 3.4826E+03 3.8059E+03 69.85 2089.70
YawBrFzp Minimum DLC1.1_0028_Land_12.0V0_S04.out 1.0273E+03 - 1.6740E+00 - 5.3025E+03 1.0274E+03 5.6595E+03 3.8925E+03 9.0780E+03 6.8689E+03 10.07 464.10
YawBrFzp Maximum DLC6.2a_0027_Land_47.5V0_000ny_S02.out 3.8500E+01 9.2774E+01 - 3.0393E+03 1.0045E+02 3.9545E+02 3.7433E+03 2.2572E+03 3.7641E+03 60.39 1488.80
YawBrFMxy Minimum DLC6.2a_0081_Land_47.5V0_000ny_S05.out 5.7783E-02 1.1429E-01 - 3.4639E+03 1.2807E-01 1.4696E+02 2.8996E+02 - 6.5604E+02 3.2508E+02 46.28 2331.10
YawBrFMxy Maximum DLC1.3_0046_18.0V0_S04.out 1.5039E+03 - 1.0406E+02 - 4.6953E+03 1.5075E+03 4.9666E+03 4.3214E+03 - 5.4823E+02 6.5834E+03 16.14 147.15
YawBrMxp Minimum DLC2.3_0016_Land_EOGO_S04.out - 9.2059E+02 5.1117E+01 - 3.6597E+03 9.2201E+02 - 2.1395E+03 - 6.1479E+03 - 8.1477E+03 6.5095E+03 22.54 67.85
YawBrMxp Maximum DLC1.1_0055_Land_22.0V0_S01.out 8.6445E+02 - 7.8540E+01 - 5.2710E+03 8.6801E+02 6.5340E+03 1.8840E+03 9.1890E+03 6.8002E+03 17.51 521.25
YawBrMyp Minimum DLC1.3_0046_18.0V0_S04.out 6.8769E+02 6.8850E+01 - 4.6791E+03 6.9113E+02 5.1800E+03 - 1.1591E+04 3.2940E+03 1.2696E+04 11.77 387.70
YawBrMyp Maximum DLC1.3_0065_24.0V0_S05.out 4.7385E+02 - 4.6778E+01 - 4.5779E+03 4.7615E+02 4.5671E+03 1.5363E+04 - 2.3153E+02 1.6027E+04 29.74 70.60
YawBrMzp Minimum DLC1.3_0063_24.0V0_S03.out 2.8296E+02 2.8850E+01 - 4.4483E+03 2.8443E+02 2.2748E+03 1.5525E+02 - 1.3811E+04 2.2800E+03 33.39 339.45
YawBrMzp Maximum DLC1.3_0039_16.0V0_S03.out 8.9640E+02 4.1972E+00 - 4.7480E+03 8.9641E+02 5.6984E+03 1.0360E+03 1.1939E+04 5.7918E+03 9.59 590.70
YawBrMMxy Minimum DLC6.1a_0012_Land_47.5V0_008ny_S04.out - 1.5674E+01 1.1791E+01 - 4.2849E+03 1.9613E+01 5.2191E-01 - 7.2265E-02 6.7986E+02 5.2689E-01 45.82 445.45
YawBrMMxy Maximum DLC1.3_0065_24.0V0_S05.out 4.6399E+02 - 4.0000E+01 - 4.5981E+03 4.6572E+02 4.7480E+03 1.5350E+04 3.6274E+02 1.6067E+04 29.58 70.65
Table 40. The Maximum and Minimum Forces and Moments at the Yaw Bearing for the Flexible Low-Solidity 100-m/s Rotor Design
YawBrFxp YawBrFyp YawBrFzp YawBrFMxy YawBrMxp YawBrMyp YawBrMzp YawBrMMxy WindVxi Time
Parameter Type File Name (kN) (kN) (kN) (kN) (kN·m) (kN·m) (kN·m) (kN·m) (m/s) (s)
YawBrFxp Minimum DLC2.3_0003_Land_EOGR-2.0_S03.out - 1.1990E+03 3.2065E+01 - 3.5497E+03 1.1994E+03 - 1.2221E+03 - 2.0900E+03 - 8.8627E+02 2.4211E+03 8.50 67.45
YawBrFxp Maximum DLC1.1_0040_Land_16.0V0_S04.out 1.3848E+03 - 9.6195E+00 - 5.0670E+03 1.3848E+03 4.3905E+03 2.1000E+03 3.8205E+03 4.8669E+03 14.45 352.20
YawBrFyp Minimum DLC6.2a_0010_Land_47.5V0_020ny_S01.out 2.2099E+02 - 1.1121E+03 - 3.4155E+03 1.1338E+03 3.8511E+03 - 2.2462E+03 6.0731E+03 4.4583E+03 65.56 1757.50
YawBrFyp Maximum DLC6.2a_0062_Land_47.5V0_340ny_S04.out 2.7731E+02 1.0008E+03 - 3.3781E+03 1.0385E+03 - 1.4355E+03 4.4044E+03 - 2.9986E+03 4.6324E+03 67.40 2089.65
YawBrFzp Minimum DLC1.1_0028_Land_12.0V0_S04.out 9.9360E+02 5.3100E+01 - 5.1525E+03 9.9502E+02 5.1945E+03 4.8600E+03 6.7290E+03 7.1135E+03 10.97 464.30
YawBrFzp Maximum DLC6.2a_0027_Land_47.5V0_000ny_S02.out 6.7254E+01 5.5264E+01 - 2.9227E+03 8.7047E+01 5.9378E+02 4.0513E+03 2.2506E+03 4.0946E+03 60.39 1488.80
YawBrFMxy Minimum DLC6.2a_0099_Land_47.5V0_000ny_S06.out 2.7940E-02 - 8.5591E-02 - 3.3110E+03 9.0036E-02 1.7886E+02 1.6115E+03 9.1993E+02 1.6214E+03 50.95 1682.65
YawBrFMxy Maximum DLC1.1_0040_Land_16.0V0_S04.out 1.3848E+03 - 9.6195E+00 - 5.0670E+03 1.3848E+03 4.3905E+03 2.1000E+03 3.8205E+03 4.8669E+03 14.45 352.20
YawBrMxp Minimum DLC2.3_0016_Land_EOGO_S04.out - 7.8485E+02 4.5408E+01 - 3.5442E+03 7.8616E+02 - 2.2781E+03 - 4.2768E+03 - 7.2105E+03 4.8457E+03 22.50 67.90
YawBrMxp Maximum DLC1.1_0060_Land_22.0V0_S06.out 6.9420E+02 - 1.9965E+02 - 5.1105E+03 7.2234E+02 6.6090E+03 6.4785E+03 7.7220E+03 9.2547E+03 15.81 422.20
YawBrMyp Minimum DLC1.4_0007_Land_ECD+R.out 9.7443E+02 - 3.4871E+01 - 4.4685E+03 9.7505E+02 2.7675E+03 - 9.6025E+03 - 1.5984E+03 9.9934E+03 11.80 73.40
YawBrMyp Maximum DLC1.3_0065_24.0V0_S05.out 3.8570E+02 - 1.6024E+01 - 4.4321E+03 3.8603E+02 4.6386E+03 1.5309E+04 8.8843E+02 1.5996E+04 29.74 70.60
YawBrMzp Minimum DLC1.3_0063_24.0V0_S03.out 3.0078E+02 - 6.8809E+00 - 4.3605E+03 3.0086E+02 2.5799E+03 1.0876E+03 - 1.2909E+04 2.7997E+03 33.39 339.45
YawBrMzp Maximum DLC1.3_0039_16.0V0_S03.out 9.4973E+02 9.2650E+00 - 4.6346E+03 9.4977E+02 4.4388E+03 2.8769E+03 1.1000E+04 5.2895E+03 16.26 592.00
YawBrMMxy Minimum DLC6.2a_0077_Land_47.5V0_280ny_S05.out 6.5802E+01 3.2835E+01 - 3.5882E+03 7.3539E+01 - 1.3079E+00 3.1658E-01 - 1.1605E+03 1.3457E+00 36.28 2015.65
YawBrMMxy Maximum DLC1.3_0065_24.0V0_S05.out 3.8570E+02 - 1.6024E+01 - 4.4321E+03 3.8603E+02 4.6386E+03 1.5309E+04 8.8843E+02 1.5996E+04 29.74 70.60
63 This report is available at no cost from the National Renewable
Energy Laboratory at www.nrel.gov/publications

A.4 Low-Speed Shaft Loads
The loads on the LSS are taken from the ultimate strength design load cases listed in Table 9. The tables list the forces and moments in all three axes within the nonrotating shaft coordinate system. The moments are defined at the location of the LSS gauge (LSSGag), which is located 1.912 m from the rotor apex towards the nacelle. The rotor apex is defined as the intersection of the LSS with the blade centerlines. The combined moment about the shaft x and y axes (LSSGagMMyz) is also reported, which is calculated at each time-step prior to post-processing as the square root of the squares of the moments LSSGagMys and LSSGagMyz. The values reported in the tables are the maximum values after the application of the safety factors listed in Table 9. For each force or moment of interest, the maximum and minimum loads are reported along with the instantaneous values of all the other forces or moments. The wind-speed in the x direction (WindVxi) and time are also reported along with the name of the simulation in which they occur. These values were used in the design of the gearbox and tower.
Table 41. Maximum and Minimum Moments and Forces Acting on the LSS for the Baseline Rotor Design
RotThrust LSShftFys LSShftFzs RotTorq LSSGagMys LSSGagMzs LSSGagMMyz WindVxi Time
Parameter Type File Name (kN) (kN) (kN) (kN·m) (kN·m) (kN·m) (kN·m) (m/s) (s)
RotThrust Minimum DLC2.3_0003_Land_EOGR-2.0_S03.out - 8.9419E+02 1.9063E+00 - 1.1660E+03 - 1.4234E+03 - 1.6753E+03 - 1.3849E+03 2.1736E+03 8.240 67.700
RotThrust Maximum DLC1.3_0042_16.0V0_S06.out 1.5066E+03 - 3.1779E+00 - 1.4742E+03 6.1155E+03 - 5.3798E+02 9.0207E+02 1.0503E+03 12.250 472.100
LSShftFys Minimum DLC6.2a_0010_Land_47.5V0_020ny_S01.out - 5.2217E+00 - 1.0940E+03 - 8.5569E+02 1.1242E+03 - 8.0729E+03 6.6132E+03 1.0436E+04 61.690 2420.850
LSShftFys Maximum DLC6.2a_0061_Land_47.5V0_320ny_S04.out 7.8848E+01 1.1198E+03 - 8.6416E+02 - 1.0360E+03 1.0786E+03 - 3.1350E+03 3.3153E+03 64.730 1593.600
LSShftFzs Minimum DLC1.1_0064_Land_24.0V0_S04.out 5.8140E+02 - 2.7045E+01 - 1.7610E+03 6.1770E+03 - 1.7940E+03 4.7760E+03 5.1018E+03 23.970 178.650
LSShftFzs Maximum DLC6.1a_0018_Land_47.5V0_008ny_S06.out 3.1887E+01 - 4.6548E+02 - 3.1333E+02 9.0760E+01 - 1.7861E+03 6.9809E+03 7.2057E+03 54.720 527.000
RotTorq Minimum DLC2.3_0015_Land_EOGO_S03.out - 5.8080E+02 - 8.7076E+01 - 1.0491E+03 - 2.2539E+03 2.0636E+03 - 5.4318E+03 5.8106E+03 27.390 66.450
RotTorq Maximum DLC1.1_0063_Land_24.0V0_S03.out 6.4770E+02 - 8.6250E+00 - 1.4544E+03 7.8360E+03 3.1335E+02 - 9.5790E+03 9.5841E+03 24.540 465.250
LSSGagMys Minimum DLC7.1a_0001_Land_38.0V0_352ny_S01.out 5.9961E+02 1.8678E+02 - 8.4271E+02 3.3077E+02 - 1.6665E+04 2.8963E+03 1.6915E+04 53.090 3309.700
LSSGagMys Maximum DLC1.3_0063_24.0V0_S03.out 2.5448E+02 - 1.7915E+02 - 1.3648E+03 4.9424E+03 1.4054E+04 - 5.4041E+03 1.5057E+04 24.120 399.800
LSSGagMzs Minimum DLC1.3_0063_24.0V0_S03.out 3.0051E+02 4.3227E+01 - 1.2381E+03 4.3268E+03 - 1.0552E+03 - 1.4607E+04 1.4645E+04 32.400 339.600
LSSGagMzs Maximum DLC1.3_0039_16.0V0_S03.out 1.3622E+03 4.0257E+01 - 1.5133E+03 6.3477E+03 - 3.5087E+03 1.3133E+04 1.3593E+04 12.980 594.300
LSSGagMMyz Minimum DLC6.2a_0045_Land_47.5V0_000ny_S03.out 1.4245E+02 1.4509E+02 - 7.9024E+02 7.4789E+01 - 1.0982E+00 - 2.0834E+00 2.3551E+00 53.160 2952.250
LSSGagMMyz Maximum DLC7.1a_0003_Land_38.0V0_008ny_S01.out 6.8673E+02 - 2.7258E+02 - 8.6317E+02 - 2.2055E+02 - 1.0096E+04 - 1.4212E+04 1.7433E+04 51.530 3326.950
Table 42. Maximum and Minimum Moments and Forces Acting on the LSS for the Optimized 80-m/s Rotor Design
RotThrust LSShftFys LSShftFzs RotTorq LSSGagMys LSSGagMzs LSSGagMMyz WindVxi Time
Parameter Type File Name (kN) (kN) (kN) (kN·m) (kN·m) (kN·m) (kN·m) (m/s) (s)
RotThrust Minimum DLC2.3_0003_Land_EOGR-2.0_S03.out - 6.8728E+02 - 2.1670E+01 - 1.1033E+03 - 1.4828E+03 - 1.9899E+03 - 1.6786E+03 2.6033E+03 9.538 66.900
RotThrust Maximum DLC1.1_0033_Land_14.0V0_S03.out 1.3605E+03 3.9810E+00 - 1.4636E+03 6.4440E+03 - 2.3250E+03 - 1.3234E+03 2.6753E+03 15.040 110.650
LSShftFys Minimum DLC6.2a_0064_Land_47.5V0_020ny_S04.out 4.7762E+00 - 1.0568E+03 - 9.6690E+02 - 5.8399E+02 - 5.2118E+03 5.6837E+03 7.7115E+03 58.510 1582.650
LSShftFys Maximum DLC6.2a_0060_Land_47.5V0_300ny_S04.out 1.8051E+01 1.0160E+03 - 7.8925E+02 - 1.8403E+02 1.0977E+03 - 1.7347E+03 2.0528E+03 67.970 2090.200
LSShftFzs Minimum DLC1.1_0064_Land_24.0V0_S04.out 5.8890E+02 - 5.6010E+01 - 1.6365E+03 6.3000E+03 7.0215E+01 7.0155E+03 7.0159E+03 25.460 436.600
LSShftFzs Maximum DLC6.2a_0010_Land_47.5V0_020ny_S01.out - 1.1737E+01 - 5.7915E+02 - 2.5641E+02 - 2.4750E+02 - 3.0074E+03 5.5506E+03 6.3130E+03 66.520 1757.350
RotTorq Minimum DLC2.3_0013_Land_EOGO_S01.out - 2.0372E+02 - 2.2990E+01 - 1.0260E+03 - 2.4123E+03 2.1978E+03 - 3.2505E+03 3.9238E+03 23.590 61.500
RotTorq Maximum DLC1.1_0061_Land_24.0V0_S01.out 9.3645E+02 2.2395E+01 - 1.5210E+03 8.0400E+03 - 2.8785E+03 5.1375E+02 2.9240E+03 22.210 613.550
LSSGagMys Minimum DLC7.1a_0001_Land_38.0V0_352ny_S01.out 5.6045E+02 1.6544E+02 - 8.0432E+02 3.0151E+02 - 1.4619E+04 1.8854E+03 1.4740E+04 54.030 3309.450
LSSGagMys Maximum DLC1.3_0065_24.0V0_S05.out 4.2579E+02 - 2.1411E+02 - 1.2652E+03 5.2839E+03 1.3689E+04 - 1.7807E+03 1.3804E+04 29.010 70.700
LSSGagMzs Minimum DLC1.3_0063_24.0V0_S03.out 3.5357E+02 8.2782E+01 - 1.1549E+03 4.7966E+03 - 1.2689E+03 - 1.4202E+04 1.4259E+04 32.510 339.300
LSSGagMzs Maximum DLC1.3_0039_16.0V0_S03.out 1.0419E+03 - 2.1654E+00 - 1.4323E+03 5.4446E+03 - 2.4138E+03 1.1279E+04 1.1535E+04 15.650 593.250
LSSGagMMyz Minimum DLC1.1_0044_Land_18.0V0_S02.out 5.2830E+02 - 5.5140E+01 - 1.4874E+03 6.0345E+03 - 2.7990E+00 - 5.9595E-01 2.8617E+00 20.000 569.650
LSSGagMMyz Maximum DLC7.1a_0003_Land_38.0V0_008ny_S01.out 6.0698E+02 - 2.4035E+02 - 8.2687E+02 - 1.5180E+02 - 7.8386E+03 - 1.2683E+04 1.4910E+04 52.670 3326.850
64 This report is available at no cost from the National Renewable
Energy Laboratory at www.nrel.gov/publications

Table 43. Maximum and Minimum Moments and Forces Acting on the LSS for the Optimized High-Solidity 100-m/s Rotor Design
RotThrust LSShftFys LSShftFzs RotTorq LSSGagMys LSSGagMzs LSSGagMMyz WindVxi Time
Parameter Type File Name (kN) (kN) (kN) (kN·m) (kN·m) (kN·m) (kN·m) (m/s) (s)
RotThrust Minimum DLC2.3_0004_Land_EOGR-2.0_S04.out - 9.4875E+02 - 2.4904E+01 - 1.1066E+03 - 1.0492E+03 - 1.5653E+03 - 1.2837E+03 2.0244E+03 8.748 69.050
RotThrust Maximum DLC1.3_0029_12.0V0_S05.out 1.6052E+03 - 2.6487E+01 - 1.3410E+03 4.9748E+03 - 6.3315E+02 - 2.9727E+03 3.0394E+03 16.950 561.150
LSShftFys Minimum DLC6.2a_0064_Land_47.5V0_020ny_S04.out 3.1053E+01 - 1.0177E+03 - 9.1663E+02 - 2.0548E+01 - 5.8619E+03 4.9720E+03 7.6865E+03 58.530 1582.700
LSShftFys Maximum DLC6.2a_0060_Land_47.5V0_300ny_S04.out 2.6081E+01 1.0140E+03 - 8.0058E+02 - 3.6861E+01 1.2485E+03 - 1.6335E+03 2.0560E+03 68.520 2090.150
LSShftFzs Minimum DLC1.1_0063_Land_24.0V0_S03.out 8.6040E+02 1.5585E+01 - 1.6680E+03 5.6685E+03 - 4.0050E+03 8.1000E+03 9.0360E+03 22.170 365.050
LSShftFzs Maximum DLC6.1a_0018_Land_47.5V0_008ny_S06.out 4.8060E+01 - 3.1927E+02 - 3.3264E+02 - 3.7449E+02 - 8.5172E+02 5.4635E+03 5.5294E+03 55.030 526.900
RotTorq Minimum DLC2.3_0013_Land_EOGO_S01.out - 5.6177E+02 - 4.1712E+01 - 1.0330E+03 - 1.8546E+03 2.5168E+03 - 3.9809E+03 4.7098E+03 23.170 61.750
RotTorq Maximum DLC1.1_0063_Land_24.0V0_S03.out 8.3445E+02 - 2.8275E+01 - 1.4854E+03 6.2190E+03 3.1950E+02 - 1.2926E+03 1.3315E+03 18.370 499.000
LSSGagMys Minimum DLC1.3_0030_12.0V0_S06.out 8.7574E+02 2.3503E+01 - 1.3393E+03 3.9339E+03 - 1.5498E+04 - 2.8998E+01 1.5498E+04 10.080 263.150
LSSGagMys Maximum DLC1.3_0065_24.0V0_S05.out 4.1607E+02 - 1.9035E+02 - 1.2829E+03 4.5441E+03 1.5188E+04 - 3.5654E+02 1.5192E+04 28.420 70.850
LSSGagMzs Minimum DLC1.3_0063_24.0V0_S03.out 3.3305E+02 3.4938E+01 - 1.1493E+03 3.6923E+03 - 1.8738E+03 - 1.5066E+04 1.5182E+04 32.040 339.750
LSSGagMzs Maximum DLC1.3_0039_16.0V0_S03.out 1.1883E+03 2.2653E+01 - 1.4337E+03 4.2660E+03 - 2.9984E+03 1.4378E+04 1.4687E+04 13.760 592.550
LSSGagMMyz Minimum DLC6.1a_0016_Land_47.5V0_352ny_S06.out 1.3130E+02 3.8813E+02 - 9.8091E+02 - 1.1962E+02 - 7.6059E-01 - 1.1853E+00 1.4083E+00 51.420 668.400
LSSGagMMyz Maximum DLC1.3_0063_24.0V0_S03.out 4.1648E+02 - 1.9292E+02 - 1.1178E+03 4.3321E+03 1.5161E+04 - 6.2856E+03 1.6412E+04 31.840 529.250
Table 44. Maximum and Minimum Moments and Forces Acting on the LSS for the Optimized Low-Solidity 100-m/s Rotor Design
RotThrust LSShftFys LSShftFzs RotTorq LSSGagMys LSSGagMzs LSSGagMMyz WindVxi Time
Parameter Type File Name (kN) (kN) (kN) (kN·m) (kN·m) (kN·m) (kN·m) (m/s) (s)
RotThrust Minimum DLC2.3_0005_Land_EOGR-2.0_S05.out - 8.6812E+02 3.0811E+00 - 1.1737E+03 - 8.8473E+02 - 2.3859E+03 - 2.7819E+03 3.6649E+03 9.309 70.750
RotThrust Maximum DLC1.3_0042_16.0V0_S06.out 1.4918E+03 - 5.8064E+00 - 1.4486E+03 4.7750E+03 - 6.6177E+02 9.3029E+02 1.1417E+03 12.000 471.850
LSShftFys Minimum DLC6.2a_0010_Land_47.5V0_020ny_S01.out - 5.7200E+00 - 8.8044E+02 - 8.3963E+02 1.8205E+02 - 4.9973E+03 5.1282E+03 7.1604E+03 65.560 1757.500
LSShftFys Maximum DLC6.2a_0060_Land_47.5V0_300ny_S04.out 3.2329E+01 8.6922E+02 - 9.6503E+02 1.5752E+02 - 6.5945E+02 - 1.7424E+03 1.8630E+03 68.520 2090.250
LSShftFzs Minimum DLC1.1_0063_Land_24.0V0_S03.out 7.3095E+02 - 2.4300E+01 - 1.7190E+03 5.2050E+03 - 1.6785E+03 8.0445E+03 8.2177E+03 18.140 366.200
LSShftFzs Maximum DLC6.2a_0027_Land_47.5V0_000ny_S02.out 7.9585E+01 5.7618E+01 - 4.3912E+02 3.0107E+02 1.2364E+02 2.1692E+03 2.1727E+03 62.250 1488.850
RotTorq Minimum DLC2.3_0014_Land_EOGO_S02.out 4.0711E+02 - 3.2670E+01 - 1.1352E+03 - 1.5037E+03 9.4963E+02 - 7.6879E+02 1.2218E+03 24.750 60.250
RotTorq Maximum DLC1.1_0063_Land_24.0V0_S03.out 6.7575E+02 - 2.9445E+01 - 1.4607E+03 6.1845E+03 - 5.2230E+01 - 7.7100E+03 7.7102E+03 25.420 464.900
LSSGagMys Minimum DLC1.3_0030_12.0V0_S06.out 8.7872E+02 5.4972E+01 - 1.4135E+03 3.7301E+03 - 1.4391E+04 - 1.8995E+03 1.4516E+04 10.300 263.100
LSSGagMys Maximum DLC1.3_0065_24.0V0_S05.out 5.6376E+02 - 1.4810E+02 - 1.3608E+03 4.6211E+03 1.2602E+04 9.1854E+01 1.2603E+04 29.580 70.650
LSSGagMzs Minimum DLC1.3_0063_24.0V0_S03.out 3.4546E+02 4.7277E+01 - 1.2284E+03 3.5087E+03 - 2.6406E+03 - 1.3261E+04 1.3521E+04 33.390 339.450
LSSGagMzs Maximum DLC1.3_0039_16.0V0_S03.out 9.7686E+02 7.9745E+00 - 1.4945E+03 4.6886E+03 - 8.9735E+02 1.2312E+04 1.2345E+04 9.621 590.650
LSSGagMMyz Minimum DLC6.1a_0001_Land_47.5V0_352ny_S01.out 8.2728E+01 2.3639E+02 - 9.6809E+02 - 2.2221E+02 9.9968E-03 - 4.2566E-01 4.2577E-01 46.930 904.200
LSSGagMMyz Maximum DLC1.3_0046_18.0V0_S04.out 7.9947E+02 5.5796E+01 - 1.4661E+03 5.0139E+03 - 1.4364E+04 3.8232E+03 1.4864E+04 11.770 387.700
Table 45. Maximum and Minimum Moments and Forces Acting on the LSS for the Optimized Flexible Low-Solidity 100-m/s Rotor Design
RotThrust LSShftFys LSShftFzs RotTorq LSSGagMys LSSGagMzs LSSGagMMyz WindVxi Time
Parameter Type File Name (kN) (kN) (kN) (kN·m) (kN·m) (kN·m) (kN·m) (m/s) (s)
RotThrust Minimum DLC2.3_0003_Land_EOGR-2.0_S03.out - 8.8792E+02 3.9281E+00 - 1.0514E+03 - 1.1814E+03 - 1.6709E+03 - 1.0846E+03 1.9921E+03 8.44 67.50
RotThrust Maximum DLC1.1_0033_Land_14.0V0_S03.out 1.4336E+03 - 1.2608E+01 - 1.3583E+03 5.2455E+03 - 1.9035E+03 - 2.4375E+03 3.0927E+03 15.57 110.55
LSShftFys Minimum DLC6.2a_0010_Land_47.5V0_020ny_S01.out - 1.2881E+01 - 9.1223E+02 - 7.5438E+02 1.5081E+02 - 4.6519E+03 4.5705E+03 6.5215E+03 64.79 1757.10
LSShftFys Maximum DLC6.2a_0060_Land_47.5V0_300ny_S04.out 2.7368E+01 8.5283E+02 - 8.9386E+02 - 2.3287E+02 - 4.2042E+02 - 1.9789E+03 2.0231E+03 68.52 2090.15
LSShftFzs Minimum DLC1.1_0063_Land_24.0V0_S03.out 6.0810E+02 8.5125E-01 - 1.5780E+03 4.9725E+03 - 8.8305E+02 7.5180E+03 7.5697E+03 18.14 366.20
LSShftFzs Maximum DLC6.2a_0027_Land_47.5V0_000ny_S02.out 7.3953E+01 3.5871E+01 - 3.2065E+02 5.3614E+02 1.1440E+02 2.2077E+03 2.2107E+03 62.25 1488.85
RotTorq Minimum DLC2.3_0016_Land_EOGO_S04.out - 6.3195E+02 - 3.9633E+01 - 1.0003E+03 - 1.7699E+03 6.9960E+02 - 2.8666E+03 2.9507E+03 23.08 67.50
RotTorq Maximum DLC1.1_0063_Land_24.0V0_S03.out 7.1340E+02 - 6.2580E+01 - 1.4629E+03 6.2100E+03 9.8760E+02 5.5050E+02 1.1307E+03 18.65 412.65
LSSGagMys Minimum DLC1.4_0007_Land_ECD+R.out 9.4716E+02 - 2.9997E+01 - 1.2145E+03 2.8309E+03 - 1.3743E+04 - 1.4499E+03 1.3819E+04 11.80 73.40
LSSGagMys Maximum DLC1.3_0065_24.0V0_S05.out 4.8452E+02 - 1.5620E+02 - 1.2012E+03 4.5211E+03 1.2212E+04 4.2849E+02 1.2220E+04 29.74 70.60
LSSGagMzs Minimum DLC1.3_0063_24.0V0_S03.out 3.3629E+02 4.3997E+01 - 1.1313E+03 3.6585E+03 - 9.6012E+02 - 1.2355E+04 1.2392E+04 31.93 339.50
LSSGagMzs Maximum DLC1.3_0039_16.0V0_S03.out 1.1124E+03 4.5738E+00 - 1.3464E+03 3.4871E+03 - 8.8898E+02 1.1308E+04 1.1342E+04 16.26 592.00
LSSGagMMyz Minimum DLC1.3_0053_20.0V0_S05.out 5.7051E+02 - 4.7858E+01 - 1.2930E+03 4.0406E+03 1.1008E+00 - 1.9764E-02 1.1010E+00 17.33 37.15
LSSGagMMyz Maximum DLC1.4_0012_Land_ECD+R.out 1.0363E+03 - 6.0318E+01 - 1.2030E+03 4.2498E+03 - 1.3235E+04 - 4.7776E+03 1.4071E+04 11.80 77.75
65 This report is available at no cost from the National Renewable
Energy Laboratory at www.nrel.gov/publications