effect sizes
DESCRIPTION
sizesTRANSCRIPT

Practical Meta-Analysis -- D. B. Wilson
1
The Effect Size
The effect size (ES) makes meta-analysis possible The ES encodes the selected research findings on a
numeric scale There are many different types of ES measures, each
suited to different research situations Each ES type may also have multiple methods of
computation
Practical Meta-Analysis -- D. B. Wilson
2
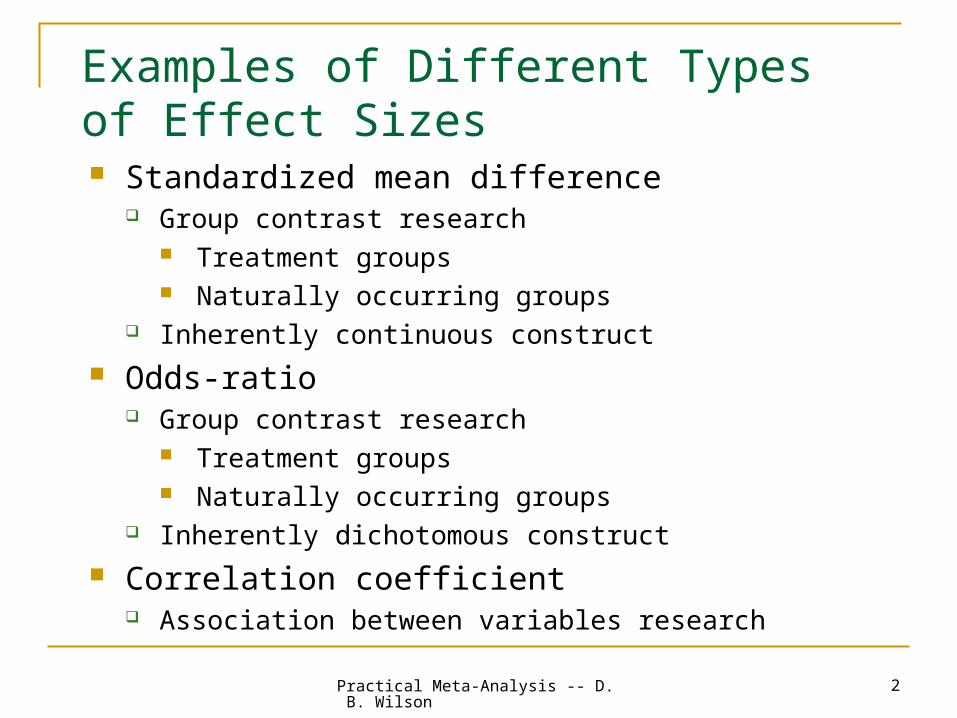
Examples of Different Types of Effect Sizes Standardized mean difference
Group contrast research Treatment groups Naturally occurring groups
Inherently continuous construct
Odds-ratio Group contrast research
Treatment groups Naturally occurring groups
Inherently dichotomous construct
Correlation coefficient Association between variables research

Practical Meta-Analysis -- D. B. Wilson
3
Examples of Different Types of Effect Sizes Risk ratio
Group differences research (naturally occurring groups) Commonly used by epidemiologist and medical meta-analyses Inherently dichotomous construct Easier to interpret than the odds-ratio

Practical Meta-Analysis -- D. B. Wilson
4
Examples of Different Types of Effect Sizes
Proportion Central tendency research
HIV/AIDS prevalence rates Proportion of homeless persons found to be alcohol
abusers
Standardized gain score Gain or change between two measurement points on the
same variable Reading speed before and after a reading improvement
class
Others?

Practical Meta-Analysis -- D. B. Wilson
5
What Makes Something an Effect Sizefor Meta-analytic Purposes The type of ES must be comparable across the
collection of studies of interest This is generally accomplished through standardization Must be able to calculate a standard error for that type of
ES The standard error is needed to calculate the ES weights, called
inverse variance weights (more on this latter) All meta-analytic analyses are weighted
Practical Meta-Analysis -- D. B. Wilson
6
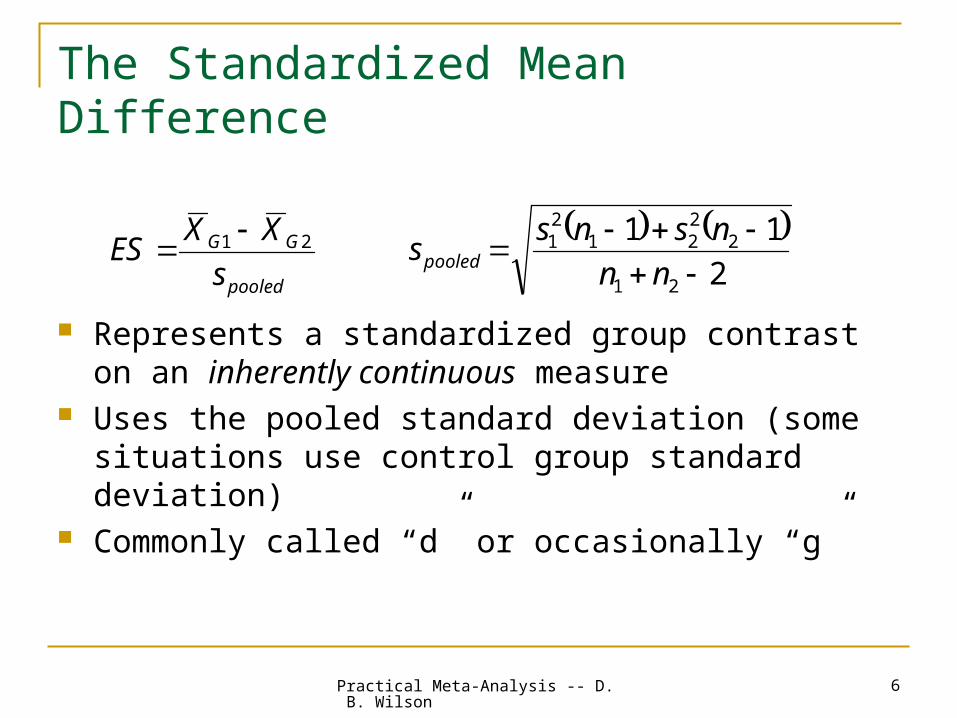
The Standardized Mean Difference
Represents a standardized group contrast on an inherently continuous measure
Uses the pooled standard deviation (some situations use control group standard deviation)
Commonly called “d” or occasionally “g”
pooled
GG
s
XXES 21
2
11
21
2221
21
nn
nsnsspooled
Practical Meta-Analysis -- D. B. Wilson
7
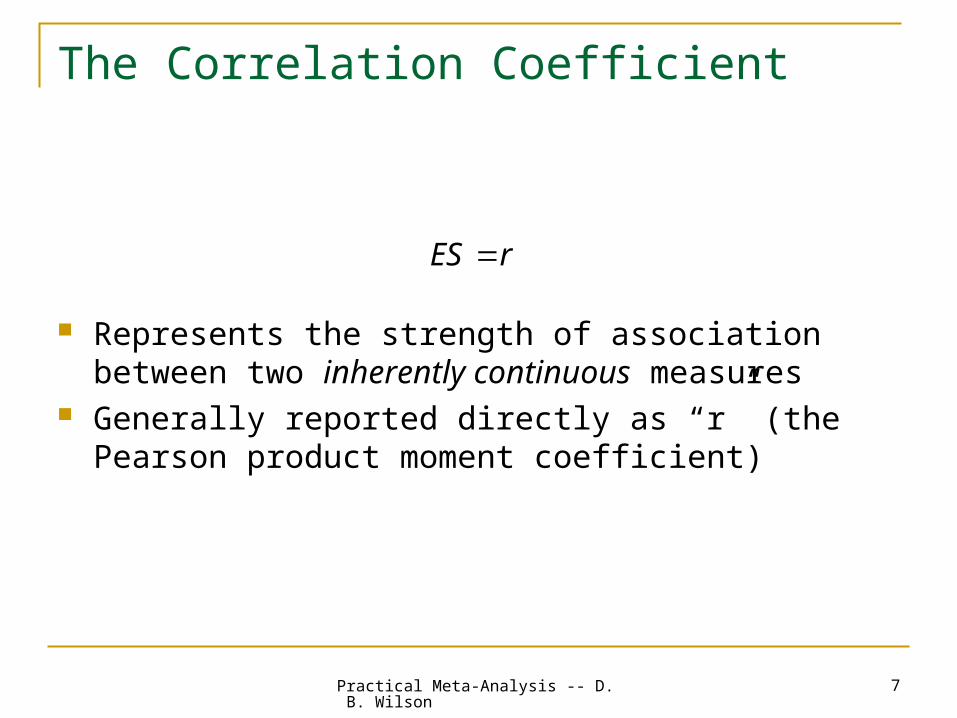
The Correlation Coefficient
Represents the strength of association between two inherently continuous measures
Generally reported directly as “r” (the Pearson product moment coefficient)
rES

Practical Meta-Analysis -- D. B. Wilson
8
The Odds-Ratio
The odds-ratio is based on a 2 by 2 contingency table, such as the one below
Frequencies
Success Failure
Treatment Group a b
Control Group c dbc
adES
The Odds-Ratio is the odds of success in the treatment group relative to the odds of success in the control group.

Practical Meta-Analysis -- D. B. Wilson
9
The Risk Ratio
The risk ratio is also based on data from a 2 by 2 contingency table, and is the ratio of the probability of success (or failure) for each group
ESa a b
c c d
/ ( )
/ ( )
Practical Meta-Analysis -- D. B. Wilson
10
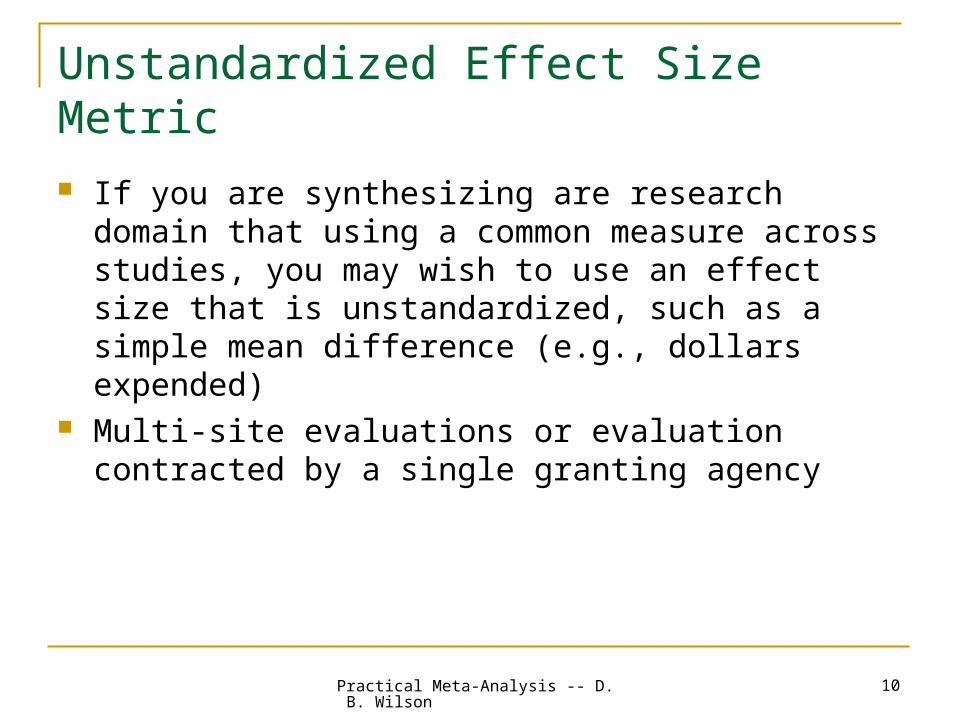
Unstandardized Effect Size Metric
If you are synthesizing are research domain that using a common measure across studies, you may wish to use an effect size that is unstandardized, such as a simple mean difference (e.g., dollars expended)
Multi-site evaluations or evaluation contracted by a single granting agency
Practical Meta-Analysis -- D. B. Wilson
11
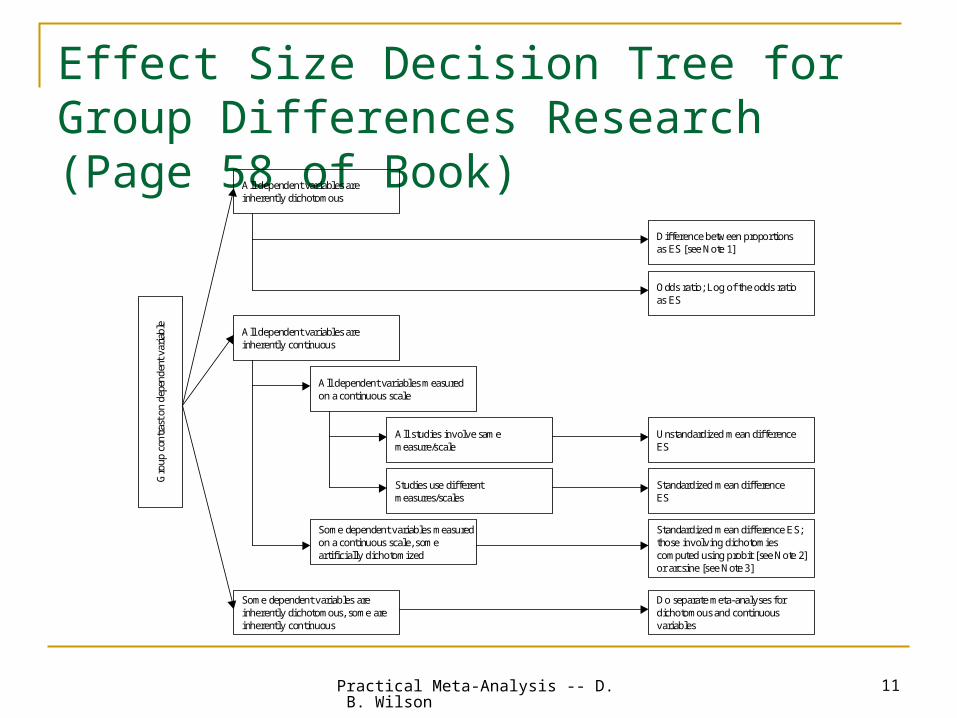
Effect Size Decision Tree for Group Differences Research (Page 58 of Book) All dependent variables are
inherently dichotomous
All dependent variables areinherently continuous
All dependent variables measuredon a continuous scale
All studies involve samemeasure/scale
Studies use differentmeasures/scales
Some dependent variables measuredon a continuous scale, someartificially dichotomized
Some dependent variables areinherently dichotomous, some areinherently continuous
Difference between proportionsas ES [see Note 1]
Odds ratio; Log of the odds ratioas ES
Unstandardized mean differenceES
Standardized mean differenceES
Standardized mean difference ES;those involving dichotomiescomputed using probit [see Note 2]or arcsine [see Note 3]
Do separate meta-analyses fordichotomous and continuousvariables
Gro
up c
ontr
ast o
n de
pend
ent v
aria
ble
Practical Meta-Analysis -- D. B. Wilson
12
Methods of Calculating the Standardized Mean Difference The standardized mean difference probably has more
methods of calculation than any other effect size type See Appendix B of book for numerous formulas and
methods.

Practical Meta-Analysis -- D. B. Wilson
13
Degrees of Approximation to the ES ValueDepending of Method of Computation
Direct calculation based on means and standard deviations Algebraically equivalent formulas (t-test) Exact probability value for a t-test Approximations based on continuous data (correlation coefficient)
Estimates of the mean difference (adjusted means, regression B weight, gain score means)
Estimates of the pooled standard deviation (gain score standard deviation, one-way ANOVA with 3 or more groups, ANCOVA)
Approximations based on dichotomous data
Great
Good
Poor
Practical Meta-Analysis -- D. B. Wilson
14
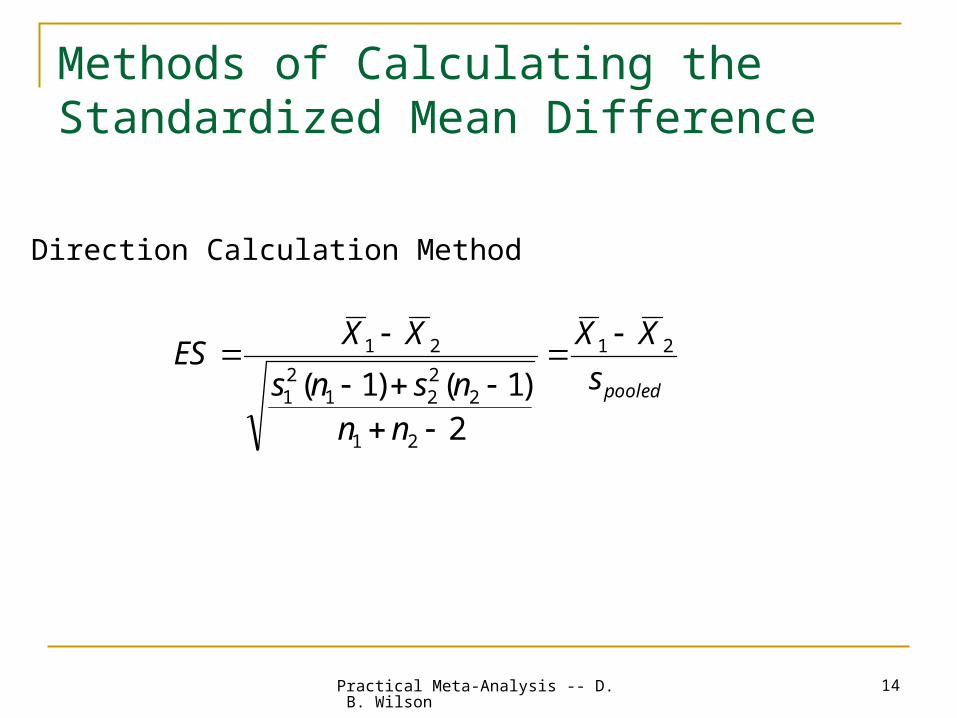
Methods of Calculating the Standardized Mean Difference
pooleds
XX
nnnsns
XXES 21
21
2221
21
21
2)1()1(
Direction Calculation Method

Practical Meta-Analysis -- D. B. Wilson
15
Methods of Calculating the Standardized Mean Difference
21
21
nn
nntES
Algebraically Equivalent Formulas:
21
21 )(
nn
nnFES
independent t-test
two-group one-way ANOVA
exact p-values from a t-test or F-ratio can be convertedinto t-value and the above formula applied
Practical Meta-Analysis -- D. B. Wilson
16
Methods of Calculating the Standardized Mean Difference
A study may report a grouped frequency distributionfrom which you can calculate means and standard deviations and apply to direct calculation method.
Practical Meta-Analysis -- D. B. Wilson
17
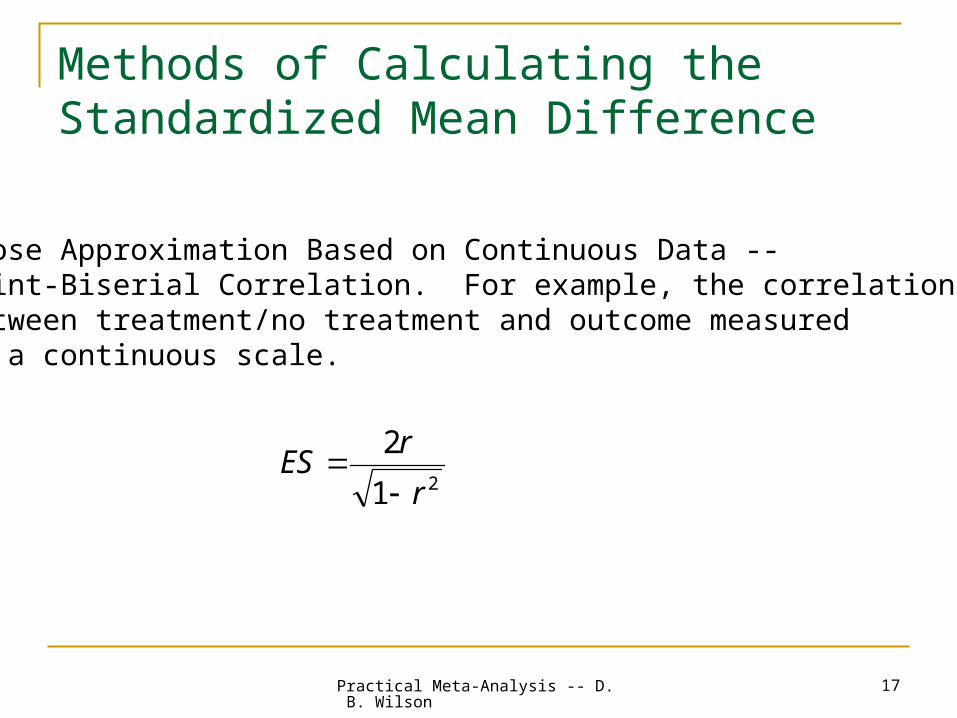
Methods of Calculating the Standardized Mean Difference
21
2
r
rES
Close Approximation Based on Continuous Data --Point-Biserial Correlation. For example, the correlationbetween treatment/no treatment and outcome measuredon a continuous scale.

Practical Meta-Analysis -- D. B. Wilson
18
Methods of Calculating the Standardized Mean Difference
Estimates of the Numerator of ES -- The Mean Difference difference between gain scores difference between covariance adjusted means unstandardized regression coefficient for group membership

Practical Meta-Analysis -- D. B. Wilson
19
Methods of Calculating the Standardized Mean Difference
Estimates of the Denominator of ES --Pooled Standard Deviation
1 nsespooled standard error of the mean

Practical Meta-Analysis -- D. B. Wilson
20
Methods of Calculating the Standardized Mean Difference
Estimates of the Denominator of ES --Pooled Standard Deviation
F
MSs betweenpooled
1
)( 22
k
n
nXnX
MS j
jjjj
between
one-way ANOVA >2 groups

Practical Meta-Analysis -- D. B. Wilson
21
Methods of Calculating the Standardized Mean Difference
Estimates of the Denominator of ES --Pooled Standard Deviation
)1(2 r
ss gainpooled
standard deviation of gainscores, where r is the correlationbetween pretest and posttestscores

Practical Meta-Analysis -- D. B. Wilson
22
Methods of Calculating the Standardized Mean Difference
Estimates of the Denominator of ES --Pooled Standard Deviation
2
1
1 2
error
errorerrorpooled df
df
r
MSs ANCOVA, where r is the
correlation between thecovariate and the DV

Practical Meta-Analysis -- D. B. Wilson
23
Methods of Calculating the Standardized Mean Difference
Estimates of the Denominator of ES --Pooled Standard Deviation
WABB
WABBpooled dfdfdf
SSSSSSs
A two-way factorial ANOVAwhere B is the irrelevant factorand AB is the interactionbetween the irrelevant factorand group membership (factorA).
Practical Meta-Analysis -- D. B. Wilson
24
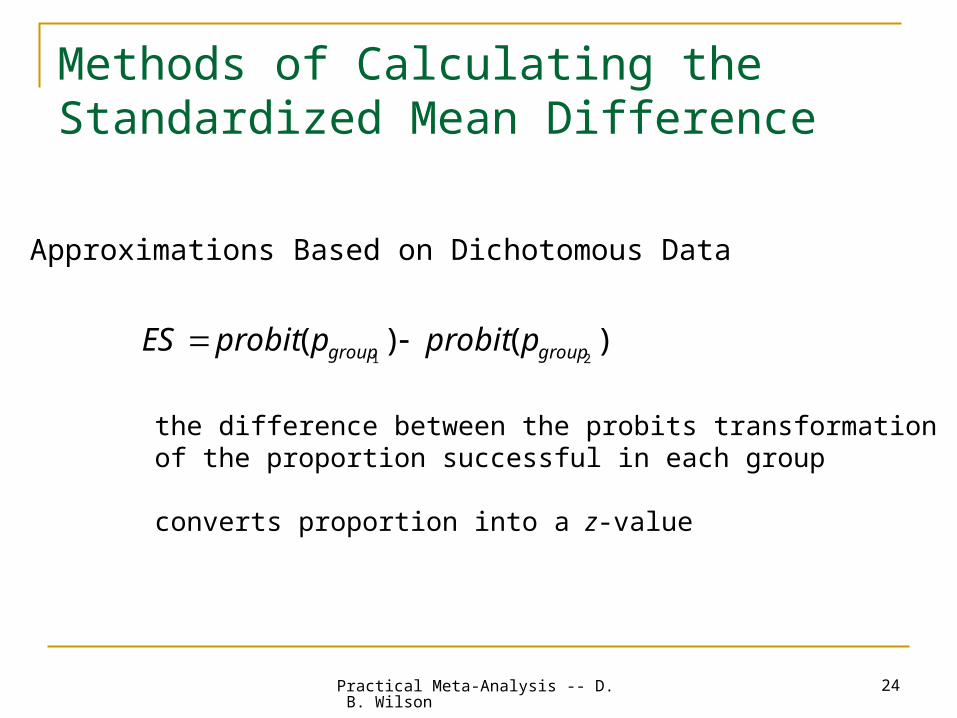
Methods of Calculating the Standardized Mean Difference
Approximations Based on Dichotomous Data
)()(21 groupgroup pprobitpprobitES
the difference between the probits transformationof the proportion successful in each group
converts proportion into a z-value
Practical Meta-Analysis -- D. B. Wilson
25
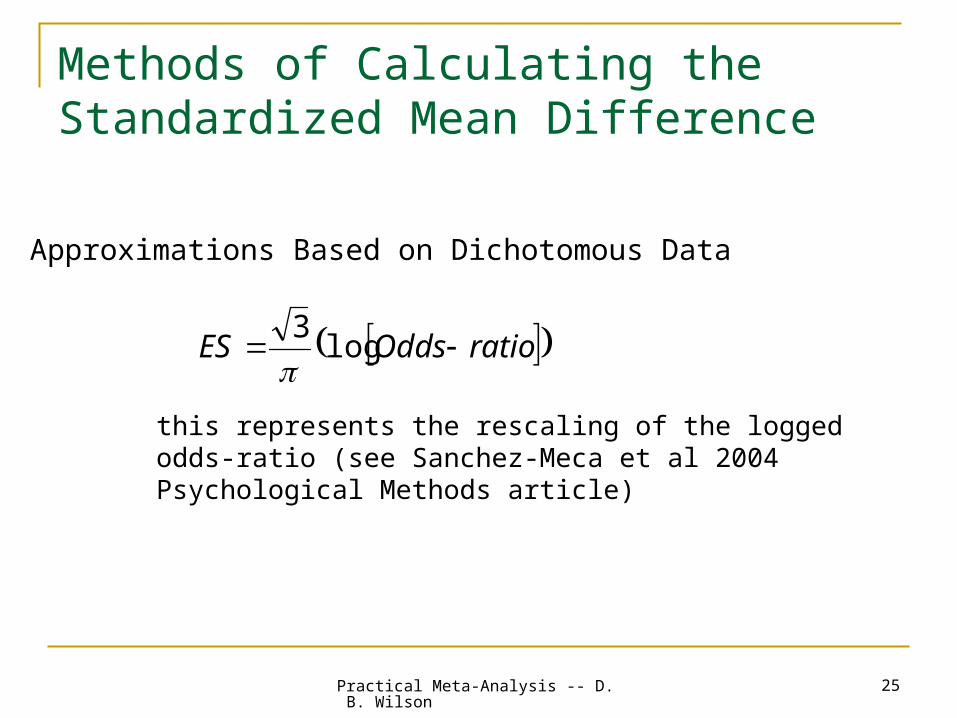
Methods of Calculating the Standardized Mean Difference
Approximations Based on Dichotomous Data
ratioOddsES log3
this represents the rescaling of the logged odds-ratio (see Sanchez-Meca et al 2004 Psychological Methods article)

Practical Meta-Analysis -- D. B. Wilson
26
Methods of Calculating the Standardized Mean Difference
Approximations Based on Dichotomous Data
2
2
2
N
ES chi-square must be based ona 2 by 2 contingency table(i.e., have only 1 df)
21
2
r
rES
phi coefficient

Practical Meta-Analysis -- D. B. Wilson
27

Practical Meta-Analysis -- D. B. Wilson
28
Practical Meta-Analysis -- D. B. Wilson
29
Formulas for the Correlation Coefficient Results typically reported directly as a correlation Any data for which you can calculate a standardized
mean difference effect size, you can also calculate a correlation type effect size
See appendix B for formulas
Practical Meta-Analysis -- D. B. Wilson
30
Formulas for the Odds Ratio
Results typically reported in one of three forms: Frequency of successes in each group Proportion of successes in each group 2 by 2 contingency table
Appendix B provides formulas for each situation

Practical Meta-Analysis -- D. B. Wilson
31
Data to Code Along With the ES
The effect size May want to code the data from which the ES is calculated Confidence in ES calculation Method of calculation Any additional data needed for calculation of the inverse variance weight
Sample size ES specific attrition Construct measured Point in time when variable measured Reliability of measure Type of statistical test used
Practical Meta-Analysis -- D. B. Wilson
32
Issues in Coding Effect Sizes
Which formula to use when data are available for multiple formulas
Multiple documents/publications reporting the same data (not always in agreement)
How much guessing should be allowed sample size is important but may not be presented for both
groups some numbers matter more than others