effective business practices 101 (5/8): power your business with information
TRANSCRIPT

Information —— use it to power your business.

Review.
Calculate business risks.
Only make informed (researched) decisions.

❶What is the competition?
❷What is the demand?
❸What are the costs?
❹What is the ROI?

What tools can you use to research your decisions?
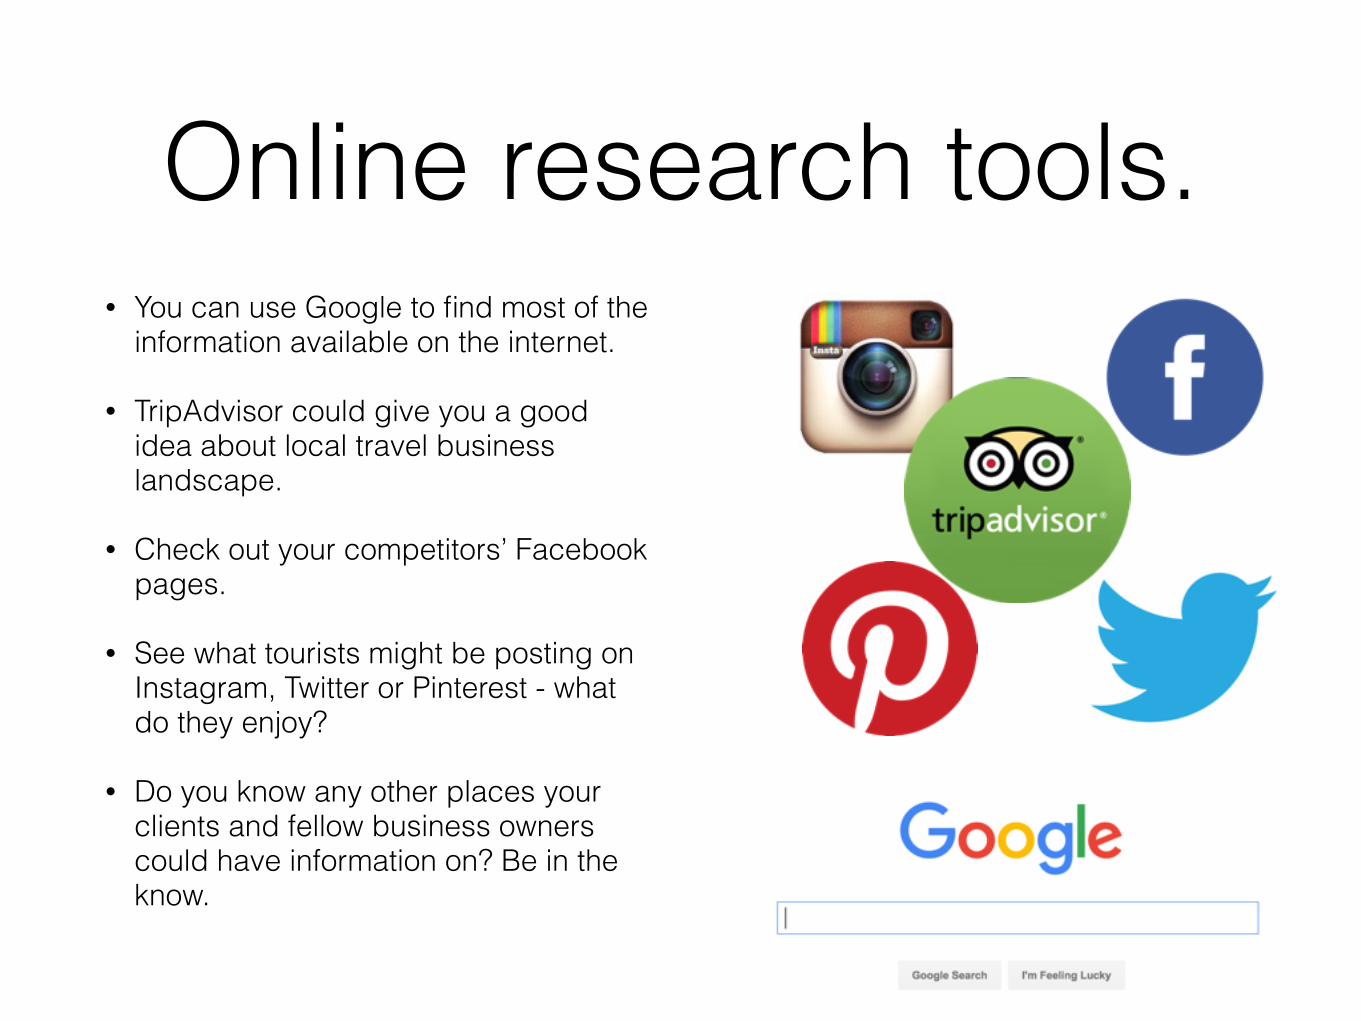
Online research tools.• You can use Google to find most of the
information available on the internet.
• TripAdvisor could give you a good idea about local travel business landscape.
• Check out your competitors’ Facebook pages.
• See what tourists might be posting on Instagram, Twitter or Pinterest - what do they enjoy?
• Do you know any other places your clients and fellow business owners could have information on? Be in the know.

Don’t forget “real-world” research.
Pay attention to the news, talk to customers and fellow business owners. Create and benefit from community.
What is diversification?


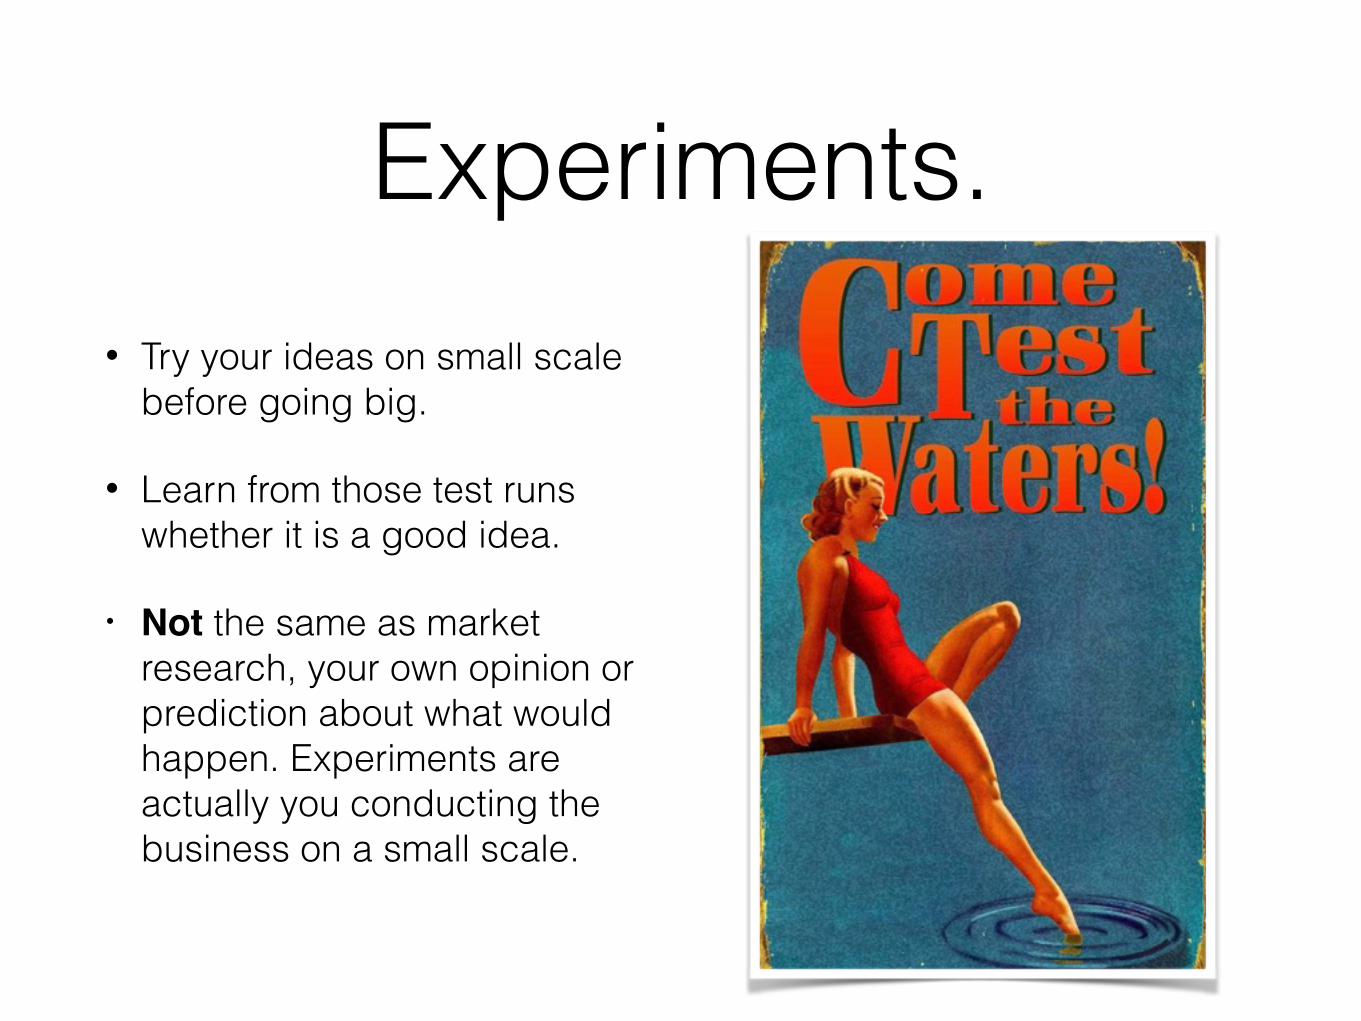
Experiments.• Try your ideas on small scale
before going big.
• Learn from those test runs whether it is a good idea.
• Not the same as market research, your own opinion or prediction about what would happen. Experiments are actually you conducting the business on a small scale.

Measure, individually.
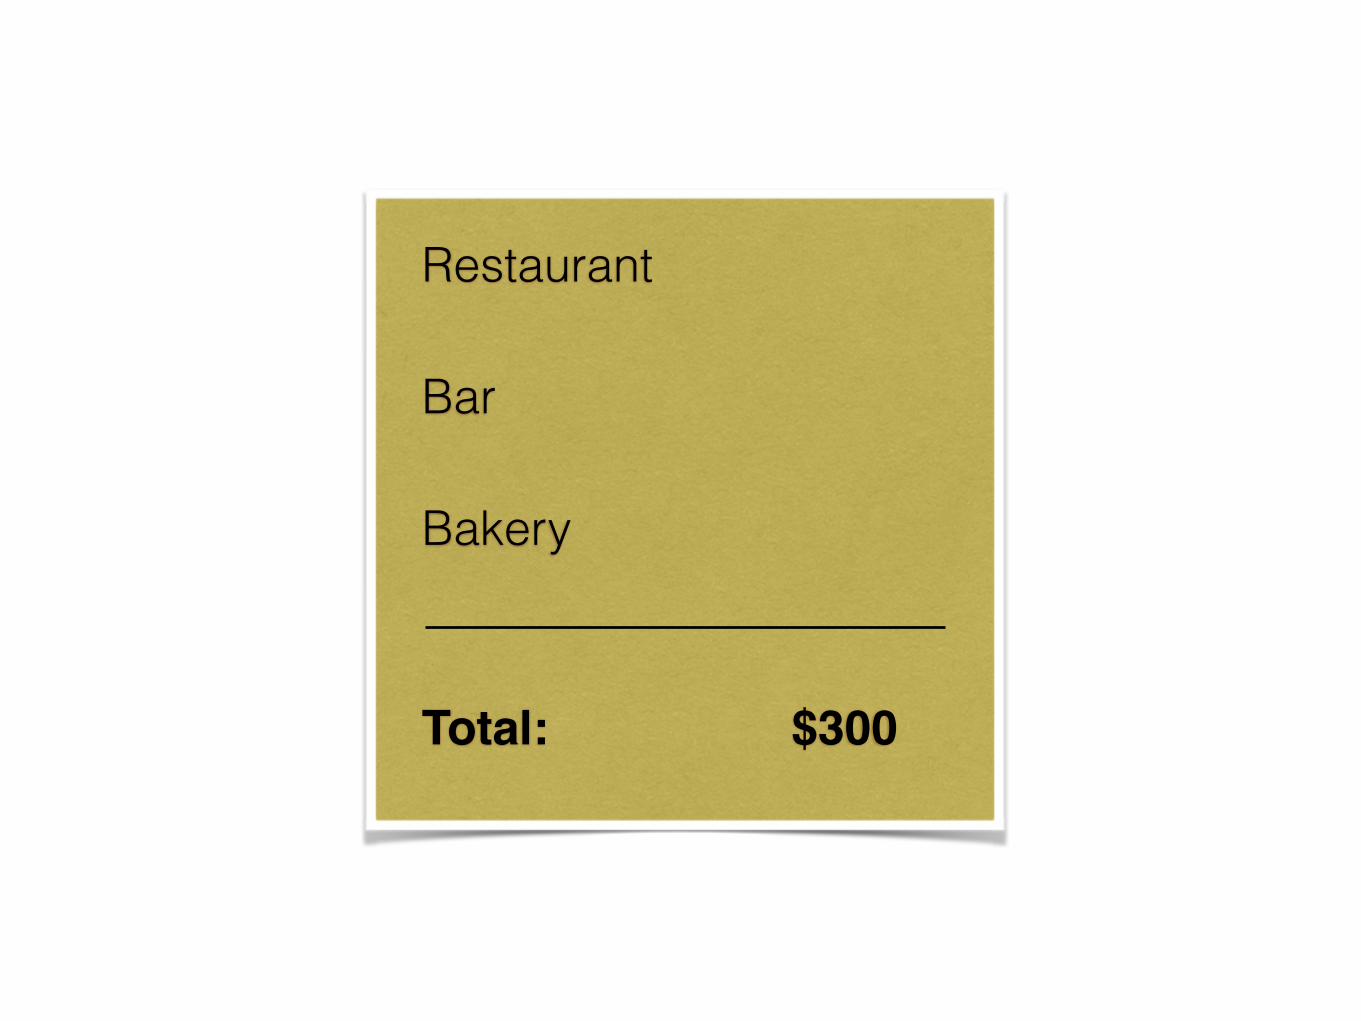
Restaurant
Bar
Bakery
Total: $300
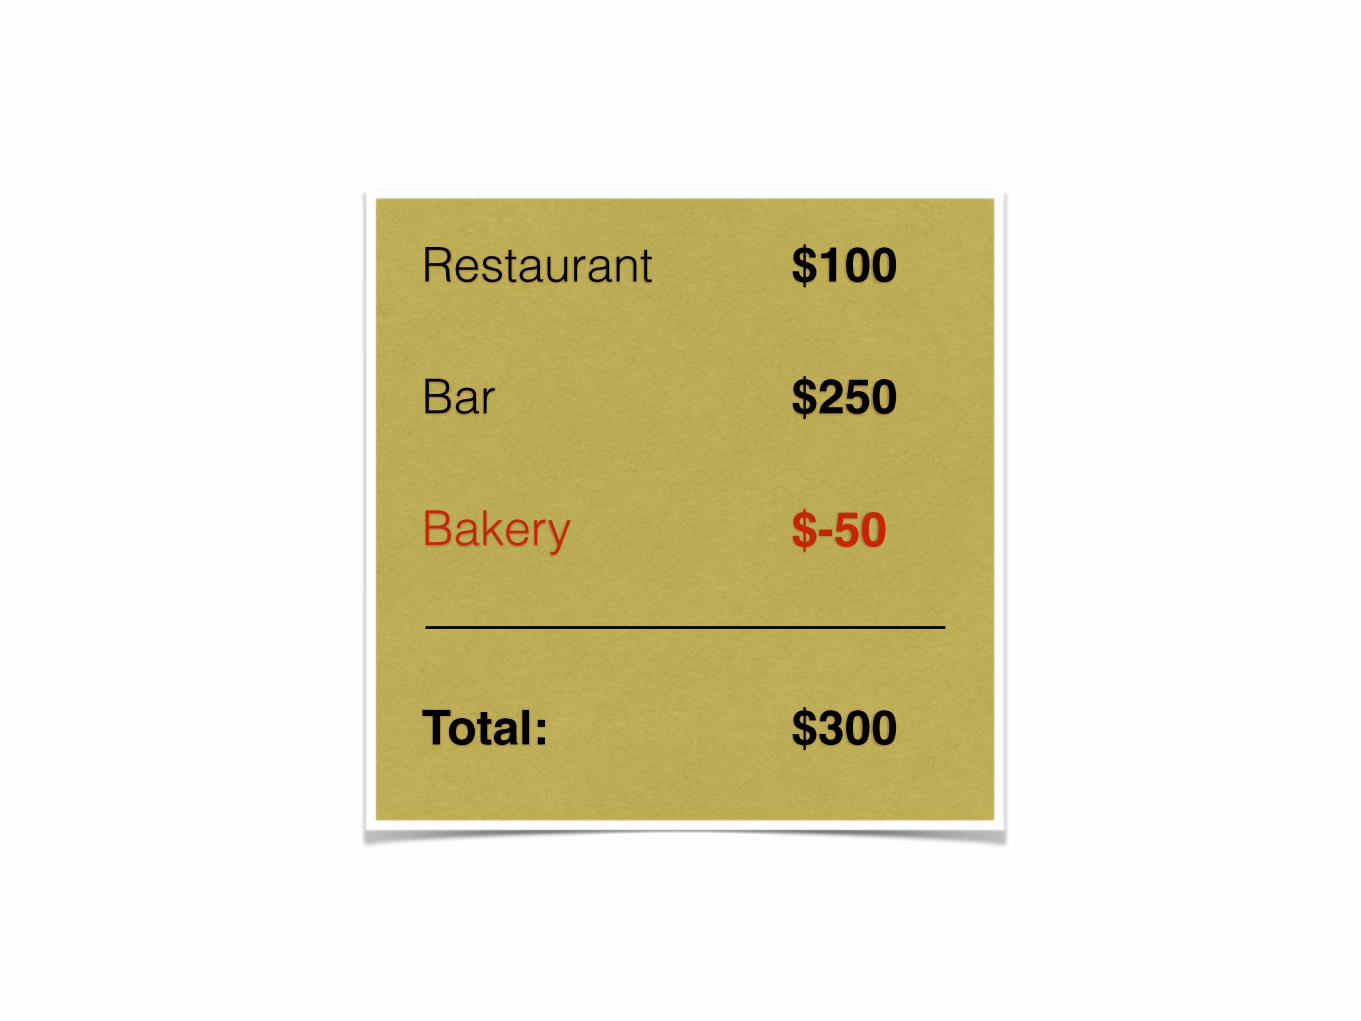
Restaurant
Bar
Bakery
Total: $300
$-50
$250
$100

Things you can measure:
• Income.
• Costs.
• Amount of work required.

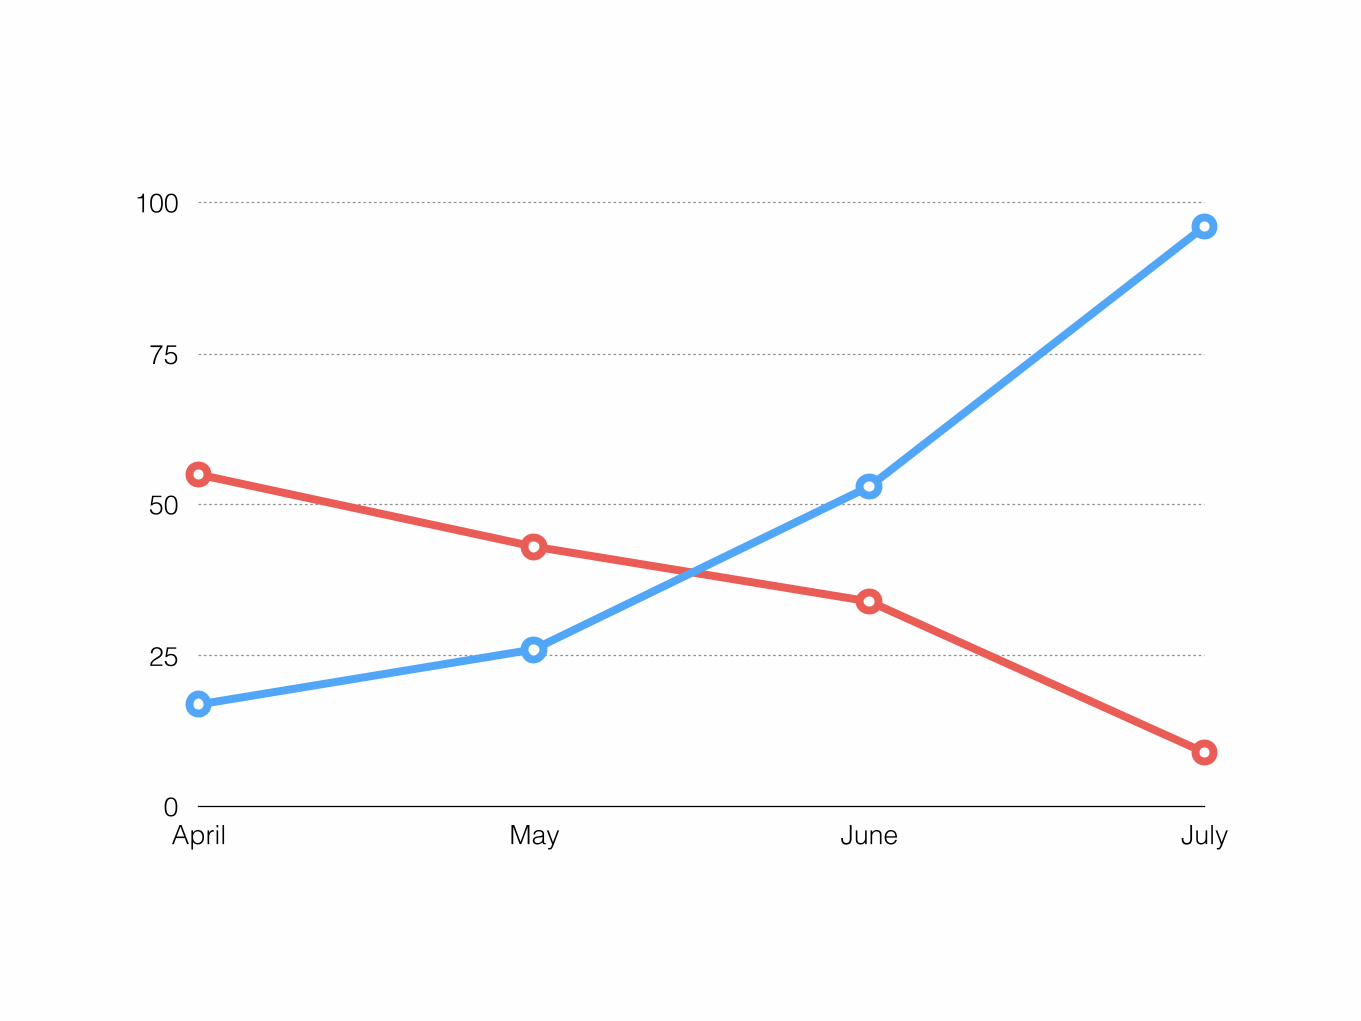
Track your ventures.
• Tracking (also called analytics) is recording your measurements over time.
• Analytics can help you see patterns in your business that will help you predict the future.
0
25
50
75
100
April May June July

Feedback is a gift.
Collect & synthesize.
• Collect a good sample of feedback (at least 10 people).
• Sort your feedback based on opinions and suggestions.
• Think how it could apply to your business.
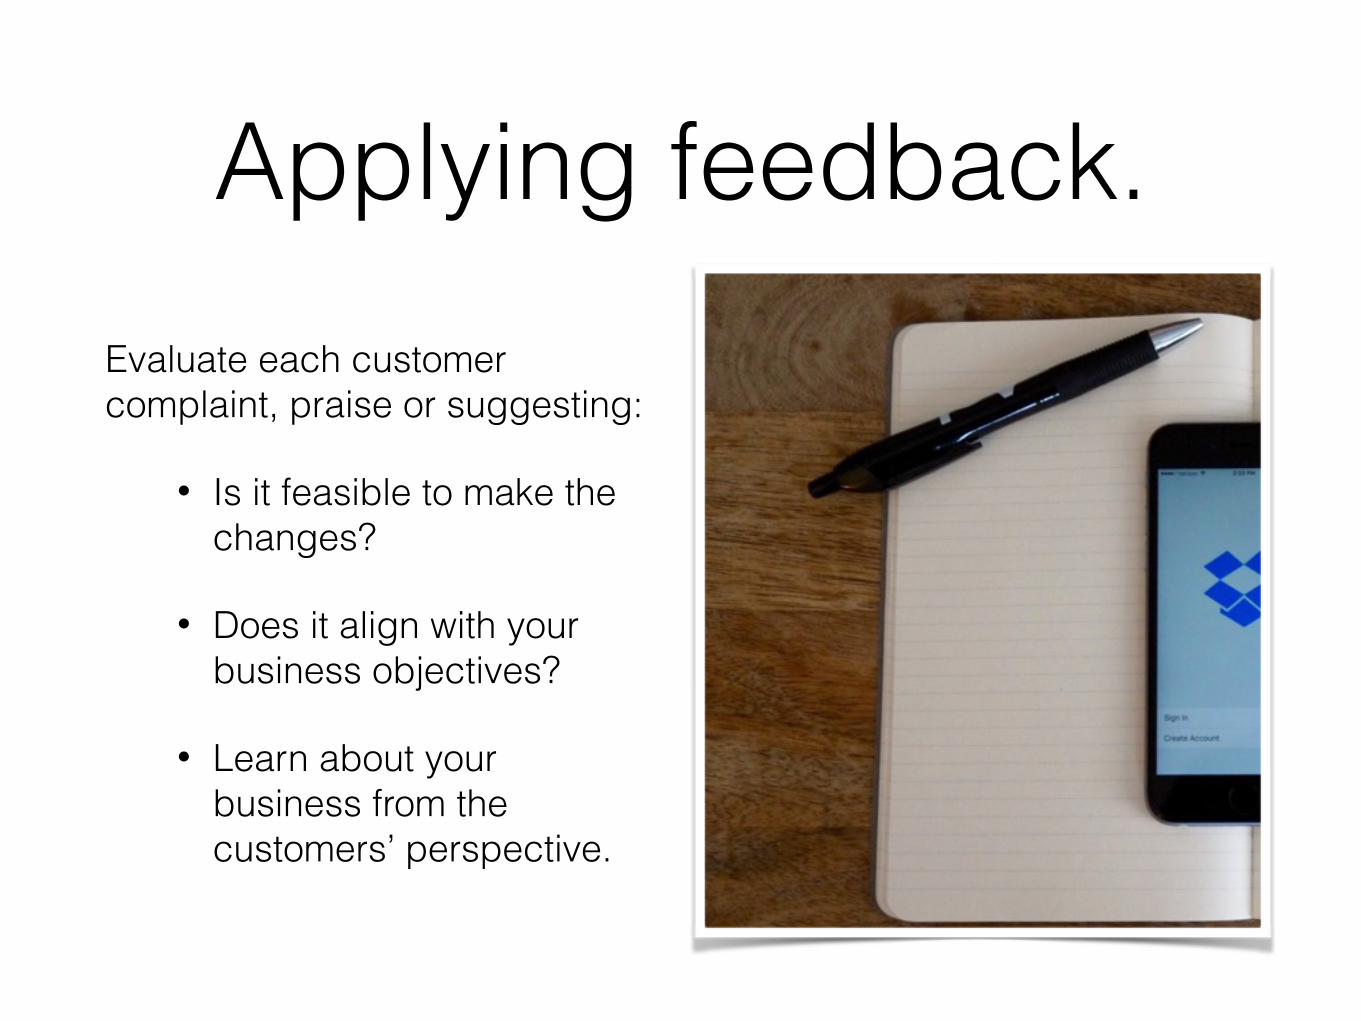
Applying feedback.Evaluate each customer complaint, praise or suggesting:
• Is it feasible to make the changes?
• Does it align with your business objectives?
• Learn about your business from the customers’ perspective.

Whom should the business benefit?
• Customers are your biggest asset and the only source of income.
• Your business has to focus on making their lives better.

Understand customers’ pain.We build businesses to create solutions for people’s
problems.
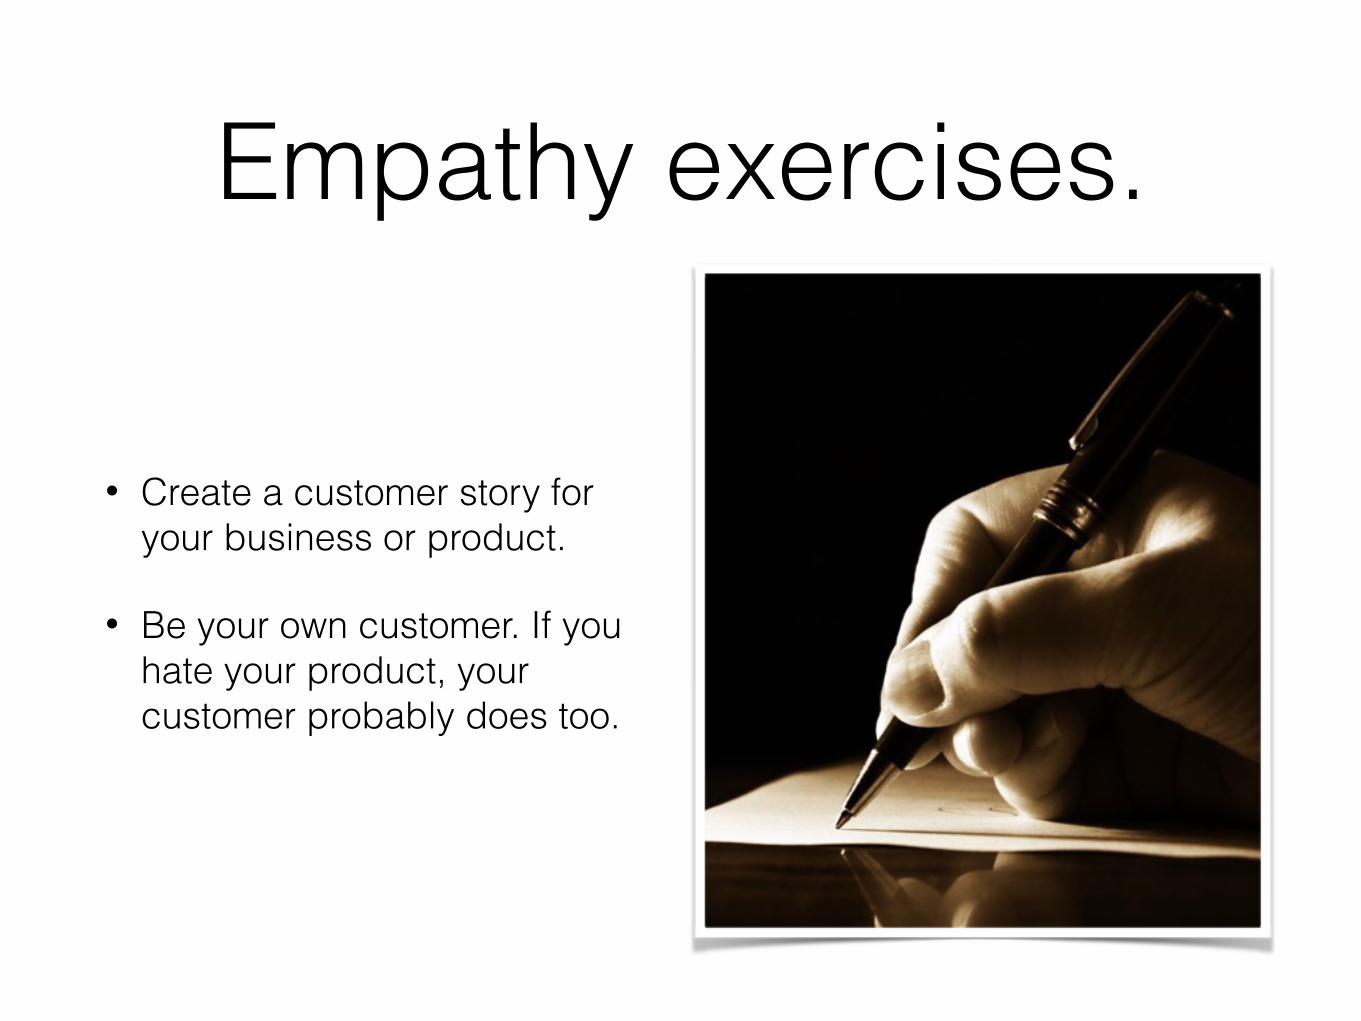
Empathy exercises.
• Create a customer story for your business or product.
• Be your own customer. If you hate your product, your customer probably does too.
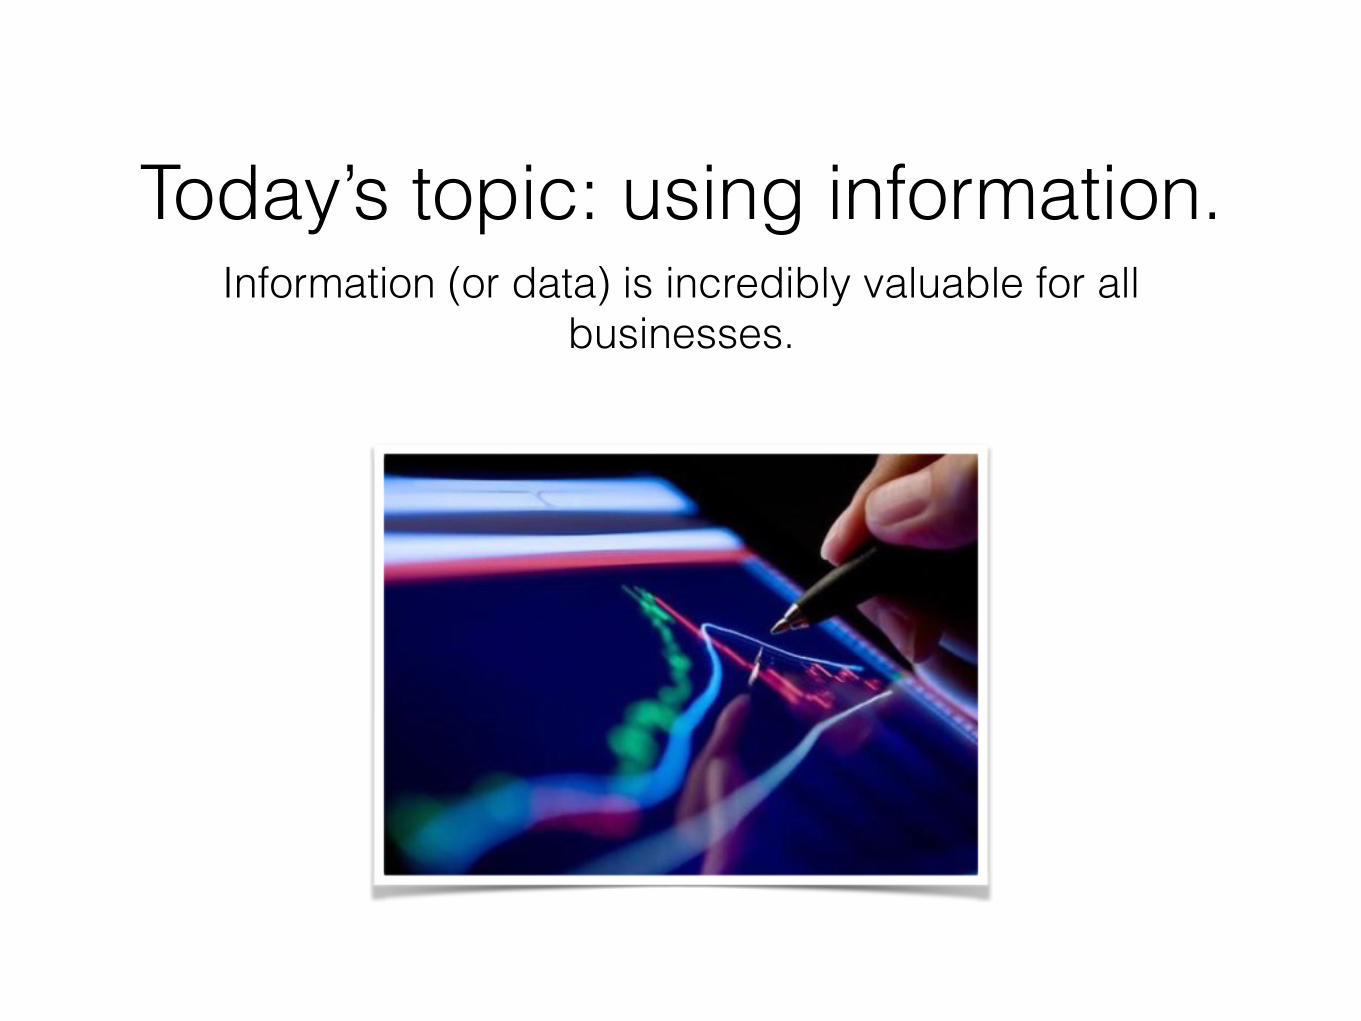
Today’s topic: using information.Information (or data) is incredibly valuable for all
businesses.
Businesses spend billions of dollars on data about their customers.
Facebook.Knows your age, gender, what you like, your hobbies and more. They spend
tremendous amount of resources to gain that knowledge and sell it at a premium to other businesses. In 2015 they made $17,928,000,000.
Google.Holds the key to search patterns of billions of people and is a gateway to the
internet for both businesses and customers due to their wealth of data and their ability to manipulate it. In 2015 they made $74,980,000,000.
Microsoft.Offer Windows 10 for free (all previous versions cost $200 and up). In return
they want information about your usage, browsing and other customer statistics. In 2015 they made $93,580,000,000.

Small businesses.Small businesses spend tremendous amount of money on information. Per
capita, more than large businesses. And their spending is expected to grow even more in the coming years.
Why is data so important to business?

Our decisions can make or break the company.

Make.

Informed.

Decisions.

What kind of information & how can you gather it about your
business and your customers?

Kinds of information.
• Data about the market: competition, demand.
• Operational data: costs, potential revenues, ROI.
• Customer data: feedback, average & ideal customer traits.

Market data.• Competition: is there a lot of
competition in the market, how are the competing businesses doing?
• Demand: is this service or product needed?
• Now and then: think ahead, learn everything you can about the market and predict how it will behave in the future.
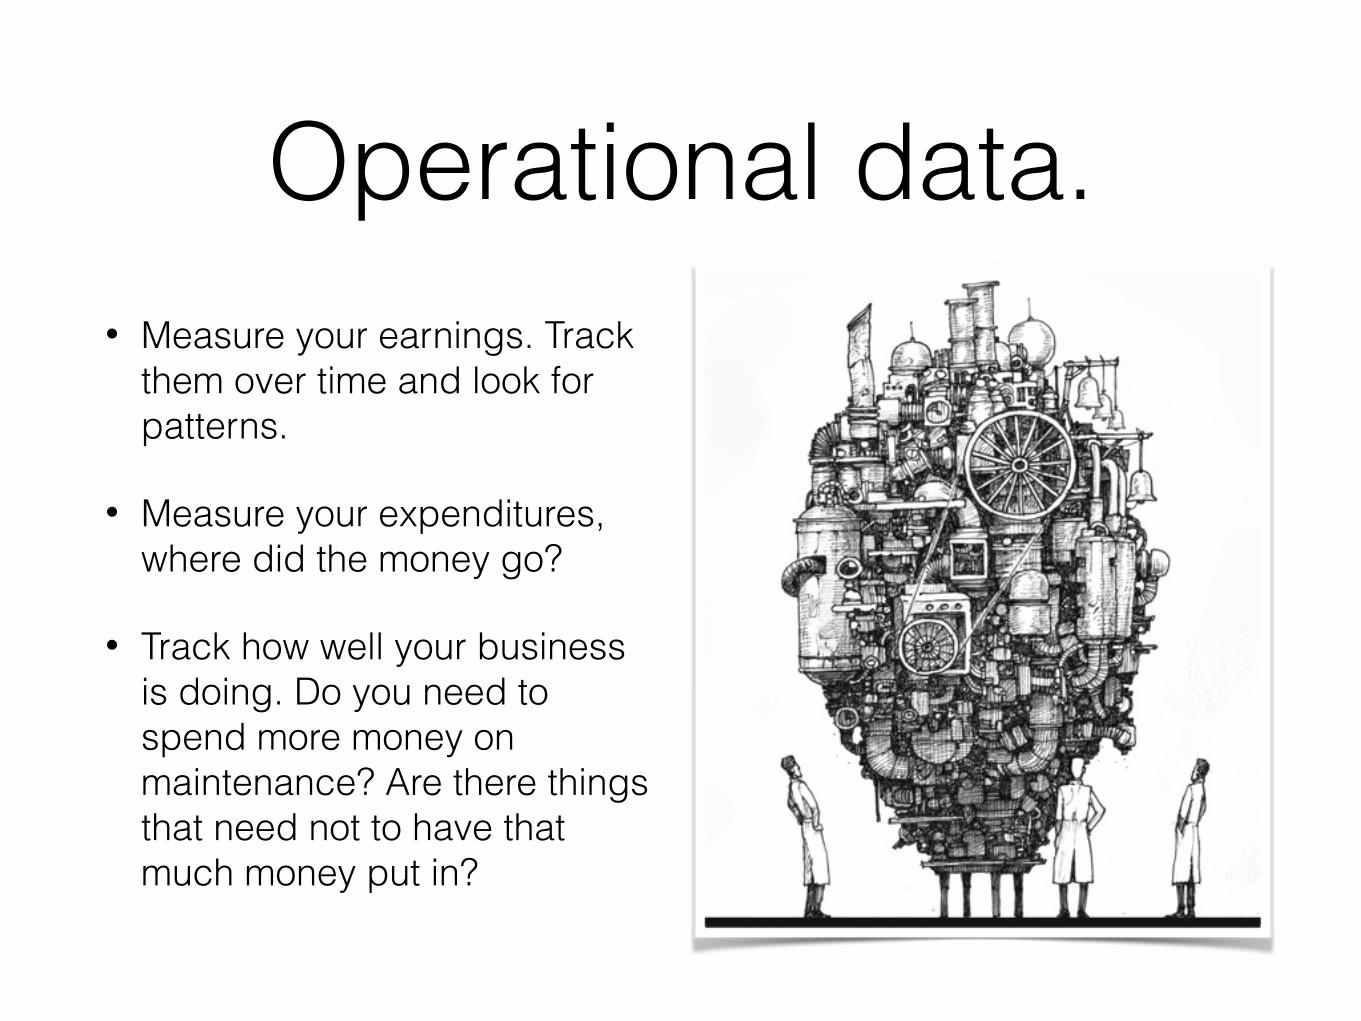
Operational data.• Measure your earnings. Track
them over time and look for patterns.
• Measure your expenditures, where did the money go?
• Track how well your business is doing. Do you need to spend more money on maintenance? Are there things that need not to have that much money put in?

Customer data.
• Who is your average customer? Where are they from? What do they like? How much do they make?
• How are your customers reacting to your products? Is the feedback showing you are improving or doing worse?

Obtain data.Online & real-world research. Customer feedback. Your
sales and expense records.

Record data.Paper records are good if you are excellent at math and being organized.
Accountant is good, but he/she might not track everything. Using software like Google Sheets is a good idea.

Google Sheets.Google Sheets might look a little different on your device but the steps are basically
the same. This mini-tutorial is the very basics of creating your own accounting system. An essential step to recording and interpreting your business’ data.
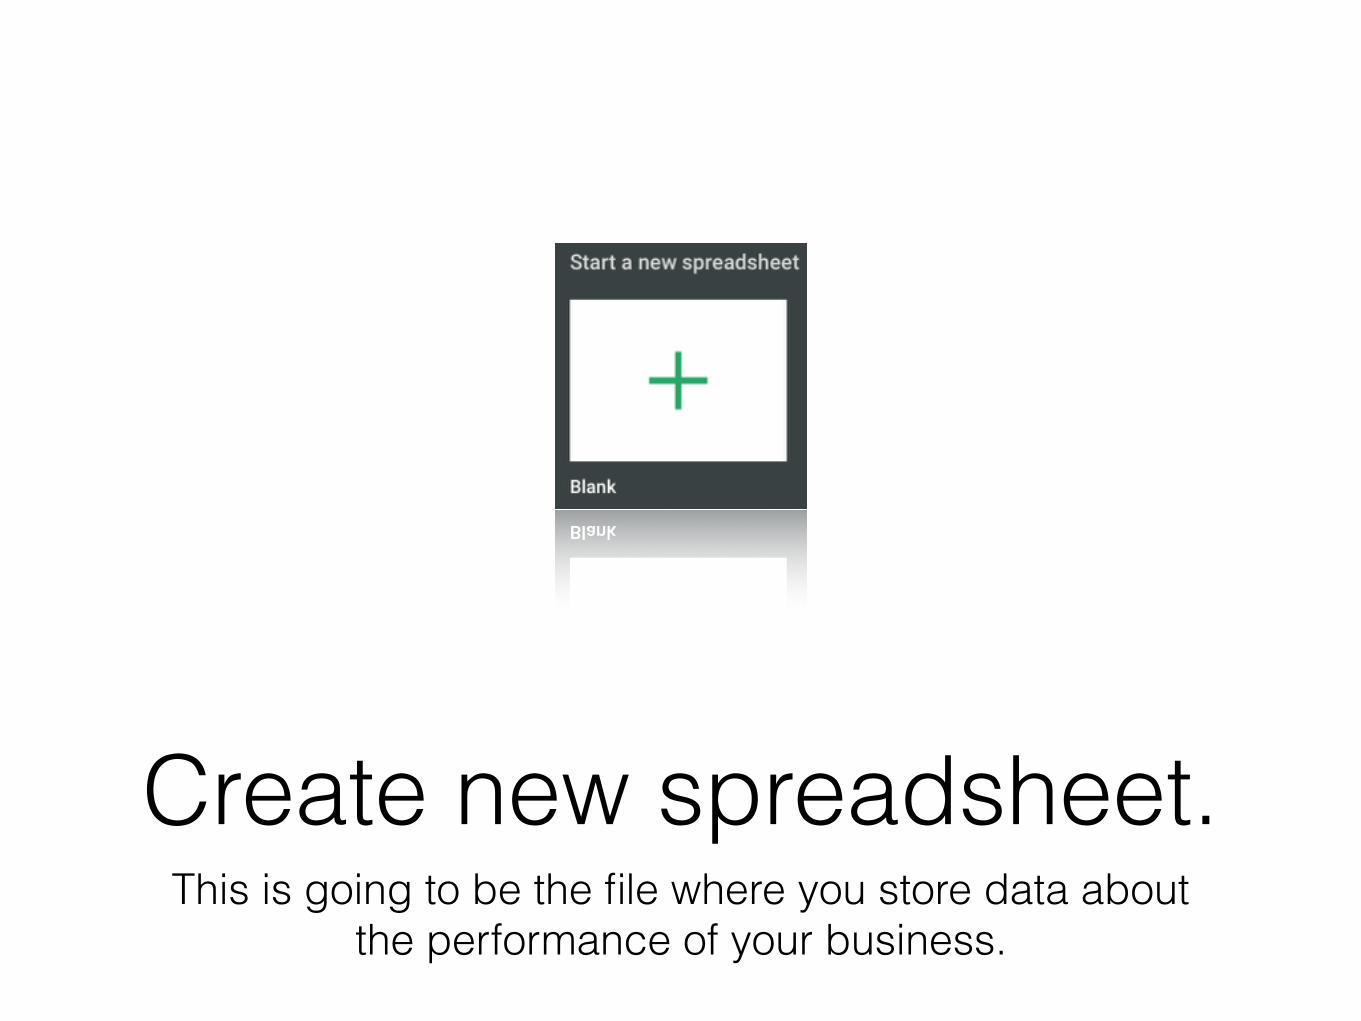
Create new spreadsheet.This is going to be the file where you store data about
the performance of your business.

This is your document.Note the row numbers on the left and lettered columns at the top. They will help you find coordinates of each cell in the middle (like chess). For example, A1 is
the currently selected cell.

Keep organized.Give a name to your spreadsheet document, for example the function that it would be performing (“Restaurant Cash Flow”).

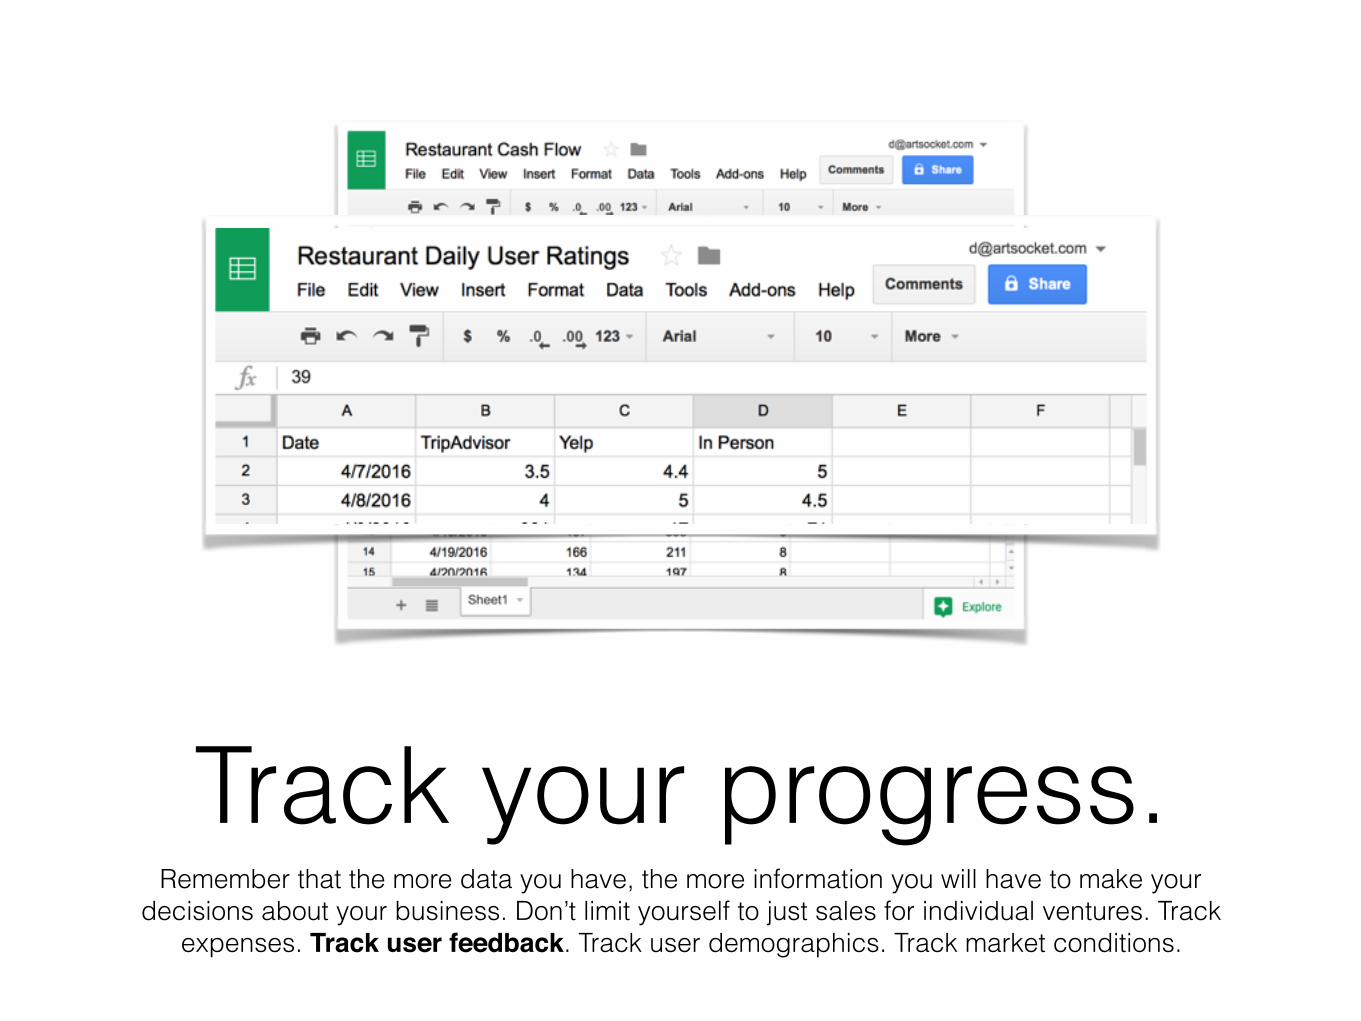
List trackable items.On the very left there should be the date. To the right you can list the items you are
tracking. Those could be daily income values from each of your diverse businesses, expenses, even customer review ratings and information about the market.

Create your first entry.Enter today’s data and the values for each of your trackable items. Continue doing this every day until you have at least two weeks’ worth of entries. Note
that your dates will often automatically convert to number notation.

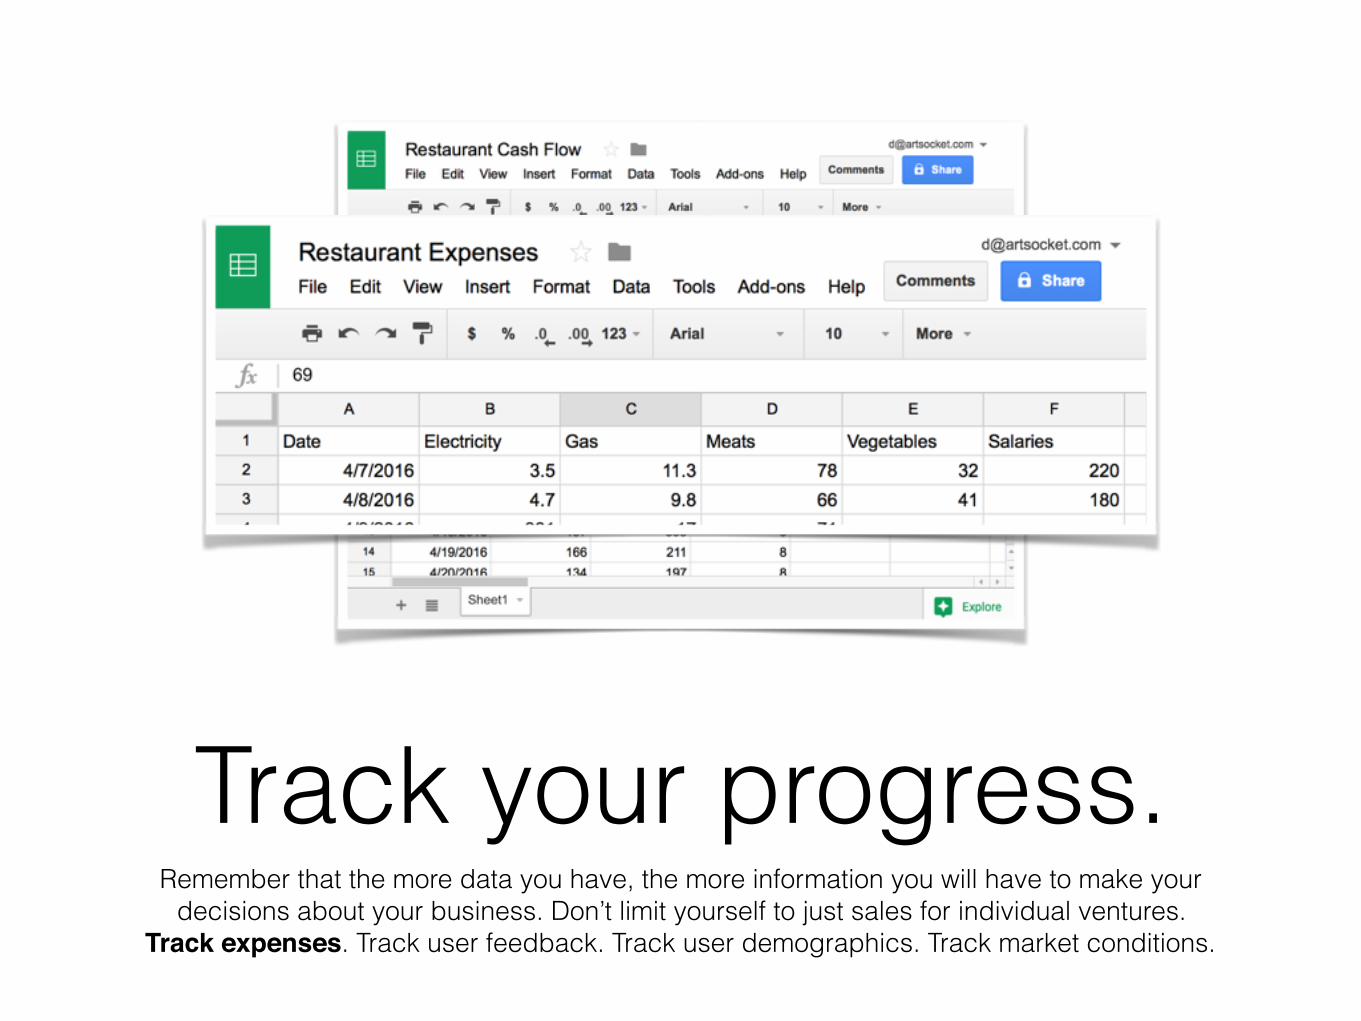
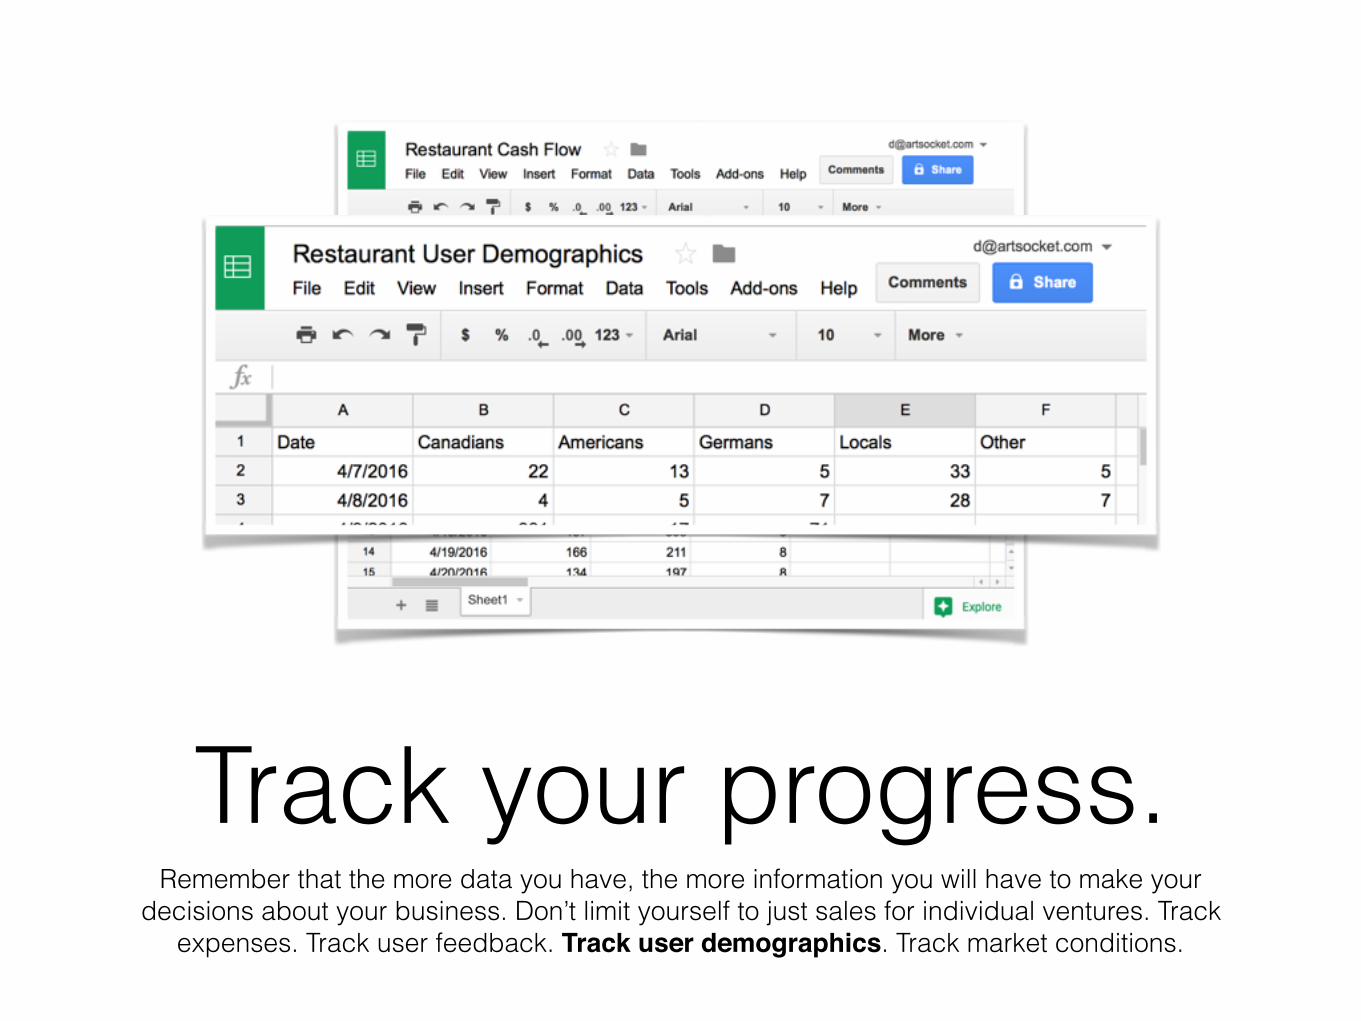
Track your progress.Remember that the more data you have, the more information you will have to make your
decisions about your business. Don’t limit yourself to just sales for individual ventures. Track expenses. Track user feedback. Track user demographics. Track market conditions.
Track your progress.Remember that the more data you have, the more information you will have to make your
decisions about your business. Don’t limit yourself to just sales for individual ventures. Track expenses. Track user feedback. Track user demographics. Track market conditions.
Track your progress.Remember that the more data you have, the more information you will have to make your
decisions about your business. Don’t limit yourself to just sales for individual ventures. Track expenses. Track user feedback. Track user demographics. Track market conditions.
Track your progress.Remember that the more data you have, the more information you will have to make your
decisions about your business. Don’t limit yourself to just sales for individual ventures. Track expenses. Track user feedback. Track user demographics. Track market conditions.

Track your progress.Remember that the more data you have, the more information you will have to make your
decisions about your business. Don’t limit yourself to just sales for individual ventures. Track expenses. Track user feedback. Track user demographics. Track market conditions.
Making sense out of your data.
Over time businesses might collect tremendous amount of data. We use computers because it’s practically impossible to store all of that information on paper. Some businesses (like one of my own)
have gigabytes of data stored on computers world-wide. It’s like having a warehouse dedicated just to keep wads of paper with numbers on them. So how can you use all of that for your business’ benefit?
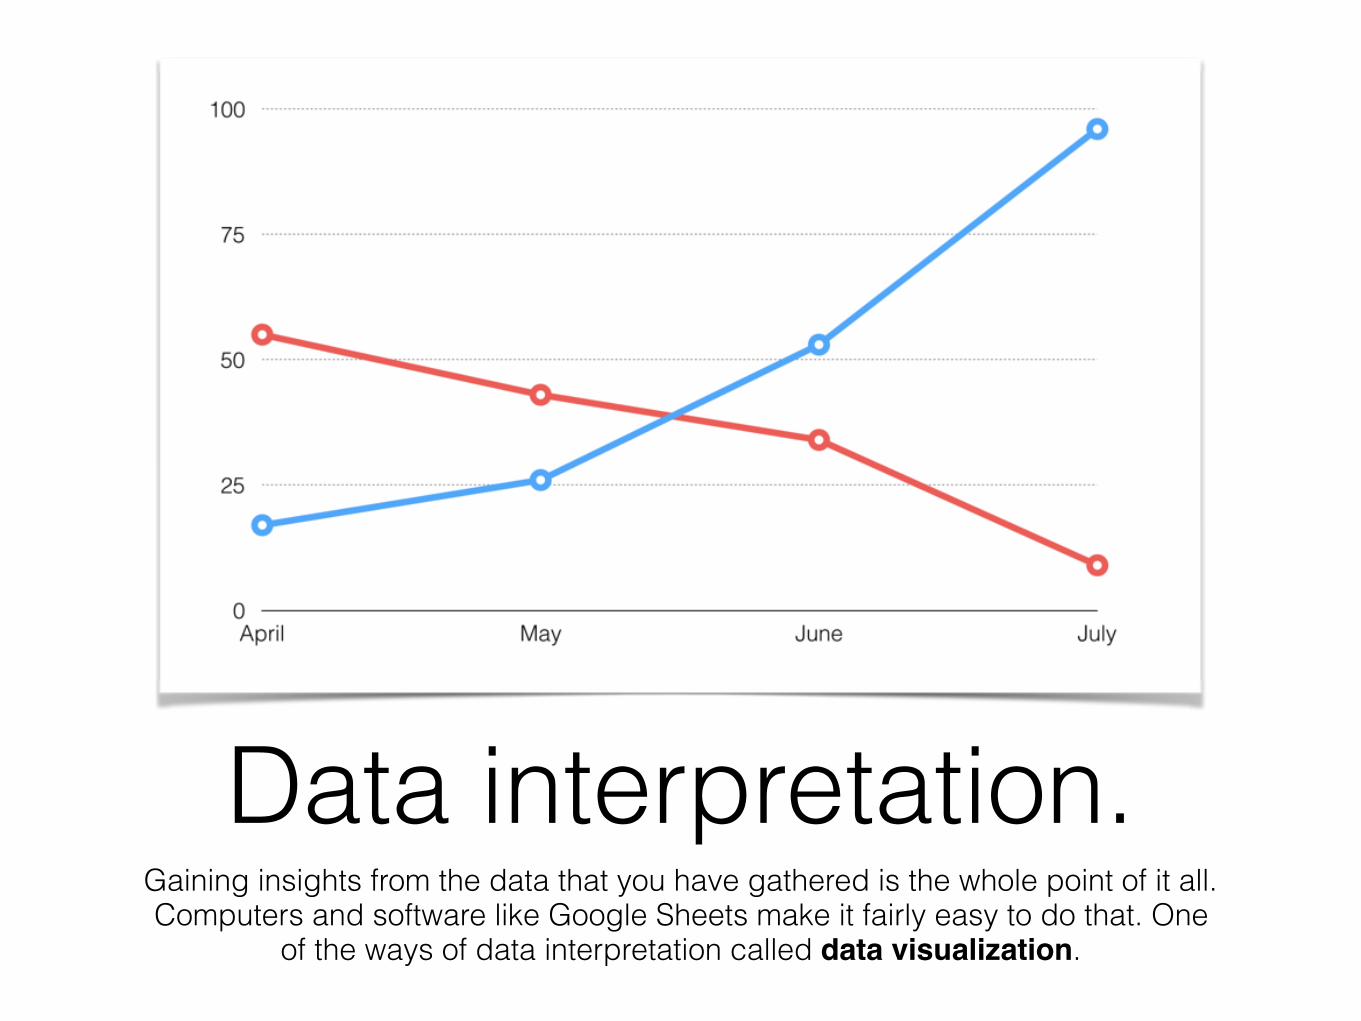
Data interpretation.Gaining insights from the data that you have gathered is the whole point of it all. Computers and software like Google Sheets make it fairly easy to do that. One
of the ways of data interpretation called data visualization.
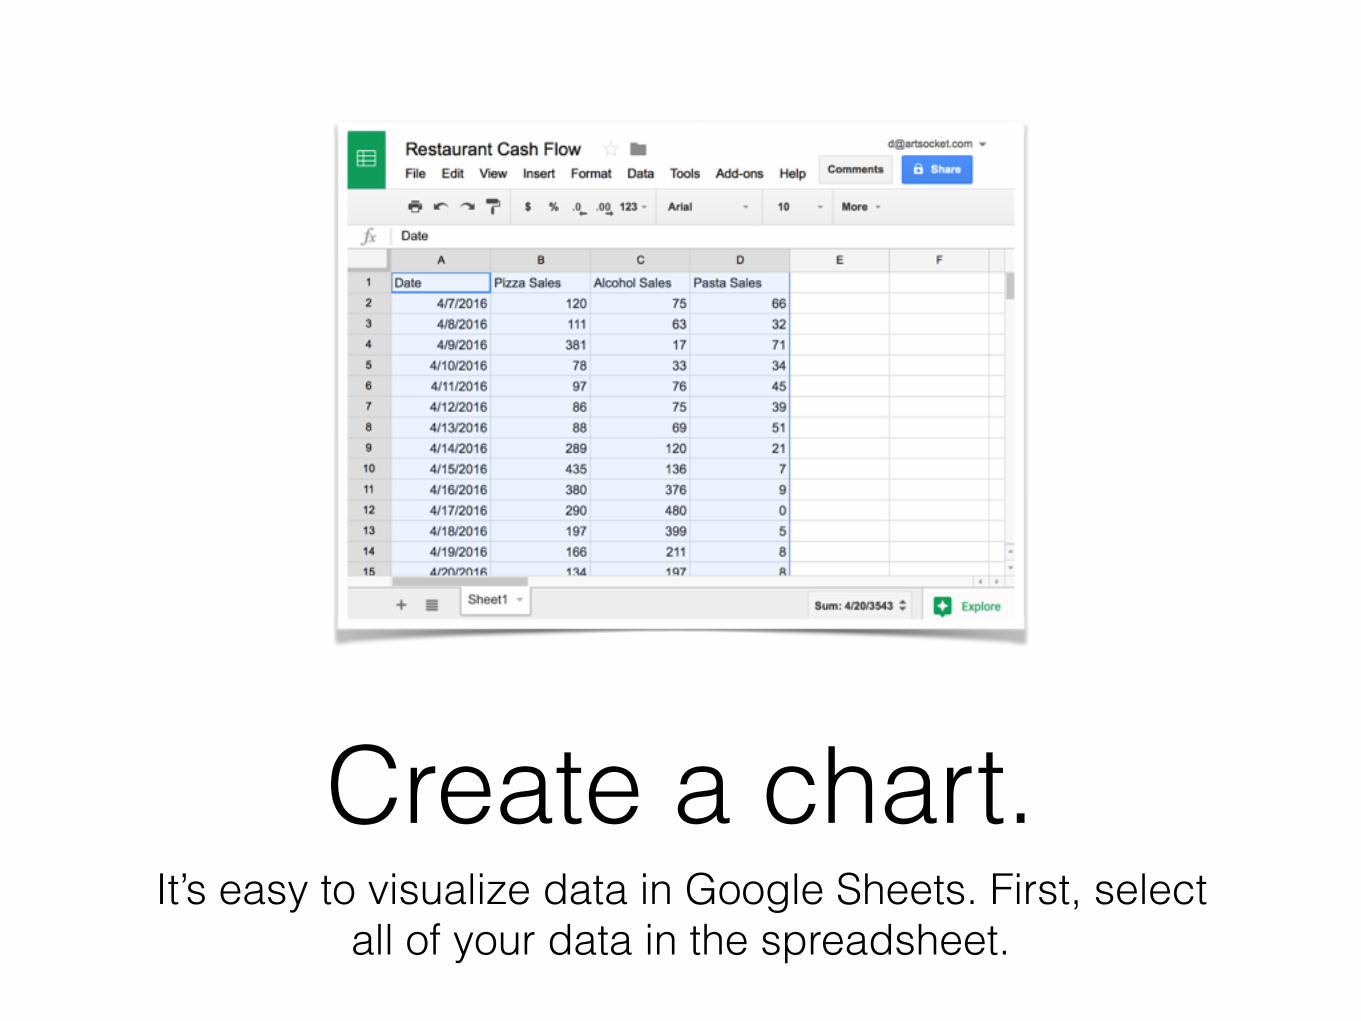
Create a chart.It’s easy to visualize data in Google Sheets. First, select
all of your data in the spreadsheet.

Create a chart.Next click “Insert” and select “Chart”.
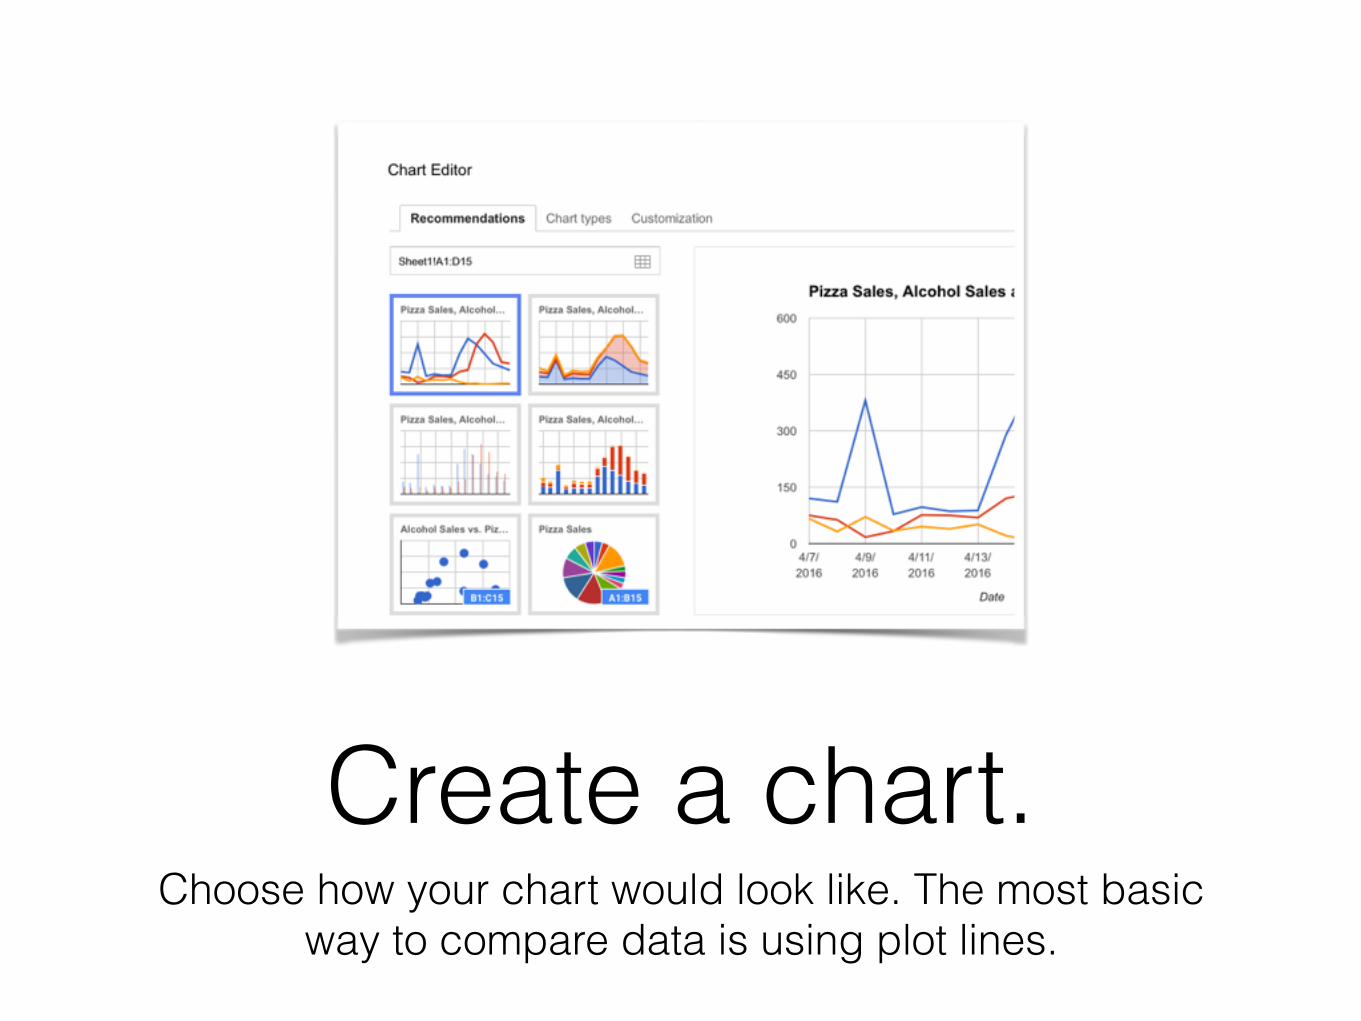
Create a chart.Choose how your chart would look like. The most basic
way to compare data is using plot lines.
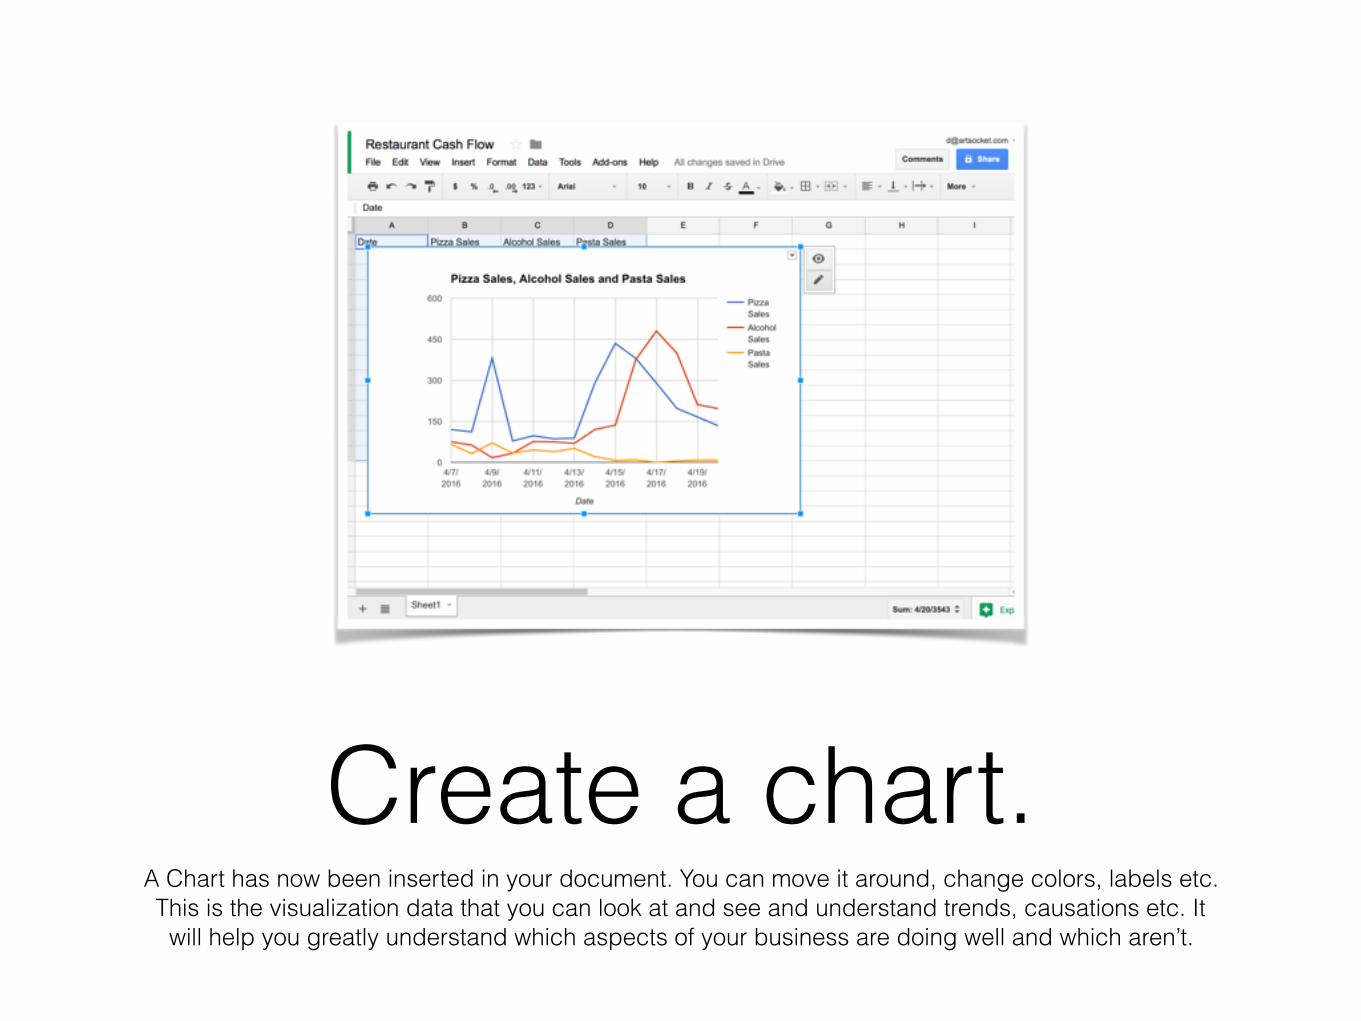
Create a chart.A Chart has now been inserted in your document. You can move it around, change colors, labels etc. This is the visualization data that you can look at and see and understand trends, causations etc. It
will help you greatly understand which aspects of your business are doing well and which aren’t.
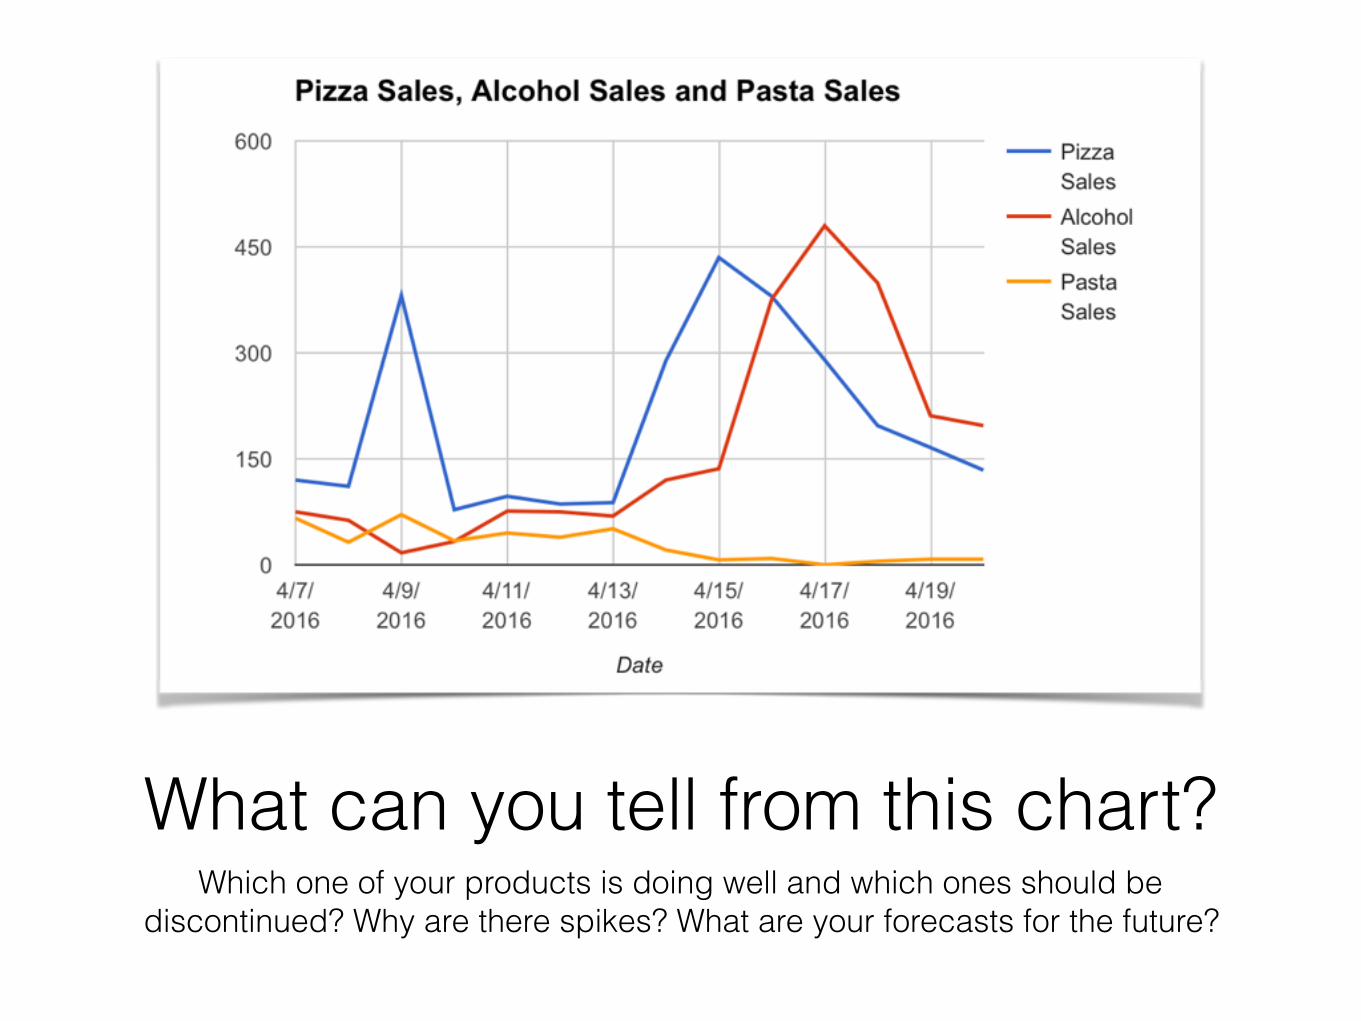
What can you tell from this chart?Which one of your products is doing well and which ones should be
discontinued? Why are there spikes? What are your forecasts for the future?

Making this chart better.What kind of additional information would this chart benefit
from? What data graphs would you overlay on top of this chart?
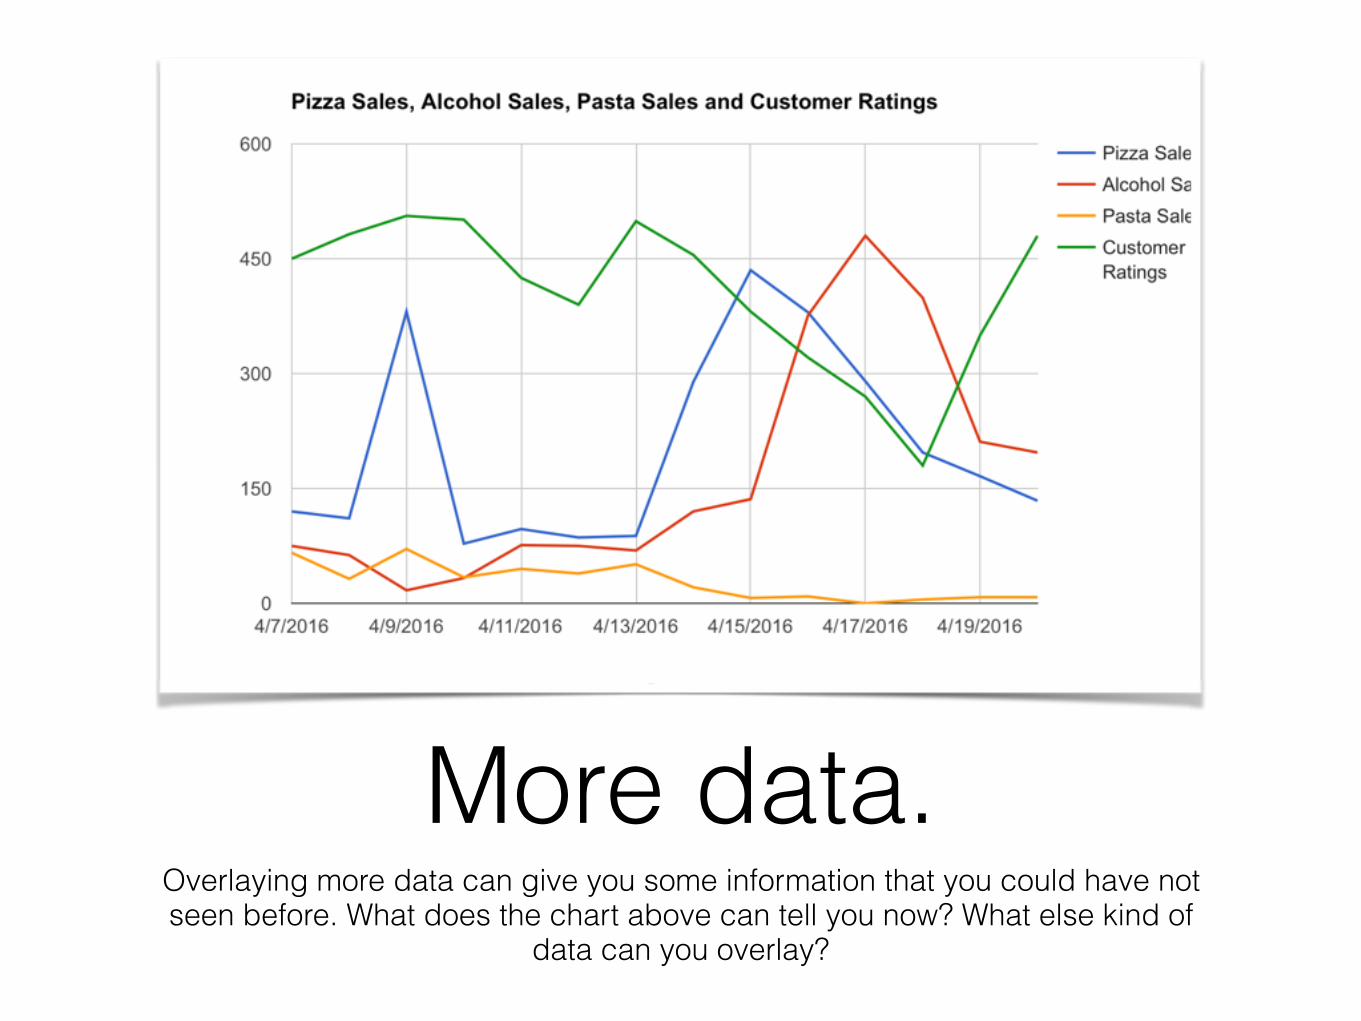
More data.Overlaying more data can give you some information that you could have not seen before. What does the chart above can tell you now? What else kind of
data can you overlay?

How can you apply empathy exercises to understand the trends in that graph?
• What kind of customer stories do you think your visitors have been experiencing?
• How can you actively implement “be your own customer” strategy to better understand what exactly went wrong?

• How do I ____ in Google Sheets.
• ____ doesn’t work in Google sheets.
You can learn how to use Google Sheets yourself.

Assignment.❶ Download Google Sheets.
❷ Create a document and track any real metric that you like.
• Example: outside temperature, how much you spent on food, lengths of these classes, distance you travelled in your vehicle etc.
• Bonus: track two related metrics, like outside temperature & amount of water you drank.
❸ If the internet permits, show me your spreadsheets by the end of this class or tell me what will you be tracking and how often.
❹ At the end of this course, present your graphs and tell me what can you tell from them.