effective communication in corporate organizations: a case
TRANSCRIPT

EFFECTIVE COMMUNICATION IN CORPORATE
ORGANIZATIONS: A CASE STUDY OF KENYA LITERATURE BUREAU
BY
SIMWA ADAVA FRIDAH
K50/71535/2008
RESEARCH PROJECT SUBMITTED IN PARTIAL FULFILLMENT FOR THE
REQUIREMENT OF MASTER OF ARTS DEGREE IN COMMUNICATION
STUDIES OF THE SCHOOL OF JOURNALISM, UNIVERSITY OF NAIROBI.
University ol NAIROBI Library
■BP2011
DECLARATION
This research is my original work and has not been submined for award of a degree at the
university of Nairobi or any other university.
Signed. CW D ate... .?T.!.. . 1L 7 ...3 t C ( (
Fridah Adava Simwa
Reg. No. K50/71535/2008
This research project has been submitted for examination with my approval as the
university supervisor.
.DateSigned.
Patrick Maluki
Lecturer (School of Journalism and Communication Studies)
University of Nairobi
*^0(1
1
DEDICATION
I o my children whose tender love and presence has shed brilliant ideas and supported the
completion of this research.
To my beloved late mother, indeed, you taught me that focus and courage are the most
important virtues.
ii

ACKNOWLE DGEMENT
Sincere appreciation goes to my lecturers at SO J. They guided and encouraged me
through the whole process of attaining this academic qualification. I am indebted to their
wealth of knowledge and the illuminating guidance they gave to this research.
Special thanks to my supervisor Mr. Patrick Maluki for his rime energy and critical
intelligence that guided and shaped this research to what it is today.
Most felt appreciation goes to my colleagues at KLB especially Wanjiku, Jumba,
Kvunguti, Kulamo and Nzamba. Thank you for your endless encouragement, wise counsel
and scholarly arguments that helped shape this research. I cannot forget all the other
members of the editorial team especially Sadera and Masese for their motivating
encouragement.
I am happy to acknowledge my classmates 2008,2009 lot for their support in class and
group discussions that were totally enriching and contributed immensely to this work.
Special gratitude goes to my family members for their continuous love, encouragement and
support. Special appreciation to my dear brother Kefa, he is the reason I have come this
far, he lit my path with academic excellence.
Heartfelt gratitude goes to my loving, caring, understanding, tolerant and most supportive
husband, Moses, who believes 1 can ! This research has been a journey of myriad words of support and encouragement.
iii

ABSTRACT
Effective communication as a field embraced in corporate communication Has received
much research attention as a branch of communication. However, in the local Kenyan
context within corporate organisations, much of the research bears minimal evidence of
existence in form ot documentation. Research in effective communication has therefore not
received adequate documentation. In understanding the above- mentioned, this research
aims at bridging this knowledge gap by undertaking effective communication studies a
case study of Kenya Literature Bureau (KLB) between the years 2005 and 2011.The
objectives of the study were: establishing the structural barriers that hinder the efficient
flow of communication; listing the factors that affect (both positively and negatively)
effective communication; identifying the most preferred medium/media of communication
and access its ability to enhance effective communication ; examining the relevance of
modern information and communication technologies (ICTs) used to enhance effective
communication and establishing the physical and psychological distractions among
employees that affect effective communication within KLB. In order to achieve the set
objectives, data was collected through administering questionnaires to sampled employees
and analyzing existing literature. The departmental Standard Operational Procedures
(SOP) and other library materials carried the core of the qualitative data required. Data
collected was analysed using descriptive statistics such as measures of central tendency
(mean, mode and median). Content analysis was applied on qualitative data to establish
the credibility, accuracy, consistency and usefulness of the qualitative data sought.
IV
TABLE OF CONTENTS
Declaration............................................................................................................................i
Dedication............................................................................................................................. ii
Acknowledgements............................................................................................................. iii
Abstract................................................................................................................................. iv
CHAPTER ONE: INTRODUCTION AND BACKGROUND OF THE STUDY
1.1: Introduction and Background of the Study........................................................... 1
1.2: Statement of the Problem........................................................................................... 5
1.3: Objectives of the Study...............................................................................................7
1.4: Research Questions......................................................................................................7
1.5: Justification of the Study........................................................................................... 8
1.6: Theoretical Framework............................................................................................... 10
1.6.1: Information/ Mathematical Theory of Communication................................. 10
1.7: Hypotheses......................................................................................................................12
1.8: Scope and Limitations of the Study..........................................................................13
1.9: Definition of Terms and Key Concepts................................................................... 14
1.10: Chapter Outline......................................................................................................... 14
CHAPTER TWO: LITERATURE REVIEW
2.1: Introduction 16

2.: Incorporating Effective Communication in Business............................................. 16
2.3: Organizational Communication................................................................................20
2.4: Communication at K LB............................................................................................. 26
2.5: Effective Communication........................................................................................... 27
2.6: Factors Affecting Communication........................................................................... 29
CHAPTER THREE: RESEARCH METHODOLOGY
3.1: Introduction.................................................................................................................. 39
3.2: Research Methodology............................................................................................... 39
3.3: Research Design...........................................................................................................40
5.4: Target Population ........................................................................................................41
3.5: Sample and Sampling Procedures.......................................................................... 42
3.5.1: Validity.........................................................................................................................43
3.5.2: Reliability.................................................................................................................... 43
3.6: Data Collection Procedures....................................................................................... 43
3.7: Data Analysis Techniques.......................................................................................... 44
3.8: Ethical Considerations and Permissions Required...............................................45
CHAPTER FOUR: DATA ANALYSIS, INTERPRETATION AND DISCUSSION
OF FINDINGS
4.1: Introduction...................................................................................................................46
VI
•4.3: Data Analysis, Interpretation and Discussion.......................................................47
CHAPTER FIVE: SUMMARY CONCLUSIONS AND RECOMMENDATIONS
5.1: Introduction...................................................................................................................80
5.2: Summary.........................................................................................................................80
5.3: Conclusion......................................................................................................................81
5.4: Recommendations.........................................................................................................82
REFERENCES .................................................................................................................85
Appendix 1............................................................................................................................ 90
Table 2.1 ................................................................................................................................. 26
Table 3.1..................................................................................................................................41
Table 4.1 ..................................................................................................................................48
Table 4.2..................................................................................................................................48
Table 4.3..................................................................................................................................49
Table 4.4 ..................................................................................................................................51
Table 4.5 ..................................................................................................................................51
Table 4.6 ..................................................................................................................................53
Table 4.7 ..................................................................................................................................54
Table 4 .8 .................................................................................................................................. 56
Table 4.9 .................................................................................................................................. 58
4.2: Population Studied.......................................................................................................46
vii
Table 4. 11................................................................................................................................61
Table 4. 12............................................................................................................................... 63
Table 4.13................................................................................................................................64
Table 4.14............................................................................................................................... 67
Table 4. 15............................................................................................................................... 68
Table 4.16............................................................................................................................... 69
Table 4.17............................................................................................................................... 73
Figure 1.2............................................................................................................................... 12
Figure 2 .1 ............................................................................................................................... 28
Figure 2 .2 ............................................................................................................................... 30
Figure 2 .3 ................................................................................................................................34
Figure 4 .1 ................................................................................................................................49
Figure 4 .2 ................................................................................................................................50
Figure 4.3 (a).......................................................................................................................... 52
Figure 4.3 (b ).........................................................................................................................53
Figure 4.4 .............................................................................................................................. 55
Figure 4 .5 ............................................................................................................................... 55
Figure 4 .6 ............................................................................................................................... 57
Figure 4 .7 ................................................................................................................................57
Figure 4.8 (a)..........................................................................................................................58
Figure 4.8 (b ) .........................................................................................................................60
Figure 4 .9 ................................................................................................................................62
Table 4.10................................................................................................................................59
viii

Figure 4.10............................................................................................................................. 65
Figure 4 .11............................................................................................................................. 65
Figure 4.12............................................................................................................................. 70
Figure 4.13............................................................................................................................. 71
Figure 4.14............................................................................................................................. 74
Figure 4.15............................................................................................................................. 75
IX

LIST OF ABBREVIATIONS AND ACRONYMS
SOJ — School of Journalism
ICT - Information Communication Technology
KLB - Kenya Literature Bureau
NGO - Non-Governmental Organisation
SOP - Standard Operation Procedures
SAGA — Semi Autonomous Governmental Authority
x
CHAPTER ONE
INTRODUCTION
1.1: Background of the Study
For any organization to build its status in the corporate world and with its stakeholders,
effective communication plays a cornerstone function. Communication departments play
key roles in the management of internal and external communication. They are vital in the
sharing of knowledge and decisions with employee as well as stakeholders. Further,
effective communication forms the biggest link between the organization, its stakeholders
and the general public.
Effective communication can be defined as an interactive process that involves the design
of ideas, message, and information as well as their dissemination with an attempt to realize
change in a person’s behaviour and/or to persuade him/her to act in a particular or
predetermined manner (Okwo, 1995). On his part, Nzerem (1996) views effective
communication as the process of encoding and decoding messages or information. In this
case, a medium (sounds, gestures, books, graphics and other media) is usually engaged.
McQuail (2000) on his part sees effective communication as a process of increased
commonality or sharing of information between participants on the basis of sending and
receiving messages. For communication to be termed effective, Fielding (2006) sees it in
terms of organizational set up which should be done through downward, sideways
(lateral) or upward communication. To him, effective communication would not only
ensure that products and services are of the best quality, but also that staff would generate
new ideas, adapt to changes and work cohesively in understanding the organizational
objectives and work to achieve them.
1
Clark and Delia (1979) believe that there are three basic objectives in any communication;
instrumental objectives which pertain to the communicator’s goal, interpersonal objectives
which relate to forming and maintaining relationships with other people and identity
objectives which deal with image formation of not only the individual but also the
organisation. This means therefore, effective communication is important both to the
employee and the organisation.
Communication can also be viewed as a process of effectively conveying information,
expressing thoughts and facts, the demonstration of the effective use of listening skills as
well as the depiction of openness to other people’s ideas and thoughts (Daly, 2003). Based
on the fact that the act of communication is for a purpose - it is aimed at influencing,
persuading, modifying and changing the behaviour of individuals- the expectation of
feedback always follows the conveyance of information. Such feedbacks enable
communicators to establish if the information was actually passed and whether it was
effective or not. This corroborates Erven (2001) who sees effective communication as
being when the original sender gets the desired effect on the receiver. At its best, effective
communication minimizes misunderstanding between sender and receiver. On the
contrary, the absence of the desired effect on the receiver or the occurrence of unexpected
effect can be referred to as ineffective communication.
In corporate organizations, communicating effectively is regarded as the processes
companies employ in the communication of all its messages to its major constituencies. It
has major roles such as: (a) encoding and promoting a strong corporate culture; (b) a
coherent corporate identity; (c) an appropriate and professional relationship with the
media and (d) quick and responsible ways of communicating in times of crisis e)
2
minimizing conflict escalation. In addition, it defines the communication of an organization
with its stakeholders and how it brings a company's values to life. In a nutshell, effective
communication in corporate organizations can be defined as the products of
communications such as use of memos, reports, letters, websites, community engagement
as well as social and environmental initiatives that a company sends to its publics (internal
or external), (Glover and Rushbrooke 1983).
Communicating effectively would be perceived therefore as encoding or exchanging
information and signals in such a way that the receiver can comprehend or grasp mentally
the intention of the sender to be able to act on that information and provide feed back that
the message received is the message intended. Once this is done and feedback is received
on both sides (sender and receiver) then, we can say that effective communication has
taken place.
As already stated, effective communication is of principal importance to corporate
organizations. It goes without saying that within the process of accomplishing their
respective production and social functions, individual members of groups have to
communicate with each other. In addition, groups need to communicate with other groups
within organizations. To this end, the communication employed is both formal and
informal (Kraut et al., 2002). Crosscutting through all spheres of life, effective
communication is essential in organizations for managerial effectiveness. In this regard,
parastatals are of no exception since managers spend a lot of time interacting with other
members of staff for purposes of achieving various organizational objectives.
3
In the past, managers spent a large portion of time and company resources communicating
in different ways such as meetings, face-to-face discussions, memos, letters, e-mails,
reports among others. DeFleur (1995) notes that in our sophisticated information-
technology led age, communication is handled through satellites, computers and news
media with worldwide reach, but still word of' mouth is essential in effective
communication since signals and symbols accompanying face to face interaction add value
to the sent messages. This is particularly so now that service workers outnumber
production workers in many organizations and research as well as production processes
are calling for augmented collaboration and teamwork between workers in different
functional groups (Kraut et al., 2002).
Corporate Communication- Case of Kenya Literature Bureau
Kenya Literature Bureau (KLB) is a state owned corporation established under the
Kenya Literature Bureau Act chapter 209 of 1980 from the originally existing East African
Literature Bureau. KLB’s vision is to be the preferred publisher of quality reading
materials and has a mission of publishing quality educational and knowledge materials at
affordable prices, promoting local authorship and providing shareholder value .KLB is
mandated to carry out several activities key among them being; to publish, print and
distribute reading material, acquire copyrights, rights and licenses and promote encourage
and assist Kenyan authors while maintaining quality authorship.
According to Kenya government report on performance contracting (2009- 2010), KLB
was ranked second best parastatal nationwide, first by the Ministry of Education and third
best Semi Autonomous Governmental Authority (SAGA). In terms of business
performance KLB hit the 1 billion turnover mark in 2008 .
4
KLB is committed to effectively and efficiently serve the customer with courtesy, integrity
and fairness and believes in effective and timely communication and keeps all channels ol
communication open to all. Regular feedback is encouraged regarding its products and
service delivery. About communication, KLB strongly believes that effective
communication can be used to manage change and ensure prompt delivery of services as it
includes feedback mechanisms. Owing to the fact that it is a main stream publishing house
in East and Central Africa, effective communication is of great importance in its’
operations. This study aims at determining the factors that affect effective communication
in corporate organisations, with KLB as the case study.
1.2: Statement of the Research Problem
Effective communication is the driving force behind successful operations in organisations.
An organisation that is to thrive well in the competitive business world needs to employ a
strong and efficient communication policy as well as a strategy, which will see it, form a
strong corporate identity, cater fully for the information needs of the internal and external
publics and to partner with media. A particular organisation will have a communication
style and its members will make sense of the world by drawing on their understanding of
communicative codes and conventions.
Kenya Literature Bureau (KLB) is mandated to carry out several activities key among
them being; to publish, print and distribute reading material, acquire copyrights, rights
and licenses and promote encourage and assist Kenyan authors while maintaining quality
authorship. KLB is committed to effectively and efficiently serve the customer with
courtesy, integrity and fairness and believes in effective and timely communication and
keeps all channels of communication open to all. Regular feedback is encouraged
5

regarding its products and service delivery. Owing to the fact that it is a mainstream
publishing house in East and Central Africa, effective communication is of great
importance in its operations.
The KLB’s (2005 — 2009) strategic plan recognizes the importance of maintaining a
competitive profile of the publishing industry within the country as well as employing a
strategy anchored on new products development, high quality of products, service delivery
and effective institutional support processes and systems. An analysis of the strategic plan
further reveals that much emphasis has been laid on; business review, new products,
regional markets, customer service delivery, human resources development and finance.
The current strategic plan (2010- 2015) details five main objectives to be achieved in the
said period of operations. The focus of this research is on the second objective that states
that KLB will improve on quality of products, services and increase productivity levels by
collecting and studying market feedback, tendering of new production equipment,
introducing appropriate reward mechanisms for stakeholders and customer service
training for staff. All the listed activities can only be done through communication.
The two strategic plans have not clearly defined effective communication and strategies to
be employed to achieve the required high business performance among the objectives
stated within the two documents. Proper and adequate attention needs to be put on the
subject of effective communication in order to strengthen communication at KLB.
It is against this background that the study endeavored to establish weather occasional
KLB books shortages in the market, delayed delivery of customer orders, lengthy
unapproved list of books from K.I.E and delayed production of some titles among other
problems are linked to effective or ineffective communication strategies employed by the
6

start of KLB. This study therefore aimed at determining the factors that affect effective
communication in corporate organisations, with KLB as the case study.
1.3: Objectives of the Study
The general objective of this study was to assess the extent to which good communication
skills affect effective communication within corporate organizations;
The following specific objectives were be used:
(i) 1 o establish the structural barriers that hinder the efficient flow of information at
KLB;
(ii) To identify the most preferred medium/media of communication in KLB and access
it ability to enhance effective communication;
(iii) I o examine the relevance of modern information and communication technologies
(ICTs) used to enhance effective communication within KLB;
(iv) To establish the physical and psychological distractions among employees that affect
effective communication within KLB.
1.4: Research Questions
The research was be guided by the following questions: -
(i) To what extent do structural barriers affect effective communication at KLB?
(ii) To what extent does the absence of good communication skills (clarity of messages,
language command, good listening skills and adequate feedback) affect
communication within KLB?
(iii) What is the most preferred channel of communication within KLB as an
organization?
7

(iv) Do modern Information and Communication Technologies (ICTs) enhance effective
communication within corporate organizations?
(v) Do physical and psychological distractions among employees affect effective
communication within corporate organizations?
1.6: Justification of the Study
Major organizations put emphasis on the importance of communication within all
development initiatives. For purposes of broadening the scope and extent of services,
many organizations are employing communication as an effective marketing tool. The day-
to-day interaction of an organization with its stakeholders, employees and other interested
groups within the community always need effective and robust communication
mechanisms. Leading organizations have their own communication team with efficient
communicators who are responsible for communication function with various national and
international organizations.
To this end, many organizations have put in place fully-fledged communication
departments that employ communication experts. In some other organizations,
communication tasks are incorporated in other departments such as corporate affairs and
marketing.
It is vital to underline that effective communication plays a major role in formulation,
implementation, monitoring and evaluation of projects or activities in corporate
organizations. In addition, effective communication is vital in the sense that it helps
organizations market their missions and values to clients as well as stakeholders. In
essence, communication also plays an important role in influencing employees' loyalty to
8
the organization as well as boosting its external image to the external world. In Theoretical
terms, effective communication in corporate organizations upholds relations between
managers and stakeholders. In addition, the media as well as other channels play key roles
to stakeholders in providing them with information. Such information enables them to
develop perceptions of these organizations.
With the understanding that communication plays a vital role in organization, a survey of
the factors that affect its effectiveness was indispensable. This study therefore aimed at
investigating the major factors that affect effective communication and their relative
impact at Kenya Literature Bureau.
The study will also contribute immensely to the already existing body of knowledge on
effective communication and its practice in corporate organizations in Kenya as well as
bridge the knowledge gaps in the field of effective communication within corporate
organisations. It will help such organizations, whether private or governmental to
formulate relevant and valuable policies that shall enhance specialized training in
communication management so as to reap the fruits that emanate from effective
communication.
Specifically, this research should benefit a number of individuals, groups of people and
institutions. The Government Institutions include Ministry of Information and
Communication; the findings could be used to formulate policies regarding effective
communication at the work place stemming from the ministerial level. Chief Executive
Officers may use the findings of the research in formulating communication policies in
their organizations.
9

Corporate Affairs and Communication Directors and managers may use the findings of
this research in the day to day running of their work to enhance their job performances
and achievement of set organisational objectives. Higher learning Institutions specifically
university and colleges through their lecturers may find the need to incorporate the
findings of this study in designing and planning for detailed and specific short and long
term courses for training the management cadres of different organizations. The findings
of this research may enhance planning for training in Human Resource Departments. The
findings would help this department in planning to cater for training needs of all
employees in effective communication at different levels. NGOs; It will help these
organizations to seek funds for training in the field of communication. Parents will benefit
by developing Interpersonal skills which would help in parenting especially the teenagers
and enhance overall family communication.
1.7: Theoretical Framework
This study was based on information theory of communication. The theory looks at how
information can flow from its source to its destination with minimum distortion and errors.
The mathematical/information theory of communication was developed by Claude
Shannon in 1948, Shannon (1948). With the advancement of research and theory, the
impact organizations have on the way employees communicate and the positive/negative
impact of such communication on organizations has been explained (Morgan, 1986;
Redding, 1985).
1.7.1: Information Theory/Mathematical Theory of Communication
Technically, communication is viewed from the information theory standpoint (Shannon
and Weaver, 1949). According to Shannon, communication is a mechanistic system (see
10

Figure 1.2). Shannon's motivation arose from the need to design telephone systems to
cany the maximum amount of information and to correct for distortions in the lines ot
communication. He introduced the concept of channel within the communication process.
He examined signal to noise ratio. Shannon explained that for communication to be
complete and well understood, the noise ratio has to be lower compared to the signal ratio.
Shannon also introduced the concept of measuring the amount of information in a
message, which he calculated mathematically. To Shannon, the amount of information in a
message is a measure of surprise and is closely related to the chance of one of several
messages being transmitted. A message is informative if the chance of its occurrence is
small; in contrast, a message that is very predictable has a small amount of information. He
noted that if entropy rate exceeds the channel capacity then there were unavoidable and
uncorrected errors in the transmission. He also showed that if the sender’s entropy rate is
below the channel capacity then there is a way to encode the information so that it is
received without errors (The Exploratium 1996). Shannon adopted his theory to analyze
human written language. He showed that it is redundant, using more symbols and words
than necessary to convey messages. The information theory looks at how information can
flow from its source to its destination with minimum distortion and errors.
In corporate communication, the challenge is to reduce the amount of noise in
communication. One needs to apply this approach with some alterations to make the
analysis less technical and mathematical. As stipulated by Shannon, noise affects the
incoming signal and may largely interfere with the received signal. In corporate
communication noise emanates from physical and psychological barriers and distractions,
semantics, voice projections, symbols among other factors (Infante 2003). In this study it
shall be necessary to identify what constitutes noise and ways of overcoming noise.
11
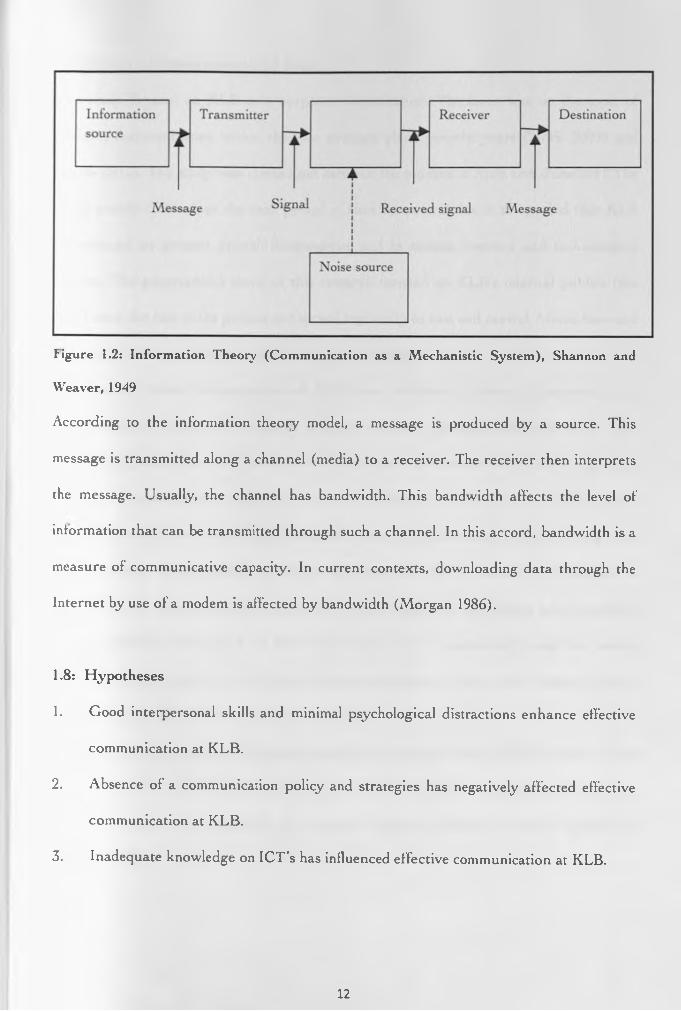
figure 1.2: Information Theory (Communication as a Mechanistic System), Shannon and
Weaver, 1949
According to the information theory model, a message is produced by a source. This
message is transmitted along a channel (media) to a receiver. The receiver then interprets
the message. Usually, the channel has bandwidth. This bandwidth affects the level of
intormation that can be transmitted through such a channel. In this accord, bandwidth is a
measure of communicative capacity. In current contexts, downloading data through the
Internet by use of a modem is affected by bandwidth (Morgan 1986).
1.8: Hypotheses
1. Good interpersonal skills and minimal psychological distractions enhance effective
communication at KLB.
2. Absence of a communication policy and strategies has negatively affected effective
communication at KLB.
3. Inadequate knowledge on ICT’s has influenced effective communication at KLB.
12

The study focused on KLB as a corporate organisation. The focus was on the topic of
effective communication within the two strategic plans periods: years (2005- 2009) and
(2010- 2015). The study was carried out between the months of April and June 201 l.The
study mainly focused on the said period of time because it this is the period that KLB
experienced its greatest growth businesswise and in human resource and technological
aspects. The geographical scope of this research focused on KLB’s internal publics (the
stall) since the rest ol the publics are spread regionally to east and central Africa, time and
financial constraint would not allow the larger coverage.
The current formal documentation at KLB does not show evidence of existence of a
communication policy and strategy guiding effective communication at KLB. The
shortcoming experienced by the study was inadequate documented information regarding
effective communication at KLB. The research therefore borrowed from works studied
during literature review and library research, which are different from KLB’s setting. The
study therefore experienced the challenge of contextualizing the content to the Kenyan (at
KLB’s) local setting. Depending on the state of psychological destructions, some questions
in the research tool may have been be termed "noise” particularly with the senior
management and may have elicited some untrue answers since they are the parties directly
involved in the organisation’s policy formulation.
As earlier noted, this research covered mainly the internal publics of KLB, which in one
way or the other may be a demeanor to the study. It is therefore recommended that other
studies in future be established to cover the external publics and other spheres of
communication.
1.9: Scope and Limitations of the Study
13
The following terms will be restricted to the definitions and explanations as given or as
used in this research.
Bandwidth: Range of’ frequencies used to transmit signals or data.
Communication Channel: refers to the means by which the message is transmitted.
Communication Process: refers to the process of sending and receiving messages with
attached meanings.
Decoding: retrieving and understanding send messages as intended.
Encoding: Sending clear messages.
Entropy: Measure of the rate of transfer of information in a particular message.
Effective Communication: refers to the accuracy of communication send, received and
decoded and embraces feedback.
Efficient Communication: refers to the cost of communication.
Feedback: Refers to the process through which the receiver communicates with the sender
by returning another message.
Noise: Refers to anything that interferes with encoding and decoding of messages by the
receiver.
Physical Distractions refer to any aspect of the physical setting in which communication
takes place that interferes with the communication process.
Psychological Distractions: Conditions that interfere with one’s state of mind which in
turn interfere with normal or required way of interacting of an individual at the place of
work.
1.10: Definition of Key Terms
14
1.11: Organization of the Study (Chapter Outline)
The study was organized in five chapters. Chapter one presents an introduction which
includes background ol the study, statement of the problem under study, purpose of the
study, objectives ot the study, research questions, theoretical framework, assumptions of
the study, scope and limitations ot the study, definition of key terms and organization of
the study. Chapter two incorporated the literature review while chapter three included the
research methodology to be used in the study. On its part, chapter four consisted of data
analysis and findings ot the study. Lastly, chapter five included discussions, conclusion,
recommendations and suggestions for further research.
15

CHAPTER TWO
LITERATURE REVIEW
2.1: Introduction
In this section of the research, a review of the related literature on the subject under
investigation is presented. There is a systematic identification and analysis of documents
containing information related to the study problem. The review involved textual analysis
ol reports as well as documents by various authors that focus on factors enhancing
effective communication in organizations.
iMugenda (2008) elicits that models and frameworks by writers are used to illustrate the
various subtopics drawn from the objectives of the study. Upon the review of related
literature the researcher attempted to establish the existing gaps to be filed in this study.
The review is divided into four key sections that include introduction, organizational
communication, the concept of effective communication and factors affecting effective
communication at KLB.
2.2: Incorporating Effective Communication in Business
In this century, communication has attained a paramount position in all sectors of the
global economy. As a result, many academic discourses have concentrated on its use in
corporate organizations. Its importance in the application of marketing techniques in the
corporate industry has been underlined. Presently, effective corporate communication is
indispensable in the success of every business. As a result, major companies have identified
its effect globally thus business giants worldwide like Standard Chartered, Barclays and
British American Tobacco have employed effective communication strategies through their
public relations departments and have greatly reaped of its fruits and continue to soar high
16

up in the business world. Cees Van Fombrun (2007), views corporate communication as
activities of managing internal and external communication aiming at creating favorable
starting points with stakeholders of the company. Effective communication promotes
business growth as well as the competitive edge of any organization (Sriramesh and Vercic
2009).
\\ hereas the study of organizational communication is not new, it is only recently that it
has been recognized as a held of academic study to a larger extent. This has mainly been in
response to the ever-increasing needs and concerns of business. To this end, that all
organizations, not just business organizations, have effective communication needs and
challenges has been well underlined. According to Kraut et al. (2002), proponents of
organizational communication training recognize that managers should be trained to not
only be effective speakers but also to have good interpersonal communication skills.
Caputo (2003) emphasizes on the need to harness effective communication skills to pass
the intended messages through words or signals.
Managers should ensure the accessibility of information as it Hows freely within the
organization. This can only be realized when information is communicated effectively to all
the employees. Thus the ability of all parties to communicate and transfer the necessary
information meaningfully and resourcefully is vital for effective communication. In the
light of this, it is worth noting that the communication process of any organization
influences its position in the current ever-dynamic corporate world. This is particularly so
since communication is inevitable tor each and every business process. The growth of an
organization is enhanced by the effective exchange of information and knowledge with the
internal groups as well stakeholders.
17

Whereas Communication is arguably enshrined within the management processes ot major
organizations, its effectiveness is enhanced by a number of factors. These factors that
rotate around the message being conveyed, its sender, the receiver or even the medium
employed (Erven, 2001). Such factors can be broken further into micro-factors; this study
investigated.
One main factor that contributes to effective communication is clarity of messages in the
communication process. To state the message firmly and correctly, the sender needs to
make the content and the metacommunication congruent. There has to be adequate grasp
of key communication skills on the sender and the receivers’ parts, (Glover and
Rushbrooke 1985).
Clarity of messages reduces noise that interferes with messages. Noise can be divided into
three types of interferences according to Bunnow (1999). These are external, internal and
semantic interlerences. Whenever messages are not clear, the sender leaves the receiver
without clarity ol his/her intention. The causes of unclear messages may be confusion on
the thinking of the sender, or semantics among other factors.
Caputo (2003) has emphasized that the use ol voice, gestures and symbols, words and
sounds to enable communicators do their work effectively (verbal and non verbal cues).
They assert that, if our voice is a primary index of our personality the sound of the voice
can either add or reduce the effectiveness of the message on the audience. Most effective
communication experts blend the elements ol speech (tone, vocal, quality, pitch and pace)
into seamless tapestry to come up with very effective messages (ibid).
18

Psychological state of mind of both the encoder and decoder is another key factor that
contributes to effective communication. People, groups, events or things can be
oversimplified conceptions, beliefs and opinions and it can replace thinking, analysis and
open mindedness to new situations in organizations. As such employees in organizations
can overlook messages on assumptions that they already know the meanings of such
messages. Greene and Burleson (2003, p. 137) state that psychological discomfort may
arise from people lacking some social skills. This may emanate from inadequate exposure
and lack of a role model to emulate. This group therefore becomes challenged in effective
communication. They see psychological problems as a source of deterioration of social
skills that in turn hamper effective communication. Environmental stressors also do add to
this state.
In addition, the choice of channel is crucial in the transmission of various messages.
Correct channels enhance the effectiveness of communication. To this end, the sender
should be sensitive to characteristics of the message whilst choosing a channel (Erven,
2001). Allocution in organisations is a major factor that contributes to ineffective
communication. McQuail (2000) notes that here; information is distributed from a centre
simultaneously to many peripheral receivers, which in turn give rise to limited opportunity
for feedback. Inadequate feedback is reason enough to term the communication process
ineffective.
The language employed in communication determines its effectiveness. Language in
communication is a medium and for it to be effective it has to be shared and understood by
the members in the communication process. In this regard, the choice of language
determines the perceptions of messages by receivers. Proper use of gestures and symbols
19

enhance communication. Baltes et al (2009), recognize the importance of using gestures
and symbols in special instances where for instance one want to communicate with the
hearing impaired people. There could be employees of this special kind and effective
gesture communication should be employed. Hand gestures are extensively employed in
human non-verbal communication.
Another major factor enhancing communication is presence of feedback. This is
underlined by the fact that feedback indicates how the message sent was decoded and
perceived by the receiver. Further, feedback makes communication two-way without
which communication is rendered ineffective. Organizations should also ensure that
members of staff have good listening skills and interpersonal skills since poor listening
skills hinder effective communication.
2.3: Organisational Communication
Organisations are termed as formal bodies engaged in a purposeful activity. Organisations
exist with prescribed activities co-ordinated and controlled to achieve set goals through
employing given strategies and guided by set objectives. All this is carried out through
communication processes. The communication processes adopted by a given organisation
are guided by the organisations culture, policies and bureaucratic set up (Glover and
Rushbrooke 1983). Organisational communication plays the key roles of, aiding
managerial performance, understanding and acceptance of work, leadership, objectives co
ordination, job satisfaction, saving on time and effort and aid in fostering positive image
building through public relations (Saleemi and Bogonko 1997). Organisational
communication helps in defining the organisation’s mission, vision and goals with clarity
(ibid).
20

Existence of effective communication within an organisation is determined by the
organisation’s structure, medium chosen to communicate and existence of feedback
(Glover and Rushbrooke 1983).
The principles of effective communication may vaiy from organisation to another but
basically they include firstly clarity of messages. Much attention should be put to avoid
vague and ambiguous messages in organisations. Members of an organisation require
adequate information for effective performance. Thirdly, right timing is important to
reinforce utility of communication. Integrity is the fourth principle of effective
communication within an organisation as it serves to achieve the organisational goals.
Participation is of importance too in effective communication as it helps promote mutual
trust and confidence between the sender and receiver of messages. Strategic use of the
grapevine cannot be down played as it supplements and at times strengthens formal
channels of communication. The system of communication chosen should be flexible to aid
the organisation adjust to the changing requirements facing the activities of the
organisation. The communication model or channels chosen should be affordable but tailor
made to suit the communication problems and requirements of the organisation (Saleemi
and Bogonko 1997).
Glover and Rushbrooke (1983) emphasize the need for each organisation to set its
communication objectives that should be done in a policy manual and it should constantly
be updated or else it will lead to inability to cope with non-routine matters where
guidelines have not been drawn. Mullins (1985) describes policy as developed guidelines
formed within the frameworks of goals and objectives that provide the basis for decision
making and the course of action to be taken in order to achieve set objectives. He further
asserts that without a policy statement and an explicit strategy, management and
21

expansion of organisations becomes difficult as staff end up working at cross-purposes.
Success in business competitiveness and dynamic external environment calls for
development of strategic communication and a corporate strategy to help the organisation
cope with pressures and demands of change. Policy and strategy help in defining plan of
action as well as coordination and control of activities within the organisation (Mullins
1985).
An organisation can choose to communicate effectively through the designs of; chain,
wheel, circle or all-channel communication. In hierarchical organisations mainly chain
communication is chosen and he advises that shorter chains be adopted as this reduces
message distortion. In wheel communication, staff should be willing to share information
freely or else gate keeping takes the upper hand here and information may be sifted to
guard personal interest. In the circle communication designs, it is advised that a clear
terms of reference be defined to guide processes as lack of it will cause confusion and limit
effective communication. Finally, all channel design is the most effective in communication
within an organisation as it permits cross communication that prevents distortion of
information. However, one key arbitrator should guide it to co- ordinate and control. That
is why companies need to have a communication’s person performing this function (Glover
and Rushbrooke 1983).
Effective communication is born from effective management whose objectives are rooted
in establishment of key tasks, identifying performance standards, setting objectives,
identifying constrains and deciding on the plan of action within an organisation. Once the
management objectives have been achieved, effective communication will have been
achieved too since it is a major branch of management in organisations (Mullins 1985).
22
A highly effective organisation is defined by the results it has which portrays the
management style employed as all activities of an organisation are run primarily through
effective communication. Processes, work schedules objectives should also be
communicated to employees in ways and using channels that can be easily understood.
Employees on their part should conveniently and freely communicate their feelings about
work as this depends on the feedback mechanisms put in place to enhance effective
communication. (Armstrong 1996).
Communication within an organisation is seen to take four perspectives namely; skills,
techniques, systems and attitudes (Harlow 1967). Whether effective or not,
communication is at the heart of many interpersonal problems faced by managers in
organizations. Infante (2003) observes that organization members perform communication
activities to reduce uncertainty of the environment.
There are four main communication media namely; speech, written communication visual
communication and non-verbal communication. An organization does carry both internal
and external channels of communication. Visual communication is key to effective
communication as it takes mainly the sense of sight. It may also be developed through the
use of words to reinforce the message being communicated (Glover and Rushbrooke
1983). Although it may be categorized as a type of communication a greater percentage of
it blends with the other forms or types of communication. For instance, if one wants to
read, decode non-verbal cues, and interpret a picture will use the sense of sight. With this
understanding it is important to note that popular communication materials like flyers, use
of graffiti, suggestion boxes, leaflets and brochures is key to effective communication
23
within corporate organisations. Visually, employees to express their inner feelings can use
to graffiti, which is a form of communication. It may be done publicly but mainly it is
normally placed in private strategic places in organisations by employees. Suggestion
boxes may too serve the same purposes as they serve as an alternative private means of
communication as mainly anonymity is used. According to Clair (2003) graffiti is the main
original form in which a less tree society or people can express themselves and it is
ditferent from wall paintings.
One other major form that etfective communication may take in an organization is use of
brochures. Brochures should be made with a subject of interest, should answer basic
questions and communicate information easily not technically (Kolin 1998). Etfective
brochures serve the purposes ot convincing, urge a customer to try a product or service,
explain a policy or encourage behavior change. In so doing, brochures communicate
specified information he users ot the brochures. Key among the considerations one should
have is to understand the literacy levels of the users so the brochures so that etfective
messages are designed. Brochures are good within an organization because they are
developed through a team’s effort (ibid)
According to Kolin (1998) newsletters may also be used to communicate effectively with
employees ot an organization. In newsletters, employees may be informed of certain issues
within the organization. Specific needs of the audience are looked into and communicated
easily.
Posters and flyers also do take another form in which effective communication can occur
within an organisation. They can be displayed to form part of the organisation's
communication strategy and plan. They form a great advantage when they are mailed; they
are durable and will cany coherent themes all the time. Once developed with a strong
2 4
concept of words or graphics they become durable as long as they are kept simple and
straightforward. Good flyers and posters apply the ‘kiss' formula; ‘keep it simple and
straight forward’ (Madison 2009).
A company logo on the other hand is a symbol that identifies the organisation and asserts
the concept of brand recognition. It creates a strong position of a product or organisation if
well positioned in the market. It provides instant recognition of a product. Banners on
their part are used strongly for advertising. They communicate brief structured messages
regarding an activity, event, product, service or and organisation (Lindstrom and Kotler
2010) .
Using the internal channels of communication, they can employ the downward, upward or
lateral mode ol communication. The choice of mode to be employed in communicating
defines the unique effectiveness of the communication style of the organization (Glover
and Rushbrooke 1983).
The downward mode entails communications of instructions from seniors downwards.
Through this mode, most communication is written and presented officially. Oral
communication is embraced mainly when senior members of staff want to praise, blame or
reprimand. In the downward mode, the same channel is used as subordinates pass reports,
suggestions and complaints up the hierarchy. This mode can only be enhanced if effective
feedback is embraced. Inadequate feedback can only create discouragement and limited
communication.
Lateral channel consists of information flow within departments and interdepartmentally.
This encourages practical liaison between the departments. It promotes cooperation (ibid).
25
These three modes may tail to pick up adequately in corporate organizations and this
detours effective communication. Employees, impatient tor information tend to break
away trom strict lines. The conversation in the corridor or the quick telephone call offers
short-term communication convenience at such a point. In the long run, rumors and
grapevine find entrance into an organisation and can be damaging to effective
communication (Glover and Rushbrooke 1983).
Rumors and gossip commonly termed as grapevine form the fourth and informal mode of
communication. Researchers have found out that 90% of the informal information that
circulates within an organization bears some truth. Though perceived with a negative
connotation the grapevine (which exists in many organizations) can form faster and
quicker orientation for new staff joining an organization. It can also serve managers to
benefit their own ends by depositing counter information to the existing information so as
the information is adopted it lays ground lor future discussions, as employees would have
slept over the information. (ABE and RCC 2008).
Having noted the above, employees are required to communicate effectively. Studies
conducted globally indicate that organizational top management, almost consistently, are
ol the view that the most important skill for managers is good communication skills
(Barrett, 2006), although they may do this at the expense of their subordinates and the
organization as a whole. Past studies have revealed that managers spend most of the day
(70 to 80 percent of their time) undertaking communication tasks (Eccles & Nohria,
1991). Presently, the emergence of internet based communication and cell phones means
that managers spend even more time communicating. In this regard, the amount of time
spent by managers communicating lays emphasis on the importance of effective
26

communication. In addition to internet based communication and phones, organisations
are lurther developing communities of practice which are groups of people within the
organisation who deepen their knowledge and expertise in a certain area within the
organisation (Robbins and Coulter 2005).
2.-1: Communication at KLB
Position in Organisational Chart Level of Staff
Board o f D ire cto rs N/A
Managing D ire c to r N/A
Heads o f D epa rtm en ts 10
Assistant Heads o f D epa rtm en ts 9
M idd le Level M a n a g e rs 8
Supervisors 7
Union isab le s ta ff 6 and below up to 1
Adopted from KLB Organisational Structure 2011 courtesy of HR Department
Table 2.1
Most communication at KLB follows the above structure. Official communication trickles
down from top line management to the lower cadre staff. The downward mode of
communication is the one mostly adopted. Official communication at KLB takes the form
of letters, memos, meetings and electronic mails.
Other communication documents do exist in the form of Standard Operating Procedures
(SOP) per department. Communication is also contained in the Scheme of Service
guidebook, which guides the employee on issues of human resource and work appraisal.
The Strategic Plan (2010 - 2015) carries the plan of action for activities that KLB is
currently carrying out. The SOP manual at KLB is fundamental to its communication
27

processes as it clearly outlines all key operations carried out in each department and this
helps employees not to depart from the norm as well as keep organizational coherence.
The nine objectives outlined in the SOP enables KLB to achieve high performance status
as well as organizational synergy which is an advantage to successful and profitable
businesses.
Other lorms ol communication take place in formal and informal meetings. During the
induction process for new employees, communication process and avenues are introduced
to new employees. Some members may be informally inducted about what happens at
KLB through stories from older members of the organisation through what Wood (2003)
terms as corporate stories. According to Wood (2003) corporate stories serve the main
function ol socializing new members into the culture of an organisation. When these
stories are told over and again, they help foster feelings of ties among employees and this
helps vitalize the organizational ideology.
2.5: Effective Communication
In simplicity, communication is the verbal or non-verbal transmission of meaning from
either one person to another or to numerous people. Usually, the communication that
occurs Irom one person to another is presented in a simple triangle composed of the
context, the sender, the message as well as the receiver (Barrett, 2006).
28

Figure 2.1 shows what simple and ideal communication would be like. Communication
would be effective. In this case, the sender understands the context as well as the receiver
(target audience). Consequently, he/she selects the right medium (channel) and sends a
clear message. On his part, the receiver decodes and understands that message precisely as
was intended by the sender. The receiver responds to the sent message through feedback
to the sender. This qualifies to be termed effective communication.
Effective communication embraces an array of approaches. Whatever the case,
communicators have to do so clearly to eliminate ambiguity. The receivers' needs are a key
factor in designing messages. At the onset of communication, t he sender should be in a
position to put into account the needs of the recipients, for instance what time is needed to
accomplish the task, how much workload does the receiver have, tone used, content,
structure of the communication among other needs.
29

The language needs of the receiver have to be put into account. The sender needs to
understand fully the audience of the messages. Another approach that may be employed to
communicate effectively would be to use the ABC Approach (ABE and RCC 2008). This
approach emphasizes accuracy, brevity and clarity in eveiy communication. The other
approach to effective communication is the use of the Seven Cs. It is more developed and
looks at seven attributes of messages whether verbal or non verbal. The Seven Cs are,
clear messages, concise, correct, courteous, complete, consistent and convincing. Listening
and feedback form two complementary skills that enrich effective communication further
(ibid).
2.6: Factors Affecting Effective Communication
Communicating effectively can be affected both positively and negatively. The positive
factors do enhance communication whereas negative factors hinder effective
communication. In reality, a number of factors enhance effective communication as elicited
in the diagram below. Although the factors can be viewed from different angles, this study
narrows down the major explicit ones. In this regard, Figure 2.1 can be adapted; to
illustrate what happens when various factors enhance effective communication. These
factors straddle across the sender or the receiver(s).
30

Factors related to A Factors related tosenders A receivers
• Clarity of messages / \ • Presence of feedback
• Choice of channel . / \ ______ _• Interpersonal skills
• Absence of physical and • Absence ofpsychological barriers / \ Stereotyping
• Absence of L \ • Absence of LanguageInterruptions \ 1 barriers
• Interpersonal skills / \ • Absence of Semantic
4
figure 2.2: Factors enhancing Effective Communication, adapted from L eadersh ip F igure
Communication Approach by Barret, D. J 2006, p 4
Senders of messages such as managers and communication officials should communicate
clear messages. They should also communicate through the right channels (media).
External factors such as physical barriers and interruptions should also be curbed during
the communication process. In this case, the effectiveness of the intended communication
is enhanced. On their part, receivers of messages ought to possess good listening skills.
They should also be devoid of language barriers or cultural stereotypes. Such factors,
including presence of feedback, enhance effective communication. It is imperative to note
that all the factors elicited above do not work entirely individually and are related to both
sender and receivers concurrently. In this accord, Figure 2.2 is a simplified model and the
interplay of the various factors may be complex in reality.
31
Barrett (2006) elicits that complication in communication stems From interruptions in
transmission. This is irrespective of whether they are caused by the sender or the receiver.
Factors such as the context in which the information is sent, the surrounding noise, the
medium (media) chosen; the choice of words as well as the image of the speaker among
others determine the success of conveyance of the meaning intended to the receivers. To
this end, the foundation of effective corporate communication involves learning to: deal
with any interruptions, appreciate contexts, and understand recipients, select the right
media and to issue clear messages that convey the meaning to specific receivers as
predetermined.
C larity of Message
The clarity of messages is of profound importance in the process of effective
communication. Often, communication in corporate organizations is either ambiguous or
vague. In the backdrop of this, various staff might poorly decipher the messages issued
within the communication processes of such organizations (Bugental et al., 1970). This
phenomenon can be termed as miscommunication resulting from muddled (unclear)
messages.
Another factor contributing to unclear messages is the use of two or more conflicting
channels. Semantics is however the major cause of unclear messages. It causes managers to
either communicate in incomprehensible ways or to give contradictory feedback (Laplante
& Ambady, 2002). The words chosen, how they are used, and the meanings attached to
them affect how members of staff comprehended them. This stems from the fact that a
word may mean different things to different people. For example, organizational jargon
32

such as increased productivity; efficiency and performance contracting are examples that
might mean one thing to a manager and something different to a junior member of staff
(Lunenburg, 2010). In this regard, managers should emphasize contextual meaning in
ensuring that all the issuance ot clear messages is buttressed.
Interpersonal Communication Skills
Interpersonal communication involves both the senders and receivers of messages. The
skills required to make this process effective are learnt. They need to be deliberate.
Attitude towards self is critical to the success of excellent interpersonal skills (Wahlstrom
1992). Positive sell-regard yields high interpersonal skills. Employees with low self-regard
minimize communication with others because of negative voices that play within them.
Messages ol mistrust to their surrounding and colleagues misguide them and this can
easily culminate into some form of conflict which detours effective communication.
Skillful active listening to messages is another component of good interpersonal skills.
Research indicates that we spend more time listening than engaging in any other form of
communication behavior. We speak at the rate of 100- 150 words per minute for average
speakers. We listen at the rate ot 450 — 600 words per minute. The difference between the
two speeds allow tor lag time, which allows us to internalize messages (Pelt 2000). We
listen at 45%, speak at 30%, read at 16% and write at 9% (Wahlstrom 1992). One can
therefore purpose to listen effectively as long they deal with distractions and withhold
judgment. For one to be termed a person with good interpersonal skills, one needs to listen
for enlightenment (ibid).
33

Keeping eye contact is seen as a way of keeping the non-verbal cues of communication
alert both for the sender and the receiver. One needs to be certain about the body
language acceptable within a certain context. Infante (2003) observes six motives for
engaging in interpersonal communication but three apply and these are: control, inclusion
and relaxation.
Absence of Physical Distractions and Interruptions
Effective communication is enhanced by the absence of physical distractions and
interruptions. There are various causes of physical distraction in an organization. These
include telephone calls, unexpected visitors, physical distances, walls, radio static etc.
Although many employees take physical barriers for granted, it is important to remove
them. This is as a result of the immense impact they pose to the effectiveness of
communication in organizations. Whereas wall can be physically removed other
interruptions such as telephone calls and unexpected visitors can be removed through laid
down instructions in the work place. The organization can also utilize appropriate choice
of media to reduce the physical distance between employees (Lunenburg, 2010).
Absence of Cultural Stereotyping
Dealing with cultural stereotypes is paramount in enhancing effective communication.
Allport (1958) defines stereotypes as overgeneralizations of the characteristics and/or
behaviors of a group that are applied universally to individuals of that group. It has been
established that stereotyping is a major hindrance to effective communication (Leonard &
Locke, 1993). In this regard, since tribal, racial and sexual stereotypes have negative
impact effective communication, they are barriers that managers have to endeavour to
overcome. In order to promote effective interethnic/interracial communication, it is
34

paramount to consider others as individuals while still being aware of general cultural
norms (Leonard & Locke, 1993).
Choice of Medium/Channel
Highest
Information Richness
Lowest
Figure 2.3: Communication Channels, Source: Guo, K. L. and Sanchez Y. (2003). “A study of
the skills and roles of senior level healthcare managers” in T he H ea lthcare M a n a g er: Florida
International University in Miami, Florida
Selecting the fitting channel of communication is paramount within the process of effective
communication (Guo, 2003). Channels can be defined as the means through which
messages are transmitted. Channels are divided into two types-verbal and nonverbal.
With technological changes, the use of the various types of channels of communication has
seen dynamic changes.
35
Verbal communication includes dialogues that otter mostly immediate feedback. In
organizations, verbal communication includes meetings. Choice of face-to-face meetings
can have immense effects on the effectiveness of communication. In this case, sufficient
information is transmitted, employees can transmit their emotions and immediate feedback
is enabled. On its part, written communication comes in handy when one has to describe
technical details.
With the advent of electronic mail and computer based communication, written
communication has seen unprecedented improvement in efficiency (Lunenburg, 2010).
According to Daft & Lengel (1984), communication channels have varying information
richness as illustrated in Figure 2.3 above.
The use of computer-aided communication has increased rapidly in the last two decades.
This has revolutionalised the way communication takes place in organizations. Studies
have shown that electronic mail has increasingly become the preferred computer based
channel of communication by many organizations (Lunenburg, 2010). This is born out of
the fact that e-mail allows messages to be generated easily. In addition, messages cannot
only be saved but can also be sent to many recipients concurrently. Readers can also
choose which messages to read first and those to read later. It is worth noting that there
are various problems that are posed by e-mail messages. These include overloads of
information, transmission of computer viruses as well as spamming. Electronic mails also
have the inability to transmit emotions.
As such, recipients can easily misinterpret the tones of the message and generate
misunderstandings. To counter this, experts have gone an extra mile to develop icons to
36

designate the emotions of senders in e-mail messages (Peck, 1997). Training on Internet
based communication has been suggested to reduce the detriment on emotionally charged
messages and disrespect (Extejt, 1998). Such training has been termed netiquette. It bars
e-mail messages from being more than 25 lines. In addition, senders are encouraged not to
use-mail lor sensitive issues.
Non-Verbal Communication
On its part, nonverbal communication can be defined as the sharing of information
without the use of words. Nelson & Quick (2003) elicits that the basic forms of nonverbal
communication are: kinesics, proxemics, facial/eye behaviour and paralanguage. Kinesics
is concerned with use of body language to transmit messages and meanings.
Proxemics is the study of the use of space in social interaction and its significance.
Although facial and eye behaviour is an important form of nonverbal communication, it
may have different meaning to people with diverse cultural backgrounds. The other form
of nonverbal communication is paralanguage. This is concerned with the quality of voice,
volume, pitch and rate of speech. Non-verbal cues can affect the effectiveness of the
communication process. Different people will interpret such cues differently based on their
own perception (Lunenburg, 2010).
A manager needs to know whether verbal or non-verbal communication should be used
before deciding which channel to settle on (Lunenburg, 2010). To this end, selecting a
befitting channel of communication is one the most important parts of the communication
process. Various channels of communication result in the transmission of information of
different volume and diversity. Further, understanding the symbolic meaning and the
37
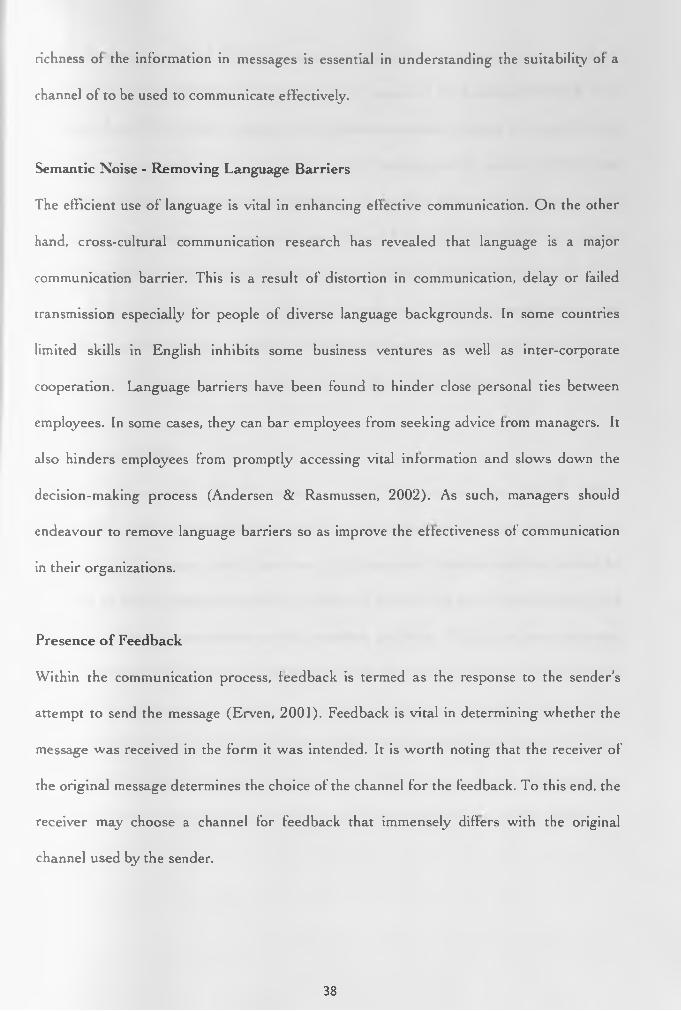
richness of the information in messages is essential in understanding the suitability ot a
channel of to be used to communicate effectively.
Semantic Noise - Removing Language Barriers
The efficient use of language is vital in enhancing effective communication. On the other
hand, cross-cultural communication research has revealed that language is a major
communication barrier. This is a result of distortion in communication, delay or failed
transmission especially for people of diverse language backgrounds. In some countries
limited skills in English inhibits some business ventures as well as inter-corporate
cooperation. Language barriers have been found to hinder close personal ties between
employees. In some cases, they can bar employees from seeking advice from managers. It
also hinders employees from promptly accessing vital information and slows down the
decision-making process (Andersen & Rasmussen, 2002). As such, managers should
endeavour to remove language barriers so as improve the effectiveness of communication
in their organizations.
Presence of Feedback
Within the communication process, feedback is termed as the response to the sender’s
attempt to send the message (Erven, 2001). Feedback is vital in determining whether the
message was received in the form it was intended. It is worth noting that the receiver of
the original message determines the choice of the channel for the feedback. To this end, the
receiver may choose a channel for feedback that immensely differs with the original
channel used by the sender.
38

Krauthammer International (2001) in a study of European corporations found out that the
majority of company executives have inadequate capacities for handling feedback from
members of staff. For these managers, only 14 percent sought feedback from stalf during
communication processes. For the rest, a large majority of 47 percent elicited that
managers only sought their opinions sometimes. Those who indicated that their opinions
were sought vety seldom or never at all were 32 and 7 percent respectively. In the same
study, it was found out that only 42 percent of the feedback obtained was utilized. For a
quarter of the managers (26%) the feedback obtained was actually acknowledged but that
no resultant action was taken. Whereas feedback is often underestimated, ensuring that it
is effectively used is one sure way of enhancing effective communication.
Poor Listening Skills
Listening is an essential skill for managers in corporate organizations (Barrett, 2006).
Erven (2001) elicits that poor listening skills is an important barrier to the effectiveness ol
communication. Manager should have one of the important listening skill-they should be
prepared to listen. Managers should be prepared to lock out other organizational and
personal problems to concentrate on the immediate problems. During the communication
process, listeners should search meaning from what the speaker is saying. Many listeners
are prone to interrupting the speaker- an indication of poor listening skills. To this end,
listeners should wait until the speaker finishes the message before passing their evaluation
and judgment. Active listening is essential to the effectiveness of the communication
process. It enables the speaker to give the best of the intended message (Erven, 2001).
39

CHAPTER THREE
RESEARCH DESIGN AND METHODOLOGY
3.1: Introduction.
While performing specific study operations researchers employ techniques to enable them
collect data and establish replicable verifiable truths about a case, phenomena or topic.
This is summed up as methodology according to (Kothari 2004). A researcher selects
methods, which includes selecting and constructing research techniques. In research
methodology, the processes employed document reasons lor using particular methods or
techniques rather than using other methods (Mugenda 2008). Through research
techniques, the researcher performs operations such as observation, recording data and
analysis ol data using clearly defined steps.
3.2: Research Methodology
Therefore, one can state that, research methodologies entail the systematic use of methods
and techniques; to help solve a research problem. The methodologies are important since
they help achieve systematic verifiable truths about the problem under study. They also
help present the problem under study logically (Kothari 2004). Research Methodology
can be grouped in various ways depending on the approach that a researcher takes. It may
be based on type of data and method used to collect the data (Mugenda 2008). Kothari
2004 notes that the key categories are conceptual versus empirical, quantitative versus
qualitative, fundamental versus applied and finally descriptive versus analytical. Social
scientists thus have classified research mainly into qualitative and quantitative.
Quantitatively research seeks to quantify social phenomena by collecting, analyzing and
interpreting data whereas qualitatively research seeks to refer to a variety of approaches
conducted in natural settings to find out some scientific truths.
40

A survey employing extensively descriptive research was the basis of this research. This is
due to the ex p o r t f a c t o nature of descriptive research since it terms things the way they are.
It farther enabled the researcher discover certain causes and report about the variables
under study. Analysis of already existing data at KLB aided the research in terms ot
making critical evaluation decisions. This research thus, employed mainly quantitative
methods coupled with qualitative methods of research.
3.3: Research Design
A research design outlines the processes that help collect data and analyse it (Kothari
2004). On his part, Mugenda (2008) views a research design in terms of conceptualization
of the problem under study bearing in mind the methods to be used in collecting and
analyzing data. He identifies descriptive, correlation and experiment based research
designs. This study employed a descriptive survey. A descriptive survey was chosen since
it can be used to establish a range of issues affecting employees (Mugenda 2008). This is
very relevant to KLB since it has quite a substantial number of employees. In descriptive
surveys, an attempt to describe the relationship between variables, the testing of
hypotheses and development of generalizations principles or theory that have universal
validity was made. In a descriptive survey, the researcher does not manipulate the
variables nor decide who receives a treatment for events to happen; hence in surveying the
factors that affect effective communication at KLB, this was one of the best designs (Best
Kahn 1993). In addition, descriptive survey can produce statistical information and
aspects of corporate communication of interest to policy makers and managers (Borg &
Gall 1989). Since it targeted a category of employees, the study fitted within the cross-
sectional sub-topic of descriptive survey design. A Questionnaire was used together with
41

library review of organizational communication materials at KLB to collect data required
for this study.
3.4: Target Population
The study covered the 6 departments and two support units at KLB. A total of 24
respondents were drawn from KLB’s 214 work force. To this end, at least 10 percent of
staff departmentally together with their respective assistant departmental heads was
chosen to take part in the study. The office of the Managing Director operates with two
key units (Legal Affaires and Audit) with unit heads who are regarded as Heads of
Department. The table below shows the distribution of staff per department at KLB.
Department Total number of staff Sample to be used (10%)
Corporate Services 89 9
Production 58 6
Publishing 22 2
Finance 16 2
Sales and Marketing 16 2
Human Resource 5 1
VLD’s Office - Support Units:
Audit 5 1
Legal 4 1
TOTAL 214 24
Table 3.1: Data provided courtesy of HR Department KLB as at April SO111 2011.
42

3.5: Sample and Sampling Procedures
The process of selecting a number of individuals or objects from a population such that the
selected group contains elements representative of the characteristic found in the entire
group is called sampling (Orodho & Kombo, 2002). A simple systematic sampling
procedure was used to select the sample sizes of KLB’s employees to be used for this
study. The technique entails direct selection of elements from the sampling Irame
(Mugenda 2008). Table 3.1 shows this list that was used as the sampling frame listing total
employees departmentally arranged hierarchically from the senior most member ol stalt in
the Department to the junior most member of staff. Thus the first k‘h element who is the
Assistant head of department was chosen, where; k= N/n — 214124 (Mugenda 2008). A
sampling frame was developed to contain the 214 permanent employees of KLB. Kasomo
(2006) says a sample of 10-20% is best for descriptive survey and using it, the researcher
sampled the 214 employees of KLB.
Two major approaches help researchers determine the sample size, firstly, to specify the
precision of estimation desired then to know the exact sample size necessary and secondly
by use of the Bayesian statistics. The study utilized the first approach since it gives a
mathematical solution (Kothari 2004). An optimum sample was used since it fulfills
efficiency, representativeness, reliability and flexibility required in a scientific study
(Kothari 2004). Systematically, the six assistant heads of departments were selected. The
other respondents per department were selected using random numbers where each
member stood an equal chance to be chosen. Staff identification numbers instead of names
were used at this stage to avoid any biasness.
By using the sample, the study embraced inference with emphasis laid on statistical
assumptions so as to enable the researcher generate valid conclusions (Mugenda 2008).
43
3.5.1: Validity
The validity of instruments represents the degree to which a test measures what it purports
to measure. According to Barrow and Milium (1989) it is also the degree to which
instruments reflect adequacy or appropriateness. Therefore a questionnaire is said to be
valid when it has the ability to measure the parameters intended. To ensure the validity,
the researcher gave the research instruments tor appraisal by the supervisor and paid heed
to the comments given. A pilot study was carried out to pre-test the data collection
instrument and any other logistics required for actual data collection.
3.5.2: Reliability
Reliability is used to measure the consistency of results. In simpler terms, if one
administers a test twice, does he get the same score on the second or subsequent
administration as the first? Reliability was ensured by a test-retest and/or coefficient of
stability method (Orodho, 2005). The researcher used the Pearson’s Product Correlation
Moment Formula to compute the co-efficient in order to establish the extent to which the
content of the questionnaires shall be consistent in bringing out the same responses every
time they are administered.
3-6: Data Collection Procedures
The researcher with the help of an enumerator developed a data collection instrument for
both the pilot and the main study. Both primary and secondary data was sought in this
research because one can only strengthen the other (Mugenda 2008). As stated earlier, the
research employed a questionnaire as the main instrument of data collection coupled with
44

analysis of KLB communication materials for the secondary data. The questionnaire
employed (see appendix 1) shows the detailed questions used. There are two types of
questions used; the open ended which allow for brief explanations, have to be coded and
the close ended questions which already have multiple choice answers and offer greater
uniformity of responses and are more easily processed. The Likert — Type — Index
questions were also employed (Babbie and Baxter 20(M). The reverse funnel format and
the coherence order of questions were used in this research to order the questions.
Contingency questioning was also employed.
The questionnaire was chosen for this study since the population for this study was large
and only a sample was drawn from the total population to find out certain representative
parameters of the population. The questionnaire was self-administered. Another reason is
because the respondents had time to give well thought out answers and finally because the
questionnaire method is free from biasness of the interviewer (Kothari 2004). The
secondary data sought was carefully selected since the documents involved were the
current standard operating procedure manuals from every department at KLB. KLB
operates as an ISO: 2008 certified organisation so the procedures are updated from time to
time. The other documents are the current Strategic Plan and the Scheme of Service.
3.7: Data Analysis Techniques
The raw data collected was pre-processed, developed, coded, stored and analyzed. Both
SPSS (Statistical Package for Social Sciences) and spreadsheets (Microsoft Excel) were
used in computing descriptive statics (frequencies, percentages and correlations) at a
significant level of (d= 0.05) and recommendations and discussions were according to the
findings. The bivariate Pearson Product Moment was employed as a measure of
association. This indicates a relationship among variables that gives hints to existing
45

problems. Intervention measures that are variable specific have been designed to address
such problems. For example, inadequate information and communication technology skills
were found to be contributing negatively to effective communication, and then training of
staff to enhance these skills is highly recommended to address this factor. If the measured
variables were on the ordinal scale, the Spearman’s Rho correlation co-efficient was used
to evaluate existing relations among employees in terms of effective communication and
the variables. Here for instance, face to face topped the list of most preferred channel of
communication and thus an indicator that it should be the most used method to
communicate crucial issues for example both long term and short term targets.
3.8: Ethical Considerations and Permissions Required
Since the research was conducted in an organisation, the researcher scheduled a formal
meeting with the Chief Executive Officer of KLB to seek permission to carry out research
in the organisation and permission was granted. The researcher sought permission also
from the Human Resource Manager to allow employees to take a few minutes (scheduled
time) and respond to the questionnaire they had received. Further, a student introductory
letter from the University of Nairobi (UON)-(SOJ) had been obtained to enable the
researcher and the assistant cany out data collection at KLB.
46
CHAPTER FOUR
H. 0: DATA AN ALYSIS, INTERPRETATION AND PRESENTATION
4.1: Introduction
The purpose of this study was to survey the factors affecting effective communication in
corporate organisations case study of KLB. The case study of KLB was purposively
chosen due to the accessibility of the organisation, information from the organisation to the
researcher and the time frame within which the research was to be carried. In this chapter
find findings that were based on quantitative and qualitative methods of data collection
and are comprehensively and systematically presented, have been discussed and
interpreted. The discussions and interpretation are linked to the five research questions
outlined in chapter one of this research. The discussion links this study to the conceptual
framework where the findings are compared to the extensive literature that was reviewed.
Information communication theory strongly informed this research thus the discussion
focuses on this theory. The analysis is presented using charts, graphs, and frequency tables
all done in percentages. The secondary data collected is presented in form of discussions.
4.2: Actual Population of the Study
The 24 employees that were sampled for this study came from the six departments at KLB
and the two units supporting the Managing Directors office. This sample figure was
obtained from combining systematic sampling and random sampling. However, there were
more willing participants and the researcher increased the sample size through sampling
procedures from 10% to 15% as earlier stated by Kasomo (2006) that a sample of between
10- 20% would be good enough. A total number of 32 questionnaires were given to the
selected sample. 26 questionnaires were returned bringing the percentage response to 81%.
47
-1.3: Data Analysis, Interpretation and Discussions
Overview:
The purpose of this study was to survey the factors affecting effective communication in
corporate organisations case study of KLB. The case study of KLB was purposively
chosen due to the accessibility of the organisation, information from the organisation to the
researcher and the time frame within which the research was to be carried. In this chapter
final findings that were based on quantitative and qualitative methods of data collection
are comprehensively and systematically presented, discussed and interpreted. The
discussions and interpretation are linked to the six research questions outlined in chapter
one of this research. The discussion links this study to the conceptual framework where
the findings are compared to the extensive literature that was reviewed. Information
communication theory strongly informed this research thus the discussion focuses on this
theory. The analysis is presented using charts, graphs, and frequency tables all done in
percentages. The secondary data is presented in form of discussions
4.4: Demographic Factors
Demographic factors sought to find out the following variables about the employees at
Kenya Literature Bureau: gender, age and education backgrounds. The following were the
findings obtained.
There is an almost equal representation of male and female staff members at the
organisation with slightly more females at 52% and the rest, 48% being male staff
members. One of the respondents did not indicate his/her gender. The table below
summarizes the results.
48

Frequency Percent Valid % Cumulative %Valid Male 12 46.2 48.0 48.0
Female 13 50.0 52.0 100.0Total 25 96.2 100.0
.Missing 99 1 3.8Total 26 100.0
Table 4.1: Gender of respondents at KLB: Males 48% and Females 52%
In terms of age, it was found out that most employees at KLB are between the age of 30
and 39 years. This indicates that the organization has a more young and energetic staff.
Specifically, employees in the age bracket of 35-39 are the majority at 32% followed by
those in the 30-34 years at 20%. The rest are as follows: 40-44 and above 50 years brackets
each at 16%; 25-29 years at 12% and the fewest age bracket at 4% being that between 45
and 49 years. About 4% of the respondents did not give information about their age.
However, the results revealed that there are fewer older male employees than female
employees although a majority of those above 50years of age are male employees. The vise-
versa is also true that there are more young male employees than their female
counterparts. The table 4.2 and Figures 4.1 below summarize this information.
Frequency Percent Valid PercentCumulative
%Valid 25-29 yrs 3 11.5 12.0 12.0
30-34 yrs 5 19.2 20.0 32.035-39 yrs 8 30.8 32.0 64.040-44 yrs 4 15.4 16.0 80.045-49 yrs 1 3.8 4.0 84.0Above 50 yrs 4 15.4 16.0 100.0Total 25 96.2 100.0
Missing 99 1 3.8Total 26 100.0
Table 4.2: Age of staff members at KLB
49
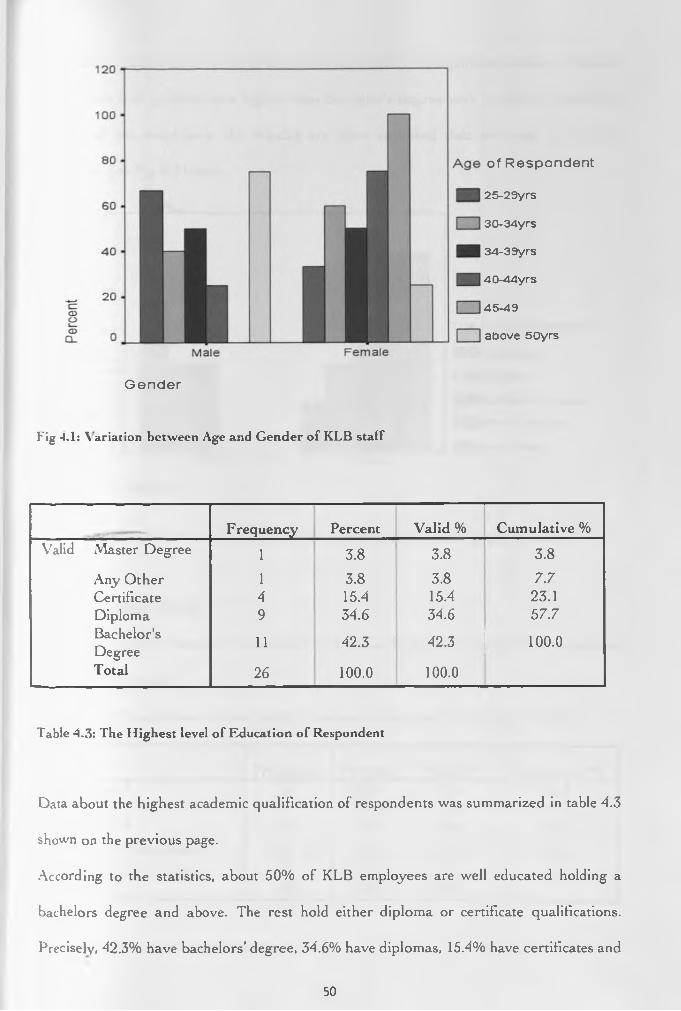
of Respondent
25-29yrs
30-34yrs
34-39yrs
40-44yrs
45-49
above 50yrs
G e n d e r
Fig 4.1: \ ariation between Age and Gender of KLB staff
Frequency Percent Valid % Cumulative %Valid Master Degree 1 3.8 3.8 3.8
Any Other 1 3.8 3.8 7.7Certificate 4 15.4 15.4 23.1Diploma 9 34.6 34.6 57.7Bachelor's 11 42.3 42.3 100.0DegreeTotal 26 100.0 100.0
Table 4.3: The Highest level of Education of Respondent
Data about the highest academic qualification of respondents was summarized in table 4.3
shown on the previous page.
According to the statistics, about 50% of KLB employees are well educated holding a
bachelors degree and above. The rest hold either diploma or certificate qualifications.
Precisely, 42.3% have bachelors’ degree, 34.6% have diplomas, 15.4% have certificates and
50
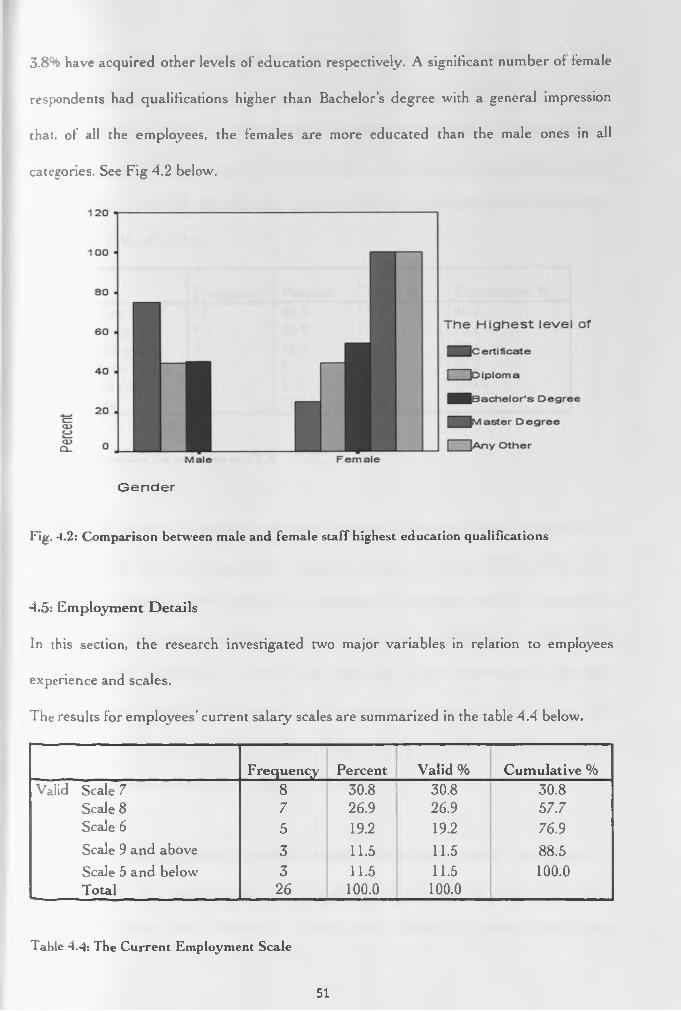
3.8% have acquired other levels of education respectively. A significant number of female
respondents had qualifications higher than Bachelor’s degree with a general impression
that, of all the employees, the females are more educated than the male ones in all
categories. See Fig 4.2 below.
G e n d e r
Fig. -1.2: Comparison between male and female staff highest education qualifications
4.5: Employment Details
In this section, the research investigated two major variables in relation to employees
experience and scales.
The results for employees’ current salary scales are summarized in the table 4.4 below.
Frequency Percent Valid % Cumulative %Valid Scale 7 8 30.8 30.8 30.8
Scale 8 7 26.9 26.9 57.7Scale 6 5 19.2 19.2 76.9Scale 9 and above 3 11.5 11.5 88.5Scale 5 and below 3 11.5 11.5 100.0Total 26 100.0 100.0
Table 4.4: The Current Employment Scale
51
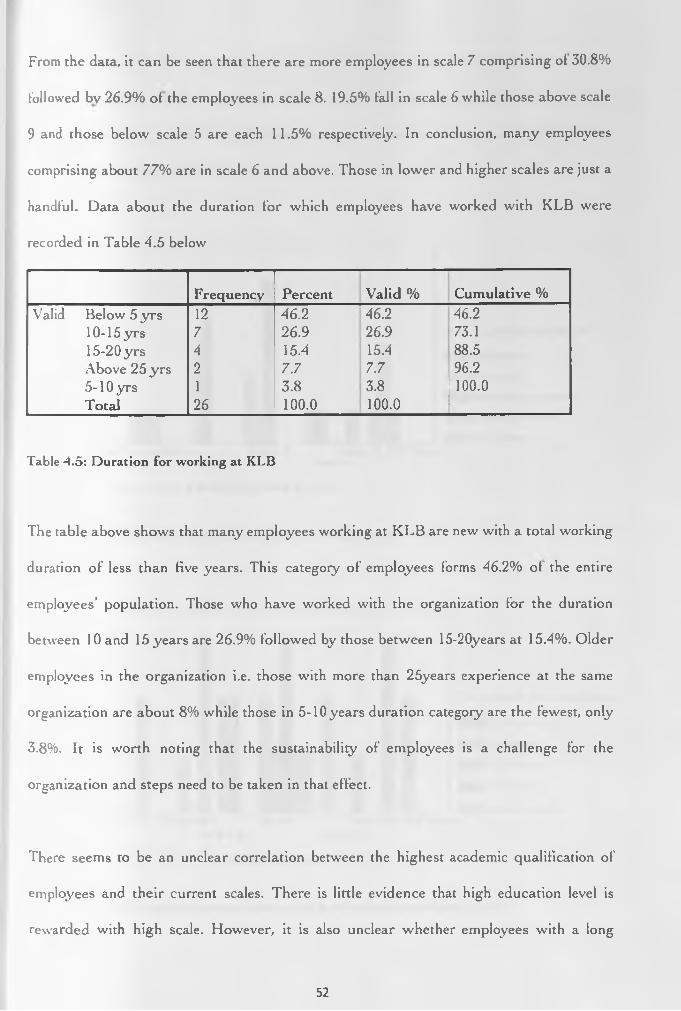
From the data, it can be seen that there are more employees in scale 7 comprising ol 30.8%
followed bv 26.9% ol the employees in scale 8. 19.5% fall in scale 6 while those above scale
9 and those below scale 5 are each 11.5% respectively. In conclusion, many employees
comprising about 77% are in scale 6 and above. Those in lower and higher scales are just a
handful. Data about the duration for which employees have worked with KLB were
recorded in Table 4.5 below
Frequency Percent Valid % Cumulative %Valid Below 5 yrs 12 46.2 46.2 46.2
10-15yrs 7 26.9 26.9 73.115-20 yrs 4 15.4 15.4 88.5Above 25 yrs 2 7.7 7.7 96.25-10 yrs 1 3.8 3.8 100.0Total 26 100.0 100.0
Table 4.5: Duration for working at KLB
The table above shows that many employees working at KLB are new with a total working
duration of less than five years. This category of employees forms 46.2% ol the entire
employees’ population. Those who have worked with the organization for the duration
between 10 and 15 years are 26.9% followed by those between 15-20years at 15.4%. Older
employees in the organization i.e. those with more than 25years experience at the same
organization are about 8% while those in 5-10years duration category are the fewest, only
3.8%. It is worth noting that the sustainability of employees is a challenge for the
organization and steps need to be taken in that effect.
There seems to be an unclear correlation between the highest academic qualification of
employees and their current scales. There is little evidence that high education level is
rewarded with high scale. However, it is also unclear whether employees with a long
52

working histoiy in the organization are in higher scales than those with just a short
working duration. There is need for further study in the organization to find out the
determinants of allocation of employment scales since that was not properly established as
illustrated in the figures A A.
scale 8 Scale 6
The Current employment scale
Fig -j.3 (a): Relationship between education and employment scale
cos c a l e 9 a n d a b o v e
Duration for working
b e l o w 5 y r s
5 -1 O y r s
1 0 -1 5 y r s
1 5 - 2 0 y r s
a b o v e 2 5 y r s
s c a l e 8
The Current employment scale
Fig. -4.3 (b): Relationship between duration of working and employment scale
5 3
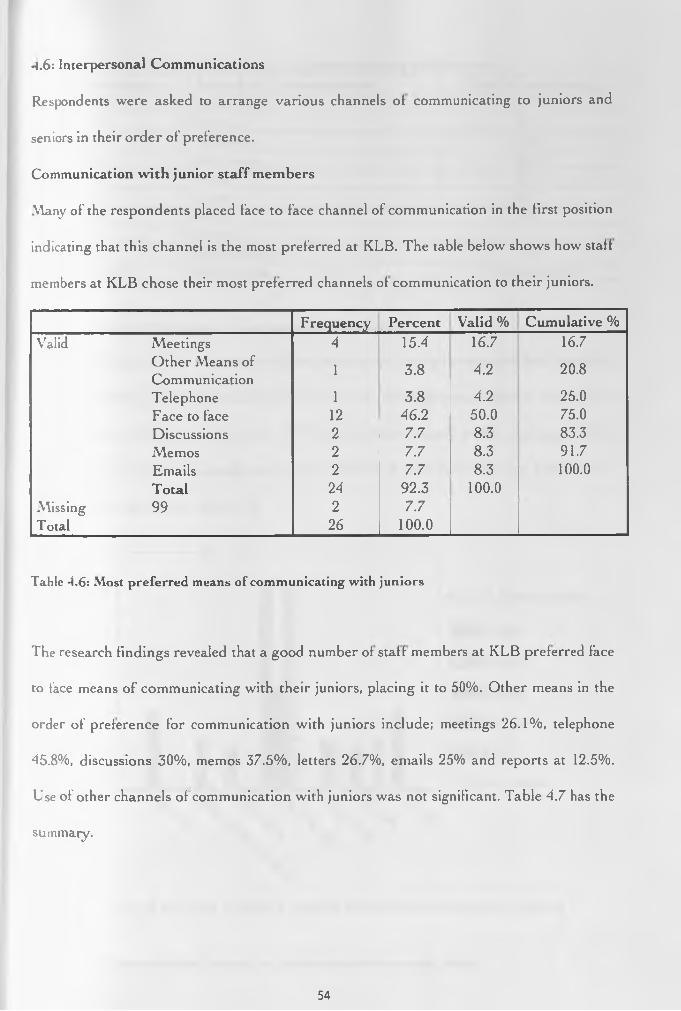
q.6: Interpersonal Communications
Respondents were asked to arrange various channels of communicating to juniors and
seniors in their order of preference.
Communication w ith junior staff members
Many of the respondents placed face to face channel of communication in the first position
indicating that this channel is the most preferred at KLB. The table below shows how staff
members at KLB chose their most preferred channels of communication to their juniors.
Frequency Percent Valid % Cumulative %Valid Meetings 4 15.4 16.7 16.7
Other Means of 1 3.8 4.2 20.8CommunicationTelephone 1 3.8 4.2 25.0Face to face 12 46.2 50.0 75.0Discussions 2 7.7 8.3 83.3Memos 2 7.7 8.3 91.7Emails 2 7.7 8.3 100.0Total 24 92.3 100.0
Missing 99 2 7.7Total 26 100.0
Table 4 .6: Most preferred means of communicating with juniors
The research findings revealed that a good number of staff members at KLB preferred face
to face means of communicating with their juniors, placing it to 50%. Other means in the
order of preference for communication with juniors include; meetings 26.1%, telephone
-45.8%, discussions 30%, memos 37.5%, letters 26.7% , emails 25% and reports at 12.5%.
Use of other channels of communication with juniors was not significant. Table 4.7 has the
summaiy.
54
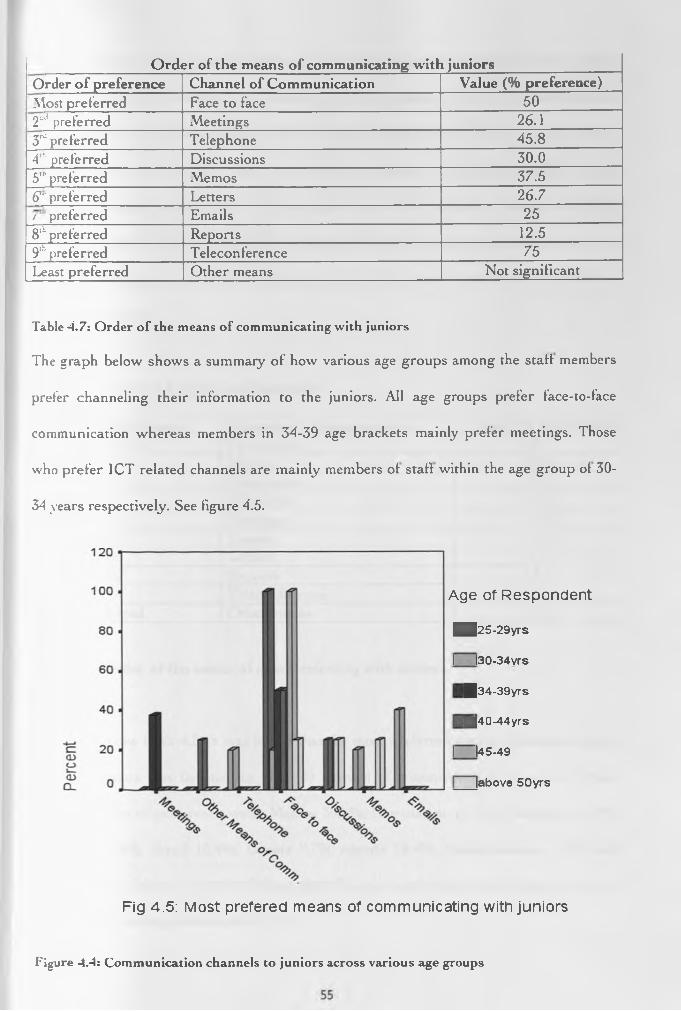
Order of the means of communicating with juniorsOrder of preference Channel of Communication Value (% preference)Most preferred Face to face 502nd preferred Meetings 26.13rd preferred Telephone 45.84A preferred Discussions 30.05'" preferred Memos 37.561" preferred Letters 26.7r preferred Emails 258lh preferred Reports 12.59,h preferred Teleconference 75Least preferred Other means Not significant
Table 4.7: Order of the means of communicating with juniors
The graph below shows a summary of how various age groups among the stall members
prefer channeling their information to the juniors. All age groups prefer face-to-face
communication whereas members in 34-39 age brackets mainly prefer meetings. Those
who prefer ICT related channels are mainly members ol stall within the age group ol 30-
34 years respectively. See figure 4.5.
Age of R espondent
■|25-29yrs
I l30-34vrs
|34-39yrs
g|40-44yrs
I |45-49
labove 50yrs
Fig 4.5: Most prefered means of com m unicating with jun io rs
Figure 4.4: Communication channels to juniors across various age groups
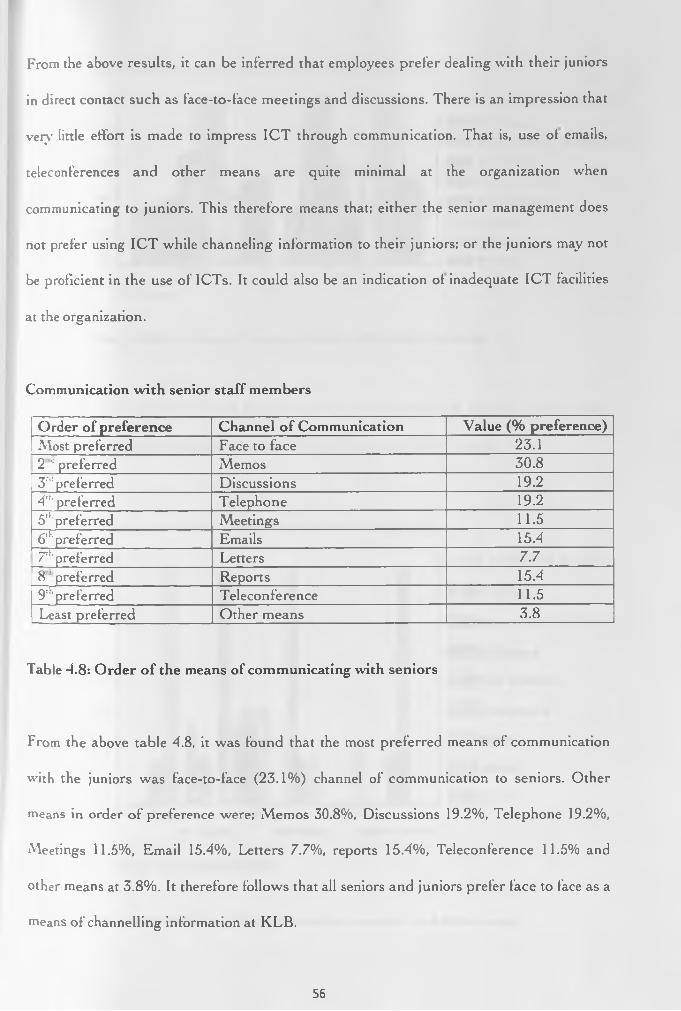
From the above results, it can be inferred that employees prefer dealing with their juniors
in direct contact such as face-to-face meetings and discussions. There is an impression that
veiy little effort is made to impress ICT through communication. That is, use ol emails,
teleconferences and other means are quite minimal at the organization when
communicating to juniors. This therefore means that; either the senior management does
not prefer using ICT while channeling information to their juniors; or the juniors may not
be proficient in the use of ICTs. It could also be an indication ol inadequate ICT facilities
at the organization.
Communication with senior staff members
Order of preference Channel of Communication Value (% preference)Most preferred Face to face 23.12 0 preferred Memos 30.83rd preferred Discussions 19.24'h preferred Telephone 19.25,k preferred Meetings 11.56'1, preferred Emails 15.47*h preferred Letters 7.78 ; preferred Reports 15.49th preferred Teleconference 11.5Least preferred Other means 3.8
Table 4.8: Order of the means of communicating with seniors
From the above table 4.8, it was found that the most preferred means of communication
with the juniors was face-to-face (23.1%) channel of communication to seniors. Other
means in order of preference were; Memos 30.8%, Discussions 19.2%, Telephone 19.2%,
Meetings 11.5%, Email 15.4%, Letters 7.7%, reports 15.4%, Teleconference 11.5% and
other means at 3.8%. It therefore follows that all seniors and juniors prefer face to face as a
means of channelling information at KLB.
56

1 2 0
100
8 0 -
6 0
4 0
20 -
Most prof©rod means
■ ■ Meetings
I > Other M eans of Comm
r ' Telephone
Face to face
C Z 3 D iscussions
I I Memos
I | Letters
I I EmailsF e male
G e n de r
Figure 4.5: Most preferred means of communication with seniors to juniors
Most male prefer discussion and face to face while addressing their seniors. On the hand,
the female staff prefers passing messages through letters and other means.
30-34yrs 40-44yrs above 50yrs
A g e o f R esp o n d en t
Figure 4.6: Most preferred means of communication to seniors in relation to age.
57

From the above figure 4.7, emails cuts across the age bracket 25-29 and 34-39 respectively.
This therefore implies that the age bracket 25-29 and 34-39 uses ICT as their most
preferred means of communicating with their seniors at KLB while a good number prefer
face to face (25-29, 34-39, 40-44 and above 50 years) respectively.
KLB’s Official Guideline Document
The research sought out whether employees at Kenya Literature Bureau were aware of an
official guidelines’ document. The question in Fig 4.9 was asked and elicited the responses
summarized in the same figure and table 4.9. For those who were aware of the existence of
such a document, were further asked to state the extent to which they followed the
guidelines.
Frequency Percent Valid % Cumulative %Valid Yes 14 53.8 53.8 53.8
No 12 46.2 46.2 100.0Total 26 100.0 100.0
Table 4.9: Knowledge of a document with communication guidelines at KLB
58
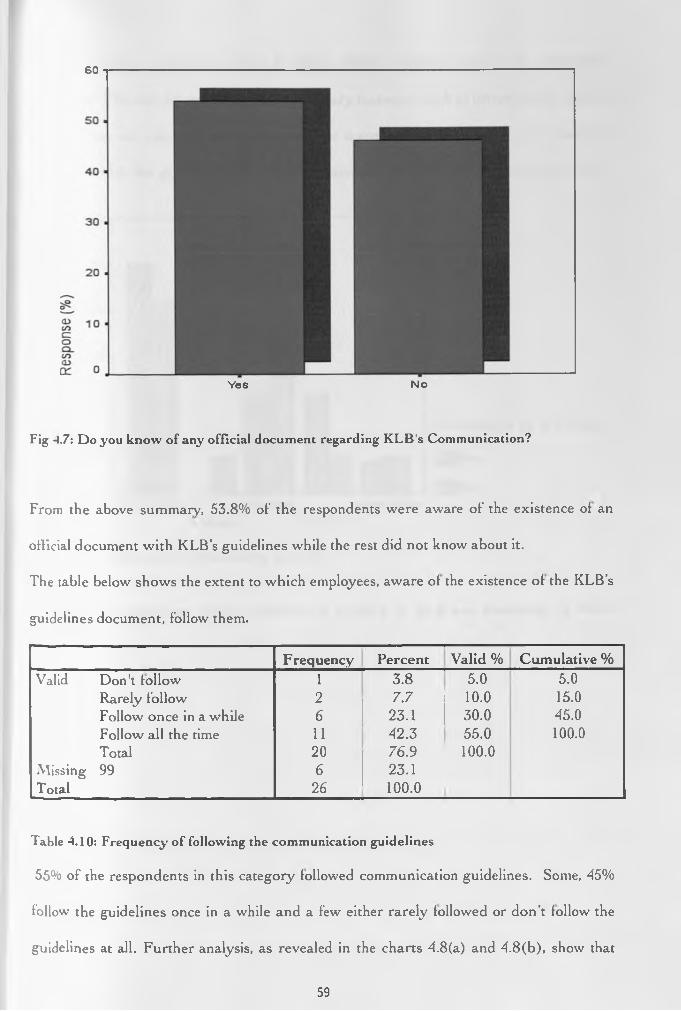
6 0
Y es N o
Fig 4.7•. Do you know of any official document regarding KLB's Communication?
From the above summary, 53.8% of the respondents were aware of the existence of an
official document with KLB’s guidelines while the rest did not know about it.
The table below shows the extent to which employees, aware of the existence of the KLB’s
guidelines document, follow them.
Frequency Percent Valid % Cumulative %Valid Don't follow 1 3.8 5.0 5.0
Rarely follow 2 7.7 10.0 15.0Follow once in a while 6 23.1 30.0 45.0Follow all the time 11 42.3 55.0 100.0Total 20 76.9 100.0
iMissing 99 6 23.1Total 26 100.0
Table -4.10: Frequency of following the communication guidelines
55% of the respondents in this category followed communication guidelines. Some, 45%
follow the guidelines once in a while and a few either rarely followed or don’t follow the
guidelines at all. Further analysis, as revealed in the charts 4.8(a) and 4.8(b), show that
59

many employees are aware of and follow KLB’s guidelines than the established
employees’. This can be attributed to intermediary measures such as orientation or just the
fact that they are new and wish to impress the management before joining the rest. The
extent to which the guidelines are followed diminishes with the duration ol stay at KLB.
60 t-----------------------------------------------------------------------------------------
below 5yrs 10-15yrs above 25yrs5-1 Oyrs 15-20yrs
D ura tion fo r w ork ing a t KLB
Fig -l.8: (a) Comparison between duration of working at KLB and knowledge of KLB’s
guidelines’
60
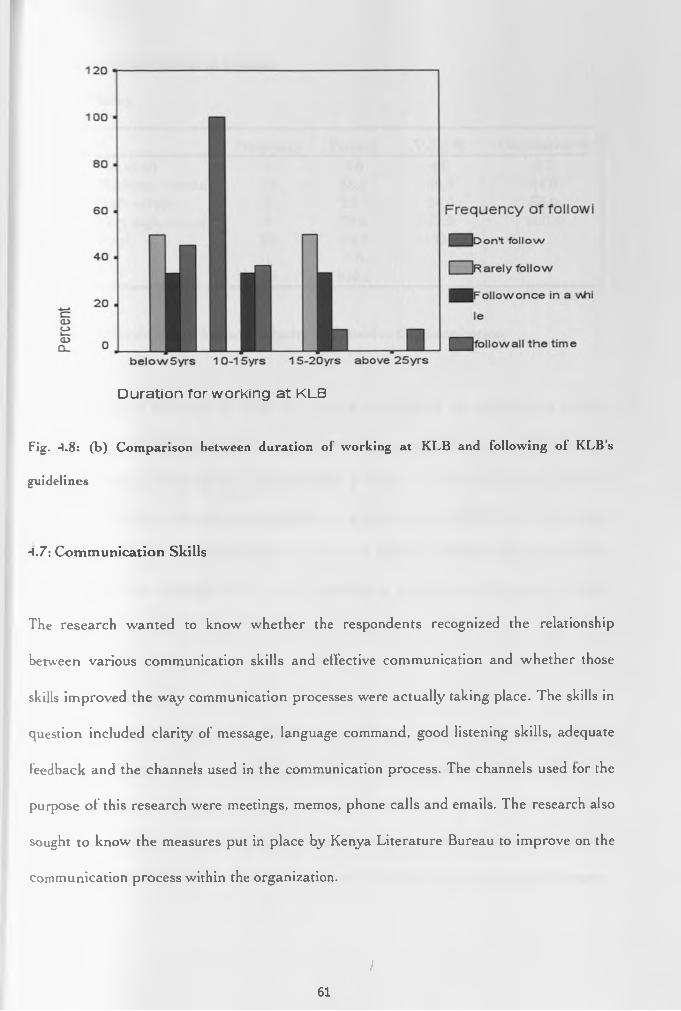
D ura tion fo r w ork ing a t KLB
Fig. -1.8: (b) Comparison between duration of working at KLB and following of KLB's
guidelines
-1.7: Communication Skills
The research wanted to know whether the respondents recognized the relationship
between various communication skills and effective communication and whether those
skills improved the way communication processes were actually taking place. The skills in
question included clarity of message, language command, good listening skills, adequate
feedback and the channels used in the communication process. The channels used for the
purpose of this research were meetings, memos, phone calls and emails. The research also
sought to know the measures put in place by Kenya Literature Bureau to improve on the
communication process within the organization.
I61

Skills in the Communication Process
Message Clarity
Frequency Percent Valid % Cumulative %Valid Not at all 1 3.8 4.0 4.0
Moderate extent 10 38.5 40.0 44.0High extent 6 23.1 24.0 68.0Very high extent 8 30.8 32.0 100.0Total 25 96.2 100.0
Missing 99 1 3.8Total 26 100.0
Table 4.11: The extent of Message C larity to Effective Communication
Research findings indicated in Table 4.11 shows that 40% ol the respondents felt that
clarity of the message improved the communication to a moderate extent. 32% felt that
clarity of message enhanced the communication process at a very high extent, 24% said
that message clarity enhanced communication to a high extent while 4% felt that message
clarity did not help in the communication process. In general, virtually all the respondents,
96% indicated that message clarity is very important in communication rating it between
moderate and very high extent correlation.
Language Command
On other communication skills, 92% of respondents said that language command
enhanced communication at very high, high or moderate extent. This adds on the
generalization that language command plays a significant role in communication.
Specifically, 45.8% said that language command enhances communication to a moderate
extent; 25% high extent, 20% very high extent and 4.2% each for low and very low extent.
62
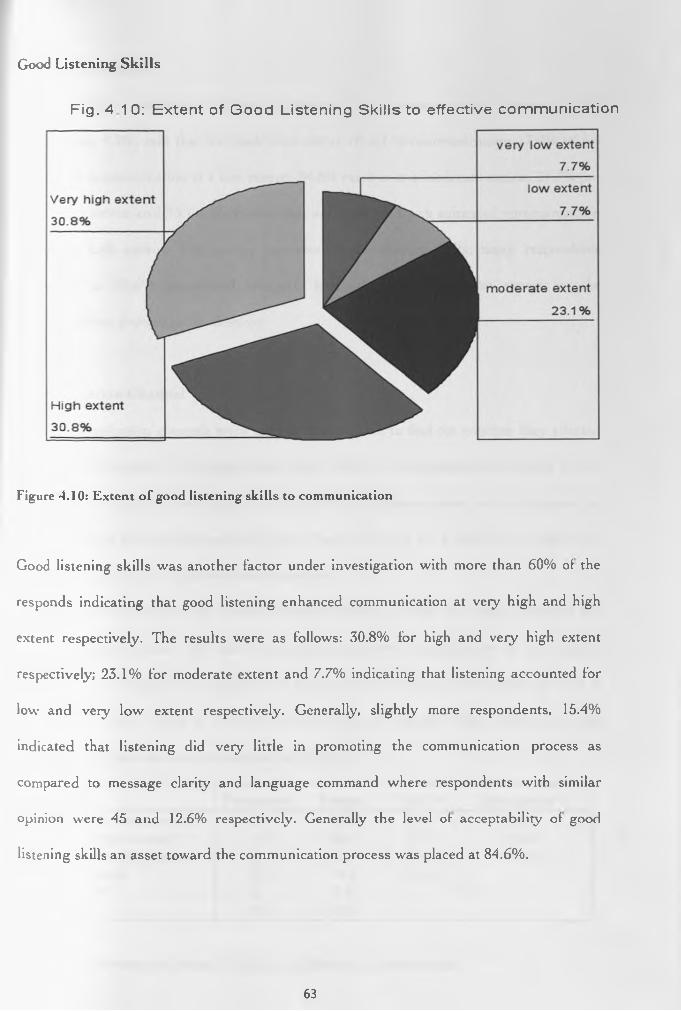
Good Listening Sk ills
Fig . 4 10: E x te n t o f G ood L is te n in g S k ills to e ffec tive co m m u n ica tio n
Figure 4.10: Extent of good listening skills to communication
Good listening skills was another factor under investigation with more than 60% ol the
responds indicating that good listening enhanced communication at very high and high
extent respectively. The results were as follows: 30.8% for high and very high extent
respectively; 23.1% for moderate extent and 7.7% indicating that listening accounted for
low and very low extent respectively. Generally, slightly more respondents, 15.4%
indicated that listening did very little in promoting the communication process as
compared to message clarity and language command where respondents with similar
opinion were 45 and 12.6% respectively. Generally the level of acceptability of good
listening skills an asset toward the communication process was placed at 84.6%.
63
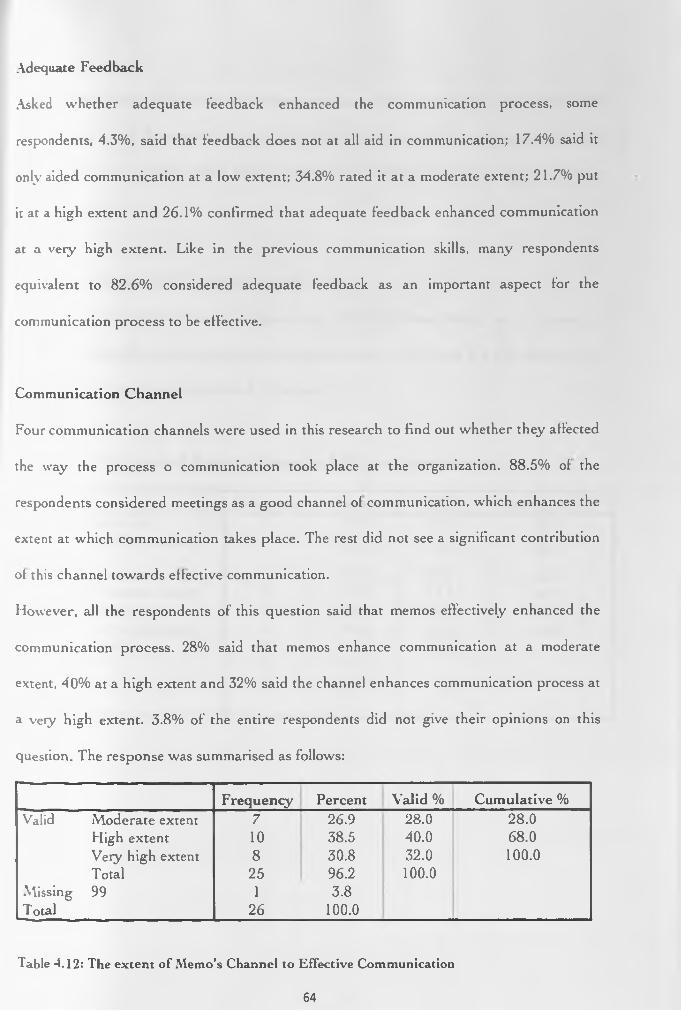
Adequate Feedback
Asked whether adequate feedback enhanced the communication process, some
respondents, 4.3%, said that feedback does not at all aid in communication; 17.4% said it
only aided communication at a low extent; 34.8% rated it at a moderate extent; 21.7% put
it at a high extent and 26.1% confirmed that adequate feedback enhanced communication
at a very high extent. Like in the previous communication skills, many respondents
equivalent to 82.6% considered adequate feedback as an important aspect for the
communication process to be effective.
Communication Channel
Four communication channels were used in this research to find out whether they affected
the way the process o communication took place at the organization. 88.5% of the
respondents considered meetings as a good channel of communication, which enhances the
extent at which communication takes place. The rest did not see a significant contribution
of this channel towards effective communication.
However, all the respondents of this question said that memos effectively enhanced the
communication process. 28% said that memos enhance communication at a moderate
extent, 40% at a high extent and 32% said the channel enhances communication process at
a very high extent. 3.8% of the entire respondents did not give their opinions on this
question. The response was summarised as follows:
Frequency Percent Valid % Cumulative %Valid Moderate extent 7 26.9 28.0 28.0
High extent 10 38.5 40.0 68.0Veiy high extent 8 30.8 32.0 100.0Total 25 96.2 100.0
Missing 99 1 3.8Total 26 100.0
Table 4.12: The extent of Memo’s Channel to Effective Communication
64
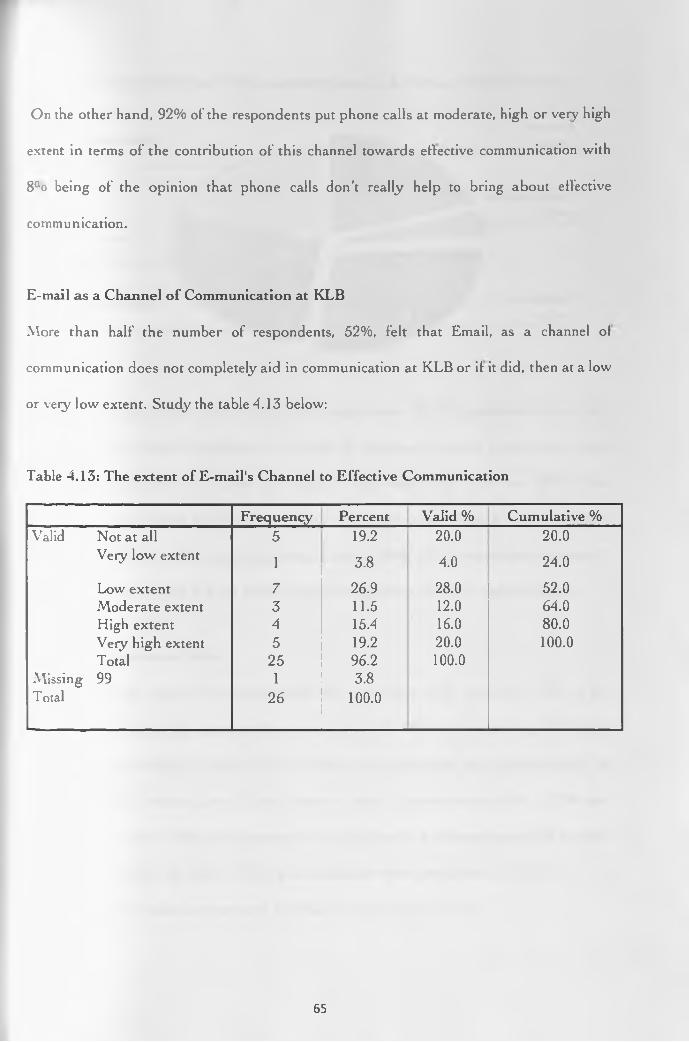
On the other hand, 92% of the respondents put phone calls at moderate, high or very high
extent in terms of the contribution of this channel towards effective communication with
8°o being of the opinion that phone calls don’t really help to bring about effective
communication.
E-mail as a Channel of Communication at KLB
More than half the number of respondents, 52%, felt that Email, as a channel of
communication does not completely aid in communication at KLB or if it did, then at a low
or very low extent. Study the table 4.13 below:
Table 4.13: The extent of E-mail's Channel to Effective Communication
Frequency Percent Valid % Cumulative %Valid Not at all 5 19.2 20.0 20.0
Very low extent 1 3.8 4.0 24.0
Low extent 7 26.9 28.0 52.0Moderate extent 3 11.5 12.0 64.0High extent 4 15.4 16.0 80.0Very high extent 5 19.2 20.0 100.0Total 25 96.2 100.0
Missing 99 1 3.8Total 26 100.0
65

Fig 4 .11 E x te n t to w h ic h E m a ils bring a b o u t e ffe c tiv e c o m m u n ic a tio n
N o t at all
This scenario explains the earlier concept that employees at KLB organization are not very
efficient in ICT related applications and there is therefore need for training and other
intermediary measures to contain the situation. Any way, 12%, 16% and 20% ol the
respondents rated emails at moderate, high and very high extent in terms ot the channel's
enhancement of the communication process, a total of 48% ol the respondents reviewed it
positively. A total of 52% did not believe e-mails bring about effective communication.
Other Communication Skills
Responds on this aspect of communication were very few with more than 73% ol the
respondents avoiding the question. However, of the 26.9% who responded, 57.1% said
that other communication skills had very little or no inlluence on communication on
process probably because they did not know of other communication skills. 42.9% said
other communication skills also enhanced communication as a process despite the fact that
they didn’t mention the skills. This is an indication that employees at KLB have not
received adequate training in terms of alternate communication skills.
6 6

Although many oi the respondents did not give information about this, the few who
attempted had the following as factors put in place by KLB to improve on the
communication process within the organization; all official information is passed through
the use of electronic mail since the computers are interconnected via e-mail and KLB
allows free group use of e-mail. Secondly, training of the customer care unit members on
various aspects of communication with the public has been explored and utilised. Thirdly,
holding team building trainings within the organization. Also, KLB has a prompt
communication strategy where communication processes are channelled through a chain of
command. Finally, the presences of open office plans, regular staff quarterly meetings and
open discussions have enhanced communication at KLB.
-i.9: Channels of Communication
The research endeavoured to know the order of preference of the various means of
communication within KLB, which would see the enhancement of effective
communication within the organization.
Most used Channel of Communication
Table 4.14 shows the order of preference according to how the respondents placed the
various channels in particular positions.
Measures Put in Place to Improve Communication
67

Order of preference Order of channel Order of preference in %
Most preferred Face to face 40
2nd preferred Telephone 23.1
5rt: preferred Memos 36
4,h preferred Letters 24
5:h preferred Notice Boards 20.8
6!h preferred Emails 17.4
7” preferred Meetings 14.3
8lh preferred Discussions 7.7
9'h preferred Teleconference 28.6
Least preferred Message pads 58.3
Fig. 4.14: Order of preference of the means of communicating with seniors
It is quite clear that the KLB employees feel face to face communication will help to bring
about most effective communication process. The majority who actually had this channel
as their most preferred also said that it was easy to elicit quick feedback and get to know
the perception and reaction of the participants in the communication process than other
channels. 40% of respondents placed face to face in the first position. Other competitive
channels in the first position behind face to face included meetings, telephones each 20%,
Emails at 16% and memos being selected by 4% of the respondents as their most preferred
channels respectively for an effective communication process. The table 4.15 below shows
details.
68

Frequency Percent Valid Percent
Cumulative
Percent
Valid Meetings 5 19.2 20.0 20.0
Telephone 5 19.2 20.0 40.0
Face to face 10 38.5 40.0 80.0
Memos 1 3.8 4.0 84.0
Emails 4 15.4 16.0 100.0
Total 25 96.2 100.0
Missing 99 1 3.8
Total 26 100.0
Table 4.15: Most preferred means of Effective Communication
Other means for effective communication in their order of preference include telephone in
the second place where 23.1% of correspondents selected it for the position. Other
channels that competed in the second place were as follows: memos and meeting each with
11.5% respectively; emails, 7.7% and 3.8% each for notice boards and letters. In the third
place of the most preferred channels of effective communication was memo at 36% closely
followed by meetings and discussions both with a rating of 2 0%. Channels categorized in
the fourth place included letters with 2-4% with telephone and discussions following at a
close range at 125 and 16% respectively. Table 4.16 shows how respondents selected the
channels rated in the fifth position in the order of preference.
69
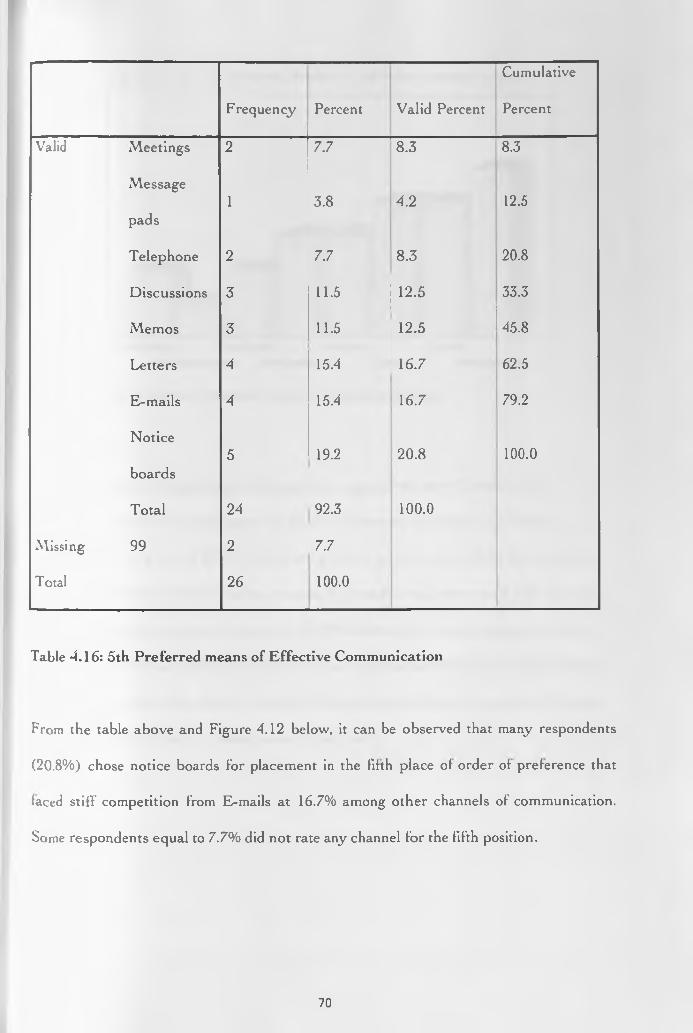
Cumulative
Frequency Percent Valid Percent Percent
Valid Meetings 2 7.7 8.3 8.3
Message1 3.8 4.2 12.5
pads
Telephone 2 7.7 8.3 20.8
Discussions 3 11.5 12.5 33.3
Memos 3 11.5 12.5 45.8
Letters 4 15.4 16.7 62.5
E- mails 4 15.4 16.7 79.2
Notice5 19.2 20.8 100.0
boards
Total 24 92.3 100.0
Missing 99 2 7.7
Total 26 100.0
Table -4.16: 5th Preferred means of Effective Communication
From the table above and Figure 4.12 below, it can be observed that many respondents
(20.8%) chose notice boards for placement in the filth place ol order ol prelerence that
laced stiff competition from E-mails at 16.7% among other channels of communication.
Some respondents equal to 7.7% did not rate any channel for the fifth position.
70

Figure 4.12 : 5th prefered means of effective communication
5th prefered means of effective communication
In the sixth, seventh, eighth and ninth positions respectively were Emails with a
preference rate 0117.4%, meetings with 14.3% preference, discussions, 7.7% and
teleconference at a rate of 28.6%. In the last position, an equivalent of the least preferred
channel for effective communication process, in three channels were rated with message
pads being the least preferred at a rate of 58.3% followed by teleconference and notice
boards respectively as shown in the chart below. That means that very tew respondents
prefer message pads as a channel probably because of non-existence, complexity in using
or lack of reinforcement by managers and supervisors.
71

F ig u re 4 .13 : L e a s t p re fe re d m e a n s o f e ffec t ive c o m m u n ic a t io n7 0
M e s s a g e pads te lec o n fe ren c in g N o ticeb o ard s
L e a st prefered m ea ns of effective communication
Influence of Choice of Channels
The following are the responses given in relation to the question seeking to find out the
factors that influence on the choice of a communication channel in the order of preference
shown above.
Staff felt that the ability to seek clarification and instant understanding is there for some
channels e.g. face to face communication. Many staff who selected face to face channel felt
that it was easy for them to seek clarification where necessary preventing
misunderstanding as it would have been if other channels were to be used. Secondly,
availability or access to computers was limited. Access to 1CT facility such as computers
was an important factor noted by virtually all the respondents. They felt that some
channels were not very effective such as teleconferencing and E-mails because of
inadequate computers and other vital facilities to facilitate their relevance. Thirdly,
personal contact was pointed out in face-to-face communication where respondents said
that they could easily hold conversations making them to learn, understand and appreciate
their colleagues amicably. Face to face enabled them to read body language. Fourthly, the
72
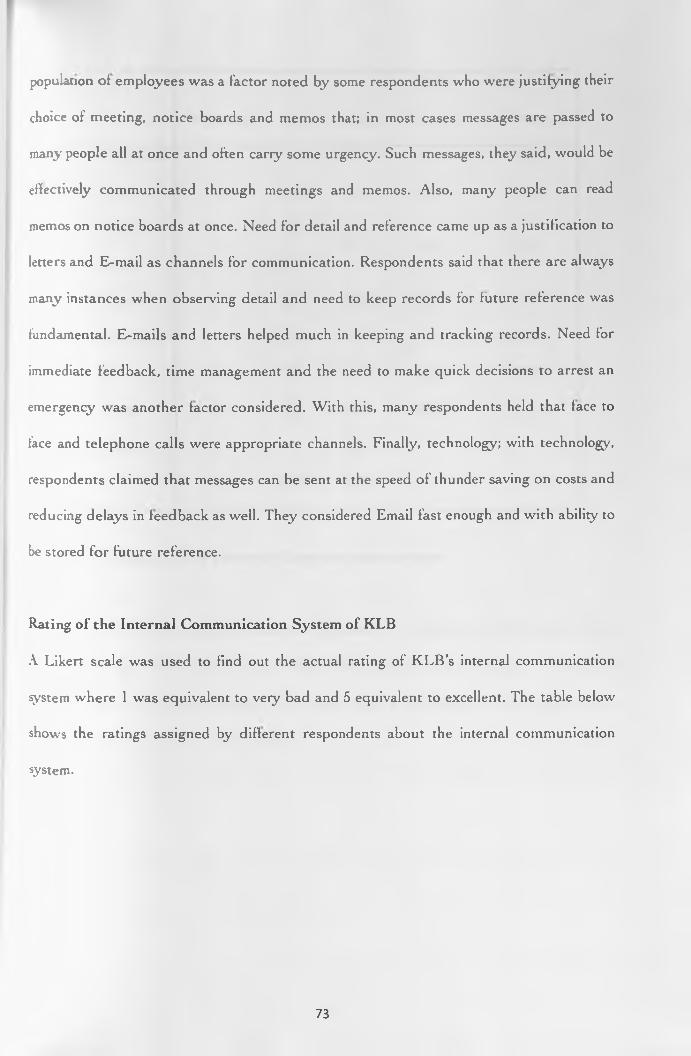
population ol employees was a factor noted by some respondents who were justifying their
choice of meeting, notice boards and memos that; in most cases messages are passed to
many people all at once and often cariy some urgency. Such messages, they said, would be
effectively communicated through meetings and memos. Also, many people can read
memos on notice boards at once. Need for detail and reference came up as a justification to
letters and E-mail as channels for communication. Respondents said that there are always
many instances when observing detail and need to keep records for future reference was
fundamental. E-mails and letters helped much in keeping and tracking records. Need for
immediate feedback, time management and the need to make quick decisions to arrest an
emergency was another factor considered. With this, many respondents held that face to
face and telephone calls were appropriate channels. Finally, technology; with technology,
respondents claimed that messages can be sent at the speed of thunder saving on costs and
reducing delays in feedback as well. They considered Email fast enough and with ability to
be stored for future reference.
Rating of the Internal Communication System of KLB
A Likert scale was used to find out the actual rating of KLB’s internal communication
system where 1 was equivalent to very bad and 5 equivalent to excellent. The table below
shows the ratings assigned by different respondents about the internal communication
system.
73

X Frequency Fx Percent
Valid
Percent
Cumulative
Percent
Very Bad 11
3.8 4.0 4.0
Bad 1 2 3.8 4.0 8.0
Fairly 3311 42.3 44.0 52.0
good
Good 8 32 30.8 32.0 84.0
Excellent 1 5 3.8 4.0 88.0
99 3 0 11.5 12.0 100.0
Total 25 22 96.2 100.0
Missing System 1 4 3.8
Total 26 3.32 100.0
Table -1.17: Rating of KLB's Internal Communication System
On average, KLB’s internal communication was rated at a coefficient ot 3.32, that is, fairly
good. Specifically, 44% rated it at a coefficient ol 3.0, fairly good; 32% with a coefficient ol
4.0, very good; 12% did not respond; 4% rated it with a coefficient of 1, very bad, and 2,
bad, respectively; see the pie chart below.
74
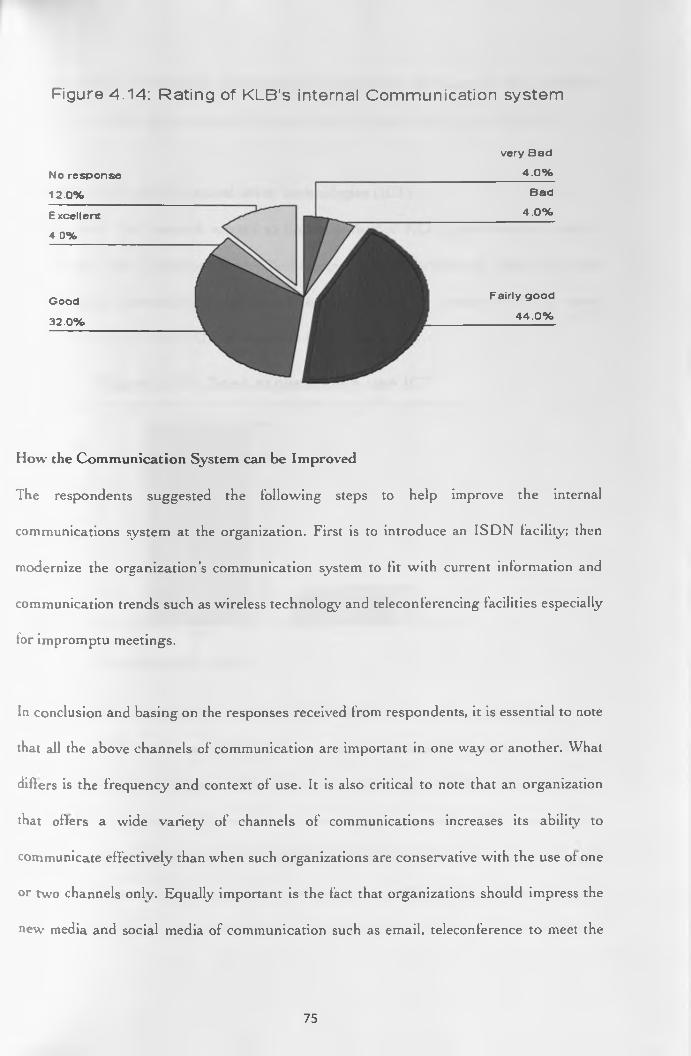
Figure 4.14: R ating of KLB's internal Com m unication system
No response
12 .0%
Excellent
4 0 %
Good
3 2 .0%
very B a d
4 .0 %
B ad
4 .0 %
Fairly good
4 4 .0 %
How the Communication System can be Improved
The respondents suggested the following steps to help improve the internal
communications system at the organization. First is to introduce an ISDN facility; then
modernize the organization’s communication system to fit with current information and
communication trends such as wireless technology and teleconferencing facilities especially
for impromptu meetings.
In conclusion and basing on the responses received from respondents, it is essential to note
that all the above channels of communication are important in one way or another. What
differs is the frequency and context of use. It is also critical to note that an organization
that offers a wide variety of channels of communications increases its ability to
communicate effectively than when such organizations are conservative with the use ot one
or two channels only. Equally important is the fact that organizations should impress the
new media and social media of communication such as email, teleconference to meet the
75

dynamic needs of the young employees and also impart the same to the established
employees such that they are capable to cope with the new trends in communication.
4.10: Information and Communication Technologies (ICT)
In this section, the research wanted to find out whether KLB appreciates the value of
Information and Communication Technologies by incorporating them in their
communication systems. Respondents reacted negatively with a majority, 87.5%, saying
that ICT was not in use at KLB as shown in figure 4.16 below.
Figure 4 .15 : Does organization use ICT100 T---------------------------------------------------------------------------------------------------------------------------
Yes No
Does organization use ICT
However, 68% of respondents confirmed that Email is used at the organization to pass
information. 88% others said that there was no teleconference facility and had not used
any at KLB. About telephone calls, 48% of the respondents affirmed that they used
organization’s telephone facility to communicate though a big number, 52% claimed not to
have used any telephone facility at KLB. There is likelihood that there is an inadequate
supply of calling and receiving points or the telephone facility itself is confined in just a
few offices. 72% of respondents denied using the short message service (SMS) to
76

communicate either within or without the organization and almost all the respondents did
confirm that they have never used Skype services with the communication system ot KLB.
Only 8% said Skype was in place at the organization. There were no other ICT facilities
identified by the respondents despite the fact that about 8% of them felt there were some
other ICT facilities at KLB not established by the research. The general impression is that
very little is done as tar as ICT is concerned at KLB. This is because only a few individuals
are aware of existence of ICT facilities and services and actually make use ot them.
They identified various challenges in the organization making the adoption ot Information
and Communication Technology lag behind. They include; adoption ot new techniques in
market resources, which KLB hasn’t so far updated. Secondly, computer illiteracy among
the employees was low. It was felt that, insufficient ICT gadgets, say few computers at the
organization and limited time to use the available ones contributed much less embracing ot
use of ICT in communication. Thirdly, inadequate computers with limited internet access,
local area network and lack of adequate ICT training also contribute to limited use of ICTs
in communication. Finally, most KLB staff were slow to adopt and showed resistance to
change in terms of communication and technology embracing.
However, they pointed out some structures that KLB has in place, which helps to promote
the adoption and use of ICT within the organization. The structures included the use of
ACCPAC system and the adoption of report presentation using overhead facility. To add
on the above, KLB is in the process of acquiring teleconferencing facilities for meetings
and is working towards the realization that each member of staff should at least have
access to a desktop, laptop or a phone. KLB has also established a department in charge of
77
ICl that has an efficient server and internet installation system that operates in virtually
ail departments. KLB has facilitated buying of computers for managers and supervisors for
e-mailing within the organization in addition to allowing laptop loans for management and
KLB has also facilitated issuance of e-mail addresses with company domain to staff to
facilitate efficient communication.
L l l : Physical and Psychological Distractions
In this section, the research wanted to find out what channel staff members of KLB use to
communicate urgent information to their supervisor and whether the channel was effective
for them. It also sought to find out issues and factors that affect the staff members in
relation to passing messages. Respondents were also asked whether they have undergone
any training in communication and whether they required any. Finally, they were to state
if there were any structural factors that affected their communication at the work place
and how such factors could be contained. The findings are analysed herein below.
In communicating urgent information to supervisors, members of KLB staff either make a
call or write a letter. 92.3% of employees prefer making a call to their supervisors in case of
any emergency or urgent communication of information. Only 7.7% prefer writing a letter
to the same effect. All the respondents (99.99%) clearly indicated that the method they
used was very efficient for them. None of the employees send someone or provided
medical reports on return from the emergency according to the data collected.
Regarding issues affecting the employees about passing of messages, few (35%) said that
messages are passed on only to a few individuals while the rest didn’t have an issue about
78

whom information is passed to. 80.8% of staff members feel that messages passed do not
have clanty problems; 19.2% said that the messages are not clear. However, an equal
number of respondents feel that communication of messages is delayed with 50%
responding in the affirmative to this and the other 50% saying that messages are delayed in
their communication.
There is however a problem when it comes to feedback with many employees, 61.5%
saying that there is no prompt feedback on communication. On the other hand,
respondents were not sure whether messages are often given or not. When asked whether
messages are not often given, 88.5% said that messages are often given. But when the same
question was paraphrased as whether messages were often given, 73.1% said that messages
are not often given. This contradicted their responses.
Training in communication was another aspect under investigation and 80.8% of the
respondents said they had no such training. An equal percentage, 80.8% said that they
need training in communication.
Asa result of these responses, KLB needs to adjust on the speed of offering feedback to all
their communication to employees, give required information to the employees and if
possible, start short term training courses in communication and ICT.
This research also established that employees at KLB suffer from the following structural
factors in relation to communication, which they wished would be done away with
immediately. One major factor is unhealthy bureaucracy, which creates a big gap between
junior employees, and the senior management because of elongated channels of
communication between the two groups mentioned which tend to cause inappropriate
79
delays. Most response delays pointed at the long chain of command in communication
before getting to the Alanaging Director. Another factor is poor transfer and sharing ol
information between the customer care units at the headquarters and Kijabe branch
leading to overlapping of commands and this brews confusion among staff. Thirdly,
inadequate notice boards or bulletin boards in the institution which is the preferred means
of communication among a substantial group of the staff members leads to less information
being shared. Finally, physical noise was pointed out to be originating from machines in
the production department, which acutely affect communication in the department and
nher neighbouring departments
The respondents were also concerned that no measures had been put in place or are being
taken to address these crucial barriers to communication.
8 0

CHAPTER FIVE
SUMMARY, CONCLUSION AND RECOMMENDATIONS
5.1: Introduction
. his chapter contains the summary, conclusions and recommendations after the study was
carried out. Conclusions are made with the objectives of the study stated in chapter one in
mind. Recommendations are made in regard to the topic of study, which is a managerial
ranction, and are intended to enhance effective communication in corporate organisations.
5.2: Summary
The research project was concerned with factors affecting effective communication within
corporate organisations case study of KLB. The objectives of the study were to establish
:he structural barriers that hinder the efficient flow of information at KLB, to identify the
most preferred medium/media of communication at KLB and access it ability to enhance
effective communication, to examine the relevance of modern information and
communication technologies (ICTs) used to enhance effective communication within KLB
and to establish the physical and psychological distractions among employees that affect
effective communication within KLB. Data was collected through a questionnaire
administered to sample employees of KLB and analysis of existing literature regarding
communication at KLB.
factors that affect effective communication positively at KLB have been identified as
clarity of messages, use of face-to-face meetings, minimal psychological and physical
-extractions, presence of feedback and good command of language. On the other hand,
^adequate interpersonal skills, complacency due to long working years at KLB,
‘̂ -adequate ICT skills, bureaucratic requirements, absence of a communication policy are
key factors that have negatively affected effective communication at KLB. All the listed
8 1

nesative factors culminate into noise within the communication process at KLB. It was
established that KLB does not have a communication policy and this causes confusion
among employees when it comes responding to non-routine activities that in turn cause
delays in feedback. KLB’s communication mainly is carried out in memos which is a 5
preferred channel of communication, this results in information being redundant,
ambiguous or vague.
5.3: Conclusion
Five factors have been identified to affect communication positively at KLB. These are
clearly designed messages which are easy to decode, the most preferred medium or
channel of communication being face to face or meetings which enable the sender and
receiver to share non-verbal cues, absence of physical and psychological distractions,
presence of feedback and good command of whatever language is used to communicate.
However the negative factors identified shade light on the fact that KLB has suffered loss
in instances where there has been delayed delivery of books, delayed feedback essentially
because of the bureaucratic strands. Little embracing of ICT by the staff has also led do
slowed business growth because many business opportunities exist online.
82

5.*$: Recommendations
The Findings ol the research have strong implications on management at KLB, corporate
organisations and scholars. Based on the findings of the research, several
recommendations are suggested first and foremost is training of employees in new,
dynamic and technical fields such as information technology that can help improve the
efficiency ot communication patterns and systems.
Secondly, KLB needs to embrace strong technological advancement by encouraging IT
based communication such as chat rooms, e-mails, teleconferencing among others. This
can also be done through availing enough technology-based equipment such as personal
computers and laptops.
KLB also needs to reduce to all cadres of employees’ bureaucracies; this will enhance tree
conversation amongst all employees regardless of their ranks, enhance feedback
mechanisms and strengthen service delivery and responsiveness to emergencies. This will
create room for business growth due to enhanced service delivery.
Critical among recommendations is to design and develop a communication policy that
should be updated from time to time. The policy should have clearly defined strategies that
will be used to achieve effective communication at KLB. A communication policy will
clearly define the communication roles and responsibilities of stall and managers and will
cushion against outdated practices while encouraging increased organisational change and
growth. Communication strategies drawn dorm the policy will lacilitate communication
efficiency.
83

All round training refresher courses on interpersonal skills to eliminate complacency
especially among older staff members will not only create good communication patterns
but also personal skills which enhance skills and work relations. It will create job
satisfaction and enhance organisational effectiveness. This will aid in embracing change lor
the better of KLB.
KLB as an organisation needs to reduce communication by memos and maximise face-to-
face meetings, as it is the most preferred channel. The onus is on the line supervisors to
design quick and creative means of meeting line staff and reaching out to them to relay
work objectives and re-evaluate them during monitoring and progress of the work.
KLB needs to employ the all channel design of effective communication with a
communication manager at the forefront of guiding communication processes inter
departmentally. This will help harness staff synergy, which in turn will increase staff
productivity.
Finally, other research should be carried out with the same topic but focusing on the
external publics to help determine the interlinkage of effective communication between the
internal and external publics of KLB.
The following functional model has been designed and suggested by this research to aid
and enhance effective communication at KLB.
84

ONE STOP COMMUNICATION AT KLB
-------------------------- * ■ Communication from Seniors to Juniors
.................................. > Communication from Juniors to Seniors
^ Interdepartmental Communication
Model for one stop dialogue communication between KLB Headquarters and Kijabe sell Point Centre
Since the research has identified some gaps in terms of effective communication at KLB,
:he above model will help facilitate communication. Communication that is to be adopted is
resigned to be cyclic with the shown control points. Feedback should be embraced fully
both in the upward communication or the downward methods of communication.
j nere should be a central office keeping and disseminating information especially to and
from the Kijabe sell point office to avoid incidences of parallel instructions and counter
instructions. This will foster streamlined service delivery. Stocks outs and delayed
deliveries will be catered for in the said communication model since there is a library of
information to refer in case there is a clarification to be made.
The model guides communication interdepartmentally which is currently missing at KLB.
Interdepartmental communication with a key custodian of information per department will
^d effective communication. This will limit, rumours, grapevine and ensure prompt action
n̂d point of reference in case there is emergency or a task to be accomplished.
85

REFERENCES
Armstrong M. (1996) H um an R esou rce M an a gem en t P ra ctice, London, Kogan page limited.
.Andersen H. & Rasmussen E. S. (2002). “The Role of Language Skills in Corporate
Communication” Paper presented for the N ordic W orkshop on Inter-organisational
Research, No.12, Kolding 16 - 18 August 2002, Denmark.
Adair J . (2009): E ffective C om m un ica tion in O rgan isa tion s The M ost Im portan t M an a gem en t Sk ill
of All, Pan Macmillan.
Baltes etal (2009) Robot S o c c e r W orld Cup XIII, Berlin, Springer Verlagand University ol
Bonn.
Baker R. and Angelopulo G. (2006 )Iritegra ted O rgan isa tion a l C om m unica tion , Cape
Town.Juta and Company.
Bertalanify, K. (1968), M ensch en W issen w ir n ich t in Robot, M en and M inds by Dr.
Fiechtner,Hans-Joachim (1970). Dusseldorl, Wein, Germany.
Barrett, D .J. (2006). L eadersh ip C om m unica tion , New York: McGraw-Hill.
Burleson R. B. and Greene O .J. (2003) H andbook o f C om m un ica tion and S o cia l In tera ction
Skill.,, New Jersey, Lawrence Erlbaum Associates Publishers.
Barrett, D.J. (2006). L eadersh ip C om m unica tion , New York: McGraw-Hill.
86
Sarrett D. J . (2006). L eadersh ip C om m un ica tion : A C om m unica tion A pproach f o r S en ior-L evel
•'anagers-. Rice University, Houston, Texas.
BugentaJ, D. E., Kaswan, J . W„ & Love, L. R. (1970). Perception of contradictory
-leanings conveyed by verbal and nonverbal channels. J o u rn a l o f P er son a lity a n d S ocia l
P sy ch o lo g y .
Bumard P. (1997) E ffective C om m un ica tive Skills f o r H ealth P ro fe s s ion a ls , London, Stanley and
Thornes.
Caputo J .e t al (2003), E ffective C om m unica tion , England, Drammatic Lines Press.
Daly J.A . (2003), E ducatum a n d In fo rm a tion S o c ie ty , New York.
DeFleur L. M. (1995) M ileston es in M ass C om m un ica tion R esearch , New York, Longman.
Erven B. L. (2001). O vercom in g B arriers to C om m un ica tion . Department ol Agricultural,
Environmental and Development Economics, Ohio State University.
r-ccles, R.G. & Nohria, N. (1991). B eyon d th e H ype: R ed iscoverin g th e E ssen ce o f M ana gem en t.
Easton: Harvard Business School Press.
r elding M. (2006) E ffective C om m unica tion in O rgan isa tions, Cape I own, Ju ta and
Company.
87

j u o . K. L.and Sanchez Y. (2003). “A study of the skills and roles of senior level healthcare
onagers" in The H ea lth ca re M a n a g er : Florida International University in Miami, Florida.
iasomo. D. (2006). R esea rch M eth od s in H um an ities a n d Educat 'um. (S ta tis tic , M easu rem en t
c i lu a t i o n a n d T es t in g ) Egerton, Kenya: Egerton University Press.
venya Literature Bureau Strategic Plan (2005 — 2010)
Kenya Literature Bureau Strategic Plan (2010 - 2015)
Kenya Literature Bureau staff scheme of service manual
Kenya Literature Bureau Annual Report (2010)
Kenya Literature Bureau — The P ub lish er Magazine 2009,2010 Issues
.Kenya Literature Bureau — Departmental Standard Operating Procedures
Kenya Literature Bureau — Sales, Accounts Publishing Meetings Minutes April 2011
Kraut, R. E. et al. (2002). In fo rm a l C om m un ica tion in O rgan iza tion s: Form, Function , and
T ech n o lo gy . Morristown, N J 07962.
Uplante, D. & Ambady, N. (2002). “Saying It like It Isn’t: Mixed Messages from Men
and Women in the Workplace” in J o u rn a l o f A pplied S o cia l P sy ch o lo g y : Harvard University.
Lind strom, M. & Kotler P. (2010) B rand Sem>e- Sensory S ecre ts B eh in d tb e S tu f f w e B u y Page
London ,Kogan.
Lunenburg, F. C. (2010). Communication: “The Process, Barriers, and Improving.
Effectiveness” in S choo lin g Volume l , N um ber 1. Sam Houston State University.
88
ugenda O.M. and Mugenda (2003). R esea rch M eth od s. Qualitative and Quantitative
Approaches. Rev. Ed). Nairobi: Africa Centre for Technology Studies Press (ACTS).
'.ugenda O .M . and Mugenda (2008) S o cia l S cien ce R esearch Nairobi: Africa Centre for
Technology Studies Press (ACTS).
Jrodho, J . A. (2005). T echn iques o f W riting R esea rch P rop o sa l< a n d R eports in E ducation and
Social Sciences, 2 “ ED. Nairobi: Kenezja Hp Enterprises.
.Mullins J . L. (1985) Management and Organisational Behaviour, Edinburg, Pearson
Education Limited.
TcQuail D (2003) /Mass C om m unica tion Theory, Aiden Press London
Nzerem T.A.N. (1996). The Importance of Communication in the Teaching and Learning
-•'rocess. In: PO Nwokolo, O Otubelu (Eds.): E ffectiv e T each ing: A Book o f R eading. Onitsha,
-\mensuo Educational Publishers.
Saleemi N. A. and Bogonko J.B . (1997) M aiu igem en t (P rin cip les a n d P ra ctice S im plified ,
Nairobi. Saleemi Publishers.
Sevenn W. J . and Tankard J .W . (2001) C om m unica tion Theories: O rigin , M ethods and Uses in
‘beM o m M ed ia . New York, Longman
89

-.obbins S.P. and Coulter M. (2005} M anagem en t, Upper Saddle River, Pearson Education
: -blisters.
tw o F.A. (1995). I n s tr u c t io n a l C om m unication . In: FA Okwo, GA Ike (Eds.): E duca tiona l
C onstituencies (internal or external).
Todho, J . A. (2005). T echn iques o f W riting Re<tearch PropiwaLt an d R eports in E ducation a n d
:ia i S c ien ces , 2 ‘ Ed. Nairobi: Kenezja Hp Enterprises.
* ood T. J . (2004), C om m un ica tion Theories in A ction, Belmont, Wadsworth/Thompson
~d www.wisc-online.com/obiects/ViewObiect.aspx?ID=OIC25Ql
'www.exploratorium.edu/complexitv/ComDLexicon/Shannon.html
ntp://www.coms.ohiou.edu/Websites/coms/Files/Content/539313/cheney.pdf
90

a p p e n d ix I
QUESTIONNAIRE
InstructionsThe questions elicited below are aimed at seeking general information regarding communication processes at Kenya Literature Bureau and the factors affecting effective communication in your organization. Please indicate your response by either ticking or writing in the space provided. Your responses will be used anonymous and will only be used for the purpose of this study. Since all the information in this questionnaire is confidential DO NOT WRITE YOUR NAME. Thanking you in advance for your honest answers.
PARTIDEMOGRAPHIC FACTORSUse a tick •/ to answer the questions(i) Kindly indicate your age (years) ?
(a) Below 25 □(b) 25-29 □(c) 30-34 □(d) 35-39 a(e) 40-44 □(0 45-49 □(g) Above 50 □Are you male or female?(a) Male □(b) Female □
Highest academic qualification?(a) Certificate □(b) Diploma □(c) Bachelors degree □(d) Master degree □(e) PhD □(0 Any other □
Specify.
Employment details(i) W hat is your current employment scale?
(a) Scale 9 and above □(b) Scale 8 □(c) Scale 7 □(d) Scale 6 □(e) Scale 7 and below □I or how many years have you worked at KLB?(a) Below 5years □(b) 10-15 years □(c) 15-20 years □
91
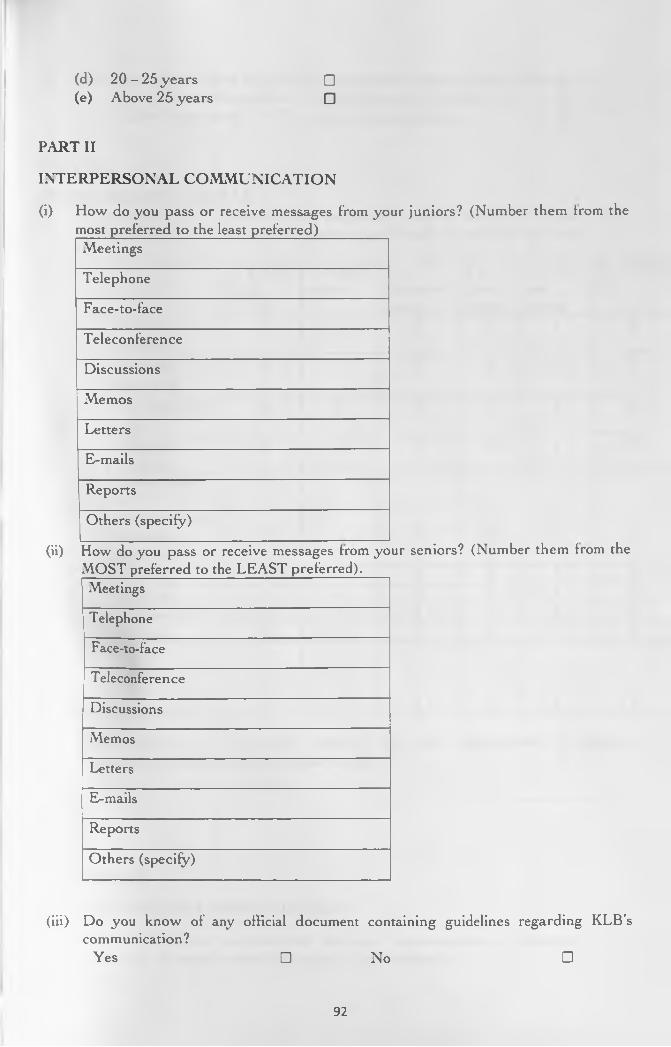
(d) 2 0 -2 5 years(e) Above 25 years
□□
PART II
INTERPERSONAL COMMUNICATION
(i) How do you pass or receive messages From your juniors? (Number them from the most preferred to the least preferred)_______Meetings
Telephone
Face-to-face
Teleconference
Discussions
Memos
Letters
E-mails
Reports
Others (specify)
(ii) How do you pass or receive messages from your seniors? (Number them Irom the MOST preferred to the LEAST preferred).Meetings
Telephone
Face-to-face
Teleconference
Discussions
Memos
Letters
E-mails
Reports
Others (specify)
(iii) Do you know of any official document containing guidelines regarding KLB’s communication?
Yes □ No □
92

(iv) How often do you follow the guidelines regarding communication? (Choose 1). I don t follow them at all Z1 I follow the once in a while DI follow them rarely □ I follow them all the time □
PART III
COMMUNICATION SKILLS(i) In a scale of 0 to 5 please indicate the extent to which the factors elicited below
enhance effective communication in your organization? (Circle appropriately)
5 = Veiyhighextent
4 = High extent
3 =Moderateextent
2 =Lowextent
l=Verylowextent
0 = Not at all
1. Clarity of message
5 4 3 2 1 0
2. Languagecommand
5 4 3 2 1 0
3. Good listening skills
5 4 3 2 1 0
4. Adequatefeedback
5 4 3 2 1 0
5. Channel used forcommunication a) meeting phone call etc
5 4 3 2 1 0
5 4 3 2 I 0b) Memo, 5 4 3 2 1 0c) Phone call 5 4 3 2 1 0
d) Email 5 4 3 2 1 06. Others
(specify).............
5 4 3 2 1 0
(ii) Please indicate any measures instituted by your organization to improve communication skills within the organization.
PART IV
CHANNEL OF COMMUNICATION
(i) Please indicate your most preferred channels of communication of choice in enhancing effective communication by tick appropriately.
93

Media Number them as preferred
Meetings
Telephone
Face-to-face
Teleconference
Discussions
Memos
Letters
E-mails
Reports
(ii) What influences the choice ofyour preferred channel(s) in question 1 above?
PART V
INFORMATION AND COMMUNICATION TECHNOLOGIES (ICT)(i) Does vour organization use modern ICT to enhance effective communication?
Yes ' □
No □
ii) If yes in question 1 above indicate the ICTs employed in your organization by ticking appropriately.
ICTs Tick in the boxes belowE-mailTeleconferencingCell phone callsSMSSkypeOthers (specify)
(ii) Please indicate the challenges (if any) that hinder the optimum utilization of ICT in your organization
(iii) What structures (if any) has your organization put in place to promote the use ot ICT within the communication processes of your organization
94

PART VI
PHYSICAL AND PSYCHOLOGICAL DISTRACTIONS(0 When in a situation ot distress or urgent need, how do you
supervisor? (Tick one answer)communicate with your
(a) Write a letter □
(b) Make a call □
(c) Send someone D
(d) Provide a medical sheet on return D
(ii) Is the method you use in 1 above convenient for you?
(a) Yes □(b) No □
(iii) What issues affect you regarding passing ot messages at than one answer)
KLB? (You can tick more
Messages are given to few individuals □
Messages are not clear □
Messages delay □
You don’t receive feedback promptly □
Messages are not often given □
Messages are often given □
(iv) Have you undergone any form of training in communications?Yes □ No □
(v) II no in 4 above vou require any?Yes ' □ ' No □
(vi) Are there structural factors that affect communication at your place ot work ? Explain your answer.
(vii) It yes in 5 above, what measures have been put in place to address the structural factors?
THANK YOU FOR YOUR SUPPORT
95