effective instructional time use for school leaders
TRANSCRIPT
Effective Instructional Time Use for School Leaders: Longitudinal Evidence from Observations of Principals
Jason A. Grissom
Vanderbilt University
Susanna Loeb Ben Master
Stanford University
***
Scholars have long argued that principals should be instructional leaders, but few studies have empirically linked specific instructional leadership behaviors to school performance. This study examines the associations between leadership behaviors and student achievement gains using a unique data source: in-person, full-day observations of approximately 100 urban principals collected over three school years. We find that principals’ time spent broadly on instructional functions does not predict student achievement growth. Aggregating across leadership behaviors, however, masks that some specific instructional investments predict year-to-year gains. In particular, time spent on teacher coaching, evaluation, and developing the school’s educational program predict positive achievement gains. In contrast, time spent on informal classroom walkthroughs negatively predicts student growth, particularly in high schools. Additional survey and interview evidence suggests this negative association may arise because principals often do not use walkthroughs as part of a broader school improvement strategy.
***
Research documenting the substantial variation in principal effectiveness across schools
highlights the importance of identifying the behavioral factors that lead some principals to be
more effective than others (e.g., Blank, 1987; Branch, Hanushek, & Rivkin, 2012; Brewer, 1993;
Coelli & Green, 2012; Grissom, Kalogrides, & Loeb, 2012; Heck, 1992). Among potential
explanations, the idea of instructional leadership echoes loudest in educational administration
literature. Although definitions vary, instructional leadership generally is defined as the class of
leadership functions that support classroom teaching and student learning (Murphy, 1988). The
connection between instructional leadership and classroom instruction or student achievement is
indirect, potentially mediated by a large number of school processes (e.g., curriculum
coordination, how students are grouped) and intermediate outcomes, such as high teacher
2
expectations and a school climate focused on instruction (Bossert, Dwyer, Rowan, & Lee, 1982;
Hallinger, Bickman, & Davis, 1996; Hallinger & Heck, 1998; Supovitz, Sirinides, & May,
2010). Across several decades of quantitative studies, a recent meta-analysis shows positive
average effects of instructional leadership on student achievement, though many of the studies
included in the review may not have appropriately controlled for confounding factors (Robinson,
Lloyd, & Rowe, 2008).
An obvious challenge for a concept as broad as leadership functions that support
teaching and learning is distilling which behaviors count as instructional leadership and which
do not. Without such specificity, practitioners have little guidance for how they might develop or
improve instructional leadership within their schools. Studies emphasize different components—
most commonly, setting goals, monitoring classrooms, supervising instruction, evaluating
progress, coordinating the curriculum, planning professional development, and protecting
instructional time (e.g., Hallinger & Murphy, 1985; Hallinger, 2005)—but a major thrust of this
literature is that strong instructional leaders are “hands-on leaders, engaged with curriculum and
instruction issues, unafraid to work directly with teachers, and often present in classrooms”
(Horng & Loeb, 2010, p. 66). This latter idea, that good principals frequently visit classrooms in
walkthroughs or informal evaluations, has become a particularly popular identifier of
instructional leadership (Eisner, 2002; Protheroe, 2009). Walkthroughs are described as data-
gathering vehicles wherein principals collect information about teaching practice or
implementation of school programs to learn what teachers need but not to evaluate them (David,
2007). When used frequently, proponents suggest that short, informal walkthroughs can help
build a more positive instructional culture, gauge the school climate, and demonstrate the value
they place on instruction (Downey et al., 2004; Protheroe, 2009).
3
Unfortunately, the research base for such claims faces important limitations. Although
the literature on instructional leadership is extensive, most studies in this area—like research on
principal effectiveness more broadly—focus on small samples or, in the case of larger-scale
studies, rely exclusively on surveys (and potential biases introduced by self-reports) to draw
inferences about principal behaviors and skills. Moreover, studies linking principals’
instructional leadership behaviors to student outcomes using larger samples have rarely utilized
longitudinal student-level administrative data capable of appropriately controlling for other
predictors of student achievement. The few prior studies attempting to link instructional
leadership to student outcomes in this kind of rigorous empirical framework have uncovered
little evidence of an association (Grissom & Loeb, 2011; May, Huff, & Goldring, 2012). This
divergence between prior research advocating the importance of instructional leadership and
these more recent findings presents a puzzle that this study seeks to address.
In contrast to nearly all existing studies, this study not only uses longitudinal data on
schools, principals, and students within a student achievement growth framework but leverages a
unique alternative source of data on school leadership behaviors: in-person observations. Over
three different school years, we sent trained observers into a stratified random sample of
approximately 125 schools in Miami-Dade County Public Schools, the nation’s fourth-largest
school district, to shadow school administrators over full school days and record detailed
information about principal time allocation. Pairing the detailed observational data with rich
administrative data provided to us by the district and with survey data collected from the
principals, we investigate principals’ investment in instructional leadership behaviors in their
schools.
4
Then, building on time-use studies reaching the surprising conclusion that time spent on
instruction broadly bears little relationship with improved outcomes (e.g., Horng, Klasik, &
Loeb, 2010; May, Huff, & Goldring, 2012), we examine how principals in different kinds of
schools spend time on specific task areas related to instruction. We differentiate among five key
areas that have emerged in the literature as important day-to-day instructional leadership
activities: classroom walkthroughs; teacher coaching, or providing instructional feedback to
teachers (Neumerski, 2013); evaluation of teacher instruction, which has long been a component
of principals’ responsibilities but which has recently grown markedly in importance as a result of
state and district policy shifts towards more rigorous evaluation systems (Donaldson, 2009;
Ebmeier, 2003); professional development (Blase & Blase, 1999; Youngs & King, 2002); and
developing the school’s educational or curricular program (Hallinger & Murphy, 1985). We then
test whether different investments in specific instructional leadership activities predict student
achievement gains in schools. In subsequent analyses, we also draw on surveys and interviews
conducted among the same set of principals to further illuminate the connections between
instructional leadership behaviors and school performance.
Data
In-Person Observations
Using a similar data collection approach to Horng et al. (2010), we sent trained observers
to shadow participating lead principals (one per school) in Miami-Dade County Public Schools
(M-DCPS) throughout a full school day for one day in the springs of 2008, 2011, and 2012. M-
DCPS educates approximately 350,000 students each year, a large majority of whom (62
percent) are Hispanic and eligible for subsidized lunches (75 percent). The observers for this
5
study were armed with a protocol developed by our research team over multiple years of
working with time use data. During each observation, a timer alerted the observer to record
information about the principal’s activity in five-minute increments, beginning about 30 minutes
prior to the official start of school and ending with the afternoon bell. The protocol contained a
list of approximately 50 task areas (e.g., student discipline, communicating with parents)—plus
modes of activity (e.g., face-to-face meeting), location, and other variables—which the observer
used to code principal activities throughout the day.1 Observers were trained on how to conduct
the observations and how to differentiate among the principal tasks using consistent decision
rules.2
The initial sample of observed schools included all M-DCPS high schools plus a random
sample of elementary and middle schools. The scale of data collection was deliberately large to
allow for explicit modeling of the links between principals’ actions and school outcomes.
Seventy-four percent of the schools in the study hosted observers in multiple (2 or 3) years.
Prior to the first data collection, we conducted a pilot study in which multiple observers coded
the same principals’ time use on separate protocols with the same timer to assess the reliability of
the observations. Inter-rater agreement was 85%. Throughout the study, we repeated this
“duplicate coder” procedure in a subsample of schools to ensure high reliability among coders.
While the data provide a reliable “snapshot” of principals’ time use, they are noisy measures of
individuals’ typical practices or of variation in their practices over time. As a result, correlations
1 Observers were trained to identify the specific task code corresponding to the principal’s activity at the moment the timer sounded. If more than one task code was necessary to accurately reflect the principal’s activity, coders were allowed to record multiple task codes on the protocol. 2 Training included practice coding of videos of principals, coding role plays, and coding feedback. Observers were provided with detailed descriptions of codes and examples of when they would apply that they studied prior to and during training and could access while conducting observations.
6
in particular instructional time use task categories from one year to the next are modest
(approximately 0.2 for most tasks).
Administrative Data
We link observations to rich administrative data about students and personnel provided to
us by M-DCPS. Student files include student characteristics and performance information on the
Florida Comprehensive Assessment Test (FCAT), which we use to create achievement growth
measures over time. In order to account for possible changes to tests and scaling over time, we
standardize students’ test scores within each grade, subject, and year of administration.3 FCAT
test data is only available for students in grades 3–10, and only in the subjects of math and
reading, which limits the population of students whose outcomes are examined in this study.
Personnel files include information about principal characteristics and employment in
each year. Principals were linked with their school in each year in which they were observed. Of
the 94 schools sampled more than once over the five-year span of the study, roughly half (47%)
experienced at least one change in principals, in which case we shadowed the new principal the
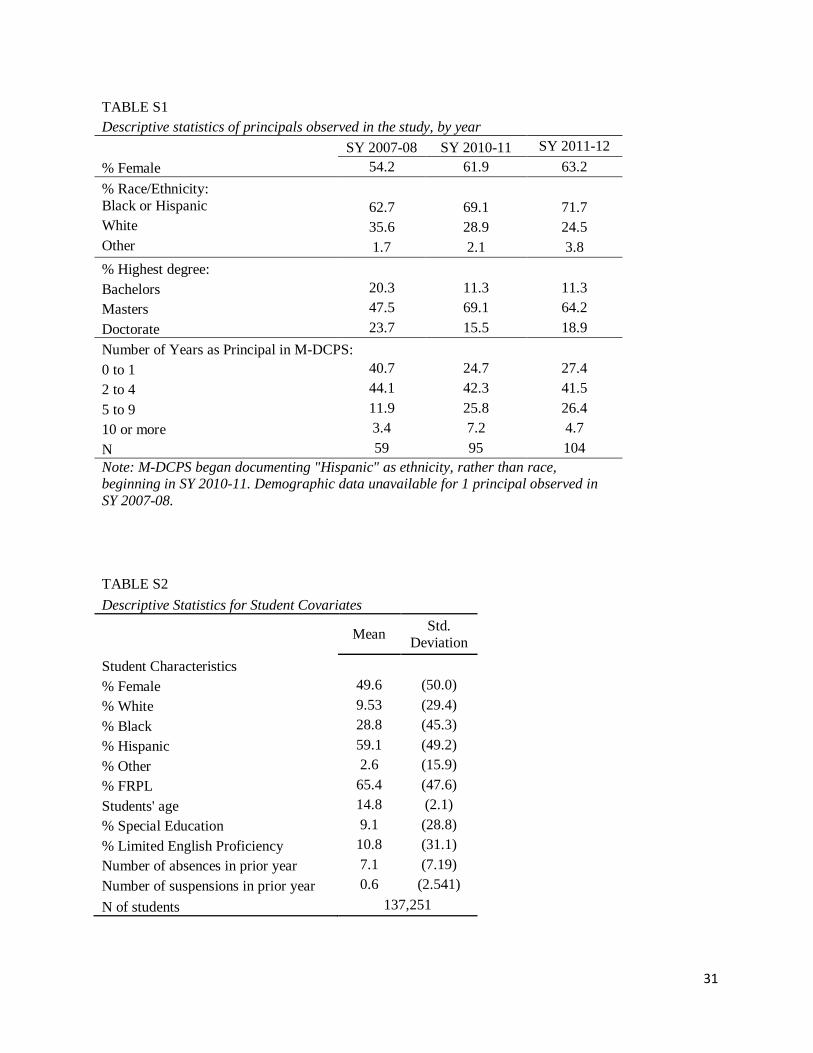
following year if possible to keep the school in the study. Descriptive statistics for principals and
students are available in the supplemental appendix, Tables S1 and S2, respectively.
Interviews and Surveys
Finally, we supplemented the observational and administrative data with structured
interviews and web-based principal surveys. Interview data come from all principals observed in
the 2011 data collection; for this study, we focus on responses to a general question asking
3 The FCAT tests exhibit IRT marginal reliabilities of around .9 across grades and subjects. For more information about the FCAT, see Florida Department of Education (2007).
7
principals to describe what it means to be the instructional leader of their school. Survey data
come from surveys of all M-DCPS principals in 2008 and 2011, which asked about classroom
observations. We gave surveys to all 314 M-DCPS principals in regular public schools in spring
2008 and 306 principals in 2011 and obtained an average response rate of 89%.
Methods
The goal of this study is to answer the following three research questions. First, we ask
what proportion of principals’ overall time is spent on instructional activities overall and on each
of five different types of instructional activities. In particular, we investigate the following
activities: (a) coaching teachers to improve their instructional practice; (b) developing the
school’s educational program or evaluating the curriculum; (c) evaluating teachers through a
formal process; (d) informal classroom walk-throughs to observe practice; and (e) planning or
participating in teachers’ professional development. Second, we ask whether variation in specific
instructional activities is associated with differences in school characteristics. Finally, we ask
whether variation in specific instructional activities predicts either schools’ achievement growth
or the trajectory of schools’ achievement growth over time.
The first two research questions are descriptive. For the first question we simply report
statistics describing the time spent on instruction overall and on each task. For the second
question we describe differences in the characteristics of schools in which principals spend more
or less time on instructional tasks and we test the differences with simple t-tests.
Student Achievement Growth Models
8
The final question requires more rigor. Although we do not have the ability to identify a
convincingly causal effect of principal time use on school effectiveness, we aim to provide initial
evidence on whether there is likely to be a causal relationship. To this end, we want to compare
observably similar schools, reducing the possibility that the observed relationship is driven by
factors that affected both school performance and principal behavior. Our first set of analyses is
based on the following equation:
𝐴𝑖𝑔𝑠𝑦 = 𝛽0 + 𝐴𝑖𝑔𝑠,𝑦−1𝛽1 + 𝐴𝑖𝑡𝑔𝑠,𝑦−1𝑜𝑡ℎ𝑒𝑟 𝛽2 + 𝑋𝑖𝑔𝑠𝑦𝛽3 + 𝐶𝑔𝑠𝑦𝛽4 + 𝑆𝑠𝑦𝛽5 + 𝑃𝑠𝑦𝛽5𝑦 + 𝜋𝑔 + 𝜃𝑦 + 𝜀𝑖𝑔𝑠𝑦 (1)
Here, the test performance of student i in grade g in school s in year y is modeled as a
function of that student’s test performance in the prior year both in the same subject (e.g., math
or reading) and in the other subject as well as student characteristics X, classroom characteristics
C, and school characteristics S. The student characteristics we include are: gender, race, age,
free or reduced price lunch (FRPL) status, special education (SPED) status, limited English
proficiency (LEP) status, and prior-year absences and out-of-school suspensions. The classroom
characteristics are the class averages of student demographic characteristics, reading and math
scores, and behavioral outcomes from the prior year, plus the standard deviation of the class’s
scores.4 The school characteristics are: total student enrollment, the proportion of student racial
groups and FRPL students in the school, and indicators for school level (elementary, middle, or
high).5 Also included in Equation 1 are grade and year fixed effects to take out any systematic
differences in achievement across years and grades. Finally, Equation 1 includes our measure of
4 In cases where students attend multiple classes in the same subject in a given school year, classroom characteristics are computed as the mean of each of those classes. Students who transfer between schools mid-year are linked with the school in which they were tested. 5 Students are matched to the school in which they took the achievement test used as the dependent variable. This matching may misattribute a student’s performance to a school if he or she transferred in during the school year.
9
interest, P, which is principal time use on instructional activities. 6 The equation essentially
models whether students who we would predict would have similar achievement gains given
their own characteristics, their classrooms characteristics, and schools’ characteristics actually
learn more in schools where principals spend more time on instruction. The model is run at the
student level with standard errors clustered at the school level.
Equation 1 allows us to ask whether students learn more in schools where we observe
principals spending more time on instruction. However, one aim of instructional leadership is to
improve school effectiveness so that schools get better over time and students learn more today
than they did in the past or more in the future than they do today. Students in a fourth grade
classroom in one year are not the same as students in that same classroom in another year, so it is
difficult to determine how much the current students would have learned in prior years had their
principal been spending more or less time on instruction. Our approach is to create an estimate of
each school’s effectiveness (“value-added”) in the same subject in each of the past two years and
to add these measures to the model presented in Equation 1. We take that approach here, using
two prior years’ school-by-year effectiveness gains with empirical Bayes shrinkage techniques as
described in Grissom, Kalogrides, and Loeb (2012) to reduce measurement error in the school
gains. Thus, this second analysis examines the relationship between principal time use and the
trajectory of their school’s student achievement gains. It asks whether students learn more when
their principal spends more time on instruction, after adjusting for the prior-year achievement
gains of students in that school.
Analysis of Survey and Interview Data 6 While we examine principal characteristics in this study, we do not explicitly control for principal characteristics other than time use, due to possible endogeneity. Alternative models that include principal characteristics yield very similar results.
10
Finally, given our findings from the analyses above, we use principal survey data,
interview data, and additional, supplemental observational records that provide more detailed
information on time use when principals are engaged in instructional tasks. Specifically, we first
leverage survey data from 2008 that investigated principals’ perspectives about their classroom
walkthrough activities. In particular, we examine whether principals identified their classroom
walkthroughs as interactions that were seen as opportunities for professional development. We
use this data to sharpen our identification of classroom walkthroughs as either more or less
related to teacher development. We also explore interview data from a subset of principals
regarding their rationale for engaging in classroom walkthroughs. Finally, we investigate the
specific content and tone of interactions that observers coded as supplemental information when
they identified teacher coaching activity to better understand the work that principals were
engaged in. Descriptive analysis from this data helps us to better understand the patterns that
emerge with respect to instructional coaching.
Results
Principals’ Instructional Time Use
Our analyses begin with a description of how much time principals spend on instructional
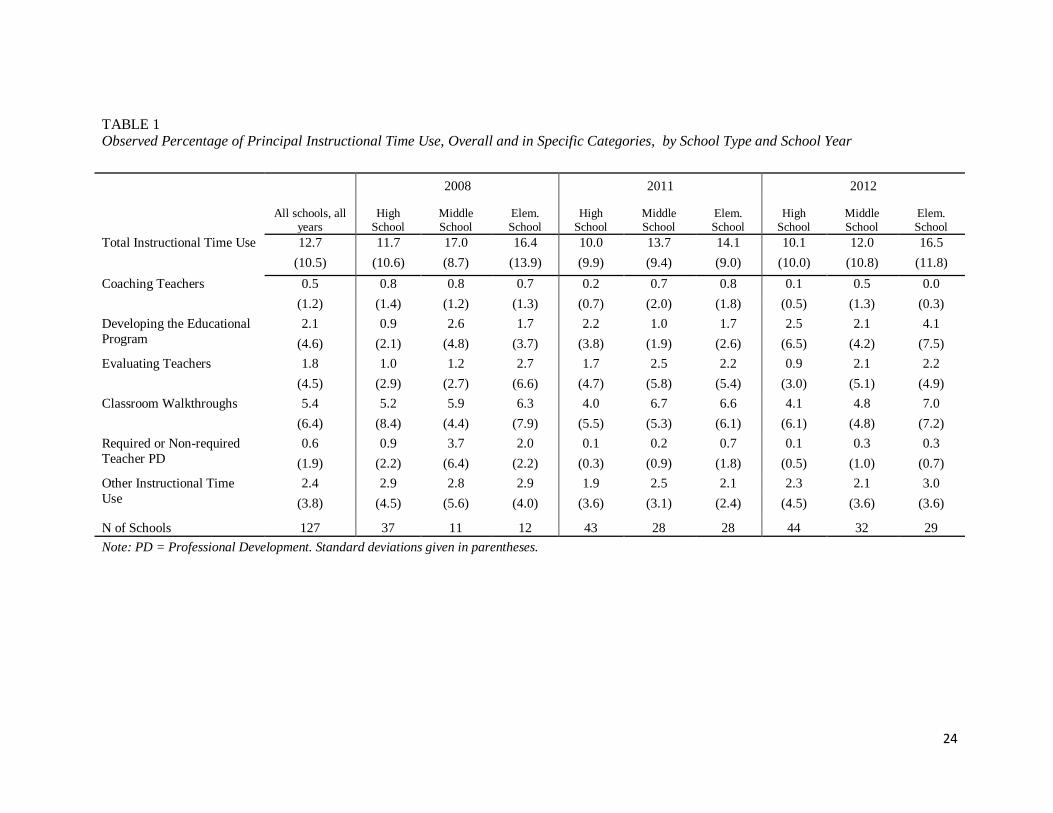
activities during the school day. Table 1 describes the distribution of principals’ instructional
time use overall and across specific categories of instructional activity. Overall, principals spend
an average of 12.7 percent of their time on instruction-related activities. Within this area, brief
classroom walkthroughs are the most common activity, accounting for 5.4 percent of principals’
time use. Formally evaluating teachers accounts for 1.8 percent of principals’ time. Principals
spend 0.5 percent of their time informally coaching teachers to improve their instruction, and 2.1
11
percent of their time developing the educational program and evaluating the curriculum at their
school. Observed principal activity related to professional development planning or execution
varies widely across school years and types but averages 0.6 percent of time use. Nine other
instructional time use categories total to 2.4 percent of principals’ time.
Variation in principals’ overall instructional time use is associated with several school
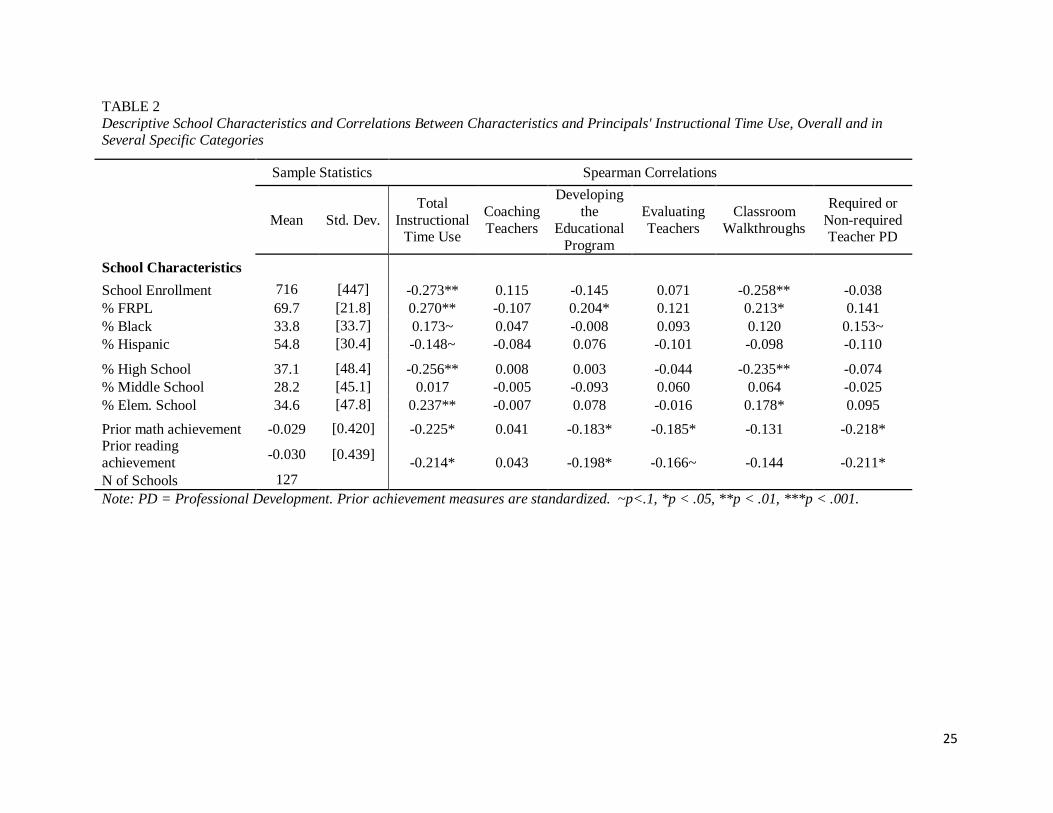
characteristics. Table 2 describes a variety of school characteristics for our sample, and also
shows the correlations between each school characteristic and both overall and specific
categories of instructional time use. Elementary school principals spend a greater portion of their
time on instructional activities, while high school principals spend less. Moreover, principals
who spend larger amounts of time on instructional activities tend to lead schools with lower
achievement levels, more black students, and more free or reduced price lunch students. The
negative correlation between principal time on instruction and prior school achievement stands in
contrast to earlier research finding instructional leadership to be more common in high-achieving
schools (e.g., Hallinger et al., 1996; Heck & Marcoulides, 1996; Heck, 1992) and may reflect a
shift—at least in M-DCPS—towards focusing instructional leadership efforts in low-achieving
schools as a means of improving student performance.
Associations between school characteristics and instructional time use vary as a function
of the specific instructional activity in question. For example, there are no significant differences
in the characteristics of schools by the percent of time principals spend coaching teachers.
However, there are some substantial differences as a function of the proportion of time spent
developing the educational program and evaluating the curriculum, evaluating teachers, and
conducting classroom walkthroughs. In particular, principals in lower-achieving schools and in
schools with a higher proportion of free or reduced price lunch students spend more time on
12
these types of instructional interventions. In a similar vein, principals in lower achieving schools
and schools with more black students, spend more time on professional development than
principals in other schools. Finally, principals spend less time on classroom walkthroughs in high
schools and in larger schools.
Instructional Time Use and School Performance
The primary goal of this study is to examine the extent to which overall and specific
instructional time use are associated with student achievement growth and with the trajectory of
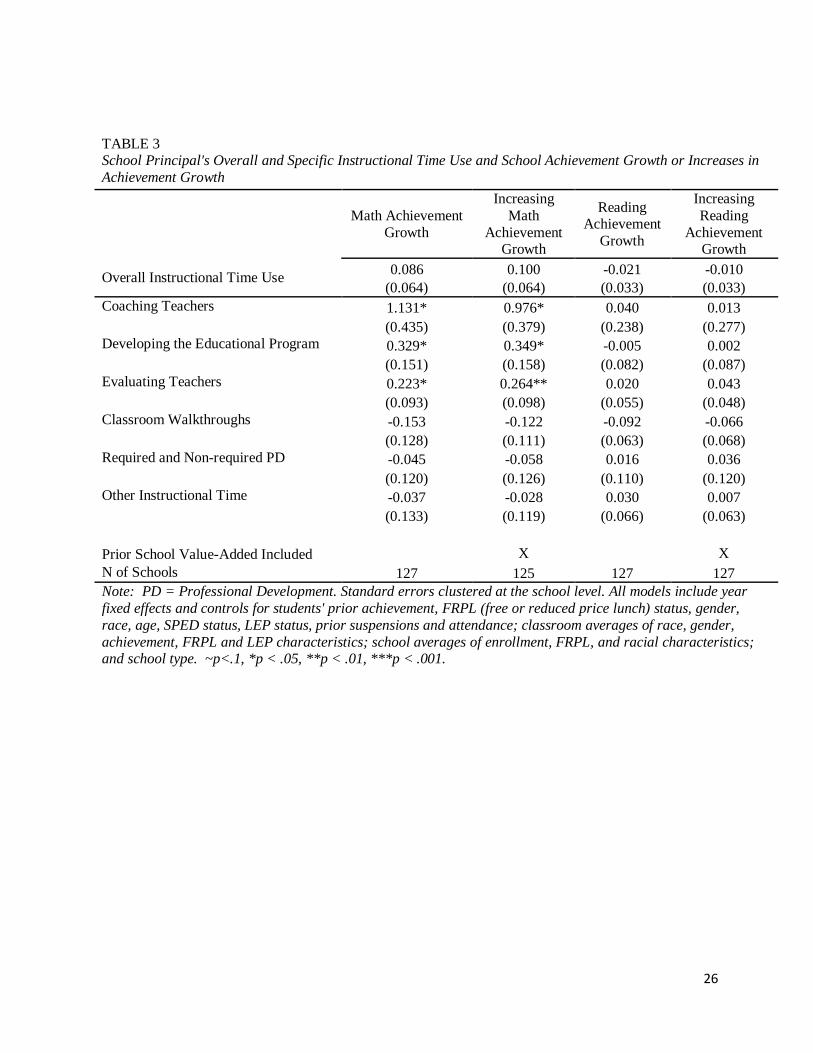
schools’ student achievement growth over time. Table 3 provides these results for our full
sample of schools across all three school years in math and in reading. The first panel of Table 3
shows that overall instructional time use is not significantly associated with any difference in
student achievement or school improvement. This result is in keeping with earlier results finding
no evidence of a relationship between school outcomes and time spent on instructional tasks
(Horng, et. al, 2010).
However, distinguishing among instructional tasks makes the potential benefits of
principals’ instructional time more evident. Some specific instructional categories are associated
with significant differences in school performance, at least in math. In particular, more time
spent coaching teachers predicts greater student math achievement growth and increases in math
achievement growth. For example, for an additional percent of principal time spent coaching
(i.e., coaching increased by .01), math achievement increases by about 1 percent of a standard
deviation. Time spent evaluating teachers or developing the educational program also predicts
somewhat higher school achievement growth in math, as well as increases in school achievement
growth. In contrast, time spent on classroom walkthroughs, the most common instructional
13
activity, has a directionally negative association with school achievement growth and with the
trajectory of school growth. These mixed results help to explain the lack of any significant
association between school performance and instructional time use overall.
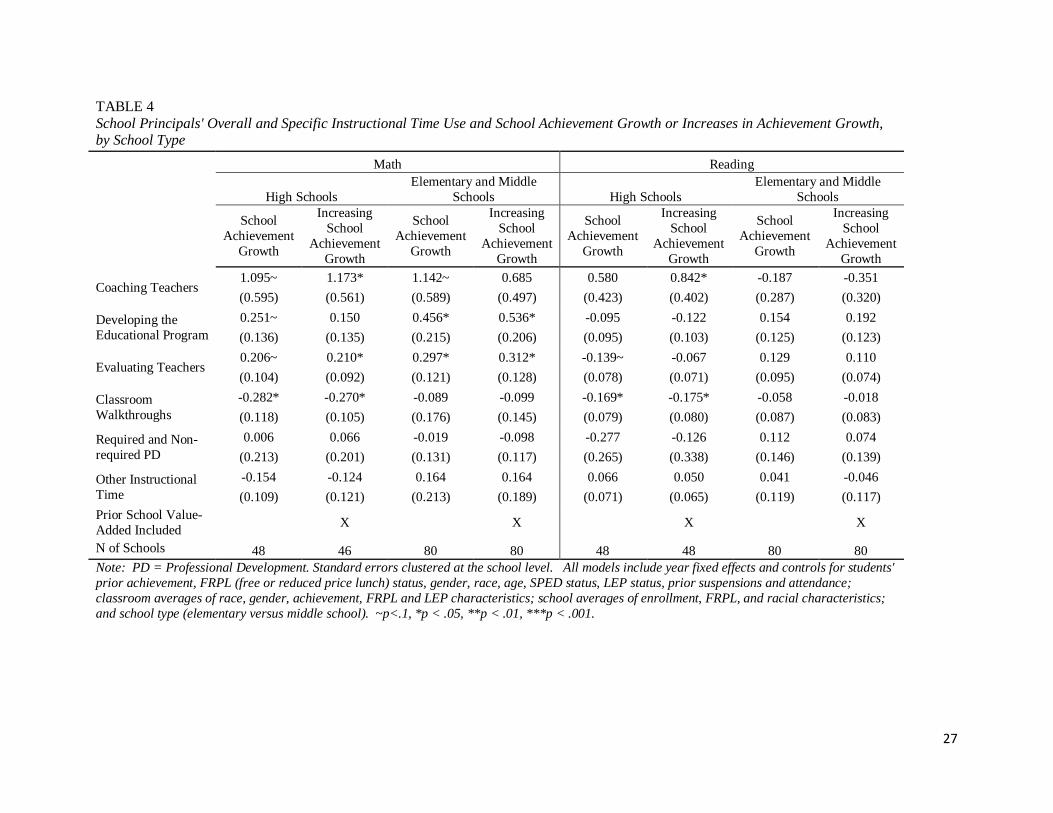
We further investigate the association between instructional time use and school
performance by examining effect sizes across school types. Table 4 details the association
between specific time categories and school achievement growth in high schools and
elementary/middle schools separately. Directionally, we see that classroom walkthroughs are
associated with the most negative performance outcomes in high schools. The significant
negative association here may be due to the diversity of subjects taught in high schools and the
resulting lack of alignment between principals’ areas of instructional expertise and instructional
practices in the classrooms they observe. The associations between school math performance
measures and teacher coaching and evaluating teachers are similar in magnitude across school
types, while time spent developing the school’s educational program shows directionally larger
effects in elementary and middle schools..
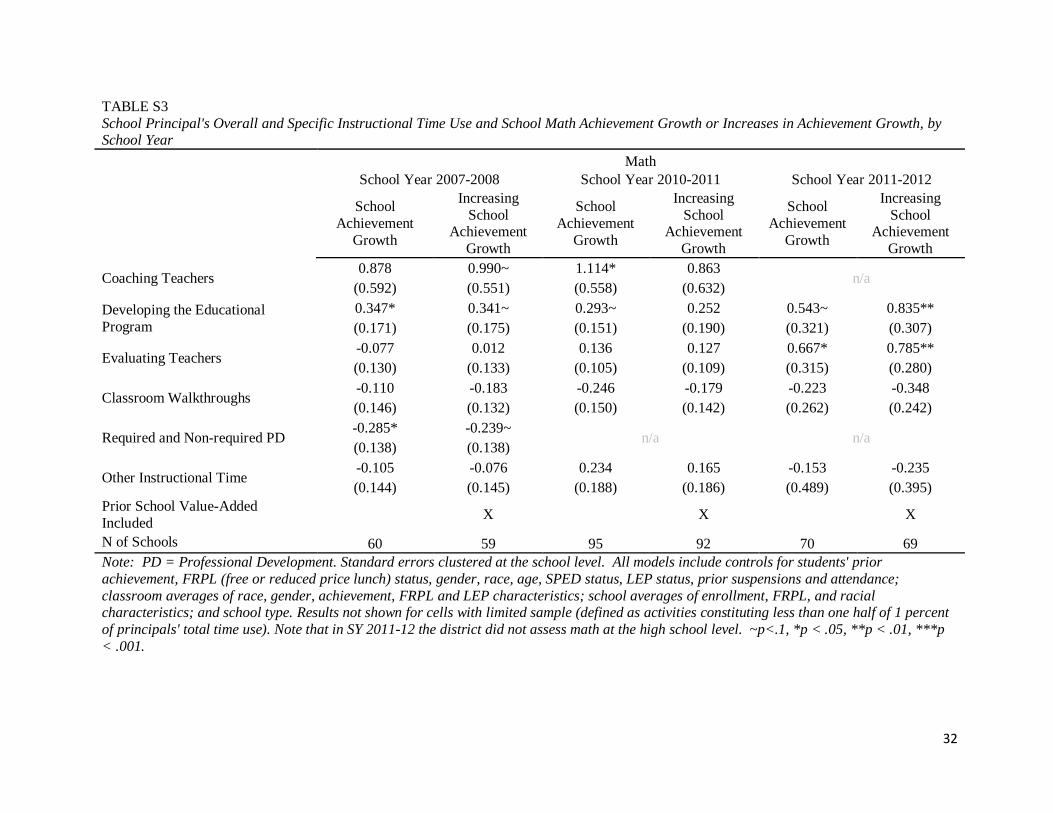
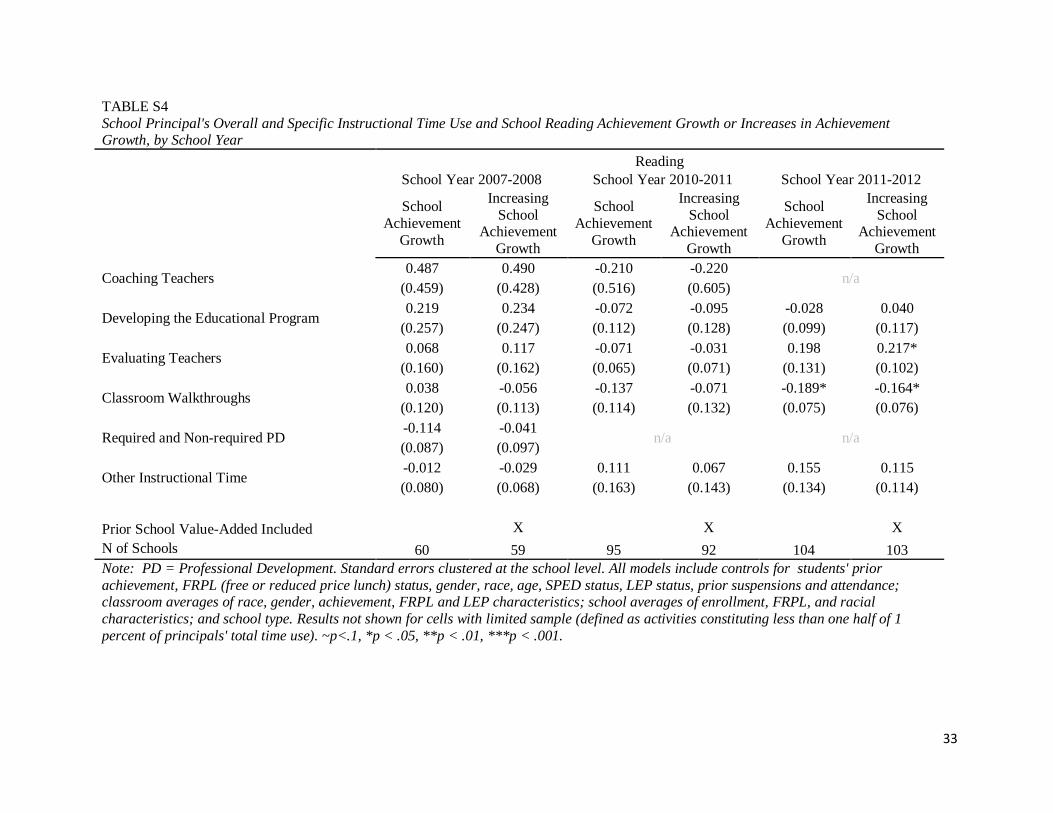
Finally, we examine the extent to which the observed associations between instructional
activities and school performance were consistent across school years, and include these results
in Tables S3 (math) and S4 (reading) in the supplemental appendix. Differences across years are
important to investigate in light of policy changes occurring over the years of our study,
including Florida’s successful Race to the Top proposal and its 2011 passage of the Student
Success Act, which spurred changes to the teacher evaluation system in M-DCPS. We find that
the positive associations between coaching and developing the educational program and school
math performance are fairly consistent, as are the negative association between classroom
walkthroughs and school performance. For example, a one percent increase in classroom
14
walkthrough time use is associated with a 0.11 percent of a standard deviation decrease in
student math achievement gains in 2007-08, a 0.25 percent decrease in 2010-11, and a 0.22
percent of a standard deviation decrease in student math achievement gains in 2011-12. In
contrast, associations between formal teacher evaluations and student achievement gains
strengthened over the period of the study, with more positive effect sizes in each subsequent year
of the study, particularly 2011-12.
Investigating Walkthroughs and Coaching
The most consistent findings in the above analyses are that while overall time on
instruction is not associated with student achievement gains or school improvement, both
classroom walkthroughs and time coaching teachers are. Surprisingly, time on classroom
walkthroughs in negatively associated with these school outcomes. In this section, we bring
additional data to bear on understanding these effects.
Classroom Walkthroughs
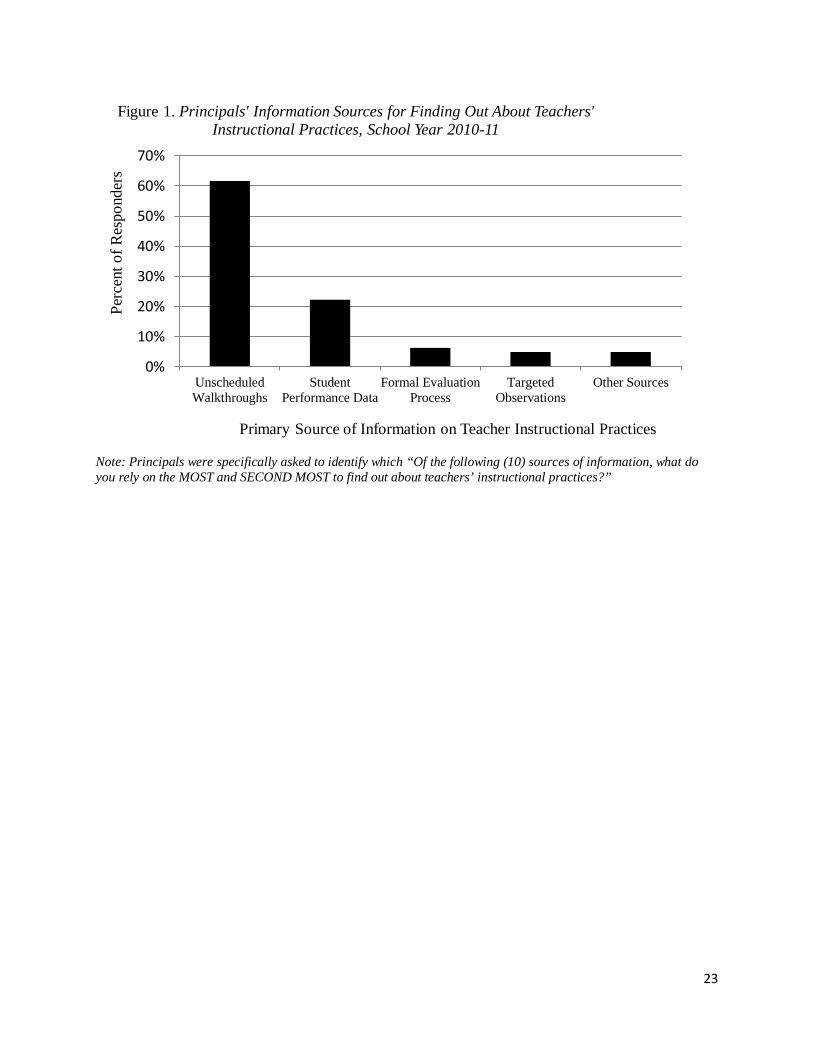
Classroom walkthroughs may serve multiple purposes. As an example, we asked
principals in the 2011 survey where they learned about the instructional practices of their
teachers. Sixty-two percent of principals identify unscheduled classroom walkthroughs as their
primary source of information (see Figure 1). However, some principals likely make better use of
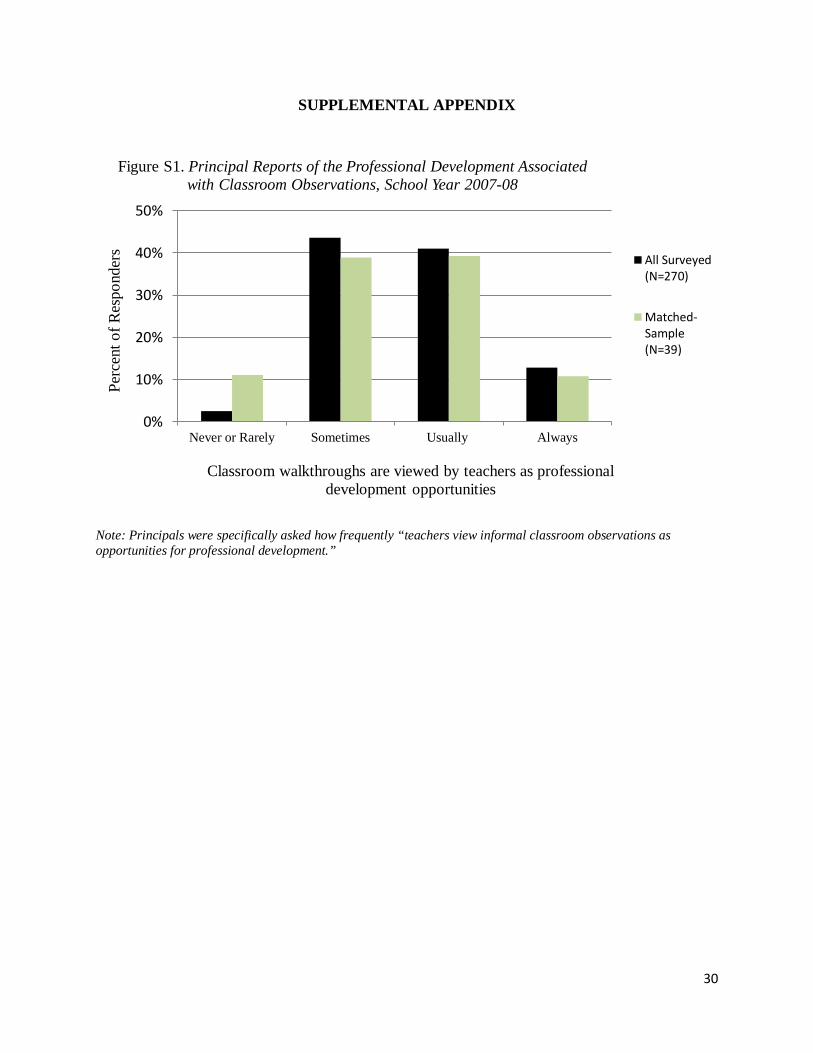
their time spent in classroom walkthroughs than other principals do. For instance, in 2008 we
asked principals whether their teachers see classroom walkthroughs as an opportunity for
professional development. Approximately the same number answered never, rarely, or
sometimes as answered usually or always (shown in Figure S2 in the supplemental appendix),
15
suggesting substantial variation in the degree to which walkthroughs are considered part of an
overall teacher improvement strategy.
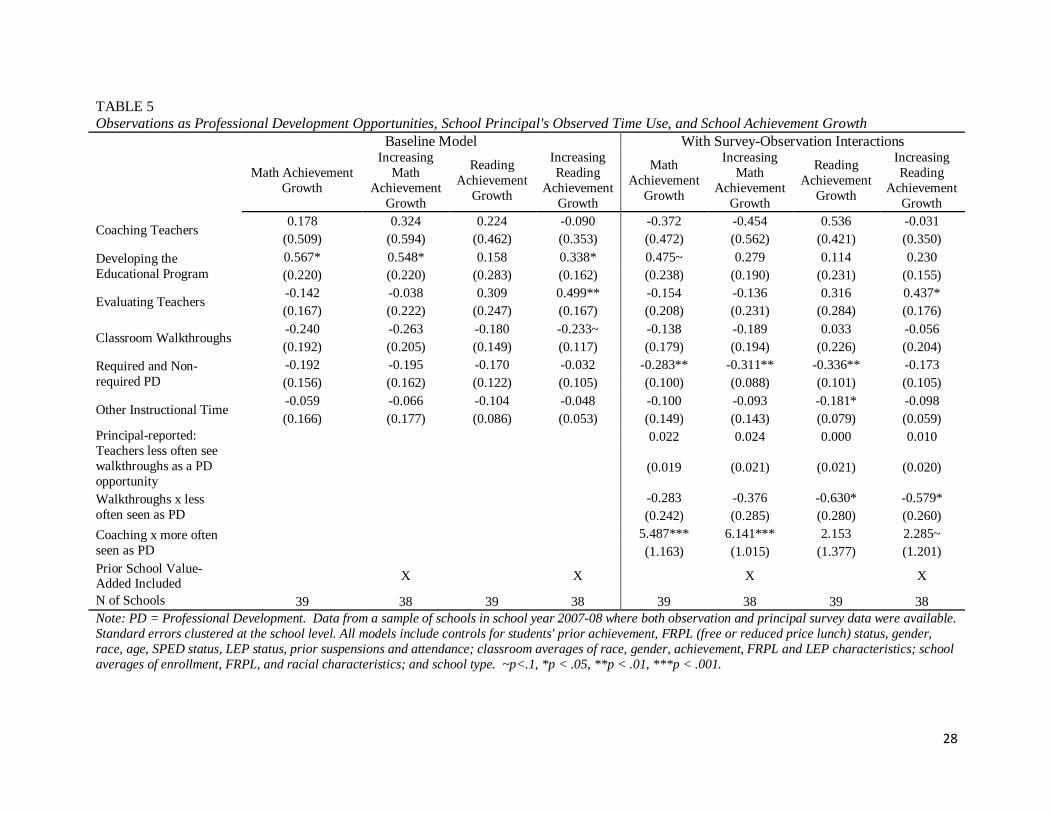
We make use of these principal reports about their classroom observations in our final
multivariate analysis. These data are available for the 39 schools in school year 2007-08 whose
principals were both observed and who completed the survey. We examine, in Table 5, the
interaction between observed principal classroom walkthroughs and principals’ self-reports that
their observations are not seen by teachers as opportunities for professional development. While
the sample size is small and not all of the estimates are significant, the general trend is evident:
time on classroom observations is more negatively associated with student achievement gains
when not used for professional development.
Coaching
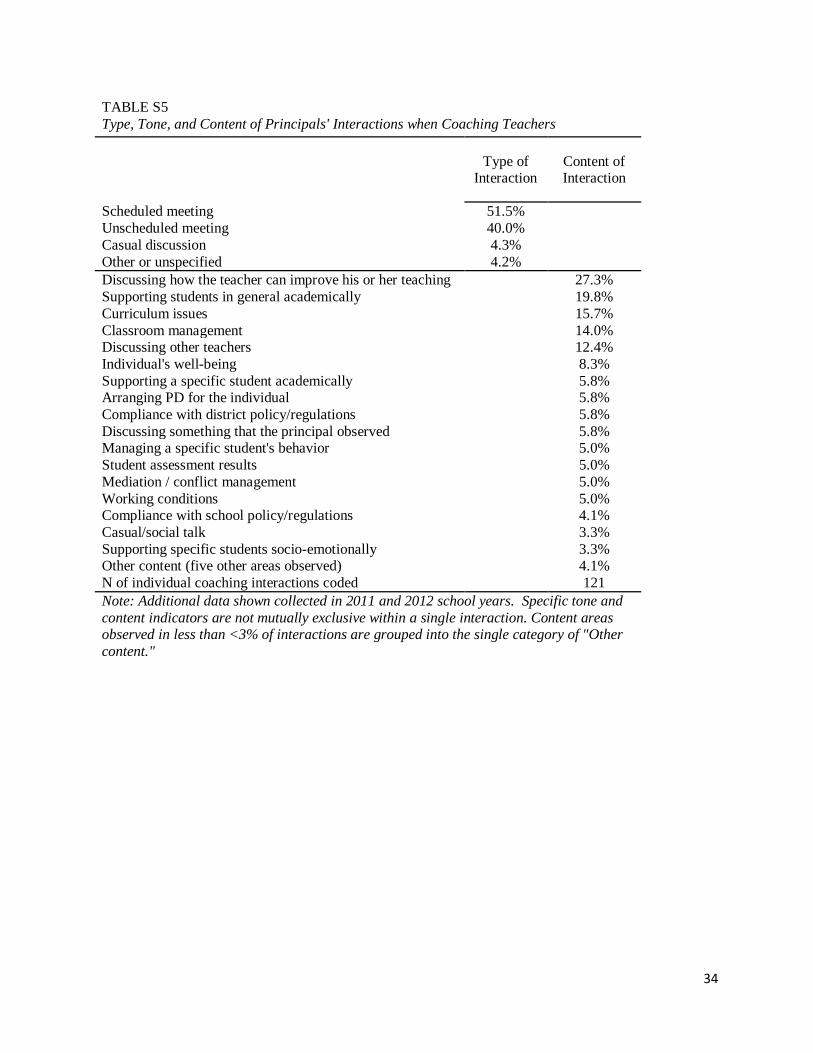
While we have less information on coaching from the surveys, we also investigate
additional detailed information about principal time use in this area using the supplemental
observational data. These data, which recorded the content of coaching interactions, are detailed
in supplemental Table S5. The most frequent topic of discussion related to how the teacher could
improve his or her teaching (27.3 percent). Other common content areas include how to support
students academically (19.8 percent), discussion of curriculum areas (15.7 percent), and
classroom management (14.0 percent). In total, close to half (46.6 percent) of coaching
interactions involved at least one of these four areas. The more positive effect of coaching
relative to professional development could be due to a greater focus on instructional content in
many of these interactions.
16
In keeping with the analysis of classroom observations above, we use the survey to ask
whether coaching is more effective when the principals do use walkthroughs for the purpose of
professional development. The idea behind this approach is that our measure of time use is
inherently noisy because we are observing principals on a single day each year and categorize
their observed behaviors based on imperfect information. By combining these measures we may
be better able to identify principals who work with teachers on instruction. Table 5 shows these
results as well. We see that coaching is particularly effective when principals also report that
teachers view their walkthroughs as opportunities for professional development.7
Interviews about Classroom Walkthroughs
Finally, we conducted interviews with principals following observations in 2011 that
included questions about their approach to instructional leadership. Though not specifically
prompted to discuss walkthroughs, 39 brought them up as part of their instructional leadership
strategies, and among those, 33 mentioned a rationale for using walkthroughs that we could code
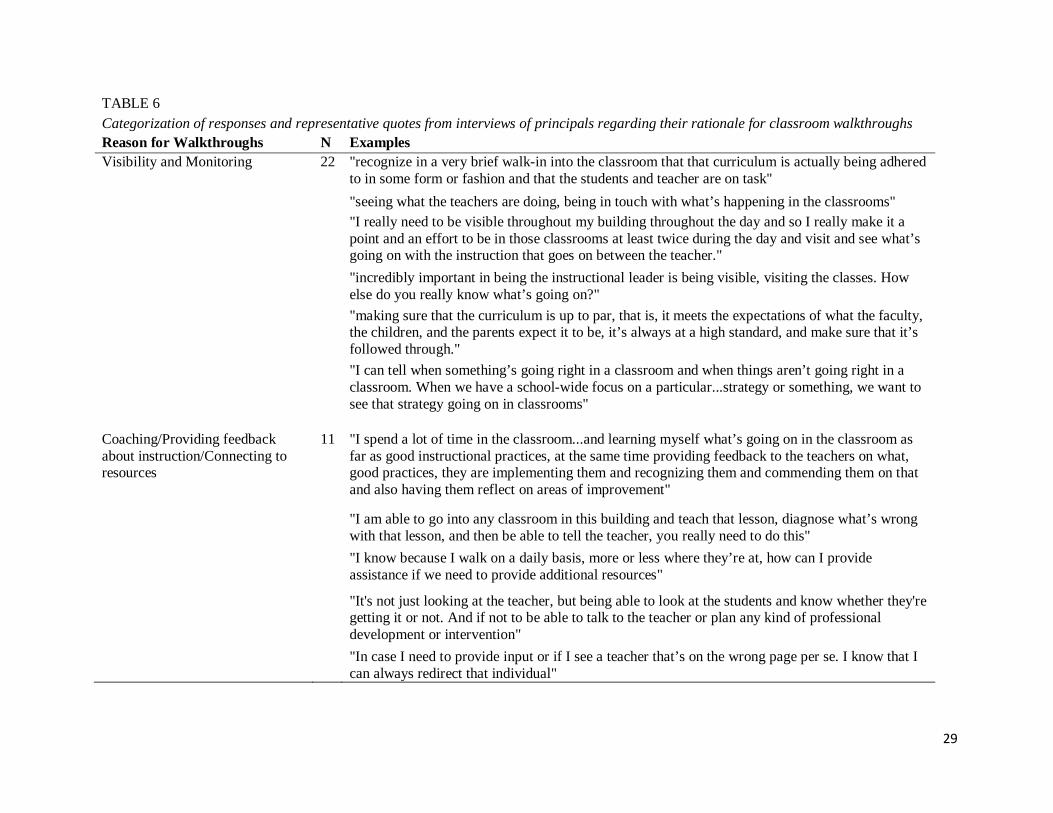
from their responses. Table 6 shows a representative sample of their responses. The most
common reasons given for conducting walkthroughs reflect a focus on monitoring teacher
practices in order to gather information and be more visible to staff. For example, one principal
described walkthroughs as a way to “recognize in a very brief walk-in into the classroom that
that curriculum is actually being adhered to in some form or fashion and that the students and
teacher are on task.” Another principal described the rationale in the following way: “I really
need to be visible throughout my building throughout the day and so I really make it a point and
7 While we present the model with the interactions with both coaching and walkthroughs, the results are similar when the interactions are entered in separate models.
17
an effort to be in those classrooms at least twice during the day and visit and see what’s going on
with the instruction.”
In contrast, a smaller subset of the principals we interviewed cited the opportunity to
provide coaching or other support to teachers as a rationale for walkthroughs. For example, one
principal described the purpose of walkthroughs as “in case I need to provide input or if I see a
teacher that’s on the wrong page per se. I know that I can always redirect that individual.”
Another described their approach as “I am able to go into any classroom in this building and
teach that lesson, diagnose what’s wrong with that lesson, and then be able to tell the teacher,
you really need to do this.”
Overall, the differences in principals’ reported rationales for conducting walkthroughs
provides some suggestive evidence for why we find that walkthroughs are negatively associated
with outcomes in some schools more than others. While most principals appear to conduct
walkthroughs primarily for reasons of information gathering and visibility, others view
walkthroughs as an opportunity to provide instructional support to staff. These differences may
reflect not only a diversity of opinions about leadership priorities, but also differences in
principals’ capacity to engage with teachers to improve their instructional execution.
Discussion and Conclusions
Given the significant time constraints under which principals operate, critical
examination of the how they can best use their time to promote school success is essential. Our
goal in this study has been to assess the relationship between principals’ time spent on
instructional tasks and school effectiveness as measured by student achievement gains and
improvement over time in schools’ student achievement gains. We do so by bringing to bear a
18
new source of evidence on principal practice: detailed in-person observations. We find no
relationship between overall time spent on instructional activities and schools’ effectiveness or
improvement trajectories. When we decompose instruction into its element tasks, however, a
more nuanced story emerges that has potentially important implications for school leadership
practice.
Like time on the school’s educational program and teacher evaluation, time spent directly
coaching teachers is positively associated with achievement gains and school improvement,
especially in math. Yet coaching appears to be a rare practice among observed principals, which
may reflect principals discounting the effectiveness of coaching or their own capacity to coach
effectively.8 In contrast, informal classroom observations or “walkthroughs” are more common
but negatively associated with achievement gains and school improvement, at least in high
schools. For a subset of schools we also had survey data indicating whether the walkthroughs
were viewed by teachers as professional development. In schools where walkthroughs are not
viewed as professional development, walkthroughs are particularly negative; while in schools
where they are viewed as professional development, coaching is particularly positive. In other
words, different use of walkthroughs seems to be associated with different results. In short, our
results suggest that time spent engaging in instruction is not itself sufficient but rather that the
effects of instructional leadership activities are conditional on the type and quality of those time
investments.
While we find a negative association between time spent on walkthroughs and outcomes,
these results do not imply that walkthroughs cannot be useful. Our survey results provide
evidence that walkthroughs are principals’ primary source of information about teachers’ 8 As Neumerski (2013) argues, principal coaching is a particularly understudied component of instructional leadership research, and we understand little about the connections between coaching and teacher practice or student learning.
19
instructional practices. However, if they do not use these walkthroughs to support professional
development or other human resource practices, the information they gather may be less
beneficial. This intuition is supported both by our findings and by prior research indicating that
walkthroughs that do not feature some component of feedback to teachers may be less effective
(Blase & Blase, 1999; Downey et al., 2004). Moreover, walkthroughs are a substantial part
(almost half) of all the time principals spend on instruction. Schools may be better served if
principals spend more time using the information for school improvement than collecting it.
Additional research into how effective principals conduct walkthroughs, target them to different
kinds of teachers, and integrate them into an overall school improvement program would be
useful for furthering our understanding of this key tool in the instructional leadership toolkit.
Still, these results are exploratory and do not directly assess the effects of principal’s
instructional leadership activities. There are a number of reasons that they might misrepresent the
true causal effect of time allocation. First, the time use and survey measures that we use may
indicate that the allocation of principal instructional time use matters, but it is also possible that
these measures are proxies for the skills and behaviors that different principals bring to the table
when trying to support teachers instructionally. It may be these differences in skills and not the
time use that actually causes the school outcomes we observe. A related “omitted variables”
concern is that we may not have appropriately taken into account important school contextual
variables that influence leadership behaviors and student learning. Additionally, our measures of
principal behaviors are single-day snapshots of principal activities that may not be representative
of practice on other days, given both variation principals’ day-to-day leadership activities
(Camburn, Spillane, & Sebastian, 2010) and the possibility that—despite our instructions that
they not do so—principals substantially altered their behaviors as a result of the observation.
20
Lastly, we cannot rule out reverse causation: better-performing schools may allow principals the
time to work with teachers, while in less effective schools they are more constrained to spend
more time observing classrooms. Given these limitations, we interpret our results not as isolating
causal effects but as providing justification for further analysis that focuses on how principals
use their time within these instructional areas and connects time use—in context—to
instructional and achievement outcomes.
21
References
Blank, R. K. (1987). The role of principal as leader: Analysis of variation in leadership of urban high schools. The Journal of Educational Research, 81(2), 69–80.
Blase, J., & Blase, J. (1999). Principals’ instructional leadership and teacher development: Teachers’ perspectives. Educational Administration Quarterly, 35(3), 349–378.
Bossert, S. T., Dwyer, D. C., Rowan, B., & Lee, G. V., (1982). The instructional management role of the principal. Educational Administration Quarterly, 18(3), 34-64.
Branch, G. F., Hanushek, E. A., & Rivkin, S. G. (2012). Estimating the effect of leaders on
public sector productivity: The case of school principals (Working Paper No. 17803). National Bureau of Economic Research.
Brewer, D. J. (1993). Principals and student outcomes: Evidence from U.S. high schools. Economics of Education Review, 12(4), 281–92.
Camburn, E. M., Spillane, J. P., & Sebastian, J. (2010). Assessing the utility of a daily log for measuring principal leadership practice. Educational Administration Quarterly, 46(5), 707–737.
Coelli, M., & Green, D. A. (2012). Leadership effects: school principals and student outcomes. Economics of Education Review, 31(1), 92–109.
David, J. L. (2007). Classroom walk-throughs. Educational Leadership, 65(4), 81.
Donaldson, M. L. (2009). So long, Lake Wobegon? Using teacher evaluation to raise teacher quality. Washington, DC: Center for American Progress.
Downey, C., Steffy, B., English, F., Frase, L., & Poston, W. (2004). The three-minute classroom walk-through. Thousand Oaks, CA: Corwin Press.
Ebmeier, H. (2003). How supervision influences teacher efficacy and commitment: An investigation of a path model. Journal of Curriculum & Supervision, 18(2), 110–141.
Eisner, E. W. (2002). The kind of schools we need. Phi Delta Kappan, 83(8), 576-594.
Florida Department of Education (2007). FCAT Reading and Mathematics Technical Report For 2006 FCAT Test Administrations. Retrieved from http://fcat.fldoe.org/pdf/fc06tech.pdf.
Grissom, J.A., & Loeb, S. (2011). Triangulating principal effectiveness: How perspectives of parents, teachers, and assistant principals identify the central importance of managerial skills. American Educational Research Journal, 48 (5), 1091-1123.
Grissom, J. A., Kalogrides, D., & Loeb, S. (2012). Using student test scores to measure principal performance (Working Paper No. 18568). National Bureau of Economic Research.
22
Hallinger, P. (2005). Instructional leadership and the school principal: A passing fancy that refuses to fade away. Leadership and Policy in Schools, 4(3), 221-239.
Hallinger, P., Bickman, L., & Davis, K. (1996). School context, principal leadership, and student reading achievement. The Elementary School Journal, 96(5), 527–549.
Hallinger, P., & Heck, R. H. (1998). Exploring the principal’s contribution to school effectiveness: 1980-1995. School Effectiveness & School Improvement, 9(2), 157.
Hallinger, P., & Murphy, J. (1985). Assessing the instructional management behavior of principals. The Elementary School Journal, 86(2), 217–247.
Heck, R. H. (1992). Principals’ instructional leadership and school performance: Implications for policy development. Educational Evaluation and Policy Analysis, 14(1), 21–34.
Heck, R. H., & Marcoulides, G. A. (1996). The assessment of principal performance: A multilevel evaluation approach. Journal of Personnel Evaluation in Education, 10(1), 11–28.
Horng, E., & Loeb, S. (2010). New Thinking About Instructional Leadership. Phi Delta Kappan, 92(3), 66–69.
Horng, E., Klasik, D. & Loeb, S. (2010). Principal’s time use and school effectiveness. American Journal of Education, 116(4), 491-523.
May, H., Huff, J., & Goldring, E. (2012). A longitudinal study of principals' activities and student performance. School Effectiveness and School Improvement, 23(4), 417-439.
Murphy, J. (1988). Methodological, measurement, and conceptual problems in the study of instructional leadership. Educational Evaluation and Policy Analysis, 10(2), 117-139.
Neumerski, C. M. (2013). Rethinking instructional leadership, a review: What do we know about principal, teacher, and coach instructional leadership, and where should we go from here? Educational Administration Quarterly, 49(2), 310–347.
Protheroe, N. (2009). Using classroom walkthroughs to improve instruction. Principal, 88(4), 30-34.
Robinson, V. M. J., Lloyd, C. A., & Rowe, K. J. (2008). The impact of leadership on school outcomes: An analysis of the differential effects of leadership types. Educational Administration Quarterly, 44(5), 635-674.
Supovitz, J., Sirinides, P., & May, H. (2010). How principals and peers influence teaching and learning. Educational Administration Quarterly, 46(1), 31–56.
Youngs, P., & King, M. B. (2002). Principal leadership for professional development to build school capacity. Educational Administration Quarterly, 38(5), 643–670.
23
Note: Principals were specifically asked to identify which “Of the following (10) sources of information, what do you rely on the MOST and SECOND MOST to find out about teachers’ instructional practices?”
0%
10%
20%
30%
40%
50%
60%
70%
UnscheduledWalkthroughs
StudentPerformance Data
Formal EvaluationProcess
TargetedObservations
Other Sources
Perc
ent o
f Res
pond
ers
Primary Source of Information on Teacher Instructional Practices
Figure 1. Principals' Information Sources for Finding Out About Teachers' Instructional Practices, School Year 2010-11
24
TABLE 1
Observed Percentage of Principal Instructional Time Use, Overall and in Specific Categories, by School Type and School Year
2008 2011 2012
All schools, all years
High School
Middle School
Elem. School
High School
Middle School
Elem. School
High School
Middle School
Elem. School
Total Instructional Time Use 12.7 11.7 17.0 16.4 10.0 13.7 14.1 10.1 12.0 16.5 (10.5) (10.6) (8.7) (13.9) (9.9) (9.4) (9.0) (10.0) (10.8) (11.8)
Coaching Teachers 0.5 0.8 0.8 0.7 0.2 0.7 0.8 0.1 0.5 0.0 (1.2) (1.4) (1.2) (1.3) (0.7) (2.0) (1.8) (0.5) (1.3) (0.3)
Developing the Educational Program
2.1 0.9 2.6 1.7 2.2 1.0 1.7 2.5 2.1 4.1 (4.6) (2.1) (4.8) (3.7) (3.8) (1.9) (2.6) (6.5) (4.2) (7.5)
Evaluating Teachers 1.8 1.0 1.2 2.7 1.7 2.5 2.2 0.9 2.1 2.2 (4.5) (2.9) (2.7) (6.6) (4.7) (5.8) (5.4) (3.0) (5.1) (4.9)
Classroom Walkthroughs 5.4 5.2 5.9 6.3 4.0 6.7 6.6 4.1 4.8 7.0 (6.4) (8.4) (4.4) (7.9) (5.5) (5.3) (6.1) (6.1) (4.8) (7.2)
Required or Non-required Teacher PD
0.6 0.9 3.7 2.0 0.1 0.2 0.7 0.1 0.3 0.3 (1.9) (2.2) (6.4) (2.2) (0.3) (0.9) (1.8) (0.5) (1.0) (0.7)
Other Instructional Time Use
2.4 2.9 2.8 2.9 1.9 2.5 2.1 2.3 2.1 3.0 (3.8) (4.5) (5.6) (4.0) (3.6) (3.1) (2.4) (4.5) (3.6) (3.6)
N of Schools 127 37 11 12 43 28 28 44 32 29 Note: PD = Professional Development. Standard deviations given in parentheses.
25
TABLE 2
Descriptive School Characteristics and Correlations Between Characteristics and Principals' Instructional Time Use, Overall and in
Several Specific Categories
Sample Statistics Spearman Correlations
Mean Std. Dev. Total
Instructional Time Use
Coaching Teachers
Developing the
Educational Program
Evaluating Teachers
Classroom Walkthroughs
Required or Non-required Teacher PD
School Characteristics School Enrollment 716 [447] -0.273** 0.115 -0.145 0.071 -0.258** -0.038
% FRPL 69.7 [21.8] 0.270** -0.107 0.204* 0.121 0.213* 0.141 % Black 33.8 [33.7] 0.173~ 0.047 -0.008 0.093 0.120 0.153~ % Hispanic 54.8 [30.4] -0.148~ -0.084 0.076 -0.101 -0.098 -0.110 % High School 37.1 [48.4] -0.256** 0.008 0.003 -0.044 -0.235** -0.074 % Middle School 28.2 [45.1] 0.017 -0.005 -0.093 0.060 0.064 -0.025 % Elem. School 34.6 [47.8] 0.237** -0.007 0.078 -0.016 0.178* 0.095 Prior math achievement -0.029 [0.420] -0.225* 0.041 -0.183* -0.185* -0.131 -0.218* Prior reading achievement -0.030 [0.439] -0.214* 0.043 -0.198* -0.166~ -0.144 -0.211* N of Schools 127
Note: PD = Professional Development. Prior achievement measures are standardized. ~p<.1, *p < .05, **p < .01, ***p < .001.
26
TABLE 3
School Principal's Overall and Specific Instructional Time Use and School Achievement Growth or Increases in Achievement Growth
Math Achievement Growth
Increasing Math
Achievement Growth
Reading Achievement
Growth
Increasing Reading
Achievement Growth
Overall Instructional Time Use 0.086 0.100 -0.021 -0.010 (0.064) (0.064) (0.033) (0.033)
Coaching Teachers 1.131* 0.976* 0.040 0.013 (0.435) (0.379) (0.238) (0.277)
Developing the Educational Program 0.329* 0.349* -0.005 0.002 (0.151) (0.158) (0.082) (0.087)
Evaluating Teachers 0.223* 0.264** 0.020 0.043 (0.093) (0.098) (0.055) (0.048)
Classroom Walkthroughs -0.153 -0.122 -0.092 -0.066 (0.128) (0.111) (0.063) (0.068)
Required and Non-required PD -0.045 -0.058 0.016 0.036 (0.120) (0.126) (0.110) (0.120)
Other Instructional Time -0.037 -0.028 0.030 0.007 (0.133) (0.119) (0.066) (0.063)
Prior School Value-Added Included X X N of Schools 127 125 127 127 Note: PD = Professional Development. Standard errors clustered at the school level. All models include year fixed effects and controls for students' prior achievement, FRPL (free or reduced price lunch) status, gender, race, age, SPED status, LEP status, prior suspensions and attendance; classroom averages of race, gender, achievement, FRPL and LEP characteristics; school averages of enrollment, FRPL, and racial characteristics; and school type. ~p<.1, *p < .05, **p < .01, ***p < .001.
27
TABLE 4 School Principals' Overall and Specific Instructional Time Use and School Achievement Growth or Increases in Achievement Growth,
by School Type
Math Reading
High Schools
Elementary and Middle Schools High Schools
Elementary and Middle Schools
School Achievement
Growth
Increasing School
Achievement Growth
School Achievement
Growth
Increasing School
Achievement Growth
School Achievement
Growth
Increasing School
Achievement Growth
School Achievement
Growth
Increasing School
Achievement Growth
Coaching Teachers 1.095~ 1.173* 1.142~ 0.685 0.580 0.842* -0.187 -0.351 (0.595) (0.561) (0.589) (0.497) (0.423) (0.402) (0.287) (0.320)
Developing the Educational Program
0.251~ 0.150 0.456* 0.536* -0.095 -0.122 0.154 0.192 (0.136) (0.135) (0.215) (0.206) (0.095) (0.103) (0.125) (0.123)
Evaluating Teachers 0.206~ 0.210* 0.297* 0.312* -0.139~ -0.067 0.129 0.110 (0.104) (0.092) (0.121) (0.128) (0.078) (0.071) (0.095) (0.074)
Classroom Walkthroughs
-0.282* -0.270* -0.089 -0.099 -0.169* -0.175* -0.058 -0.018 (0.118) (0.105) (0.176) (0.145) (0.079) (0.080) (0.087) (0.083)
Required and Non-required PD
0.006 0.066 -0.019 -0.098 -0.277 -0.126 0.112 0.074 (0.213) (0.201) (0.131) (0.117) (0.265) (0.338) (0.146) (0.139)
Other Instructional Time
-0.154 -0.124 0.164 0.164 0.066 0.050 0.041 -0.046 (0.109) (0.121) (0.213) (0.189) (0.071) (0.065) (0.119) (0.117)
Prior School Value-Added Included X X X X
N of Schools 48 46 80 80 48 48 80 80 Note: PD = Professional Development. Standard errors clustered at the school level. All models include year fixed effects and controls for students' prior achievement, FRPL (free or reduced price lunch) status, gender, race, age, SPED status, LEP status, prior suspensions and attendance; classroom averages of race, gender, achievement, FRPL and LEP characteristics; school averages of enrollment, FRPL, and racial characteristics; and school type (elementary versus middle school). ~p<.1, *p < .05, **p < .01, ***p < .001.
28
TABLE 5 Observations as Professional Development Opportunities, School Principal's Observed Time Use, and School Achievement Growth
Baseline Model With Survey-Observation Interactions
Math Achievement Growth
Increasing Math
Achievement Growth
Reading Achievement
Growth
Increasing Reading
Achievement Growth
Math Achievement
Growth
Increasing Math
Achievement Growth
Reading Achievement
Growth
Increasing Reading
Achievement Growth
Coaching Teachers 0.178 0.324 0.224 -0.090 -0.372 -0.454 0.536 -0.031
(0.509) (0.594) (0.462) (0.353) (0.472) (0.562) (0.421) (0.350) Developing the Educational Program
0.567* 0.548* 0.158 0.338* 0.475~ 0.279 0.114 0.230 (0.220) (0.220) (0.283) (0.162) (0.238) (0.190) (0.231) (0.155)
Evaluating Teachers -0.142 -0.038 0.309 0.499** -0.154 -0.136 0.316 0.437* (0.167) (0.222) (0.247) (0.167) (0.208) (0.231) (0.284) (0.176)
Classroom Walkthroughs -0.240 -0.263 -0.180 -0.233~ -0.138 -0.189 0.033 -0.056 (0.192) (0.205) (0.149) (0.117) (0.179) (0.194) (0.226) (0.204)
Required and Non-required PD
-0.192 -0.195 -0.170 -0.032 -0.283** -0.311** -0.336** -0.173 (0.156) (0.162) (0.122) (0.105) (0.100) (0.088) (0.101) (0.105)
Other Instructional Time -0.059 -0.066 -0.104 -0.048 -0.100 -0.093 -0.181* -0.098 (0.166) (0.177) (0.086) (0.053) (0.149) (0.143) (0.079) (0.059)
Principal-reported: Teachers less often see walkthroughs as a PD opportunity
0.022 0.024 0.000 0.010
(0.019 (0.021) (0.021) (0.020)
Walkthroughs x less often seen as PD
-0.283 -0.376 -0.630* -0.579*
(0.242) (0.285) (0.280) (0.260) Coaching x more often seen as PD
5.487*** 6.141*** 2.153 2.285~
(1.163) (1.015) (1.377) (1.201) Prior School Value-Added Included X X X X
N of Schools 39 38 39 38 39 38 39 38 Note: PD = Professional Development. Data from a sample of schools in school year 2007-08 where both observation and principal survey data were available. Standard errors clustered at the school level. All models include controls for students' prior achievement, FRPL (free or reduced price lunch) status, gender, race, age, SPED status, LEP status, prior suspensions and attendance; classroom averages of race, gender, achievement, FRPL and LEP characteristics; school averages of enrollment, FRPL, and racial characteristics; and school type. ~p<.1, *p < .05, **p < .01, ***p < .001.
29
TABLE 6 Categorization of responses and representative quotes from interviews of principals regarding their rationale for classroom walkthroughs Reason for Walkthroughs N Examples Visibility and Monitoring 22 "recognize in a very brief walk-in into the classroom that that curriculum is actually being adhered
to in some form or fashion and that the students and teacher are on task" "seeing what the teachers are doing, being in touch with what’s happening in the classrooms" "I really need to be visible throughout my building throughout the day and so I really make it a
point and an effort to be in those classrooms at least twice during the day and visit and see what’s going on with the instruction that goes on between the teacher."
"incredibly important in being the instructional leader is being visible, visiting the classes. How else do you really know what’s going on?"
"making sure that the curriculum is up to par, that is, it meets the expectations of what the faculty, the children, and the parents expect it to be, it’s always at a high standard, and make sure that it’s followed through."
"I can tell when something’s going right in a classroom and when things aren’t going right in a classroom. When we have a school-wide focus on a particular...strategy or something, we want to see that strategy going on in classrooms"
Coaching/Providing feedback about instruction/Connecting to resources
11 "I spend a lot of time in the classroom...and learning myself what’s going on in the classroom as far as good instructional practices, at the same time providing feedback to the teachers on what, good practices, they are implementing them and recognizing them and commending them on that and also having them reflect on areas of improvement"
"I am able to go into any classroom in this building and teach that lesson, diagnose what’s wrong with that lesson, and then be able to tell the teacher, you really need to do this"
"I know because I walk on a daily basis, more or less where they’re at, how can I provide assistance if we need to provide additional resources"
"It's not just looking at the teacher, but being able to look at the students and know whether they're getting it or not. And if not to be able to talk to the teacher or plan any kind of professional development or intervention"
"In case I need to provide input or if I see a teacher that’s on the wrong page per se. I know that I can always redirect that individual"
30
SUPPLEMENTAL APPENDIX
Note: Principals were specifically asked how frequently “teachers view informal classroom observations as opportunities for professional development.”
0%
10%
20%
30%
40%
50%
Never or Rarely Sometimes Usually Always
Perc
ent o
f Res
pond
ers
Classroom walkthroughs are viewed by teachers as professional development opportunities
Figure S1. Principal Reports of the Professional Development Associated with Classroom Observations, School Year 2007-08
All Surveyed(N=270)
Matched-Sample(N=39)
31
TABLE S1 Descriptive statistics of principals observed in the study, by year
SY 2007-08 SY 2010-11 SY 2011-12
% Female 54.2 61.9 63.2 % Race/Ethnicity: Black or Hispanic 62.7 69.1 71.7 White 35.6 28.9 24.5 Other 1.7 2.1 3.8 % Highest degree: Bachelors 20.3 11.3 11.3 Masters 47.5 69.1 64.2 Doctorate 23.7 15.5 18.9 Number of Years as Principal in M-DCPS: 0 to 1 40.7 24.7 27.4 2 to 4 44.1 42.3 41.5 5 to 9 11.9 25.8 26.4 10 or more 3.4 7.2 4.7 N 59 95 104 Note: M-DCPS began documenting "Hispanic" as ethnicity, rather than race, beginning in SY 2010-11. Demographic data unavailable for 1 principal observed in SY 2007-08.
TABLE S2
Descriptive Statistics for Student Covariates
Mean Std. Deviation
Student Characteristics % Female 49.6 (50.0) % White 9.53 (29.4) % Black 28.8 (45.3) % Hispanic 59.1 (49.2) % Other 2.6 (15.9) % FRPL 65.4 (47.6) Students' age 14.8 (2.1) % Special Education 9.1 (28.8) % Limited English Proficiency 10.8 (31.1) Number of absences in prior year 7.1 (7.19) Number of suspensions in prior year 0.6 (2.541) N of students 137,251
32
TABLE S3 School Principal's Overall and Specific Instructional Time Use and School Math Achievement Growth or Increases in Achievement Growth, by
School Year
Math
School Year 2007-2008 School Year 2010-2011 School Year 2011-2012
School Achievement
Growth
Increasing School
Achievement Growth
School Achievement
Growth
Increasing School
Achievement Growth
School Achievement
Growth
Increasing School
Achievement Growth
Coaching Teachers 0.878 0.990~ 1.114* 0.863
n/a (0.592) (0.551) (0.558) (0.632)
Developing the Educational Program
0.347* 0.341~ 0.293~ 0.252 0.543~ 0.835** (0.171) (0.175) (0.151) (0.190) (0.321) (0.307)
Evaluating Teachers -0.077 0.012 0.136 0.127 0.667* 0.785** (0.130) (0.133) (0.105) (0.109) (0.315) (0.280)
Classroom Walkthroughs -0.110 -0.183 -0.246 -0.179 -0.223 -0.348 (0.146) (0.132) (0.150) (0.142) (0.262) (0.242)
Required and Non-required PD -0.285* -0.239~
n/a n/a (0.138) (0.138)
Other Instructional Time -0.105 -0.076 0.234 0.165 -0.153 -0.235 (0.144) (0.145) (0.188) (0.186) (0.489) (0.395)
Prior School Value-Added Included X X X
N of Schools 60 59 95 92 70 69 Note: PD = Professional Development. Standard errors clustered at the school level. All models include controls for students' prior achievement, FRPL (free or reduced price lunch) status, gender, race, age, SPED status, LEP status, prior suspensions and attendance; classroom averages of race, gender, achievement, FRPL and LEP characteristics; school averages of enrollment, FRPL, and racial characteristics; and school type. Results not shown for cells with limited sample (defined as activities constituting less than one half of 1 percent of principals' total time use). Note that in SY 2011-12 the district did not assess math at the high school level. ~p<.1, *p < .05, **p < .01, ***p < .001.
33
TABLE S4 School Principal's Overall and Specific Instructional Time Use and School Reading Achievement Growth or Increases in Achievement
Growth, by School Year
Reading
School Year 2007-2008 School Year 2010-2011 School Year 2011-2012
School Achievement
Growth
Increasing School
Achievement Growth
School Achievement
Growth
Increasing School
Achievement Growth
School Achievement
Growth
Increasing School
Achievement Growth
Coaching Teachers 0.487 0.490 -0.210 -0.220
n/a (0.459) (0.428) (0.516) (0.605)
Developing the Educational Program 0.219 0.234 -0.072 -0.095 -0.028 0.040
(0.257) (0.247) (0.112) (0.128) (0.099) (0.117)
Evaluating Teachers 0.068 0.117 -0.071 -0.031 0.198 0.217*
(0.160) (0.162) (0.065) (0.071) (0.131) (0.102)
Classroom Walkthroughs 0.038 -0.056 -0.137 -0.071 -0.189* -0.164*
(0.120) (0.113) (0.114) (0.132) (0.075) (0.076)
Required and Non-required PD -0.114 -0.041
n/a n/a (0.087) (0.097)
Other Instructional Time -0.012 -0.029 0.111 0.067 0.155 0.115 (0.080) (0.068) (0.163) (0.143) (0.134) (0.114)
Prior School Value-Added Included X X X N of Schools 60 59 95 92 104 103 Note: PD = Professional Development. Standard errors clustered at the school level. All models include controls for students' prior achievement, FRPL (free or reduced price lunch) status, gender, race, age, SPED status, LEP status, prior suspensions and attendance; classroom averages of race, gender, achievement, FRPL and LEP characteristics; school averages of enrollment, FRPL, and racial characteristics; and school type. Results not shown for cells with limited sample (defined as activities constituting less than one half of 1 percent of principals' total time use). ~p<.1, *p < .05, **p < .01, ***p < .001.
34
TABLE S5 Type, Tone, and Content of Principals' Interactions when Coaching Teachers
Type of Interaction
Content of Interaction
Scheduled meeting 51.5% Unscheduled meeting 40.0% Casual discussion 4.3% Other or unspecified 4.2%
Discussing how the teacher can improve his or her teaching
27.3% Supporting students in general academically
19.8%
Curriculum issues
15.7% Classroom management
14.0%
Discussing other teachers
12.4% Individual's well-being
8.3%
Supporting a specific student academically
5.8% Arranging PD for the individual
5.8%
Compliance with district policy/regulations
5.8% Discussing something that the principal observed
5.8%
Managing a specific student's behavior
5.0% Student assessment results
5.0%
Mediation / conflict management
5.0% Working conditions
5.0%
Compliance with school policy/regulations
4.1% Casual/social talk
3.3%
Supporting specific students socio-emotionally
3.3% Other content (five other areas observed)
4.1%
N of individual coaching interactions coded 121 Note: Additional data shown collected in 2011 and 2012 school years. Specific tone and content indicators are not mutually exclusive within a single interaction. Content areas observed in less than <3% of interactions are grouped into the single category of "Other content."