effective sizing of internal - iia sizing organization.dl.pdf · effective sizing of internal audit...
TRANSCRIPT


EffEctivE Sizing of intErnal audit dEpartmEntS
By
Urton L. Anderson, PhD, CIA, CCSA, CGAP, CFSAThe University of Texas at Austin
Margaret H. Christ, PhD, CIAThe University of Georgia
Karla M. Johnstone, PhDThe University of Wisconsin–Madison
and
Larry Rittenberg, PhD, CIAThe University of Wisconsin–Madison
With Sponsorship By:IIA Norway
andSupport From:
Ernst & Young LLP
The Institute of Internal Auditors

Disclosure
Copyright © 2010 by The Institute of Internal Auditors Research Foundation (IIARF), 247 Maitland Avenue, Altamonte Springs, Florida 32701-4201. All rights reserved. No part of this publication may be reproduced, stored in a retrieval system, or transmitted in any form by any means — electronic, mechanical, photocopying, recording, or otherwise — without prior written permission of the publisher.
The IIARF publishes this document for informational and educational purposes. This document is intended to provide information, but is not a substitute for legal or accounting advice. The IIARF does not provide such advice and makes no warranty as to any legal or accounting results through its publication of this document. When legal or accounting issues arise, professional assistance should be sought and retained.
The Institute of Internal Auditors’ (IIA’s) International Professional Practices Framework (IPPF) comprises the full range of existing and developing practice guidance for the profession. The IPPF provides guidance to internal auditors globally and paves the way to world-class internal auditing.
The mission of The IIARF is to expand knowledge and understanding of internal auditing by providing relevant research and educational products to advance the profes-sion globally.
The IIA and The IIARF work in partnership with researchers from around the globe who conduct valuable studies on critical issues affecting today’s business world. Much of the content presented in their final reports is a result of IIARF-funded research and prepared as a service to The Foundation and the internal audit profession. Expressed opinions, interpretations, or points of view represent a consensus of the researchers and do not necessarily reflect or represent the official position or policies of The IIA or The IIARF.
ISBN 978-0-89413-688-709/10First Printing

iii
tablE of contEntS
acknowledgments ...........................................................................................................vii
about the authors ...........................................................................................................ix
i. introduction and Executive Summary of Key findings .............................................1
ii. the internal auditing resource problem .................................................................5
iii. a conceptual model for determining the Effective Size of an internal audit department ............................................................................................................9Critical Factor One: Characteristics of the Organization .....................................12Critical Factor Two: Characteristics of the Organization’s Governance
Structure ..........................................................................................................12Critical Factor Three: The Mission of the Internal Audit Department ................13Critical Factor Four: The Value Proposition of the Internal Audit Department. .13Critical Factor Five: Alignment with the Value Propositions. ..............................13Critical Factor Six: Characteristics of the Internal Audit Department. ................14Critical Factor Seven: Internal Audit Service Quality. ..........................................14Conceptual Result: The Size of the Internal Audit Department. .........................15
iv. data collection ....................................................................................................17
v. results .................................................................................................................19Critical Factor One: Characteristics of the Organization .....................................19Critical Factor Two: Characteristics of the Organization’s Governance
Structure .........................................................................................................24Critical Factor Three: The Mission of the Internal Audit Department ................32Critical Factor Four: The Value Proposition of the Internal Audit
Department .....................................................................................................37Critical Factor Five: Potential Misalignment with the Value Propositions ...........41Critical Factor Six: Characteristics of the Internal Audit Department .................45Critical Factor Seven: Internal Audit Service Quality ..........................................48Model Conclusion: The Size of the Internal Audit Department ..........................50

Effective Sizing of Internal Audit Departments
iv
vi. testing the conceptual model ...............................................................................55
vii. conclusion ............................................................................................................63
viii. references ............................................................................................................65
research Sponsor recognition ........................................................................................67
the iia research foundation board of trustees .............................................................68
the iia research foundation board of research and Education advisors .......................69
list of tables
Table 1: Descriptive Statistics .........................................................................................19Table 2: Composition of the Board of Directors ............................................................25Table 3: Frequency of Board Meetings ..........................................................................25Table 4: Audit Committee Characteristics ......................................................................27Table 5: Audit Committee Meeting Frequency ...............................................................28Table 6: Extent of Reliance on Noninternal Audit Functions for Risk Management .....30Table 7: Noninternal Audit Responsibility for Assurance/Compliance for Various
Activities ...........................................................................................................31Table 8: Extent Specific Internal Audit Activities are Performed by Sourced
Resources ..........................................................................................................37Table 9: Internal Audit Involvement in Risk Management Activities .............................40Table 10: Extent of Management and Internal Audit Disagreement ..............................42Table 11: Mission Alignment Example ...........................................................................44Table 12: Internal Audit Experience ...............................................................................45Table 13: Percentage of Auditors with Certifications ......................................................46Table 14: Internal Audit Staffing Philosophy ..................................................................47Table 15: Number of Internal Audit Staff ......................................................................51Table 16: Internal Audit Budget and Actual Expenses ...................................................52Table 17: Factors Significantly Influencing Internal Audit Department Size (FTE) .......56
v
Table of Contents
list of figures
Figure 1: Method for Developing Conceptual Model ......................................................9Figure 2: Conceptual Model ..........................................................................................11Figure 3: Location of Operations ...................................................................................20Figure 4: Mergers, Acquisitions, and Divestitures ..........................................................21Figure 5: Strategic Alliance Activity ..............................................................................22Figure 6: Centralization of the Internal Control System and IT Control System ...........23Figure 7: Description of IT Environment ......................................................................24Figure 8: Board of Directors’ Governance .....................................................................26Figure 9: Audit Committee Governance ........................................................................29Figure 10: Objectives in the Internal Audit Mission (Full Sample).................................34Figure 11: Objectives in the Internal Audit Mission (Public versus Private) ...................35Figure 12: Extent of Alternative Sourcing for Internal Auditing ....................................36Figure 13: Audit Resources Dedicated to Specific Activities ..........................................38Figure 14: Audit Resources Dedicated to Specific Activities (Public versus Private) .......39Figure 15: Usage of Internal Audit Tools .......................................................................49Figure 16: Assessment of Internal Audit Quality ...........................................................50Figure 17: Skills Needed by Internal Audit Departments ...............................................53


vii
acKnowlEdgmEntS
We are grateful for the financial and research support provided by The Institute of Internal Auditors Research Foundation. We also thank the various internal auditors who provided their time and expertise in participating in our preliminary roundtable discussions and responding to our surveys.


ix
about thE authorS
urton anderson, phd, cia, ccSa, cgap, cfSa, is the Clark W. Thompson, Jr., Professor in Accounting Education and chair of the Department of Accounting at the McCombs School of Business, The University of Texas at Austin. He received his PhD from The University of Minnesota in 1985. Professor Anderson’s research has addressed various issues in internal and external auditing — particularly corporate governance, compliance, enterprise risk management, and internal control. His work has been published in journals such as The Accounting Review, The Journal of Accounting Research, Auditing: A Journal of Theory and Practice, Organizational Behavior and Human Decision Processes, and many others. He has written four books and is one of the co-authors of the internal auditing textbook Internal Auditing: Assurance and Consulting Services published by The IIA. Several of his books have been translated into Spanish, Chinese, and Japanese. Professor Anderson is a certified internal auditor and active in The IIA. He has been a member and chair of The IIA’s Board of Regents and is the current chair of the Internal Auditing Standards Board. In 1997 he was named Leon R. Radde Educator of the Year by The IIA. In June 2006 The IIA recognized his outstanding contributions to the field of internal auditing by giving him the Bradford Cadmus Memorial Award. Professor Anderson serves on the Board of Directors for the Health Care Compliance Association and the Advisory Board of the Society of Corporate Compliance and Ethics. He is also active in the Auditing Section of the American Accounting Association (AAA) and currently serves as its president.
margaret h. christ, phd, cia, is an assistant professor of accounting at the J. M. Tull School of Accounting at the University of Georgia. She received her PhD from the University of Texas at Austin in 2008. She received her B.S. in accounting with a concen-tration in internal auditing from Louisiana State University in 1999. Before receiving her doctorate, Professor Christ was an internal auditor and risk consultant with Arthur Andersen and Protiviti. Her clients included a variety of firms from the banking, energy, and manufacturing industries, including several Fortune 500 companies. Professor Christ’s research focuses on control systems, risk management, and inter-organizational collaborations. Her dissertation, examining the influence of management’s intentions when implementing formal control systems, has been recognized with the Michael Barrett Doctoral Dissertation Award by The IIA and as the runner-up in the Outstanding Dissertation Competition by the Management Accounting Section of the American Accounting Association. Her recent research has been published in Internal Auditor, Strategic Finance, and by The IIA Research Foundation (IIARF). Professor Christ is a certified internal auditor and an active member of The IIA. She has served the organiza-tion as a member of its Academic Relations Committee. She is also active in the Auditing Section and Management Accounting Section of the AAA.

Effective Sizing of Internal Audit Departments
x
Karla m. Johnstone, phd, received her PhD from the University of Connecticut in 1997 and is currently an associate professor at the University of Wisconsin School of Business. Her research includes studies on corporate governance, internal controls, client acceptance, fraud, negotiation, internal auditing, audit committee decision-making, and budget-setting. Professor Johnstone serves on the editorial boards at The Accounting Review, Auditing: A Journal of Practice & Theory, The International Journal of Auditing, and Current Issues in Auditing. She is an associate editor at Accounting Horizons. She has served the AAA by co-chairing the 2007 Auditing Section Midyear Conference and the Auditing Section Innovation in Auditing Education Award Committee. She has also served as a committee member of the AAA’s Notable Contributions to the Accounting Literature Award Committee and the Auditing Section’s Audit Standards Committee and Research Committee. She serves as a board member and audit committee member at the Center for Advanced Studies in Business. Professor Johnstone teaches auditing and was awarded the 2008 School of Business Chipman Outstanding Faculty Teaching Award. She is a co-author on the auditing textbook Auditing: A Business Risk Approach.
larry E. rittenberg, phd, cia, is the Ernst & Young Professor of Accounting & Information Systems at the University of Wisconsin. On the faculty since 1976, Professor Rittenberg teaches in the area of audit and assurance, including risk management and corporate governance topics. His current research deals with the effectiveness of audit committees, corporate governance, and assurance services. Professor Rittenberg is former chairman of The Committee of Sponsoring Organizations of the Treadway Commission (COSO) and continues to serve on the Board of Directors. COSO is a voluntary private-sector organization formed in 1985 to improve the quality of financial reporting through business ethics, effective internal controls, and corporate governance. Professor Rittenberg served on The IIA’s Board of Directors as vice chairman-research, and as president of The IIARF. He is also a former member of the Executive Committee of the AAA. He has written extensively, including as co-author of Auditing: A Business Risk Approach (2009). He is also a co-author of The Outsourcing Dilemma: What Works Best for Internal Auditing and Research Opportunities in Internal Auditing published by The IIARF. He was a member of the drafting subcommittee and a committee member of the Report of the NACD Blue Ribbon Commission on Audit Committees. He is a recipient of The IIA’s Leon R. Radde Award as the Educator of the Year, and in 2005 he received The IIA’s Bradford Cadmus Memorial Award. He has been a recipient of the Outstanding Contributor Award from Internal Auditor, and has been recognized by the Wisconsin Institute of Certified Public Accountants as their Outstanding Educator. He was named one of the nation’s 100 most influential people in finance in 2005 by Treasury and Risk Management Magazine. Professor Rittenberg also serves on the Audit Committee of Woodward Governor, a publicly traded corporation.

1
i. introduction and ExEcutivE Summary
of KEy findingS
It is widely accepted that internal auditing is a key element of internal control, and regu-lators and stock exchange requirements demand the presence of internal auditing for registered companies. Yet organizations often struggle to know whether the investments they make in resource allocations for internal auditing are appropriate and effective. We often hear questions such as: How much should be invested in internal auditing? How many auditors does an organization like ours have? How does the existence of other functions within the organization that perform similar activities affect the investment in internal auditing? How do I know if I am getting value from internal auditing?
Certainly, not all internal audit departments are the same, nor do they have the same mission within their organizations. This is true even though most internal audit depart-ments strive to follow the definition of internal auditing developed by The Institute of Internal Auditors in 1999:
“Internal auditing is an independent, objective assurance and consulting activity designed to add value and improve an organization’s operations. It helps an orga-nization accomplish its objectives by bringing a systematic, disciplined approach to evaluate and improve the effectiveness of risk management, control, and gover-nance processes.”
Internal audit missions vary widely across different organizations. For example, some internal audit departments are very active in the area of risk management and even have a subset of the department that focuses on risk management. At the same time, some internal audit departments have minimal activities in the risk area. Some focus on compli-ance activities, while others focus on operational audits, IT security, or fraud prevention and detection. In other words, not all departments are the same, and they are often asked to serve different missions within an organization. Therefore, simply comparing the size of one internal audit department with another — even in the same industry and the same relative size company — can give misleading indications as to the appropriate size of an internal audit department.
Effective Sizing of Internal Audit Departments
2
This study is designed to address these issues. We start by analyzing the number of different activities that an internal audit department might perform. That analysis leads us to a conceptual model of internal audit effective sizing that articulates the key factors that may be tailored to each organization’s unique characteristics, mission, personnel, and quality profile. We subsequently test the conceptual model using data from a wide variety of orga-nizations, including whether the audit committee and management’s views and internal auditing’s views of the mission of internal auditing are closely aligned (a surrogate for management’s assessment of the value of internal auditing).
The study differs from traditional approaches to “effective sizing” that normally bench-mark the size of internal audit departments with other departments in the same industry or organizations of similar size. Rather, this study starts from a different premise: The appropriate size of the internal audit department should be based on the specific mission of the function — as determined by management and the audit committee — and should vary with the scope of internal auditing’s mission, experience of its personnel, the tech-nology it uses, the control, compliance, and operational audit emphasis, and geographic areas covered. Using the conceptual model developed in this study, it is possible for two internal audit departments in organizations of similar size and in the same industry to have significant differences in both composition and size based on their specific respective missions, tools used, experience, and scope of work.
We developed the conceptual model by considering prior published academic research concerning internal auditing, brainstorming among research team members in consulta-tion with key personnel at Ernst & Young LLP, and conducting intensive field interviews. To test the conceptual model, we surveyed 449 chief audit executives (CAEs) at an array of organizations located primarily in the United States. After removing companies in the financial industry, and those in the nonprofit and governmental sectors, we report survey results for 236 organizations.1
1 The data provided by financial institutions, nonprofits, and governmental agencies yield significantly different results than does that provided by the other publicly traded and private organizations that we include in our sample. Given our goal of developing a model to determine the “effective size” of internal audit departments, it was necessary to focus on a smaller, more similar sample of data; therefore, we removed these firms.

3
I. Introduction and Executive Summary of Key Findings
The survey results support the validity of the conceptual model that we present in the next section. Further, the study results support a tailored answer to the size of an internal audit department (in terms of the full-time equivalent number of personnel, assuming all other factors are equal).2 The general findings indicate that:
• Internal audit size (i.e., number of full-time equivalents, or “headcount”) increases:
o For public organizations (as compared to privately-held organizations).o For U.S.-based organizations (as compared to those based outside the
United States).o As the size of the organization (in assets and inventory) increases.o As the control structure of the organization becomes more decentralized.o As the number of audit committee members increases.o As audit committee oversight of the internal audit department increases.o As the frequency of private meetings between the internal audit department
and audit committee increases.o When the mission and activities of the internal audit department are aligned.o When operational auditing is explicitly included in the mission statement.o As the use of automated data extraction tools increases. o When the internal audit department meets or exceeds the expectations of
key stakeholders such as audit committees or senior management).
• Internal audit size (i.e., number of full-time equivalents or “headcount”) decreases:
o As the percentage of audit activities that are outsourced increases (as the survey responses were based on headcount, not effective factors significantly influencing internal audit department size [FTEs]).
o As the use of fraud detection tools increases (such as automated software and other fraud monitoring tools).
o When management and the CAE disagree about the importance of IT auditing (and management places less value on IT auditing than internal auditing does).
o As the percentage of certified internal auditors (CIAs) in the department increases.
2 We use the number of personnel as a primary measure of size, although we note that it is corre-lated with other measures such as budgetary resources. Additional analysis using annual internal audit budget as the dependent variable yields similar results.

Effective Sizing of Internal Audit Departments
4
o As more reliance is placed on alternative assurance mechanisms such as separate, noninternal audit groups providing contract/joint venture monitoring, compliance, and health safety of employee monitoring activities.
o As the (percentage) representation of inside directors on the audit committee increases.

5
ii. thE intErnal auditing rESourcE problEm
How much of an organization’s resources should be allocated to the internal audit func-tion? Standard 2030 of The IIA’s International Standards for the Professional Practice of Internal Auditing (Standards) states that the CAE must ensure that internal audit resources are appropriate (i.e., there is a reasonable mix of knowledge, skills, and competencies of internal audit staff), sufficient (i.e., of adequate quantity), and effectively deployed (i.e., used in a way that optimizes achievement) to achieve the approved plan or objectives for the internal audit function. Further, Standard 2010 requires that the CAE establish risk-based plans that are aligned with the organization’s overall goals. Providing effective internal audit services following the Standards is necessary, but the Standards does not set out the specific guidance needed to help CAEs in determining the size necessary to meet the standards, and where applicable, exceed corporate objectives for internal auditing.
Traditional Approaches to Determine “Effective Size” of Internal Audit Departments
Our observations and interaction with IIA leadership on international committees is that organizations routinely apply three approaches in determining the “right” size of their internal audit department: 1) a static approach that starts with the existing level of the audit function; 2) a risk analysis approach; and 3) a benchmarking approach.
The static approach starts with the size and composition of the existing internal audit department and makes incremental changes in response to changed conditions in corpo-rate risk, acquisitions, geographical coverage, control structure, or mission (e.g., more consulting-type activities) and — more recently — to challenges to downsize the organiza-tion. When used effectively, this approach carefully considers the skill sets, staff experience, objectives of internal auditing, and nature of the organization’s and internal auditing’s information technologies. However, there are two potential problems with this approach. First, there is little evidence that the existing size is appropriate as a starting point. Second, the changes — and subsequent new size — may be influenced by temporary factors such as the initial implementation of the U.S. Sarbanes-Oxley Act of 2002.

Effective Sizing of Internal Audit Departments
6
A second method involves a systematic risk analysis approach whereby the internal audit department presents various plans to the audit committee or management concerning the amount of effort/coverage that internal auditing can achieve with current resources, a fixed percentage increase, or a fixed percentage decrease. Such an approach is dependent on management and audit committee views concerning: a) the effectiveness of the risk identi-fication process by internal auditing; b) the organization’s risk appetite, risk tolerance, and residual risk; and c) the appropriate role of internal auditing in risk management.3 While there are many merits to this approach, it still suffers from potential drawbacks:
1. It may not consider the use of advanced technology or other functions that perform risk management activities (both of which could reduce the size of internal auditing).
2. It may not consider an “operational audit” mission of the department, cost-effective compliance activities, or changes in objectives that may include more consultative-type activities.
3. It may not fully incorporate information about whether the risk analysis process itself is sufficiently comprehensive or the organization has an effective and comprehensive enterprisewide risk management process.
A third approach to determining the “right” size of an internal audit department involves benchmarking, whereby an organization considers its relative size in comparison to other organizations using The IIA’s Global Audit Information Network (GAIN) database or other industry group surveys. The information is then used to begin discussions as to whether an internal audit department should be increased, or whether its mission should be expanded or contracted. One difficulty with benchmarking is that it does not address the efficiency/effectiveness of an internal audit department; it only provides comparisons with groups in similar industries (and maybe of similar size). Further, the internal audit peers used for benchmarking may have different objectives, different strategies for staffing, or may address a different profile of risks in their organization. Benchmarking often does not consider the extent to which other activities in an organization (either the existing organization or the organization against which the audit department will be benchmarked) may be similar in nature and purpose to internal auditing. Finally, benchmarking does not take into account variation in risk across industry or environment, or changes mandated by regulations. While benchmarking is often used to either claim that an audit department
3 Risk appetite, risk tolerance, and residual risk are not explicitly considered in our survey. However, they are implicitly included in measures regarding internal auditing’s mission/activity alignment and perceived quality.
7
II. The Internal Auditing Resource Problem
is efficient, or alternatively, that it requires additional resources, such comparisons can be misleading.
While there are advantages and disadvantages to each of the three approaches (and others that may be used), we propose that the profession does have a conceptual model that can be mathematically modeled to provide a potentially more useful discussion of the most effective size of an internal audit activity. Like the other approaches, we believe that this approach will be refined as more data becomes available and as internal audit activities evolve.
Previous Academic Research
A limited amount of academic research has developed rigorous statistical models to estimate the size of an internal audit department. This research, which we have used in developing our conceptual model, is valuable and has provided insight on factors that seem to affect the size of internal auditing. For example, Carcello et al. (2005) surveyed 217 U.S. public companies in 2001 and 2002 to develop such a model. Their research shows that monetary budgets for internal auditing are positively associated with the following factors (i.e., internal audit activity increases directly with increases in):
• Organization size.• Organization leverage (higher leverage leading to larger size internal audit
departments).• Certain industries (financial, service, and utilities were larger than others). • Level of inventory and operating cash flows. • Audit committee review of internal audit budgets.
Further, their work showed internal audit budgets are negatively associated with the amount of internal audit work that is outsourced (i.e., the more work that was outsourced, the less the total amount of internal audit budget).4 While their model represents a useful first step in predicting how internal audit budgets may change in relationship to various factors, they do not explicitly address the issue of “effective size” of internal auditing based on the mission or value proposition of internal auditing, management’s expecta-tions regarding internal audit service quality, specific tasks and tools that internal audit departments use, or the overall corporate governance environment.
4 Note that the total internal audit budget includes the amount spent on outsourcing as well as the amount spent on internal staff. Not all research shows this same result.

Effective Sizing of Internal Audit Departments
8
The conceptual model that we develop in this paper extends the work of Carcello et al. by a) developing a surrogate measure for the effective size of the internal audit department; b) including variables that represent post-Sarbanes-Oxley relevant tasks and risks; and c) including a much broader scope of internal audit-relevant variables. The conceptual model also builds on recent work provided by various internal audit thought leaders on factors affecting the future of the internal audit department.

9
iii. a concEptual modEl for dEtErmining thE EffEctivE SizE of an
intErnal audit dEpartmEnt
We have developed a conceptual model of internal audit size based on factors generated from the professional literature and in-depth interviews with 12 diverse internal audit departments regarding what should influence the size of an internal audit department. We used a three-step process to develop that model, as depicted in Figure 1.
Figure 1: Method of Developing Conceptual Model
Step 1: Preparatory Development
Evaluate prior research and professional standards:• Academic research• IIA research• International
Standards for the Professional Practice of Internal Auditing
Step 3: Conceptual Model
Once articulated, the model is tested using the following methods:• Survey development• Data analysis• Model validation
Step 2: Model Development
In-house Analysis and Review• Research team• E&Y internal audit personnel
Field Interviews• Directors of
internal audit• Chief audit
executive
Preliminary Drafts of Conceptual Model
First, we examined previously published research concerning internal auditing, with particular emphasis on the factors revealed to be important indicators by Carcello et al. (2005). We also considered the depth of research developed by The IIARF, as well as the Standards, to identify factors that should influence the size and scope of an internal audit department. Second, we brainstormed among research team members and consulted with key internal audit services personnel to refine our thoughts. Further, we conducted inten-sive field interviews nationwide with CAEs from organizations of differing sizes across geographic locations and industries. We also sought to interview CAEs that ran depart-ments that were totally in-sourced, as well as those using co-sourcing and outsourcing. The interviews were conducted with CAEs at the following organizations:
Effective Sizing of Internal Audit Departments
10
1. Ameriprise Financial2. Ceridian Corporation3. Deluxe Corporation4. Ecolab5. General Dynamics6. General Mills7. Imation Corporation8. Land O’ Lakes, Inc.9. Legg Mason10. The Toro Company11. U.S. Department of Education – Office of the Inspector General12. Wells Fargo
The interviews were conducted in groups that included multiple CAEs. We conducted the interviews over several months, refined the conceptual model, and presented updated drafts of it at each subsequent set of interviews.
During the field interviews, we were struck by several insights that ultimately perme-ated much of our research, the conceptual model, and our findings. First, our model development sessions revealed that tone at the top and the internal audit department’s defined mission are critical to determining resources allocated to the function. Second, the nature of internal audit activities within some organizations is changing dramatically. For example, in some organizations, many activities often thought of as internal audit activities have been incorporated into other operational aspects of some organizations, including functions such as monitoring IT security, risk analysis and testing, and contin-uous audits of IT data processing. In some organizations, other activities that were not formerly thought of as internal audit activities are now defined as such, including func-tions such as leadership roles in determining Sarbanes-Oxley compliance. The changing nature of internal-audit-type activities performed has significantly influenced our concep-tualization of our effective sizing model. Third, our model development process made it clear that some internal audit departments have closely aligned their activities with the expectations of management and the audit committees, while others have not achieved such alignment. Obviously, to the extent that there is alignment (misalignment), manage-ment and the audit committee (the customers of the internal audit department) will likely be more (less) satisfied with the performance and quality of the internal audit department, and will be more (less) willing to expend resources to support it.
Our intent is to test the conceptual model through statistical data analysis to determine whether it is useful in estimating something close to an effective size of an internal audit activity given the objectives of such an activity, the nature of the organization, and other
11
III. A Conceptual Model for Determining the Effective Size of an Internal Audit Department
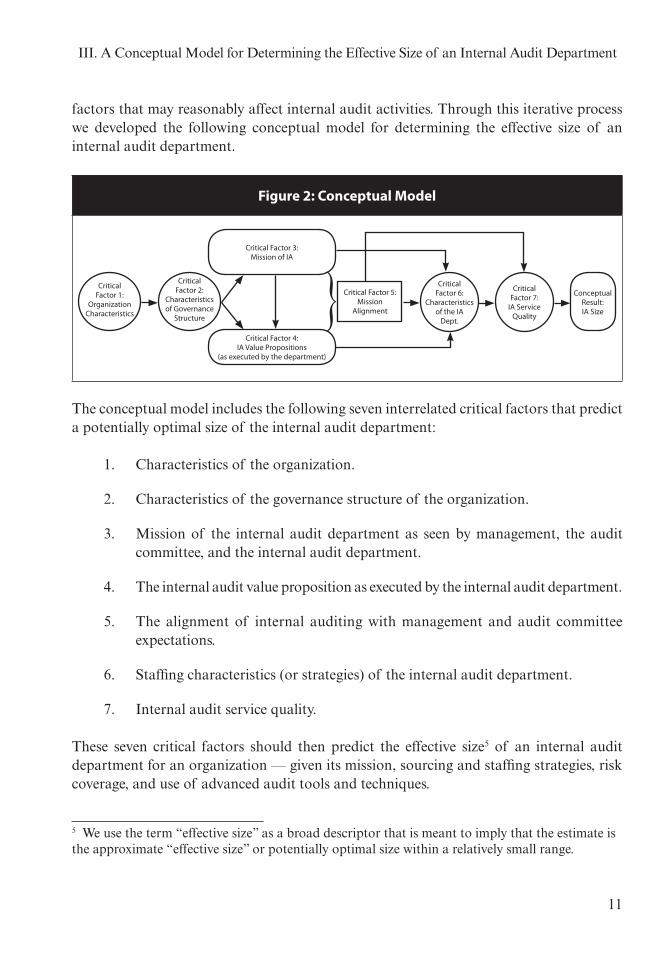
factors that may reasonably affect internal audit activities. Through this iterative process we developed the following conceptual model for determining the effective size of an internal audit department.
Figure 2: Conceptual Model
Critical Factor 1:
Organization Characteristics
Critical Factor 2:
Characteristics of Governance
Structure
Critical Factor 6:
Characteristics of the IA
Dept.
Critical Factor 7:
IA Service Quality
Conceptual Result:IA Size
Critical Factor 5:Mission
Alignment
Critical Factor 3:Mission of IA
Critical Factor 4:IA Value Propositions
(as executed by the department)
}The conceptual model includes the following seven interrelated critical factors that predict a potentially optimal size of the internal audit department:
1. Characteristics of the organization.
2. Characteristics of the governance structure of the organization.
3. Mission of the internal audit department as seen by management, the audit committee, and the internal audit department.
4. The internal audit value proposition as executed by the internal audit department.
5. The alignment of internal auditing with management and audit committee expectations.
6. Staffing characteristics (or strategies) of the internal audit department.
7. Internal audit service quality.
These seven critical factors should then predict the effective size5 of an internal audit department for an organization — given its mission, sourcing and staffing strategies, risk coverage, and use of advanced audit tools and techniques.
5 We use the term “effective size” as a broad descriptor that is meant to imply that the estimate is the approximate “effective size” or potentially optimal size within a relatively small range.

Effective Sizing of Internal Audit Departments
12
Critical Factor One: Characteristics of the Organization
Any consideration of the effective size of an internal audit department should include basic characteristics of the organization itself, as noted by Carcello et al. (2005). Such characteristics include organization size, location, complexity, financial condition, risk, industry membership, and global footprint. We expect that larger, more complex organi-zations will benefit from greater internal audit resources. Previous research suggests that financially stable organizations make a greater commitment to corporate governance and internal audit activities. The research is less clear on organizations that have become more leveraged and less financially stable. On one hand, one would expect that they may require a larger commitment to internal auditing to ensure compliance with various legal restric-tions. On the other hand, such organizations may choose not to invest in internal auditing to save costs so they can reduce costs. Similarly, we expect high-risk organizations to invest more in internal auditing to assist those in oversight positions to better manage risks. Industry membership is more difficult to associate with internal audit size, but we recog-nize that different industries require different levels of internal audit activity (e.g., due to regulations, public perceptions, past issues, etc.), and that internal audit size will likely reflect those systematic differences.
Critical Factor Two: Characteristics of the Organization’s Governance Structure
We expect that an organization’s corporate governance characteristics, including board and audit committee characteristics and risk management functions, are also likely to influence the size of the internal audit department. Our preliminary expectations are that strong governance characteristics will influence internal audit size because organizations with such characteristics are committed to sound internal control, risk management, and operational efficiency, and have strong control environments. But, there is a caveat that we need to explore when testing the conceptual model. That caveat is that the organiza-tions with strong governance characteristics may have smaller internal audit departments because they are fully invested in controls across the organization and/or because they have committed to internal audit-type functions that exist elsewhere in the organization (IT security, risk management, compliance, etc.). That is, these organizations may achieve control objectives with fewer internal audit resources because of the control investment built into strategic planning, operations, financial reporting, and compliance activities.

13
III. A Conceptual Model for Determining the Effective Size of an Internal Audit Department
Critical Factor Three: The Mission of the Internal Audit Department
When developing the conceptual model, we used the feedback from our interviews to separate the internal audit mission (as perceived by management) and the internal audit value propositions as executed by the internal audit department (i.e., the services internal auditing provides to the organization). This allows us to investigate the effects of align-ment or misalignment between the internal audit mission and the actual audit activities. The alignment (misalignment) between expectations and performance of internal auditing may logically influence the size of an internal audit department. We expect that as the internal audit department’s mission becomes more comprehensive, its size will necessarily increase to reflect those resource demands, but only if there is an alignment of actual internal audit activity with that mission.
Critical Factor Four: The Value Proposition of the Internal Audit Department
The conceptual model also addresses the specific “value-added” activities performed by internal auditing. The IIA’s formal definition of internal auditing states that it is “…designed to add value” (IIA 1999). However, each internal audit department must deter-mine precisely which activities or value propositions it will pursue to meet the goal of being a value-added service. As the scope of those value-added services increases, along with the quality of execution of those services, we expect the size of the internal audit department to increase. That is, we expect that organizations will be willing to invest more resources in an internal audit department that is perceived to provide a greater value. As with other parts of the model, we lay out various factors that can affect the value percep-tion of internal audit activities when we test the model.
Critical Factor Five: Alignment with the Value Propositions
A key element of our conceptual model concerns the appropriate alignment between management’s beliefs about internal auditing’s appropriate role, tasks, and performance (i.e., the value proposition of internal auditing), and internal auditing’s own beliefs concerning its value propositions. When management and internal auditing agree about the importance of specific internal audit activities, the likelihood that management will make a greater investment in internal auditing increases. In contrast, if there are signifi-cant differences, particularly where management does not see the value, we expect the investment in internal audit activities to be reduced.

Effective Sizing of Internal Audit Departments
14
Further, our model considers overall alignment between internal auditing’s value proposi-tions (as described in the internal audit mission) and the actual activities internal auditors perform. Greater mission/activity alignment is likely to be positively related to internal audit quality because internal audit customers (company management and the audit committee) are likely to believe internal auditing meets or exceeds their expectations. Therefore, we expect that greater mission/activity alignment will be positively related to the size of the internal audit department.
Critical Factor Six: Characteristics of the Internal Audit Department
Next, we consider the characteristics of internal audit staffing and the technology internal auditing uses in conducting its work. Professional standards and our interviews lead us to believe that internal-audit specific experience, within-company experience, and profes-sional certifications should all influence audit department size. We anticipate that a more professionally oriented staff, along with one that is more highly experienced (in internal auditing), will enable the internal audit department to accomplish its mission and provide value with relatively fewer overall total resources. Thus, we predict that the size of internal auditing should be inversely associated with the level of staffing experience and profes-sionalism. As we test the model, we use factors such as CIA certification or other similar measures of experience and expertise as internal auditors.
We also consider internal auditing’s use of effectiveness-enhancing tools, including those involving data extraction and analysis, fraud detection and prevention, audit manage-ment, control self-assessment, Sarbanes-Oxley compliance, and continuous monitoring. We know that investment in IT will improve the breadth, and usually the depth, of audit coverage. There are two potential impacts of using such technology. First, the investment in audit technology should allow existing auditors to do more with less staff. Therefore, the investment might lead to smaller sized staffs. Second, because internal auditors can do more (and add more value with less staff), it is possible that such organizations may actually invest more in internal auditing because they receive greater benefit from audit activities. Our empirical testing will examine these two possible interpretations.
Critical Factor Seven: Internal Audit Service Quality
Finally, our model development interviews reinforced that the quality of service, although sometimes difficult to measure, is a key factor to consider in determining the effective size of an internal audit department. The argument is much like the one above regarding invest-ment in efficiency-enhancing tools (i.e., higher quality work adds more value, generates

15
III. A Conceptual Model for Determining the Effective Size of an Internal Audit Department
an expectation of future quality, and increases the demand for internal audit services). Internal audit departments that exceed their potential in terms of quality are more likely to garner additional resources over time. As such, we predict that internal audit depart-ments that are perceived as high quality will be recognized as such and more resources will be devoted to those departments — all other things equal.
Conceptual Result: The Size of the Internal Audit Department
The conceptual model, if appropriately developed and tested with the right variables, should allow us to predict the relative size of internal audit departments within our sample organizations, and further, should represent a good approximation for the effective size of an internal audit department. At a minimum, it should represent a good starting point for internal discussions. Moreover, if there are significant discrepancies between the model’s prediction and current size, it may represent an opportunity for self-introspection on the value proposition and structure of an existing internal audit activity. We recognize that such discrepancies may also imply that either a) our model is imprecise, or b) the measure-ments we use for the critical factors are not sufficiently robust. We try to minimize the latter through our development methodology and use various model testing techniques that are widely accepted in the academic literature. There are, of course, many alternative ways to measure size. We include full-time-equivalent headcounts in terms of number of internal audit staff members, along with monetary budget and actual expense amounts.


17
iv. data collEction
With the assistance of The IIARF and Ernst & Young, we identified CAEs as the source of most of the information needed for our study. Our target respondents included all IIA members included in the CAE group of The IIA — 6,644 CAEs. During the summer and fall of 2008, we sent each CAE an e-mail introducing our study. The e-mail included a hyperlink that they could access to complete the survey through an online program. After several weeks, we sent a reminder e-mail to those who had not yet responded to the survey. We received 449 survey responses, resulting in a response rate of 7 percent, which is not unusually low compared to other surveys like ours, particularly given the very extensive length of the survey (see Anderson et al. 2006, for example).
Recall that our conceptual model indicates that industry-specific factors may significantly influence size (for example, financial institutions generally have larger internal audit staffs due to compliance factors). Our preliminary data indicate exactly what we expected (i.e., we exclude 120 financial companies, 37 nonprofits, 26 governmental entities, and 30 companies designated as “other,” which we determined to be nonprofits. We exclude these firms because the data they provide yields significantly different results compared to the data provided by other publicly traded and private companies in our sample. Ultimately, we include 236 organizations in our analysis.
The first page of the survey provided a detailed introduction to the research project and included an informed consent agreement for their participation. After reading this intro-ductory information, CAEs began the survey. Participants responded to questions related to each critical factor in the conceptual model. A copy of the questionnaire is available from the authors.


19
v. rESultS
The following paragraphs, tables, and figures provide descriptive statistics and discussion regarding the critical factors of our conceptual model.
Critical Factor One: Characteristics of the Organization
Organizational characteristics likely to influence the size of the internal audit depart-ment include whether the organization is publicly or privately held, its industry, size, and complexity, and the extent to which the control structure is centralized (or decentralized). We gathered a number of variables to measure these characteristics of the organizations in our sample.
Of the 236 companies in our sample, 142 are publicly traded (60.17 percent) and 94 are privately held (39.83 percent). They have an average of $9.9 billion in assets (in the current year) and $6.9 billion in revenue. Table 1 describes the industry representation of our sample.
Table 1: Descriptive Statistics
IndustryTotal
Respondents (% of Sample)
Publicly Held (% of Sample)
Privately Held (% of Sample)
N = 236 N = 142 N = 94
Health Care 32 (13.6%) 5 (3.5%) 27 (28.7%)
Manufacturing 80 (33.9%) 68 (47.9%) 12 (12.8%)
Retail 16 (6.8%) 10 (7.0%) 6 (6.4%)
Services 16 (6.8%) 9 (6.3%) 7 (7.4%)
Transportation 5 (2.1%) 4 (2.8%) 1 (1.1%)
Other 87 (36.9%) 46 (32.4%) 41 (44.1%)
Total Sample 236 (100%) 142 (60.17%) 94 (39.83%)

Effective Sizing of Internal Audit Departments
20
CAE respondents self-reported the industry category that best fit their organization. As shown in Table 1, approximately 37 percent of respondents indicated that their organi-zation was not accurately described using the available categories so they selected the “other” category. These respondents did not provide an adequate description of the firm that would allow us to better describe the industry.
Figure 3 illustrates the location of operations of the organizations in our sample. The results show that approximately 40 percent of the organizations operate entirely within the United States, while 45.3 percent are based in the United States with international operations.
Figure 3: Location of Operations
U.S. Operations
Based in U.S. with International Operations
Based Internationally with U.S. Operations
Operates Entirely Outside the U.S.
7.7%
39.3%
7.7%
45.3%
One factor that may affect internal audit size is the extent to which an organization is involved in significant mergers and acquisitions. The rationale for including this variable in the characteristics component is that mergers/acquisitions often result in control and risk issues that need to be addressed (and might call for greater internal audit involve-ment). Figure 4 illustrates the extent to which organizations in our sample have engaged in mergers or acquisitions and divestitures as a regular part of their activities. It reveals that about half of the organizations have engaged in both mergers or acquisitions and divesti-tures, and have experienced significant organizational changes in the recent past.

21
V. Results
Figure 4: Mergers, Acquisitions, and Divestitures
To further understand the complexity of the organizations in our sample, we asked partic-ipants to indicate the extent to which the organization has strategic partnerships. Strategic partnerships, or alliances, include a wide range of mutually beneficial formal relationships between two or more organizations, such as strategic suppliers, marketing or distribu-tion partners, etc. These strategic relationships often require a different control structure.6 Often these relationships will contain contract provisions that require more audits of results. As shown in Figure 5, more than 76 percent of the organizations engage in some strategic alliance activity. Most (69 percent) have between one and 30 alliances.
6 See Anderson et al. 2006 (http://www.theiia.org/bookstore/product/managing-strategic-alliance-risk-survey-evidence-of-control-practices-in-collaborative-interorganizational-settings-1404.cfm) for information on control systems designed to manage risk related to strategic alliances.
0%
10%
20%
30%
40%
50%
60%
Divestiture Activity
Merger Activity
Extensively Somewhat None

Effective Sizing of Internal Audit Departments
22
Figure 5: Strategic Alliance Activity
In other results, not described in tables or figures, we find that about 47 percent of the orga-nizations have entered into formal, profit-sharing arrangements (joint ventures) with other organizations to some extent (between one and five joint ventures) during the previous two years (2006-2007). About 8 percent (8.3 percent) indicate that they have engaged in joint ventures extensively (greater than six joint ventures) during the past two years. We also find that organizations in our sample have an average of eight major business segments (min = 0, max = 200) and 21 foreign subsidiaries (min = 0, max = 340). In short, the organizations in our sample are relatively complex in terms of strategic alliances, joint ventures, business segments, and foreign subsidiaries.
Figure 6 describes the extent to which the a) internal control systems and b) IT control systems are centralized. Approximately 28 percent of organizations have centralized internal control systems, indicating that the internal controls are consolidated and coor-dinated within one administrative system and processes are standardized throughout the organization. Forty-seven percent have centralized IT control systems, indicating that IT controls are primarily consolidated and coordinated centrally.
None
1 – 30 Alliances
31 – 50 Alliances
51 – 70 Alliances
71 – 100 Alliances
100+ Alliances
23.6%
69.0%
3.9 1.7% 1.7%

23
V. Results
Figure 6: Centralization of the Internal Control System and IT Control System
Corporate complexity is also affected by the IT environment — in particular the extent to which IT supports multiple systems or continues to support legacy systems. The results in Figure 7 show that only 31 percent of the organizations support a single instance of commercially available software. In contrast, almost 70 percent of the organizations are supporting multiple instances of both commercially available and legacy systems. For our purposes, we classify these organizations as having highly complex IT structures because of the diversity of IT that must be supported and controlled.
Internal Control Structure IT Control Structure
Decentralized 24.7%
Centralized 27.7%
Partially Decentralized
47.7%
Decentralized 14.1%
Centralized 47.0%
Partially Decentralized
38.9%

Effective Sizing of Internal Audit Departments
24
Figure 7: Description of IT Environment
Critical Factor Two: Characteristics of the Organization’s Governance Structure
Previous research and interviews with CAEs indicate that the structure and control mech-anisms associated with various elements of corporate governance will influence the size of the internal audit department. We consider board of director, audit committee, and risk management characteristics in our analyses.
Board of Director Characteristics. Panels A and B in Table 2 describe the characteristics of the boards at the organizations in our sample. We find that, on average, organizations have about 11 directors and only about 19 percent have boards consisting of outside board members only. Our CAE respondents separately indicate that only 59 percent believe their board of directors is sufficiently independent7 from management. When viewing Table 2, please note that the large outlier in terms of the size of the board is due to a foundation board. Such boards are typically large because of their desire to bring in outsiders who support (and help raise funds to support) The IIARF’s mission.
7 This is the opinion of the survey respondents, not as defined by any regulatory or governing body.
Single Instance of Commercial Software
Multiple Instance of Commercial Software
Single Instance of Legacy System
Multiple Instance of Legacy System
17.9%
31.1%4.2%
46.8%

25
V. Results
Table 2 : Composition of the Board of Directors
Panel A: Number of Directors
Number of Directors
Mean Minimum Maximum
Publicly Traded 9.54 3 16
Privately Held 13.35 0 72
Total Sample 10.88 (7.75) 0 72
Panel B: Independence from Management
Fewer than 50% are independent
More than 50% are independent
100% are independent
Publicly Traded 8.6% 86.7% 4.8%
Privately Held 34.3% 32.8% 32.8%
Total Sample 16.1% 64.9% 19.0%
Table 3 describes the frequency of board of director meetings, as well as the frequency with which the boards meet with the internal and external auditors. In other (untabulated) results, we find that summaries of significant internal audit findings are formally reviewed by 79 percent of the audit committee, board of directors, or both.
Table 3: Frequency of Board Meetings
Frequency of Board of Directors Meetings
AnnuallySemi-
annually QuarterlyMore
FrequentlyAs
Needed Other
Board of Directors Meetings
1.1% 5.1% 48.6% 41.7% 1.1% 2.3%
BOD Meets with Internal Auditing
5.5% 6.8% 58.2% 5.5% 5.5% 18.5%
BOD Meets with External Audit
10.7% 10.7% 50.7% 5.0% 8.6% 14.3%

Effective Sizing of Internal Audit Departments
26
Figure 8 explores whether 1) there have been any problem resignations on the board in the last two years; 2) the board has sufficient access to sensitive information, such as regula-tory investigations or improper acts; and 3) the board has information needed to effectively monitor management’s objectives, strategies, and financial and operating positions. Results indicate that in virtually all organizations, there have not been any problematic resignations. Also, in more than 70 percent of the organizations, the board has access to all sensitive and monitoring information needed for effective oversight. While positive, it strikes us as interesting that between a quarter and a third of the participants do not believe that the board has sufficient access to sensitive information and to information that allows them to effectively monitor management’s strategies, operations, and controls. Thus, for our analysis purposes, based on this variable we would classify approximately two-thirds of the organizations as having strong governance and approximately one-third without strong governance.
Figure 8: Board of Directors’ Governance
0%
20%
40%
60%
80%
100%
No
Yes
Access to Monitoring Information
Access to Sensitive Information
Problem Resignations from Board

27
V. Results
Audit Committee Characteristics. About 68 percent of the organizations in our sample indi-cate that they have an audit committee. As shown in Table 4, Panel A, audit committees are on average slightly larger in privately held companies compared to public companies (4.76 and 3.87 members, respectively). However, all publicly traded companies do, indeed, have audit committees, ranging in size from two to seven members. Table 4, Panel B, reveals that more than 90 percent of audit committees (in publicly traded and privately held compa-nies) have at least one outside director. In publicly traded companies, approximately 87 percent of audit committees are composed entirely of outside directors. Thus, while there is some variation, most of the organizations in our sample have an audit committee of reasonable size and independence.
Table 4: Audit Committee Characteristics
Panel A: Number of Audit Committee Members
Number of Audit Committee Members
Average Minimum Maximum
Private Companies 4.76 0 15
Public Companies 3.87 2 7
Total Audit Committee Members 4.00 0 10
Panel B: Independence from Management
100% Inside
Directors
At Least One Outside
Director
More Than 50% Outside
Directors
100% Outside
Directors
Private Companies 8.3% 10.0% 16.7% 65.0%
Public Companies 7.8% — 4.9% 87.4%
Audit Committee Composition 7.9% 4.2% 9.1% 78.8%
Table 5 describes the frequency of audit committee meetings, and the frequency with which audit committees meet with the internal and external auditors. Meetings occur with reasonable frequency, with more than 60 percent of audit committees meeting at least quarterly, and similar patterns of meeting frequencies with both the internal and external auditors. For example, both internal and external auditors are most likely to meet with the audit committee quarterly (60.5 percent and 55.9 percent, respectively).

Effective Sizing of Internal Audit Departments
28
Table 5: Audit Committee Meeting Frequency
Frequency of Audit Committee Meetings
AnnuallySemi-
annually Quarterly 10+ As
Needed Other
Audit Committee Meetings 1.2% 3.1% 62.0% 7.4% 6.7% 19.6%
Meetings with Internal Audit 3.7% 6.2% 60.5% 5.6% 5.6% 18.5%
Meetings with External Audit 6.8% 11.8% 55.9% 3.1% 6.8% 15.5%
We also asked participants about a variety of other characteristics of the audit committee governance practices at their organizations. The results are illustrated in Figure 9. The results show that 67 percent of audit committees include at least one financial expert, 65 percent have a written charter, and 97 percent meet privately with the CAE. Sixty-six percent of audit committees review and approve the annual internal audit budget and 42 percent review and approve the internal audit charter. Approximately 45 percent of audit committees have responsibility for hiring and firing the internal audit director. In Figure 9 we also compare the audit committee characteristics found in publicly and privately held companies.
Risk Management Function Characteristics. An element of governance that is increasing in importance is top management and board initiatives and oversight of a comprehensive risk management process. To the extent that other departments (not internal audit) are performing risk management, or risk analysis-type activities, the internal audit scope may be less than in an organization in which internal auditing is more actively engaged in risk management activities. We view this variable differently from an internal audit activity to develop and communicate (to management and the board) an assessment of the robust-ness of the organization’s risk management process.
We also examined the extent to which noninternal audit departments were responsible for providing various assurance or compliance activities. On average, the (untabulated) results show that organizations use other noninternal audit departments to perform risk manage-ment activities to a moderate extent (mean = 4.50 on the seven-point scale). In Table 6 we document the percentage of respondents who indicated that noninternal audit depart-ments’ perform specific audit/compliance and risk management activities. For example, 65 percent of our participants indicated that noninternal audit functions provided assurance or risk management activities related to IT security to a moderate or great extent. On the other hand, only 8 percent indicated that no other assurance or compliance activities by noninternal audit functions were performed related to IT security.

29
V. Results
Figure 9: Audit Committee Governance
Fina
ncia
l Exp
ert
Writ
ten
Audi
t Co
mm
ittee
Cha
rter
Audi
t Com
mitt
ee a
nd
Inte
rnal
Aud
iting
Mee
t
Audi
t Com
mitt
ee A
ppro
ves
Inte
rnal
Aud
it Ch
arte
r
Audi
t Com
mitt
ee A
ppro
ves
Inte
rnal
Aud
it Bu
dget
Audi
t Com
mitt
ee H
ires/
Fire
s CA
E
Acce
ss to
Sen
sitiv
e In
form
atio
n
Acce
ss to
Mon
itorin
g In
form
atio
n
0%
20%
40%
60%
80%
100%
PrivatePublic

Effective Sizing of Internal Audit Departments
30
Table 6: Extent of Reliance on Noninternal Audit Functions for Risk Management
NoneLimited Extent
Moderate Extent
Great Extent
N/A
IT Security 8.0% 21.7% 43.5% 21.1% 5.7%
Compliance with Laws & Regulations
1.1% 20.4% 41.6% 31.2% 5.7%
Health & Safety of Employees 5.1% 18.8% 33.0% 36.9% 6.2%
Monitoring to Identify Emerging Liabilities
9.2% 17.8% 35.6% 26.4% 10.9%
Joint Venture Auditing 11.5% 20.1% 20.1% 3.4% 44.8%
Quality Control/Quality Assurance 9.8% 13.8% 33.9% 27.6% 14.9%
Monitoring of Supply Chain Partners
10.9% 22.9% 28.1% 14.4% 23.6%
Monitoring of Third-party Construction Contracts
16.6% 19.4% 29.7% 8.6% 25.7%
Monitoring of Third-party Service Contracts
16.7% 24.1% 27.6% 13.2% 18.4%
Environmental Health & Safety Audits
11.6% 15.0% 27.1% 28.9% 17.3%
Post-project Implementation Reviews
18.5% 20.2% 27.2% 8.6% 25.4%
Loss Prevention 15.5% 23.0% 29.8% 9.8% 21.8%
Other 9.3% 2.3% 4.7% 4.7% 79.1%
The largest areas where nonaudit functions perform compliance and assurance work for the organization include:
• Health and safety management.• Environmental health and safety audits.• Quality control.• Compliance with laws and regulations.• IT security.• Monitoring for emerging liabilities.

31
V. Results
Some of these areas represent specialties where internal auditing usually does not perform the control activities, e.g., quality control. However, internal auditing usually is respon-sible for determining whether those functions are operating effectively. All of the areas listed above (and repeated in Table 7) represent potentially significant risks to an organiza-tion. As an example, we were surprised that 58 percent of the respondents did not indicate active monitoring of the supply chain by the process owners. Table 7 identifies the (single) most frequently cited noninternal audit function responsible for each of the compliance/assurance services (in column 2). In column 3 we provide the percentage of respondents who indicated that the activity was performed by a department outside of internal auditing (at least to a moderate extent) and indicate that the department in column 2 is primarily responsible. For example, 65 percent of those respondents who indicated that IT security was performed outside of internal auditing indicated that there is an internal IT depart-ment responsible for this activity.
Table 7: Noninternal Audit Responsibility for Assurance/Compliance for Various Activities
Assurance/Compliance Activity
Primary Responsibility for Assurance/Compliance
for the Activity
Percent of Respondents That Uses This Functional
Unit (to at least a moderate extent)
IT Security Internal IT Department 65.0%
Compliance with Laws & Regulations
Legal Department 73.0%
Health & Safety of Employees Environmental Health & Safety Department
70.0%
Monitoring Emerging Liabilities Environmental Health & Safety Department
62.0%
Joint Venture Auditing Accounting Department 23.5%
Quality Control/Quality Assurance Quality Control/Project Management Department
61.5%
Monitoring of Supply Chain Partners
Supply Chain Function 42.5%
Monitoring of Construction Contracts
Multiple Departments 38.3%
Monitoring of Service Contracts Multiple Departments 40.8%
Environmental Health & Safety Audits
Environmental Health & Safety Department
56.0%

Effective Sizing of Internal Audit Departments
32
Table 7: Noninternal Audit Responsibility for Assurance/Compliance for Various Activities (continued)
Assurance/Compliance Activity
Primary Responsibility for Assurance/Compliance
for the Activity
Percent of Respondents That Uses This Functional
Unit (to at least a moderate extent)
Post-project Implementation Reviews
Accounting Department 35.8%
Loss Prevention Accounting Department 39.6%
Critical Factor Three: The Mission of the Internal Audit Department
Although internal auditing is defined broadly, we explored its mission more directly by asking CAEs which of the following, if any, were included in the mission for their internal audit department:
Definitions of Objectives Included in the Internal Audit Mission
o Operational Auditing Auditing of operational processes.
o Financial Auditing Auditing of financial reporting processes.
o IT Auditing Auditing the IT development processes, change controls, etc.
o IT Security & Control Auditing of IT security and privacy compliance.
o Compliance Auditing compliance with laws and regulations, policy, etc.
o Financial Audit Support Providing assistance to external auditors during financial statement audits.
o Auditing Third Parties Reviewing contract compliance, revenue collection, joint venture/strategic partner relations, etc.
o Reporting on Internal Control
Rendering an opinion on internal controls in accordance with COSO.
o Risk Management Leadership
Championing risk management.
o Leadership Development Internal auditing serves as a training ground for organizational management.

33
V. Results
Definitions of Objectives Included in the Internal Audit Mission (continued)
o Control Improvement Providing consulting services on control development or pre-implementation reviews, control self-assessment engagements, etc.
o Control Leadership/ Continuous Monitoring
Developing systems to provide information to management regarding control on a continuous basis.
o Anti-fraud Programs Developing and implementing fraud prevention and detection programs.
o Governance Providing administrative support for the audit committee.
o Compliance with Statutory Audit Requirements
Performing audits/reviews to ensure compliance with various statutory audit requirements.
o Other Defined by participants.
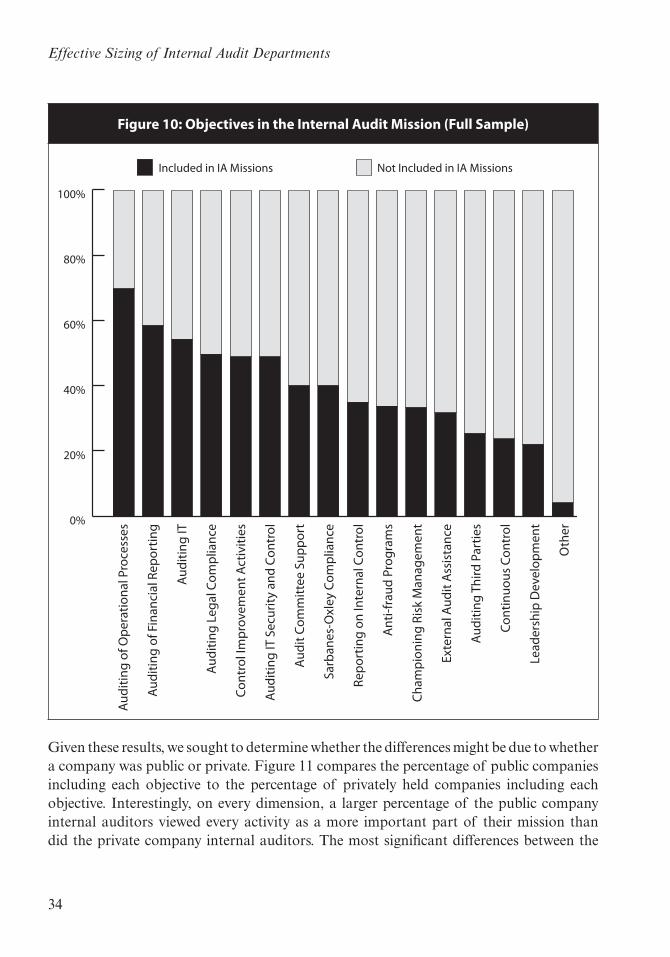
Mission-relevant Responsibilities. The organizations in our sample include a variety of internal audit function missions. Figure 10 illustrates the percentage of participants indi-cating each objective that is included in the mission statement. The results reveal that, on average, the internal audit mission includes approximately five activities (5.47). More than 50 percent of participants indicated that 1) auditing the financial reporting process; 2) auditing IT development processes and controls; and 3) auditing operational processes are explicitly included in the mission statement.
Equally important, we find the data in Figure 10 to be interesting because of what internal auditing does not do. Given our wording, we were not surprised that some things such as “developing and implementing fraud detection and prevention programs” were not generally seen as part of the internal audit mission. This makes sense because the development of such programs is rightfully an organization’s (not internal auditing’s) responsibility. However, some of the other activities that were not performed are also interesting. For example:
• Approximately 75 percent did not see leadership development as one of the missions of internal auditing (potentially in conflict with management and audit committee views).
• More than 70 percent did not perform any continuous monitoring of controls (an investment in audit methodology).
• More than 70 percent are not involved in auditing third-party contracts.
• Approximately two-thirds of the participants do not provide a formal report on the quality of internal controls.
Effective Sizing of Internal Audit Departments
34
Figure 10: Objectives in the Internal Audit Mission (Full Sample)Au
ditin
g of
Ope
ratio
nal P
roce
sses
Audi
ting
of F
inan
cial
Rep
ortin
g
Audi
ting
IT
Audi
ting
Lega
l Com
plia
nce
Cont
rol I
mpr
ovem
ent A
ctiv
ities
Audi
ting
IT S
ecur
ity a
nd C
ontr
ol
Audi
t Com
mitt
ee S
uppo
rt
Sarb
anes
-Oxl
ey C
ompl
ianc
e
Repo
rtin
g on
Inte
rnal
Con
trol
Ant
i-fra
ud P
rogr
ams
Cham
pion
ing
Risk
Man
agem
ent
Exte
rnal
Aud
it A
ssis
tanc
e
Audi
ting
Third
Par
ties
Cont
inuo
us C
ontr
ol
Lead
ersh
ip D
evel
opm
ent
Oth
er
0%
20%
40%
60%
80%
100%
Not Included in IA MissionsIncluded in IA Missions
Given these results, we sought to determine whether the differences might be due to whether a company was public or private. Figure 11 compares the percentage of public companies including each objective to the percentage of privately held companies including each objective. Interestingly, on every dimension, a larger percentage of the public company internal auditors viewed every activity as a more important part of their mission than did the private company internal auditors. The most significant differences between the

35
V. Results
missions of public and privately held companies include IT audit and IT security, auditing financial reporting processes, auditing operational processes, and (not surprisingly) Sarbanes-Oxley compliance.
Figure 11: Objectives in the Internal Audit Mission (Public versus Private)
Auditing of Operational Processes
Auditing of Financial Reporting
Auditing IT
Auditing Legal Compliance
Control Improvement Activities
Auditing IT Security and Control
Audit Committee Support
Sarbanes-Oxley Compliance
Reporting on Internal Control
Anti-fraud Programs
Championing Risk Management
External Audit Assistance
Auditing Third Parties
Continuous Control
Leadership Development
Other
0% 20% 40% 60% 80% 100%
Public
Private
Extent of Internal Audit Responsibilities Accomplished via Alternative Sourcing. Many organizations source some or all internal audit activities with third parties or other sources such as internal operational experts. Clearly, alternative sourcing of internal audit activi-ties impacts the number of internal auditors the organization directly employs.8 Therefore, we asked a variety of questions to identify the extent of alternative sourcing, as well as the nature of these sourced services. Figure 12 shows that 46 percent of our partici-pants (average to larger size firms) perform all internal audit activities in house and 54
8 Alternative sourcing of some or all internal audit activities will reduce the number of internal auditors employed by the organization. Additional analysis examining the effect of alternative sourcing on the internal audit budget and internal audit expenses also reveals that it reduces the number of FTEs employed to complete the audit plan.

Effective Sizing of Internal Audit Departments
36
percent use some form of alternative sourcing.9 For the organizations that use outsourcing arrangements, 43 percent rely on outsourcing to fulfill their technical audit needs rather than everyday activities (8 percent) or primary form of outsourcing (3 percent).
Figure 12: Extent of Alternative Sourcing for Internal Auditing
100% Completed In House
Co-source to Fulfill Everyday Activities
Co-source to Fulfill Technical Needs
Primarily Outsourced
2.5%
46.0%43.4%
8.1%
Table 8 describes the extent to which specific internal audit activities are performed when an organization uses outsourced resources to perform internal audit activities. The activi-ties that are commonly not outsourced include operational audits (69.6 percent), complex operations (54.5 percent), and fraud/forensic investigations (49.5 percent). Activities that are outsourced include IT controls and security (34.3 percent), complex regulatory require-ments (17.2 percent), and Sarbanes-Oxley work (16.9 percent).
9 Our participants were mostly from moderate to larger size organizations. Therefore our models are based on this available data. It is possible that smaller organizations might be more prone to use outsourcing to meet specialty needs.

37
V. Results
Table 8: Extent Specific Internal Audit Activities Are Performed by Sourced Resources
Not At All
To a Very Limited Extent
To a Moderate
Extent
To a Very Great
Extent N/A
IT Controls and Security 34.4% 26.7% 17.9% 16.4% 4.6%
Complex Regulatory Requirements
42.7% 21.4% 12.5% 4.7% 18.8%
Complex Operations 54.5% 15.7% 9.4% 5.2% 15.2%
Global Operations 24.4% 14.0% 5.2% 8.3% 48.2%
Fraud/Forensic Investigations 49.5% 26.8% 4.6% 5.2% 13.9%
Operational Audits 69.6% 13.4% 4.6% 5.7% 6.7%
Sarbanes-Oxley 34.4% 17.9% 9.7% 7.2% 30.8%
Critical Factor Four: The Value Proposition of the Internal Audit Department
In our survey, we ask participants to identify the value propositions of the internal audit department and indicate the percentage of total internal audit resources dedicated to each activity. Figure 13 shows the average amount of audit resources devoted to specific activ-ities. The largest resource allocation is to operational auditing, followed by 15 percent dedicated to Sarbanes-Oxley, and another 13 percent allocated to financial auditing. Our survey differentiated between Sarbanes-Oxley activities and financial-related audits. However, testing of financial reporting controls for Sarbanes-Oxley is a form of financial-related audit. Therefore, financial-related auditing makes up the single largest category, at 28 percent of activities. As with other observations, the data below are interesting not only for where internal audit resources are allocated, but where resources are not allocated in any significant amounts: fraud investigation, risk management, and consulting.10
10 A future research project could investigate whether these differences in resource allocations might be a partial explanation of the alignment/nonalignment of management and internal audit objectives. Sufficient data were not available to answer this question as we did not receive suffi-cient responses from audit committee members or top management.

Effective Sizing of Internal Audit Departments
38
Figure 13: Audit Resources Dedicated to Specific Activities
Figure 14 compares the resources spent on each audit activity in publicly held companies versus those spent in privately held companies. Operational auditing is the largest expense in privately held companies (40 percent), with approximately 24 percent dedicated to oper-ational auditing in public companies. As expected, public companies spend approximately three times as many resources on Sarbanes-Oxley compliance. However, privately held companies spend a larger percentage of their resources on other compliance activities (not Sarbanes-Oxley) than public companies (e.g., compliance with OSHA regulations, environmental regulations, etc.).
Operational Auditing (22.3%)
Sarbanes-Oxley Compliance (15.4%)
Financial Auditing (13.0%)
IT Security (8.8%)
Compliance Activities (8.4%)
Fraud Investigations (1.7%)
Consulting Activities (1.6%)
Risk Management Activities (1.4%)
Other Activities (1.1%)
13.0%
8.4%
1.7%
1.6%1.4% 1.1%
22.3%
8.8%15.4%
Internal Audit Activities

39
V. Results
Figure 14: Audit Resources Dedicated to Specific Activities (Public versus Private)
0% 5% 10% 15% 20% 25% 30% 35% 40%
Private
Public
Sarbanes-Oxley Compliance
Operational Auditing
Financial Auditing
IT Security
Compliance Activities
Fraud Investigations
Consulting Activities
Risk Management Activities
Other Activities
Next, we examined the extent to which the internal audit department engages in various compliance and risk-management activities and whether internal auditing takes on an ownership role — including management and oversight — or an audit/support role. We define an ownership role as when internal auditing has responsibility for the manage-ment and oversight of the function in general. A support/audit role is defined as internal auditing performing audit or other supporting activities to assist the process owner. As shown in Table 9, internal auditing is most extensively involved in Sarbanes-Oxley compli-ance, IT security, and continuous monitoring. However, when internal auditing is involved, the department rarely assumes an ownership role and instead is primarily involved in a support role. In fact, our results indicate that only about 19 percent of the internal audit departments in our sample assume an ownership role for Sarbanes-Oxley compliance. However, that said, it is worth noting that our participants showed much more extensive involvement in Sarbanes-Oxley compliance than in any other activity.

Effective Sizing of Internal Audit Departments
40
Table 9: Internal Audit Involvement in Risk Management Activities
Activity
Mean % Extent of Internal Audit Involvement for Each Activity
Average Internal Audit Role in Each Activity
N/A Occasional Regular ExtensiveOwnership
RoleSupport
Role
Sarbanes-Oxley Compliance
34.3% 7.9% 17.4% 40.4% 18.8% 81.2%
IT Security 12.9% 34.8% 41.0% 11.2% 2.5% 97.5%
Continuous Monitoring
29.0% 31.2% 30.1% 9.7% 15.1% 84.9%
Companywide Risk Management
16.0% 45.7% 28.0% 10.3% 13.0%
87.0%
Legal Compliance 14.7% 50.8% 27.7% 6.8% 1.7% 98.3%
Effectiveness of Quality Control over Internal Processes
25.4% 36.7% 30.5% 7.3% 4.2% 95.8%
Quality Control Processes
43.4% 44.0% 11.4% 1.1% 0.8% 99.2%
HR Compliance 23.6% 65.7% 10.7% 0.0% 0.0% 100.0%
Joint Venture/Contract Compliance
40.0% 48.0% 11.4% 0.6% 0.8% 99.2%
HR Policies and Procedures
33.9% 53.7% 11.9% 0.6% 0.8% 99.2%
Intellectual Property for Compliance
60.8% 30.7% 8.0% 0.6% 0.4% 99.6%
Licensing and Royalty Payments/Collections
68.2% 25.0% 5.7% 1.1% 0.0% 100.0%
Tax Compliance 51.4% 44.1% 3.4% 1.1% 0.4% 99.6%

41
V. Results
Critical Factor Five: Potential Misalignment with the Value Propositions
Table 10 reveals the extent of management and internal audit alignment (misalignment) between management and internal auditing about the importance of various internal audit activities. There can be many measures of potential alignment/misalignment — and as posited in the conceptual model, this misalignment may affect the resources devoted to internal auditing. Note that we are not arguing that management’s view is more correct, or that internal auditing’s view is more correct. We simply asked CAEs whether or not their views are aligned with management’s views so that we can determine whether potential alignment or misalignment affects the resources allocated to internal auditing — and, as importantly, which factors of alignment or misalignment most affect resource allocation.11
Generally, the results indicate that management and internal auditing agree on the impor-tance of most internal audit activities.12 However, we find that for more than 45 percent of the organizations in our sample, internal auditors believe that their role in risk management (48.20 percent) and IT audit and security activities (47.40 percent) are more important than management does. This suggests that almost 50 percent of internal auditors believe management undervalues these activities. Alternative interpretations of this result include: 1) management does not believe it is getting the value expected from these activities; 2) there may be other functions (including operational management) that management relies on for assurance that these activities are properly controlled; or 3) there is another func-tion performing the task as well and management believes this to be a costly duplication of effort. In about 20 percent of organizations, management places more importance on internal auditing’s support of the external audit compared to the importance placed on it by the internal audit department.
11 We asked CAEs, who might be more prone to believe there is alignment than would an audit committee member or top management. As the research expands, we would like to get more input from audit committee members and top management because our personal experience is that sometimes where there is significant misalignment of perceptions of internal audit value, the CAE may be one of the last to realize the misalignment. Given this potential deficiency in the data, we believe that, even with these limitations, the data are quite robust and sufficient to test the model.
12 Recall that the data are drawn from responses by CAEs. Although we solicited responses from management and boards on the same issues, the response rate was not sufficient to analyze their responses. Thus, we rely on the CAEs’ perception of relative importance, based on their interaction with management.

Effective Sizing of Internal Audit Departments
42
Table 10: Extent of Management and Internal Audit Disagreement
Management Believes It is Significantly
More Important
Management Believes It is
Slightly More Important
Management and Internal
Auditing Agree On
Importance
Internal Auditing
Believes It is Slightly More
Important
Internal Auditing
Believes It is Significantly
More Important
Sarbanes-Oxley Work and Financial Reporting
0.9% 6.5% 75.9% 15.7% 0.9%
Operational Auditing
1.7% 4.6% 63.0% 17.9% 12.7%
IT Audit and Security
0.0% 4.0% 48.6% 32.4% 15.0%
Internal Auditing’s Role in Risk Management
1.2% 9.0% 41.6% 29.5% 18.7%
Auditing of Procurement and Payment
0.6% 4.1% 74.6% 17.8% 3.0%
Auditing of Revenue Recognition
1.2% 7.2% 78.3% 11.4% 1.8%
Auditing of Advertising
0.9% 6.5% 75.9% 15.7% 0.9%
Supporting External Audit
4.3% 15.3% 73.6% 4.9% 1.8%
Compliance with HR Policies, Procedures, and Controls
1.2% 2.4% 74.9% 18.6% 3.0%
Compliance with Shipping/Inventory Policies
1.4% 4.2% 80.6% 13.2% 0.7%
Compliance with Code of Ethics
1.2% 2.9% 76.6% 14.0% 5.3%

43
V. Results
Table 10: Extent of Management and Internal Audit Disagreement (continued)
Management Believes It is Significantly
More Important
Management Believes It is
Slightly More Important
Management and Internal
Auditing Agree On
Importance
Internal Auditing
Believes It is Slightly More
Important
Internal Auditing
Believes It is Significantly
More Important
Compliance with Other Policies and Procedures
0.6% 3.6% 74.3% 16.2% 5.4%
Audit of Compliance (or Whistleblower) Hotline
1.3% 3.8% 71.0% 19.5% 4.4%
In addition, we compare the activities explicitly described in the internal audit mission (see Figure 10) to the activities the internal audit department includes as value propositions and actually performs (see Table 9). To the extent that the activities listed in the internal audit mission differ from those actually performed by internal auditing, we expect that the internal audit department may not be meeting management’s expectations. Specifically, for each item listed in the mission, we determine whether the organization reported that resources are devoted to that activity.
To develop a measure of alignment that we could use to determine whether the differences seem to affect the resources devoted to internal auditing, we performed the following steps. We verified that all activities to which resources are dedicated are included in the mission. We added together all of the activities that are not included in both the mission and the stated activities as our measure of mission alignment. We consider organizations with alignment equal to zero (0) or one (1) to be well aligned. We consider organizations with an alignment score greater than one (1) to be misaligned. Table 11 provides an example of our calculation of the mission alignment variable.

Effective Sizing of Internal Audit Departments
44
Table 11: Mission Alignment Example
Included in
Mission?Activities
Performed?
Differences Between Mission
& Activities
Compliance (no Sarbanes-Oxley) Activities
Yes Yes
Consulting Activities Yes No X
Financial Audit No No
Fraud-related Activities Yes Yes
IT Audit Yes No X
Operational Audit Yes Yes
Risk Management No No
Sarbanes-Oxley Compliance No Yes X
Total Differences 3
If there are one or fewer differences, we consider the activities aligned with the mission of internal auditing. If there is more than one difference, we consider the activities and mission to be misaligned.
Using the methodology described above, we find that approximately 75 percent of the organizations in our sample perform activities that are included in the stated mission of the internal audit function. That is, approximately 75 percent are “aligned.” Further examination of mission alignment in public and private companies separately reveals that 71.1 percent of public companies and 80.9 percent of private companies in our sample are aligned. We did not specifically test whether the nature of the alignment (misalignment) made the most difference. Rather, for the broader conceptual model, we are interested in whether or not there is a strong or weak consistency between the activities included in the mission and the activities performed by internal auditing.

45
V. Results
Critical Factor Six: Characteristics of the Internal Audit Department
As posited in the conceptual model, an internal audit department’s staffing philosophy, as well as automation strategy, may influence the effective size of an internal audit depart-ment. For example, we would expect that a department with experienced CIAs might be smaller than a department with a CAE (who may or may not be a CIA) supervising a number of staff auditors that are on a rotation through internal auditing as part of a financial management training program. As noted earlier, the extent that internal auditing uses automation might or might not lead to a smaller audit function. In general, given limited resources, we expect that an audit department that uses a great deal of automation may use a smaller internal audit staff to accomplish its objectives.
Characteristics of Internal Audit Personnel. By comparing Panels A and B of Table 12, we find that, on average, each classification of internal audit employee has slightly more experience in internal auditing than they do within the organization as a whole. This is consistent with the notion that many organizations rely on experienced internal audi-tors when hiring new staff. Indeed, our survey results indicate that less than 5 percent (4.22 percent) of organizations hire inexperienced auditors directly from college campuses (described more fully in Table 14).
Table 12: Internal Audit Experience
Panel A: Years of Experience in Internal Auditing
Industry
Average Experience Working in Internal Auditing (in years)
Staff/Senior ManagerSenior
ManagerChief Audit Executive
Health Care 4.72 8.57 10.11 14.60
Manufacturing 4.37 8.63 7.65 13.38
Retail 7.75 5.88 7.75 16.54
Services 4.50 9.00 14.33 16.90
Transportation 3.60 6.00 13.5 18.00
Other 5.59 9.08 10.62 14.01
Total Sample 5.04 8.50 9.59 14.28

Effective Sizing of Internal Audit Departments
46
Table 12: Internal Audit Experience (continued)
Panel B: Years of Experience within the Organization
Industry
Mean Experience Working in Internal Auditing (in years)
Staff/Senior ManagerSenior
ManagerChief Audit Executive
Health Care 3.89 6.29 4.67 10.12
Manufacturing 4.54 6.27 8.55 10.16
Retail 11.09 5.29 11.00 10.08
Services 3.70 7.25 9.50 7.31
Transportation 3.40 6.50 7.50 11.00
Other 4.65 5.63 7.00 8.45
Total Sample 4.88 6.13 7.73 9.68
Table 13 reports the percentage of internal auditors that have achieved various certifica-tions or are classified as IT specialists. In the total sample, approximately 30 percent of internal auditors hold CIA certifications, with a larger percentage (37.93 percent) holding Certified Public Accountant (CPA) certifications. Only about 16 percent of internal auditors have the Certified Information Systems Auditor (CISA) certification, which is also reflected in the relatively low number of internal auditors classified as IT specialists (approximately 10 percent).
Table 13: Percentage of Auditors with Certifications
Industry
Average Percentage of Auditors with Certifications
% CIA % CPA % CISA % IT Specialists (a)
Health Care 31.84 51.53 16.11 10.76
Manufacturing 34.73 40.20 16.99 10.38
Retail 24.49 40.64 20.47 24.17
Services 26.72 27.93 11.46 3.88
Transportation 34.39 26.20 17.64 14.50
Other 26.38 32.42 14.52 9.26
Total Sample 30.09 37.93 15.97 10.39

47
V. Results
Further, we consider the possibility that one of the critical characteristics of an internal audit department is that it can serve as a training ground for future operational managers. To this end, we ask several questions designed to determine the extent that the internal audit department is used to develop managers for the organization. Internal audit depart-ments that serve as management training grounds are likely to have a larger staff compared to those that do not, because auditors may be transitioning in and out of the department and will have relatively limited internal audit experience. We asked participants to indicate the extent to which the audit department is used for leadership/personnel development. The average response indicated that the internal audit department is used for leadership development to a limited extent (2.55/7.0 with 1 = “a very limited extent,” 4 = “a moderate extent,” and 7 = “a very great extent”). The use of internal audit departments for personnel development is greater for public companies (mean = 2.75) than for privately held compa-nies (mean = 2.27), but is not a major objective across the internal audit departments in our sample.
For further exploration, we asked participants to describe the staffing philosophy of the organization. That is, we asked whether the internal audit department typically hires internal auditors to perform a rotation in the department before transitioning into another posi-tion in the organization, or hires “career auditors.” Further, we asked whether auditors are usually hired from within the organization or outside, and as entry-level or experienced personnel. Table 14 illustrates the results of this analysis and reveals that approximately 46 percent of companies in our sample view internal auditing as a career position, consistent with the relatively limited extent of use of the internal audit department for leadership devel-opment. However, we do find that 44 percent of public companies hire experienced auditors with the intention of rotating them into other positions within the company at some point.
Table 14: Internal Audit Staffing Philosophy
Employees Rotate Through the Organization
Employees Remain in Internal Auditing
Internal Audit Hiring Strategy
Org. Employee
Entry Level Exp. Hire
Entry Level
Exp. Hire Other
Publicly Held 5.77% 2.89% 44.23% 3.85% 30.77% 12.50%
Privately Held 1.64% 6.56% 9.84% 4.92% 60.66% 16.39%
Total Sample 4.82% 4.22% 31.33% 4.22% 41.57% 13.86%
Total Sample Summary 40.37% 45.79% 13.86%

Effective Sizing of Internal Audit Departments
48
Internal Audit Use of Tools. In addition to the characteristics of internal audit personnel, it is also important to consider the tools that they use to complete their tasks. To understand that issue, we collected data regarding the extent to which the internal audit department leverages automated internal audit tools. There are a variety of resources and tools avail-able to internal auditors to improve the efficiency of audits. Further, many of these tools can improve the effectiveness of the audits by allowing auditors to examine the complete population of transactions, thereby performing a thorough review of the entire organiza-tion, rather than being limited by sample size. We asked participants to indicate how much they use each of the following: 1) data extraction and analysis tools; 2) fraud detection and prevention tools; 3) audit management tools (e.g., automated workpapers or scheduling tools); 4) control self-assessment tools; 5) Sarbanes-Oxley compliance tools; and 6) contin-uous monitoring tools. Figure 15 reveals the percentage of organizations reporting at least a moderate usage of each type of internal audit tools. As shown, data extraction tools are the most commonly used technology tools, with approximately 63 percent of organiza-tions indicating at least a moderate usage. Audit management tools (such as electronic workpapers and automated risk assessment tools) are the second most frequently used, with approximately 45 percent of respondents indicating at least a moderate usage. Again, most internal audit departments have not invested in continuous control monitoring.
Critical Factor Seven: Internal Audit Service Quality
The last critical factor in the model focuses on perceptions of internal audit quality. To assess this factor, we asked participants to provide their own assessments of the value provided by internal auditing. Specifically, internal auditors indicated whether or not they believe internal auditing is meeting or exceeding its potential. As evidenced in Figure 16, approximately 55 percent indicate that the internal audit department operates slightly, somewhat, or significantly below its full potential.13 Approximately 15 percent of partici-pants say the internal audit department meets its potential, and only 2 percent say internal auditing is significantly exceeding expectations. Thus, internal auditors’ perceptions of the quality of their own departments leave room for improvement.
13 Again, these are perceptions of CAEs who, if anything, would most likely overvalue the contri-butions of internal auditing compared to management and/or audit committee evaluations.

49
V. Results
Figure 15: Usage of Internal Audit Tools
Dat
a Ex
trac
tion
and
Ana
lysi
s Too
ls
Frau
d D
etec
tion/
Pr
even
tion
Tool
s
Audi
t Man
agem
ent
Tool
s/W
orkp
aper
s &
Sc
hedu
ling
Cont
rol S
elf-
asse
ssm
ent T
ools
Sarb
anes
-Oxl
ey
Com
plia
nce
Tool
s
Cont
inuo
us
Mon
itorin
g To
ols
0%
10%
20%
30%
40%
50%
60%
70%
% Organizations With at Least Moderate Usage

Effective Sizing of Internal Audit Departments
50
Figure 16: Assessment of Internal Audit Quality
0%
10%
20%
30%
40%
Extent to Which Internal Auditing Meets Its Potential
Significantly Below
Somewhat Below
Slightly Below
Meets Potential
Slightly Above
Somewhat Above
Significantly Above
Model Conclusion: The Size of the Internal Audit Department
Internal Audit Staffing Size and Budgets. The ultimate goal of our conceptual model is to help determine the effective size of the internal audit department. Ultimately, given an organization’s value proposition for internal auditing, its staffing philosophy, and other factors, we would like to identify characteristics that lead to a specific size of internal audit department that is meeting or exceeding its value proposition expectations. More impor-tantly, we would like to predict the factors that seem to be most valued by management. In this section, we present descriptive data on various measures of internal audit department size in our sample organizations. Table 15 shows the total number of internal auditors for the full sample and various industry categories. The results reveal that, on average, sample organizations have about 19 internal auditors on their staff, with the largest audit depart-ments in the manufacturing sector (32 auditors on average) and the smallest in health care (seven auditors on average).

51
V. Results
Table 15: Number of Internal Audit Staff
IndustryHealth
Care Manuf. Retail Services Transportation OtherTotal
Sample
Internal Audit Staff, including Chief Audit Executive
6.68 32.43 10.82 13.58 19.60 11.75 18.65
Internal Audit Staff per 1,000 Employees
.91 2.24 .50 1.25 .73 3.5 2.23
Table 16 documents the 2007 and 2008 internal audit budgets (in hours and USD) and the actual internal audit activities performed (in hours and USD) in 2006 and 2007. Average actual expenses (related to activities performed in 2006 and 2007) remained flat over the past two years. However, average hours have increased. As a result, average cost per hour has decreased from approximately $119 per hour to $102 per hour.
Internal Audit Resource Adequacy. While the preceding information provides descriptive evidence concerning the actual staffing and budgetary resources allocated to internal audit departments currently, we also asked participants to assess whether they believe those resources are adequate. The results (untabulated) reveal that 37.4 percent of respondents believe that the current number of internal audit staff is appropriate, while approximately 61 percent believe more internal auditors are needed, with only 1.6 percent stating that the current internal audit department is overstaffed.14 With respect to the amount of mone-tary resources dedicated to internal auditing, 47.9 percent indicate that more resources are needed, 50.5 percent believe the current resource allocation is appropriate, and 1.6 percent say that fewer resources are necessary. Figure 17 illustrates the specific internal audit skills that should be added for organizations expressing a need for more internal auditors. For example, approximately 33 percent of organizations needing additional internal audit staff need IT audit skills and 30 percent need specialized audit skills.15
14 Given the large percentage of respondents who believe their internal audit department is understaffed, the question may arise about how the data in this study can be used to estimate the effective size of an internal audit activity. We address this concern by focusing our analysis (in Section VI) using only organizations in which the stated mission and activities performed by internal auditing are closely aligned. It is in these organizations where we believe internal auditing is best suited to be meeting the control objectives of the organization. That alignment should predict the best fit for the conceptual model. The model should predict how much internal audit staffing would (should) change when there is less alignment.
15 Advanced audit skills include analytical reviews, audit inquiries, etc.

Effective Sizing of Internal Audit Departments
52
Tabl
e 16
: Int
erna
l Aud
it B
udge
t and
Act
ual E
xpen
ses
Aver
age
Inte
rnal
Aud
it
Hou
rs &
Dol
lars
Min
imum
Inte
rnal
Aud
it
Hou
rs &
Dol
lars
Max
imum
Inte
rnal
Aud
it
Hou
rs &
Dol
lars
Av
erag
eIA
$/
Hou
r%
In
crea
se
Min
.IA
$/
Hou
r%
In
crea
se
Max
IA$/
Hou
r%
In
crea
se
Tota
l IA
Act
iviti
es —
H
RS 2
006
23,9
16
$ 11
8.96
16%
22
5$
177.
78
33%
25
0,00
0$
80.
00
20%
Tota
l IA
Act
iviti
es —
H
RS 2
007
27,7
52$
102.
45
300
$ 66
.67
30
0,00
0$
95.
33
Tota
l IA
Act
iviti
es —
U
SD 2
006
$ 2,
845,
018
—
0%
$
40,0
00
—
-50%
$
20,0
00,0
00
—
43%
Tota
l IA
Act
iviti
es —
U
SD 2
007
$ 2,
843,
038
—
$ 20
,000
$
28,6
00,0
00
—
Tota
l IA
Bud
get —
H
RS 2
007
26,0
26$
101.
58
-7%
30
0$
316.
67
0%
25
0,00
0$
114.
80
20%
Tota
l IA
Bud
get —
H
RS 2
008
24,3
30$
103.
98
300
$ 28
3.33
300,
000
$ 9
6.00
Tota
l IA
Bud
get —
U
SD 2
007
$ 2,
643,
814
—
4%
$
95,0
00
—
-11%
$
28,7
00,0
00
—
0%
Tota
l IA
Bud
get —
U
SD 2
008
$ 2,
529,
892
—
$ 85
,000
—
$ 28
,800
,000
—

53
V. Results
Figure 17: Skills Needed by Internal Audit Departments
0%
5%
10%
15%
20%
25%
30%
35%IT
Aud
it
Trad
ition
al A
udit
Adva
nced
Aud
it
Spec
ializ
ed A
udit
Frau
d In
vest
igat
ions
Com
plia
nce
Audi
t
Cultu
ral
Know
ledg
e/La
ngua
ge
% Needing Additional Personnel with This Skill


55
vi. tESting thE concEptual modEl
The conceptual model is based on our knowledge gained from interviews and previous research. In theory, the model provides a framework of issues we should think about in determining the effective size of an internal audit department. However, we need to go from theory to practice. In other words, can the conceptual model be used to predict the effective size of an internal audit department given its value proposition, staffing philos-ophy, and the other factors identified in developing the model? If yes, can we further refine the model to determine the effective size that might reflect better alignment between management and audit committee values for internal auditing and the delivery of those value-added activities?
The most powerful way to first test the validity of the conceptual model is to use regres-sion analysis that incorporates real-world data gathered for the specific purpose of testing the model (much of the data are described herein). In performing this analysis, we pursue the association between the critical factors in our conceptual model (i.e., characteristics of the organization, characteristics of the organization’s governance structure, the mission of the internal audit department, the value proposition of the internal audit department, potential misalignment with the value propositions, characteristics of the internal audit department, and internal audit service quality) and the size of the internal audit depart-ments in our sample organizations. We not only want to know the association of these factors, but which ones really make a significant difference in predicting the relative size of an internal audit department that best meets or exceeds management’s expectations.
Measuring the Effective Size of an Internal Audit Department
We considered several different measures for the effective size of an internal audit depart-ment, including the number of internal auditors (in terms of full-time equivalents), internal audit monetary budgets, and internal audit actual monetary expenses. Analysis of the correlations between these variables indicates that they are significantly correlated (for all, p<.01).16 An analysis of the data indicates that the participants were most reliable in providing accurate and complete data on the number of internal auditors on their staffs,
16 These significant correlations include firms that engage third-party service providers to perform a portion of the internal audit services.

Effective Sizing of Internal Audit Departments
56
and because the data were highly correlated, we decided to use that figure as our primary predicted outcome. However, when significant differences between inferences across the alternative effective size measures were noted in our analysis, we performed more in-depth analysis and discuss it further (see below).
Explanatory Factors
Table 17 documents the factors that significantly influence the size of the internal audit department and the manner in which each influences the size (positively or negatively). Further, using a linear regression model, we calculate coefficients associated with each of the variables noted above.17
The first column of Table 17 notes each variable; the second column notes the direction of the effect of that variable on the size of the internal audit department; and the third column provides an interpretation. The following paragraphs provide additional descrip-tions of these variables and the intuition behind their affect on internal audit size.
Table 17: Factors Significantly Influencing Internal Audit Department Size (FTE)
VariablesDirection of Effect Interpretation of Result
Characteristics of the Organization
Publicly Traded versus Private Organizations
+ Internal audit size increases for publicly traded companies (as compared to private companies).
Total Assets for the Current Year
+ Internal audit size increases as the size of the organization (in assets) increases.
Internal Control Decentralization
+ Internal audit size increases as the control structure of the organization becomes more decentralized.
Location – Internal audit size is smaller for organizations with (both) headquarters and operations primarily outside the United States.
17 The explanatory factors included in this analysis are those that are found to be statistically signif-icant through our regression analysis. Many other factors were considered (see Section V of this paper) during our model testing process, but they did not have a significant influence on the size of the internal audit function.
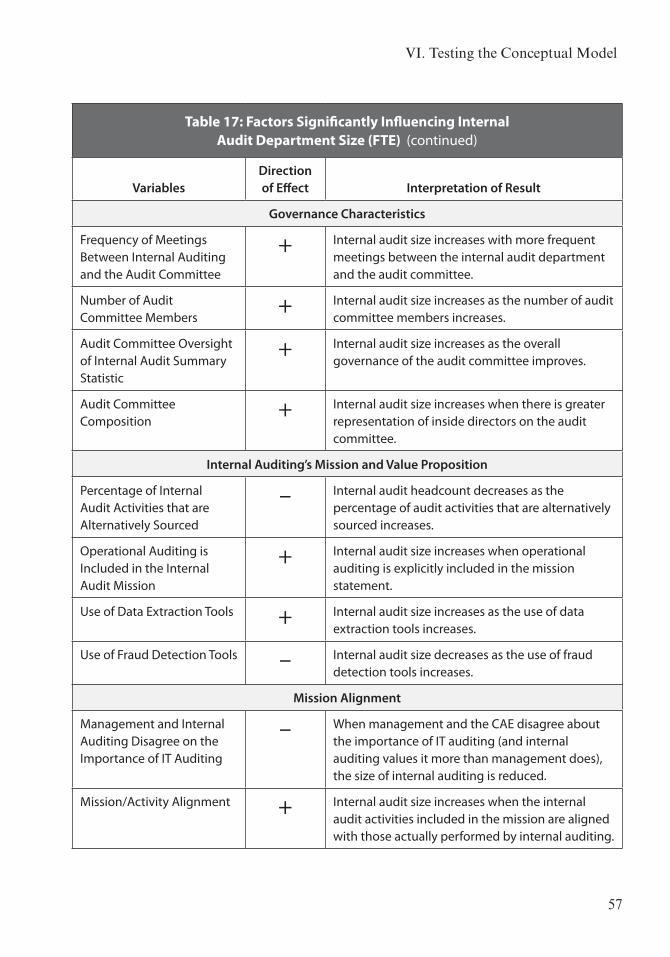
57
VI. Testing the Conceptual Model
Table 17: Factors Significantly Influencing Internal Audit Department Size (FTE) (continued)
VariablesDirection of Effect Interpretation of Result
Governance Characteristics
Frequency of Meetings Between Internal Auditing and the Audit Committee
+ Internal audit size increases with more frequent meetings between the internal audit department and the audit committee.
Number of Audit Committee Members
+ Internal audit size increases as the number of audit committee members increases.
Audit Committee Oversight of Internal Audit Summary Statistic
+ Internal audit size increases as the overall governance of the audit committee improves.
Audit Committee Composition
+ Internal audit size increases when there is greater representation of inside directors on the audit committee.
Internal Auditing’s Mission and Value Proposition
Percentage of Internal Audit Activities that are Alternatively Sourced
– Internal audit headcount decreases as the percentage of audit activities that are alternatively sourced increases.
Operational Auditing is Included in the Internal Audit Mission
+ Internal audit size increases when operational auditing is explicitly included in the mission statement.
Use of Data Extraction Tools + Internal audit size increases as the use of data extraction tools increases.
Use of Fraud Detection Tools – Internal audit size decreases as the use of fraud detection tools increases.
Mission Alignment
Management and Internal Auditing Disagree on the Importance of IT Auditing
– When management and the CAE disagree about the importance of IT auditing (and internal auditing values it more than management does), the size of internal auditing is reduced.
Mission/Activity Alignment + Internal audit size increases when the internal audit activities included in the mission are aligned with those actually performed by internal auditing.

Effective Sizing of Internal Audit Departments
58
Table 17: Factors Significantly Influencing Internal Audit Department Size (FTE) (continued)
VariablesDirection of Effect Interpretation of Result
Characteristics of Internal Audit Department/Personnel
Percentage of Auditors with CIA Designation
– Internal audit size decreases as the percentage of CIAs in the department increases.
Reliance on Noninternal Audit Department for Management of Joint-venture Compliance
– Internal audit size decreases as activities regarding joint-venture compliance are performed by departments outside of internal auditing.
Internal Audit Service Quality
Internal Audit Value + Internal audit size increases when internal auditing meets or exceeds its potential.
Characteristics of the Organization. Several important company characteristics signifi-cantly influence the size of the internal audit department. First, whether the organization is publicly or privately held impacts the size of the department, such that publicly held companies require more internal auditors than similar privately held companies. Second, the size of the organization, as described by its total assets in the current year, is positively related to the size of the internal audit department. That is, organizations with greater total assets require larger internal audit departments. Third, the complexity of the orga-nization’s control structure is positively associated with internal audit department size. Specifically, organizations with a decentralized control structure have larger internal audit departments than those with partially decentralized or centralized control structures. Fourth, we find that organizations that are headquartered and operate primarily outside the United States have smaller internal audit departments than those headquartered and operating in the United States. This may be due to the heightened regulatory environment in the United States, although we cannot be absolutely certain about the reason.
Characteristics of the Governance Structure. The governance structure of the company has a strong, positive influence on the size of the internal audit department, suggesting that organizations that have made a commitment to good governance also value internal auditing and, therefore, invest resources in the internal audit department. Specifically, internal audit department size is increasing with the number of audit committee members and the frequency of meetings between the audit committee and the CAE.

59
VI. Testing the Conceptual Model
We also measured the effectiveness of audit committee oversight by creating a summary statistic based on answers to the following five yes/no questions:
1. Does the audit committee review the internal audit charter?2. Does the audit committee review the internal audit budget?3. Is the audit committee responsible for hiring and firing the CAE?4. Does the audit committee have access to sensitive information (e.g., regulatory
actions, etc.)?5. Does the audit committee have access to the information necessary for monitoring
management’s objectives, strategies, and financial activities?
This oversight statistic is a significant explanatory factor in predicting internal audit department size. The audit committees that provide greater oversight of internal auditing and have more access to sensitive information for oversight and monitoring are associated with larger internal audit departments.18
Finally, our analysis indicates that the composition of the audit committee influences the size of the internal audit department. Specifically, audit committees that have a larger percentage of inside directors (compared to outside directors) have larger internal audit departments.
Internal Audit Mission and Value Proposition. The formal mission of an internal audit department will vary among organizations, depending upon the organization’s strategies and goals. We find that organizations that explicitly include operational auditing in the internal audit mission have larger internal audit departments than those that do not hold internal auditing responsible for auditing operational processes. Further, the extent to which internal audit activities are performed by alternatively sourced resources reduces the size of internal audit headcount within the organization.19
Our results also suggest that the types of technologies used by the internal audit depart-ment, and the extent to which they are used, is related to the size of the internal audit department. First, larger internal audit departments tend to use more automated data extraction and analysis tools. This result suggests that internal audit departments may
18 We also examined other board governance variables and tested them in our statistical model. However, they add little additional explanatory power to the model, so we do not include those variables in our discussion here.
19 Additional analyses using 1) annual internal audit budget and 2) actual internal audit expenses as the dependent variable yielded consistent results, indicating that the overall budget and actual expenses are lower when third-party sourcing is used to some extent.

Effective Sizing of Internal Audit Departments
60
not necessarily use these tools to reduce the amount of time and effort needed to perform (traditional) audit activities. Rather, it is likely that by using these tools, internal audit departments are performing more rigorous audits. For example, by using data extraction and analysis tools, auditors can more easily examine the complete population of transac-tions, rather than using sampling techniques that would be necessary absent such tools. The tools provide an opportunity for internal auditors to extend their coverage with more meaningful analysis for management and the board. We posit that the more meaningful analysis may tend to build on itself (i.e., as the value proposition increases, management and boards will look for, and invest in, further value-added activities).
Somewhat surprising to us, we found that the use of fraud detection and prevention tools is negatively related to the number of internal auditors needed in an organization. This suggests that automated fraud detection tools improve the efficiency of fraud detection and therefore reduce the number of auditors needed to identify fraud. Further, the use of such tools may effectively prevent fraud, resulting in lower levels of fraud and reducing the need for internal auditors to perform fraud-related investigations. We believe this is an area worthy of further exploration.
Mission (Mis)Alignment. We also investigated the extent to which differences between management and the internal audit department’s priorities may influence the size of the internal audit department. As previously described, for most activities, respondents reported that there was considerable agreement between management’s beliefs and those of the internal audit department. However, we find a significant effect (on internal audit department size) when management and the internal audit department disagree on the importance of IT auditing and security. Specifically, we find that internal audit depart-ments are smaller in organizations where internal auditing believes IT auditing and security is more important than management does. This suggests that management may either a) be undervaluing IT auditing and security audits by internal auditing, or b) see little value in the internal audit work because the value is not delivered by internal auditing, or assur-ance is gathered through other sources (e.g., external audits of IT or separate IT security functions within IT). Our data are not sufficient to conclude which of these explanations is most likely correct. Whatever the explanation, it is clear that when management believes less value is being delivered than internal auditing believes it is delivering, then the internal audit department will be smaller.20
20 During our interviews and our review of the literature, we found that very few internal audit departments were performing systematic surveys of the perceived value of their work and how they might improve their value-added to the organization.

61
VI. Testing the Conceptual Model
We also examine the extent to which a gap between the internal audit mission and the actual activities performed by the internal audit department are related to the size of the internal audit department. We compare each activity listed in the mission with the actual activities the internal audit department performs. We find that when the activities of the internal audit department do not align with the mission, the internal audit departments are smaller compared to organizations where there is — relatively — closer alignment between the activities. It is likely that in these organizations, the internal audit department is not able to meet the expectations of management because it is not performing the activi-ties that have been determined to be most important by the organization.
Characteristics of Internal Audit Department/Personnel. We find that characteristics of the internal audit department personnel affect its relative size. Specifically, we find that the percentage of internal auditors employed within the organization that are certified internal auditors (CIAs) is negatively related to the number of internal auditors in the department. This result suggests that as the level of professionalism within the internal department increases, the number of auditors needed to execute internal audit activities decreases. We also find that internal audit departments tend to be smaller when organiza-tions use other departments to perform risk management and compliance activities related to joint ventures.21
Internal Audit Service Quality. Internal audit quality is positively associated with the size of the internal audit department.22 This suggests that the more an internal audit department meets or exceeds its potential, the more likely that success continues to build such that management and the board are willing to make larger investments in internal auditing. Alternatively, it may also suggest that the internal audit department has suffi-cient resources to meet or exceed management’s expectations.
21 We performed a separate analysis examining only those organizations in which there was alignment between the internal audit mission and the internal audit activities. When considering only these organizations, we also find that internal audit departments are smaller when activities related to IT security and quality control are performed outside the internal audit department.
22 Recall that we measured the quality of internal auditing as self-reported by the internal audit CAE. We tried to corroborate this self-reported measure with similar results from audit committee members or senior management, but we were not able to achieve a sufficiently large response to statistically measure the responses. Thus, the fact that we found the variable to be significant using only self-reported information provides indirect evidence on the strength of the finding.

63
vii. concluSion
The purpose of this whitepaper is to develop and test a conceptual model of internal audit effective sizing. We begin by describing the process by which we developed the conceptual model. We then articulate the relationships among the components of the model, including describing seven critical factors that determine the size of an internal audit department: 1) characteristics of the organization; 2) characteristics of the governance structure of the organization; 3) the mission of the internal audit department as seen by management, the audit committee, and the internal audit department; 4) the internal audit value proposition as executed by the internal audit department; 5) the alignment of internal auditing with management and audit committee expectations; 6) various characteristics of the internal audit department (e.g., staffing); and 7) internal audit service quality.
Next, we discuss the methodology that we used to test the conceptual model, including development of a survey that was completed by 236 CAEs at a variety of organizations operating throughout the United States. We then provide a detailed discussion of the survey results, along with a description of the results of statistical tests that validate the model.
Our research results indicate:
• Internal audit size (i.e., number of full-time equivalents or “headcount”) increases:
o For public companies (as compared to privately held companies).o For U.S.-based companies (as compared to companies based outside the
United States).o As the size of the organization (in assets and inventory) increases.o As the control structure of the organization becomes more decentralized.o As the size of the audit committee increases.o As audit committee oversight of the internal audit department increases.o As the frequency of private meetings between the internal audit department
and audit committee increases.o When the mission and activities of the internal audit department are aligned.o When operational auditing is explicitly included in the mission statement.o As the use of data extraction tools increases.o When the internal audit department meets or exceeds its potential (i.e., when
internal auditing consistently exceeds the expectations of key stakeholders such as audit committees or senior management).

Effective Sizing of Internal Audit Departments
64
• Internal audit size (i.e., number of full-time equivalents or “headcount”) decreases:
o As the percentage of audit activities that are outsourced increases (as the survey responses were based on headcount, not effective FTEs).
o As the use of fraud detection tools increases (such as automated software and other fraud monitoring tools).
o When management and the CAE disagree about the importance of IT auditing (and management places less value on IT auditing than does internal auditing).
o As the percentage of CIAs in the department increases.o As more reliance is placed on noninternal audit joint venture compliance
activities.o As the (percentage) representation of inside directors on the audit committee
increases.
Our results reveal that there are some limitations to traditional benchmarking models that compare organizations within an industry and based on size. Our model finds that the effective size of an internal audit department is influenced by many variables that are specific to each organization, such as the items included in the internal audit mission, tools used by internal auditing, and the reliance on noninternal audit departments to perform risk management activities.
Importantly, we believe the data that has been developed and tested can be used by orga-nizations and internal audit departments to perform some self-examination that can lead to a) more goal congruence between internal auditors and management; b) periodic self-assessment by internal auditing, coupled with surveys of management to understand value being delivered by internal auditing; and c) alternative ways to include both the efficiency and the effectiveness of the internal audit department. We encourage internal auditors to perform such self-examination and work toward a continuous improvement model that is required of all businesses today.
65
viii. rEfErEncES
Anderson, S. W., M. H. Christ, and K. L. Sedatole. 2006. Managing Strategic Alliance Risk: Survey Evidence of Control Practices in Collaborative Inter-organizational Settings. The Institute of Internal Auditors Research Foundation Whitepaper. http://www.theiia.org/bookstore/product/managing-strategic-alliance-risk-survey-evi-dence-of-control-practices-in-collaborative-interorganizational-settings-1404.cfm.
Bedard, J. C., and K. M. Johnstone. 2004. Earnings manipulation risk, corporate gover-nance risk, and auditors’ planning and pricing decisions. The Accounting Review (79, 2): 277–304.
Carcello, J. V., D. R. Hermanson, and K. Raghunandan. 2005. Factors associated with U.S. public companies’ investment in internal auditing. Accounting Horizons (19, 2): 69–84.
The Institute of Internal Auditors. 1999. Definition of Internal Auditing. Altamonte Springs, FL: The Institute of Internal Auditors.
The Institute of Internal Auditors. 2009. International Professional Practices Framework. Altamonte Springs, FL: The Institute of Internal Auditors.
Marks, N. “How much is enough,” Internal Auditor, February 2000.


67
The vision of The IIA Research Foundation is to understand, shape, and advance the global profession of internal auditing by initiating and sponsoring intelligence gathering, innovative research, and knowledge-sharing in a timely manner. As a separate, tax-exempt organization, The Foundation does not receive funding from IIA membership dues but depends on contributions from individuals and organizations, and from IIA chapters and institutes, to move our programs forward. We also would not be able to function without our valuable volunteers. To that end, we thank the following:
rESEarch SponSor rEcognition
Research SponsorsAssociation of College and University Auditors
University of California SystemIIA NorwayIIA ChicagoIIA Houston
IIA Philadelphia
Visionary CirclePaul J. Sobel, CIA
Chairman’s CircleStephen D. Goepfert, CIA
Patricia E. Scipio, CIA3M Company
Cargill Inc.Chevron Corporation
ExxonMobil CorporationItau Unibanco Holding SA
JCPenney CompanyLockheed Martin Corporation
Microsoft CorporationPricewaterhouseCoopers LLP
Southern California Edison Company
Diamond DonorIIA New YorkIIA San Jose

Effective Sizing of Internal Audit Departments
68
thE iia rESEarch foundation board of truStEES
president: Patricia E. Scipio, CIA, PricewaterhouseCoopers LLP
vice president-Strategy: Mark J. Pearson, CIA, Boise Inc.
vice president-research: Philip E. Flora, CIA, CCSA, Texas Guaranteed TG
vice president-development: Wayne G. Moore, CIA, Wayne Moore Consulting
treasurer: Stephen W. Minder, CIA, YCN Group LLC
Secretary: Douglas Ziegenfuss, PhD, CIA, CCSA, Old Dominion University
Neil Aaron, The McGraw-Hill CompaniesRichard J. Anderson, CFSA, DePaul University
Urton L. Anderson, PhD, CIA, CCSA, CFSA, CGAP, University of Texas-AustinSten Bjelke, CIA, IIA Sweden
Michael J. Head, CIA, TD Ameritrade Holding CorporationJames A. LaTorre, PricewaterhouseCoopers LLP
Marjorie Maguire-Krupp, CIA, CFSA, Coastal Empire ConsultingLeen Paape, CIA, Nyenrode Business University
Jeffrey Perkins, CIA, TransUnion LLCEdward C. Pitts
Michael F. Pryal, CIA, Michael Pryal & AssociatesCarolyn Saint, CIA, Lowe’s Companies, Inc.
Mark L. Salamasick, CIA, University of Texas at DallasSusan D. Ulrey, CIA, KPMG LLP
Jacqueline K. Wagner, CIA, Ernst & Young LLPShi Xian, Nanjing Audit University
69
The IIA Research Foundation Board of Research and Education Advisors
thE iia rESEarch foundation board of rESEarch and Education adviSorS
chairman: Philip E. Flora, CIA, CCSA, Texas Guaranteed TG
vice-chairman: Urton L. Anderson, PhD, CIA, CCSA, CFSA, CGAP, University of Texas-Austin
George R. Aldhizer III, PhD, CIA, Wake Forest UniversityLalbahadur Balkaran, CIA
Kevin W. Barthold, CPA, City of San AntonioThomas J. Beirne, CFSA, The AES CorporationAudley L. Bell, CIA, Habitat for Humanity Intl.
Toby Bishop, Deloitte & Touche LLPSezer Bozkus, CIA, CFSA, KPMG
John K. Brackett, CFSA, RSM McGladrey, Inc.Adil S. Buhariwalla, CIA, Emirates Airlines
Thomas J. Clooney, CIA, CCSA, KPMG LLPJean Coroller, Ernst & Young LLP
Mary Christine Dobrovich, Jefferson Wells Int’lSusan Page Driver, CIA, Texas General Land OfficeDonald A. Espersen, CIA, despersen & associates
Randall R. Fernandez, CIA, Adams HarrisJohn C. Gazlay, CPA, CCSA
Dan B. Gould, CIAUlrich Hahn, CIA, CCSA, CGAP
John C. Harris, CIA, Aspen Holdings/FirstComp Insurance CompanySabrina B. Hearn, CIA, University of Alabama System
Katherine E. Homer, Ernst & Young LLPPeter M. Hughes, PhD, CIA, Orange County
David J. MacCabe, CIA, CGAPGary R. McGuire, CIA, Lennox International Inc.
John D. McLaughlin, Smart Business Advisory and Consulting LLCSteven S. Mezzio, CIA, CCSA, CFSA, Resources Global Professionals
Deborah L. Munoz, CIA, CalPortland CompanyFrank M. O’Brien, CIA, Olin Corporation
Michael L. Piazza, Professional Development InstituteAmy Jane Prokopetz, CCSA, Farm Credit Canada
Mark R. Radde, CIA, Resources Global ProfessionalsVito Raimondi, CIA, Zurich Financial Services NA
Sandra W. Shelton, PhD, DePaul UniversityLinda Yanta, CIA, Eskom