effective training and use of rgb satellite products for ...€¢ what are the red/green/blue (rgb)...
TRANSCRIPT
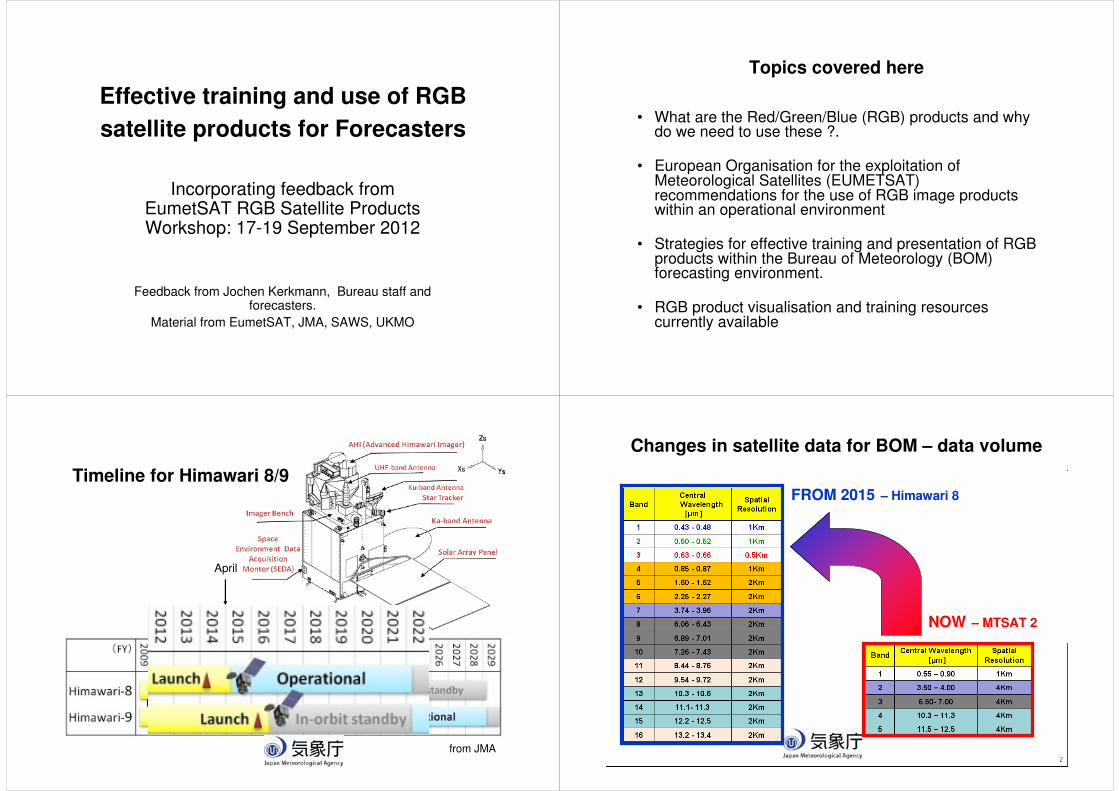
Effective training and use of RGB
satellite products for Forecasters
Incorporating feedback from EumetSAT RGB Satellite Products Workshop: 17-19 September 2012
Feedback from Jochen Kerkmann, Bureau staff and forecasters.
Material from EumetSAT, JMA, SAWS, UKMO
Topics covered here
• What are the Red/Green/Blue (RGB) products and why do we need to use these ?.
• European Organisation for the exploitation of Meteorological Satellites (EUMETSAT) recommendations for the use of RGB image products within an operational environment
• Strategies for effective training and presentation of RGB products within the Bureau of Meteorology (BOM) forecasting environment.
• RGB product visualisation and training resources currently available
from JMA
Timeline for Himawari 8/9
April
NOW – MTSAT 2
FROM 2015 – Himawari 8
Changes in satellite data for BOM – data volume
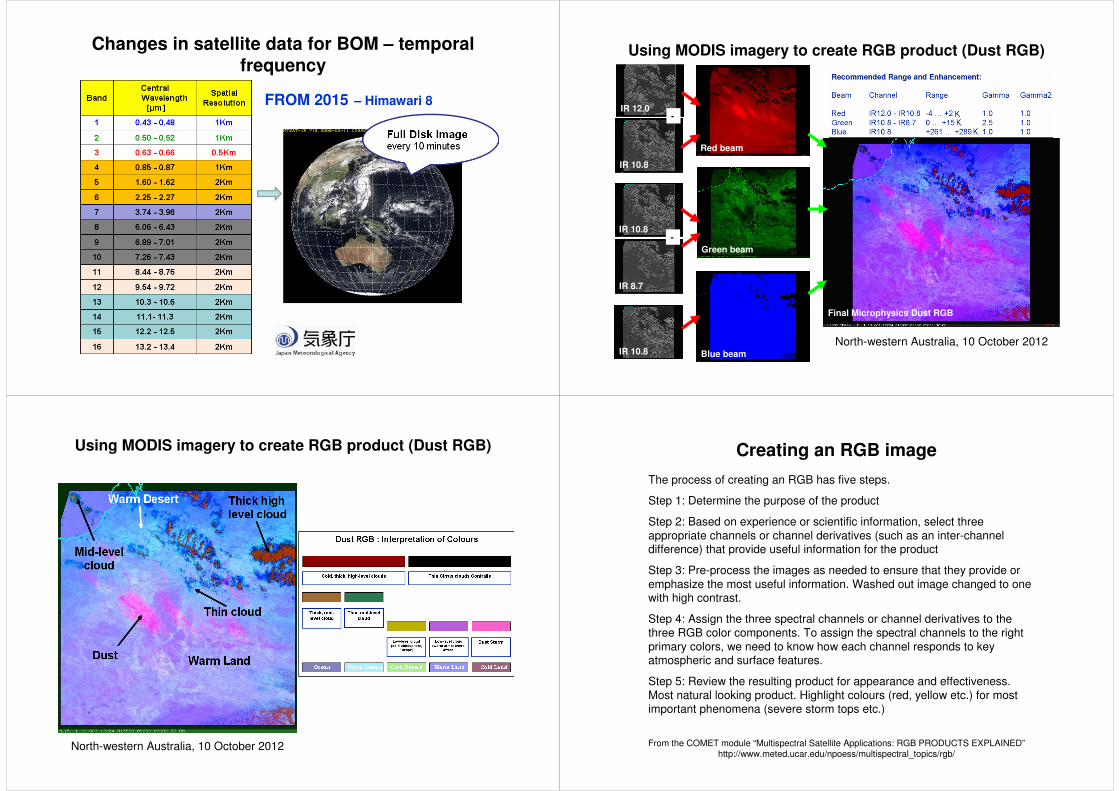
Changes in satellite data for BOM – temporal frequency
FROM 2015 – Himawari 8
Using MODIS imagery to create RGB product (Dust RGB)
IR 12.0
IR 10.8
IR 10.8
IR 10.8
IR 8.7
Red beam
Green beam
Blue beam
Final Microphysics Dust RGB
-
-
North-western Australia, 10 October 2012
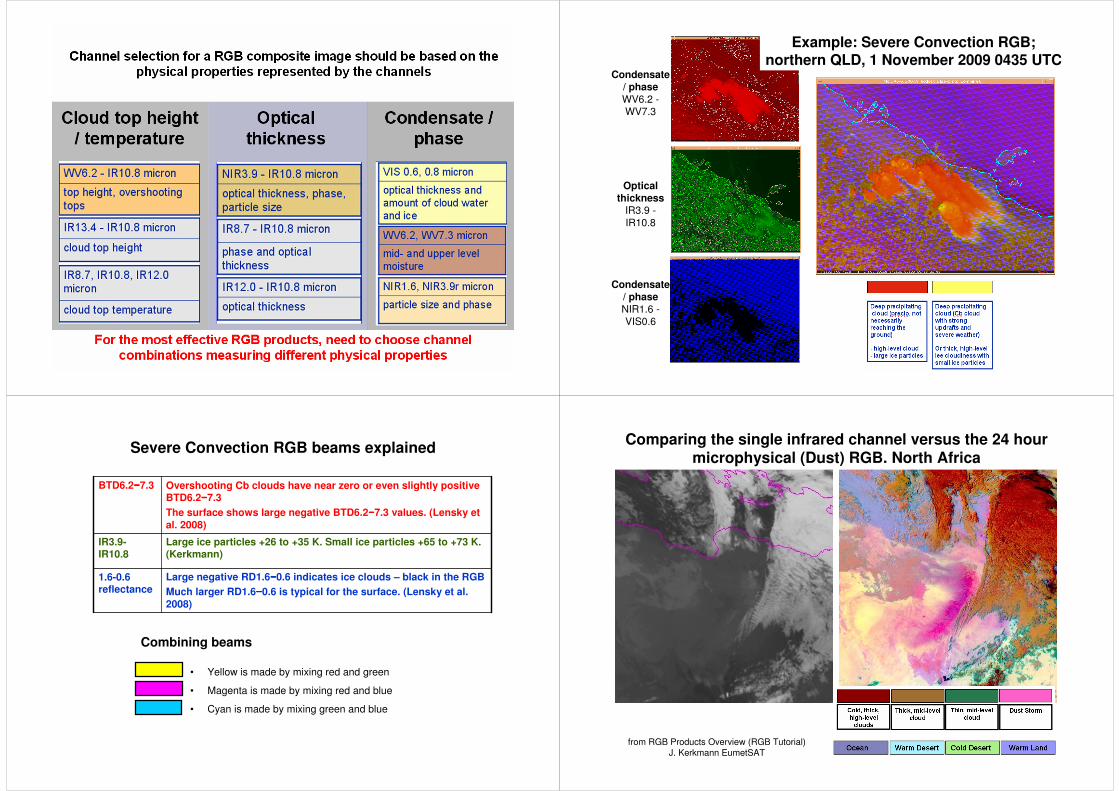
Using MODIS imagery to create RGB product (Dust RGB)
North-western Australia, 10 October 2012
Creating an RGB image
The process of creating an RGB has five steps.
Step 1: Determine the purpose of the product
Step 2: Based on experience or scientific information, select three
appropriate channels or channel derivatives (such as an inter-channel difference) that provide useful information for the product
Step 3: Pre-process the images as needed to ensure that they provide or
emphasize the most useful information. Washed out image changed to one with high contrast.
Step 4: Assign the three spectral channels or channel derivatives to the
three RGB color components. To assign the spectral channels to the right
primary colors, we need to know how each channel responds to key atmospheric and surface features.
Step 5: Review the resulting product for appearance and effectiveness.
Most natural looking product. Highlight colours (red, yellow etc.) for most important phenomena (severe storm tops etc.)
From the COMET module “Multispectral Satellite Applications: RGB PRODUCTS EXPLAINED”http://www.meted.ucar.edu/npoess/multispectral_topics/rgb/
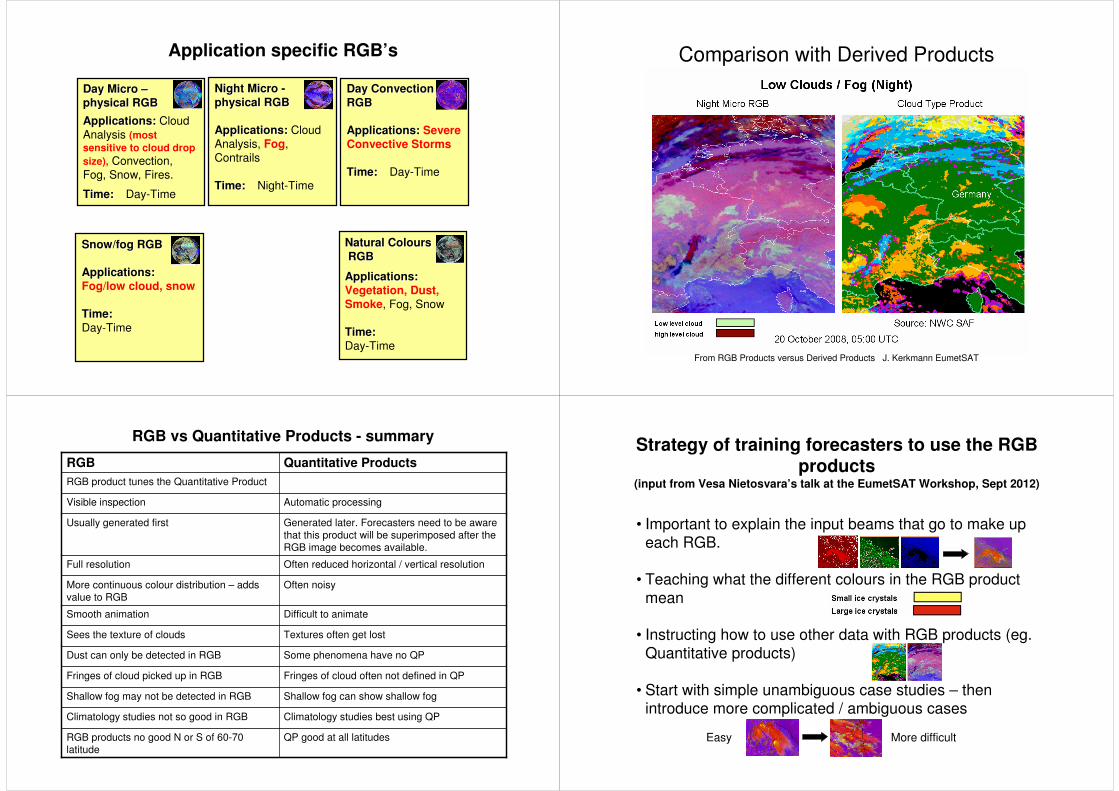
Condensate / phase
WV6.2 -
WV7.3
Optical thickness
IR3.9 -
IR10.8
Condensate / phase
NIR1.6 -
VIS0.6
Example: Severe Convection RGB; northern QLD, 1 November 2009 0435 UTC
Severe Convection RGB beams explained
• Yellow is made by mixing red and green
• Magenta is made by mixing red and blue
• Cyan is made by mixing green and blue
Large ice particles +26 to +35 K. Small ice particles +65 to +73 K. (Kerkmann)
IR3.9-IR10.8
Large negative RD1.6−−−−0.6 indicates ice clouds – black in the RGB
Much larger RD1.6−−−−0.6 is typical for the surface. (Lensky et al.
2008)
1.6-0.6 reflectance
Overshooting Cb clouds have near zero or even slightly positive BTD6.2−−−−7.3
The surface shows large negative BTD6.2−−−−7.3 values. (Lensky et
al. 2008)
BTD6.2−−−−7.3
Combining beams
from RGB Products Overview (RGB Tutorial)J. Kerkmann EumetSAT
Comparing the single infrared channel versus the 24 hour microphysical (Dust) RGB. North Africa

What are the advantages of using the RGB
image over the single channel image ?. What are the disadvantages ?.
Improvements• Texture of clouds (combines VIS and IR attributes)
• Higher information content – many colours.
• Defines features (dust cloud) that are not visible in the infrared.
Disadvantages
• Lots of colours / colour gradations – interpretation more difficult. More subjective. Animation of images may help – differentiate surface from atmosphere.
• Colourblind people will have major problems using this data
RGB products for Operational Forecasting –EumetSAT recommendation
Five application specific RGBs
24 hour Microphysical RGB Airmass RGB
Day
Microphysical
RGB
Night
Microphysical
RGB
Day Severe
Convection
RGB
Snow / fog
RGB
Natural
Colours RGB
Two RGB composites which complement each other
from RGB Products Overview (RGB
Tutorial)J. Kerkmann EumetSAT
EUMETSAT strategy of using RGB products – 2 “24-hour products” that are used all the time and 5
application specific RGB products.
At WMO level: agree on a strict minimum of harmonised RGB composites. The following strategies for the application of RGB
products to the forecasting routine were outlined:
Two RGB composites which complement each other are used
all of the time. These are the 24 hour Microphysics RGB and the Airmass RGB.
Five application specific RGB products (Day Microphysics RGB,
Night Microphysics RGB, Day Convective Storm RGB, Day Snow-Fog RGB, Natural Colours RGB) are used selectively
when appropriate.
24 hour RGB composites
North Africa South Atlantic
24-h Microphysics RGB
(Dust RGB) Airmass RGB
Cold, thick high-level
clouds
Thick mid level
cloud Cold Airmass
Jet (high PV)
Warm Airmass
Thick, high level clouds
Thick low level
clouds (cold
airmass)
Thick, mid level clouds
Low-level cloud
(cold atmosphere)
Warm Desert
Dust (day)
Dust (night)
Ocean / warm
land
From RGB Products Overview (RGB Tutorial) J. Kerkmann EumetSAT, also EumetSAT Image Library

Channel combination “recipes’ of the 24 hour
Microphysics (Dust) RGB vs the Airmass RGB
1.01.0+243 ... +208 KWV6.2Blue
1.01.0-40 ... +5 KIR9.7 – IR10.8Green
1.01.0-25 ... 0 KWV6.2 - WV7.3Red
Gamma 2GammaRangeChannelBeam
Airmass RGB
1.0+261 ... +289 KIR10.8Blue
2.50 ... +15 KIR10.8 – IR8.7Green
1.0-4 ... +2 KIR12.0 – IR10.8Red
Gamma 2GammaRangeChannelBeam
24 hour dust microphysics RGB
1.0
1.0
1.0
Actually, there are three 24 hour Microphysics RGB products with subtle differences.
8 November 2005, 12:00 UTC
From RGB Products Overview (RGB Tutorial) J. Kerkmann EumetSAT
Airmass RGB
24-h Microphysics RGB(Dust RGB)
24-h Microphysics RGB(Ash RGB)
24-h Microphysics RGB(Cloud RGB)
The reason why the ranges for the blue beams in the ash RGB and the dust RGB
are different. Dust clouds are usually lower and warmer than ash clouds.
The ranges for the green beam are different because dust over desert needs a
range of 0 to 15 K (to account for the low emissivity of sand in IR8.7) while SO2
clouds are better visible when the range is lower from -4 to +6K (J.Kerkmann pers.
comm. 2012)
24 hour Ash
Microphysics RGB
24 hour Dust
Microphysics RGB
24 hour Cloud
Microphysics RGB
1.0+243...+3031.0+261...+2891.0+248...+303IR10.8Blue
1.0-4 ... +5 K2.50 ... +15 K1.20 ... +6 KIR10.8 – IR8.7Green
1.0-4 ... +2 K1.0-4 ... +2 K1.0-4 ... +2 KIR12.0 – IR10.8Red
GammaRangeGammaRangeGammaRangeChannelBeam
Channel combination “recipes” for the three classes of 24-hour Microphysics RGB product
from Tri-spectral Window RGB Applications with MSG SEVIRI (24-h Microphysics RGB) J. Kerkmann
Application specific RGB’s
Day Microphysical RGB Night Microphysical RGB Day Convection RGB
Snow / fog RGB
Natural Colours RGB
Natural ColoursNatural Colours
RGBRGB
Applications:Applications:Vegetation, Dust, Smoke, Fog, Snow
Time:Time:Day-Time
Day Micro Day Micro ––
physical RGBphysical RGB
Applications: Applications: Cloud
Analysis (most
sensitive to cloud drop
size), Convection,
Fog, Snow, Fires.
Time:Time: Day-Time
Day Convection Day Convection
RGB RGB
Applications: Applications: Severe Convective Storms
Time:Time: Day-Time
Night Micro Night Micro --
physical RGBphysical RGB
Applications: Applications: Cloud
Analysis, Fog,
Contrails
Time:Time: Night-Time
Snow/fog RGBSnow/fog RGB
Applications:Applications:Fog/low cloud, snow
Time:Time:
Day-Time
Application specific RGB’s Comparison with Derived Products
From RGB Products versus Derived Products J. Kerkmann EumetSAT
RGB vs Quantitative Products - summary
Often reduced horizontal / vertical resolutionFull resolution
Generated later. Forecasters need to be aware
that this product will be superimposed after the
RGB image becomes available.
Usually generated first
RGB product tunes the Quantitative Product
Climatology studies best using QPClimatology studies not so good in RGB
Shallow fog can show shallow fogShallow fog may not be detected in RGB
QP good at all latitudesRGB products no good N or S of 60-70
latitude
Fringes of cloud often not defined in QPFringes of cloud picked up in RGB
Some phenomena have no QPDust can only be detected in RGB
Textures often get lostSees the texture of clouds
Difficult to animateSmooth animation
Often noisyMore continuous colour distribution – adds
value to RGB
Automatic processingVisible inspection
Quantitative ProductsRGB
Strategy of training forecasters to use the RGB products
(input from Vesa Nietosvara’s talk at the EumetSAT Workshop, Sept 2012)
• Important to explain the input beams that go to make up
each RGB.
• Teaching what the different colours in the RGB product
mean
• Instructing how to use other data with RGB products (eg.
Quantitative products)
• Start with simple unambiguous case studies – then introduce more complicated / ambiguous cases
Easy More difficult
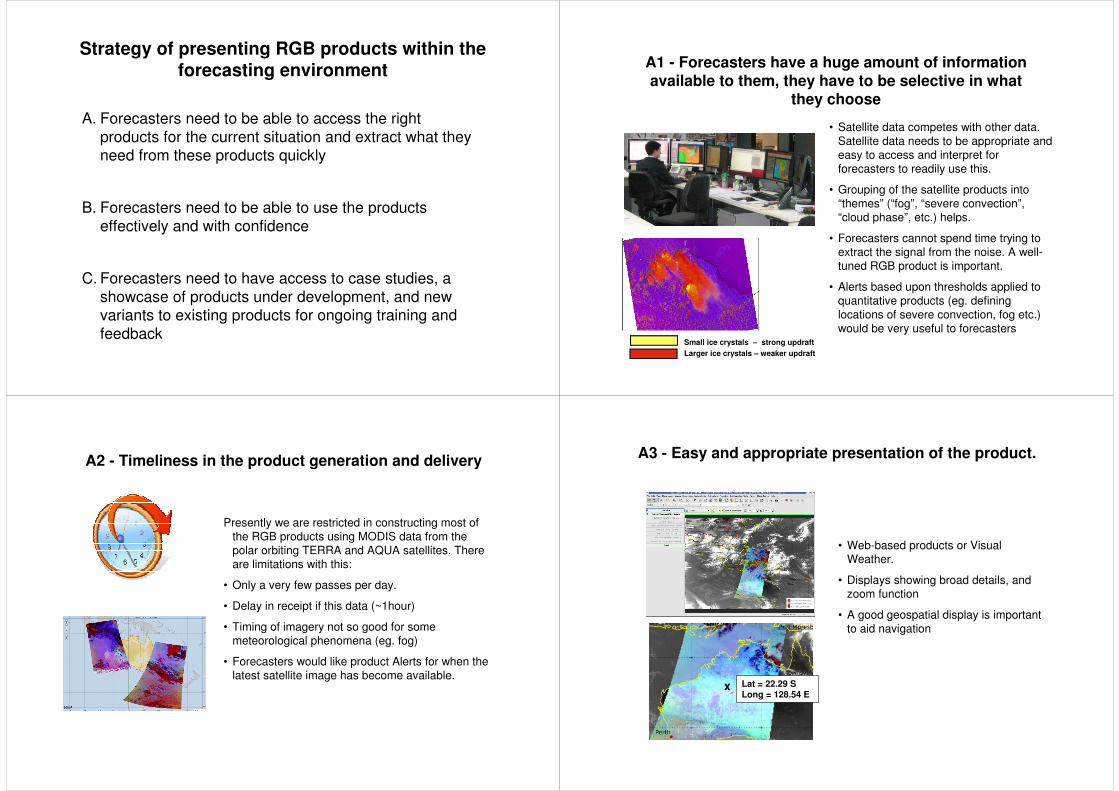
Strategy of presenting RGB products within the forecasting environment
A. Forecasters need to be able to access the right
products for the current situation and extract what they need from these products quickly
B. Forecasters need to be able to use the products
effectively and with confidence
C. Forecasters need to have access to case studies, a
showcase of products under development, and new variants to existing products for ongoing training and
feedback
• Satellite data competes with other data.
Satellite data needs to be appropriate and
easy to access and interpret for
forecasters to readily use this.
• Grouping of the satellite products into
“themes” (“fog”, “severe convection”,
“cloud phase”, etc.) helps.
• Forecasters cannot spend time trying to
extract the signal from the noise. A well-
tuned RGB product is important.
• Alerts based upon thresholds applied to
quantitative products (eg. defining
locations of severe convection, fog etc.)
would be very useful to forecasters
A1 - Forecasters have a huge amount of information available to them, they have to be selective in what
they choose
Small ice crystals – strong updraft
Larger ice crystals – weaker updraft
A2 - Timeliness in the product generation and delivery
Presently we are restricted in constructing most of
the RGB products using MODIS data from the
polar orbiting TERRA and AQUA satellites. There
are limitations with this:
• Only a very few passes per day.
• Delay in receipt if this data (~1hour)
• Timing of imagery not so good for some
meteorological phenomena (eg. fog)
• Forecasters would like product Alerts for when the
latest satellite image has become available.
A3 - Easy and appropriate presentation of the product.
• Web-based products or Visual Weather.
• Displays showing broad details, and zoom function
• A good geospatial display is important
to aid navigation
Lat = 22.29 SLong = 128.54 E
x
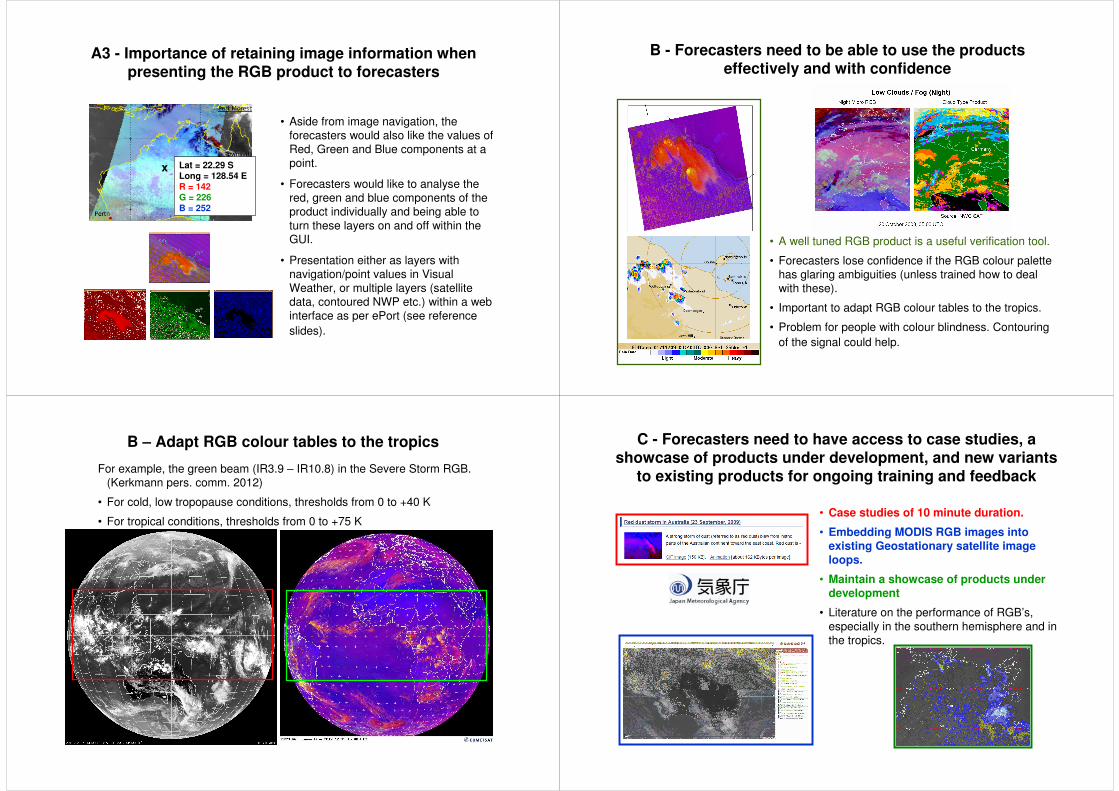
A3 - Importance of retaining image information when presenting the RGB product to forecasters
• Aside from image navigation, the
forecasters would also like the values of
Red, Green and Blue components at a
point.
• Forecasters would like to analyse the
red, green and blue components of the
product individually and being able to
turn these layers on and off within the GUI.
• Presentation either as layers with
navigation/point values in Visual
Weather, or multiple layers (satellite
data, contoured NWP etc.) within a web
interface as per ePort (see reference
slides).
Lat = 22.29 SLong = 128.54 ER = 142G = 226B = 252
x
B - Forecasters need to be able to use the products effectively and with confidence
• A well tuned RGB product is a useful verification tool.
• Forecasters lose confidence if the RGB colour palette
has glaring ambiguities (unless trained how to deal
with these).
• Important to adapt RGB colour tables to the tropics.
• Problem for people with colour blindness. Contouring
of the signal could help.
B – Adapt RGB colour tables to the tropics
For example, the green beam (IR3.9 – IR10.8) in the Severe Storm RGB.
(Kerkmann pers. comm. 2012)
• For cold, low tropopause conditions, thresholds from 0 to +40 K
• For tropical conditions, thresholds from 0 to +75 K
C - Forecasters need to have access to case studies, a showcase of products under development, and new variants
to existing products for ongoing training and feedback
• Case studies of 10 minute duration.
• Embedding MODIS RGB images into existing Geostationary satellite image loops.
• Maintain a showcase of products under development
• Literature on the performance of RGB’s,
especially in the southern hemisphere and in
the tropics.
Summary
• RGB image products are the result of the meteorological and visually meaningful combination of many single satellite channels into one product
• Use of these products by forecasters will become more widespread over the Australasian region from 2015 with the data from the Himawari 8 geostationary satellite
• It is important to prepare forecasters in the use of these products, and incorporate these products into the forecasters toolkit in an effective way.
• We can do this by utilising the experience of EumetSATand other relevant agencies, in the context of our own requirements.
References
COMET module “Multispectral Satellite Applications: RGB PRODUCTS EXPLAINED” http://www.meted.ucar.edu/npoess/multispectral_topics/rgb/
EumetSAT RGB Satellite Products Workshop: 17-19 September 2012
In particular, the presentations:
“RGB Products Overview (RGB Tutorial)” J. Kerkmann EumetSAT
“RGB Products versus Derived Products” J. Kerkmann EumetSAT
J. Kerkmann, 2010; Tri-spectral Window RGB Applications with MSG SEVIRI (24-h Microphysics RGB)
http://www.rtc.dmi.gov.tr/FILES/KURS/334/DOCS/JochenKerkman2.pdf
Lensky et al. 2008: “Clouds-Aerosols-Precipitation Satellite Analysis Tool (CAPSAT), Atmos. Chem. Phys., 8, 6739-6753.)
WMO RGB Composite Satellite Imagery Workshop, Boulder, CO, USA, 5-6 June 2007. Final Report http://www.wmo.int/pages/prog/sat/documents/RGB-1_Final-Report.pdf