effective widths of compression-loaded plates … / tp-2000-210538 effective widths of...
TRANSCRIPT

NASA / TP-2000-210538
Effective Widths of Compression-LoadedPlates With a Cutout
Mark W. Hilburger, Michael P. Nemeth and James H. Starnes, Jr.
Langley Research Center, Hampton, Virginia
October 2000
https://ntrs.nasa.gov/search.jsp?R=20000109795 2018-06-13T00:13:39+00:00Z

The NASA STI Program Office ... in Profile
Since its founding, NASA has been dedicated tothe advancement of aeronautics and spacescience. The NASA Scientific and Technical
Information (STI) Program Office plays a key
part in helping NASA maintain this importantrole.
The NASA STI Program Office is operated byLangley Research Center, the lead center forNASA's scientific and technical information. The
NASA STI Program Office provides access to the
NASA STI Database, the largest collection ofaeronautical and space science STI in the world.
The Program Office is also NASA's institutionalmechanism for disseminating the results of its
research and development activities. Theseresults are published by NASA in the NASA STI
Report Series, which includes the following
report types:
TECHNICAL PUBLICATION. Reports ofcompleted research or a major significant
phase of research that present the results of
NASA programs and include extensivedata or theoretical analysis. Includes
compilations of significant scientific andtechnical data and information deemed to
be of continuing reference value. NASAcounterpart of peer-reviewed formal
professional papers, but having lessstringent limitations on manuscript length
and extent of graphic presentations.
TECHNICAL MEMORANDUM. Scientific
and technical findings that are preliminaryor of specialized interest, e.g., quick release
reports, working papers, andbibliographies that contain minimalannotation. Does not contain extensive
analysis.
CONTRACTOR REPORT. Scientific and
technical findings by NASA-sponsored
contractors and grantees.
CONFERENCE PUBLICATION. Collected
papers from scientific and technical
conferences, symposia, seminars, or othermeetings sponsored or co-sponsored byNASA.
SPECIAL PUBLICATION. Scientific,
technical, or historical information from
NASA programs, projects, and missions,
often concerned with subjects having
substantial public interest.
TECHNICAL TRANSLATION. English-
language translations of foreign scientificand technical material pertinent to NASA'smission.
Specialized services that complement the STI
Program Office's diverse offerings includecreating custom thesauri, building customized
databases, organizing and publishing research
results ... even providing videos.
For more information about the NASA STI
Program Office, see the following:
• Access the NASA STI Program Home Page
at http'//www.sti.nasa.gov
• E-mail your question via the Internet [email protected]
• Fax your question to the NASA STI HelpDesk at (301) 621-0134
• Phone the NASA STI Help Desk at(301) 621-0390
Write to:
NASA STI Help DeskNASA Center for AeroSpace Information7121 Standard Drive
Hanover, MD 21076-1320

NASA / TP-2000-210538
Effective Widths of Compression-LoadedPlates With a Cutout
Mark W. Hilburger, Michael P. Nemeth and James H. Starnes, Jr.
Langley Research Center, Hampton, Virginia
National Aeronautics and
Space Administration
Langley Research CenterHampton, Virginia 23681-2199
October 2000

Available from:
NASA Center for AeroSpace Information (CASI)
7121 Standard Drive
Hanover, MD 21076-1320
(301) 621-0390
National Technical Information Service (NTIS)
5285 Port Royal Road
Springfield, VA 22161-2171
(703) 605-6000

Abstract
Introduction
Results from a study of the effects of cutouts and laminate construction on the preb-
uckling and initial postbuckling stiffnesses, and the effective widths of compression-load-
ed laminated-composite and aluminum square plates are presented. An effective-width
concept is derived for plates with and without cutouts, and experimental and nonlinear
finite-element analysis results are presented. Behavioral trends are compared for seven
plate families and for cutout-diameter-to-plate-width ratios up to 0.66. A general com-
pact design curve that can be used to present and compare the effective widths for a wide
range of laminate constructions is also presented. A discussion of how the results can be
used and extended to include certain types of damage, cracks, and other structural dis-
continuities or details is given. Several behavioral trends are described that initially ap-
pear to be nonintuitive. The results demonstrate a complex interaction between cutout
size and plate orthotropy that affects the axial stiffness and effective width of a plate sub-
jected to compression loads.
Efficient, lightweight, stiffened panels that are subject-
ed to compression loads are often designed to take advan-
tage of the postbuckling stiffness and strength of their plate
elements. More specifically, the flat plate elements exhibit
stable postbuckling behavior and, as a result, can often sup-
port loads significantly greater than their buckling load. Pri-
or to buckling, the axial stresses in each plate element are
typically uniform across the width of a compression-loaded
plate. When a flat plate element buckles, the axial stiffness
of the central region of the plate element is reduced as a re-
sult of the corresponding bending deformations, and the in-
ternal axial load path is redistributed from the central region
of the plate element toward the adjacent stiffeners of the
stiffened panel. Thus, the stiffened panel behaves as if the
load is supported by the stiffeners and by a portion of the
plate elements adjacent to each stiffener. The width of a
plate element that effectively supports part of the applied
load is known as the effective width of the plate. 14
Historically, the effective-width concept appears to
have originated in the design of ship plating. 2 Around 1932,
von KS_rmS_n,Sechler, and Donnell became the first to apply
the effective-width concept to all-metal aircraft construc-
tion. 1 The motivation for this work was to establish a simple
design-oriented analysis that approximates the stiffness of
the buckled plate elements in the calculation of the stiffener
strength and the ultimate load capacity of the stiffened pan-
el. Designing a panel to allow plate buckling above a spec-
ified design load provides a lighter weight panel because the
plate will be thinner than a plate designed to resist buckling.
Currently, the effective-width concept remains in use as an
important preliminary design tool, not only for metallic,
stiffened aircraft panels, but also for laminated composite
stiffened aircraft panels.
A common structural detail that is present in many
stiffened panels is a cutout. For example, cutouts are used
to reduce weight, to provide access to various locations in-
side an aircraft, and to permit hydraulic and electrical lines
to pass through the structure. Thus, the effect of a cutout on
the postbuckling behavior of a plate and its effective width
is important in the design of aircraft structures. A recent sur-
vey of the postbuckling behavior of plates with a cutout is
given in Ref. 5 and indicates that the effect of a cutout on the
effective-width of a plate has received relatively little atten-
tion, compared to plate buckling behavior.
The present paper describes the results of a study of the
effects of cutouts and laminate construction on the prebuck-
ling and initial postbuckling responses and the effective
width of compression-loaded, symmetrically laminated-
composite plates and aluminum plates. In particular, the be-
havior of square plates that are subjected to a uniform edge
displacement is presented. First, the effective-width con-
cept is presented in terms of prebuckling and initial post-
buckling stiffnesses of a plate, and is then extended to
include plates with a cutout. Then, results are presented for
the effective width of aluminum and graphite-epoxy plates
that are based on the experimentally measured prebuckling
and postbuckling stiffnesses that have been presented in
Refs. 6 and 7. Next, results obtained by using the STAGS
finite-element analysis code s are presented for correspond-
ing geometrically perfect plates with nominal dimensions
and idealized boundary and loading conditions. Behavioral
trends that are exhibited by the experimental and finite-ele-
ment analysis results are then presented and compared for
aluminum plates and for composite plates with six laminate
families and cutout-diameter-to-plate-width ratios d/W
ranging from 0 to 0.66. In addition, a general, compact de-
sign curve that can be used to present and compare the effec-
tive widths of a wide range of laminated-composite plate
constructions is presented. A discussion of how the results
can be used and extended to include certain types of central-
ized damage, cracks, and other structural discontinuities or
details that affect the axial stiffness of a plate is also present-ed.

Background and Analysis
The effective-width concept is based on the behavior
of plates that are subcomponents of a stiffened structural
configuration, such as a wing or fuselage, that are loaded in
compression. In particular, the concept was developed for a
plate subcomponent that is attached to two stiff frames and
two less stiff stringers, and that is surrounded by other sim-
ilar panels, frames, and stringers. For this arrangement, the
effective-width concept assumes that the plate edges remain
straight during loading; because of the stiffness provided by
the adjacent structure. However, the effective width con-
cept can also be applied to plates that are supported such that
the unloaded edges are free to deform in the plane of the
plate. This type of support condition is often simulated in
the laboratory (e.g., Ref. 6) and is the focus of the present
study.
The effective-width concept, at the plate subcompo-
nent level, is based on the redistribution of the axial stress
resultant, N x, at the loaded edges when a compression-load-
ed plate buckles, as illustrated in Fig. 1. For example, a per-
fectly flat compression-loaded plate with simply-supported
edges remains flat and N x is uniformly distributed across
the loaded edges prior to buckling (Fig. l(c)). When the
plate buckles, a significant portion of the plate's central re-
gion exhibits relatively large out-of-plane displacements
which reduce the effective axial stiffness (Fig. l(b)). When
the stiffness of the central region of the plate is reduced, the
internal loads are redistributed toward the side supports and
N x becomes nonuniform across the loaded edges (Fig. l(d)).
This change in internal load distribution corresponds to the
abrupt change in slope of the load versus end-shortening
curve shown in Fig. l(b). A common practice in the prelim-
inary design of stiffened panels is to replace the nonuniform
N x distribution at the loaded edges with a tmiform load dis-
tribution (Nx) .... over a reduced width W e (the effective
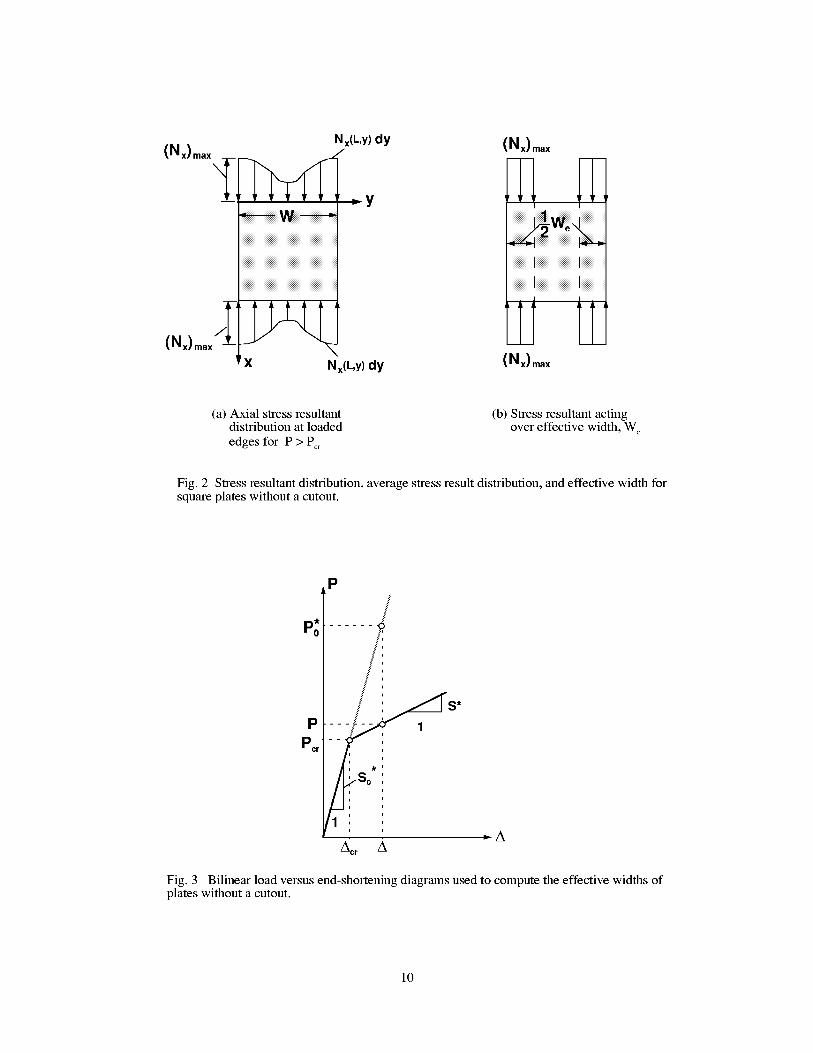
width), as shown in Fig. 2. This approximation is often used
to estimate the required strength of stringers for postbuck-
ling strength and represents a simple way to incorporate
nonlinear behavior into a design. The symbol (Nx) .... rep-
resents the maximum value of N x that occurs at the loaded
edges of a plate (Fig. 2(a)). The value of W e is determined
by equating the load P that acts on the plate with the load
given by (Nx) .... times the effective width (see Ref. 4); thatis
=I w N x dy = (Nx)maxWe (1)PdO
in which the term (Nx)moxW is interpreted as the load in
an tmbuckled plate, corresponding to a given value of post-
buckling end-shortening A, if the plate was unbuckled. This
interpretation of Eq. (1) is illustrated in Fig. 3, where
P0 = (NO .... W . Thus, the ratio of the effective width to the
actual width is expressed as
We Pw - * (3)
P0
The experimental results that are presented in Refs. 6
and 7 indicate that in many cases the postbuckling branch of
the load versus end-shortening curves for elastic plates re-
mains essentially linear for loads up to nearly twice the
buckling load. With the aid of Fig. 3, the ratio of the effec-tive width to the actual width for bilinear load versus end-
shortening curves can be expressed in terms of the prebuck-
ling stiffness, So , and the postbuckling stiffness S* by ei-
ther of the following equations
W.w:-.+1":rI (4)
sI(s .)11we 1+ -1 1w-s; s; s; pc,- (5)
Acr
where Pcr is the buckling load, Ecr=L is the average
strain at buckling, and E = _ is the average strain in the
plate for the load P.
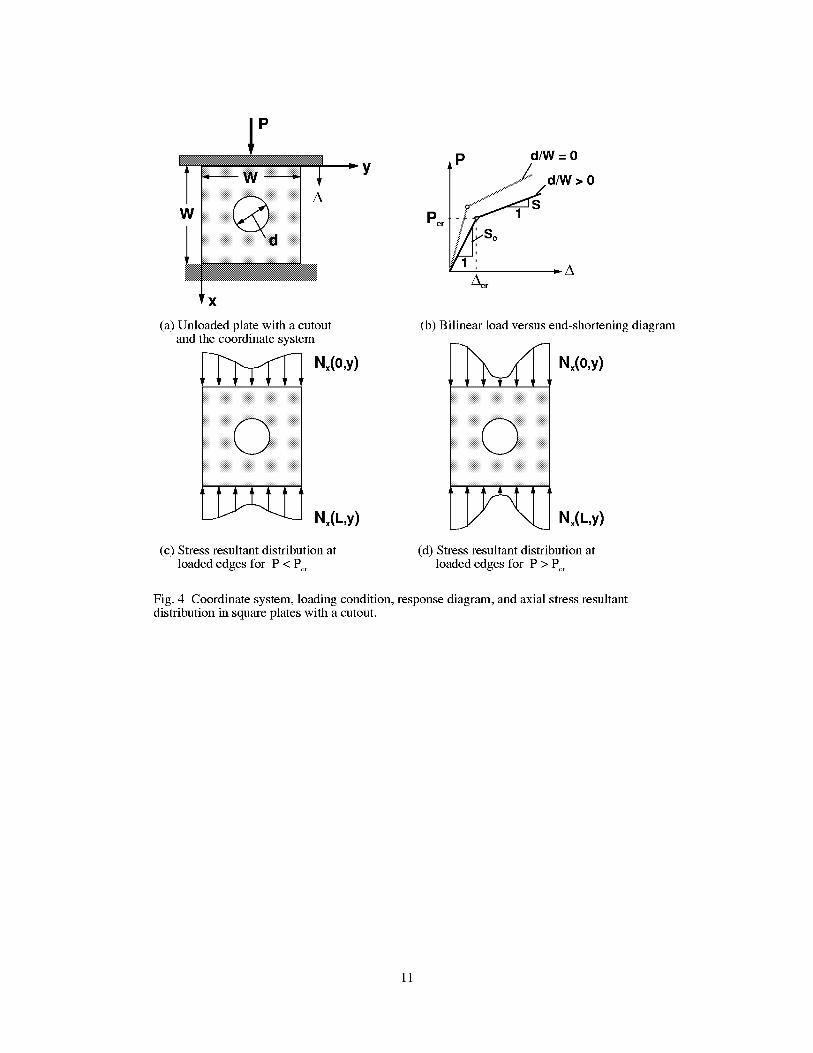
Compression-loaded plates with a centrally located
cutout exhibit a reduction in their effective axial prebuck-
ling stiffness and a redistribution of the internal loads to-
ward the tmloaded edges, as illustrated in Fig. 4. Moreover,
this effect is amplified when a plate with a cutout buckles.
Thus, it is possible to introduce an effective-width concept
for plates with a cutout in both the prebuckling and post-
buckling ranges by following the same rationale that has
been presented above. The relationship between the axial
stiffness of an unbuckled plate without a cutout, S 0 , and the
stiffnesses of an unbuckled and buckled plate with a cutout
is illustrated in Fig. 5. In the prebuckling range, the effec-
tive-width ratio defined by Eq. (3) can be expressed by (see
Fig. 5)
Following Ref. 9, Eq. (1) is written as
We_ P
W (N 0 .... W(2)
We So
W - So (6)
where SO is the prebuckling stiffness of the corresponding
plate with a cutout. In the postbuckling range, the ratio of

theeffectivewidthtotheactual width for bilinear load ver-
sus end-shortening curves can be expressed in terms of the
prebuckling stiffnesses So and SO and the postbuckling
stiffness S of the corresponding plate with a cutout by ei-
ther of the following equations
w 0i cr :0( qw - So[(7)
Finite-Element Model and Analyses
Nonlinear finite-element analyses were conducted in
the present study to provide insight into the experimental re-
sponse trends that are subsequently presented herein. The
plates were analyzed with the STAGS finite-element code. 8
A typical finite-element model of a perfectly flat plate with a
centrally located, circular cutout that was used in the study is
illustrated in Fig. 6. Points on the plate mid-surface are locat-
ed by an x-y-z coordinate flame whose origin is at the top left
corner of the plate. The plate length and width are defined as
L and Wa, respectively, and the cutout diameter is denoted
by d. The nominal plate lengths and widths were 10.0 in. for
all plates. Cutout diameters ranged from 0 to 6.6 in. Both
aluminum and graphite-epoxy composite plates were consid-
ered in this study. The aluminum plates were made of 6061-
T6 alloy sheets and were modeled with a uniform, average
measured thickness of 0.0647 in. The nominal material prop-
erties for 6061-T6 aluminum alloy are: Young's modulus E =
10.0 X 10 6 psi and Poisson's ratio v = 0.33. The laminated-
composite plates were modeled by using a uniform thickness
equal to the average measured plate thicknesses that are given
in Table 1. All of the laminated-composite plate test speci-
mens were made of Hercules, Inc. AS4/3502 graphite-epoxy
material. The nominal lamina properties reported in Ref. 6
and used herein include a longitudinal modulus E 1= 18.5 x
10 6 psi, a transverse modulus E 2 = 1.6 x 10 6 psi, an inplane
shear modulus G12 = 0.832 x 10 6 psi, and a major Poisson's
ratio v_2 = 0.35.
Idealizations of the test-fixture support conditions were
used in the finite-element model. To simulate clamped load-
ed edges, the out-of-plane displacements, w, and the tangen-
tial displacements, v, were set equal to zero in the boundary
regions of the finite-element model that extend 1/4 in. from
each loaded end of a plate (see Fig. 6). The compression load
was introduced into the plate by applying a uniform end-dis-
placement A to one end of the model while holding the other
end of the panel fixed on the boundary, as illustrated in Fig.
6; that is, u(0,y) = A and u(L,y) = 0. The simply supported,
unloaded edges (knife-edge supports) were simulated by set-
ting the out-of-plane displacement equal to zero on a line 1/4
in. from each unloaded edge of a panel. The corresponding
unsupported width of the plate that is between the knife edg-
es is given by W = 9.5 in. The tangential displacements, u,
were unrestrained on the unloaded edges. In addition, the un-
loaded edges are free to translate in the y-coordinate direc-tion.
The finite-element meshes used in the present study
were defined by using user-written subroutines that are com-
patible with the STAGS finite-element code. 8 These user-
written subroutines facilitated the generation of models with
different cutout sizes and mesh densities, and provided a con-
venient means for assessing the convergence of a given finite-
element model. Convergence studies were done for all finite-
element models and a typical converged finite-element mesh
is shown in Fig. 6. The models consist of four-noded STAGS
410 quadrilateral shell elements. The 410 element is a flat,
facet-type element that is based on the Kirchoff-Love shell
hypotheses and the nonlinear Lagrangian strain tensor. The
element nodes include three drilling degrees of freedom and
three translational degrees of freedom. Large rotations are
accounted for at the element level by the use of a corotational
algorithm. The element theory is documented in Ref. 8.The STAGS code uses both the modified and full New-
ton methods for its nonlinear solution algorithms. The
STAGS equivalence transformation (ET) processor is used to
continue beyond bifurcation points into the postbuckling
response range of a solution. The ET processor allows the
user to select a solution branch in the direction of growth of a
bifurcation mode that has been computed for the nonlinear
stress state in the neighborhood of the bifurcation point.
This bifurcation mode is held constant, with a magnitude
specified by the user, and the load factor in the solution is
adjusted until the solution residual vanishes.
The prebuckling responses of the plates considered
herein were determined by using the geometrically nonlin-
ear, quasi-static analysis capability in STAGS. The ET pro-
cessor was used to get beyond the bifurcation point and
branch onto the postbuckling equilibrium path of the panels.
Once the initial postbuckling path was established for a
plate, the analysis was continued into the postbuckling
response range by using the quasi-static analysis algorithm
in STAGS. A typical finite-element model contained approx-
imately 10,000 degrees of freedom.
The initial prebuckling stiffnesses of the geometrically
perfect, idealized test specimens were obtained by comput-
ing the slope of a line passing through two solution points on
the primary branch of the load versus end-shortening curve.
Similarly, the initial postbuckling stiffnesses were obtained
by computing the slope of the line that passes through the bi-
furcation point on the load versus end-shortening curve for
a given specimen and that is tangent to the stable secondary
equilibrium path.
Nonlinear finite-element analyses of geometrically

imperfectplateswerealsoconductedin thepresentstudyprimarilytodeterminetheeffectofinitialgeometricimper-fectionsontheprebucklingstiffnessofaplateandbecauseinitialgeometricimperfectionsareknowntoaffecttheef-fectivewidthofacompression-loadedplate.l°Becausenofull-fieldorothertypeofinitialimperfectionmeasurementdataareavailable,aneigen-modeimperfectioncharacter-izedbyasinglehalf-waveshapealongthecoordinateaxesandavariableamplitudewasused.Forthesegeometricallyimperfectplates,theprebucklingstiffnesseswereobtainedinthesamemannerasdescribedpreviouslyforthegeomet-ricallyperfectplates.
Results and Discussion
The experimental results presented in Refs. 6 and 7 for
square aluminum plates and for square [010]s, [9010] s, [(0/
90)5]s, [(_+30)6]s, [(_+45)6]s, and [(-+60)6] s laminated-compos-
ite plates with or without a central circular cutout and sub-
jected to a tmiform axial edge displacement are described in
this section. For these results, the compression-loaded edg-
es of the plates were clamped in a test fixture and the tmload-
ed edges were supported by knife edges, which are intended
to simulate simply supported edges. The distance between
the knife edges is the unsupported width of a plate and is
designated herein by the symbol W, and the relative size of
the cutout is indicated by the ratio d/W. The nominal value
of W is 9.5 in. for each specimen and the actual, nominal
plate width W a is 10.0 in. Specific details about the test
specimens and apparatus and details about the test proce-
dure are described in Refs. 6 and 7 and are not repeated, for
the most part, herein. All of the laminated-composite plates
were made of Hercules, Inc. AS4/3502 graphite-epoxy ma-
terial and the aluminum plates were made of 6061-T6 alu-
minum alloy material. The nominal material properties have
been described in the previous section of the present paper.
First, the experimental results of Refs. 6 and 7 are pre-sented in a manner that illustrates the effect of cutout size on
the prebuckling and postbuckling axial stiffnesses of the
aluminum plates and the laminated-composite plates. Be-
cause these experimental results exhibit some unusual
trends, corresponding results that were obtained from non-
linear finite-element analyses are also presented to provide
insight into the behavior. These finite-element analysis re-
suits are based on idealized geometry, boundary conditions,
and loading conditions; uniform thickness distributions; and
the nominal material properties that were previously de-
scribed. Because of these idealizations and approximations,
the finite-element analysis results are not intended to be
used for test-analysis correlation. The finite-element results
are used to provide a means for contrasting the behavioral
trends from idealized analyses that a designer might use
with the behavior that may exist in real structures. Next, ef-
fective widths are presented for selected experimental re-
suits as a function of the average axial-strain level to
demonstrate the effects of laminate construction and cutout
size. Finally, a compact design chart is presented that pro-
vides a means for representing effective widths of plates
with or without a cutout in a general manner. Additional
charts, based on finite-element analyses, that illustrate the
effects of plate geometry and material properties on the pa-
rameters that appear in the compact design chart are also
presented.
Overall Stiffness Trends
The test results of Refs. 6 and 7 are presented together
in Figs. 7-9, and the corresponding analysis results are pre-
sented in Figs. 10-12. Graphs of the prebuckling stiffness
ratio S/S 0 , the postbuckling stiffness ratio S/S*, and the
postbuckling-to-prebuckling stiffness ratio S/S 0 that were
measured experimentally are presented in Figs. 7-9, respec-
tively. In Fig. 7, S O is the experimentally measured preb-
uckling stiffness of the specimen without a cutout for each
family of test specimens. In Fig. 8, S* is the experimentally
measured postbuckling stiffness of the specimen without a
cutout for each family of test specimens (values of S O and
S* are given in Refs. 6 and 7). Corresponding graphs of the
prebuckling stiffness ratio S/S 0 , the postbuckling stiffness
ratio S/S*, and the postbuckling-to-prebuckling stiffness ra-
tio S/S 0 that were obtained from finite-element analyses are
presented in Figs. 10-12, respectively. In Fig. 10, S O -- Exh
for each family of plates, and in Fig. 11, S* is the postbuck-
ling stiffness of the plate without a cutout that was obtained
from the finite-element analyses for each family of plates.
Values of E x for each of the laminates without a cutout and
their average thicknesses h are given in Table 1. In all of
these figures, results for the aluminum plates are given by
the black line with the filled black circles. Similarly, results
for the [010]s, [9010]s, and [(0/90)5] s plates are given by the
solid gray lines with the unfilled triangles, unfilled dia-
monds, and unfilled circles, respectively. Results for the
[(_+30)6]s, [(_+45)6]s, and [(-+60)6] s plates are given by the
dashed black lines with the unfilled triangles, unfilled dia-
monds, and unfilled squares, respectively.
The results in Fig. 7 generally show that the largest re-
ductions in prebuckling stiffness with increasing cutout size
are exhibited by the [010]s specimens, followed by the [(0/
90)5] s specimens. This trend is also exhibited by the finite-
element analysis results for the corresponding idealized
plates (Fig. 10). The smallest reductions in prebuckling
stiffness with cutout size are generally exhibited by the
[9010]s specimens, followed by the [(--.30)6]s specimens.
The finite-element analysis results of the corresponding ide-
alized plates show that the smallest reductions in prebuck-
ling stiffness with cutout size are exhibited by the [(-+60)6] s
specimens, followed by the [(-+45)6] s specimens. However,
only three data points are given for the specimens for values
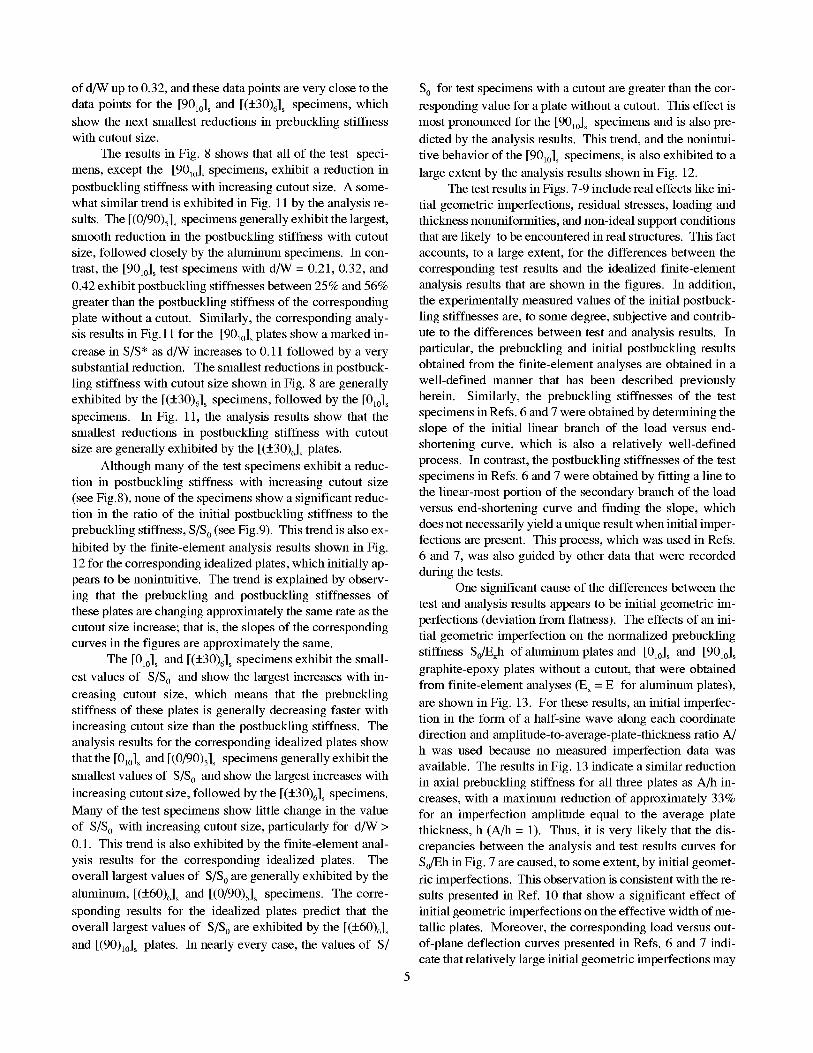
ofd/Wupto0.32,andthesedatapointsareveryclosetothedatapointsforthe[9010]Sand[(_+30)6]Sspecimens,whichshowthenextsmallestreductionsinprebucklingstiffnesswithcutoutsize.
TheresultsinFig.8showsthatallofthetest speci-mens,exceptthe [9010]_specimens,exhibitareductioninpostbucklingstiffnesswithincreasingcutoutsize.Asome-whatsimilartrendisexhibitedinFig.11bytheanalysisre-suits.The[(0/90)5]_specimensgenerallyexhibitthelargest,smoothreductioninthepostbucklingstiffnesswithcutoutsize,followedcloselybythealuminumspecimens.Incon-trast,the[9010]_testspecimenswithd/W= 0.21,0.32,and0.42exhibitpostbucklingstiffnessesbetween25%and56%greaterthanthepostbucklingstiffnessofthecorrespondingplatewithoutacutout.Similarly,thecorrespondinganaly-sisresultsinFig.11forthe[90_0]_platesshowamarkedin-creaseinS/S*asd/Wincreasesto0.11followedbyaverysubstantialreduction.Thesmallestreductionsinpostbuck-lingstiffnesswithcutoutsizeshowninFig.8aregenerallyexhibitedbythe[(_+30)6]Sspecimens,followedbythe[010]_specimens.In Fig.11,theanalysisresultsshowthatthesmallestreductionsin postbucklingstiffnesswithcutoutsizearegenerallyexhibitedbythe[(_+30)6]_plates.
Althoughmanyofthetestspecimensexhibitareduc-tioninpostbucklingstiffnesswithincreasingcutoutsize(seeFig.8),noneofthespecimensshowasignificantreduc-tionin theratiooftheinitialpostbucklingstiffnesstotheprebucklingstiffness,S/S0(seeFig.9).Thistrendisalsoex-hibitedbythefinite-elementanalysisresultsshowninFig.12forthecorrespondingidealizedplates,whichinitiallyap-pearstobenonintuitive.Thetrendisexplainedbyobserv-ingthattheprebucklingandpostbucklingstiffnessesoftheseplatesarechangingapproximatelythesamerateasthecutoutsizeincrease;thatis,theslopesofthecorrespondingcurvesinthefiguresareapproximatelythesame.
The[010]_and[(_+30)6]_specimensexhibitthesmall-estvaluesof S/S0 andshowthelargestincreaseswithin-creasingcutoutsize,whichmeansthattheprebucklingstiffnessof theseplatesisgenerallydecreasingfasterwithincreasingcutoutsizethanthepostbucklingstiffness.Theanalysisresultsforthecorrespondingidealizedplatesshowthatthe[010]Sand[(0/90)5]_specimensgenerallyexhibitthesmallestvaluesof S/S0andshowthelargestincreaseswithincreasingcutoutsize,followedbythe[(_+30)6]_specimens.Manyofthetestspecimensshowlittlechangein thevalueof S/S0withincreasingcutoutsize,particularlyfor d/W>0.1.Thistrendisalsoexhibitedbythefinite-elementanal-ysisresultsfor thecorrespondingidealizedplates.Theoveralllargestvaluesof S/S0aregenerallyexhibitedbythealuminum,[(_+60)6]_and[(0/90)5]_specimens.Thecorre-spondingresultsfor theidealizedplatespredictthattheoveralllargestvaluesof S/S0areexhibitedbythe[(_+60)6]Sand[(90)10]_plates.In nearlyeverycase,thevaluesof S/
SOfortest specimens with a cutout are greater than the cor-
responding value for a plate without a cutout. This effect is
most pronounced for the [9010]_ specimens and is also pre-
dicted by the analysis results. This trend, and the noniutui-
tire behavior of the [9010]_ specimens, is also exhibited to a
large extent by the analysis results shown in Fig. 12.
The test results in Figs. 7-9 include real effects like ini-
tial geometric imperfections, residual stresses, loading and
thickness nonuniformities, and non-ideal support conditions
that are likely to be encountered in real structures. This fact
accounts, to a large extent, for the differences between the
corresponding test results and the idealized finite-element
analysis results that are shown in the figures. In addition,
the experimentally measured values of the initial postbuck-
ling stiffnesses are, to some degree, subjective and contrib-
ute to the differences between test and analysis results. In
particular, the prebuckling and initial postbuckling results
obtained from the finite-element analyses are obtained in a
well-defined manner that has been described previously
herein. Similarly, the prebuckling stiffnesses of the test
specimens in Refs. 6 and 7 were obtained by determining the
slope of the initial linear branch of the load versus end-
shortening curve, which is also a relatively well-defined
process. In contrast, the postbuckling stiffnesses of the test
specimens in Refs. 6 and 7 were obtained by fitting a line to
the linear-most portion of the secondary branch of the load
versus end-shortening curve and finding the slope, which
does not necessarily yield a unique result when initial imper-
fections are present. This process, which was used in Refs.
6 and 7, was also guided by other data that were recorded
during the tests.
One significant cause of the differences between the
test and analysis results appears to be initial geometric im-
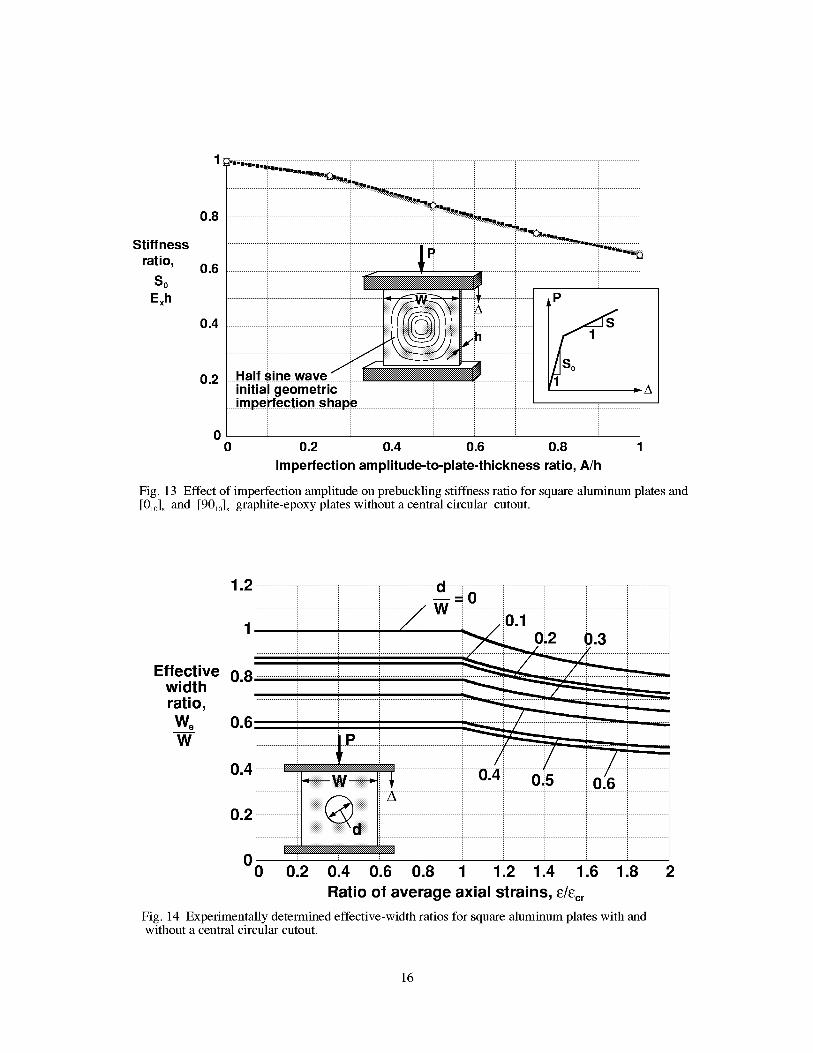
perfections (deviation from flatness). The effects of an ini-
tial geometric imperfection on the normalized prebuckling
stiffness S0/Exh of aluminum plates and [010]_ and [9010] S
graphite-epoxy plates without a cutout, that were obtained
from finite-elemeut analyses (E x = E for aluminum plates),
are shown in Fig. 13. For these results, an initial imperfec-
tion in the form of a half-sine wave along each coordinate
direction and amplitude-to-average-plate-thickness ratio A/
h was used because no measured imperfection data was
available. The results in Fig. 13 indicate a similar reduction
in axial prebuckling stiffness for all three plates as A/h in-
creases, with a maximum reduction of approximately 33%
for an imperfection amplitude equal to the average plate
thickness, h (A/h = 1). Thus, it is very likely that the dis-
crepancies between the analysis and test results curves for
S0/Eh in Fig. 7 are caused, to some extent, by initial geomet-
ric imperfections. This observation is consistent with the re-
sults presented in Ref. 10 that show a significant effect of
initial geometric imperfections on the effective width of me-
tallic plates. Moreover, the corresponding load versus out-
of-plane deflection curves presented in Refs. 6 and 7 indi-
cate that relatively large initial geometric imperfections may

havebeenpresentin manyof thetestspecimens.Othersourcesofdiscrepanciesbetweenthefinite-elementanalysisandexperimentalresultsarevariationsinthicknessandma-terialproperties,residualstresses,andnonuniformloadin-troductioneffectsthatwerenot measuredfor thetestspecimens.Inaddition,theidealizationof the actual bound-
ary conditions provided by the test fixture is likely to con-
tribute some difference between the test and analysis results.
Regardless of the differences between corresponding
test and analysis results presented in Figs. 7 through 12, both
the test and analysis results predict several of the same
trends. Most importantly, the test and analysis results indi-
cate a complex interaction between plate orthotropy and cut-
out size which results in significant variations in the
prebuckling and postbuckling stiffness ratios of compres-
sion-loaded plates with or without a cutout. The result also
show that real, imperfection-like effects can greatly affect
the behavior of plates and should be considered in their de-
sign.
Effective-Width Ratios
Plots of effective-width ratios provide a simple means
for incorporating the postbuckling strength and stiffness of
plate subcomponents into the design of stiffened structures.
Similarly, as shown previously herein, effective-width ra-
tios can be defined for structural details, like a cutout, thatcause a similar load redistribution as the structural detail in-
creases in influence. In this section, effective-width ratios
we EW are presented as a function of normalized strain ec,. for
the aluminum test specimens and the [010]s, [9010]s, [(0/
90)5]_, and [(-1"30)6]_ laminated-composite test specimens
considered herein in Figs. 14-18, respectively. In particular,
prebuckling and postbuckling effective-width ratios are
presented for d/W values that range from d/W=0.0 to d/
W=0.66 and implicitly include real imperfections like initial
geometric imperfections and thickness nonuniformities.e
The prebuckling range of the figures corresponds to ec,. <
1. Similar plots can be generated for the finite-element anal-
ysis results that have been presented herein, but have been
omitted in favor of the compact design curve that is present-
ed in Fig. 19. The effective widths in Figs. 14-18 are deter-
mined by using Eq. (7) and the inputs used in Eq. (7) are
from the experimentally measured results that were present-
ed in the previous section. As a result of using Eq. (7), the
effective-width curves that are presented subsequently are
based on a bilinear representation of the load versus end-
shortening curves, and represent the initial postbuckling be-
havior of the test specimens. Material nonlinearities and
large geometric nonlinearities that are associated with devi-
ations from a bilinear load-end-shortening curve are not
considered in the present study.
The test results shown in Figs. 14-18 exhibit many of
the same general trends. For example, the results indicate
that the effective widths of the plates are constant in the pre-
buckling response range, as expected. In addition, with the
exception of the results for the [9010]_specimens, the results
indicate that, as dee increases, the prebuckling effective
width decreases monotonically. Moreover, in the postbuck-
ling response range, the effective widths of the plates gener-
ally decrease monotonically with increasing strain level for
all cutout sizes. The test results for the [90m] _specimens
that are presented in Fig. 16 indicate that the prebuckling ef-
fective width of the plate with d/W=0.42 is approximately
16% greater than the prebuckling effective width of the cor-
responding plate without a cutout. In the postbuckling re-
sponse range, the effective widths of the [90m] SspecimensE
decrease monotonically with Ec,.. However, the results in-
dicate that the [90m] _specimen with a larger cutout does not
correspond to lower effective-width ratios. More specifical-E
ly, the results show that, for values of Ec,. slightly greater
than 1, the [90m] _specimens with small values of dee have
higher effective-width ratios than the specimens with largerE
values of dee. However, for larger values of Ec,. this trend
is reversed, and the [90m] _specimens with larger values of
dee exhibit larger effective-width ratios than the specimens
with smaller values of dee. Like the results presented in
the previous section, the results in Figs. 14-18 indicate a
complex interaction between plate orthotropy and cutout
size which results in significant variations in the prebuck-
ling and postbuckling effective-width ratios of compres-
sion-loaded plates with or without cutouts.
Equation (7) forms the basis for a very compact or con-
cise way of representing the effective widths of the general
class of laminated plates in addition to metallic plates. This
property of Eq. (7) results from the fact that it applies to
compression-loaded plates, with or without a cutout, and
can be used with measured test data for S/S 0 and S/S 0 or
data from analytical or numerical methods. Similarities and
differences in the behavior of various plates can be high-
lighted and compared directly by casting Eq. (7) into the
form of a generic design chart like the one shown in Fig. 19.
In this figure, stiffness-weighted, effective-width ratios are
presented as a function of normalized strain for values of S/
So=. 1, .2, .3, .4, .5, .6, .7, and .8. Insight into response trends
can be obtained by generating results such as those present-
ed in Figs. 7 and 9 for the test specimens considered herein
or such as the finite-element analysis results presented in
Figs. 10 and 12.
Extrapolation of the Results
The concept of effective width can be applied to any
structural detail or discontinuity that affects the apparent ax-
ial stiffness of a plate and causes the stresses on the loaded
edges of a compression-loaded plate to be redistributed to-
ward the unloaded edges. For example, load introduction
and thickness nonuniformities, initial geometric imperfec-
tions, spatial variation in material properties, boundary con-
ditions, residual stresses, and certain kinds of damage affect
the stiffness ratios S/S 0 and S/S0, and graphs that show
these effects can be used with Eq. (7) and Fig. 19 to obtain
values for the effective width and the corresponding behav-
ioral trends caused by variations in the stiffness parameters.
A specific example of how the results presented herein can
be used is given by a damage state in a plate that does not
propagate or grow significantly with the load level. For this
case, the load versus end-shortening response curve can be
approximated by a bilinear curve and the effect of the dam-
age on the stiffness ratios S/S 0 and S/S 0 can be replaced
by an estimated equivalent (or conservative) cutout. More
precise values for the effective width could be obtained by
establishing experimentally the effect of damage on the
stiffness ratios S/S 0 and S/S 0.
The approach presented herein should not be used for
extensive damage propagation with load, material nonlin-
earities, geometric nonlinearities, or any other quantity that
results in load versus end-shortening response curves that
cannot be approximated as bilinear curves. However, Eq.
(2) forms the basis for defining an effective width for lami-
nated-composite plates, just as it did for yielding in metallic
plates. 11 For this type of behavior, (Nx) .... in Eq. (2) must
be related to the applied end-shortening by a failure criteri-
on, such as the maximum strain criterion.
Concluding Remarks
A study of the effects of cutouts and laminate construc-
tion on the prebuckling and initial postbuckling stiffnesses
and the corresponding effective widths of compression-
loaded, symmetrically laminated-composite and aluminum
square plates has been presented. The effective-width con-
cept has been extended to plates with cutouts, and results
have been presented that include previously published ex-
perimental results and nonlinear finite-element analysis re-
suits for the corresponding geometrically perfect plates with
idealized support and loading conditions and material prop-
erties. Behavioral trends that were obtained from the exper-
imental results and from finite-element analysis results have
been presented and compared for seven plate families and
cutout diameter-to-plate width ratios ranging from 0 to 0.66.
In addition, a general, compact design curve that can be used
to determine and compare the effective widths of a wide
range of laminated-composite plate constructions has been
presented, and a discussion of how the results can be used
and extended to include certain types of centralized damage,
cracks, and other structural discontinuities or details that af-
fect the axial stiffness of a plate has been given.
The results show that some plates with cutouts can
have significantly higher prebuckling and initial postbuck-
ling stiffnesses and effective widths than the corresponding
plate without a cutout. These results illustrate a complex in-
teraction between cutout size and plate membrane and bend-
ing orthotropies that affect the internal load distribution in a
plate.
References
1. Von KSmlSn, T., Sechler, E. E., and Domlell, L. H., "The
Strength of Thin Plates in Compression," ASME Transactions,
APM 54 5, Vol. 54, No. 2, Janualy 30, 1932, pp. 53 57.
2. Bengston, H. W., "Ship Plating Under Compression and Hydro
static Pressure," presented at the annual meeting of the Society of
Naval Arctfitects and Marflle Engineers, New York, NY, Novem
ber 16 17, 1939, Paper No. 1.
3. Steinbacher, F. R. and Gerard, G., Aircraft Structural Mechan-
ics, Pitman Publishing Colp., 1952, pp. 289 294.
4. Hu, P. C., Ltmdquist, E. E., and Batdorf, S. B., "Effect of Small
Deviations From Flatness on Effective Width and Bucklfllg of
Plates in Compression," NACA Technical Note No. 1124, September 1946.
5. Nemeth, M. P., "Buckling and Postbuckling Behavior of Lami
nated Composite Plates With a Cutout," NASA Technical Paper
3587, July 1996.
6. Nemeth, M. P., "Buckling and Postbuckling Behavior of Square
Compression Loaded Graphite Epoxy Plates With Circular Cut
outs," NASA Technical Paper 3007, August 1990.
7. Nemeth, M. P., "Buckling and Postbuckling Behavior of Com
pression Loaded Isotropic Plates With Cutouts," NASA Technical
Paper 3024, September 1990.
8. Rankin, C. C., Brogan, F. A., Loden, W. A. and Cabiness, H. D.,
STAGS Users Manual, Lockheed Palo Alto Research Laborato13_,
Repo_ LMMS P032594, 1999.
9. Dym, C. L., Stability Theot_y and Its Applications to Structural
Mechanics, Noordhoff International, Leyden, The Netherlands,1974.
10. Vihmy, O. and Rockey, K. C., "A Generalized Effective Width
Method for Plates Loaded in Compression," J. Constructional Steel
Research, Vol. 1, No. 3, 1981, pp. 3 12.
11. Mayers, J. and Budiansky, B., "Analysis and Behavior of Sim
ply Supported Flat Plates Compressed Beyond the Buckling Load
into the Plastic Range," NACA Technical Note No. 3368, Februmy
1955.
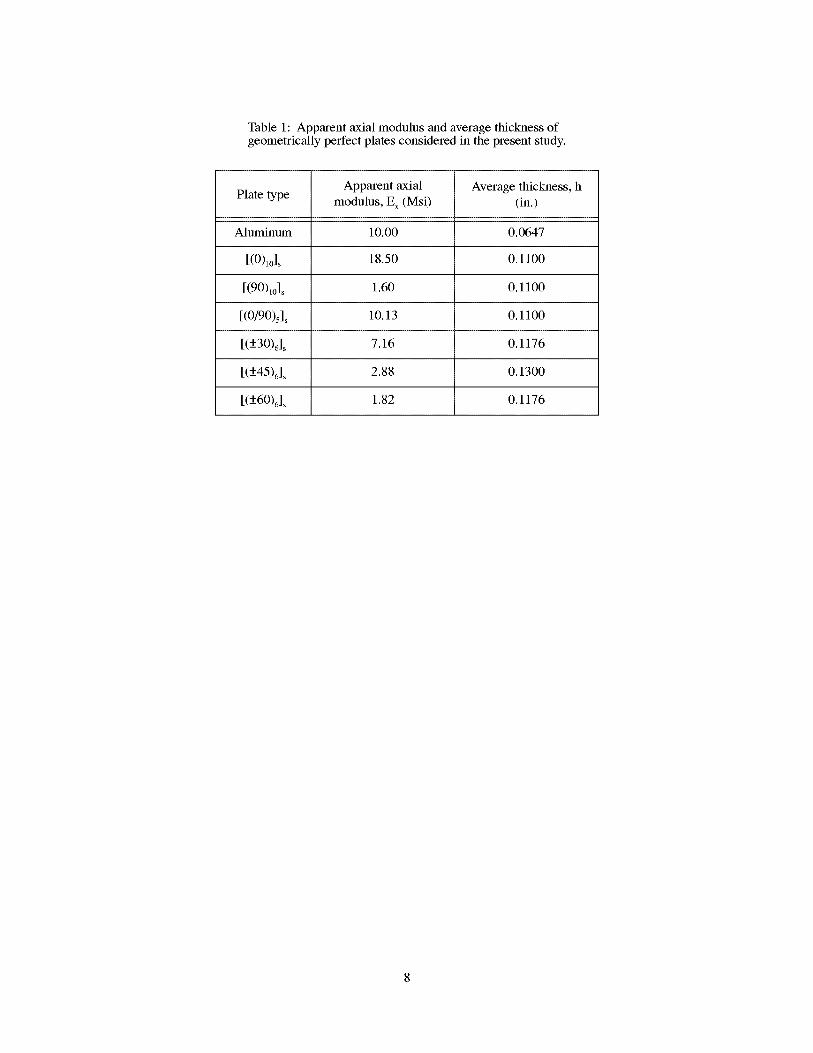
Table 1: Apparent axial modulus and average thickness ofgeometrically perfect plates considered in the present study.
Apparent axial Average thickness, hPlate type modulus, E x (Msi) (in.)
Aluminum 10.00 0.0647
[(0)1o] S 18.50 0.1100
[(90)1o] S 1.60 O.1100
[(0/90)5] _ 10.13 O.1100
[([-30)6]s 7.16 O.1176
[(+45)6]_ 2.88 0.1300
[(-l60)6]_ 1.82 0.1176

(a) Plate configuration and coordinate system
,1111 .x,O.,,
TTTT .x,..,(c) Stress resultant distribution at
loaded edges for P < Pcr
Per
P
Acr
,.A
(b) Bilinear load versus end-shortening diagram
Nx(O,y)
Nx(L,Y)
(d) Stress resultant distribution atloaded edges for P > Pcr
Fig. 1 Coordinate system, loading condition, response diagram, and axial stress resultantdistribution in square plates without a cutout.
(N x)maxN x(L,y) dy/
(Nx) max/----__
N x(L,y) dy
(Nx) max
(Nx) m_x
(a) Axial stress resultantdistribution at loaded
edges for P > P
(b) Stress resultant actingover effective width, W e
Fig. 2 Stress resultant distribution, average stress result distribution, and effective width forsquare plates without a cutout.
P;
P
Pcr
P
S*
/So
Act A
,,A
Fig. 3 Bilinear load versus end-shortening diagrams used to compute the effective widths ofplates without a cutout.
10
WA
X
(a) Unloaded plate with a cutoutand the coordinate system
_ Nx(0,y)
Per
p d/W=O
I_S d/W>OS1'
/_= ,. A
(b) Bilinear load versus end-shortening diagram
Nx(0,y)
Nx(L,Y) Nx(L,Y)
(c) Stress resultant distribution atloaded edges for P < Pcr
(d) Stress resultant distribution atloaded edges for P > Per
Fig. 4 Coordinate system, loading condition, response diagram, and axial stress resultantdistribution in square plates with a cutout.
11

P
........ S 0
Po .;_-d/W > 0
_N" O_ /1 c s
_ d/W > 0p*
P
Pcr
i
1 ,, _A
Aor A
Fig. 5 Bilinear load versus end-shortening diagram used to compute the effective width of a plate with acutout.
W a
Clamped loaded edgeu(O,y) = A
Simply _Simplysupported supportededge edge
X_U
u(L, y) = 0
Clamped edge
Fig. 6 Typical finite-element model geometry and boundary conditions (dashed lines mark the rows onwhich the out-of-plane boundary conditions are applied).
12

1.2
Prebucklingstiffness ........._:_i
ratio, 0.8 .............
So
So 0.6 .............
0.4 .............
0.2
00 0.1
[90.Ji::_::::'::.:_"................................Por- f
S
(_.o)ol................................::...
...............................................i--- _ 1 ' ,, AI[(t3o)ds .........i . Z_cr ]
minum.............!.t!!iiiiii i..........r(_,9o)ji>-,i............................i.........i:_
..........................................N,o] ...................i..............
0.2 0.3 0.4 0.5 0.6 0.7
Cutout diameter-to-plate-width ratio, d/W
Fig. 7 Prebuckling stiffness ratios for square aluminum and laminated-composite plates, with andwithout a central circular cutout, obtained from experiments.
Postbucklingstiffness
ratio,
S
S*
1.6
1.4
1.2
1
0.8
0.6
0.4
0.2
00
[901o]_
........Alu.minbm .......
P
....Per -2J
.... ,j
......':"_::i!)[(_3o)a_..............
..............1_.........t.............................._
.........Z...t......:'_:,::...t..............................
............................il::_:"i_ _
......... e...._ ..........
[01j_...................................[(P!go,)j_i
"So d/W > 0
0.1 0.2 0.3 0.4 0.5 0.6 0.7
Cutout diameter-to-plate-width ratio, d/W
Fig. 8 Postbuckling stiffness ratios for square aluminum and laminated-composite plates, with andwithout a central circular cutout, obtained from experiments.
.A
13

Stiffness
ratio,
S
So
1 ------ [(O/9(_)s]s
o. .......................\-i-----....................\ ...............\.
o.o _ii__:'_::-...............',.J,q -.-.ji!.....
Aluminum
.° .... -.0.4....................0.2 i ........................................................................................................
0 I I I
0 0.1 0.2 0.3 0.4 0.5 0.6 0.7
Cutout diameter-to-plate-width ratio, d/W
Fig. 9 Postbuckling-to-prebuckling stiffness ratios for square aluminum and laminated-composite plates,with and without a central circular cutout, obtained from experiments.
0.8
Prebucklingstiffness
ratio, 0.6
So
So 0.4
0.2
A d/W=Ol P So d/W>0
_ 1 S
Pcr_ ,.A
Acr
....iA
hI_ iiiiiiii
...........Aluminum
i[(o_o)_]_
0 0.1 0.2 0.3 0.4 0.5 0.6 0.7
Cutout diameter-to-plate-width ratio, d/W
Fig. 10 Prebuckling stiffness ratios for perfectly flat, square aluminum and laminated-compositeplates, with and without a central circular cutout, obtained from finite-element analyses.
14

Postbucklingstiffness
ratio,
S
_
1.6
1.4
1.2
1=
0.8
0.6
0.4
0.2
0
[(0/91))j_
0 0.1 0.2 0.3 0.4 0.5 0.6 0.7
Cutout diameter-to-plate-width ratio, d/W
Fig. 11 Postbuckling stiffness ratios for perfectly flat, square aluminum and laminated-composite plates,with and without a central circular cutout, obtained from finite-element analyses.
Stiffness
ratio,
S
So
P
[(*6o)j, ...............i[9 o ......../:: i . i[(-4. i_1;....
0.8 ...........i.............................i.........................i..........................
_;:ii__L_.......[]....._.............,,...........[]......0.64 _...... : :, = ,
O_o rO,o_ir_o)o_o_;0 0.1 0.2 0.3 0.4 0.5
Cutout diameter-to-plate-width ratio, d/W
P
IP A .............
0.6 0.7
Fig. 12 Postbuckling-to-prebuckling stiffness ratios for perfectly flat, square aluminum and laminated-composite plates, with and without a central circular cutout, obtained from finite-element analyses.
15
Stiffnessratio,
SoExh
0.8
0.6
0.4
0.2
0
............................................................................................ ....'....'..."
P
.Ha!f..Sine waveinitial geometric . A
0 0.2 0.4 0.6 0.8 1
Imperfection amplitude-to-plate-thickness ratio, A/h
Fig. 13 Effect of imperfection amplitude on prebuckling stiffness ratio for square aluminum plates and[010]S and [9010]S graphite-epoxy plates without a central circular cutout.
Effectivewidthratio,WeW
1.2................................................................i..............................d=0 ..................................................................................................1 0.1
...............02 ...............i_:3..................................
4
................... A
0.
0.8
0.6
0.4
0.2
........................... i.....................i.....................
00 0.2 0.4 0.6 0.8 1 1.2 1.4 1.6 1.8 2
Ratio of average axial strains, _/_cr
Fig. 14 Experimentally determined effective-width ratios for square aluminum plates with andwithout a central circular cutout.
16

Effective 0.8widthratio,We 0.6W
....................i0.110.21ii 0.32
0 o
0.42i ..........0_6
0.2 0.4 0.6 0.8 1 1.2 1.4 1.6 1.8
Ratio of average axial strains, _/_cr
Fig. 15 Experimentally determined effective-width ratios for square [010]sgraphite-epoxy plateswith and without a central circular cutout.
2
Effectivewidthratio,WeW
1.2
d
A
1 ............/
......................................... i
0.6
......................................................................................................i0.4 ............................................................. _ ____._,
0.2 ...................................................................................................... i
...................................................................................................... i
O0 0.2 0.4 0.6 0.8 1.2 1.4 1.6 1.8 2
Ratio of average axial strains, e/ecr
Fig. 16 Experimentally determined effective-width ratios for square [9010]Sgraphite-epoxy plateswith and without a central circular cutout.
17

Effective 0.8widthratio,
We 0.6W
d1.2 ........................................." =O
W
0.4
0.2
0.11
0 0
_O.60 0.66
P
0.42
0.2 0.4 0.6 0.8 1.2 1.4 1.6 1.8 2
Ratio of average axial strains, _/_cr
Fig. 17 Experimentally determined effective-width ratios for square [(0/90)5] Sgraphite-epoxy plateswith and without a central circular cutout.
A
d1.2 ........................................._=0 ......................
wA
Effective 0.8widthratio,We 0.6W
0.2 ................................................................!0:.60..............o,.66......................................................................................................
00 0.2 0.4 0.6 0.8 1.2 1.4 1.6 1.8 2
Ratio of average axial strains, E/Ecr
Fig. 18 Experimentally determined effective-width ratios for square [('1-30)6]s graphite-epoxy plateswith and without a central circular cutout.
18

1.2S
Stiffness 1
weightedeffective
width ratio, 0.8
W 0.6
0.4
0.2So = A
00 0.2 0.4 0.6 0.8 1 1.2 1.4 1.6 1.8 2
Ratio of average axial strains, _/_cr
Fig. 19 Stiffness weighted effective-width ratios for plates with and without a central circular cutout.
19

Form ApprovedREPORT DOCUMENTATION PAGE Q¥_N_,_7_4-_1w
Public reporting burden for this collection of information is estimated to average 1 hour per response, including the time for reviewing instructions, searching existing datasources, gathering and maintaining the data needed, and completing and reviewing the collection of information. Send comments regarding this burden estimate or any otheraspect of this collection of information, including suggestions for reducing this burden, to Washington Headquarters Services, Directorate for Information Operations andReports, 1215 Jefferson Davis Highway, Suite 1204, Arlington, VA 22202-4302, and to the Office of Management and Budget, Paperwork Reduction Project (0704-0188),Washington, DC 20503.1. AGENCY USE ONLY (Leave blank) 2. REPORT DATE 3. REPORT TYPE AND DATES COVERED
October 2000 Technical Publication
4. TITLE AND SUBTITLE
Effective Widths of Compression-Loaded Plates With a Cutout
6. AUTHOR(S)
Mark W. Hilburger, Michael P. Nemeth and James H. Starnes, Jr.
7. PERFORMING ORGANIZATION NAME(S) AND ADDRESS(ES)
NASA Langley Research Center
Hampton, VA 23681-2199
9. SPONSORING/MONITORING AGENCY NAME(S) AND ADDRESS(ES)
National Aeronautics and Space Administration
Washington, DC 20546-0001
5. FUNDING NUMBERS
522-11-41-01
8. PERFORMING ORGANIZATIONREPORT NUMBER
L-18004
10. SPONSORING/MONITORINGAGENCYREPORTNUMBER
NASA/TP-2000-210538
11. SUPPLEMENTARY NOTES
Presented at the 41 st AIAA/ASME/ASCE/ASC/ASH Structures, Structural Dynamics, and Materials
Conference, April 3-6, 2000, Atlanta, Georgia. Hilburger: NRC-Resident Research Associate, Langley
Research Center, Hampton, VA; Nemeth and Starnes: Langley Research Center, Hampton, VA12a. DISTRIBUTION/AVAILABILITY STATEMENT
Unclassified-Unlimited
Subject Category 39 Distribution: Standard
Availability: NASA CASI (301) 621-0390
12b. DISTRIBUTION CODE
13. ABSTRACT (Maximum 200 words)
A study of the effects of cutouts and laminate construction on the prebuckling and initial postbuckling
stiffnesses, and the effective widths of compression-loaded, laminated-composite and aluminum square plates is
presented. The effective-width concept is extended to plates with cutouts, and experimental and nonlinear finite-
element analysis results are presented. Behavioral trends are compared for seven plate families and for cutout-
diameter-to-plate-width ratios up to 0.66. A general compact design curve that can be used to present and
compare the effective widths for a wide range of laminate constructions is also presented. A discussion of how
the results can be used and extended to include certain types of damage, cracks, and other structural
discontinuities or details is given. Several behavioral trends are described that initially appear to be nonintuitive.
The results demonstrate a complex interaction between cutout size and plate orthotropy that affects the axial
stiffness and effective width of a plate subjected to compression loads.
14. SUBJECT TERMS
effective width, buckling, post buckling, composite plates, cutouts, design
17. SECURITY CLASSIFICATIONOF REPORT
Unclassified
NSN 7540-01-280-5500
18. SECURITY CLASSIFICATIONOF THIS PAGE
Unclassified
19. SECURITY CLASSIFICATIONOF ABSTRACT
Unclassified
15. NUMBER OF PAGES
2416. PRICE CODE
A0320. LIMITATION
OF ABSTRACT
UL
Standard Form 298 (Rev. 2-89)Prescribed by ANSI Std. Z-39-18298-102