effectiveness factors for reactions … factors for reactions between ... partially wetted catalysts...
TRANSCRIPT

Chemical Engineering Science. Vol. 42, No. 6, pp. 1323-1332, L987. 0009-2509/87 $3.00 + 0.00 Printed in Great Britain. 0 ,987 Pergamon Journals Ltd.
EFFECTIVENESS FACTORS FOR REACTIONS BETWEEN VOLATILE AND NON-VOLATILE COMPONENTS IN
PARTIALLY WETTED CATALYSTS
IOANNIS V. YENTEKAKIS and COSTAS G. VAYENAST Institute of Chemical Engineering and High Temperature Chemical Processes, University of Patras,
Patras 26110, Greece
(Received 3 February 1986; accepted 21 July 1986)
Abstract-A steady state model is formulated to describe the reactions between one gaseous and two non- volatile components on partially wetted catalysts in a trickle-bed reactor. Unlike previous studies, the model does not assume a gaseous or liquid limiting reactant. The computed results show the effect of intraparticle and interphase mass transfer resistances as well as of wetting efXciency and number and location of wetted zones on catalyst performance. Maximum effkctiveness factors are generally obtained with intermediate values of the wetting efficiency. The model is applied to a typical HDS process of heavy gas oil in trickle-bed reactors.
1. INTRODUCTION
The performance of catalyst pellets in trickle-bed reactors is affected significantly by interphase and intraparticle mass transfer resistances as well as by the extent of catalyst wetting (Satterfield, 1975; Colombo et al., 1976, Morita and Smith, 1978; Gianetto et al., 1978; Shah, 1979; Herskowitz et al., 1979; Van Landeghem, 1980; Lee and Smith, 1982; Herskowitz and Smith, 1983). Criteria for assessing the importance of intra- and inter-phase heat and mass transfer resistances of pellets in a trickle-bed reactor and for determining the extent of pellet wetting have been developed (Lee and Smith, 1982). The role of wetting efficiency of catalyst pellets on catalyst performance depends critically on the nature of the limiting reactant.
For reactions in which the intrinsic rate is controlled by a non-volatile component, reduced wetting ef- ficiency decreases the global rate. If the limiting reactant is in the gas phase, however, then a reduction in wetting efficiency tends to enhance catalyst perform- ance (Herskowitz et al., 1979; Ramachandran and Smith, 1979).
Typical values of wetting efficiencies in pilot scale and commercial trickle-bed reactor units are between 0.6 and 1 (Satterfield, 1975; Colombo et al., 1976; Herskowitz et al., 1979; Herskowitz and Smith, 1983). The dependence of wetting efficiency, f, on various operating parameters has been studied experimentally (Colombo et al., 1976; Morita and Smith, 1978; Herskowitz et al., 1979; Mills and Dudukovic, 1981; Herskowitz and Mosseri, 1983) and an expression off in terms of the Reynolds, Froude and Weber numbers has been proposed and correlated well with existing experimental results (Mills and Dudukovic, 1981). Partial wetting of catalyst particles leads to non- uniform reactant concentrations around the external
TAuthor to whom correspondence should be addressed.
surface and therefore conventional effectiveness factor expressions are not applicable.
Previous workers have computed overall effective- ness factors, 9, for single reactions assuming either a gaseous or a non-volatile limiting reactant (Mills and Duducovic, 1979; Ramachandran and Smith, 1979; Tan and Smith, 1980; Mills and Dudukovic, 1980; Herskowitz, 1981a; Herskowitz, 1981b; Goto et al., 1981; Zheng et al., 1984b). Analytical power series expressions have been obtained for the case of linear kinetics in various geometries (Herskowitz et al., 1979; Herskowitz and Smith, 1983; Mills and Dudukovic, 1979; Mills and Dudukovic, 1980; Herskowitz, 1981b; Zheng et al., 1984b) but evaluation of the power series coefficients from the resulting dual-series equations is difficult (Herskowitz and Smith, 1983). A powerful numerical method for coefficient evaluation and ef- fectiveness factor computation has been developed (Mills and Dudukovic, 1979 and 1980). Approximate effectiveness factor expressions have also been pro- posed on the basis of the assumption that q can be expressed as a weighted average of the effectiveness factor qL when the particle is completely wetted and of that when the particle is completely covered by gas (Ramachandran and Smith, 1979; Mills and Dudukovic, 1980; Tan and Smith, 1980; Goto et al., 1981). Approximate and rigorously computed ef- fectiveness factors have been compared for the case of first and nth order kinetics (Goto et al., 1981) of the limiting reactant. Agreement is usually good for rela- tively large Thiele moduli (Mills and Dudukovic, 1980; Tan and Smith, 1980; Herskowitz, 1981b; Goto et al., 1981). Previous theoretical studies have not addressed the problem of effectiveness factor computation when the concentrations of the gaseous and liquid reactants are comparable and the intrinsic rate depends on the both of them. This is the case in several important industrial trickle-bed reactor applications, such as the hydrodesulfurization of heavy petroleum fractions where the total concentration of sulfur containing
1323

1324 I. V. YENTEKAKIS and C. G. VAYENAS
compounds and of dissolved hydrogen are often comparable. In this case the rate is near first order in hydrogen for pressures below 140 bar and between first and second with respect to the sum of the sulphur containing compounds (Cecil et al., 1968; Schuit and Gates, 1973; Rollmann, 1977; Gates er al., 1979).
becomes very large. Both the number and the location of wetted zones are found to have a significant effect on catalyst performance. Computed effectiveness factors typically increase by 100% as the number of wetted zones increases from one to infinity.
In the present communication we analyse the prob- lem of reaction between a volatile and one or two non- volatile components in a partly wetted catalyst pellet without assuming any reactant to be reaction rate limiting. The reason for considering two non-volatile reactants is that this is the minimum number of pseudocomponents required to describe the substan- tially different reactivities of various sulphur contain- ing compounds present in usual HDS reactor feed- stocks (Schuit and Gates, 1973; Yitzhaki and Aharom, 1977; Gates et al., 1979). It should be noted that two pseudocomponents, each reacting with linear kinetics, suffice to describe the frequently observed second order dependence of total sulphur conversion on reactor LHSV (Cecil et al., 1968; Schuit and Gates, 1973). As in previous studies the non-volatile reactants are assumed to diffuse into the catalyst pellet only through the liquid covered external surface. The gaseous reactant enters the pellet primarily through the so-called gas covered external surface, but also to a lesser extent through the wetted part of the external surface.
Both reaction rates were assumed to be first order in each of the two non-volatile components which are characterized by different reactivities. This is known to simulate well the apparent second order dependence of the HDS rate on the total sulphur content (Cecil et al., 1968; Schuit and Gates, 1973).
The resulting equations were solved numerically using a finite difference approach. The effect was examined of the pertinent physicochemical parameters on catalyst performance. Particular emphasis was given to the wetting etficiency which, as expected, plays a dominant and interesting role, which is qualitatively different from that in the case of a single limiting reactant (Mills and Dudukovic, 1979; Mills and Dudukovic, 1980; Herskowitz, 1981a; Herskowitz, 1981b; Goto et al., 1981; Zheng et al., 1984b).
Previous studies have usually assumed one sym- metric continuous polar wetted zone per catalyst pellet. The case of more than one wetted zone has been recently explored for the case of a single reactant with linear kinetics (Capra et al., 1982; Ring and Missen, 1986). In the former case where the analysis was limited to a particular range of parameters corresponding to a hydrogenation reaction, the effect of increasing number of wetted zones was found to be negligible. Ring and Missen studied a wider range of parameters and found that the effectiveness factor can increase by as much as 40 0/0 when the number of wetted zones changes from one to four. In the present communi- cation we examine the effect of the number as well as of the location of wetted zones by considering four different wetting patterns and by establishing the limiting behaviour when the number of wetted zones
2. PROBLEM FORMULATION AND BASIC EQUATIONS
The porous catalytic pellet, assumed to be spherical, completely filled with liquid and partially wetted, is shown in Fig. 1. Assuming symmetric boundary con- ditions with respect to one axis of the sphere, one can express the fractional wetting coverage or wetting efficiencyfin terms of the angles of the boundaries 0, . In the case of one continuous polar wetted zone it is
f= (1 -cos 0,)/2. (la)
Three other wetting cases were examined in order to study the effect of the number and location of wetted zones, as shown in Fig. 1: they can be called bipolar (b), equatorial (c) and bipolar-equatorial (d). The corresponding wetting efficiency expressions are
f=(l-cos0,) (lb)
f=cos@, (Ic)
f= (1 +sin OJ-cos 0,). (ld)
Two reactions are assumed to take place in the pellet between a volatile component V and two non-volatile
polar bipirr
esurtorial P
bledrr-erurterial
Fig. 1. Partially wetted spherical catalyst pellets and compu- tational grid geometry.
Reactions between volatile and non-volatile components 1325
components Sl and S2;
r1 Sl(1) + aI V(g) + products (2)
S2( 1) + a2 V(g) 2 products. (3)
In the case of hydrodesulfurization (HDS) V stands for H2 and Sl and S2 represent two sulphur containing pseudocomponents which differ considerably in reac- tivity for HDS, e.g. thiophene and a dibenzo thiophene (Nag et al., 1979; Vrinat, 1983).
Assuming the pellet to be isothermal, which is usually a well justified assumption in most trickle-bed reactors (Herskowitz and Smith, 1983), one can write the following dimensionless mass balance equations for V, Sl and S2:
UC,,1 = 95, *:rr (4)
LCC,,l = 952a:rti (5)
LCC,] = 9u, i,*:r: +9a2iZ@trf (6)
with
1 + dsinGdC I I-
p2 sin 0 dQ d@ (7)
- - where p = r/(dP/2), CS, = cS,/cS,,b~cS2 = cS2/ _
cS2, br c, = Cv/Cv,eq - -
The equilibrium volatile reactant concentration in the liquid phase C, cq is defined as C, $H, where H, is the vapour-liquid equilibrium coefficient of species V.
In the case of one wetted zone the corresponding boundary conditions (BCs) are
dCs, - = finite; dp
dCs, - = B&,(1 -Cs,); dp
dcsl -.-=Q dp
dG2 ~ = finite; dp
d&z - = B&,(1 -Cs2);
dp
dcsz - = 0; dp
(8)
(94
Pb)
(10)
(lla)
(lib)
dC, = finite dp
, p=o,o<o<x (12)
dC ---x = Bi dp
v.gls(l -C,); p=l,o<o<of (13a)
dC 2 = Bi,_,(l -C,); dp
p=l,Or-<O<n (13b)
where
B&i = &. si drJ2D, si BisZ = K,. s&2D, s2
Bi “. gs =K ,.,dd2DLY Bi,b = Kds.vdd2D,vv
Boundary conditions (S), (10) and (12) indicate that because of the asymmetry at p = 1 it is in general dC,/dp # 0 at p = 0, i.e. the concentration minima of Sl, S2 and V do not coincide with the centre of the pellet, as shown in Fig. 2 of the results sections. In the case of bipolar, equatorial and bipolar-equatorial wetting the angular constraints of BCs 9a, 9b, 1 la, 11 b, 13a and 13b change according to Fig. 1.
The effectiveness factors for reactions (2) and (3) can be computed from
‘II =;
1 x
ss p2 sin OrydO dp (14)
0 0
v2 =;
1 x
ss p2 sin Or2 d@ dp. (15)
0 0
An overall effectiveness factor may be defined from
q overarl = (aii,Wq, +a2C2Q$q2)/@lCl#
+a212*t). (16)
This effectiveness factor, which is a weighted average of ‘I~ and qzr expresses the ratio of the actual global rate of volatile component consumption to the rate that would prevail for infinitely fast intrapellet mass transfer.
2.1. Reaction kinetics Equations (4)-(6) together with BCs (8~(13) can be
solved numerically for arbitrary kinetic expressions r, and r2_ In this work mass action kinetics only have considered, i.e.
r , = K, zi,,c, (17)
rz = K,c,,c, (18)
This was done because eqs (17) and (18) provide a satisfactory fit to the kinetic behaviour of several important reactions carried out commercially in trickle bed reactors, such as HDS of petroleum fractions on Co-MO based catalysts (Kumar et al., 1984). More complex Langmuir-Hinshelwood type rate expres- sions have also been proposed for HDS of model compounds (Satterfield and Roberts, 1968; Houalla et al., 1978; Broderick and Gates, 1981; Singhal et al., 1981) but these expressions are seldom used in indus- trial practice. The retarding effect of the product HIS on the rate of HDS is known to be important (Gates et al., 1979; Vrinat, 1983) and should be taken into

1326 I. V. YENTEKAKIS and C. G. VAYENAS
account, particularly near the exit of the reactor. However few kinetic investigations have attempted to quantify this retarding effect by rate expressions containing Pn, s explicitly. In most kinetic investiga- tions (Yitzhaki and Aharoni, 1977; Rollmann, 1977; Nag ef al., 1979; Houalla et al., 1980) the effect of H2S is implicitly built into the experimentally extracted rate constants K1 and K2 of eqs (17) and (18).
2.2. Numerical solution Equations (4j(6) together with boundary con-
ditions (8 j( 13) were solved numerically using the finite difference method. The resulting set of 3 x K x L nonlinear equations, where K and L are the numbers of grid points along the radial and angular direction respectively, were solved by means of the following iterative scheme: Arbitrary, usually zero, values were assigned to the nonlinear kinetic terms and the result- ing set of 3 x K x L linear equations was solved using Gauss elimination with pivoting for all 3 x K x L concentrations which were then resubstituted into the kinetic terms. Convergence of all concentrations within 0.1 o/0 usually required 4-12 iterations. The number of grid points was varied in order to examine the accuracy of the results. In most runs it was found that K = 30 and L = 12 sufficed to provide satisfac- tory accuracy ( f 1%) of the computed effectiveness factors.
3. RESULTS AND DISCUSSION
Figure 2 shows computed radial concentration profiles of the reactants in the catalyst particle for typical values of the Biot and Thiele numbers, one polar wetted zone and wetting efficiency f = 0.75. As expected, the minimum concentration of the volatile component Vis found towards the liquid covered part of the pellet. The opposite is true for the concen- trations of the two non-volatile components Sl and S2 where the minima are found at the gas covered surface.
r/R
Fig. 2. Typica radial concentration profiles of nonvolatile reactants SI, S2 and volatile reactant V along the symmetry axis of the pellet, i.e. 0 = 0 and n; solid lines: cD1 = 2, CD, = 1, dashed lines: @, = I, m2 = 0.5; other parameters: Bi = 10, Bi,_ g,S = 15, Bi, gs = 100 < - cz = 1 [ I- 3 1
0~~ = 1, cc2 =’ 3, f‘= 0.75, polar wetting.
3.1. Limiting behaviour for negligible and severe mass transfer limitations
Interphase mass transfer plays a key role in global catalyst performance. This is shown in Fig. 3 where the effectiveness factor of one reaction rlt is plotted against the Thiele modulus Q,. Curves labelled a correspond to the case of negligible interphase mass transfer resist- ance and were obtained by allowing all for Biot numbers to become infinitely large ( > 104). Curve a, corresponds to complete wetting (I = 1) and no side reaction (Qr = 0). It gives the effectiveness factor qt. I for a single bimolecular reaction in a spherical pellet with symmetric surface BCs and is proportional to @; i for large values of a1 . Introducing partial wetting eficiency (f= 0.75) and maintaining aZ = 0 one ob- tains curve a, which approximately conforms to q1 = fqL, except for @I < 1 as in the case of a monomol- ecular reaction (Colombo et al., 1976, Gianetto et al., 1978; Mills and Dudukovic, 1979; Herskowitz and Smith, 1983). Curve a3 corresponds to the same conditions with a2, except mz is now non-zero and equal to 2. It can be seen that curves a, and a3 coincide for large Q1 values, but a3 tends asymptotically to a value less than one for @I + 0. This is because the volatile reactant V is consumed by the second reaction even at vanishing @I values. Indeed as shown by curve a4 the effectiveness factor qZ of the second reaction is rather insensitive to changes in mL _
Curves on Fig. 3 labelled (b) correspond to the case of severe interphase mass transfer limitations and correspond to Ei,, = Bi,, = 0.1, Bi, gs = Ei, rls = 0.2. Indices 1, 2, 3 and 4 of curves (b) correspond to the samefand (IQ conditions as with curves (a). The basic feature of curves (b) is that they become proportional to dpF2 for large a1 values. In fact curve b,, which
-7
Fig. 3. Effect of Thiele modulus @, on the effectiveness factor ‘I~ (curves a,, a,, a,, b, , bz, b,) and q2 (curves. a4, b4) for negligible (curves a) and severe (curves b) external mass transfer limitations with a, = ,I, az = 3. cl, = Ej2 = l,i, = cz = 0.5. Curves (a): x 104; curves (b): B’
dashed curves correspond to complete wet;;?g, all o>t%s tof = 0.75; one polar wetted zone; see text for discussion.

Reactions between volatile and non-volatile components 1327
corresponds to complete wetting, practically coincides with vi = Bi,,/3@: for @i values larger than one. This result is identical to that obtained for first order reactions in spherical pellets with symmetric surface BCs.
Introduction of partial wetting efficiency f= 0.75 results in curves bZ(@ = 0) and b, (a2 = 2) which show that the approximation r] 1 = fq r, 1 is again valid for @r > 1.
3.2. Effect of wetting eficiency Figures 4 and 5 show the effect of wetting efficiency
on catalyst performance for one polar wetted zone when interphase mass transfer of the non-volatile reactants is relatively slow with respect the interphase mass transfer of the gaseous component. Under these conditions the liquid reactants tend to become rate
1. 1
.O .5 1. f
Fig. 4. Effect of wetting efficiency on effectiveness factors q, , qz for various values of QI, @* and fast mass transfer of the volatile component; Bi,, = Bisz = 10, Bi, slS = 20, Bi, ss = 100, 5, = 1.6, cz = 1, cl = cz = 0.5, aI = 3, a, = 1, kz
= Q, , polar wettmg.
Fig. 5. Effectiveness factor dependence on Thiele modulus for fast mass transfer of the volatile component. Curves labelled l-5 correspond to f= 0.067, 0.25, 0.5, 0.75 and 1.0
respectively; conditions as in Fig. 4.
limiting and the situation is qualitatively similar to that analysed for single reactions with first or nth order kinetics (Mills and Dudukovic, 1979; Herskowitz, 1981b; Goto et a[., 1981) i.e. the effectiveness factors r~i and qz are monotonically increasing functions off. In these and in following figures the effectiveness factor of the more reactive component ql is shown by solid curves, while the corresponding qZ. which is always greater than vi. is represented by dashed curves. The overall effectiveness factor is not shown, since it is always bracketed between vi and qZ and can be readily computed from equation (16).
As shown in Fig. 4 the approximation vi =f~r,~, (i = 1, 2) can provide a reasonable estimate of vi only for Qi exceeding unity. However the practical useful- ness of this simplifying approximate expression is further diminished by the fact that, as shown in section 3.5, the number and location of the wetted zone(s) has a significant effect on vi, thus the value off by itself cannot provide a complete description of the wetting pattern. Figure 5 shows the effect of mi on qi for constant values off. For large Di values the effective- ness factors vi become proportional to l/Q:. This is because of the relatively small Biot numbers used in these computations. The fact that r~i and r,rz do not reach the limiting values offBis,/@f andfBi,,/Q: for large Qi. as they would in the case of single first order reactions, is due to the consumption of the volatile component by both reactions.
When the interphase mass transfer resistances of the gaseous and non-volatile components are comparable and the gaseous component is transfered primarily via the gas covered particle surface, then the effectiveness factor exhibits a maximum at intermediate f values. This is shown in Fig. 6 which also demonstrates that the optimum wetting efficiency is rather insensitive to changes in the Thiele moduli.
The optimum wetting efficiency depends strongly on the interphase mass transfer resistance of the volatile component at the liquid covered particle surface. This
1.
cl,Jl***
I I
I
Fig. 6. Effect of wetting efficiency on catalyst performance for slow mass transfer of the volatile component on the wetted part of the catalyst surface; Bist = Bisz = 10, Bi,,sts = 1, W.,, = 50, 5, = 1.6, cz = 1, <, = c2 = 0.5, ~1 = 3, ~2
= I, mz = a,. polar wetting.
1328 I. V. YENTEKAKIS and C. G. VAYENAS
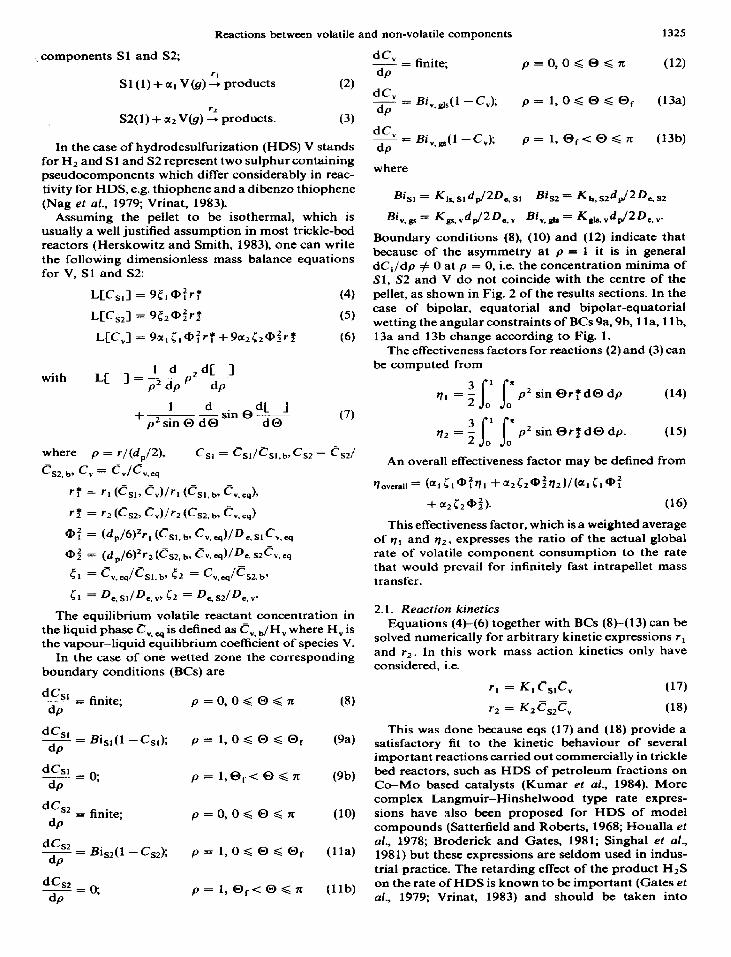
is shown in Fig. 7 which demonstrates that the op- timum value of the wetting efficiencyf,,,,increases with increasing Bi, glS_ Under similar conditions qmaX and f,,, have both been found to be insensitive to Bi, Bs provided the latter exceeds Bi, glS. This is explained by noticing that the volatile component enters the pellet primarily via the gas covered part of the external surface; since Bi “, Bp is sufficiently large the rate of mass transfer of the gaseous reactant is determined primar- ily by the value off
3.3. Effect of Bi v gs and Biv gas For fixed values of the wetting efficiency f increasing
Bi “, glS enhances catalyst performance. This is shown in Fig. 8. For the same values of parameters the effect of increasing Bi v, gs is less pronounced. The effect would be significant only for small values of the bulk concentration of the gaseous reactant.
.5 f
Fig. 7. Effect of gas-liquid-solid mass transfer coefficient of volatile component Bi y dS on the optimum wetting efficiency
fop,; a, = m2 = 1, other conditions as in Fig. 6.
Fig. 8. Effectiveness factors II, , p+ vs Bi, gls for various values of @I = mz; Bi,, = Bi,, = 10, Bi, gs =‘lS, El = 1.6, c2 = 1,
[, = r2 = OS, Q, = 3, CL* = 1, f = 0.75, polar wetting.
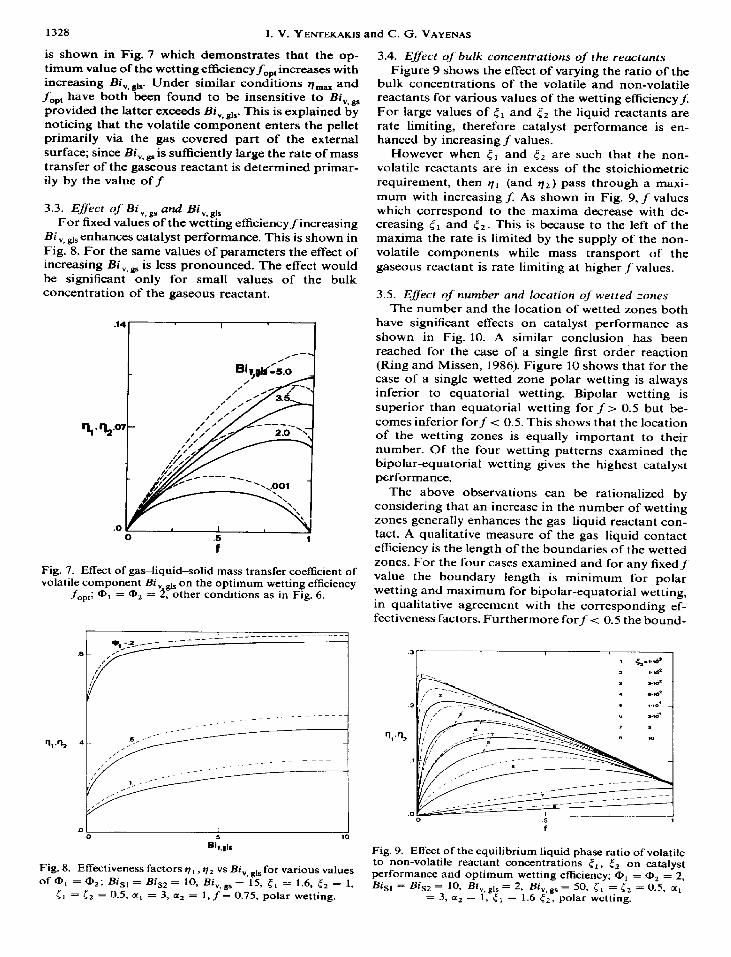
3.4. Effect of bulk concentrations of the reactants Figure 9 shows the effect of varying the ratio of the
bulk concentrations of the volatile and non-volatile reactants for various values of the wetting efficiency5 For large values of <I and c2 the liquid reactants are rate limiting, therefore catalyst performance is en- hanced by increasing f values.
However when c1 and t2 are such that the non- volatile reactants are in excess of the stoichiometric requirement, then q, (and q2) pass through a maxi- mum with increasing f. As shown in Fig. 9, f values which correspond to the maxima decrease with de- creasing 5, and c2. This is because to the left of the maxima the rate is limited by the supply of the non- volatile components while mass transport of the gaseous reactant is rate limiting at higher f values.
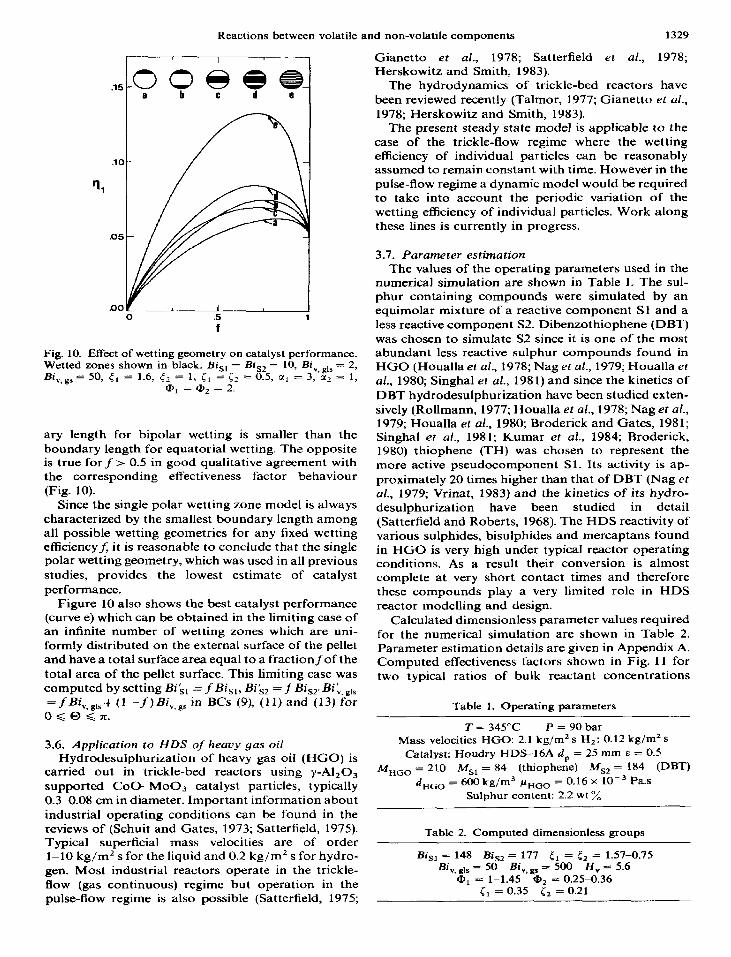
3.5. Eflect of number and location of wetted zones The number and the location of wetted zones both
have significant effects on catalyst performance as shown in Fig. 10. A similar conclusion has been reached for the case of a single first order reaction (Ring and Missen, 1986). Figure 10 shows that for the case of a single wetted zone polar wetting is always inferior to equatorial wetting. Bipolar wetting is superior than equatorial wetting for f > 0.5 but be- comes inferior forf < 0.5. This shows that the location of the wetting zones is equally important to their number. Of the four wetting patterns examined the bipolar-equatorial wetting gives the highest catalyst performance.
The above observations can be rationalized by considering that an increase in the number of wetting zones generally enhances the gas-liquid reactant con- tact. A qualitative measure of the gas-liquid contact efficiency is the length of the boundaries of the wetted zones. For the four cases examined and for any fixed f value the boundary length is minimum for polar wetting and maximum for bipolar-equatorial wetting, in qualitative agreement with the corresponding ef- fectiveness factors. Furthermore forf < 0.5 the bound-
Fig. 9. Effect of the equilibrium liquid phase ratio of volatile to non-volatile reactant concentrations rI, & on catalyst performance and optimum wetting efficiency; @‘I = Qz = 2, Bi ~1 = Bis, = 10, Bi,,,l, = 2, Bi,,,, = 50, ir = C2 = 0.5, a,
= 3, cc2 = 1, {I = 1.6 c2, polar wetting.
Reactions between volatile and non-volatile components 1329
.lO
.05
.oo 0 .5 1
f
Fig. 10. Effect of wetting geometry on catalyst performance. Wetted zones shown in black. Bi,, = Bi Bi =50 < =1.6 5 =l c =c =%5-
- 10, Bi,,,,, = 2, V.&s 3 1
’ 3, L’cg = p ) al = 3, az = 1,
ary length for bipolar wetting is smaller than the boundary length for equatorial wetting. The opposite is true forf> 0.5 in good qualitative agreement with the corresponding effectiveness factor behaviour (Fig. 10).
Since the single polar wetting zone model is always characterized by the smallest boundary length among all possible wetting geometries for any fixed wetting efficiencyj; it is reasonable to conclude that the single polar wetting geometry, which was used in all previous studies, provides the lowest estimate of catalyst performance.
Figure 10 also shows the best catalyst performance (curve e) which can be obtained in the limiting case of an infinite number of wetting zones which are uni- formly distributed on the external surface of the pellet and have a total surface area equal to a fractionfof the total area of the pellet surface. This limiting case was computed by setting BikI = f Bi,,, Bi’,, = f Bi,,, Bi:, g,s =fW,gls + (1 -f ~Bk,,, in BCs (9), (11) and (13) for O<O<TL
3.6. Application to HDS of heavy gas oil Hydrodesulphurization of heavy gas oil (HGO) is
carried out in trickle-bed reactors using y-AlzOX supported COO-Moo3 catalyst particles, typically 0.34.08 cm in diameter. Important information about industrial operating conditions can be found in the reviews of (Schuit and Gates, 1973; Satterfield, 1975). Typical superficial mass velocities are of order l-10 kg/m2 s for the liquid and 0.2 kg/m’s for hydro- gen. Most industrial reactors operate in the trickle- flow (gas continuous) regime but operation in the pulse-flow regime is also possible (Satterfield, 1975;
Gianetto et al., 1978; Satterfield et al., 1978; Herskowitz and Smith, 1983).
The hydrodynamics of trickle-bed reactors have been reviewed recently (Talmor, 1977; Gianetto et al.,
1978; Herskowitz and Smith, 1983). The present steady state model is applicable to the
case of the trickle-flow regime where the wetting efficiency of individual particles can be reasonably assumed to remain constant with time. However in the pulse-flow regime a dynamic model would be required to take into account the periodic variation of the wetting efficiency of individual particles. Work along these lines is currently in progress.
3.7. Parameter estimation The values of the operating parameters used in the
numerical simulation are shown in Table 1. The sul- phur containing compounds were simulated by an equimolar mixture of a reactive component Sl and a less reactive component S2. Dibenzothiophene (DBT) was chosen to simulate S2 since it is one of the most abundant less reactive sulphur compounds found in HGO (Houalla et al., 1978; Nag er al., 1979; Houalla et al., 1980; Singhal et al., 1981) and since the kinetics of DBT hydrodesulphurization have been studied exten- sively (Rollmann, 1977; Houalla et al., 1978; Nag et al., 1979; Houalla et al., 1980; Broderick and Gates, 1981; Singhal et al., 1981; Kumar et al., 1984; Broderick, 1980) thiophene (TH) was chosen to represent the more active pseudocomponent Sl. Its activity is ap- proximately 20 times higher than that of DBT (Nag et al., 1979; Vrinat, 1983) and the kinetics of its hydro- desulphurization have been studied in detail (Satterfield and Roberts, 1968). The HDS reactivity of various sulphides, bisulphides and mercaptans found in HGO is very high under typical reactor operating conditions. As a result their conversion is almost complete at very short contact times and therefore these compounds play a very limited role in HDS reactor modelling and design.
Calculated dimensionless parameter values required for the numerical simulation are shown in Table 2. Parameter estimation details are given in Appendix A. Computed effectiveness factors shown in Fig. 11 for two typical ratios of bulk reactant concentrations
Table 1. Operating parameters
T = 345°C P = 90 bar Mass velocities HGO: 2.1 kg/m2 s H,: 0.12 kg/m’s
Catalyst: Houdry HDS-16A d, = 25 mm E = 0.5 M HGO = 210 MS, = 84 (thiophene) MS, = 184 (DET)
d EGO = 600 kg/m3 pHGO = 0.16 x 10m3 Pa.s Sulphur content: 2.2 wt ‘A
Table 2. Computed dimensionless groups
Bi s1 = 148 Bi, = 177 5, = ?f2 = 1.57-0.75 Bi, glS = 50 Bi, gs = 500 H, = 5.6
UrI = l-l.45 a2 = 0.25X).36 r1 = 0.35 <z = 0.21
1330 I. V. YENTEKAKIS and C. G. VAYENAS
‘-
0 .5 1 f
Fig. 11. Effectiveness factor dependence on wetting efficiency for typical hydrodesulphurization conditions of HGO. Curves (a) and (b) correspond to <, = c2 = 1.6 and 5, = l2
= 0.75 respectively. Polar wetting.
exhibit maxima with respect tofwithin the range off values (0.7-l) encountered in practice (Colombo et al., 1976; Morita and Smith, 1978; Herskowitz et al., 1979; Mills and Dudukovic, 198 1; Herskowitz and Mosseri, 1983). The HDS rate of the Iess reactive component is maximized at smallerfvalues. This is primarily due to its lower diffusivity. Because of mass transfer limi- tations the effectiveness factor of the more active component is rather low. Computed effectiveness factors are in good qualitative agreement with indus- trial practice (Cecil et al., 1968; Schuit and Gates, 1973).
4. CONCLUSIONS
A mathematical model has been developed to de- scribe the global kinetic behaviour of reactions be- tween volatile and non-volatile compounds in partially wetted trickle-bed reactor catalyst pellets. Unlike previous studies the analysis assumes no limiting reactant and therefore applies to a number of practical cases where concentrations of dissolved gases and liquid reactants inside the catalyst pellets are com- parable. It is shown that the global reaction rate in a pellet is often maximized for intermediate values of the wetting efficiency and thus complete wetting may not be desirable, as interphase mass transport of the gaseous reactant may be seriously hindered. When the ratios eI, l2 of volatile to non-volatile components approach zero or infinity, then the present results regarding the role of wetting efficiency are in agree- ment with previous studies (Mills and Dudukovic, 1979; Milis and Dudukovic, 1980; Herskowitz, 1981b; Goto ef al., 1981; Zheng et al., 1984b). For fixed wetting efficiency the number and location of wetted zones also play important roles on catalyst performance. Increasing the length of the wetted zones boundaries, significantly enhances catalyst performance.
The single particle model presented here can be used with arbitrary kinetics to predict the local behaviour in trickle-bed reactors operating in the trickle-flow regime. However when the wetting efficiency of indi- vidual particles changes fast with time, as would be the case in the pulse-flow regime, where the pulsing period
(Talmor, 1977) may be comparable to the character- istic diffusion time in the pellets, then steady state models like the one presented here are not applicable and more general dynamic models must be used. Work along this line will be published in a forthcoming communication.
Acknowledgement-This work was supported by the Hellenic Refineries of Aspropyrgos, Greece.
Bi “9 gls
Bi,,
Bi sl, Bi sz
C c
c G,.b SI, b
cv, b
e v, eq
De
d
% f
HV
K
K1? K1
K Is,Slr . K,s s2
K, KL
KS
K gls, v
K g*, v
NOTATION
Biot number of mass transfer of vo- latile component at the liquid-covered surface of the particle, K,,S,vd,,/2D, y Biot number for mass transfer of vb- latile component at the gas-covered surface of the particle, K,, ,d,/2 D, v Biot numbers for mass transfer of non- volatile components Sl and S2 at the liquid-covered surface of the particle, K 1s sld,J2Ds SI, K,s, s,dJ2D,, s2
dimensionless concentration concentration, mole/m3 bulk liquid concentrations of Sl, S2 components, mole/m3 bulk gas concentration of volatile component V, mole/m3 liquid concentration of volatile reactant in equilibrium with its bulk gas concentration, c, JH,, mole/m3 effective diffusivity in liquid-filled catalyst pellet pores density, kg/m3 particle diameter, m wetting efficiency (external), dimen- sionless vapor-liquid equilibrium coefficient of volatile species V, C, dc,. c4 number of computational cells in radial direction kinetic constants of reactions (2) and (3) respectively, m3/mole s liquid to porous solid mass transfer coefficients of nonvolatile reactants Sl, S2, m/s gas film mass transfer coefficient, m/s liquid film mass transfer coefficient, m/s liquid to porous solid mass transfer coefficient, m/s overall gas-liquid-porous solid mass transfer coefficient of volatile reactant V at the wetted external pellet surface, m/s overall gas to porous solid mass trans- fer coefficient of volatile reactant V at the dry external pellet surface

Reactions between volatile and non-volatile components 1331
L
LC I M P r
II. 12
r?, r r
R Sl, s2
T V SIP vS2 VH,
V
number of computational cells in an- Capra, V.. Sicardi, S., Gianetto, A. and Smith, 3. M., 1982, gular direction Effect of liquid wetting on catalyst effectiveness in trickle-
operator defined in eq. (7) bed reactors. Can. J. &em. Engng 60, 282-288.
molecular weight Cecil, R. R., Mayer, F. X. and Cart, E. N., 1968, paper
pressure, Pa presented at Am. Inst. Chem. Engrs Meeting, Los Angeles.
Colombo. A. J.. Baldi. G. and Sicardi, S., 1976, Solid-liquid radial coordinate. m contactmg effectiveness in trickle-bed reactors. C&n. rate of reactions (2) and (3) respect- Engng SC?. 31, 1101-l 108.
ively, mole/m3 s Gates, B. C., Katzer, J. R. and Shuit, G. C. A., 1979, Chemistry
dimensionless rates of reactions (2) of Catalyric Processes, pp. 390443. McGraw-Hill, New York.
and (3) Gianetto. A.. Baldi. G.. Snecchia. V. and Sicardi. S.. 1978. . I
pellet radius, m Hydrody&nics &d ‘solid-liquid contacting effectiveness
liquid reactants; in the case of HGO in trickle-bed reactors. A.1.Ch.E. J. 24, 1087-1104.
high and low reactivity sulphur con- Goto, S. and Smith, J. M., 1975, Trickle-bed reactor perform-
taining pseudocomponents ante, Part I: Holdup and mass transfer effects. A.1.Ch.E. J. 21.706713.
temperature, K Goto; S., Lakota, A. and Levee, J., 1981, Effectiveness factors molal volumes of reactants Sl, S2, H2 on nth order kinetics in trickle-bed reactors. Chem. Engng
at normal boiling point, m3/gmole Sci. 36, 157-162.
volatile reactant Herskowitz, M., 1981a, Effects of wetting efficiency on
selectivity in a trickle-bed reactor. Chem. Engng Sci. 36, 1099-1101.
Greek symbols Herskowitz, M., 1981b, Wetting etiicrency in trickle-bed
stoichiometric coefficients in reactions reactors. The overall effectiveness factor of partially wetted
(2) and (3) respectively catalyst particles. Chem. Engng Sci. 36, 16651671.
Herskowitz, M. and Mosseri, S., 1983, Global rates of particle porosity, dimensionless effective diffusivity ratios D, sl/D, v,
D, s2lD, v respectively effectiveness factors for reactions (2) and (3) effectiveness factors for completely wetted pellet effectiveness factor defined in eq. (16) azimuthal angle wetting angle shown in Fig. 1 viscosity, Pa s ratio of equilibrium volatile to non- volatile reactant concentrations, cv,.,!cSl, b> cv,,,~cS2. b dimensionless radial coordinate, r/R Thiele moduli for reactants S 1 and S2, defined after eq. (7)
refer to reactions (2) and (3) respectively bulk conditions gas phase liquid phase completely wetted pellet surface
REFERENCES
Mills, P. L. and Dudukovic, M. P., 1980, Analysis of catalyst effectiveness in trickle-bed reactors processing volatile or nonvolatile reactants. Chem. Engng Sci. 35, 2267-2279.
Mills, P. L. and Dudukovic, M. P., 198 1, Evaluation of liquid- solid contacting in trickle-bed reactors by tracer methods. A.1.Ch.E. J. 27, 893-904.
Morita, S. and Smith, J. M., 1978, Mass transfer and Broderick, D. H., 1980, Ph.D. Thesis, University of Delaware, contacting efficiency in a trickle-bed reactors. Imf. Engng
Newark. Chem. Fun&m. 17, 113-120. Broderick, D. H. and Gates, B. C., 1981, Hydrogenolysis and Nag, N. K., Sapre, A. V., Broderick, D. H. and Gates, B. C.,
hydrogenation of dibenzothiophene catalyzed by sul- 1979, Hydrodesulfurization of polycyclic aromatics cata- nhided CoC%MoOx /Y-AI-O,: the reaction kinetics. lvzed bv sulfide CO&MOO,IY-Al,O*: the relative
reaction in trickle-bed reactors: .effects- of gas and liquid flow rates. Ind. Engng Chem. Fundam. 22, 4-6.
Herskowitz, M. and Smith, J. M., 1983, Trickle-bed reactors: a review. A.f.Ch.E. J. 29, l-18.
Herskowitz, M., Carbonell, R. G. and Smith, J. M., 1979, Effectiveness factors and mass transfer in trickle-bed reactors. A.1.Ch.E. J. 25, 272-282.
Houalla, M., Nag, N. K., Sapre, A. V., Broderick, D. H. and Gates, B. C., 1978, Hydrodesulfurization of dibenzothio- phene catalyzed by sulfided COO-Moos/y-Al,O,: the reaction network. A.I.Ch.E. J. 24, 1015-1021.
Ho&la. M.. Broderick. D. H., Same, A. V., Nag, N. K., De Beer, ‘V. -H. J., Gates, B: C, and Kwar<- H., 1980, Hydrodesulfurization of methyl-substituted dibenzothio- phenes catalyzed by sulfided CoMo/y-Al,O1. J. Catal. 61, 523-527.
Knmar, M., Akgerman, A. and Anthony, R. G., 1984, Desulfurization by in situ hydrogen generation through water gas shift reaction. Ind. Engng Chem Processes, Des. Dev. 23, 88-93.
Lee, H. H. and Smith, J. M., 1982, Trickle-bed reactors: criteria of negligible transport effects and of partial wetting. Chem. Engng Sci. 37, 223227.
Mahajani, V. V. and Sarma, M. M., 1979, Effective interfacial area and liquid-particle mass transfer in trickle-beds. A.I.Ch.E. J. if3, I!%-195.
Mills, P. L. and Dudukovic, M. P., 1979, A dual-series solution for the effectiveness factor of partially wetted catalysts in trickle-bed reactors. Ind. Engng Chem. Fundam. 18, 139149.
i1.Ch.E. J. 27, 663-673. - - rkactivitiks. .I. Catal. 57, 50951Z:. _ - Brunner. E.. 1985. Solubilitv of hvdronen in 10 organic Ramachandran. P. A. and Smith. J. M., 1979. Effectiveness
solvents at 298.15, 323.15 and 373.i5 KyChem. Engng%ara factors in trickle-bed reactors. -A.I.ChE. J. 25, 538-542. 30, 269-273. Ramanujam, S., Leipziger, S. and Well, S. A., 1985,
1332 1. V. YENTEKAKIS and C. G. VAYENAS
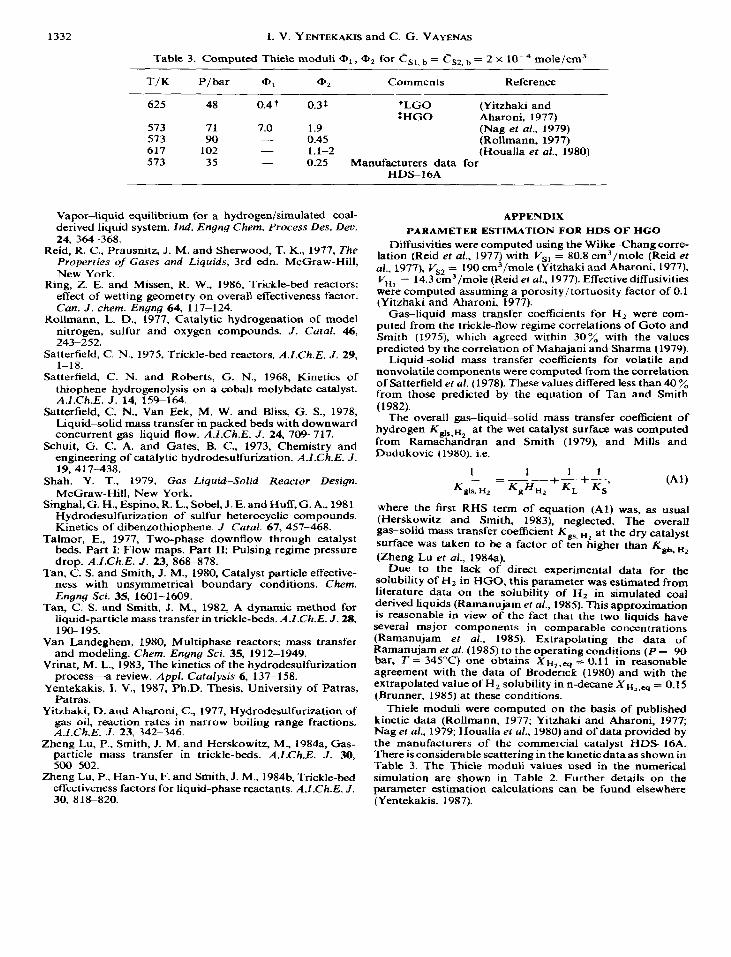
Table 3. Computed Thiele moduli Q1, @, for es,, b = csz, b = 2 x lOA mole/cm3
T/R P/bar Comments Reference
625 48
573 71 573 90 617 102 573 35
0.4 t
7.0 -
0.3% tLG0 (Yitzhaki and ZHGO Aharoni, 1977)
1.9 (Nag et al., 1979) 0.45 (Rollmann, 1977) 1.1-Z (Houalla et al., 1980) 0.25 Manufacturers data for
HDS16A
Vapor-liquid equilibrium for a hydrogen/simulated coal- derived liquid system. Znd. Engng Chem. Process Des. Dev. 24, 364-368.
Reid, R. C., Prausnitz, J. M. and Sherwood, T. K., 1977, The Properties of Gases and Liquids, 3rd edn. McGraw-Hill, New York.
Ring, 2. E. and Missen, R. W., 1986, Trickle-bed reactors: effect of wetting geometry on overall effectiveness factor. Can. J. them. Engng 64, 117-124.
Rollmann, L. D., 1977, Catalytic hydrogenation of model nitrogen, sulfur and oxygen compounds. J. Catal. 46, 243-252.
Satterfield, C. N., 1975, Trickle-bed reactors. A.Z.Ch.E. J. 29, l-18.
Satterfield, C. N. and Roberts, G. N., 1968, Kinetics of thiophene hydrogcnolysis on a cobalt molybdate catalyst. A.Z.Ch.E. J. 14, 159-164.
Satterfield, C. N., Van Eek, M. W. and Bliss, G. S., 1978, Liquid-solid mass transfer in packed beds with downward concurrent gas-liquid flow. A.Z.Ch.E. J. 24, 709-717.
Schuit, G. C. A. and Gates, B. C., 1973, Chemistry and engineering of catalytic hydrodesulfurization. A.Z.Ch.E. J. 19, 417438.
Shah. Y. T., 1979, Gas-Liquid-Solid Reactor Design. McGraw-Hill, New York.
Singhal, G. H., Espino, R. L., Sobel, J. E. and Huff,,. A., 1981 Hydrodesulfurization of sulfur heterocyclic compounds. Kinetics of dibenzothiophene. J. Catal. 67, 457468.
Tahnor, E., 1977, Two-phase downflow through catalyst beds. Part I: Flow maps. Part II: Pulsing regime pressure drop. A.Z.Ch.E. J. 23, 868-878.
Tan, C. S. and Smith, J. M., 1980, Catalyst particle effective- ness with unsymmetrical boundary conditions. Chem, Engng Sci. 35, 160-1609.
Tan, C. S. and Smith, J. M., 1982, A dynamic method for liquid-particle mass transfer in trickle-beds. A.Z.Ch.E. J. 28, 190-195.
Van Landeghem, 1980, Multiphase reactors: mass transfer and modeling. Chem. Engng Sci. 35, 1912-1949.
Vrinat, M. L., 1983, The kinetics of the hydrodesulfurization process-a review. Appl. Catalysis 6, 137-158.
Yentekakis, 1. V., 1987, Ph.D. Thesis, University of Patras, Patras.
Yitzhaki. D. and Aharoni. C.. 1977. Hvdrodesulfurization of gas oii, reaction rates in narrow boiling range fractions. A.Z.Ch.E. J. 23, 342-346.
Zhene Lu. P.. Smith. J. M. and Herskowitz. M.. 1984a. Gas- par‘iicle mass transfer in trickle-beds. A.Z.Ch.E. j. 30, 500-502.
Zheng Lu, P., Han-Yu, F. and Smith, J. M., 1984b, Trickle-bed effectiveness factors for liquid-phase reactants. A.Z.Ch.E. J. 30, 8 18-820.
APPENDIX PARAMETER ESTIMATION FOR HDS OF HGO
Diffusivities were computed using the WilkeChang corre- lation (Reid er al., 1977) with Vsl = 80.8 cm3/mole (Reid et al., 1977), V,, = 190 cm3/mole (Yitzhaki and Aharoni, 1977) V = 14.3 cm3/mole (Reid et al., 1977). Effectivediffusivities wt;e computed assuming a porosity/tortuosity factor ofO.l (Yitzhaki and Aharoni, i977).
Gas-liquid mass transfer coefficients for H, were com- puted from the trickle-flow regime correlations of Goto and Smith (1975), which agreed within 30% with the values predicted by the correlation of Mahajani and Sharma (1979).
Liquid-solid mass transfer coefficients for volatile and nonvolatile components were computed from the correlation of Satterfield et al. (1978). These values differed less than 40 y0 from those predicted by the equation of Tan and Smith (1982).
The overall gas-liquid-solid mass transfer coefficient of hydrogen Kgls,B, at the wet catalyst surface was computed from Ramachandran and Smith (1979), and Mills and Dudukovic (1980), i.e.
641)
where the first RHS term of equation (Al) was, as usual (Herskowitz and Smith, 1983), neglected. The overall gas-solid mass transfer coefficient K,, HZ at the dry catalyst surface was taken to be a factor of ten higher than K,, H1 (Zheng Lu et al., 1984a).
Due to the lack of direct experimental data for the solubility of Hz in HGO, this parameter was estimated from literature data on the solubility of Hz in simulated coal derived liquids (Ramanujam et al., 1985). This approximation is reasonable in view of the fact that the two liquids have several major components in comparable concentrations (Ramanujam et al., 1985). Extrapolating the data of Ramanujam et al. (1985) to the operating conditions (P = 90 bar, T = 345°C) one obtains XB2 _eq = 0.11 in reasonable agreement with the data of Broderrck (1980) and with the extrapolated value of H, solubility in n-decane X RI.MI = 0.15 (Brunner, 1985) at these conditions.
Thiele moduli were computed on the basis of published kinetic data (Rollmann, 1977; Yitzhaki and Aharoni, 1977; Nag et al., 1979; Houalla et ul., 1980) and of data provided by the manufacturers of the commercial catalyst HDS-16A. There is considerable scattering in the kinetic data as shown in Table 3. The Thiele moduli values used in the numerical simulation are shown in Table 2. Further details on the parameter estimation calculations can be found elsewhere (Yentekakis, 1987).