effectiveness of a community-based participatory …
TRANSCRIPT

EFFECTIVENESS OF A COMMUNITY-BASED
PARTICIPATORY NUTRITION PROMOTION PROGRAM TO
IMPROVE CHILD NUTRITIONAL STATUS IN EASTERN
RURAL ETHIOPIA: A CLUSTER RANDOMIZED TRIAL
by
Yunhee Kang, MS.
A dissertation submitted to Johns Hopkins University in conformity with
the requirements for the degree of Doctor of Philosophy
Baltimore, Maryland
March, 2015
© 2015 Yunhee Kang
All rights reserved

ii
ABSTRACT
Background: Appropriate complementary feeding and hygiene may reduce child
undernutrition. To improve child nutritional status and feeding and hygiene behaviors
in rural Ethiopia, a community-based participatory nutrition promotion (CPNP)
program was designed, adapting positive deviance theory and involving two-week
group nutrition sessions. This program was implemented to complement the existing
Essential Nutrition Action (ENA) and Community-based Management of Acute
Malnutrition (CMAM) programs. The effectiveness of the CPNP program in
improving child growth and caregiver feeding and hygiene practices was tested in a
cluster randomized, controlled trial using the existing programs alone as the control
group. To better understand how the CPNP achieved expected outcomes, we
evaluated the following five key intervention components, using a program impact
pathway (PIP) analysis approach: (1) quality of the CPNP implementation (2)
participants’ acceptance of the program, (3) participants’ recall of delivered messages
(4) child feeding practices and nutritional status at the community level, and (5) the
influence of CPNP on participation in the existing ENA and CMAM programs.
Methods: The CPNP program was launched on August 2012 in Habro and
Melka Bello districts of Oromia region of Ethiopia. The districts were divided into 12
clusters of which the CPNP was implemented in 6, while the ongoing programs of
ENA and CMAM were carried out in all 12 clusters. Out of 2,064 (1,032 per group)
child and mother pairs randomly selected from the locally prepared child rosters in
Habro and Melka Bello districts, 1,790 children 6 to 12 months of age and their
mothers, 914 and 876 pairs in the control and intervention areas, respectively, were
enrolled in the study in November 2012, four months after the CPNP program had
started. Enrolled children were followed over the next 12-months and measured for

iii
length and weight every three months. At each visit the mothers were asked about the
child’s diet using 24-hour-based dietary recall questionnaire, and infant and young
child feeding (IYCF) practices every month, whereas hand washing practices were
elicited every six months. Length-for-age (LAZ), weight-for-length (WLZ), and
weight-for-age (WAZ) z scores, and stunting (LAZ<-2), wasting (WLZ<-2), and
underweight (WAZ<-2) status were calculated using the WHO reference population.
Child feeding scores for current breastfeeding (range 0-7), meal frequency (range 0-
15), dietary diversity (DDS, range 0-10), hand washing (range 0-6), and two
composite feeding scores combining different variables were constructed to represent
a 12-month feeding and hygiene practice pattern. For process evaluation, we reviewed
attendance records for 3,299 participants and conducted group session observation
checklists of 114 sessions and extracted data to construct process indicators such as
dose delivered, dose received, and fidelity. Mothers were also asked every three
months whether they were involved in the ENA and CMAM programs. A small
survey of individuals who directly participated in the nutrition sessions (n = 197) was
conducted to examine their own acceptance of the CPNP program and recall of
messages provided in the nutrition sessions. Multilevel mixed-effects linear regression
models using longitudinal data and Cox regression for recurrent event models for
stunting, underweight, and wasting episodes were used.
Results: We conducted an intention-to-treat analysis. A total of 1,475 children—
750 and 725 children in the control and intervention area who were measured at least
two out of five times, respectively—were included in the analysis of child growth.
After controlling for clustering effects and enrollment characteristics, children in the
intervention area had a significantly greater LAZ/month of 0.021 (95% CI: 0.008,
0.034), WAZ/month of 0.015 (95% CI: 0.003, 0.026), length/month of 0.059 cm (95%
iv
CI: 0.027, 0.092), and weight/month of 0.031kg (95% CI: 0.019, 0.042) compared to
children in the control area. There was no difference in the risk of recurrent incidence
of stunting [Hazard Ratio (HR) 1.01, 95% CI: 0.811], underweight (HR 0.826, 95%
CI: 0.643, 1.061), or wasting (HR 1.048, 95% CI: 0.812, 1.354) between intervention
and control areas. Prevalence of stunting was lower in the intervention area by 7.5%
at the 9 month follow-up (p = 0.037) and by 7.3% at 12 month of follow-up (not
significant). Of 1,199 mothers, those in the intervention area (n = 570) showed higher
scores on meal frequency (diff: 1.02, 95% CI: 0.33, 1.70), and both composite feeding
scores (type 1, diff: 1.30, 95% CI: 0.41, 2.19) (type 2, diff: 1.39, 95% CI: 0.48, 2.23)
than mothers in the control area (n = 629), but there were no differences in scores of
current breastfeeding (diff: -0.08, 95% CI: -0.22, 0.06), dietary diversity (diff: 0.38,
95% CI: -0.21, 0.98), or hand washing (diff: 0.41, 95% CI: -0.21, 1.02) between
mothers in the two areas. The CPNP sessions were delivered at 81% of the
expectation level; fidelity to intervention protocols varied between 68% and 92%. Out
of 197 CPNP participants, 95% had ever contributed materials to a session and 90%
showed positive perceptions of the session practices. For each of the session activities
(e.g., food preparation), ~70% rated their participation level as active. The
participants recalled 5.0 ± 2.0 (SD) out of the 8 messages (e.g., preparing nutritious
complementary foods). We also observed improvements in feeding and hygiene, i.e.,
minimum dietary diversity (34.0% vs. 19.9%, p < 0.05) and mother’s cleanliness
(40.0% vs. 24.0%, p < 0.05) at an early stage of the CPNP, and a higher involvement
of CPNP participants in the existing program (e.g., Essential Nutrition Action) over
the project period compared to non-participants within the same intervention area
(32.3% vs. 19.8%, p < 0.001).

v
Conclusions: A community-based participatory nutrition program approach
adapting the positive deviance model was found to be effective in improving child
feeding practices among caregivers and child growth in the rural Ethiopian context.
Using a PIP analysis, our results suggest that the CPNP program was adequately
implemented and well-accepted among participants. Program impact was seen in the
early stages of the program implementation, although a true baseline was not
available, giving the additional benefit of positively influencing the ongoing ENA
program, and eventually resulting in improved child nutritional status.
DISSERTATION COMMITTEE
DISSERTATION COMMITTEE MEMBERS
Parul Christian (Advisor), DrPH, Professor, International Health
David Paige (Chair), MD, Professor, Population, Family and Reproductive
Health
Keith P. West, DrPH, Professor, International Health
Elizabeth Colantuoni, PhD, Associate Scientist, Biostatistics
DISSERTATION COMMITTEE MEMBER ALTERNATES
Robert S. Lawrence, MD, Professor, Environmental Health
Kristen Hurley, PhD, Associate Professor, International Health

vi
ACKNOWLEDGEMENT
My upmost thanks to sincere God for giving me a passion for addressing child
undernutrition issue in developing countries and leading me to the best place to study
international nutrition and best people to work and study together. He listened my
prayer in the beginning of my life as a Ph.D student in the Johns Hopkins and replied
to me with most beautiful things that I could not even imagine.
I would like to deeply thank my wonderful advisor, Dr. Parul Christian.
Whenever I faced difficult situations, she gave me clear direction, lavished her
support and patience, and became a strong buttress to me. Because of her support, I
could listen to the voice form my heart beyond the situation and get the courage to
choose this research opportunity despite a lot of challenges.
I am grateful for Dr. Keith West’s encouragement, and wider and insightful
perspectives of international nutrition research. His humble leadership to lead the
JiVitA and the Human Nutrition program gave me deep impression.
I have many other faculty to thank for their support and lessons. As my
dissertation committee, I would like to thank Dr. David Paige for his warm heart,
kindness, and great passion to learning. Thanks to Dr. Elizabeth Colentuoni for her
wonderful and kind comments on statistical analysis. Thanks to Dr. Kristen Hurly and
Dr. Robert Lawrence for being my dissertation committee alternates so generously
and willingly. I thank to my department and school-wide examination committees;
Drs. Hee-soon Juon, Laura Caulfield, David Peters, Saifuddin Ahmed, and Rimal
Rajiv. I give many thanks to Lee Shu Fune Wu, Sucheta Mehra, Peggy Bremer,
Rhonda Skinner, Tom Durkin, Carol Buckley, and Cristina Salazar.
To enable this study to work in Ethiopia, there were countless number of
people who supported this research. Without them, this research would be impossible.
vii
First, I am indebted to all mothers and children in the Habro and Melka Bello
districts, who were involved in the Ethiopia Integrated Nutrition Project (EINP) and
this research. I want to thank Sungtae Kim, Director of International Ministry
Division of World Vision Korea. He conceived a hope to prepare a research to be
used for undernourished children in developing countries, initiated this research
project, and supported it up to now. Along together, thanks to partners in World
Vision Korea, Heechan Roh, Sarah Yeo, and Jieun Lee for their continued support. I
am thankful to Seungman Cha and Se-eun Park, who had prepared together this
research in the beginning.
I am grateful to WITH for their support for this research and their prayers,
especially to Younkyoung Suh, Jisung Woo, Eunjoo Yang, and Miran Kwak. Pastor
Byongsung Kim, and Yongsook Lee, president of WITH.
I would like to offer special thanks to Ethiopian colleagues. Many thanks to
our data collectors and data management team for their hard work under the harsh
environment, especially two team leaders, Asnake and Anish. Thanks to the EINP
project team, Lemma Debele, Tadesse Abera, and Imiru Waqjira, who successfully
implemented the EINP project as well as supported the field research operation.
Along together, deep thanks for the huge support from World Vision Ethiopia head
office in Addis Ababa, Area Development Program offices in Habro and Melka Bello
district, district health offices in Habro and Melka Bello communities. I would like to
send my love and warm regards to my kid friends in Habro, who were my joy and let
me realize the reason of my study in Ethiopia.
Thanks to Dr. Bridget and Dr. Sisay for supporting these research findings to
be translated to the World Vision nutrition programs.
This dissertation research was possible with many generous financial support.
viii
First I gratefully acknowledge World Vision Korea and KOICA’s support for this
research and the EINP. Also I have benefited through generous financial support by
DSM scholarship, Sarang Church (Oak scholarship), WITH, Elsa Orent Keiles
fellowship, the George G. Graham Professorship Endowment, Dr. Parul Christian,
and Dr. Byoungki Cho of Standardia, for continuation of my Ph.D study.
I would like to thank to our amazing dissertation support group; Sunny,
Megan, Dorothy, Bess, Ramya, Myra, and Jen. All our struggling, frustration,
achievement, friendship, and encouragement until completing dissertation should be
remembered. We rode the waves of dissertation defense, holding hands together. Most
deep thanks to Sunny, who accompanied me like my family on this six years long
journey.
Thanks to many friends who gave me great insight and strength; Muzi,
Maxwell, Sohyun Park, Lenis, Seunghee, Hsin-jen Chen, Jinhee, Youngji Cho, Lois,
and Jisung and many Korean MPH and MSPH students who supported my
preparation of dissertation.
And last but not least, I want to acknowledge my family in South Korea for
their unconditional support, love, and patience. My Mom and Dad, Hyunjyoung,
Jonghyoung, Hansol, and Su-ho... I am so proud of you all.

ix
TABLE OF CONTENTS
ABSTRACT ............................................................................................................. II
ACKNOWLEDGEMENT .................................................................................... VI
CHAPTER 1. INTRODUCTION ............................................................................ 1
1.1 PROBLEM STATEMENT ............................................................................... 1
1.2 SUMMARY OF DISSERTATION CHAPTERS ............................................ 7
CHAPTER 2. LITERATURE REVIEW.............................................................. 14
2.1 CHILD UNDERNUTRITION: GLOBAL PERSPECTIVES ........................ 14
2.2 INFANT AND YOUNG CHILD FEEDING IN DEVELOPING
COUNTRIES .................................................................................................. 18
2.3 CHILD FEEDING INDEX ............................................................................ 21
2.4 COMPLEMENTARY FEEDING TRIALS ................................................... 22
2.5 POSITIVE DEVIANT HEARTH PROGRAMS ........................................... 27
2.6 PROCESS EVALUATIONS IN NUTRITION INTERVENTIONS ............. 30
2.7 NUTRITION SITUATION ANAYLSIS IN ETHIOPIA ............................... 32
CHAPTER 3. STUDY DESIGN AND METHODS ............................................. 53
3.1 OVERVIEW ................................................................................................... 53
3.2 STUDY DESIGN AND POPULATION ....................................................... 56
3.3 DEVELOPMENT OF THE INTERVENTIONS ........................................... 66
3.4 DATA COLLECTION ................................................................................... 74
3.5 DATA MANAGEMENT AND QUALITY CONTROL ............................... 82
3.6 STATISTICAL ANALYSIS .......................................................................... 83
3.7 ETHICAL CONSIDERATIONS ................................................................... 89
3.8 TIMELINE ..................................................................................................... 90
CHAPTER 4. EFFECTIVENESS OF A COMMUNITY-BASED
PARTICIPATORY NUTRITION PROMOTION PROGRAM TO
IMPROVE CHILD GROWTH IN EASTERN RURAL ETHIOPIA ............... 97
4.1 ABSTRACT ................................................................................................... 97
4.2 INTRODUCTION .......................................................................................... 98
4.3 METHODS ................................................................................................... 101
4.4 RESULTS ..................................................................................................... 110
4.5 DISCUSSION ............................................................................................... 113

x
CHAPTER 5. EFFECTIVENESS OF A COMMUNITY-BASED .................. 136
5.1 ABSTRACT ................................................................................................. 136
5.2 INTRODUCTION ........................................................................................ 137
5.3 SUBJECTS AND METHODS ..................................................................... 139
5.4 RESULTS ..................................................................................................... 148
5.5 DISCUSSION ............................................................................................... 151
CHAPTER 6. PROGRAM IMPACT PATHWAY ANALYSIS OF A
COMMUNITY-BASED PARTICIPATORY NUTRITION PROMOTION
APPROACH TO IMPROVE CHILD FEEDING AND HYGIENE
PRACTICES IN RURAL ETHIOPIA ............................................................... 174
6.1 ABSTRACT ................................................................................................. 174
6.2 INTRODUCTION ........................................................................................ 175
6.3. METHODS .................................................................................................. 182
6.4 RESULTS ..................................................................................................... 188
6.5 DISCUSSION ............................................................................................... 193
CHAPTER 7. DISCUSSION ............................................................................... 216
APPENDIX............................................................................................................ 224
CURRICULUM VITAE ...................................................................................... 272
xi
TABLES
CHAPTER 3
Table 3.1 Projected sample sizes per cluster and in total for a range of minimal
detectable difference in LAZ scores and standard deviation differences ......... 64
Table 3.2 Estimated number of children enrolled to intervention groups based
on proportionate to the population size of the clusters....................................... 65
Table 3.3 Summary of key interventions of the CPNP, ENA, and CMAM
programs ............................................................................................................ 67
Table 3.4 EINP site and target population ........................................................ 68
Table 3.5 An example of the CPNP menu and its nutrient composition .......... 69
Table 3.6 Summary of data collection methods and main outcomes by
evaluation component of the community-based participatory nutrition
promotion (CPNP) program ............................................................................. 81
Table 3.7 Intervention implementation schedule and data collection activities by
month ............................................................................................................. 91
CHAPTER 4
Table 4.1 Comparison of characteristics at visit1 for the Ethiopia Integrated
Nutrition Project (EINP) trial ......................................................................... 120
Table 4.2 Program participation and use of services in Essential Nutrition
Action (ENA) activity and Community-based Management of Acute
Malnutrition (CMAM) programs and among mothers in control and
intervention areas .......................................................................................... 122
Table 4.3 Longitudinal regression models for average marginal monthly effect
of intervention on child-growth outcomes compared with control group ...... 123
Table 4.4 Longitudinal regression models for average marginal monthly effect
of intervention on child-growth outcomes compared with control group/CPNP
group at individual level ................................................................................. 126
Table 4.5 Effect of a community-based participatory nutrition promotion
(CPNP) on the risk of stunting, underweight, and wasting during the 12 month
follow-up ........................................................................................................ 127
xii
CHAPTER 5
Table 5.1 Scoring system used to construct scores for breastfeeding, meal
frequency, dietary diversity (DDS), and hand washing and a composite feeding
score ................................................................................................................ 158
Table 5.2 Scores of breastfeeding, meal frequency, dietary diversity (DDS),
composite feeding and hand washing for all five visits among study mothers in
control and intervention areas ......................................................................... 161
Table 5.3 Scores of breastfeeding, meal frequency, dietary diversity (DDS),
composite feeding and hand washing for all five visits among non-CPNP
participants and CPNP participants in intervention area ................................ 163
CHAPTER 6
Table 6.1 Summary of data collection methods and main outcomes by
evaluation component of community-based participatory nutrition promotion
(CPNP) ............................................................................................................ 202
Table 6.2 Enrollment in Community-based Participatory Nutrition Education
(CPNP) program by month at intervention area ............................................. 204
Table 6.3 Community-based participatory nutrition promotion (CPNP)
implementation process I: evaluated by percentage of dose delivered, dose
received, and fidelity to protocols .................................................................. 205
Table 6.4 Community-based participatory nutrition promotion (CPNP)
implementation process II: evaluated by indicators of fidelity to protocols using
observation evaluation .................................................................................... 206
Table 6.5 Participants’ acceptance to the program: degree of participation and
contribution, and perception among participants of community-based
participatory nutrition education (CPNP) program ........................................ 207
Table 6.6 Participants’ recall for session messages and food ingredients to the
community-based participatory nutrition promotion (CPNP) session ........... 208
Table 6.7 Infant and young child feeding (IYCF) and hygiene practices among
the study subjects in control area and intervention area, and subjects who
participated CPNP session in the intervention area at first round of survey .. 209
Table 6.8 Exposure to the Essential Nutrition Action (ENA) activity and
Community-based Management of Acute Malnutrition (CMAM) program
among surveyed mothers in control area, and non-CPNP participants and CPNP
participants in the intervention area ................................................................ 210
xiii
FIGURES
CHAPTER 3
Figure 3.1 Program logic model to describe expected input, activities, outputs,
and outcomes of CPNP, ENA and CMAM programs ...................................... 55
Figure 3.2 Clustering and intervention allocation ............................................ 60
Figure 3.3 Study design for the proposed study ............................................... 62
Figure 3.4 Structure of EINP project team and research team ......................... 75
CHAPTER 4
Figure 4.1 Consort diagram for trial participants from trial enrollment through
12 months follow-up ..................................................................................... 119
Figure 4.2 Predicted length-for-age, weight-for-age, and weight-for-length z
scores, and length and weight of children in control and intervention areas
during 6 to 24 months of age ............................................................................ 124
Figure 4.3 Predicted length-for-age, weight-for-age, and weight-for-length z
scores, and length and weight of children in control and intervention areas
during 12-month follow-up ............................................................................ 125
Figure 4.4 Prevalence of stunting at visit 4 (9 month follow-up) and visit 5 (12
month follow-up ............................................................................................. 128
CHAPTER 5
Figure 5.1 Consort diagram for trial participants from enrollment through the
12-month follow-up ........................................................................................ 159
Figure 5.2 Unadjusted mean (95% Confidence Interval) child feeding and
hygiene scores at five visits, each three months apart, among study subjects in
control area and intervention area .................................................................. 160
Figure 5.3 Unadjusted mean (95% Confidence Interval) child feeding and
hygiene scores at five visits, each three months apart, among non-CPNP
participants and CPNP participants in intervention area ................................ 162
CHAPTER 6
Figure 6.1 Conceptual program impact pathway (PIP) of program activities,
proximal outcomes, and impact outcomes of community-based participatory
nutrition promotion (CPNP) ........................................................................... 201

xiv
PAPER APPENDIX TABLES
Appendix 4.1 Anthropometric measurements in control and intervention area
over 12 month follow-up by visit ................................................................... 129
Appendix 5.1 Scores of breastfeeding, feeding frequency, dietary diversity,
composite feeding and hand washing among study mothers in control area and
intervention area ............................................................................................. 164
Appendix 5.2 Scores of breastfeeding, feeding frequency, dietary diversity,
composite feeding and hand washing among non-CPNP participants and CPNP
participants in the intervention area ................................................................ 165
Appendix 6.1 Periodical trend of participation of Community-based
Participatory Nutrition Education (CPNP) program, EINP project ............... 211
xv
ABBREVIATION
ADP Area Development Programs
CMAM Community-Based Management of Acute Malnutrition
CSB Corn-Soy Blend
CPNP Community-based Participatory Nutrition Promotion
DAC Development Assistance Committee
DALY Disability-Adjusted Life-Years
DHO District Health Office
EDHS Ethiopia Demographic and Health Survey
EIHNP Ethiopia Integrated Health and Nutrition Project
ENA Essential Nutrition Action
GEE Generalized Estimating Equation
LAZ (HAZ) Length (Height)-for-age z score
HEP Health Extension Program
HEWs Health Extension Workers
HFIAS Household Food Insecurity Access Scale
ICC Intra-cluster Correlation Coefficient
IYCF Infant and Young Child Feeding
KOICA Korea International Cooperation Agency
MCH Maternal and Child Health
MDGs Millennium Development Goals
MICS Multiple Indicator Cluster Survey
MUAC Mid-Upper Arm Circumference
NNP National Nutrition Program
NNS National Nutrition Strategies
ODA Official Development Aid
ORHB Oromia Regional Health Bureau
OTP Outpatient Therapeutic Program
PD Hearth Positive Deviant Hearth
RCT Randomized Controlled Trial
RUTF Ready to use Therapeutic Foods
SC Stabilization Center
SFP Supplementary Feeding Program
VCHWs Volunteer Community Health Workers
WAZ Weight-for-age z score
WHO World Health Organization
WLZ (WHZ) Weight-for-length (height) z score
WITH Wholistic Interest Through Health
WVE World Vision Ethiopia
WVK World Vision Korea
1
CHAPTER 1. INTRODUCTION
1.1 PROBLEM STATEMENT
Child undernutrition accounts for more than one third of preventable deaths among
children under five years of age in developing countries (1). Undernutrition begins at
conception onwards, and failure to address undernutrition at an early life stage
adversely affects later life stages by increasing the risk of childhood morbidity, poor
academic performance at school, increased susceptibility to non-communicable
diseases, and less economic productivity (2). Globally, 161.5 million (24.5%) children
under five year of age were estimated to be stunted, 98.9 million (15.0%) were
underweight, and 50.8 million (8%) were wasted (3).
The Lancet series in 2008 introduced 13 nutrition-specific interventions that
had been shown to be effective in reducing child undernutrition (4). Recently the
second Lancet series in 2013 further expanded on these interventions (5). Out of
effective interventions, approaches to improve appropriate complementary feeding
practices presented promising results in a few studies. Nutrition education about
complementary feeding could lead to an increase in height-for-age z (HAZ) scores by
0.25 (95% CI, 0.01 to 0.49) in food-secure countries (6-8).
Most randomized controlled trials have presented primary outcomes of
interest, but what and how such interventions were implemented, modified, and
accepted remains unexamined or described in a limited way (9-11). Lack of
understanding in the implementation process of community nutrition programs that
are based on behavior change communication strategies is likely to hinder effective
program development, implementation, and scaling up to other similar settings. In
response to these questions, a theory-driven program impact pathways (PIP) analysis
applying process evaluation has been proposed and utilized to open the “black box” of

2
programs (9-12). In a 2008 WHO/UNICEF meeting, the term program impact
pathway (PIP) was defined as “the pathway from an intervention input through
programmatic delivery, household and individual utilization to its desired impact”
(13). A PIP analysis can reveal the various operational components of a program,
identify successes and failures in the mechanisms by which programs are expected to
impact outcomes. Until now, only a few implementation studies have examined the
implementation processes of complementary feeding trials and conducted a PIP
analysis, to demonstrate the adequacy and the feasibility of these interventions (14-
20).
Ethiopia has a high burden of child undernutrition. In 2011 the Ethiopia
Demographic and Health Survey (EDHS) reported the prevalence of stunting,
wasting, and underweight among children under five years of age to be 44.4%, 9.7 %,
and 28.7%, respectively (21). For decades, emergency nutrition programs have
tackled the problems of undernutrition in Ethiopia, but recent study findings indicate
that its causes have multifaceted features, and includes not only food insecurity (22),
but poor maternal and child feeding and caring practices (23-25), prenatal influences
(25, 26), poor access to and low utilization of community health services (27-29), and
fundamentally deep-rooted poverty. To address such nutritionally vulnerability, the
Ethiopian government has made efforts by launching National Nutrition Strategies
(NNS)/Programs (NNP) which includes the Essential Nutrition Action (ENA) activity
and the Community-Based Management of Acute Malnutrition (CMAM) program.
ENA is designed to deliver nutrition counseling to caregivers through
community volunteers. The main messages of the ENA program are to promote
optimal breastfeeding, appropriate complementary feeding, caring for sick children,
and to prevent micronutrient deficiencies (30). Programs based on the ENA approach
3
in Ethiopia and Madagascar have shown to significantly improve breastfeeding and
complementary practices (31). Although the ENA program has critical components to
prevent child malnutrition, the current community health system in Ethiopia is
unlikely to support the ENA service delivery. In this context, the ENA activity is
largely about delivering brief nutrition messages to caregivers through Health
Extension Workers (HEWs)/community volunteers. These HEWs are often
overburdened with already huge service duties (32, 33). Community volunteers,
whose work is to support the HEWs, and have been found to have inadequate
knowledge about ENA key messages and have poor counseling skills in convincing
mothers to keep recommended practices (32). In addition, the current community
health system has an unclear supervision structure and no specific incentives for the
community volunteers’ activities, as identified in other settings where community
health workers play key roles in delivering primary health services (34, 35).
The CMAM program aims to treat acutely malnourished children with
therapeutic or supplementary foods (36), and has been shown to be effective in
treating malnutrition cases in emergent and developing settings (37, 38), but the
program depends entirely on external aid to purchase therapeutic and supplementary
foods, without touching fundamental causes of child undernutrition (37).
Subsequently, oftentimes the caregivers remain unaware of the ways to handle such
cases without dependence on the therapeutic foods.
To compensate for these disadvantages of the CMAM and ENA programs,
World Vision designed a community-based participatory nutrition promotion (CPNP)
and incorporated the CPNP program into the existing context of ENA and CMAM
programs. The CPNP, as a behavior change communication intervention, adapted the
Positive Deviant Hearth (PD Hearth) program components, such as nutrition

4
rehabilitation sessions for two weeks, follow-up visits, and growth-monitoring
activities (39). The PD Hearth approach identifies behaviors practiced and menus
prepared by caretakers of well-nourished children, positive deviants, living in the poor
community (40, 41). These culturally acceptable and affordable practices are shared
with other caregivers with malnourished children in the Hearth sessions. Conversely,
the CPNP—adapting a structured implementation process—prepares nutritionally
balanced menus designed by World Vision nutrition specialists using locally
affordable and available foods (42), and delivers universal complementary feeding
guidelines without finding context-specific practices (43).
Adding the CPNP into the existing Ethiopian nutrition context was expected to
compensate for the above-indicated defects of the ENA and CMAM programs as
follows: (1) by rehabilitating malnourished children with menus prepared with locally
available food ingredients rich in nutrients at CPNP sessions, (2) by promoting
adequate feeding and hygiene practices, and sharing these practices with neighboring
caregivers, and (3) by promoting increased participation in the ENA program.
The above-cited idea was crystallized and called the Ethiopia Integrated
Nutrition Project (EINP), whereby CPNP, ENA, and CMAM programs were
concurrently conducted by World Vision Korea (WVK) in collaboration with the
World Vision Ethiopia (WVE), Wholistic Interest Through Health (WITH, a Korea-
based NGO), and local health governments, funded by the Korea International
Cooperation Agency (KOICA)a. The main intervention components of the three
programs are defined as follows:
CPNP: Through a two-week group nutrition session, the nutrient- dense
a a government agency to maximize the effectiveness of Korea's grant aid programs for developing
countries by implementing the government's grant aid and technical cooperation programs
5
complementary foods are prepared using locally available and affordable food
ingredients, and nutrition education messages are delivered to caregivers with support
of CPNP operators and supervisors. The nutrition messages are mainly about child
feeding and hygiene practices based on WHO infant complementary feeding practices
(44, 45).
ENA: Health Extension Workers (HEWs)/community volunteers are subject
to provide monthly nutrition counseling to caregivers with children under two years of
age on adequate breastfeeding and complementary feeding practices, and how to care
for sick children (30).
CMAM: Acutely malnourished children—screened by mid-upper arm
circumference (MUAC) measurements—are treated with therapeutic foods or
supplementary foods (36). Procurement was managed by the project team and the
CMAM program operation was conducted by district health offices.
With this program context, the overarching goal of the proposed study was to
evaluate the effectiveness of the CPNP program added to the ENA and CMAM
programs on child growth from 6 to 24 months of age and child feeding and hygiene
among caregivers in rural Ethiopia compared to children in the control area, and to
examine key implementation components by which the CPNP program impacts child
nutritional status at the community level using program impact pathway (PIP)
analysis.
To meet the overarching goal of this study, the present study has the following
three specific aims:
Specific aim 1: To examine the effectiveness of the CPNP program added to the ENA
and CMAM programs in improving length-for-age (LAZ), weight-for-age (WAZ),

6
and weight-for-length (WLZ) z scores and in reducing the risk of stunting,
underweight, and wasting among children 6 to 24 months of age
Hypothesis 1a: Compared to children of the control area, the LAZ, WAZ, and
WLZ in children of the intervention area will be significantly greater over the
12-month follow-up.
Hypothesis 1b: Compared to children of the control area, the risk of stunting,
underweight, and wasting in children of the intervention area will be
significantly lower over the 12-month follow-up.
Specific aim 2: To examine the effectiveness of the CPNP program added to the ENA
and CMAM programs in improving child feeding and hygiene practices among
mothers of children 6 to 24 months of age
Hypothesis 2a: Compared to mothers of the control area, child feeding and
hygiene scores in mothers of the intervention area will be significantly higher
over the 12-month follow-up. Child feeding and hygiene scores includes the
following: (1) current breastfeeding score, (2) meal frequency score, (3)
dietary diversity score, (4) hand washing score, and (5) composite feeding
score_1 (involving currently breastfeeding, meal frequency and dietary
diversity), and composite feeding score_2 (involving meal frequency and
dietary diversity).
Specific aim 3: To evaluate the program impact pathway (PIP) through which the
CPNP program improves child feeding and hygiene practice and child growth,
through five key pathway components: (1) quality of implementation process of
CPNP program, (2) CPNP participants’ program acceptance, (3) CPNP participants’

7
message recall, (4) child feeding and hygiene practices, and (5) influence of CPNP
program on the exposure to ENA and CMAM programs
Hypothesis 3a: Percentage dose delivered, percentage dose received, and
percentage fidelity to the protocol will be greater than 70% of total expected
level.
Hypothesis 3b: At least 70% of CPNP participants will show positive program
acceptance (e.g., active participation at the sessions, material contributions,
and favorable perceptions of the sessions).
Hypothesis 3c: CPNP participants will recall each discussion message and
food ingredient at a 70% level.
Hypothesis 3d: Compared to the non-participants in the intervention area,
child feeding and hygiene practices will be better among CPNP participants at
the program initial stage.
Hypothesis 3e: Compared to the mothers in the control area, mothers in the
intervention area will be more involved in the ENA program over the 12-
month follow-up.
1.2 SUMMARY OF DISSERTATION CHAPTERS
This dissertation consists of seven chapters including this Introduction Chapter. The
next chapter (Chapter 2) provides a comprehensive literature review on current
situation analysis of child undernutrition in developing countries, research findings of
complementary feeding trials and Positive Deviant Hearth programs, and process
evaluation studies, including cases of program impact pathway studies for nutrition
programs in underdeveloped settings. Lastly, the maternal and child nutrition situation
and current information of CMAM and ENA programs are reviewed.

8
Chapter 3 describes the methods of this dissertation study in detail, including the
study settings and population, randomization procedure, intervention, sampling
strategy, data collection procedures and data management, Institutional Review Board
process, and approaches of statistical analysis.
Chapter 4 (Paper 1) presents findings on the effectiveness of the CPNP
intervention in improving child growth among children 6 to 24 months of age. The
results show that the CPNP program significantly improved monthly LAZ, WAZ, and
WLZ among children in the intervention area compared to the control area; however,
no significant effect was found on reducing the risk of stunting, underweight, or
wasting. The target journal for this last paper is the American Journal of Clinical
Nutrition.
Chapter 5 (Paper 2) presents findings on the effectiveness of the CPNP
intervention in improving child feeding and hygiene practices among caregivers. The
results show that the CPNP program significantly improved meal frequency and
composite feeding scores among mothers of children 6 to 24 months of age in the
intervention area compared to mothers in the control area; however, there was no
significant improvement in breastfeeding, dietary diversity, or hand washing. The
target journal for this second paper is the Journal of Nutrition.
Chapter 6 (Paper 3) presents findings on the PIP analysis of the CPNP program.
The program was implemented with adequate dose, receipt and fidelity compared to
expectation at the design stage. Program contributions and perceptions among

9
participants was high, and discussion messages in the program were well-recalled. A
positive influence of enhancing the ENA program was identified. The target journal
for this paper is the Journal of Nutrition.
Chapter 7 concludes this dissertation by summarizing the main findings of the
study and discussing program implications and further study areas, and strengths and
limitations. This chapter also offers recommendations for future community-based
nutrition interventions targeting young children for civil societies and Ethiopian
government.
10
REFERENCES
1. Black RE, Allen LH, Bhutta ZA, Caulfield LE, de Onis M, Ezzati M, et al.
Maternal and child undernutrition: global and regional exposures and health
consequences. Lancet. 2008 Jan 19;371(9608):243-60.
2. Victora CG, Adair L, Fall C, Hallal PC, Martorell R, Richter L, et al. Maternal and
child undernutrition: consequences for adult health and human capital. Lancet. 2008
Jan 26;371(9609):340-57.
3. UNICEF, WHO, World Bank. Levels & Trends in Child Malnutrition: UNICEF-
WHO-The World Bank Joint child malnutrition estimates. 2013.
4. Bhutta ZA, Ahmed T, Black RE, Cousens S, Dewey K, Giugliani E, et al. What
works? Interventions for maternal and child undernutrition and survival. Lancet. 2008
Feb 2;371(9610):417-40.
5. Bhutta ZA, Das JK, Rizvi A, Gaffey MF, Walker N, Horton S, et al. Evidence-
based interventions for improvement of maternal and child nutrition: what can be
done and at what cost? Lancet. 2013 Aug 3;382(9890):452-77.
6. Penny ME, Creed-Kanashiro HM, Robert RC, Narro MR, Caulfield LE, Black RE.
Effectiveness of an educational intervention delivered through the health services to
improve nutrition in young children: a cluster-randomised controlled trial. Lancet.
2005 May 28-Jun 3;365(9474):1863-72.
7. Guldan GS, Fan HC, Ma X, Ni ZZ, Xiang X, Tang MZ. Culturally appropriate
nutrition education improves infant feeding and growth in rural Sichuan, China. J
Nutr. 2000 May;130(5):1204-11.
8. Santos I, Victora CG, Martines J, Goncalves H, Gigante DP, Valle NJ, et al.
Nutrition counseling increases weight gain among Brazilian children. J Nutr. 2001
Nov;131(11):2866-73.
9. Saunders RP, Evans MH, Joshi P. Developing a process-evaluation plan for
assessing health promotion program implementation: a how-to guide. Health Promot
Pract. 2005 Apr;6(2):134-47.
10. Rossi P, Lipsey M, Freeman H. Evaluation: A systematic Approach. Thousand
Oaks, Calif, USA: Sage Publications; 2003.
11. Oakley A, Strange V, Bonell C, Allen E, Stephenson J, RIPPLE Study Team.
Process evaluation in randomised controlled trials of complex interventions. BMJ.
2006 Feb 18;332(7538):413-6.
12. Kim S, Habicht J, Menon P, Stoltzfus R. How do programs work to improve child
nutrition? Program impact pathways of three nongovernmental organization
intervention projects in the Peruvian Highlands. Washington: International Food
Policy Research Institute; 2011.

11
13. WHO (World Health Organization). Strengthening Action to Improve Feeding of
Infants and Young Children 6–23 Months of Age in Nutrition and Child Health
Programmes: Report of Proceedings, October, 6–9, 2008. 2009.
14. Robert RC, Gittelsohn J, Creed-Kanashiro HM, Penny ME, Caulfield LE, Narro
MR, et al. Process evaluation determines the pathway of success for a health center-
delivered, nutrition education intervention for infants in Trujillo, Peru. J Nutr. 2006
Mar;136(3):634-41.
15. Newman JE, Garces A, Mazariegos M, Michael Hambidge K, Manasyan A,
Tshefu A, et al. Theory-driven process evaluation of a complementary feeding trial in
four countries. Health Educ Res. 2014 Apr;29(2):297-305.
16. Gartner A, Maire B, Kameli Y, Traissac P, Delpeuch F. Process evaluation of the
Senegal-Community Nutrition Project: an adequacy assessment of a large scale urban
project. Trop Med Int Health. 2006 Jun;11(6):955-66.
17. Rawat R, Saha KK, Kennedy A, Rohner F, Ruel M, Menon P. Anaemia in infancy
in rural Bangladesh: contribution of iron deficiency, infections and poor feeding
practices. Br J Nutr. 2014 Jan 14;111(1):172-81.
18. Rawat R, Nguyen PH, Ali D, Saha K, Alayon S, Kim SS, et al. Learning how
programs achieve their impact: embedding theory-driven process evaluation and other
program learning mechanisms in Alive & Thrive. Food Nutr Bull. 2013 Sep;34(3
Suppl):S212-25.
19. Avula R, Menon P, Saha KK, Bhuiyan MI, Chowdhury AS, Siraj S, et al. A
program impact pathway analysis identifies critical steps in the implementation and
utilization of a behavior change communication intervention promoting infant and
child feeding practices in Bangladesh. J Nutr. 2013 Dec;143(12):2029-37.
20. Nguyen PH, Menon P, Keithly SC, Kim SS, Hajeebhoy N, Tran LM, et al.
Program Impact Pathway Analysis of a Social Franchise Model Shows Potential to
Improve Infant and Young Child Feeding Practices in Vietnam. J Nutr. 2014 Aug 20.
21. Central Statistical Agency [Ethiopia] and ICF International. Ethiopia
Demographic and Health Survey 2011. Addis Ababa, Ethiopia and Calverton,
Maryland, USA: Central Statistical Agency and ICF International; 2012.
22. Hadley C, Tessema F, Muluneh AT. Household food insecurity and caregiver
distress: equal threats to child nutritional status? Am J Hum Biol. 2012 Mar-
Apr;24(2):149-57.
23. Horii N, Guyon AB, Quinn VJ. Determinants of delayed initiation of
breastfeeding in rural Ethiopia: programmatic implications. Food Nutr Bull. 2011
Jun;32(2):94-102.
24. Setegn T, Gerbaba M, Belachew T. Determinants of timely initiation of
breastfeeding among mothers in Goba Woreda, South East Ethiopia: a cross sectional
study. BMC Public Health. 2011 Apr 8;11:217.

12
25. Gibson RS, Abebe Y, Hambidge KM, Arbide I, Teshome A, Stoecker BJ.
Inadequate feeding practices and impaired growth among children from subsistence
farming households in Sidama, Southern Ethiopia. Matern Child Nutr. 2009
Jul;5(3):260-75.
26. Umeta M, West CE, Verhoef H, Haidar J, Hautvast JG. Factors associated with
stunting in infants aged 5-11 months in the Dodota-Sire District, rural Ethiopia. J
Nutr. 2003 Apr;133(4):1064-9.
27. Haidar J, Kogi-Makau W. Gender differences in the household-headship and
nutritional status of pre-school children. East Afr Med J. 2009 Feb;86(2):69-73.
28. Regassa N. Antenatal and postnatal care service utilization in southern Ethiopia: a
population-based study. Afr Health Sci. 2011 Sep;11(3):390-7.
29. Demissie T, Ali A, Mekonnen Y, Haider J, Umeta M. Demographic and health-
related risk factors of subclinical vitamin A deficiency in Ethiopia. J Health Popul
Nutr. 2009 Oct;27(5):666-73.
30. LINKAGES. ENA Counsellor’s Guide. Using the Essential Nutrition Actions to
Improve the Nutrition of Women and Children in Ethiopia, including under Situations
of Emergencies and HIV & AIDS 2005.
31. Guyon AB, Quinn VJ, Hainsworth M, Ravonimanantsoa P, Ravelojoana V,
Rambeloson Z, et al. Implementing an integrated nutrition package at large scale in
Madagascar: the Essential Nutrition Actions framework. Food Nutr Bull. 2009
Sep;30(3):233-44.
32. Save the children. Ethiopia National Nutrition Strategy; Review and Analysis of
Progress and Gaps: One Year On May 2009. 2009.
33. Kelbessa Z, Baraki N, Egata G. Level of health extension service utilization and
associated factors among community in Abuna Gindeberet District, West Shoa Zone,
Oromia Regional State, Ethiopia. BMC Health Serv Res. 2014 Jul 28;14:324,6963-
14-324.
34. Standing H, Chowdhury AM. Producing effective knowledge agents in a
pluralistic environment: what future for community health workers? Soc Sci Med.
2008 May;66(10):2096-107.
35. Glenton C, Scheel IB, Pradhan S, Lewin S, Hodgins S, Shrestha V. The female
community health volunteer programme in Nepal: decision makers' perceptions of
volunteerism, payment and other incentives. Soc Sci Med. 2010 Jun;70(12):1920-7.
36. Valid International. Community-based Therapeutic Care (CTC): field manual. .
First Edition, 2006.
37. United Nations Children’s Fund. Evaluation of Community Management of Acute
Malnutrition (CMAM): Ethiopia Country Case Study. Three United Nations Plaza

13
New York, NY 10017, United States: Evaluation Office United Nations Children’s
Fund; September 2012.
38. Ethiopia MoH. CMAM rollout: ingress to scale up nutrition. CMAM/ SUN
Conference 14th - 17th November 2011. Addis Ababa, Ethiopia. Scaling up
Community Management of Acute Malnutrition and Scaling up Nutrition (SUN).
http://cmamconference2011.files.wordpress.com/2011/11/session-2_country-
1_ethiopia1.pdf. In press 2011.
39. Nutrition Working Group, Child Survival Collaborations and Resources Group
(CORE). Positive Deviance / Hearth: A Resource Guide for Sustainably
Rehabilitating Malnourished Children. Washington, D.C: December 2002.
40. Wishik SM, Vynckt S. The use of nutritional 'positive deviants' to identify
approaches for modification of dietary practices. Am J Public Health. 1976
Jan;66(1):38-42.
41. Zeitlin M, Ghassemi H, Mansour M. Positive Deviance in Child Nutrition: With
Emphasis on Psychosocial and Behavioral Aspects and Implications for Development.
The United Nations University, Tokyo. Available at:
http://unu.edu/unupress/unupbooks/80697e/80697E00.htm [Accessed 19 December
2010. 1990.
42. World Vision Ethiopia. PD Hearth in CMAM & ENA Context Report by
Technical Support: EARO Health and Nutrition Team. Gelemso, Habro ADP: World
Vision Ethiopia; 2012.
43. Pan American Health Organization. Guiding Principles for Complementary
Feeding of the Breastfed Child. Washington, D.C: 2003.
44. WVI Nutrition Centre of Expertise. Training of positive deviance/hearth volunteer
(curriculum). 2011.
45. World Vision International Nutrition Centre of Expertise. Training of master
trainers for positive deviance/hearth. 2011.
14
CHAPTER 2. LITERATURE REVIEW
This chapter describes the following: the global situation of child undernutrition and
its consequences, infant and young child feeding in low income countries (LIC), study
results of complementary feeding trials related to nutrition education/counselling in
LIC, and examples of process evaluation studies focusing on program impact pathway
(PIP) analysis for nutrition interventions. Last, the child and maternal nutrition
situation in Ethiopia and ongoing programs of Essential Nutrition Action (ENA) and
Community-based Management of Acute Malnutrition (CMAM) in Ethiopia are
described.
2.1 CHILD UNDERNUTRITION: GLOBAL PERSPECTIVES
In 2013, globally, 161.5 million (24.5 %) children under five year of age were
estimated to be stunted [height-for-age z score (HAZ) < -2], 98.9 million (15.0%)
were underweight [weight-for-age z score (WAZ) < -2], and 50.8 million (8%) were
wasted [weight-for-height z score (WHZ) < -2) (1). Stunting, underweight, and
wasting frequently are found together (2), and most countries experience some
combination of under-five undernutrition (3).
Childhood undernutrition is multifactorial but inadequate dietary intake and/or
infectious diseases are the immediate causes (4). A lack of sustainable access to safe
foods with sufficient quality and quantity, inappropriate health systems and unhealthy
environment, and inadequate maternal and child care as underlying causes adversely
affect dietary intake and infection conditions. Fundamentally, social and political
structures at national and societal levels are distal factors that lead to undernutrition at
national and societal levels (4).
Child undernutrition is estimated to be responsible for 35% of child deaths and

15
11% of the total global disease burden in children under five years of age (5).
Stunting, severe wasting, and intrauterine growth retardation account for 2.2 million
deaths; combined, they accounted for 21% of global disability-adjusted life-years
(DALYs) of preschool children (6). Micronutrient deficiencies of vitamin A, zinc, and
iodine are unacceptably high in developing countries as well. Vitamin A and zinc
deficiencies were associated with 0.6 million and 0.4 million deaths, respectively, and
together account for 9% of lost DALYs in childhood (6).
The most rapid physical growth in life occurs from conception through 24
months of age (7). Sub-optimal feeding practices, morbidity resulting from persistent
infections, and enteropathic conditions lead to increased risk of growth faltering and
micronutrient deficiencies (8, 9). Mortality in children who were stunted and
underweight was more than three times greater than mortality among well-nourished
children [Hazard Ratio (HR) 3.4, 95% CI: 2.6, 4.3]. This risk increases more than 12-
fold (HR 12.3, 95% CI: 7.7, 19.6) among children who were stunted, underweight,
and wasted (2). Populations born with low birth weight and those undernourished in
childhood have a higher risk of lifelong disadvantages such as developing chronic
diseases including cardiovascular diseases, mental illnesses, and may suffer
deficiencies in cognitive development, reproductive performance, intellectual ability,
and future economic productivity (10). There is inequality in stunting prevalence
based on socioeconomic status. In a study, stunting prevalence in the poorest quintile
was 2.47 (range 1.00 to 7.64) times higher than in the richest quintile (9).
The period of 1,000 days from conception to 24 months of age is recognized
as the most effective intervention period to mitigate the adverse effects of
undernutrition; thus, evidence-based nutrition-specific interventions have been
delivered with a focus on this period (11). The 2013 Lancet child and maternal under-
16
nutrition series identified a set of 13 evidence-based cost-effective interventions
shown to be efficacious in small-scale trials (11). It was estimated that if collective
implementation of these interventions were conducted on a large scale and with wide
coverage in the 36 countries presenting high prevalence of growth faltering, the
impact would turn out as a reduction of stunting by 36% at age 36 months, mortality
by 25% between birth and 36 months, and DALYs related to stunting, severe wasting,
intrauterine growth restriction, and micronutrient deficiencies by about 25% (12). As
a global commitment to tackle this public health issue, the World Health Assembly
targets to reduce by 40% the number of under-five stunted children from 171 million
in 2010 to 100 million in 2025, and to reduce wasting to less than 5% (13).
Until now the underlying mechanisms of linear growth failure and its stunting-
prevention interventions are not thoroughly defined (14). Growth failure appears
across the life course, starting from the moment of conception. Approximately 20% of
stunting is attributed to utero origins (15). Globally, almost 3 million infants were
born preterm and small-for-gestational age. Using data from 19 birth cohorts, the risk
of postnatal stunting increased markedly among infants born preterm (OR 1.93, 95%
CI: 1.71, 2.18), SGA (OR 2.43, 95% CI: 2.22, 2.66) and SGA-preterm (OR 4.51, 95%
CI: 3.42. 5.93), compared to infants born appropriate for gestational age and at term
(15). Maternal height is associated with size at birth, child stunting at 24 months, and
offspring height at all ages (correlations ranging from 0.15 to 0.55, p < 0.001) (16).
In developing countries, the average length-for-age z scores indicate
approximately −0.5 among newborns after birth, and from 6 months of age presents a
steep decline to around −2.0 by 18 to 24 months of age (17). Growth velocity of
healthy infants is maximal between birth and 6 months of age (18).
There is a bidirectional interaction between infectious diseases, such as

17
diarrhea and pneumonia, and malnutrition (19). Frequent diarrhea episodes increased
the risk of having pneumonia among undernourished child populations by a factor of
1.08 (95% CI: 1.00-1.15) (20, 21). Using data from two randomized controlled trials
of vitamin A supplementation in Ghana and Brazil, differences in diarrhea episodes in
the study groups showed strong linear association with differences in WAZ (21).
Undernourished conditions may in part be related to reduced efficacy of oral rotavirus
vaccines, and pneumonia immunization of children or immunization of pregnant
women against influenza may offer benefits of improving child growth and reducing
intrauterine growth retardation (19, 22, 23). In a study of seven infant cohorts,
cumulative diarrhea resulted in a smaller but measurable decrease in linear growth.
The average diarrhea burden (equivalent to 23 days per year) resulted in decrease of
0.38 cm (95% CI: -0.59, -0.17) in length at 2 years of age (24).
Environmental enteric dysfunction (EED) is characterized by villous atrophy
and stimulated chronic inflammation (8, 25, 26). This subclinical condition results in
reduced nutrient absorption and increased intestinal permeability, followed by
endotoxin translocation into the systematic circulation in the body, stimulating
chronic inflammation of the small intestine mucosa and IGF-1 suppression. EED may
lead to growth faltering among those at the first 24 months of life, when the EED
occurs concurrently in the marginal dietary intake environment of developing
countries and high growth demand at this range of age.
Growth faltering starts from conception and dramatically increase until 24
months (17). Until now, the appropriate intervention period to address child stunting
is considered as -9 to 24 months as a window of opportunity, with slight increase after
24 months of age and without recovery until ≥ 5 years of age (17). However, a recent
study proposed the possibility of catch-up growth beyond 24 months and mid-
18
childhood, using longitudinal data from collaboration of the Consortium of Health
Oriented Research in Transitioning (Brazil, Guatemala, India, Philippines, and South
Africa), and data from rural Gambia (27). Another study, using longitudinal data in
the Young Lives study, showed significant reduction from stunting prevalence at early
age in four mid- and low-income countries; this growth recovery and failure was
associated with household and community attributes (28, 29).
2.2 INFANT AND YOUNG CHILD FEEDING IN DEVELOPING COUNTRIES
Infancy and childhood is a period of continuing growth and development. The
FAO/WHO/UNU recommendations for total energy requirements and energy
requirements from complementary foods during infancy are based on longitudinal
measurements of total energy expenditure from 76 US children (30); for infants at 6-8
months, 9-11 months, and 12-23 months of age, energy requirements were estimated
to be ~600, ~700, and ~900 kcal per day, respectively (30). Given that energy intake
from breast milk is 413, 379, and 346 kcal per day for each age group, the energy
intakes required from complementary foods for each age group are 202, 307, and 548
kcal per day, respectively (Table 1). Assuming that meals are prepared with a
minimum energy density of 1.0 kcal/g, children in all age groups would need at least
three meals per day to have enough energy from complementary foods (Table 2);
however, specific guidelines are needed regarding the effect of energy density and
feeding frequencies of complementary foods on breast milk consumption. Increasing
energy density in complementary foods is likely to decrease feeding frequencies of
foods and breast milk consumption (31).

19
Table 2.1 Energy requirements according to age group, as presented in the
WHO/UNICEF 1998 publication and in recent longitudinal studies of US children
(30)
Age
group
(mo)
Recommended
feeding frequency of
complementary
foods
Total energy
requirement Energy
intake from
breast milk
(kcal/day)
Energy
required from
complementary
foods
(kcal/day)
no. of
meals per
day
no. of
snacks per
day (kcal/day)*
(kcal/kg
body
weight/day)
6-8 2-3 1-2 615 (~600) 77.0 413 202 (~200)
9-11 3-4 1-2 686 (~700) 77.5 379 307 (~300)
12-23 3-4 1-2 894 (~900) 81.3 346 548 (~550) * US longitudinal data
Table 2.2 Minimum daily number of meals required to attain the level of energy
needed from complementary foods with various mean energy densities for children
with low level of breast milk energy intake, per age group (30)b
No. of meals
Energy density
(kcal/g)
6-8 mo 9-11 mo 12-23 mo
0.6 3.7 4.1 5.0
0.8 2.8 3.1 3.7
1.0 2.2 2.5 3.0
Adequate infant and young child feeding (IYCF) practices are important as
child growth is determined by an interaction between the individual’s genetic
potential, hormonal milieu, and the environment. Optimal breastfeeding and
complementary feeding practices can save the lives of 1.5 million children under five
years of age every year (6). WHO guidelines for infant and young child feeding
practices include early initiation of breastfeeding within one hour of birth, exclusive
breastfeeding for the first six months of life, and the introduction of nutritionally
b Estimated total energy requirement is based on new US longitudinal data averages plus 25% (2SD).
Assumed functional gastric capacity (30g/kg reference body weight) is 249g/meal at 6-8 months,
285g/meal at 9 -11 months, and 345g/meal at 12-23 months.
20
adequate and safe complementary foods at six months, together with continued
breastfeeding up to two years, and appropriate feeding practices in children 6 to 23
months of age such as measures of dietary diversity, feeding frequency, and the
consumption of iron-rich or iron-fortified foods (Appendix 2.1) (32).
The global coverage of IYCF indicators was reported in two studies. A study
using Demographic and Health Survey data of 46 developing countries pointed out
that the coverage of many IYCF indicators is by and large poor, and requires effective
nutrition strategies to promote recommended practices (5). On average about 36% of
infants 0 to 6 months of age were exclusively breastfed, and about 60% of children
received age-appropriate breastfeeding. Less than a third of children received
nutritionally adequate and safe complementary foods with adequate dietary diversity.
Half of children received the minimum number of meals that meet the feeding
frequency criteria (5). While more than 70% of children in Latin America and
Caribbean countries consumed at least 4 food groups on the day before the survey,
only about 30% of children in Asia and African countries could meet this standard.
The proportion of breastfed children 6 to 23 month of age consuming a minimally
acceptable diet, defined as receiving at least the minimum dietary diversity and the
minimum meal frequency during the previous day, was only 21% in 41 developing
countries, particularly fewer children (~15%) in countries of the African region met
the minimum criteria. As such, global strategies to promote IYCF practices that are
grounded on the specific context are called for in developing countries.
Exclusively breastfeeding for the first six months after birth is not associated
with improved height-for-age z scores (33). Another study examining 7 IYCF
practices in 28 countries using the Multiple Indicator Cluster Survey 3 (MICS3)
pointed out that not only are feeding practices varied across developing countries, but

21
improved conditions of development or education in countries have also not been
translated to improved feeding practices (34, 35).
IYCF indicators showed an association with child anthropometry in a few
studies. In a study with pooled data from 14 low-income countries to assess the
overall average effect of the WHO IYCF indicators on child anthropometry,
consumption four or more diverse food groups reduced risk of stunting (OR 0.79,
95% CI: 0.72, 0.86) and underweight (OR 0.78, 95% CI: 0.71,0.86) (35). Moreover,
timely solid food introduction at 6 to 8 months was associated with reduced
underweight (OR 0.52, 95% CI: 0.44, 0.62) and stunting (OR 0.50, 95% CI: 0.41,
0.60), and iron-fortified food consumption showed association with both stunting (OR
0.82, 95% CI: 0.76, 0.89) and underweight (OR 0.83, 95% CI: 0.77, 0.90) (35).
In eight studies—using recent Demographic and Health Surveys data from a
total of 9 countries in sub-Saharan Africa, Asia, and the Caribbean—diet diversity and
overall diet quality indicators showed positive association with HAZ in Bangladesh,
Ethiopia, India, and Zambia (p < 0.05). In Bangladesh and Zambia, complementary
feeding indicators were not associated with WHZ, but exclusive breastfeeding for the
first 6 months after birth was associated with greater WHZ (p < 0.05) (36).
2.3 CHILD FEEDING INDEX
Child feeding indices (CFIs) using data related to infant and young child feeding
indicators were first proposed by Ruel and Menon (37). A few indices of child
feeding were designed according to the existing holistic feeding practices, and the
associations between the child feeding indices with child growth and energy and
micronutrient intake were examined in a few African and Asian countries including
Ethiopia (37-41). As a whole, child feeding indices showed positive association with

22
height-for-age and weight-for-age z scores, but the association with weight-for-height
z score was not clear. In general, five types of indicators—breastfeeding, dietary
diversity based on 7-8 food groups in the past 24 hour, meal frequency, bottle feeding,
and foods group frequency in the past week—were used to construct CFIs (37). Based
on the contexts, Ma et al. used food consistency as an indicator to construct a
summary index instead of bottle feeding. Sawadogo et al. used the number of foods
consumed in the past 24 hours instead of food group frequency in the past 7 days (38,
39). For the food group frequency in the past, it was reasonable that dietary diversity
scores based on 24-hour recall examined five times, once every three months, could
replace the contribution from food group diversity based on 7-day recall because this
indicator is considered an indication of a relatively long period of food consumption.
In a previous study examining CFIs in Ethiopia, the viability of using dietary diversity
based on 24-hour recall instead of 7-day recall was mentioned (42). Another study
using CFIs in Ethiopia evaluated feeding practices for HIV-exposed infants; the CFI
showed weak correlation between current breastfeeding status and bottle feeding (40).
While most studies were based on rural and urban settings, a CFI study was
conducted in a metropolitan area in China (43). Notably few longitudinal CFI studies
were available, and all studies were adapted with Moursi et al.’s method to construct a
longitudinal index (43, 44).
2.4 COMPLEMENTARY FEEDING TRIALS
A few studies examining the impact of various behavior change communication
(BCC) strategies on child nutritional status and caregivers’ feeding practices
contributed to increasing the coverage of IYCF indicators as well as the understanding
23
of facilitating and impeding factors in implementing interventions in various contexts
(45-47).
Those BCC strategies deliver interventions involving multicomponent,
contextualized nutrition messages, and communication channels (47, 48); main target
groups are mostly caregivers with children 6 to 24 months of age. The nutrition
services were delivered by the following: mentor/peer mothers, community health
workers, doctors, health care providers, and influential family members. Interventions
included individual counseling through home visits or health center visits, group
education, food preparation and demonstration, messages delivery with or without
food supplements, and mass media. The intervention periods and frequencies varied
by study. Some interventions were entirely embedded in the existing health system, as
a consequence, potentially strengthened local health capacity (49, 50). Nutrition
messages were specifically grounded on IYCF guidelines but contextualized to be
culturally acceptable and applicable to caregivers in a few studies as appropriate.
Their impact on outcomes were largely encouraging, which resulted in better
accomplishment in changes in caregivers’ knowledge and practices and child growth
(47). Shi et al. suggest that effective educational interventions should include
designing culturally appropriate educational messages, training effective
communication skills of health providers, involving various community and
household members as providers as well as beneficiaries, and making use of existing
health-providing services or social groups (47).
Caulfield et al. reviewed complementary feeding trials and programs
published between 1970 and 1997 (45). Of those, five efficacy trials and four
programs showed an increase in total energy intake: 65 to 399 kcal per day and 71 to
164 kcal per day, respectively. Improvement in child growth rates was between 0.1

24
and 0.5SD. A systematic review with 17 studies by Imdad et al. showed that the
provision of appropriate complementary foods with or without nutritional counseling
led to an extra gain of 0.25 kg (± 0.18) in weight and 0.54 cm (± 0.38) in height in
children aged 6 to 12 months, whereas education about complementary feeding
resulted in an extra gain of 0.30 kg (± 0.26) in weight and of 0.49 cm (± 0.50) in
height (46).
The previous studies showed promising effects of interventions to promote
complementary feeding through various behavior change communication channels on
HAZ and WAZ (46, 51). Education on complementary feeding only (fortified or
unfortified, but not micronutrients alone) resulted in significant increases in HAZ
[standard mean difference (SMD) 0.23, 95% CI: 0.09, 0.36] and WAZ (SMD 0.16,
95% CI: 0.05, 0.27) (46, 51). For the studies in food insecure conditions, only
education on CF resulted in improvement of HAZ (SMD 0.25, 95% CI: 0.09, 0.42, 1
study) (52) and WAZ scores (SMD 0.26, 95% CI: 0.12, 0.41, 2 studies) (52, 53), and
reduced the rates of stunting [Relative Risk (RR) 0.68, 95% CI: 0.60, 0.76, 1 study]
(52).
Interventions, implemented in food secure populations in Peru, Brazil, and
China, produced improved dietary intake, feeding frequency, and better weight gain
or height gain (49, 50, 54). One of the outstanding aspects in common in these studies
was the introduction of weaning food recipes and providing information about use of
locally available animal food sources. Environments with variable food choices were
likely to favor the approach of promoting the use of nutrient-dense complementary
foods. The study in Peru strengthened the nutrition advice provided by health centers
and emphasized affordable nutrition messages about the use of specific foods and
responsive feeding to children (49). Nutrient-dense thick foods were found to be
25
utilized greater in intervention children than in children in control communities (31%
vs. 20%, p = 0.03), and the prevalence of stunting was lower in intervention
communities than in control communities (16% vs. 5%, AOR 3.04). Children in the
intervention area had more energy intake from complementary foods, consumed more
animal foods, iron, and zinc; however, there was no significant difference in 24-hour
recall-based feeding practices by the two groups.
In a group educational study in China, healthcare providers led the group
sessions, emphasizing animal foods use through food preparation and demonstrated
weaning foods (50). The intervention improved the percentage of consumption of
meats or organ meats (96.9% vs. 58.2%. p < 0.001), beans (92.1% vs. 67.2%, p <
0.001), yellow and orange foods (97.2% vs. 76.7%, p < 0.001), and the number of
more meals over the year of follow-up. Intervention children consumed significantly
more meals at 6, 9, and 12 months than the control group, but had small changes in
weight gain. In the Brazil study, trained doctors in health centers administered
nutrition counseling to mothers about nutritional values of animal protein,
micronutrient rich foods, and recipes to increase nutrient density in complementary
foods (54). The doctors’ intercommunication skills and knowledge were favored by
community caregivers, and mothers in the intervention reported superior knowledge
and recall of recommended guidelines than mothers in the control group.
On the other hand, in the food insecure settings, strategies attempting to
improve caregivers’ behaviors—especially with regards to complementary feeding
practices—had moderately encouraging results. In a study in India improving health
workers’ communication skills and performance, the energy intake from
complementary foods was higher in the intervention children at 18 months of age
(3807 ± 1527 vs. 2577 ± 1058 kJ; p < 0.001) than in the control children (55). In other

26
randomized controlled trials in India, feeding education improved the mean daily
feeding frequency (e.g., being fed solids at least four times a day) (OR 4.35, 95% CI:
1.96, 10.00) (53) or increased the receiving diet with diverse foods (OR 3.23, 95% CI:
1.28, 7.69) (56).
In a study in Pakistan, which examined the effect of the Integrated
Management of Childhood Illness (IMCI) module–'Counsel the mother'–by trained
health workers, the intervention children were given more eggs (p = 0.043) and more
frequently thick kitchuri (p = 0.044), and show better HAZ scores (p = 0.012),
compared to non-intervened children (57). A study in Bangladesh compared the effect
of three months Intensive Nutrition Education (INE) and the INE plus SF (supplement
foods with 300 kcal energy intake and 8-9g protein in addition to INE) on the
rehabilitation of malnourished children (56); a higher proportion of recovered children
and improved WAZ scores during follow-up periods were found in the intervention
groups than in the control groups (p < 0.001). The Philani program, a
paraprofessional home visit program in South Africa, which involved mentoring
mothers in their own community, showed a significantly greater proportion of
rehabilitated children in the intervention group than in the control group by three
months (43% vs. 31%; p < 0.01) (58). In a study in Iran, family members were
instructed together with caregivers about food preparation and cooking practices,
which resulted in significant improvement in child nutritional status (p < 0.05) (59).
Studies that enhanced responsive feeding practices led to optimistic results. A few
trials in Bangladesh showed overall positive consequences on child language and
developmental indicators as well as on weight and height gain (60-62).
Meanwhile, nutrition educational strategies proven to be efficacious may not
necessarily translate to positive outcomes in programmed settings. The Community
27
Nutrition Project (CNP) in Senegal indicated instead that the control zone had a
greater decrease of 5.1% in child wasting, compared to a 0.5% decrease in the
intervention zone (p < 0.05) (63, 64). In the absence of an appropriate control group,
nutrition program settings, engaging multi-intervention components, may have
limitations in interpreting program effects.
2.5 POSITIVE DEVIANT HEARTH PROGRAMS
The Positive Deviant (PD) Hearth approach uses an intensive behavioral change
intervention, targeting families of children with malnutrition to introduce the locally-
discovered PD practices as well as to promote other practices essential to child health.
The PD Hearth approach is based on the premise that there are individuals who share
the same poor socioeconomic characteristics as their community members but manage
to find ways to overcome barriers and actually practice positive behaviors without
external interventions (65). In 1976, Wishik described an approach that identified
deviant behaviors, which are affordable, acceptable, and sustainable, practiced by the
caretakers of well-nourished children from poor families and suggested transferring
such positive practices to other community members in the community with
malnourished children (66). The term ‘Positive Deviance (PD)’ was first used by
Zeitlin in 1990 (67). Hearth programs were originally modified versions of the
Nutrition Demonstration Foyer (NDF) program that originally evolved from
Mothercraft Centers in Haiti, where volunteer mothers prepared and fed meals to
malnourished children in outdoor kitchens. In the 1990s, the concept of PD was
combined with Hearth sessions—called PD Hearth programs—and were implemented
in Haiti, Bangladesh, and Vietnam (68).

28
Since then, PD Hearth approaches have been implemented by international
NGOs and governments in developing countries and have shown overall positive
impact on child nutritional status (65, 69). The Nutrition Working Group, Child
Survival Collaborations and Resources Group [CORE] produced the PD Hearth
approach manual that includes critical steps in program implementation (70): The
manual grouped PD behaviors/practices into four categories: child feeding, child
caring, hygienic and health-care seeking practices. PD foods investigated are used to
rehabilitate underweight children by encouraging mothers to prepare complementary
foods.
A systematic review of the PD Hearth approach represents the largely positive
influences of PD Hearth with mixed results of program effectiveness in reducing child
malnutrition (69). The PD Hearth approach sustained and was able to prevent
malnutrition cases among younger siblings of participating children. The program
sensitized the communities to child undernutrition and helped the communities build
the capacity to secure the well-being of children using affordable and available
resources (71).
A randomized trial in Vietnam, prospectively following up to 120 children
each in comparison and intervention groups for 12 months (72, 73); however, during
the follow-up, children who were younger (<15 months) and more malnourished at
baseline indicated on average far less drop of WAZ scores in the intervention group
than counterpart children in the control group. The intervention children consumed a
greater amount of foods (409.8g vs. 340.3g; p < 0.01), showed higher meal frequency
(4.4 vs. 4.9; p < 0.05), and had more energy intake (826.9 kcal vs. 718.4 kcal; p <
0.05) than control children at the 12-month follow-up (74).
Sibling studies suggested a sustainable impact of interventions using the PD

29
Hearth approach. In Vietnam, after 3 to 4 years of cessation of the Community
Empowerment and Nutrition Project (CENP), younger siblings of participants were
significantly better nourished than those in the comparison group, with better WAZ
scores (1.82 vs. 2.45; p = 0 .007), WHZ scores (0.71 vs. 1.45; p < 0.001), and HAZ
scores (2.11 vs. 2.37; p = 0.4) (71).
In another sibling study in Indonesia, low underweight prevalence was
observed among younger siblings of children who were intervened in a previous
program than comparison sibling children (22% vs. 43%, p value not reported) (75);
however, a study of the impact on younger siblings’ nutritional status in Rwanda had
no significant difference (76).
In non-randomized trials, one study in Haiti reported no significant differences
in nutritional status between study groups (77), but in another study in Haiti,
intervened children continued catch-up growth through month two and six (40% and
60%, respectively) (78).
In a study with 100 family in India, some identified factors associated with
determinants of positive deviants were maternal autonomy in decision (OR 7.3, 95%
CI: 2.1, 25.5), family happiness on child birth (OR 2.8, 95% CI: 0.9, 9.9),
psychosocial care, and home environment (OR 2.8, 95% CI: 0.8, 10.8), and mothers
keen to learn new things (OR 2.9, 95% CI: 0.9, 9.4) (79). This result indicates that
family support and mothers’ efficacies are very important determinants of growing
well-nourished children even in poor communities.
PD Hearth interventions are likely to have a promising impact on improving
child feeding and caring behaviors among mothers, ensuring child nutrition in
households and at community levels, and mobilizing community resources to combat
child undernutrition, but comprehensive and rigorous studies are still needed. Bullen

30
suggested a need for studies using a robust study design with larger sample size,
examining the extent of community participation specifically (69). Studies will also
be needed to identify factors that may facilitate or impede program sustainability,
track changes in the intervened community over the longer period regarding women’s
empowerment, and other health outcomes, considering the connectivity with other
development programs.
2.6 PROCESS EVALUATIONS IN NUTRITION INTERVENTIONS
Process evaluation in randomized controlled trials is commonly conducted in health
promotion programs, but implementation data often remain descriptive and lack of
systematic data collection methods without appropriate guidelines. Despite promising
findings of nutrition interventions in improving child growth and healthy practices of
caregivers, what and to what extent interventions were implemented, modified, and
accepted remains unexamined in most community-based programs. Lack of
understanding in the implementation process may result in considerable trial and error
of implementing parties, especially government health departments and civil societies,
in scaling up nutrition schemes of behavioral change to other similar settings. Process
evaluation of the complex programs at scale is particularly important to open the
“black box” of programs, to understand how programs are operationalized, and how
success and failure of their impact and mechanisms are involved (80-82). Until now,
only a few process evaluation studies have examined the implementation processes of
complementary feeding trials based on BCC strategies, demonstrating the adequacy
and feasibility of these interventions (83-85). The Alive & Thrive project targeted to
improve infant and young child feeding practices (IYCF) in Bangladesh, Ethiopia,
and Vietnam described detailed mechanisms of theory-driven process evaluation,
31
which provide useful information for future process evaluation in large-scale nutrition
programs. Mixed methods involving quantitative and qualitative methods were used,
and data collection was simultaneously carried out in control and intervention groups.
Program impact pathways (PIP) were examined in Vietnam and Bangladesh
(86, 87). Program impact pathway (PIP) analysis one of methodological approaches to
carry out process evaluation (88). In a 2008 WHO/UNICEF meeting, the term
program impact pathway (PIP) was defined as “the pathway from an intervention
input through programmatic delivery, household and individual utilization to its
desired impact” (89). PIP analysis focuses on the causal mechanisms of programs and
the intention to move beyond static input-out program models. Sparse documentation
and use of program theories are available in nutrition intervention programs; however,
there is growing interest and greater awareness of the need to understand causal
mechanisms and pathways of intervention programs. Cases of PIP analysis highlight
the importance of designing a program theory framework and assessing the
components that lie along the primary program impact pathways to optimize program
service delivery and utilization. This study underscores the importance of including
process evaluation that will lead to the development and implementation of more
effective nutrition interventions. The PIP model of Conditional Cash Transfer (CCT)
was developed and evidence was synthesized regarding child nutrition. They found
gaps in knowledge about the mechanism of improving nutrition by CCT programs
(90). The Alive & Thrive project evaluated program process using program impact
pathways. A BCC intervention implemented in Bangladesh attempted to improve
infant and young child feeding (IYCF) practices. A PIP analysis showed the capacity
of the implementation staff and the extent of fidelity to the intervention; facilitating
factors such as family support and barriers including lack of resource were described
32
(86). The Alive & Thrive (A&T) social franchise model that attempted to improve
infant and young child feeding (IYCF) practices in Vietnam indicated its effective
management of the franchise system and challenges in service utilization (87). In an
RCT study in Peru, where health personnel delivered the multicomponent intervention
as part of usual care in the government health centers, using process indicators such as
the extent of delivery dose, fidelity to intervention protocol, barriers to
implementation and context were assessed; they quantified the extent of program
implementation and quality. The process evaluation demonstrated additional benefits
to existing government programs by the intended interventions (91). In the same
context, they conducted a pathway analysis and found significant determinants to the
improvement outcomes such as health center implementation, caregiver exposure, and
caregiver message recall (83). Using a program theory framework, the Homestead
Food Production program in Cambodia did a PIP analysis and found program
components delivered as planned and utilized, and identified program gaps in the
pathway to reduce program impact and, based on the process results, suggested
increasing some intervention components to improve impact (92).
2.7 NUTRITION SITUATION ANAYLSIS IN ETHIOPIA
2.7.1 Child and maternal undernutrition in Ethiopia
In 2009 more than six million Ethiopian children under five years of age suffered
from growth retardation, accounting for 3.5% of the total stunted children in the
developing world (93). Prevalence of stunting, wasting, and underweight was
estimated to be 44.4%, 9.7 %, and 28.7% in preschool children, respectively (94). In
Ethiopia, causes for the 321,000 deaths of children under five years of age were
attributed to neonatal deaths (33%), pneumonia (22%), diarrhea (17%), malaria (6%),
33
and HIV/AIDS (4%), which accounts for one third of under-five deaths in Ethiopia
(95). The under-five child mortality in Ethiopia has been reduced from 184 deaths per
1,000 births in 1,990 to 106 deaths in 2,010 at a 6.6% yearly reduction rate. The
overall prevalence of stunting and wasting has gradually declined, but inequality in
providing health programs has resulted in disproportionate malnutrition prevalence
between slum urban and rural areas, and between male and female children (95).
According to data from the Ethiopia Demographic Health Survey (EDHS)
2011, the increase in undernutrition begins in the first 4 to 6 months after birth. HAZ
scores of children at birth were close to the mean value of the reference population.
Later, the trajectory of HAZ scores decreased sharply at 4 to 6 months of age until 24
months of age, so it eventually reached two standard deviations below the mean of the
reference population, which is in line with the period that exclusive breastfeeding
ends and the transition to complementary feeding begins (94).
Determinants of undernutrition in Ethiopia have been found to have the
following multifaceted features, ranging not only from household food shortages
caused by droughts (96), but also from complex causes: suboptimal child feeding and
caring practices (97-99), nutritionally inadequate diets including micronutrient-
absorption inhibitors (99), maternal poor nutritional status (100), not completing
immunization (101), poor access to and utilization of community health services (102-
104), non-availability of latrine and unprotected water sources (105), poor housing
conditions (105), malaria (106), seasonal variation (107), and low socioeconomic
backgrounds (96, 108).
Maternal mortality decreased from 950 deaths in 100,000 live births in 1990 to
350 deaths in 2010 in Ethiopia (95). Approximately 22,000 Ethiopian women lost
their lives in 2005 due to hemorrhage (34%), sepsis/infection including AIDS (16%),
34
and hypertensive disorders (9%). Statistical data indicate that poor access to health
services, low utilization of postnatal care and lack of trained health work forces
resulted in deteriorating maternal health outcomes (98). Only 28% of mothers could
get access to antenatal care by skilled health providers at least once during pregnancy,
and only 6% of deliveries were attended by skilled health providers, and 89% of
pregnant women did not take iron supplements during pregnancy period (95). Women
of child bearing age experienced chronic shortage of macro- and micronutrient
deficiencies including iron, zinc, vitamin A, vitamin B12, and folate (109, 110).
Besides, the underlying causes for women’s poor nutrition status may include low
socioeconomic status because the majority of them were engaged in subsistence
farming and grain-based diets deficient in animal food sources (111).
Vitamin A, iron, zinc, and iodine deficiencies and their clinical signs are
widespread in Ethiopian children and women of reproductive ages. Despite the
inconsistent statistical data, vitamin A deficiency among children and women is
apparent. One report indicated that nationally 1.7 % of the children had Bitot's spots
and 37.7 % of the children had deficient serum retinol levels (95% CI: 35.6, 39.9)
(112). Approximately 62 % of the 6,762,000 children were vitamin A deficient
(defined by serum retinol <0.70 µmol/L), and 4.8% of the children (530,000) had
xerophthalmia, which is the highest prevalence in the world (113). Inadequate dietary
consumption of vitamin A and/or suboptimal use of the nutrient in the body mainly
contribute to causes of vitamin A deficiencies. Clinical vitamin A deficiency was
significantly associated with male-child, older age, or rural residence (p < 0.05) (112).
High subclinical vitamin A deficiency was also associated with low levels of maternal
awareness of vitamin A deficiency, and not receiving vitamin A supplement over the
year (114). Alongside, the coverage of pneumonia treatment coverage rate by
35
appropriate healthcare providers was only 19%, and the proportion of children treated
with oral rehydration salts has declined from 38% in 2000 to 15% in 2005 (115). The
vitamin A supplementation coverage rate was only 58% in 2005, which increased
from 16% in early 2000. Anemia was prevalent among 54% of the preschool children
and 71% of children under two years of age (94).
Micronutrient deficiencies in Ethiopia were associated with consumption of
indigenous plants. Grain-based monotonous diets with high phytate prevent children
from consuming enough micronutrients for balanced growth. On the other hand, some
staples help children not to become micronutrient deficient. A survey in 1996
indicated that people consuming Enset (Ensete ventricosum) had the lowest
occurrence of Bitot’s spot and night blindness, followed by grain-croppers, cash-
croppers, and those living in pastoral areas (101). Teff (Eragrosis teff), high iron, and
zinc-containing grain, is generally used as a staple food in Southern Ethiopia where
zinc and iron deficiencies are reported to be low (116). Across the country, the
percentage of households consuming adequately iodized salt is estimated to be 15%;
13% in rural households and 23% in urban households (94). Besides, anemia is found
to be associated with poor human waste management, lack of safe drinking water, and
lower women’s educational status (117). Zinc deficiency is prevalent in Ethiopia.
Zinc is provided to infants during the first 6 months through exclusive breastfeeding
(118). Afterward, an amount of only one-sixth of the zinc requirement is met through
breast milk; as a result, additional zinc needs to be obtained primarily through
complementary foods. Low serum zinc concentration adversely affects the cognition
of pregnant mothers in South Ethiopia (119). In a randomized controlled study of zinc
supplementation, stunted children showed significantly more increase in length

36
(mean±SE: 7.0 ± 1.1 cm, p < 0.001) than stunted children in the placebo group (2.8 ±
0.9 cm) (120).
2.7.2 Infant and young child feeding practices in Ethiopia
In Ethiopia, the proportion of exclusively breastfeeding for the first 6 months after
birth was 52% in 2011(94). Fortunately, the exclusive breastfeeding rate for the first 6
months after birth is higher compared to other African countries with similar under-
five child mortality (93). At 6 to 9 months of age, only half of the children received
complementary foods. The proportion of minimum acceptable diet for breastfed
children was only 21%, and only 5% of children 6 to 23 months of age fulfilled
minimum standards with respect to food diversity (94). The environment, where
available food resources are few, used to impose constraints on preparing diversified
and enough amounts of food for infants and young children. Responsive feeding is
commonly practiced by the caregivers in some districts (121). Pre-lacteal feeding, a
complementary diet started at 12 months of age or beyond, bottle-feeding, and
maternal illiteracy were reported as major risk factors that increase the occurrence of
stunting (97, 122). The fact that stunted preschool children were observed even in
food surplus areas underscored the importance of adequate feeding practices (100).
Ethiopian mothers' knowledge and beliefs towards breastfeeding and
complementary foods are not well known. Nevertheless, few studies have pointed out
current barriers in promoting infant and young child feeding and caring practices.
Colostrum was often discarded as it was considered to cause abdominal problems, and
ritual pre-lacteal feeding was often reported (122-124). In some districts, caregivers
recognized colostrum (inger) and breast milk (yetut wotet) as different substances
(122). While maternal knowledge about the nutritional value of human milk and
37
breastfeeding duration was overall sound, the majority of mothers preferred not to
breastfeed during illness of mother or child (123). Some mothers began the
introduction of weaning food at the child’s age of 4-6 months, mainly because the
mothers believed that the reduction of the amount of breast milk and the child’s age
would be adequate to start weaning food (124). As such, potentially harmful beliefs,
which could lead to the detrimental health outcomes, should be well-addressed
through culturally tailored and context-specific behavior change communication
strategies that promote immediate colostrum feeding and discourage pre-lacteal
feeding.
2.7.3 Essential Nutrition Action (ENA) and Community-based Management of
Acute Malnutrition (CMAM) programs in Ethiopia
The ENA framework was initiated by the USAID-funded BASICS project in 1997,
and was implemented in developing countries including Madagascar and Ethiopia
under the USAID-funded LINKAGES Project of the Academy for Educational
Development (AED)(125, 126). The ENA operational framework uses an integrated
package of preventive nutrition actions including IYCF, micronutrients, and women’s
nutrition. Delivering strategies included interpersonal counseling, community
mobilization, and mass media at variable contact points such as antenatal and
postnatal care, immunization sessions, and healthcare service during child illnesses
(126). A peer reviewed ENA framework study in Madagascar reported collectively
positive impacts (127). After five years of implementation, the rate of exclusive
breastfeeding in the first 6 months after birth increased from 42% to 70% (p < 0.001),
and the rate of feeding children the minimum recommended number of meals per day
at 6 to 23 months increased from 87% to 93% (p < 0.001). But behaviors such as
38
dietary diversity of complementary foods or appropriate feeding during child illnesses
had non-significant changes. In 2008, the Ethiopian government launched its first-
ever National Nutrition Strategy (NNS), primarily focusing on improvement of
maternal and child nutritional status (128). As one of the key nutrition activities of the
NNS/NNP, the Essential Nutrition Actions (ENA) program was expected to promote
and support the prioritized nutrition behaviors (128). Messages delivered through the
ENA program included optimal breastfeeding, appropriate complementary feeding,
care of sick children, importance of women’s nutrition, control of vitamin A
deficiency and anemia, and iodine deficiency disorders (129). In Ethiopia, the
Volunteer Community Health Workers (VCHWs) supported by Health Extension
Workers (HEWs) were the main deliverers of the ENA program at the Kebelec level
(130). In addition, the VCHWs were involved in other relevant health activities
including antenatal care, preparation before delivery and prenatal care, family
planning, immunization, and growth monitoring. The ENA program achieved
significant improvement in breastfeeding practices, maternal diet, and vitamin A
supplementation, but barely promoted complementary foods and hygiene practices in
some districts in Ethiopia (125).
In 2011, the prevalence of severely acute malnourished children under five
years of age was 2.8%, and the prevalence of moderately malnourished children was
6.9% (94). The population covered by the CMAM program was more than 40 million
(131). The CMAM program was piloted in the year 2000 as part of a research
program in Malawi, Ethiopia, and South Sudan, and a large-scale program was
launched in response to the drought in 2003. National protocols for severely acute
malnutrition case management are currently available (132). A total of 315 districts
cThe smallest administration unit under district level in Ethiopia.

39
have either inpatient wards or Out-patient Therapeutic Programs (OTPs). Since 2002,
the national capacity of the CMAM program has been expanded from treatment of
18,000 to treatment of 230,000 severely malnourished patients, and has reached 59%
of health facility coverage (133). HEWs and VCHWs are trained for screening and
referring acutely malnourished children. Government ownership and commitment was
considered as the key to CMAM scaling up; however, systems are still needed to
monitor and improve quality of service (131, 133).

40
Appendix 2.1 Infant and young child feeding (IYCF) indicators
Core indicators
Category Indicators Definition
Breastfeeding
initiation
Early initiation of
breastfeeding
Proportion of children born in the
last 24 months who were put to the
breast within one hour of birth
Exclusive
breastfeeding
Exclusive breastfeeding
under 6 months
Proportion of infants 0–5 months
of age who are fed exclusively
with breast milk
Continued
breastfeeding
Continued breastfeeding
at 1 year
Proportion of children 12–15
months of age who are fed breast
milk
Introduction of
complementary
foods
Introduction of solid,
semi-solid or soft foods
Proportion of infants 6–8 months
of age who receive solid, semi-
solid or soft foods
Dietary diversity Minimum dietary
diversity
Proportion of children 6–23
months of age who receive foods
from 4 or more food groups
Meal frequency
Minimum meal
frequency
Proportion of breastfed and non-
breastfed children 6–23 months of
age who receive solid, semi-solid,
or soft foods (but also including
milk feeds for non-breastfed
children) the minimum number of
times or more.
Summary infant
and young child
feeding indicator
Minimum acceptable
diet
Proportion of children 6–23
months of age who receive a mini-
mum acceptable diet (apart from
breast milk).
Consumption of
iron-rich or iron-
fortified foods
Consumption of iron-
rich or iron-fortified
foods
Proportion of children 6–23
months of age who receive an
iron-rich food or iron-fortified
food that is specially designed for
infants and young children, or that
is fortified in the home.
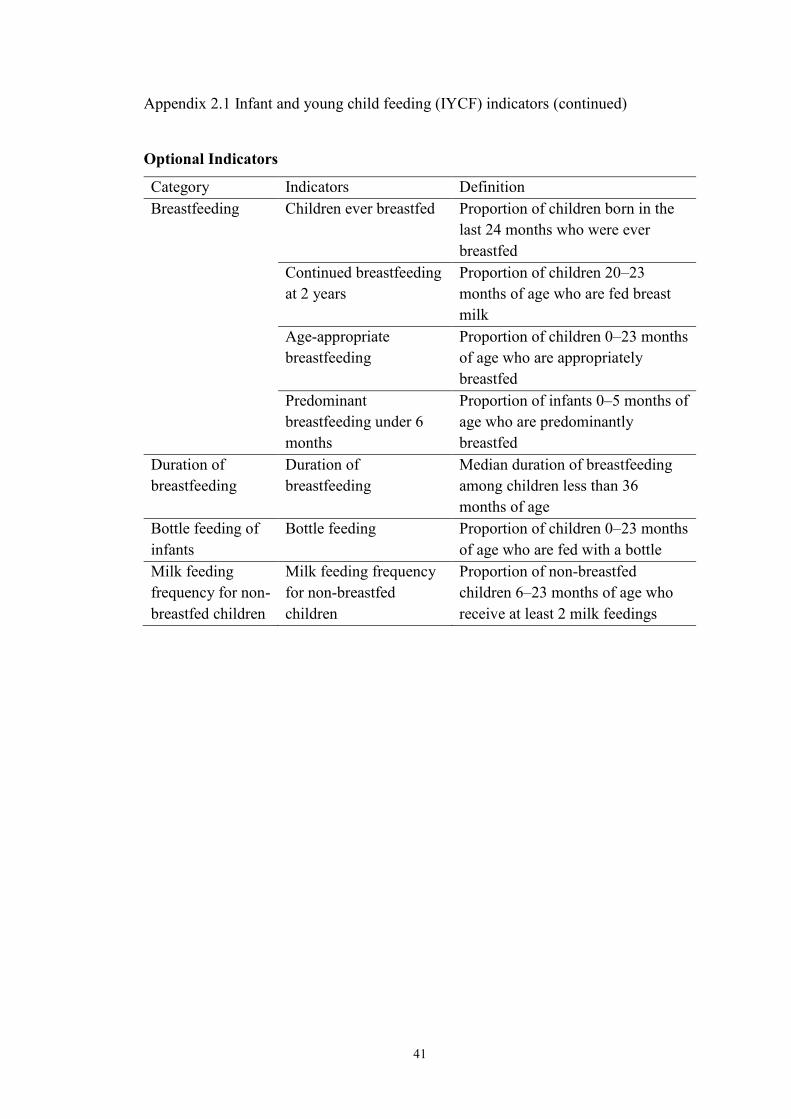
41
Appendix 2.1 Infant and young child feeding (IYCF) indicators (continued)
Optional Indicators
Category Indicators Definition
Breastfeeding Children ever breastfed Proportion of children born in the
last 24 months who were ever
breastfed
Continued breastfeeding
at 2 years
Proportion of children 20–23
months of age who are fed breast
milk
Age-appropriate
breastfeeding
Proportion of children 0–23 months
of age who are appropriately
breastfed
Predominant
breastfeeding under 6
months
Proportion of infants 0–5 months of
age who are predominantly
breastfed
Duration of
breastfeeding
Duration of
breastfeeding
Median duration of breastfeeding
among children less than 36
months of age
Bottle feeding of
infants
Bottle feeding Proportion of children 0–23 months
of age who are fed with a bottle
Milk feeding
frequency for non-
breastfed children
Milk feeding frequency
for non-breastfed
children
Proportion of non-breastfed
children 6–23 months of age who
receive at least 2 milk feedings
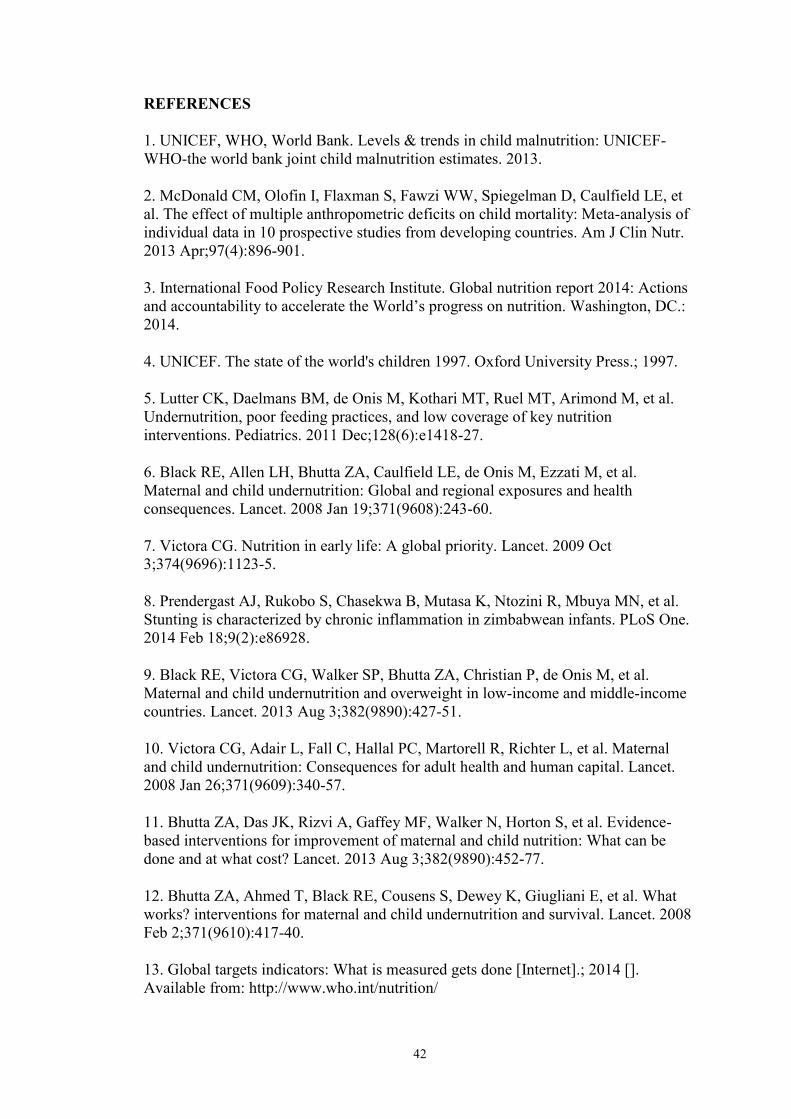
42
REFERENCES
1. UNICEF, WHO, World Bank. Levels & trends in child malnutrition: UNICEF-
WHO-the world bank joint child malnutrition estimates. 2013.
2. McDonald CM, Olofin I, Flaxman S, Fawzi WW, Spiegelman D, Caulfield LE, et
al. The effect of multiple anthropometric deficits on child mortality: Meta-analysis of
individual data in 10 prospective studies from developing countries. Am J Clin Nutr.
2013 Apr;97(4):896-901.
3. International Food Policy Research Institute. Global nutrition report 2014: Actions
and accountability to accelerate the World’s progress on nutrition. Washington, DC.:
2014.
4. UNICEF. The state of the world's children 1997. Oxford University Press.; 1997.
5. Lutter CK, Daelmans BM, de Onis M, Kothari MT, Ruel MT, Arimond M, et al.
Undernutrition, poor feeding practices, and low coverage of key nutrition
interventions. Pediatrics. 2011 Dec;128(6):e1418-27.
6. Black RE, Allen LH, Bhutta ZA, Caulfield LE, de Onis M, Ezzati M, et al.
Maternal and child undernutrition: Global and regional exposures and health
consequences. Lancet. 2008 Jan 19;371(9608):243-60.
7. Victora CG. Nutrition in early life: A global priority. Lancet. 2009 Oct
3;374(9696):1123-5.
8. Prendergast AJ, Rukobo S, Chasekwa B, Mutasa K, Ntozini R, Mbuya MN, et al.
Stunting is characterized by chronic inflammation in zimbabwean infants. PLoS One.
2014 Feb 18;9(2):e86928.
9. Black RE, Victora CG, Walker SP, Bhutta ZA, Christian P, de Onis M, et al.
Maternal and child undernutrition and overweight in low-income and middle-income
countries. Lancet. 2013 Aug 3;382(9890):427-51.
10. Victora CG, Adair L, Fall C, Hallal PC, Martorell R, Richter L, et al. Maternal
and child undernutrition: Consequences for adult health and human capital. Lancet.
2008 Jan 26;371(9609):340-57.
11. Bhutta ZA, Das JK, Rizvi A, Gaffey MF, Walker N, Horton S, et al. Evidence-
based interventions for improvement of maternal and child nutrition: What can be
done and at what cost? Lancet. 2013 Aug 3;382(9890):452-77.
12. Bhutta ZA, Ahmed T, Black RE, Cousens S, Dewey K, Giugliani E, et al. What
works? interventions for maternal and child undernutrition and survival. Lancet. 2008
Feb 2;371(9610):417-40.
13. Global targets indicators: What is measured gets done [Internet].; 2014 [].
Available from: http://www.who.int/nutrition/

43
14. Emergency Nutrition Network. Review of the links between wasting and stunting.
ENN, 2014. available
from: http://www.ennonline.net/ourwork/reviews/wastingstunting. .
15. Christian P, Lee SE, Donahue Angel M, Adair LS, Arifeen SE, Ashorn P, et al.
Risk of childhood undernutrition related to small-for-gestational age and preterm birth
in low- and middle-income countries. Int J Epidemiol. 2013 Oct;42(5):1340-55.
16. Addo OY, Stein AD, Fall CH, Gigante DP, Guntupalli AM, Horta BL, et al.
Maternal height and child growth patterns. J Pediatr. 2013 Aug;163(2):549-54.
17. Victora CG, de Onis M, Hallal PC, Blossner M, Shrimpton R. Worldwide timing
of growth faltering: Revisiting implications for interventions. Pediatrics. 2010
Mar;125(3):e473-80.
18. Martorell R, Young MF. Patterns of stunting and wasting: Potential explanatory
factors. Adv Nutr. 2012 Mar 1;3(2):227-33.
19. Schlaudecker EP, Steinhoff MC, Moore SR. Interactions of diarrhea, pneumonia,
and malnutrition in childhood: Recent evidence from developing countries. Curr Opin
Infect Dis. 2011 Oct;24(5):496-502.
20. Schmidt WP, Cairncross S, Barreto ML, Clasen T, Genser B. Recent diarrhoeal
illness and risk of lower respiratory infections in children under the age of 5 years. Int
J Epidemiol. 2009 Jun;38(3):766-72.
21. Schmidt WP, Boisson S, Genser B, Barreto ML, Baisley K, Filteau S, et al.
Weight-for-age z-score as a proxy marker for diarrhoea in epidemiological studies. J
Epidemiol Community Health. 2010 Dec;64(12):1074-9.
22. Zaman K, Roy E, Arifeen SE, Rahman M, Raqib R, Wilson E, et al. Effectiveness
of maternal influenza immunization in mothers and infants. N Engl J Med. 2008 Oct
9;359(15):1555-64.
23. Steinhoff MC, Omer SB, Roy E, Arifeen SE, Raqib R, Altaye M, et al. Influenza
immunization in pregnancy--antibody responses in mothers and infants. N Engl J
Med. 2010 Apr 29;362(17):1644-6.
24. Richard SA, Black RE, Gilman RH, Guerrant RL, Kang G, Lanata CF, et al.
Diarrhea in early childhood: Short-term association with weight and long-term
association with length. Am J Epidemiol. 2013 Oct 1;178(7):1129-38.
25. Keusch GT, Denno DM, Black RE, Duggan C, Guerrant RL, Lavery JV, et al.
Environmental enteric dysfunction: Pathogenesis, diagnosis, and clinical
consequences. Clin Infect Dis. 2014 Nov 1;59 Suppl 4:S207-12.
26. Humphrey JH. Child undernutrition, tropical enteropathy, toilets, and
handwashing. Lancet. 2009 Sep 19;374(9694):1032-5.

44
27. Prentice AM, Ward KA, Goldberg GR, Jarjou LM, Moore SE, Fulford AJ, et al.
Critical windows for nutritional interventions against stunting. Am J Clin Nutr. 2013
May;97(5):911-8.
28. Lundeen EA, Behrman JR, Crookston BT, Dearden KA, Engle P, Georgiadis A, et
al. Growth faltering and recovery in children aged 1-8 years in four low- and middle-
income countries: Young lives. Public Health Nutr. 2014 Sep;17(9):2131-7.
29. Schott WB, Crookston BT, Lundeen EA, Stein AD, Behrman JR, Young Lives
Determinants and Consequences of Child Growth Project Team. Periods of child
growth up to age 8 years in ethiopia, india, peru and vietnam: Key distal household
and community factors. Soc Sci Med. 2013 Nov;97:278-87.
30. Dewey KG, Brown KH. Update on technical issues concerning complementary
feeding of young children in developing countries and implications for intervention
programs. Food Nutr Bull. 2003 Mar;24(1):5-28.
31. Islam MM, Khatun M, Peerson JM, Ahmed T, Mollah MA, Dewey KG, et al.
Effects of energy density and feeding frequency of complementary foods on total
daily energy intakes and consumption of breast milk by healthy breastfed bangladeshi
children. Am J Clin Nutr. 2008 Jul;88(1):84-94.
32. WHO. Indicators for assessing infant and young child feeding practices - part I:
Definitions. conclusions of a consensus meeting held 6–8 november 2007.
Washington D.C., USA; 2008.
33. Engebretsen IM, Jackson D, Fadnes LT, Nankabirwa V, Diallo AH, Doherty T, et
al. Growth effects of exclusive breastfeeding promotion by peer counsellors in sub-
saharan africa: The cluster-randomised PROMISE EBF trial. BMC Public Health.
2014 Jun 21;14:633,2458-14-633.
34. Arabi M, Frongillo EA, Avula R, Mangasaryan N. Infant and young child feeding
in developing countries. Child Dev. 2012 Jan-Feb;83(1):32-45.
35. Marriott BP, White A, Hadden L, Davies JC, Wallingford JC. World health
organization (WHO) infant and young child feeding indicators: Associations with
growth measures in 14 low-income countries. Matern Child Nutr. 2012 Jul;8(3):354-
70.
36. Jones AD, Ickes SB, Smith LE, Mbuya MN, Chasekwa B, Heidkamp RA, et al.
World health organization infant and young child feeding indicators and their
associations with child anthropometry: A synthesis of recent findings. Matern Child
Nutr. 2014 Jan;10(1):1-17.
37. Ruel MT, Menon P. Child feeding practices are associated with child nutritional
status in latin america: Innovative uses of the demographic and health surveys. J Nutr.
2002 Jun;132(6):1180-7.

45
38. Sawadogo PS, Martin-Prevel Y, Savy M, Kameli Y, Traissac P, Traore AS, et al.
An infant and child feeding index is associated with the nutritional status of 6- to 23-
month-old children in rural Burkina Faso. J Nutr. 2006 Mar;136(3):656-63.
39. Bork K, Cames C, Barigou S, Cournil A, Diallo A. A summary index of feeding
practices is positively associated with height-for-age, but only marginally with linear
growth, in rural Senegalese infants and toddlers. J Nutr. 2012 Jun;142(6):1116-22.
40. Haile D, Belachew T, Birhanu G, Setegn T, Biadgilign S. Infant feeding practices
among HIV exposed infants using summary index in sidama zone, southern Ethiopia:
A cross sectional study. BMC Pediatr. 2014 Feb 18;14:49,2431-14-49.
41. Moursi MM, Treche S, Martin-Prevel Y, Maire B, Delpeuch F. Association of a
summary index of child feeding with diet quality and growth of 6-23 months children
in urban Madagascar. Eur J Clin Nutr. 2009 Jun;63(6):718-24.
42. Arimond M, Ruel M. Summary indicators for infant and child feeding practices:
An example from the Ethiopia demographic and health survey 2000. Academy for
Educational Development 1825 Connecticut Ave., NW Washington, DC 20009-5721:
Food and Nutrition Technical Assistance Project (FANTA); 2002.
43. Ma JQ, Zhou LL, Hu YQ, Liu JR, Liu SS, Zhang J, et al. A summary index of
infant and child feeding practices is associated with child growth in urban Shanghai.
BMC Public Health. 2012 Jul 28;12:568,2458-12-568.
44. Moursi MM, Martin-Prevel Y, Eymard-Duvernay S, Capon G, Treche S, Maire B,
et al. Assessment of child feeding practices using a summary index: Stability over
time and association with child growth in urban Madagascar. Am J Clin Nutr. 2008
May;87(5):1472-9.
45. Caulfield L, Huffman S, Piwoz E. Interventions to improve intake of
complementary foods by infants 6 to 12 months of age in developing countries:
Impact on growth and on the prevalence of malnutrition and potential contribution to
child survival. Food and nutrition bulletin. 1999;20:183-200.
46. Imdad A, Yakoob MY, Bhutta ZA. Impact of maternal education about
complementary feeding and provision of complementary foods on child growth in
developing countries. BMC Public Health. 2011 Apr 13;11 Suppl 3:S25.
47. Shi L, Zhang J. Recent evidence of the effectiveness of educational interventions
for improving complementary feeding practices in developing countries. J Trop
Pediatr. 2011 Apr;57(2):91-8.
48. Stewart CP, Iannotti L, Dewey KG, Michaelsen KF, Onyango AW.
Contextualising complementary feeding in a broader framework for stunting
prevention. Matern Child Nutr. 2013 Sep;9 Suppl 2:27-45.
49. Penny ME, Creed-Kanashiro HM, Robert RC, Narro MR, Caulfield LE, Black
RE. Effectiveness of an educational intervention delivered through the health services

46
to improve nutrition in young children: A cluster-randomised controlled trial. Lancet.
2005 May 28-Jun 3;365(9474):1863-72.
50. Shi L, Zhang J, Wang Y, Caulfield LE, Guyer B. Effectiveness of an educational
intervention on complementary feeding practices and growth in rural China: A cluster
randomised controlled trial. Public Health Nutr. 2010 Apr;13(4):556-65.
51. Lassi ZS, Das JK, Zahid G, Imdad A, Bhutta ZA. Impact of education and
provision of complementary feeding on growth and morbidity in children less than 2
years of age in developing countries: A systematic review. BMC Public Health.
2013;13 Suppl 3:S13,2458-13-S3-S13. Epub 2013 Sep 17.
52. Roy SK, Jolly SP, Shafique S, Fuchs GJ, Mahmud Z, Chakraborty B, et al.
Prevention of malnutrition among young children in rural Bangladesh by a food-
health-care educational intervention: A randomized, controlled trial. Food Nutr Bull.
2007 Dec;28(4):375-83.
53. Kilaru A, Griffiths PL, Ganapathy S, Ghosh S. Community-based nutrition
education for improving infant growth in rural Karnataka. Indian Pediatr. 2005
May;42(5):425-32.
54. Santos I, Victora CG, Martines J, Goncalves H, Gigante DP, Valle NJ, et al.
Nutrition counseling increases weight gain among Brazilian children. J Nutr. 2001
Nov;131(11):2866-73.
55. Bhandari N, Mazumder S, Bahl R, Martines J, Black RE, Bhan MK, et al. An
educational intervention to promote appropriate complementary feeding practices and
physical growth in infants and young children in rural Haryana, India. J Nutr. 2004
Sep;134(9):2342-8.
56. Roy SK, Fuchs GJ, Mahmud Z, Ara G, Islam S, Shafique S, et al. Intensive
nutrition education with or without supplementary feeding improves the nutritional
status of moderately-malnourished children in Bangladesh. J Health Popul Nutr. 2005
Dec;23(4):320-30.
57. Zaman S, Ashraf RN, Martines J. Training in complementary feeding counselling
of healthcare workers and its influence on maternal behaviours and child growth: A
cluster-randomized controlled trial in Lahore, Pakistan. J Health Popul Nutr. 2008
Jun;26(2):210-22.
58. le Roux IM, le Roux K, Comulada WS, Greco EM, Desmond KA, Mbewu N, et
al. Home visits by neighborhood mentor mothers provide timely recovery from
childhood malnutrition in South Africa: Results from a randomized controlled trial.
Nutr J. 2010 Nov 22;9:56.
59. Salehi M, Kimiagar SM, Shahbazi M, Mehrabi Y, Kolahi AA. Assessing the
impact of nutrition education on growth indices of Iranian nomadic children: An
application of a modified beliefs, attitudes, subjective-norms and enabling-factors
model. Br J Nutr. 2004 May;91(5):779-87.

47
60. Aboud FE, Akhter S. A cluster-randomized evaluation of a responsive stimulation
and feeding intervention in Bangladesh. Pediatrics. 2011 May;127(5):e1191-7.
61. Aboud FE, Shafique S, Akhter S. A responsive feeding intervention increases
children's self-feeding and maternal responsiveness but not weight gain. J Nutr. 2009
Sep;139(9):1738-43.
62. Aboud FE, Moore AC, Akhter S. Effectiveness of a community-based responsive
feeding programme in rural Bangladesh: A cluster randomized field trial. Matern
Child Nutr. 2008 Oct;4(4):275-86.
63. Gartner A, Kameli Y, Traissac P, Dhur A, Delpeuch F, Maire B. Has the first
implementation phase of the community nutrition project in urban Senegal had an
impact? Nutrition. 2007 Mar;23(3):219-28.
64. Gartner A, Maire B, Traissac P, Kameli Y, Delpeuch F. Determinants of nutrition
improvement in a large-scale urban project: A follow-up study of children
participating in the Senegal community nutrition project. Public Health Nutr. 2006
Dec;9(8):982-90.
65. Schooley J, Morales L. Learning from the community to improve maternal-child
health and nutrition: The positive Deviance/Hearth approach. J Midwifery Womens
Health. 2007 Jul-Aug;52(4):376-83.
66. Wishik SM, Vynckt S. The use of nutritional 'positive deviants' to identify
approaches for modification of dietary practices. Am J Public Health. 1976
Jan;66(1):38-42.
67. Zeitlin M, Ghassemi H, Mansour M. Positive deviance in child nutrition: With
emphasis on psychosocial and behavioral aspects and implications for development.
the United Nations university, Tokyo. available at:
Http://unu.edu/unupress/unupbooks/80697e/80697E00.htm [accessed 19 december
2010. 1990.
68. Burkhalter BR & Northrup RS. Hearth program at the hospital Albert Schweitzer
in Haiti. in: Hearth nutrition model: Applications in Haiti, Vietnam, and Bangladesh
(ed. O wollinka, E keeley, BR burkhalter & N bashir) the U.S. Agency for
International Development and World Relief Corporation by the Basic Support for
Institutionalizing Child Survival (BASICS) Project; 1997.
69. Bisits Bullen PA. The positive deviance/hearth approach to reducing child
malnutrition: Systematic review. Trop Med Int Health. 2011 Jul 12.
70. Nutrition Working Group, Child Survival Collaborations and Resources Group
(CORE). Positive deviance / hearth: A resource guide for sustainably rehabilitating
malnourished children. Washington, D.C: December 2002.
71. Mackintosh UA, Marsh DR, Schroeder DG. Sustained positive deviant child care
practices and their effects on child growth in Vietnam. Food Nutr Bull. 2002
Dec;23(4 Suppl):18-27.

48
72. Marsh DR, Pachon H, Schroeder DG, Ha TT, Dearden K, Lang TT, et al. Design
of a prospective, randomized evaluation of an integrated nutrition program in rural
Vietnam. Food Nutr Bull. 2002 Dec;23(4 Suppl):36-47.
73. Schroeder DG, Pachon H, Dearden KA, Kwon CB, Ha TT, Lang TT, et al. An
integrated child nutrition intervention improved growth of younger, more
malnourished children in northern Vietnam. Food Nutr Bull. 2002 Dec;23(4
Suppl):53-61.
74. Pachon H, Schroeder DG, Marsh DR, Dearden KA, Ha TT, Lang TT. Effect of an
integrated child nutrition intervention on the complementary food intake of young
children in rural north Vietnam. Food Nutr Bull. 2002 Dec;23(4 Suppl):62-9.
75. McNulty J, Pambudi ES. Report of the Pos Gizi Assessment: Suggestions for
expanding the approach in Indonesia.
http://www.positivedeviance.org/PD_Evaluation_Report_for_DEPKES_FINAL.pdf:
2008.
76. Brackett C. Malnutrition interventions in developing nations: Strengths and
weaknesses of the positive deviance ⁄ hearth program in rural Rwanda. Fullerton:
California State University; 2007.
77. Burkhalter BR, Northrup RS. Hearth program at the hoˆ pital Albert Schweitzer in
Haiti in: Hearth nutrition model: Applications in Haiti, Vietnam, and Bangladesh.
available at: Http://pdf.usaid.gov/pdf_docs/ PNACA868.pdf. Arlington: the U.S.
Agency for International Development and World Relief Corporation by the Basic
Support for Institutionalizing Child Survival (BASICS) Project; 1997.
78. Bolles K, Speraw C, Berggren G, Lafontant JG. Ti foyer (hearth) community-
based nutrition activities informed by the positive deviance approach in Leogane,
Haiti: A programmatic description. Food Nutr Bull. 2002 Dec;23(4 Suppl):11-7.
79. Sethi V, Kashyap S, Aggarwal S, Pandey RM, Kondal D. Positive deviance
determinants in young infants in rural Uttar Pradesh. Indian J Pediatr. 2007
Jun;74(6):594-5.
80. Saunders RP, Evans MH, Joshi P. Developing a process-evaluation plan for
assessing health promotion program implementation: A how-to guide. Health Promot
Pract. 2005 Apr;6(2):134-47.
81. Rossi P, Lipsey M, Freeman H. Evaluation: A systematic approach. Thousand
Oaks, Calif, USA: Sage Publications; 2003.
82. Oakley A, Strange V, Bonell C, Allen E, Stephenson J, RIPPLE Study Team.
Process evaluation in randomised controlled trials of complex interventions. BMJ.
2006 Feb 18;332(7538):413-6.
83. Robert RC, Gittelsohn J, Creed-Kanashiro HM, Penny ME, Caulfield LE, Narro
MR, et al. Process evaluation determines the pathway of success for a health center-

49
delivered, nutrition education intervention for infants in Trujillo, Peru. J Nutr. 2006
Mar;136(3):634-41.
84. Newman JE, Garces A, Mazariegos M, Michael Hambidge K, Manasyan A,
Tshefu A, et al. Theory-driven process evaluation of a complementary feeding trial in
four countries. Health Educ Res. 2014 Apr;29(2):297-305.
85. Gartner A, Maire B, Kameli Y, Traissac P, Delpeuch F. Process evaluation of the
senegal-community nutrition project: An adequacy assessment of a large scale urban
project. Trop Med Int Health. 2006 Jun;11(6):955-66.
86. Avula R, Menon P, Saha KK, Bhuiyan MI, Chowdhury AS, Siraj S, et al. A
program impact pathway analysis identifies critical steps in the implementation and
utilization of a behavior change communication intervention promoting infant and
child feeding practices in Bangladesh. J Nutr. 2013 Dec;143(12):2029-37.
87. Nguyen PH, Menon P, Keithly SC, Kim SS, Hajeebhoy N, Tran LM, et al.
Program impact pathway analysis of a social franchise model shows potential to
improve infant and young child feeding practices in Vietnam. J Nutr. 2014 Aug 20.
88. Rawat R, Nguyen PH, Ali D, Saha K, Alayon S, Kim SS, et al. Learning how
programs achieve their impact: Embedding theory-driven process evaluation and
other program learning mechanisms in Alive & Thrive. Food Nutr Bull. 2013
Sep;34(3 Suppl):S212-25.
89. WHO (World Health Organization). Strengthening action to improve feeding of
infants and young children 6–23 months of age in nutrition and child health
programmes: Report of proceedings, october, 6–9, 2008. 2009.
90. Leroy JL, M. Ruel M, Verhofstadt E. The impact of conditional cash transfer
programmes on child nutrition: A review of evidence using a programme theory
framework. Journal of Development Effectiveness. 2009;1(2):103-29.
91. Robert RC, Gittelsohn J, Creed-Kanashiro HM, Penny ME, Caulfield LE, Narro
MR, et al. Implementation examined in a health center-delivered, educational
intervention that improved infant growth in Trujillo, Peru: Successes and challenges.
Health Educ Res. 2007 Jun;22(3):318-31.
92. Olney DK, Vicheka S, Kro M, Chakriya C, Kroeun H, Hoing LS, et al. Using
program impact pathways to understand and improve program delivery, utilization,
and potential for impact of Helen Keller International's homestead food production
program in Cambodia. Food Nutr Bull. 2013 Jun;34(2):169-84.
93. UNICEF. Tracking progress on child and maternal nutrition: A survival and
development priority: A survival and development priority. 2009. Internet:
Http://www.unicef.org/publications/files/Tracking_Progress_on_Child_and_Maternal
_Nutrition_EN_110309.pdf. 2009.
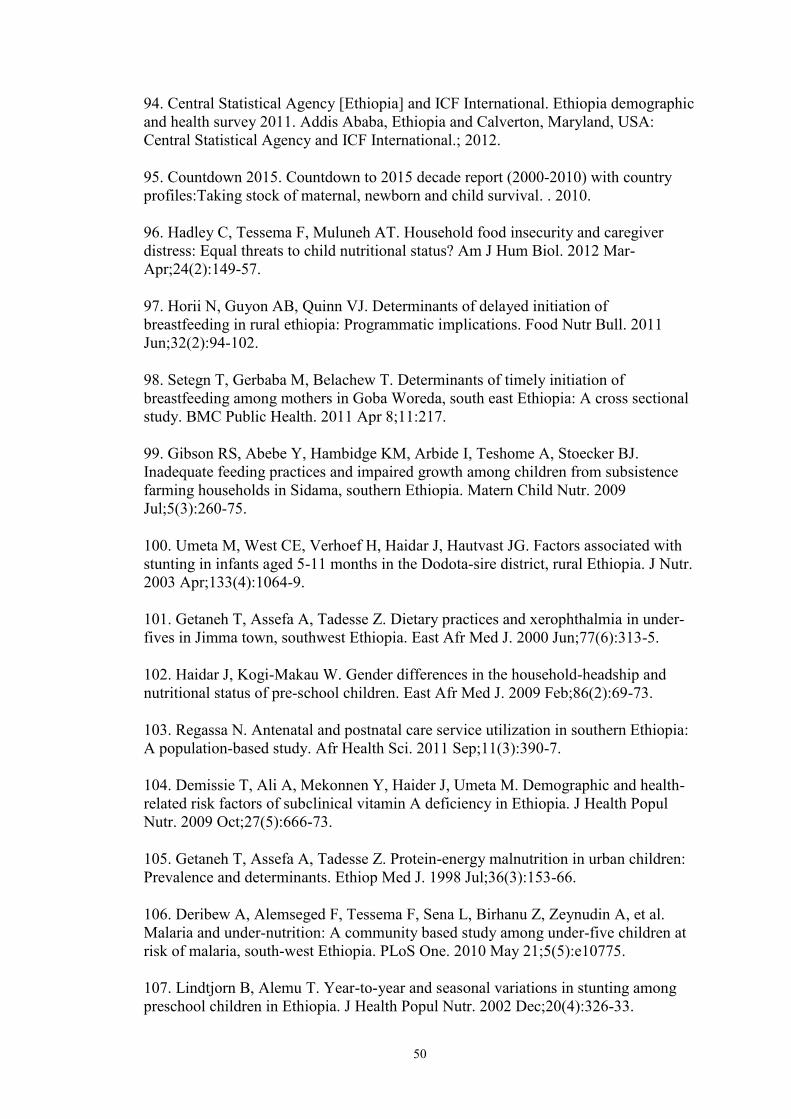
50
94. Central Statistical Agency [Ethiopia] and ICF International. Ethiopia demographic
and health survey 2011. Addis Ababa, Ethiopia and Calverton, Maryland, USA:
Central Statistical Agency and ICF International.; 2012.
95. Countdown 2015. Countdown to 2015 decade report (2000-2010) with country
profiles:Taking stock of maternal, newborn and child survival. . 2010.
96. Hadley C, Tessema F, Muluneh AT. Household food insecurity and caregiver
distress: Equal threats to child nutritional status? Am J Hum Biol. 2012 Mar-
Apr;24(2):149-57.
97. Horii N, Guyon AB, Quinn VJ. Determinants of delayed initiation of
breastfeeding in rural ethiopia: Programmatic implications. Food Nutr Bull. 2011
Jun;32(2):94-102.
98. Setegn T, Gerbaba M, Belachew T. Determinants of timely initiation of
breastfeeding among mothers in Goba Woreda, south east Ethiopia: A cross sectional
study. BMC Public Health. 2011 Apr 8;11:217.
99. Gibson RS, Abebe Y, Hambidge KM, Arbide I, Teshome A, Stoecker BJ.
Inadequate feeding practices and impaired growth among children from subsistence
farming households in Sidama, southern Ethiopia. Matern Child Nutr. 2009
Jul;5(3):260-75.
100. Umeta M, West CE, Verhoef H, Haidar J, Hautvast JG. Factors associated with
stunting in infants aged 5-11 months in the Dodota-sire district, rural Ethiopia. J Nutr.
2003 Apr;133(4):1064-9.
101. Getaneh T, Assefa A, Tadesse Z. Dietary practices and xerophthalmia in under-
fives in Jimma town, southwest Ethiopia. East Afr Med J. 2000 Jun;77(6):313-5.
102. Haidar J, Kogi-Makau W. Gender differences in the household-headship and
nutritional status of pre-school children. East Afr Med J. 2009 Feb;86(2):69-73.
103. Regassa N. Antenatal and postnatal care service utilization in southern Ethiopia:
A population-based study. Afr Health Sci. 2011 Sep;11(3):390-7.
104. Demissie T, Ali A, Mekonnen Y, Haider J, Umeta M. Demographic and health-
related risk factors of subclinical vitamin A deficiency in Ethiopia. J Health Popul
Nutr. 2009 Oct;27(5):666-73.
105. Getaneh T, Assefa A, Tadesse Z. Protein-energy malnutrition in urban children:
Prevalence and determinants. Ethiop Med J. 1998 Jul;36(3):153-66.
106. Deribew A, Alemseged F, Tessema F, Sena L, Birhanu Z, Zeynudin A, et al.
Malaria and under-nutrition: A community based study among under-five children at
risk of malaria, south-west Ethiopia. PLoS One. 2010 May 21;5(5):e10775.
107. Lindtjorn B, Alemu T. Year-to-year and seasonal variations in stunting among
preschool children in Ethiopia. J Health Popul Nutr. 2002 Dec;20(4):326-33.

51
108. De Silva MJ, Harpham T. Maternal social capital and child nutritional status in
four developing countries. Health Place. 2007 Jun;13(2):341-55.
109. Haidar J, Omwega AM, Muroki NM, Ayana G. Daily versus weekly iron
supplementation and prevention of iron deficiency anaemia in lactating women. East
Afr Med J. 2003 Jan;80(1):11-6.
110. Wondmikun Y. Lipid-soluble antioxidants status and some of its socio-economic
determinants among pregnant Ethiopians at the third trimester. Public Health Nutr.
2005 Sep;8(6):582-7.
111. Haidar J, Nekatibeb H, Urga K. Iron deficiency anemia in pregnant and lactating
mothers in rural Ethiopia. East Afr Med J. 1999 Nov;76(11):618-22.
112. Demissie T, Ali A, Mekonen Y, Haider J, Umeta M. Magnitude and distribution
of vitamin A deficiency in Ethiopia. Food Nutr Bull. 2010 Jun;31(2):234-41.
113. Haddad L, Ross J, Oshaug A, Torheim LE, Cogill B. 5th report on the world
nutrition situation, 2004: Nutrition for improved development outcomes; p. 102.
Geneva: United Nations Standing Committee on Nutrition; 2004.
114. Haidar J, Tsegaye D, Mariam DH, Tibeb HN, Muroki NM. Vitamin A
supplementation on child morbidity. East Afr Med J. 2003 Jan;80(1):17-21.
115. Bhutta ZA, Chopra M, Axelson H, Berman P, Boerma T, Bryce J, et al.
Countdown to 2015 decade report (2000-10): Taking stock of maternal, newborn, and
child survival. Lancet. 2010 Jun 5;375(9730):2032-44.
116. Availability of local food supply and nutrient deficiencies in Ethiopia [Internet].;
March 2009. Available from:
http://www.wishh.org/workshops/intl/ethiopia/mar09/ppt/Baye__UNECA_mar09.pdf
117. Adish AA, Esrey SA, Gyorkos TW, Johns T. Risk factors for iron deficiency
anaemia in preschool children in northern Ethiopia. Public Health Nutr. 1999
Sep;2(3):243-52.
118. Subcommittee on Nutrition During Lactation, Committee on Nutritional Status
During Pregnancy and Lactation, Food and Nutrition Board, Institute of Medicine.
Nutrition during lactation. Washington, D.C.: National Academy Press; 1991.
119. Stoecker BJ, Abebe Y, Hubbs-Tait L, Kennedy TS, Gibson RS, Arbide I, et al.
Zinc status and cognitive function of pregnant women in southern Ethiopia. Eur J Clin
Nutr. 2009 Jul;63(7):916-8.
120. Umeta M, West CE, Haidar J, Deurenberg P, Hautvast JG. Zinc supplementation
and stunted infants in Ethiopia: A randomised controlled trial. Lancet. 2000 Jun
10;355(9220):2021-6.
121. Srivastava N, Sandhu A. Infant and child feeding index. Indian J Pediatr. 2006
Sep;73(9):767-70.

52
122. Rogers NL, Abdi J, Moore D, Nd'iangui S, Smith LJ, Carlson AJ, et al.
Colostrum avoidance, prelacteal feeding and late breast-feeding initiation in rural
northern Ethiopia. Public Health Nutr. 2011 Nov;14(11):2029-36.
123. Woldegebriel A. Mothers' knowledge and belief on breast feeding. Ethiop Med J.
2002 Oct;40(4):365-74.
124. Bekele A, Berhane Y. Weaning in Butajira, south Ethiopia: A study on mothers'
knowledge and practice. Ethiop Med J. 1998 Jan;36(1):37-45.
125. The LINKAGES Project: Guyon A, Beyero M, Hainworth M, Quinn V. The
ESHE Project: Carnell M, Mulligan B, Solomon E, et al. Community assessment in
selected ESHE focus woredas in amhara, oromia, & SNNP regions. Ethiopia. 2006.
126. FANTA. Review of incorporation of essential nutrition actions into public health
programs in Ethiopia. 2008.
127. Guyon AB, Quinn VJ, Hainsworth M, Ravonimanantsoa P, Ravelojoana V,
Rambeloson Z, et al. Implementing an integrated nutrition package at large scale in
Madagascar: The essential nutrition actions framework. Food Nutr Bull. 2009
Sep;30(3):233-44.
128. Save the children. Ethiopia national nutrition strategy; review and analysis of
progress and gaps: One year on May 2009.
129. LINKAGES. ENA Counsellor’s guide. using the essential nutrition actions to
improve the nutrition of women and children in Ethiopia, including under situations
of emergencies and HIV & AIDS 2005.
130. Banteyerga H. Ethiopia's health extension program: Improving health through
community involvement. MEDICC Rev. 2011 Jul;13(3):46-9.
131. Ethiopia MoH. CMAM rollout: Ingress to scale up nutrition. CMAM/ SUN
conference 14th - 17th November 2011 Addis Ababa, Ethiopia. scaling up community
management of acute malnutrition and scaling up nutrition (SUN).
http://cmamconference2011.files.wordpress.com/2011/11/session-2_country-
1_ethiopia1.pdf. In press 2011.
132. Ethiopia Federal Ministry of Health. Protocol for the management of severe
acute malnutrition. March 2007.
133. United Nations Children’s Fund. Evaluation of community management of acute
malnutrition (CMAM): Ethiopia country case study. Three United Nations Plaza New
York, NY 10017, United States: Evaluation Office United Nations Children’s Fund;
September 2012.

53
CHAPTER 3. STUDY DESIGN AND METHODS
This chapter describes the study design and data collection methods of the
effectiveness and process evaluation of a community-based participatory nutrition
promotion (CPNP) program, which was added to the Essential Nutrition Action
(ENA) and Community-based Management of Acute Malnutrition (CMAM)
programs in rural Ethiopia. The following components are described: study setting
and population, randomization procedure, study subjects, intervention, data collection
instruments and schedule, data collection and statistical analysis.
3.1 OVERVIEW
Appropriate complementary feeding and hygiene practices reduce the high burden of
child stunting in developing countries (1, 2). A community-based Participatory
Nutrition Promotion (CPNP) program using a two-week group nutrition session was
designed to promote child feeding and hygiene and improve child nutritional status.
We adapted CPNP program components from previous Positive Deviance Health
interventions in developing countries (3). The CPNP program was added to the
existing programs of the ENA and CMAM in two rural districts in Ethiopia.
The logic framework for the CPNP program is provided in Figure 3.1. The
overarching goal of the proposed study was to evaluate the effectiveness of the CPNP
program on child growth in children 6 to 24 months of age and child feeding and
hygiene practices among caregivers in rural Ethiopia. In addition to the effectiveness
evaluation, a program impact pathway (PIP) analysis of the CPNP program, was done
by assessing: (1) quality of implementation process, (2) participants’ program
acceptance, (3) participants’ message recall, (4) child feeding and hygiene practices

54
and child growth, and (5) influence on participation in the ENA and CMAM
programs.
We conducted a randomized controlled trial in 12 community clusters in two
rural districts – Habro and Melka Belo in Ethiopia; ENA and CMAM programs were
implemented in 6 control clusters, and CPNP, ENA, and CMAM programs were
carried out in their matched 6 intervention clusters. Out of the 2,064 child and mother
pairs—randomly selected from a roster of children in the community aged 6 to 12
months of age—who were visited, 1,790 child and mother pairs, 914 in the control
area and 876 in the intervention area, were enrolled in this study after obtaining
informed consent. Every three months, children’s length and weight were measured,
and the mothers were asked about their child feeding and hygiene practices using
infant and young child feeding (IYCF) indicators (4). Every six months, the mothers
were also asked about hand washing with soap. For process evaluation, we reviewed
project records of 3,299 CPNP participants and checklist of activities used during 114
group session observations. In connection with the effectiveness evaluation, we also
conducted a household survey every three(5) months of 914 and 876 mothers in the
control and intervention areas, respectively, to ask about subjects’ exposure to the
CMAM and ENA programs, including recall of messages provided during the
counseling sessions among direct CPNP participants (n = 197).
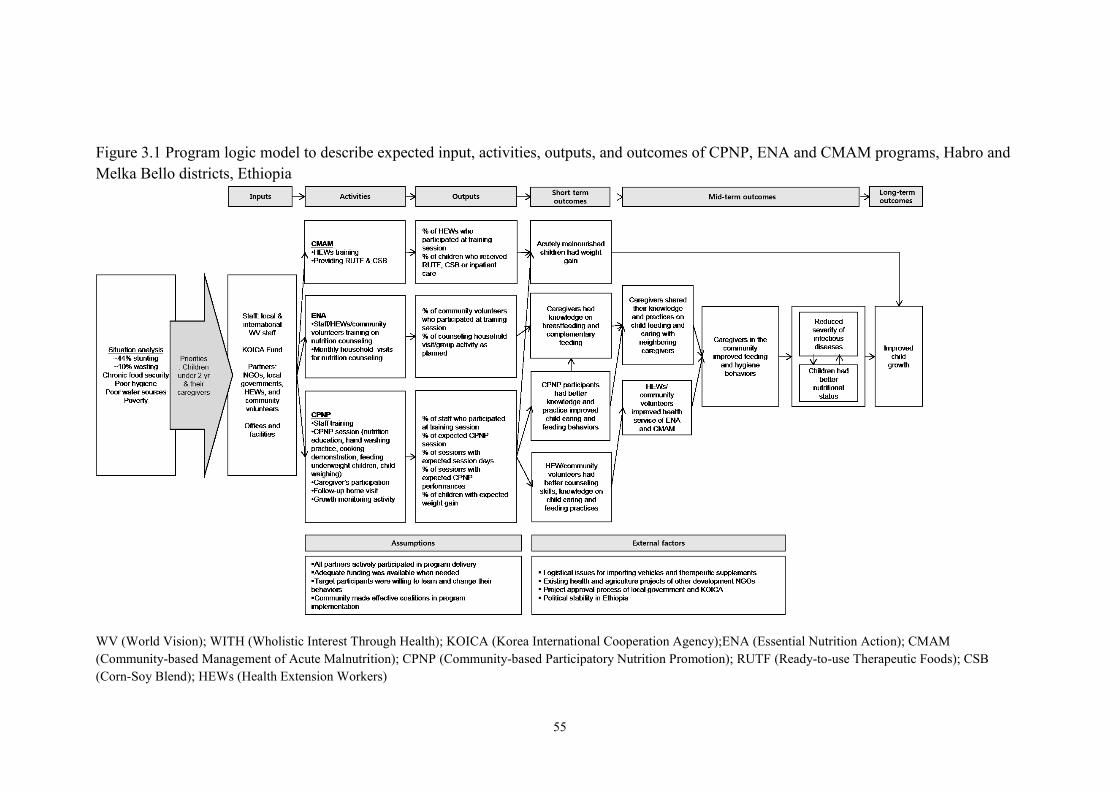
55
Figure 3.1 Program logic model to describe expected input, activities, outputs, and outcomes of CPNP, ENA and CMAM programs, Habro and
Melka Bello districts, Ethiopia
WV (World Vision); WITH (Wholistic Interest Through Health); KOICA (Korea International Cooperation Agency);ENA (Essential Nutrition Action); CMAM
(Community-based Management of Acute Malnutrition); CPNP (Community-based Participatory Nutrition Promotion); RUTF (Ready-to-use Therapeutic Foods); CSB
(Corn-Soy Blend); HEWs (Health Extension Workers)
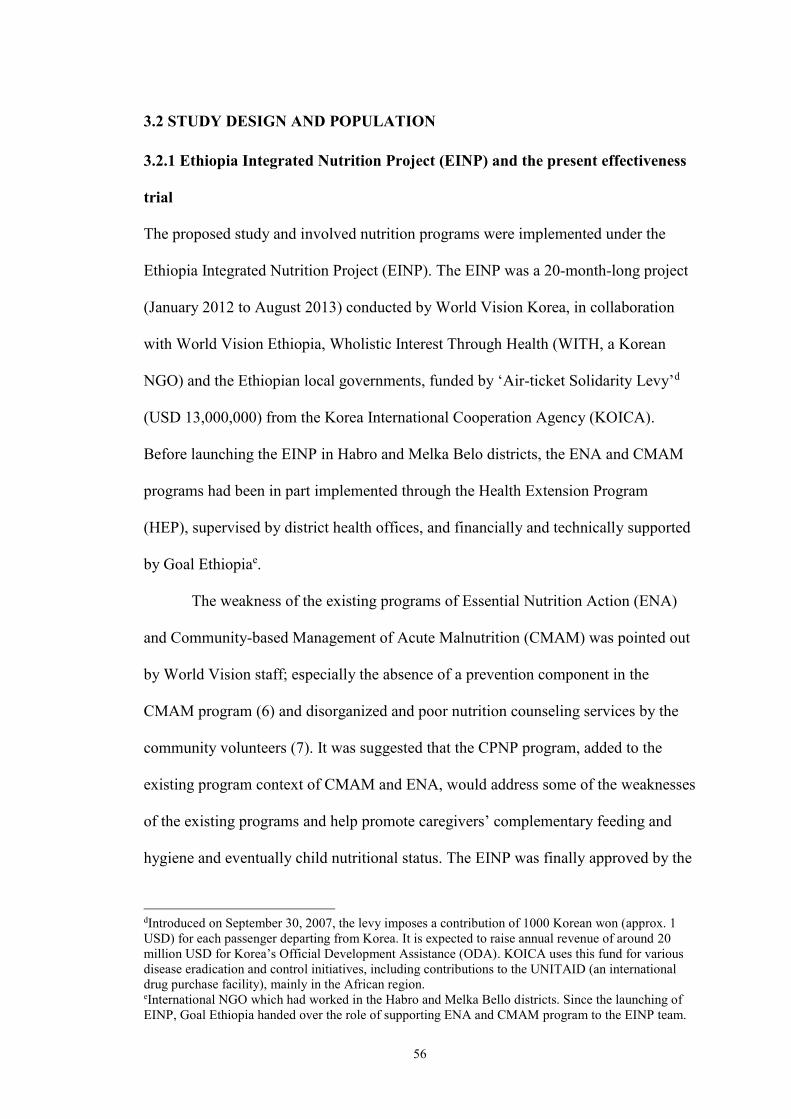
56
3.2 STUDY DESIGN AND POPULATION
3.2.1 Ethiopia Integrated Nutrition Project (EINP) and the present effectiveness
trial
The proposed study and involved nutrition programs were implemented under the
Ethiopia Integrated Nutrition Project (EINP). The EINP was a 20-month-long project
(January 2012 to August 2013) conducted by World Vision Korea, in collaboration
with World Vision Ethiopia, Wholistic Interest Through Health (WITH, a Korean
NGO) and the Ethiopian local governments, funded by ‘Air-ticket Solidarity Levy’d
(USD 13,000,000) from the Korea International Cooperation Agency (KOICA).
Before launching the EINP in Habro and Melka Belo districts, the ENA and CMAM
programs had been in part implemented through the Health Extension Program
(HEP), supervised by district health offices, and financially and technically supported
by Goal Ethiopiae.
The weakness of the existing programs of Essential Nutrition Action (ENA)
and Community-based Management of Acute Malnutrition (CMAM) was pointed out
by World Vision staff; especially the absence of a prevention component in the
CMAM program (6) and disorganized and poor nutrition counseling services by the
community volunteers (7). It was suggested that the CPNP program, added to the
existing program context of CMAM and ENA, would address some of the weaknesses
of the existing programs and help promote caregivers’ complementary feeding and
hygiene and eventually child nutritional status. The EINP was finally approved by the
dIntroduced on September 30, 2007, the levy imposes a contribution of 1000 Korean won (approx. 1
USD) for each passenger departing from Korea. It is expected to raise annual revenue of around 20
million USD for Korea’s Official Development Assistance (ODA). KOICA uses this fund for various
disease eradication and control initiatives, including contributions to the UNITAID (an international
drug purchase facility), mainly in the African region. eInternational NGO which had worked in the Habro and Melka Bello districts. Since the launching of
EINP, Goal Ethiopia handed over the role of supporting ENA and CMAM program to the EINP team.

57
Ethiopian Finance and Economic Development Ministry and Regional Health Bureau
in April 2012 and phased out in August 2013 (Appendix B).
The current study was prepared by a Memorandum of Understanding (MOU)
among World Vision Korea, WITH, and World Vision Ethiopia (Appendix A). Ms.
Yunhee Kang led this study as a primary investigator with other investigators from
World Vision Korea, World Vision Ethiopia, and WITH. The present trial was funded
by World Vision Korea (USD 100,000, project number E197814).
3.2.2 Study area
This study was conducted in Habro and Melka Bello districts, Oromia Regional State
in Ethiopia (Figure 3.2). The two districts are 150-180 km or more apart from each
other. Both districts were selected for the EINP because these areas experienced food
insecurity and had a high burden of child malnutrition and both ENA, and CMAM
programs were being implemented here.
Habro district is located in the West Harargie zone of Oromia Regional State,
396 km from Addis Ababa (8). The district is an agrarian site of 722 km2, consisting
of 28 rural Kebeles and three towns. Agro-ecologically, it is divided into three
categories: Low-land 22%, mid high-land 61% and high-land 17%. The district has an
estimated total population of 191,546. The majority are Muslims (85%), followed by
Orthodox Christian (14%) and other religious groups. Oromo is the dominant ethnic
group consisting of 75% of the total population, with the remaining 25% being the
Amara and others. Cultivable land is about 38% out of the total land, with 13%
degraded/unproductive land, 43% bush and grass land, 6% forest. Immunization
coverage reaches 58% and potable water coverage is 24.5%. The average distance to
the nearest potable water source for the households is ~2.5 km. Melka Bello district is

58
located in the East Hararghe zone, 488 km from Addis Ababa (9). The area size is
1147 km2, segmented into 22 rural Kebeles and two towns. Agro-ecologically, it is
divided into three categories: Low-land 41%, mid high-land 39% and high land 20%.
The estimated total population in 2007 was 176,813. The majority of residents are
Muslims (95%); Oromo is the dominant group, accounting for 98% of the population.
Cultivable land is about 38% out of total land, followed by 14% degraded/
unproductive land, 5.3% bush and grassland, and 24% forest covered land.
Immunization coverage reaches 86% and potable water coverage is only 5%. The
average distance to the nearest potable water source from the households is ~12.5 km.
Both areas have similar agricultural practices. Mixed agriculture of crop
production and livestock rearing together is the predominant source of livelihood for
the majority of the population. Major cereals grown in the district are maize, sorghum,
teff, finger millet, and wheat. The district also has a practice of producing legumes
and pulses, root crops, vegetables, fruits, and other cash crops (predominantly “chat”).
It is highly dependent on human labor and oxen-driven following traditional methods.
Diversified local community-based organizations support each other for their social
and economic activities. “Afosha,” “Ekub,” Cooperatives, youth associations, women
associations and farmers associations are such community organizations in the two
districts. The availability and level of activities of these voluntary local self-help
groups and associations vary from village to village even within the same Kebele, for
instance.
Since 2007, World Vision Ethiopia has operated large-scale development
programs in both districts, with close ties with the communities. All Kebeles and
towns in both districts were accessible to all three nutrition programs, whereas only
28 rural Kebeles in the Habro district and 20 rural Kebeles in the Melka Bello district

59
were included in the study site. The town areas in these two districts and two large
remote Kebeles in Melka Bello district were excluded from the study because of the
quite different environments between town and rural areas and logistical difficulties in
gaining access to remote areas.
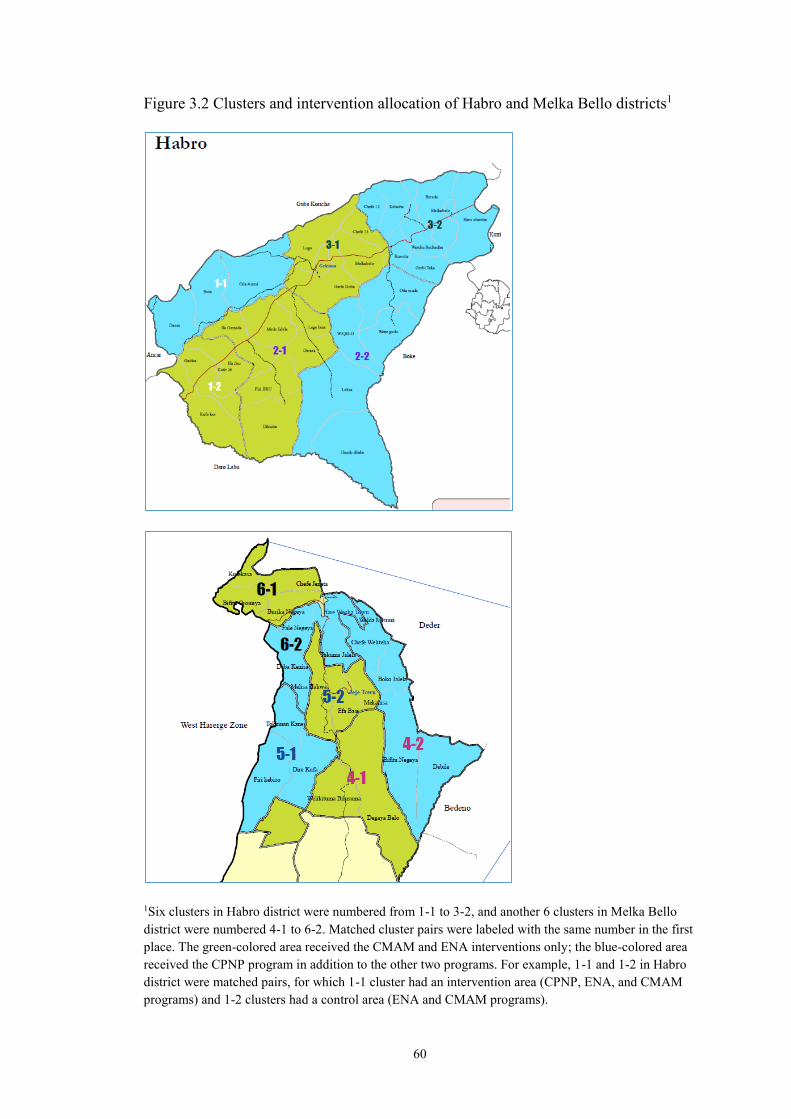
60
Figure 3.2 Clusters and intervention allocation of Habro and Melka Bello districts1
1Six clusters in Habro district were numbered from 1-1 to 3-2, and another 6 clusters in Melka Bello
district were numbered 4-1 to 6-2. Matched cluster pairs were labeled with the same number in the first
place. The green-colored area received the CMAM and ENA interventions only; the blue-colored area
received the CPNP program in addition to the other two programs. For example, 1-1 and 1-2 in Habro
district were matched pairs, for which 1-1 cluster had an intervention area (CPNP, ENA, and CMAM
programs) and 1-2 clusters had a control area (ENA and CMAM programs).

61
3.2.3 Study Design
We conducted a randomized effectiveness trial. A total of 12 clusters were created
prior to the beginning of randomization of interventions. The number of 12 clusters
was based on intervention logistics of the EINP project team. The Geographic
Information System (GIS) unit of World Vision Ethiopia kindly provided maps of
Habro and Melka Bello districts with spatial information on geographical distribution
of Kebeles, including major landmark indicators. The GIS resource enabled us to
create clustering of the study site and visible allocation of control and intervention
groups.
The procedure of creating geographical clusters was as follows. First, all 28
Kebeles in the Habro district and 20 Kebeles in the Melka Bello district were ranked
according to its food security level, e.g. high, middle and low, based on the qualitative
information offered by the agriculture program officer of World Vision Ethiopia and
government agriculture officers. Next, two to six nearby Kebeles in the similar food
insecure environment were grouped together so that study site was divided into 12
clusters, 6 clusters per district (Figure 3.2). For the intervention randomization, each
cluster was paired with another cluster selected to be similar in their food security
condition. Pair-matching to reduce variation between clusters enabled us to have six
pairs assumed to have similar food security and population size.
3.2.4 Randomization
Randomization of intervention and control clusters was accomplished with a coin toss
in the presence of the local health officers and community leaders to have mutual
agreement and impartiality in random allocation of interventions. One study
investigator explained the rule of random allocation of intervention, obtained
62
agreement among the local health officers and community leaders, and carried out
tossing a coin. If one cluster of each pair was randomly assigned to the intervention
group, the other one automatically was assigned to control group.
The agreement document for the intervention allocation, including the
signatures of local health officers and authorities, was obtained. As a result, 6 control
clusters and 6 intervention clusters were created. Specifically, 25 Kebeles, 14 in
Habro district and 11 in Melka Bello district, were assigned to the control area, and
another 23 Kebeles, 14 in Habro district and 9 in Melka Bello district, were assigned
to the intervention area (Figure 3.3).
Figure 3.3. Study design for the proposed study
3.2.5 Subject selection
This study attempted to prospectively study child growth and feeding practices among
mothers of children 6 to 24 months of age. Children aged 6 to 12 months of age and
their caregivers living in a study site in the Habro and Melka Bello districts were
enrolled. The demographic information for the two districts was listed, including the

63
estimated numbers of children under one year of age and the number of underweight
children by Kebele (Appendix 3.1 and 3.2).
Sample size: Sample sizes were calculated to detect a range of differences in the
means of length-for-age z scores (LAZ) between the two intervention groups. The
detectable difference estimates were calculated using the Dupont and Plummer
sample size formula for calculating a difference in population means (10). There was
no available information on Intra-cluster Correlation Coefficient (ICC), prevalence of
stunting or LAZ in the study site, so that values were excerpted from relevant
literature. A 0.2 z scores difference in LAZ was derived from a meta-analysis about
complementary feeding trials (2). Hence, we expected that LAZ in children in the
intervention area would be at least 0.2 Z higher than children in the control area. Fenn
B et al. analyzed the clustering, estimation of ICC, using DHS data in 46 developing
countries. The median ICC for national samples for childhood undernutrition were
0.054 for stunting and 0.032 for wasting (11); hence, this study utilized the value of
0.054 per ICC for sample size estimates. For a cluster-randomized trial, suppose now
that n individuals are sampled in each cluster, σ0 and σ1 are within cluster standard
deviations, k is the coefficient of variation of true proportions between clusters within
each group, then c, the number of clusters required, is given by
c=1+(zα/2+zβ)2[(σ0
2+ σ12)/n+k2(μ0
2+μ12)]/(μ0-μ1)
2
n=(σ02+ σ1
2)/ [{(c-1)*(μ0-μ1)2/(zα/2+zβ)
2} - k2(μ02+μ1
2)]
A sample size of 1,032 per group was required to find a 0.2 Z difference in between-
group means; α was set at .05, power at 0.80, cluster size at 172, lost to follow-up at
10%, SD of 0.9 Z score and ICC at 0.054 (Table 3.1). The estimated number of
children eligible for this study by group and by cluster is listed in Table 3.2. The total

64
number of children assigned to the control group and intervention group was equal
but the number of children assigned to each cluster, consisting of the control group
and the intervention group, was determined proportionate to the population size of the
clusters.
Table 3.1 Projected sample sizes per cluster and in total for a range of minimal
detectable difference in LAZ and standard deviation differences
Assumed
Standard
deviation
Minimum
detectable
difference in
LAZ scores
LAZ in control area at 12 month follow up
(10% lost to follow-up)
-2.0Z -1.9Z -1.8Z -1.7Z -1.6Z -1.5Z
Total Total Total Total Total Total
σ = 0.8
0.2Z 3888 2616 1992 1632 1392 1236
0.25Z 900 804 744 684 648 600
0.3Z 468 444 420 408 396 384
0.35Z 300 300 288 276 276 264
σ = 0.9
0.2Z 4920 3300 2520 2064 1764 1548
0.25Z 1128 1020 936 864 804 768
0.3Z 588 564 540 516 480 468
0.35Z 384 360 348 336 336 324
σ = 1.0
0.2Z 6072 4068 3108 2544 2184 1908
0.25Z 1392 1260 1056 1056 996 936
0.3Z 720 684 636 636 600 576
0.35Z 468 444 420 420 420 408
σ = 1.1
0.2Z 7344 4944 93768 3072 2628 2316
0.25Z 1680 1524 1392 1284 1200 1140
0.3Z 876 588 792 756 720 696
0.35Z 564 540 528 516 504 480
σ = 1.2
0.2Z 8736 5868 4476 3660 3120 2748
0.25Z 2004 1800 1644 1524 1428 1356
0.3Z 1044 984 936 900 864 828
0.35Z 672 648 624 600 588 576

65
Table 3.2 Estimated number of children enrolled to intervention groups based on
proportionate to the population size of the clusters.
Cluster No.
Group No. of
Kebeles
No. of assigned children by
intervention group and by
cluster (N=2,064)
Cluster Control area 25 1,032
1_1 Habro 3 115
2_2 Habro 5 234
3_2 Habro 6 180
4_2 Melka Bello 4 162
5_1 Melka Bello 3 144
6_2 Melka Bello 4 197
Cluster Intervention area 23 1,032
1_2 Habro 3 85
2_1 Habro 6 283
3_1 Habro 5 207
4_1 Melka Bello 2 147
5_2 Melka Bello 3 154
6_1 Melka Bello 4 156
An established birth registration system—which was required for the random
selection of children—was absent in the study area; thus, we requested district health
offices to create a roster of children in the study area aged 0 to 12 months of age,
which allowed us to carry out the random selection of children according to the
sample size assigned to each cluster. To facilitate this process, EINP project staff
constructed a calendar indicating Ethiopian years and dates as well as a Gregorian
calendar for the last two years, to estimate the children’s ages as accurately as
possible. The year 2004 in the Ethiopian calendar began on September 12, 2011 A.D.
of the Gregorian calendar. A child roster form was employed that included the
following information: Kebele name, village name, community volunteer’s name, the
child’s name, birth date and sex, the mother’s name, father’s name, household
location including key landmark near the house.
Health extension workers (HEWs) and community volunteers collected the
data in the study site. After a brief training, each one visited ~50 households assigned

66
to each of them in a village, identified all children under one year of age, recorded the
relevant information to the child roster form using the calendar, and reported it to
their supervising HEWs. All children roster information was compiled by HEWs of
the Kebele and was again reported to health centers in the District. Collected data
were entered into a Microsoft Excel program by the data management team; thus,
each child was be assigned a unique identification number. Using a unique
identification number that we assigned to each child, 2,064 children 4 to 11 months of
age were randomly selected proportional to the population size of each cluster.
Data collectors visited 2,064 households; out of the 2,064 randomly selected
children from the roster, 914 children from control and 876 children from intervention
areas were enrolled in the study.
3.3 DEVELOPMENT OF THE INTERVENTIONS
This study involved three interventions: CPNP, ENA, and CMAM programs. The
design and implementation process of the EINP was conducted by World Vision
experts and the study investigators. Out of the three interventions implemented in the
study, the CMAM program and the ENA program were embedded entirely in the
established government health system and performed by HEWs or community
volunteers, whereas the CPNP program had a separate operating system with hired
employees within the World Vision local offices. Each of the interventions in the
EINP is summarized in Table 3.3, and distribution of the EINP target population of
the two districts is presented in Table 3.4.
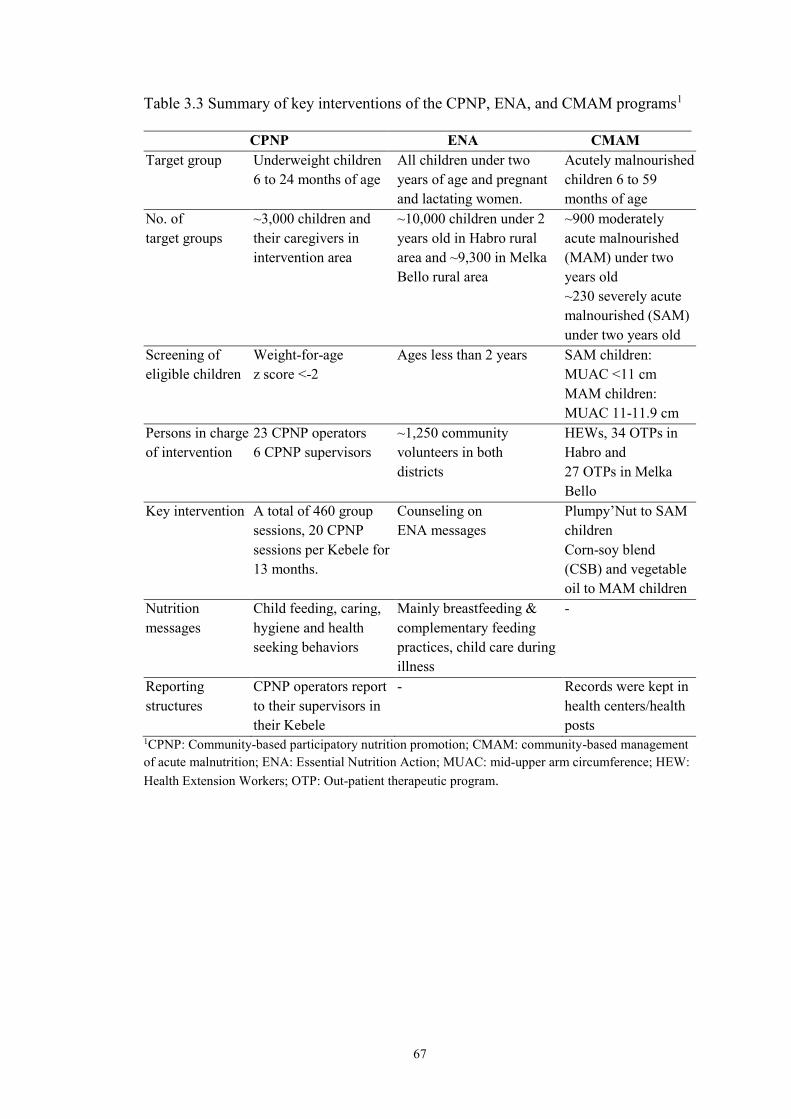
67
Table 3.3 Summary of key interventions of the CPNP, ENA, and CMAM programs1
CPNP ENA CMAM
Target group Underweight children
6 to 24 months of age
All children under two
years of age and pregnant
and lactating women.
Acutely malnourished
children 6 to 59
months of age
No. of
target groups
~3,000 children and
their caregivers in
intervention area
~10,000 children under 2
years old in Habro rural
area and ~9,300 in Melka
Bello rural area
~900 moderately
acute malnourished
(MAM) under two
years old
~230 severely acute
malnourished (SAM)
under two years old
Screening of
eligible children
Weight-for-age
z score <-2
Ages less than 2 years SAM children:
MUAC <11 cm
MAM children:
MUAC 11-11.9 cm
Persons in charge
of intervention
23 CPNP operators
6 CPNP supervisors
~1,250 community
volunteers in both
districts
HEWs, 34 OTPs in
Habro and
27 OTPs in Melka
Bello
Key intervention A total of 460 group
sessions, 20 CPNP
sessions per Kebele for
13 months.
Counseling on
ENA messages
Plumpy’Nut to SAM
children
Corn-soy blend
(CSB) and vegetable
oil to MAM children
Nutrition
messages
Child feeding, caring,
hygiene and health
seeking behaviors
Mainly breastfeeding &
complementary feeding
practices, child care during
illness
-
Reporting
structures
CPNP operators report
to their supervisors in
their Kebele
- Records were kept in
health centers/health
posts 1CPNP: Community-based participatory nutrition promotion; CMAM: community-based management
of acute malnutrition; ENA: Essential Nutrition Action; MUAC: mid-upper arm circumference; HEW:
Health Extension Workers; OTP: Out-patient therapeutic program.

68
Table 3.4 EINP site and target population (12)
Habro Melka Bello Total
Total population 191,546 176,813 368,359
Total under five children 31,418 28,997 60,411
Targeted No. of children for ENA 5,403 4,988 10,391
Targeted No. of wasted children 500 500 1,000
Targeted No. of children with MAM 1,700 1,570 3,270
Targeted No. of malnourished women 300 250 550
*2011 projection of the 2007 population (national census report).
3.3.1 Community-based Participatory Nutrition Education (CPNP)
CPNP is a nutrition program based on a behavior change communication (BCC)
strategy, adapting some implementation components from an existing PD Hearth
approach (3). CPNP program shared some PD Hearth program elements such as 12-
day group nutrition Hearth sessions, targeting underweight children, weighing at
admission, 2 weeks, and 1 month after the nutrition session, follow-up visits for two
weeks, utilization of locally available community resources, and community
sensitization and participation. However, CPNP program had no community-specific
positive deviant behaviors. Instead, generally identified PD practices with regard to
feeding, caring, hygiene, and health-seeking were recommended. CPNP menu was
designed by World Vision nutrition experts using local foods, and nutrition sessions
were led by CPNP operators, not by voluntary mothers who practiced PD behaviors.
Factors that modified original PD Hearth model into CPNP program included large
project area that covered ~180,000 population with various topography, limited
project time period (~20 months), and community and project staff capacity
Six CPNP supervisors for each of the six clusters and 23 CPNP operators for
the 23 Kebeles were hired. CPNP supervisors took responsibility for CPNP
scheduling, supervising, follow-up visits, and meeting with community members.
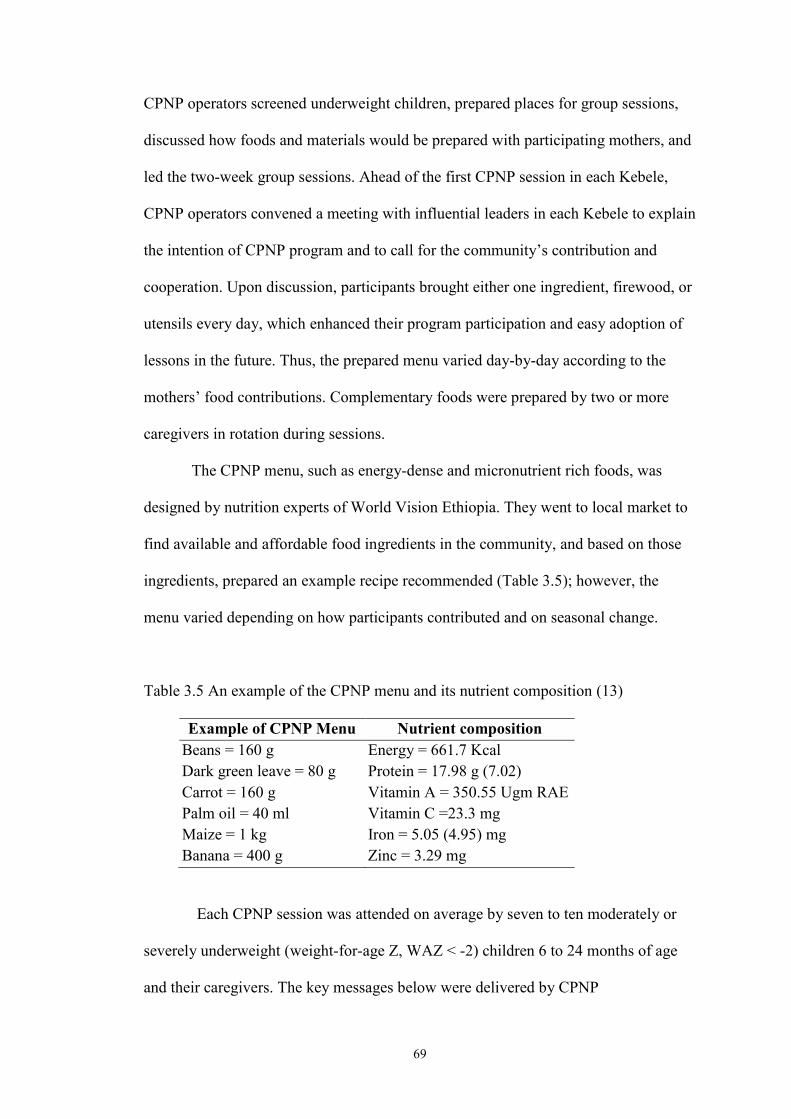
69
CPNP operators screened underweight children, prepared places for group sessions,
discussed how foods and materials would be prepared with participating mothers, and
led the two-week group sessions. Ahead of the first CPNP session in each Kebele,
CPNP operators convened a meeting with influential leaders in each Kebele to explain
the intention of CPNP program and to call for the community’s contribution and
cooperation. Upon discussion, participants brought either one ingredient, firewood, or
utensils every day, which enhanced their program participation and easy adoption of
lessons in the future. Thus, the prepared menu varied day-by-day according to the
mothers’ food contributions. Complementary foods were prepared by two or more
caregivers in rotation during sessions.
The CPNP menu, such as energy-dense and micronutrient rich foods, was
designed by nutrition experts of World Vision Ethiopia. They went to local market to
find available and affordable food ingredients in the community, and based on those
ingredients, prepared an example recipe recommended (Table 3.5); however, the
menu varied depending on how participants contributed and on seasonal change.
Table 3.5 An example of the CPNP menu and its nutrient composition (13)
Example of CPNP Menu Nutrient composition
Beans = 160 g
Dark green leave = 80 g
Carrot = 160 g
Palm oil = 40 ml
Maize = 1 kg
Banana = 400 g
Energy = 661.7 Kcal
Protein = 17.98 g (7.02)
Vitamin A = 350.55 Ugm RAE
Vitamin C =23.3 mg
Iron = 5.05 (4.95) mg
Zinc = 3.29 mg
Each CPNP session was attended on average by seven to ten moderately or
severely underweight (weight-for-age Z, WAZ < -2) children 6 to 24 months of age
and their caregivers. The key messages below were delivered by CPNP

70
supervisors/CPNP operators.
Good feeding: Breastfeed child up to 12 times in a day / Feed child 4-5 times in a day
with foods containing protein, carbohydrates, and vitamins.
Good health: When a child is sick, go to health center / Prevent illness such as
deworming / Get children immunized / Have micronutrient supplementation (vitamin
A every 6 months).
Good hygiene: Wash hands after using toilet / Wash their clothes and clean their
bodies / Clean house and kitchen / Clean latrine everyday / Put pigs, mules, dogs or
other animals outside / Child is to be bathed everyday / Nails are to be clipped / Child
is to wear shoes.
Good caring: Get child vaccinated / Feed child often during times of illness / Mother
or others play with child and grandmother cares for child / Mother tells stories and
sings songs to child / Someone helps child eat.
Good environment: Use latrine / Discard waste materials to landfills / Burn waste
materials.
Participating mothers were instructed to share CPNP lessons and methods of
preparation of nutrient-dense meals that they learned with their neighbors in the same
Kebele. Community volunteers weighed the participating children at entry and at the
completion of each two-week CPNP session. The discharge criteria in the CPNP
sessions was defined as gaining 200 to 400 grams during a two-week stay in CPNP
sessions and more than 400 grams by the end of two additional weeks of home
follow-up. Those children who gained less than 200 grams were referred to the next
CPNP session held in nearby villages. Those children were weighed again at 1, 3, and

71
6 months after his/her graduation from the CPNP sessions. For 13 months, a total of
460 CPNP sessions in 23 Kebeles were planned, 20 sessions per Kebele. 280 sessions
in 14 Kebeles of Habro district and 180 sessions in 9 Kebele in Melka Bello district.
The number of targeted underweight children 6 to 24 months of age was estimated to
be less than 3,000 children (14) for 13 months.
3.3.2 Essential Nutrition Action (ENA) intervention
The ENA program was mainly defined as individual counseling on key nutrition
messages through household visits by community volunteers. Before the EINP
started, community volunteers were available in the study site, but not appropriately
trained for nutrition knowledge and did not have counselling skills. Nutrition experts
of World Vision Ethiopia provided a week nutrition counselling training to 120
HEWs; next, by these HEWs, ~1,250 community volunteers in both districts were
trained for ENA messages and counseling skills through a 4-day training. Trained
community volunteers were supposed to visit and counsel pregnant women and
mothers of children under two years of age. The seven key nutrition messages were as
follows: (1) optimal breastfeeding (e.g. exclusively breastfeeding for the first six
months and continued breastfeeding up to 24 months, (2) adequate complementary
feeding beginning at six months, (3) optimal feeding of the child during and after
illness, (4) control of vitamin A deficiency, (5) control of anemia, (6) promotion of
iodized salt consumption by all families, and (7) promotion of improved women’s
nutrition. Community volunteers’ activities were entirely voluntary-based and not
mandatory. There was no reporting structure of the ENA program in the district health
offices. All children under five years of age received vitamin A supplementation
twice a year, and children above 24 months of age had de-worming pills twice a year.

72
3.3.3 CMAM program
The CMAM program was designed to treat children 6 to 59 months of age who had
severe or moderately acute malnutrition. The CMAM program has three treatment
components: an out-patient therapeutic program (OTP), a supplementary feeding
program (SFP), and a stabilization center (SC) (15).
OTPs were located at health posts/health centers in all Kebeles that provided
out-patient treatment care. HEWs screened acutely malnourished children with
MUAC tapes and referred the identified malnourished children to OTPs. Children
whose age was 6 months and above and whose MUAC was less than 11.0 cm with
good appetite test or no medical complications were admitted to the OTP program;
however, if the children had poor appetite or medical complications, the child was
referred to inpatient care. Plumpy’Nut was provided to the children according to the
Ethiopia national protocol (16) and were followed up weekly in the OTP. If the
MUAC of an admitted child increased greater than 11.0 cm, he/she was discharged.
On occasion, families with moderately wasted children with MUAC of 11-
11.9 cm and pregnant and lactating women in a moderately malnourished state
received a monthly ration of corn-soy blend (CSB) and vegetable oil for three months
ration at distribution sites. SCs were available at district health hospitals or large
health centers. Children 6 to 59 months of age with poor appetite or with medical
complication or edema were hospitalized and treated at an SC.
3.3.4 Summary of intervention implementation
HEWs and community volunteers were under the government health system structure,
represented as the Health Extension Program (HEP), which was an innovative
community-based program in Ethiopia that improved the primary health care

73
coverage from 76.9% in 2005 to 90% in 2010 (7). Since its start by the Federal
Ministry of Health (FMoH) in 2003, the HEP has trained 30,578 HEWs on knowledge
and skills, including disease prevention, family health, environmental hygiene and
sanitation, and health education and communication, after which HEWs transferred
health knowledge and skills to directly households in rural areas or by training
community volunteers (17). Under the overall supervision of district health offices
(DHOs) regarding all health activities carried out in health centers and health posts,
HEWs and community volunteers provided primary health services in a health post in
the Kebeles. Every Kebele had a health post where two female HEWs were recruited
from the area. One HEW supervised on average 30 community volunteers, each of
whom was in charge of approximately 50 households in the Kebele.
At first year of the EINP project, 111 HEWs in Habro district and 35 HEWs in
the Melka Bello district were trained for ENA counselling. In general, two female
HEWs served one Kebele, delivering primary health care services directed by the
Ethiopian government. Following the training sessions, 580 (429 females and 151
males) and 395 community volunteers were trained for ENA counseling in the Habro
and Melka Bello districts, respectively. At the second year of the project, 56 HEWs
and 892 community volunteers from Habro district only attended the ENA refresh
training. There were 35 and 28 OTP sites in Habro and Melka Bello districts,
respectively. Over the project period (July 2012 to Aug 2013), 1,914 and 1,938
children 6 to 59 months of age were treated with Plumpy’Nut in Habro and Melka
Bello districts, respectively. By district, guidelines to provide CSB and oil were
somewhat different. In the Habro district, screened households received 8.3 kg of
CSB at a time per month. But in Melka Bello district, screened households received
24.9 kg of CSB, a 3-month portion at once. The fact of receiving Plumpy’Nut means

74
that the child was admitted to the outpatient therapeutic program (OTP), which is one
component of the CMAM program, operated at either health centers or health posts. It
was reported that 82.8% and 80.5% out of admitted children were discharged after
recovery in Habro and Melka Bello districts, respectively.
3.4 DATA COLLECTION
All forms and questionnaires were designed by reviewing and modifying relevant
questions excerpted from the Caregiver Survey-Modules of World Vision
International (18) (see the questionnaires in Appendix C, D and E). Developed
questionnaires were first prepared in English and later on translated into Afan Oromo
by government-registered translators (Appendix G). All forms and questionnaires
were pre-tested prior to data collection. At each visit, questionnaires were
photocopied in Addis Ababa and delivered to each district before a new data
collection round started.
Eighteen data collectors and 2 team leaders, 9 data collectors and 1 team
leader at each district, were locally recruited and trained for 5 days on obtaining
informed consent, measuring child length and weight with measuring board and
weighing scale, and interviewing with questionnaires. The data management team
consisted of four female workers who learned information-technology at a local
vocational school. The roles and responsibilities of the project team and research team
were clearly distinguished and mutually supported, but data collectors were not
involved in the project implementation. Data collectors and data management team
were hired as community workers for the Habro and Melka Bello World Vision ADP
offices. The EINP and present study were conducted with support from the head

75
office of World Vision Ethiopia, World Vision Korea, WITH, and KOICA. Figure 3.4
presents the operation structure of the EINP project and research teams.
Figure 3.4 Structure of EINP project team and research team
For effectiveness evaluation, the data collection was carried out at five major time
points: visit1 (enrollment), visit2, visit3, visit4, and visit5, each three months apart.
Anthropometric measurements and household surveys to interview caregivers
regarding behaviors involving feeding and hygiene practices were carried out every
three months. Upon oral or written informed consent (Appendix C), mothers were
interviewed and, for illiterate mothers, oral informed consent was obtained with
permission of household members. Each interview did not last more than 1.5 hours.
The interviewers worked independently and were not involved in project
implementation duties. Prior to the first data collection of the study, a certain portion
of subjects experienced more than one nutrition service out of the three interventions
76
due to the preceding intervention schedule than the data collection at visit1. Out of
2,064 child and mother pairs that were randomly selected from a child roster, 1,790
pairs—914 in the control area and 876 in the intervention area—were enrolled in this
study.
For the PIP analysis, data were collected from routine monitoring records and
a survey in connection with the effectiveness data collection. Main components
evaluated in the PIP analysis included the following: (1) quality of the implementation
process, (2) participants’ program acceptance, (3) participants’ message recall, (4)
child feeding and hygiene at initial stage, (5) influence on exposure to ENA and
CMAM programs.
Visit1 was conducted from November 20, 2012 to February 19, 2013; visit5
was conducted from November 20, 2013 to February 19, 2014. Visit1 was conducted
four months after the CPNP sessions and the CSB distribution of the CMAM program
had started; thus, we were unable to collect true baseline information prior to program
implementation. Enrollment information collected at visit1 was used to assess
comparability between the two groups, although it was recognized that some program
elements may already have altered behaviors and knowledge. Data collection
methods, outcomes, and sample size for study outcomes are summarized in Table 3.6.
The main variables and data collection methods are described below.
Anthropometric measurement: Children’s weight and length were measured by
trained data collectors every three months from enrollment (visit1) to visit5. Both
weight and length were measured in duplicate. Weight was measured to the nearest
0.01 kg by a digital scale (model 354, SECA/GERMANY) using a standardized
protocol (19). Locally designed measuring boards were used to measure supine length

77
to the nearest 0.1 cm. Standardization of anthropometric measurements were achieved
by taking multiple measurements on non-study subjects during the training sessions.
Refresher training was done when necessary. Regular supervision visits were made by
the student investigator and research supervisors during the data collection period.
Child feeding practices: Mothers were visited every three months—a total of five
times from visit1 to visit5—by trained data collectors using structured 24-hour diet
recall questionnaires and asked about infant and young child feeding (IYCF) practices
of the breastfed child adhering to the WHO guiding principles (4, 5). Mothers were
asked whether they currently continued to breastfeed their child (current
breastfeeding), how many times they fed the child in the past 24 hours (meal
frequency), and what type of foods they fed the child in the past 24 hours using a list
of food items (dietary diversity). At each visit, mothers were asked whether they fed
the food item/food groups to her child using the following 15 food items/food groups:
breast milk; formula; animal milk (e.g., cow milk); any food made from grains (e.g.,
millet, sorghum, maize, rice, wheat, teff, or ingera); any food made from pumpkins,
carrots, red sweet potatoes, mango, or papaya; any green leafy vegetables; any other
fruits (bananas, tomatoes, apples, or avocados); any liver, kidney, heart or other organ
meats; any meat (e.g., beef, lamb, goat, chicken, or duck); any food made from
legumes or nuts (e.g., peas, beans, lentils, or peanuts); any food made with oil, fat, or
butter; eggs; fish; cheese or yoghurt; any sugary foods (e.g., chocolates, sweets,
candies, pastries, cakes or biscuits, or sugary juice).

78
Hand washing practices: Every six months (at visit1, 3 and 5) mothers were asked
whether they washed their hands with water and soap at four critical time points, i.e.
after defecation, after cleaning the child’s bottom, before preparing foods, and before
feeding the child.
Socioeconomic and demographic characteristics: The following characteristics were
asked at visit1 as enrollment information: Household head information (e.g., sex, age,
marital status, literacy, and occupation), household economy (e.g., main income
source, access to land for farming, and household asset), household dwelling
characteristics (e.g., ownership, construction materials, electricity use, access to
market and health facility), maternal characteristics (e.g., age, parity, antenatal and
post natal services, and education), and infant characteristics (e.g., age, sex,
immunization, vitamin A supplementation).
Household food insecurity: An established Household Food Insecurity Access Scale
(HFIAS) was used to measure food insecurity in the study site in the past four weeks
(20). The main domains of the HFIAS are (1) worry and anxiety, (2) insufficient food
quality, and (3) insufficient food intake. The nine questions of HFIAS were followed
by frequency questions from which the four levels of food insecurity are computed.
Social capital: The Short Social Capital Assessment Tool (SASCAT)—a shortened
version of the Adapted Social Capital Tool (A-SCAT) (21)—was used to
quantitatively measure structural and cognitive social capital.

79
Exposure to programs: Mothers were asked the following at each visit, every three
months: (1) whether they ever participated in the ENA activity through the
HEWs/community volunteers/1 to 5 network in the past three months, (2) whether the
child ever received Plumpy’Nut/CSB in the past three months, and (3) whether they
ever participated in CPNP sessions.
Project records review and data extraction: We reviewed an attendance book for
3,299 participants who ever attended the CPNP session over the 13 months of project
period and 3-day observation checklists for 114 sessions. 23 CPNP operators
routinely recorded attendance books (Appendix E.1), which included information of
Kebelle and village names, session starting dates and completion dates, child name,
mother and father names, child sex and age, weight at admission and 2 weeks, 1
month and 3 month after CPNP session, and attending days. The observation
checklists were intended to help the operators effectively supervise each session. 8
supervisors prepared the observation checklists (e.g. cleanliness of session place, key
nutrition/health message discussed, hand washing practice by caregivers before
feeding) for 114 sessions (Appendix E.2). Each item in the checklists was scored as
follows: 0 (not performed), 2 (moderately/modestly performed), or 4 (actively
performed), with a range of 0-12 for three days. All food ingredients prepared by
mothers at the session were listed. From the observation checklists, the total score of
three days for each item was extracted from this project records.
Participants’ acceptance to CPNP program: Of the 197 mothers who participated in
a CPNP session at the time of visit2, 76 mothers in Habro district and 179 mothers in
Melka Bello district were asked about the following, using Likert scales: (1) how

80
actively they participated in the session activities (e.g., singing, child feeding, food
preparation, hand washing, and discussion), (2) how they perceived the session (e.g.,
satisfaction with the session, confidence in adhering to the CPNP practices, usefulness
of CPNP practices), and (3) what materials they contributed to the session (e.g., foods,
utensils). The mothers were asked to recall discussed messages and food ingredients
at the session and were asked about type of foods currently used.
Participants’ CPNP message recall: In connection with the effectiveness trial, using
a structured questionnaire, mothers who had ever attended sessions by visit2 were
asked whether they learned a series of CPNP messages (e.g., preparing nutritious
complementary foods, responsive (actively) feeding, hand washing) at the CPNP
sessions, and which food ingredients they used at the CPNP sessions.
Mother and child cleanliness: Through spot-check hygiene observation, data
collectors assessed how clean (e.g. clean, dusty, or dirty) the mother and child were
for their hands, hair, clothes, and face by observation at every six-month survey visit.

81
Table 3.6 Summary of data collection methods and main outcomes by evaluation component of the community-based participatory nutrition
promotion (CPNP) program, Habro and Melk Bello area, Ethiopia (2012 to 2014)1
Evaluation
components Methods Main outcomes Study group
Enrollment
characteristics
Survey C: 914 mothers,
I: 876 mothers; at enrollment
Aim1.
Child growth
Anthropometric
measurement
Length, weight, length-for-age z score (LAZ), weight-for-
age z score (WAZ), and weight-for-length z score (WLZ)
stunting, wasting, and underweight
C: 914 mothers,
I: 876 mothers; five times every three months
Aim2.
Child feeding and
hygiene
Survey Scores of currently breastfeeding, dietary diversity, meal
frequency, hand washing and composite feeding
C: 914 mothers,
I: 876 mothers; five times every three months
(every six month for hand washing)
C1. Quality of the
implementation
process
Records review
and data extraction
% dose delivered & dose received
% fidelity to intervention protocol
Fidelity scores to intervention protocol
I: 3,299 participants in 6 clusters in the intervention
area for 13 months
I: 114 sessions in the intervention area for 6 months
C2. Participants’
acceptance
Survey
(recall)
Scores of active participation in session activities, material
contribution, and perception to the session
I: 197 CPNP participants at visit22
C3. Participants’
message recall
Survey
(recall)
Scores of CPNP messages and food ingredients recalls I: 197 CPNP participants at visit2
C4: Child feeding and
hygiene at initial stage
Survey
Spot check
observation
% of infant and young child feeding (IYCF) indicators
% of hygiene practices (hand washing and cleanliness)
C: 869 mothers
I: 836 mothers (including 141 CPNP participants)
at visit1
C5. Influence on other
program exposure
Survey
% receiving ENA counseling in the past three months
% receiving Plumpy’Nut3 in the past three months
C: 914 mothers,
I: 876 mothers; five times every three months 1 CPNP: Community-based participatory nutrition promotion; ENA: Essential Nutrition Action; CMAM: community-based management of acute malnutrition program; I:
intervention area; C: control area; C1 to C5: component 1 to component 5. 2 Survey visits started from 4 four months after the CPNP session started, continued every three months, a total of five times (visit 1 to visit5). 3 Plumpy’Nut was provided to severely acute malnourished children through the community-based management of acute malnutrition program.

82
3.5 DATA MANAGEMENT AND QUALITY CONTROL
All forms were tested in the field prior to being finalized and translated. All collected
data were reviewed by supervisors of the data collection team and were entered by
data entry personnel using data-entry formats prepared by study investigators in a
Microsoft Excel program. Participating child/mother pairs were assigned a unique
identifier. All data were cross-checked with questionnaires or abstraction forms for
possible errors to ascertain inconsistent data and values outside specific ranges.
Backup copies of the database were generated on a daily basis. Data entered into the
database were converted to a Stata format for further data analysis. Households were
revisited within one week if data were missing or beyond the acceptable range. Data
analysis was performed using Stata version 12.0 (Stata Corporation, College Station,
TX, USA).
For conducting the research, this study was led by the investigator group and
the data collection team. The investigators took overall responsibility for this study,
including periodical reporting of research progress. Under supervision of the
investigator team, the data collection team, consisting of two supervisors, one for each
study site, and twenty data collectors and four data entry personnel, took
responsibility for data collection and entry. The data collection team was intensively
trained and not involved in the intervention performance or study design procedures.
The investigators regularly visited the study field to train the data collection team and
data entry personnel, to monitor the progress of the study and data collection, to work
on proposal writings for additional funding sources, and to present the ongoing
research to a variety of stakeholders. The data collection team had bi-weekly team
meetings to resolve challenges in the field. Errors in anthropometric measurements
were found at visit1.
83
To ensure data reliability, all instruments and forms were tested in the pilot
study. Quality checks were performed periodically by the supervisors. Instruments
providing values outside the acceptable range were replaced. Specially formatted
forms were provided for the data collection log. These forms kept records of
anthropometric data and other collected data. Participants’ names and location of their
households were carefully identified. All forms and questionnaires were kept in the
World Vision Ethiopia offices in Habro and Melka Bello districts on a regular basis
and compiled in the Habro district office.
3.6 STATISTICAL ANALYSIS
Exploratory analysis
The objectives of the exploratory data analysis was to describe the study population
and to examine the distribution of each variable. Box plots and histograms were
performed for continuous variables, and frequency distributions were examined for
categorical variables. Normality was assessed by looking at skewedness and kurtosis,
Q-Q plot, and outliers were checked. Maternal and child characteristics, socio-
economic status, household food insecurity, child feeding and caring, hygiene
practices, CMAM performance, and community volunteers’ counseling performance
were described in terms of their means or median values, comparing distributions
between intervention groups using Student t-tests. Categorical variables were
summarized with percentile and frequency distributions, and distribution was tested
using chi-square test. Significance for all analyses was defined as a p value less than
or equal to 0.05.
84
Construction of variables/indicators
Age- and sex- specific z scores: The length and weight measurements for each child
were converted to LAZ, WAZ and WLZ scores using the international growth
reference from the WHO Multicenter Growth Reference Study (22). Stunting,
underweight, and wasting were defined as height (or length)-for-age, weight-for-age,
and weight-for-height (length) more than two standard deviations below the median
of the WHO growth reference.
Household wealth index: Household wealth status was assessed by constructing an
index generated from principal components analysis. The following household
socioeconomic and demographic variables were included in the principal component
analysis: dwelling in one’s own house, occupation of head of household, land holding,
source of drinking water, type of fuel for cooking, number of livestock, electricity,
possessed furniture, and sanitary latrine (23). The regression scores from the first
component were used to create an index that was divided into quintiles, and then
grouped as highest 20%, middle 40%, or lowest 40% (23).
Household food insecurity (HFI) scores: The Household Food Insecurity Access
Scale consisted of nine occurrence questions (20). For each question, mothers were
asked if they experienced the condition in the household in the past four weeks. If the
answer was ‘yes’ to the question, a frequency question was followed up to identify
whether the condition occurred rarely (once or twice), sometimes (three to ten times)
or often (more than ten times). The responses were coded as 0 = never, 1 = rarely, 2 =
sometimes, or 3 = often, giving a range of HFI scores from 0 to 27 for the nine
85
questions. According to the HFI scores, we categorized households into four groups
such as food-secure and mild, moderately, and severely food-insecure.
IYCF indicators: Minimum dietary diversity and minimum meal frequency were
computed according WHO guidelines (24); minimum dietary diversity is the
proportion of children 6–24 months of age who receive foods from 4 or more food
groups. Minimum meal frequency is for breastfed and non-breastfed children 6 to 24
months of age who receive solid, semi-solid, or soft foods the minimum number of
times or more.
Child feeding and hygiene scores: Based on child feeding practices and hygiene
practices, we constructed the age-specific feeding and hygiene scoring system (see the
details in Table 5.1), separately for three age groups: 6–8, 9–11 and 12–24 months.
Current breastfeeding, meal frequency, dietary diversity, and two types of child
feeding scores were examined at each five visits, except for the hygiene score, which
was examined across three visits.
Mother (or child) cleanliness: If a mother (or child) was assessed as clean for all
their face, clothes, hands, and hair, the mother or child was grouped as clean,
otherwise, as not clean. Mother (or child) cleanliness was defined as the proportion of
mothers (or child) who were clean at all their face, clothes, hands, and hair.
Process indicators: The process indicators linked to the conceptual program impact
pathway (PIP) model include the following. percentage dose delivered is defined as
percentage of intervention activities completed by project staff out of the total
expected, as specified in the accreditation criteria; percentage dose received is defined

86
as the percentage of intervention receipt by the intervention target population out of
the total expected; Fidelity is defined as the percentage or scores of intervention
activities completed by project staff that adhered to intervention protocols; Exposure
is defined as the percentage of exposure to intervention activities by caregivers;
Message recall is defined as the percent recall of CPNP messages by caregivers;
Proximal outcomes are the percentage of infant feeding behaviors consistent with key
project messages, as well as caregivers’ mean scores for a key child feeding and
hygiene.
3.6.1 Aim 1: Effectiveness evaluation of CPNP on child growth
The main outcomes of this study aim were differences in LAZ, weight-for-length z
score (WLZ), and WAZ, and risk of stunting, wasting, and underweight in children 6
to 24 months of age between the intervention and control areas.
The growth pattern of children was described by plotting the mean length,
weight, LAZ, WAZ, and WLZ against age in months at each time point of follow-up.
This study had no true baseline due to logistical limitations, and study enrollment was
made after four months of CPNP program implementation, so enrollment
characteristics were used to check comparability. Enrollment characteristics included
child and parents’ characteristics (e.g., age, education), socio-economic status (e.g.
household assets, main living source), household food insecurity, water and sanitation
facilities, and social capital. .
Enrollment characteristics were compared using linear, logistic and ordinal
logistic regression to account for cluster effects between areas. All variables that
differed at enrollment were adjusted during further analyses.
Comparison of covariates was conducted to determine whether there were
87
imbalances on potentially important confounding variables that occurred by chance
despite the randomization process. Variables that were identified as unbalanced
between intervention groups were adjusted in the analysis.
All analysis of intervention effects was done on an intention-to-treat basis. The
effect of the CPNP program as compared to control area was estimated using a three-
level mixed effect model using a longitudinal dataset and to account for correlations
of outcomes within children and within cluster, adjusting for confounding variables
such as household food insecurity, fathers’ education, household wealth index, type of
nearest health facility, district, and child age, and accounting for geographical
clustering effect. A sensitivity analysis to improve data quality was carried out on
anthropometric measurements (Chapter 4).
Since this analysis includes data clustered at different levels (individual and
cluster), a multilevel analysis that accounts for differences among child growth
(random intercept and random slope for age) of children by cluster (random intercept)
may be appropriate. The distribution of anthropometric outcomes at 6 to 24 months of
age was graphically presented by Lowess curves derived from nonparametric, locally
weighted regression analyses (25). Cox proportional hazards regression with shared
frailty for recurrent events model (26) was used to analyze the effect of the CPNP
program on the repetitive risk of stunting, wasting, and underweight of subject
children during the 12-month follow-up. In this model, the different time periods for
each event for the same subject were analyzed separately and adjusted for the fact that
time periods within each subject are dependent.
3.6.2 Aim 2: Effectiveness evaluation of CPNP on child feeding and hygiene
practices

88
Applying the same methods, enrollment characteristics of the control and intervention
areas were compared using logistic, ordinal, or multinomial logistic regression
accounting for geographic clustering, and variables that differed by intervention group
were included in further analysis. A total of 1,199 mothers who were questioned at all
five visits were included in the data analysis. Bar graphs were prepared to present
scores of feeding and hygiene at each visit in the control and intervention groups.
Based on infant and young child feeding indicators (IYCFs), scores of currently
breastfeeding, meal frequency, dietary diversity (DDS), hand washing, and composite
feeding were developed. The scores were defined separately for each of the three age
groups: 6–8, 9–11, and 12–24 months and examined at each visit, except for the
hygiene score, which was examined across three visits. Detailed scoring methods are
described in Chapter 5. The composite feeding score was constructed adapting child
feeding indices proposed by Ruel and Menon (27). Multilevel linear models were
constructed to estimate the differences in scores of current breastfeeding, meal
frequency, dietary diversity, hand washing, and composite feeding between the
control and intervention groups, adjusting for variables that differed at enrollment.
3.6.3 Aim 3: Program impact pathway (PIP) analysis of CPNP
Descriptive analyses were conducted for five critical implementation components,
which were identified from the program impact pathway (PIP) (Figure 6.1). For
evaluation of the quality of the implementation process of CPNP (component 1),
process indicators, such as percentage dose delivered, percentage dose received, and
percentage or scores of fidelity to intervention protocol were constructed based on
extracted data from the attendance book and observation checklists, and were
compared in six intervention clusters by chi-squared test. The following variables

89
were evaluated regarding the participants’ program acceptance (component 2):
material contribution to the CPNP session, perception of the session (e.g., satisfaction,
usefulness of CPNP message, confidence in putting the CPNP messages into
practice), and active participation in main CPNP activities (e.g., singing, hand
washing, and feeding). These variables were presented as percentages of those
accepting/participating/perceiving of specific elements out of surveyed participants.
Participants’ message recall (component 3) was presented as a percentage of those
who remembered specific CPNP messages (e.g. preparing nutritious complementary
foods) out of surveyed participants. For proximal outcomes of child feeding and
hygiene behaviors (component 4), multilevel mixed effect models were constructed
and tested between the control and intervention areas (detailed information in Chapter
5 and 6). P-values were calculated by multilevel linear regression analysis, accounting
for cluster effect to compare (1) control group vs. intervention area, or (2) non-CPNP
participants vs. CPNP participants in the intervention area. Indicators of exposure to
ENA and CMAM programs (component 5) were calculated by summing up all events
from visit1 to visit5 divided by the total number of subjects to estimate mean
percentages compared by two-sample tests of proportions.
3.7 ETHICAL CONSIDERATIONS
The study proposal, consent forms, and modules received ethical approval from the
Ethical Review Committee of Oromia Regional Health Bureaus (ORHB) in Ethiopia
(BEFO/AH/UTR/1-84/29021, Aug. 23, 2012) (Appendix F). Yunhee Kang was listed
as an investigator in the study. Informed consent was obtained from mothers of
subject children. For illiterate mothers, we used oral informed consents under
permission of one of the household members, with a local language translated consent
90
form. Contents of the informed consents were read by data collectors. Study object,
method, expected results, each measurement time and process and potential
benefit/harm was informed in the local language, Afan Oromo. Women who
consented to join the study agreed to let their child be measured for 12 months as
scheduled by the project for their length and weight at visit1 to visit5. Caregivers
were informed that they were allowed to leave this study at any time if they felt
uncomfortable or were not available to participate in this study due to any reasons. All
information collected in this research was not particularly sensitive, but was collected
and managed only by trained interviewers; confidentiality was maintained by keeping
secure records and de-identifying the records during analysis and dissemination.
While the potential benefits of participation were minimal, the risks associated with
participation were also negligible. The time commitment for participation was less
than one hour per interview. Providers may have experienced mild psychological
discomfort when taking the survey, but this was highly unlikely because sensitive
topics were not included in the survey. Because most of the mothers were illiterate, all
mothers of study subject children were provided detailed information about the study
verbally at visit1 before data collection, and only mothers who signed written or
verbal informed consent were enrolled to this study. This trial was registered with
Current Controlled Trials, ISRCTN 89206590.
3.8 TIMELINE
The total duration of the study—including proposal writing, data analysis, and thesis
write-up—was 39 months. IRB approval and finalization of study procedures were
approved by the Ethical Review Committee of the Oromia Regional Health Bureau.
Apart from data collection, interventions were individually implemented by the World

91
Vision project team jointly with district health offices. Subject enrollment began
November 2012; follow-up continued up to January 2013. Data collection, entry, and
management began upon enrollment of the participants. Data collection was
completed in February 2014, and data entry and crosschecking was finished by the
end of April 2014. Data analysis and write up took approximately one year to
complete from the mid-point of data collection. The entire process was completed by
December 2014 (Table 3.7).
Table 3.7 Intervention implementation schedule and data collection activities by
month
2012 2013 2014 2015
Phase 1 2 3 4 1 2 3 4 1 2 3 4 1
Project implementation X X X X X X X
Writing research proposal and
developing forms
X
Local IRB Approval X
Establishing child registration
system & randomization
X
Setting up of data management
system
X
Training of interviewers X
Obtaining informed consent X
Data collection (Effectiveness
survey)
X X X X X X X
Data collection (Recall survey) X X
Data cleaning X
Final data analysis X X X X
Thesis write-up X X X X X
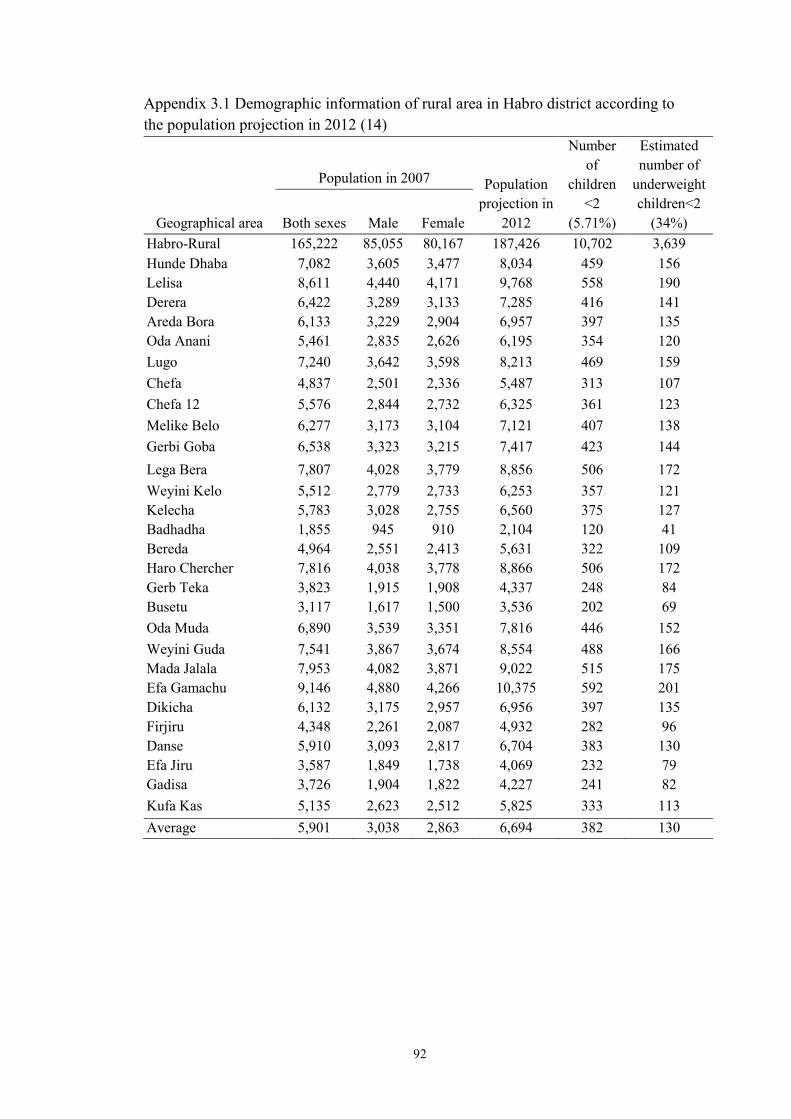
92
Appendix 3.1 Demographic information of rural area in Habro district according to
the population projection in 2012 (14)
Geographical area
Population in 2007 Population
projection in
2012
Number
of
children
<2
(5.71%)
Estimated
number of
underweight
children<2
(34%) Both sexes Male Female
Habro-Rural 165,222 85,055 80,167 187,426 10,702 3,639
Hunde Dhaba 7,082 3,605 3,477 8,034 459 156
Lelisa 8,611 4,440 4,171 9,768 558 190
Derera 6,422 3,289 3,133 7,285 416 141
Areda Bora 6,133 3,229 2,904 6,957 397 135
Oda Anani 5,461 2,835 2,626 6,195 354 120
Lugo 7,240 3,642 3,598 8,213 469 159
Chefa 4,837 2,501 2,336 5,487 313 107
Chefa 12 5,576 2,844 2,732 6,325 361 123
Melike Belo 6,277 3,173 3,104 7,121 407 138
Gerbi Goba 6,538 3,323 3,215 7,417 423 144
Lega Bera 7,807 4,028 3,779 8,856 506 172
Weyini Kelo 5,512 2,779 2,733 6,253 357 121
Kelecha 5,783 3,028 2,755 6,560 375 127
Badhadha 1,855 945 910 2,104 120 41
Bereda 4,964 2,551 2,413 5,631 322 109
Haro Chercher 7,816 4,038 3,778 8,866 506 172
Gerb Teka 3,823 1,915 1,908 4,337 248 84
Busetu 3,117 1,617 1,500 3,536 202 69
Oda Muda 6,890 3,539 3,351 7,816 446 152
Weyini Guda 7,541 3,867 3,674 8,554 488 166
Mada Jalala 7,953 4,082 3,871 9,022 515 175
Efa Gamachu 9,146 4,880 4,266 10,375 592 201
Dikicha 6,132 3,175 2,957 6,956 397 135
Firjiru 4,348 2,261 2,087 4,932 282 96
Danse 5,910 3,093 2,817 6,704 383 130
Efa Jiru 3,587 1,849 1,738 4,069 232 79
Gadisa 3,726 1,904 1,822 4,227 241 82
Kufa Kas 5,135 2,623 2,512 5,825 333 113
Average 5,901 3,038 2,863 6,694 382 130

93
Appendix 3.2 Demographic information of rural area in Melka Bello district
according to the population projection in 2012 (14)
Geographical area
Population
Population
projection
in 2012
Number
of
children
<2
(5.71%)
Estimated
number of
underweight
children
under two
(34.0%) Both sexes Male Female
Melka Belo-Rural 168,074 85,475 82,599 190,661 10,887 3701
Melka Belo-Rural
(Excluding two remote
Kebeles)
143,943 73,090 70,853 163,287 9324 3170
Kufekasa 4,537 2,299 2,238 5,147 294 100
Bifitu Oromiya 5,269 2,696 2,573 5,977 341 116
Chefe Jeneta 6,525 3,315 3,210 7,402 423 144
Burika Negeya 6,640 3,421 3,219 7,532 430 146
Fale Negeya 7,323 3,740 3,583 8,307 474 161
Welda Misima 4,471 2,276 2,195 5,072 290 98
Melisa Haka 11,197 5,741 5,456 12,702 725 247
Daba Kenisa 10,323 5,238 5,085 11,710 669 227
Tokuman Kane 8,496 4,347 4,149 9,638 550 187
Dire Kufa Kuter 4 5,254 2,590 2,664 5,960 340 116
Welikituma Bilusuma 9,908 5,145 4,763 11,239 642 218
Firi Kebiso 8,279 4,191 4,088 9,392 536 182
Tokuma Jalela 7,902 4,010 3,892 8,964 512 174
Degaya Bello 11,827 5,990 5,837 13,416 766 260
Mekanisa 4,084 2,044 2,040 4,633 265 90
Efa Basi 7,280 3,793 3,487 8,258 472 160
Chefe Weliteha 10,893 5,447 5,446 12,357 706 240
Boko Jalela 4,870 2,447 2,423 5,524 315 107
Bifitu Negeya 5,786 2,870 2,916 6,564 375 127
Debile 3,079 1,490 1,589 3,493 199 68
Average 7,197 3,655 3,543 8,164 466 159

94
REFERENCES
1. Bhutta ZA, Das JK, Rizvi A, Gaffey MF, Walker N, Horton S, et al. Evidence-
based interventions for improvement of maternal and child nutrition: What can be
done and at what cost? Lancet. 2013 Aug 3;382(9890):452-77.
2. Bhutta ZA, Ahmed T, Black RE, Cousens S, Dewey K, Giugliani E, et al. What
works? interventions for maternal and child undernutrition and survival. Lancet. 2008
Feb 2;371(9610):417-40.
3. Nutrition Working Group, Child Survival Collaborations and Resources Group
(CORE). Positive deviance / hearth: A resource guide for sustainably rehabilitating
malnourished children. Washington, D.C: December 2002.
4. WHO. Indicators for assessing infant and young child feeding practices - part I:
Definitions. Conclusions of a consensus meeting held 6–8 November 2007.
Washington D.C., USA; 2008.
5. Dewey K. Guiding principles for complementary feeding of the breastfed child
. 525 Twenty-third St. N.W., Washington, D.C. 20037: WHO. Division of Health
Promotion and Protection Food and Nutrition Program; 2003.
6. Emergency Nutrition Network. Field Exchange no. 40. 2011. Emergency Nutrition
Network.
7. Banteyerga H. Ethiopia's health extension program: Improving health through
community involvement. MEDICC Rev. 2011 Jul;13(3):46-9.
8. World Vision Ethiopia. Habro area development program. FY 2012 detailed
implementation plan (implementation period: October 2011 – september 2012). Addis
Ababa, Ethiopia: 2011.
9. World Vision Ethiopia. Melka bello area development program. FY 2012 detailed
implementation plan (implementation period: October 2011– September 2012). Addis
Ababa, Ethiopia: 2011.
10. Dupont WD, Plummer WD,Jr. Power and sample size calculations for studies
involving linear regression. Control Clin Trials. 1998 Dec;19(6):589-601.
11. Fenn B, Morris SS, Frost C. Do childhood growth indicators in developing
countries cluster? implications for intervention strategies. Public Health Nutr. 2004
Oct;7(7):829-34.
12. World Vision Korea. Action proposal on ethiopia integrated health and nutrition
project . 2011.
13. World Vision Ethiopia. PD hearth in CMAM & ENA context report by technical
support: EARO health and nutrition team. Gelemso, Habro ADP: World Vision
Ethiopia; 2012.

95
14. Population census commisson. The 2007 Population and Housing Census of
Ethiopia: Statistical report for OromiyaRegion; part V: Population size of kebeles.
2008.
15. Valid International. Community-based therapeutic care (CTC): Field manual. First
Edition, 2006.
16. Ethiopia Federal Ministry of Health. Protocol for the management of severe acute
malnutrition. March 2007.
17. Federal Ministry of Health. Federal ministry of health (ET). Health extension
program in Ethiopia: Profile [internet]. Addis Ababa: Health extension and education
center; 2007 [cited 2011 may 24]. 27 p. available from:
Http://www.ethiopia.gov.et/English/MOH/Resources/Documents/HEW%20profile%2
0Final%2008%2007.pdf.
18. World Vision International. Caregiver survey module 2012. access to
http://www.wvdevelopment.org/
19. Cogill B. Anthropometric indicators measurement guide. revised edition.
Washington, D.C: Academy for Educational Development, Food and Nutrition
Technical Assistance Project; 2003. Report No.: USAID Cooperative Agreement No.
HRN-A-00-98-00046-00.
20. Food and Nutrition Technical Assistance Project (FANTA). Household food
insecurity access scale (HFIAS) for measurement of food access: Indicator guide.
August 2007.
21. De Silva MJ, Harpham T. Maternal social capital and child nutritional status in
four developing countries. Health Place. 2007 Jun;13(2):341-55.
22. de Onis M, Garza C, Victora CG, Bhan MK, Norum KR. The WHO multicentre
growth reference study (MGRS): Rationale, planning, and implementation. Food and
Nutrition Bulletin. 2004;25(supplement 1):S3-S84.
23. Rutstein SO. The DHS wealth index: Approaches for rural and urban areas.
Calverton, Maryland, Macro International, MEASURE DHS, 2008 oct. [28] p. (DHS
working papers no. 60).
24. World Health Organization. Indicators for assessing infant and young child
feeding practices: Part 2—Measurement. Geneva, Switzerland: World Health
Organization; 2010.
25. Cleveland WS, Devlin SJ. Locally weighted regression—an approach to
regression-analysis by local fitting. J Am Stat Assoc. 1988;83:596-610.
26. Twisk JW, Smidt N, de Vente W. Applied analysis of recurrent events: A practical
overview. J Epidemiol Community Health. 2005 Aug;59(8):706-10.

96
27. Ruel MT, Menon P. Child feeding practices are associated with child nutritional
status in Latin America: Innovative uses of the Demographic and Health Surveys. J
Nutr. 2002 Jun;132(6):1180-7.

97
CHAPTER 4. EFFECTIVENESS OF A COMMUNITY-BASED
PARTICIPATORY NUTRITION PROMOTION PROGRAM TO
IMPROVE CHILD GROWTH IN EASTERN RURAL ETHIOPIA
4.1 ABSTRACT
Background: Appropriate complementary feeding and hygiene may reduce child
undernutrition. Objective & Design: We designed a community-based participatory
nutrition promotion (CPNP) program in Ethiopia, adopting in part the theory of
positive deviance. Through group nutrition sessions, this program engaged mothers in
“learning by doing” around child feeding and hygiene and the use of affordable
resources. This program was implemented in addition to the existing government
nutrition programs of Essential Nutrition Action (ENA) and Community-based
Management of Acute Malnutrition (CMAM) and tested in a cluster randomized trial
to examine its effectiveness in improving child growth in 12 rural areas in Ethiopia.
Results: 1,790 children 6 to 12 months of age were enrolled in the trial and measured
for their length and weight every three months for 12 months. A total of 38.9% of the
children enrolled in the intervention area attended the CPNP program. In multi-level
mixed effect regression models based on longitudinal data (n = 1,475) controlling for
clustering effects and enrollment characteristics, children in the intervention area had
a significantly greater increase in length-for-age z score (LAZ)/month of 0.021 (95%
CI: 0.008, 0.034) and weight-for-age z score (WAZ)/month of 0.015 (95% CI: 0.003,
0.026), length/month (diff: 0.059 cm; 95% CI: 0.027, 0.092), and weight/month (diff:
0.031 kg; 95% CI: 0.019, 0.042) compared to children in the control area. There was
no difference in the recurrent risk of stunting, underweight, or wasting between
intervention and control groups. Conclusions: A novel community participatory

98
nutrition promotion program appeared to be effective in improving child growth in the
rural Ethiopian context.
4.2 INTRODUCTION
Undernutrition is associated with deaths by preventable diseases in early childhood, as
well as long-term consequences in human capital development, including delayed
cognitive and motor development, poor learning performance at school, increased risk
of non-communicable disease followed by excessive weight gain later in life, and low
income and productivity in the adult stage (1). As a global commitment to tackle this
public health issue, WHO targets to reduce the number of under-five stunted children
by 40% from 171 million in 2010 to 100 million in 2025 and to reduce wasting to less
than 5% (2). The period of 1000 days from conception to 24 months of age was
recognized as the most effective intervention period to mitigate the adverse effects of
undernutrition, thus evidence-based nutrition-specific interventions have been
delivered with a focus on this period (3).
Ethiopia is a developing country with a high burden of child undernutrition
and micronutrient deficiencies; 44.4% of children under five years of age are stunted,
9.7% are wasted, and 40% have anemia (<11.0 g/dl) (4). Factors associated with
undernutrition in Ethiopia are multifaceted as with the UNICEF malnutrition
framework as follows: insufficient nutrient intake (5), inappropriate breastfeeding and
complementary feeding practices (6-9), prenatal influences (8), poor access to and
low utilization of health care (10-12), household socioeconomic status (9, 13), food
insecurity (14), and level of parental education (9). In Ethiopia, only 4% of breastfed
children age 6-23 months are given foods from at least four food groups, while 48%
are fed the minimum number of times or more per day (4). Inequality in appropriate

99
feeding practices were found to be according to residence and wealth quintile.
Complementary feeding interventions were effective in improving child
nutritional status in developing settings (3, 15, 16). These intervention strategies
featured multi-dimensional behavioral change communication activities, such as
locally acceptable and affordable recipes development, intensive group education or
individual counselling, use of mass media, involvement of community groups and
health care workers, and were embedded within existing health programs (17-23).
Given the current poor condition of child feeding practices, contextualized, effective,
and sustainable child feeding strategies are needed in Ethiopia that are in line with
Ethiopia National Nutrition Strategies (NNS)/Programs (NNP) (24).
There were two types of community-based nutrition programs in poor rural
districts: the Essential Nutrition Action (ENA) program and Community-based
Management of Acute Malnutrition (CMAM) program. The ENA activity was first
introduced by USAID/Ethiopia as an approach of ENA framework to improve the
nutrition of women and children focusing on improving breastfeeding,
complementary feeding, and micronutrient deficiencies, and had successful outcomes
(25). In 2008, an end-line evaluation of pre-post design showed that consumption of
three or more types of foods increased compared to baseline (53% vs. 33%); the
proportion of meeting the minimum acceptable diet was greater among children in the
project area compared to children in non-project areas (24% vs. 12%) (26). Despite
the achievement of ENA implementation at the regional level, poor working structure
in the ENA framework was found to be an obstacle in addressing undernutrition. The
CMAM program was also integrated into the government health system to treat
acutely malnourished children at the community level (27).
ENA activities were supposed to be delivered by community volunteers, but

100
they themselves had poor knowledge of child feeding practices and poor counseling
skills in convincing mothers to keep recommended feeding practices. There was no
available supervision or incentive system to monitor the entire volunteer delivery
structure (28). The CMAM program, on the other hand, though promising in treating
severe wasting with ready-to-use therapeutic foods (RUTF) (29), had no prevention
program components and depended entirely on external emergency funding to
purchase related therapeutic or supplementary foods (30, 31).
With this backdrop, World Vision Korea and World Vision Ethiopia designed
a new program model—which we called “community-based participatory nutrition
promotion (CPNP)”—in collaboration with Wholistic Interest Through Health
(WITH, a Korea-based NGO) and Ethiopia local health governments (Appendix A
and B). The new model aimed to address the gaps in the ENA and CMAM programs
and to strengthen community participation and program ownership, in part adopting a
positive deviance theory but designed for scale implementation (32). This new model
attempted to promote appropriate complementary feeding and hygiene among
caregivers by using locally affordable and available resources.
The idea was that this new model would eventually lead to improvements in
the child nutritional status at the community level. The CPNP was added to the
existing ENA activities and to the CMAM program, and was implemented from
August 2012 to August 2013 in two rural districts of eastern Ethiopia. The CPNP was
evaluated to assess its effectiveness on the growth of children 6 to 24 months of age in
a cluster randomized trial (CRT) compared to areas with the existing ENA and
CMAM programs only.

101
4.3 METHODS
The CRT compared the effectiveness of the CPNP program added to existing ENA
and CMAM programs with the existing programs only (control program) in
improving length-for-age (LAZ), weight-for-age (WAZ), and weight-for length
(WLZ) z scores, and for reducing stunting, underweight and wasting among children
6 to 24 months of age in two rural districts in Ethiopia. Additionally, we tested
whether CPNP participants had faster weight gain and a greater WAZ scores than
non-participants in the intervention area. Stunting, underweight, and wasting were
defined as height (or length)-for-age, weight-for-age, and weight-for-height (length)
more than two standard deviations below the median of the WHO growth reference
(33). Child growth was followed up for 12 months up to 18 to 24 month of age. The
effects of the CPNP program on child feeding and hygiene of mothers were among
secondary outcomes that were reported in Chapter 5.
4.3.1 Participants and population site
The effectiveness study was conducted in the Habro and Melka Bello districts of
eastern Ethiopia. The total population of Habro and Melka Bello districts was
estimated at 191,546 and 176,813, respectively, in 2011 (34). The study site included
all 29 rural Kebeles (the smallest administrative unit of Ethiopia) of Habro district and
20 of 22 rural Kebeles of the Melka Bello district. The study Kebeles had an
estimated average population of 6,300 and 416 children 0 to 24 months of age. Both
districts were typical of eastern rural Ethiopian communities, with limited
development and dependence on mixed crop agriculture, mainly sorghum, maize, and
other vegetables, livestock rearing, and the production of Khat, a stimulant plant with
amphetamine-like effects, as a predominant cash crop (35, 36). These districts were

102
selected not only because that they displayed typical characteristics of eastern rural
Ethiopia but also because of their poorly working ENA activity structures of
community volunteers and availability of therapeutic foods such as Plumpy’Nut that
were given to treat severely acute malnourished children at health centers/health posts
through the CMAM program. World Vision Ethiopia has implemented the Area
Development Program (ADP) for more than five years, building close ties with
community members in the two districts.
Study subjects could be any children aged 6 to 12 months at enrollment
residing in the study area, except for twins, regardless of preceding intervention
exposure. Due to the nature of public group nutrition sessions of CPNP, it was
expected that the program would influence not only participants themselves but also
their neighboring mothers, who could either observe the session in their communities
or learn CPNP lessons from CPNP participants.
4.3.2 Outcomes
The primary outcomes of the study were differences in LAZ, WAZ, and WLZ, and
differences in risk of stunting, underweight, and wasting of children 6 to 24 months of
age between the control and intervention areas. The length and weight measurements
for each child were converted to LAZ, WAZ and WLZ scores using the international
growth reference from the WHO Multicenter Growth Reference Study (33).
4.3.3 Sample size
We estimated that a sample of 2,064 children (n = 1032/group) would be required to
increase a 0.2 z score in LAZ in 18-24 months of age based on an expectation of a -
1.7 z score in the control area (37), accepting a type I (α) error of 5%, power at 0.80,

103
cluster size at 172, lost to follow up at 10%, standard deviation of 0.9 z score (38).
There was no available intra-cluster correlation coefficient (ICC) information for
anthropometric indicators in the study area, so we assumed an ICC of 0.054, which
was calculated based on DHS in 46 developing counties in another study (39).
4.3.4 Randomization
A cluster was used as a unit of randomization. The procedure of forming clusters was
as follows. First, all 49 Kebeles in the Habro and Melka Bello districts were ranked
according to the level of socio-economic condition assessed by the qualitative
information of Agricultural Officers of the World Vision ADPs. Statistical
information to assess socio-economic status at the Kebele level was absent. Second,
two to six nearby Kebeles presumed to share similar socio-economic living
environments were grouped into a cluster, eventually resulting in 12 clusters with 6
clusters per district. One cluster included 4 Kebeles on average. Each cluster was
matched to the other cluster in the same district based on the similarity of agricultural
and wealth information from World Vision local staff and local government officers.
By tossing a coin in the presence of the local authorities, if one cluster was randomly
decided as an intervention area, the paired cluster automatically became a control
area. Intervention allocation was not blinded among study subjects and community
members due to the public nature of the intervention. Borders between the control
area and the intervention area were not separated.
4.3.5 Interventions: The Ethiopia Integrated Nutrition Project (EINP)
The CPNP was implemented as part of the Ethiopia Integrated Nutrition Project
(EINP), which was comprised of CPNP, ENA and CMAM programs. The CPNP was
104
called “Sagantaa Shuuro” in Afan Oromo, which meant “porridge program.” Some
program elements, such as a two-week group session and utilization of community
available and affordable resources, were partially adapted from the Positive Deviance
Hearth program (40, 41). The CPNP session operation unit was a village (“Ganda”), a
sub-community structure in a Kebele. One female CPNP operator was recruited from
her Kebele, who prepared and led a 12 day long CPNP session. Seven to twelve child
and mother pairs participated in each CPNP session, where they contributed various
food ingredients and session materials such as firewood, prepared complementary
foods per recipes developed by NGO nutrition experts, and fed their children on the
spot. Mothers discussed feeding, caring, hygiene and health-seeking messages with
CPNP operators. During the session, all mothers took turns in pairs preparing
porridge. All enrolled children were weighed on the 1st day and 12th day of the
session, one month, and three months after the session. The CPNP participants had 1
to 2 follow-up visits by CPNP operators or supervisors during the following two
weeks. Once a CPNP session was carried out in a village in a Kebele, the next session
was prepared in a neighboring village within the Kebele.
The ENA activity aimed to deliver nutrition messages to all mothers with
children under two years of age by HEWs or community volunteers. Adequate
breastfeeding and appropriate complementary feeding practices, proper care for sick
children, maternal nutrition, and micronutrient deficiency were the main nutrition
messages in the ENA counseling (42).
Severely wasted children with mid-upper arm circumferences (MUAC) of less
than 11 cm but without complications were referred to the nearest health post/health
center and received Plumpy’Nut until their recovery (43). Through a few rounds of
distribution, children with MUAC greater than 11 cm but less than 12 cm received 8.3

105
kg of corn-soy blend (CSB) and oil per month from their assigned health center for
three months. The list of beneficiary households were prepared by the district health
office every three months.
The EINP was launched in January 2012 and was phased out in August 2013.
The ENA training of HEWs and community volunteers and the CMAM training of
HEWs were conducted in both districts from March to May 2012. For the CMAM
program, Plumpy’Nut was available year round, but CSB was provided occasionally
due to logistical limitations. The first CSB distribution was put in place in August
2012 at the time when the first CPNP session began in the intervention area. World
Vision Korea and World Vision Ethiopia had full responsibility for designing CPNP,
training the ENA and CMAM program health staff, HEWs, and community
volunteers. Implementation of the ENA activity and the CMAM program was the
responsibility of the district health offices.
4.3.6 Procedures
An established birth registration system which could be used for the random selection
of subject children was absent in the study area, so we requested the Habro and Melka
Bello district health offices to prepare a roster of children in the study area aged 0 to
12 months of age. To facilitate this process, we prepared a calendar indicating
Ethiopian years and dates as well as a Gregorian calendar for the last two years to
estimate the children’s ages as accurately as we could. The Ethiopian calendar year of
2004 began on September 12, 2011 A.D of the Gregorian calendar. After a brief
training session, HEWs and community volunteers visited households in their Kebele,
recorded the relevant information to the child roster form. The form included Kebele
and village name, HEWs and community volunteers’ name, mother’s name, and
106
child’s name, birthdate, age and sex. After the surveillance, the forms were submitted
to health centers first, then compiled and delivered to the district health offices. The
information was entered into a Microsoft Excel program. Using a unique
identification number that we assigned to each child, 2,064 children 4 to 11 months of
age were randomly selected proportional to the population size of each cluster.
Because the roster was prepared a month before the data collection started at visit1
and a round of data collection took three months’ collection, we had to consider the
aging of subject children. Eventually, four months after the CPNP sessions began
(August 2012), the first visit for the data collection was made (November 2012) and
continued for 15 months until February 2014. The data collection was carried out at
five major time points for a cohort of children aged 6 to 12 months: enrollment
(visit1), 3 month (visit2), 6 month (visit3), 9 month (visit4) and 12 month follow-up
(visit5). Thus, the children who were enrolled at the age of 6 to 12 months at visit1
turned 18 to 24 months old at visit5. The CPNP program was phased out when visit4
started.
The data collection team was comprised of one team leader and nine
enumerators in each district, and the data management team consisted of four female
members, all of whom were recruited from their district and trained by World Vision
nutrition experts and study investigators for anthropometric measurement and
household interviews. A structured questionnaires was initially prepared in English
and translated into the local language (“Afan Oromo”) by a government-registered
translator. The data collection tool was pre-tested in a neighboring Kebele outside the
study area.
After providing informed consent (Appendix C.1), the weight and length of
the children were measured using standardized procedures (44) every three months
107
from the moment of enrollment (visit1) to the 12-month follow-up (visit5). Weight
was measured to the nearest 0.01kg by a digital scale (model 354,
SECA/GERMANY). A locally designed measuring board was used to measure supine
length for children to the nearest 0.1cm.
At enrollment, using a structured questionnaire, mothers of subject children
were asked about household demographic and socioeconomic information, dwelling
condition, maternal and infant characteristics, household assets, food insecure
conditions, social capital, water sources, and sanitation facilities. The Household Food
Insecurity Access Scale (HFIAS) was used to measure food insecurity (45). Short
Social Capital Assessment Tool (SASCAT) was used to quantitatively measure
structural and cognitive social capital (46). Infant and young child feeding practices
and hygiene practices were asked every three months and every six months,
respectively (Chapter 5). The mothers were asked whether or not they participated or
received each of the three interventions, i.e. attendance to CPNP session, receipt of
ENA activity/counselling, or receipt of Plumpy’Nut or CSB through the CMAM
program in the past three months. Enumerators and the data entry team had no
interaction with the intervention implementation staff or government health staff.
Twelve-month follow-up of child anthropometric status was completed by February
20, 2014.
4.3.7 Data quality control
Standardization of anthropometric measurements was achieved by taking multiple
measurements on non-study subjects during the training prior to commencement of
data collection, and refresher training was done when necessary. Regular supervision
visits by team leaders were made during data collection visits. The data collection
108
team had bi-weekly team meetings to resolve challenges in the field. Errors in
anthropometric measurement were found at visit1. To prevent further error
occurrence, we strengthened refresher training at the beginning of visit2, and provided
reminders on how to accurately measure length and weight. Collected questionnaires
and forms were submitted to team leaders regularly during team meetings and
delivered to the data management team in the Habro district. All entered data were
cross-checked with another data entry person.
After all data were entered, a sensitivity analysis to improve data quality was
carried out on anthropometric measurements as follows: data with z-scores in
unacceptable ranges (i.e., < -6 for LAZ and WAZ, etc.) were deleted. Specifically, if
LAZ scores were greater than 6 or below -6, the LAZ scores and corresponding length
values were deleted together. If WAZ scores were greater than 6 or below -6, or if
WLZ scores were greater than 5 or below -5, the WAZ and WLZ scores and
corresponding weight values were deleted. Subsequently, we deleted data of
enumerators who had systematic measurement errors in their measures. To find such
errors, we calculated monthly length and weight changes by age and sex of all
enumerators and compared these values with those of WHO Child Growth Standards
children (47). We removed length measures at visit1 if there were unacceptably high
increases in length between visit2 and visit1, since many errors were reported during
the visit. We deleted length data with subsequent measures that were lower than those
of prior visits. Last, we included into data analysis the anthropometric data of children
who had two or more measures in length and weight out of five visits.
4.3.8 Statistical analysis
109
Descriptive statistics for continuous variables were presented as mean ± SD, while
categorical variables were presented as number (n) and proportion (%). Analyses were
by intention to treat. Statistical significance was set at P < 0.05 with all tests being
two-tailed.
Enrollment characteristics were compared using linear, logistic and ordinal
logistic regression to account for cluster effects between areas. All variables that
differed at enrollment were adjusted during further analyses. Univariate linear or
logistic models were used to explore the difference in length, weight, and z scores
between children in the control and intervention areas or the odds ratio of prevalence
of stunting, underweight, and wasting for each visit. Longitudinal data analysis using
anthropometric measures was conducted using three-level mixed effects linear
regression models to estimate linear and ponderal growth rate to compare the control
area vs. intervention area, or CPNP participants vs. non-CPNP participants.
Data of subjects with at least two measurements at different time points were
included in the longitudinal data analysis. The models added quadratic terms of age,
accounted for cluster level effect and baseline differences in fathers’ education,
household food insecurity, type of nearest health facility, district, and anthropometry
persons, as these variables differed at study enrollment. Fixed-effects covariates
included intervention (control area vs. intervention area), child age, sex and variables
that differed at visit1. Random intercepts were present at both the individual and
cluster levels, and the random slope was at child age.
The distribution of anthropometric outcomes at 6 to 24 months of age was
graphically presented by Lowess curves derived from nonparametric, locally weighed
regression (48). Cox proportional hazards regression with shared frailty for recurrent
events model (49) was used to analyze the effect of the CPNP program on the

110
repetitive risk of stunting, wasting, and underweight of subject children during the 12-
month follow-up. In this model, the different time periods for each event for the same
subject were analyzed separately and adjusted for the fact that time periods within
each subject are dependent. Logistic regression analysis using the robust cluster
variance estimator were used to estimate prevalence of stunting, underweight, and
wasting at 12-months of follow-up.
Data management and statistical analysis were performed using Stata version
12.0 (Stata Corporation, College Station, TX, USA).
4.3.9 Ethical review
The study proposal, questionnaires, and subject consent forms were submitted and
approved by the Oromia Regional Health Bureau (IRB No: BERO/AHKTF/1-
89/29021, Aug 23, 2012) (Appendix F.1 and F.2). All mothers of study subject
children were provided detailed information about the study verbally at enrollment
(visit1) prior to data collection, and only mothers who provided consent were enrolled
in this study. This trial was registered with Current Controlled Trials, ISRCTN
89206590.
4.4 RESULTS
Out of the 2,064 randomly selected children from the roster, 914 children from
control and 876 children from intervention areas were enrolled in the study.
Exclusions were related to not finding children/refusal to participate (n = 89 in
intervention and n = 14 in control area) or age criteria not being met (n = 67 in
intervention and n = 104 in control area). Thus, a total of 1,790 child and mother pairs
were enrolled at visit1 and followed up with every three months. Groups had no
111
difference in the percentage of being followed by visit, except for a 3.5% difference at
visit2 (88.5% in control area vs. 85.0% in intervention area); 1,552 (86.7%) were
followed at visit2, 1,546 (86.4%) were followed at visit3, 1,501 (83.9%) were
followed at visit4, and 1,394 (77.9%) were followed at visit5 (Figure 4.1).
Enrollment information from the 1,790 child and mother pairs was used to
assure comparability between control and intervention areas (Table 4.1). Groups did
not differ in child age and sex, parents’ age, mothers’ education, parity, main living
sources, religion, water source and sanitation use, and social capital. The mean (SD)
age of enrolled children was 8.7 (1.9) months, the mean (SD) age of fathers and
mothers was 32.3 (6.8) and 26.1 (5.4) years, respectively, and 82.3% of mothers were
illiterate. More than 90% of the households depended on mixed farming for their
livelihoods. Z scores and prevalence of child undernutrition were not significantly
different by group, reflected by LAZ (-0.90 vs. -0.87), WAZ (-1.00 vs. -1.00), and
WLZ (-0.62 vs. -0.72), and stunting (19.2% vs. 20.0%), underweight (19.2% vs.
19.2%) and wasting (16.9% vs. 16.7%), in the control and intervention area.
However, the intervention area had a significantly greater percentage of fathers with
primary education (48.6% vs. 37.8%; p = 0.044), fewer households with severe food
insecurity (12.4% vs. 34.7%; p = 0.001), greater access to the local hospital (1.0% vs.
14.4%; p < 0.001), and marginally better household wealth status. These variables
were not comparable between groups, so that all those were accounted for during
further analysis.
According to the CPNP program records, 372 CPNP sessions were held, and
3,299 mother and child pairs attended the CPNP sessions in the intervention area
during the 13 months before the phase out of the EINP. Out of the 3,299 participant
children, 67.8% gained more than 200g after attending the CPNP session of 2 weeks

112
(Chapter 6). Of 876 study subjects in the intervention area, the proportion of CPNP
session attendants was 16.5% (n = 97) at visit1 but increased up to 38.9% (n = 340)
by visit5 (Table 4.2). In the control area, 3.3% of children reported to have
experienced CPNP participation. Regarding the exposure to CMAM and ENA
programs, there was no difference in the proportion receiving CSB between control
and intervention areas. By contrast, fewer children received Plumpy’Nut (6.8% vs.
2.9%, P < 0.001) and more mothers were exposed to the ENA activity (15.1% vs.
23.4%, P < 0.001) in the intervention than in the control area.
Out of the 1,790 subject children, 750 (82.1%, N = 914 in control area) and
725 (82.8%, N = 876 in intervention area) children in the control and intervention
areas, respectively, were included in the longitudinal analysis of child growth as they
had at least two measures at different time points after the data cleaning procedure. As
a result, 315 (17.6%) children were completely excluded from the longitudinal data
analysis, and their enrollment characteristics were comparable to the children
included in the data analysis. Z scores, length and weight among study children were
listed by visit in Appendix 4.1.
All longitudinal models accounted for cluster level effect and differences in
enrollment characteristics. Using a longitudinal analysis by age, children in the
intervention area were estimated to have significantly better growth in terms of LAZ
(diff: 0.021 z score/month; 95% CI: 0.008, 0.034), WAZ (diff: 0.032 z score/month;
95% CI: 0.016, 0.039), WLZ (diff: 0.042 z score/month; 95% CI: 0.024, 0.059),
length (diff: 0.059 cm/month; 95% CI: 0.027, 0.092) and weight (diff: 0.031
kg/month; 95% CI: 0.019, 0.042) compared to children in the control area (Table 4.3
and Figure 4.2). Differences in these anthropometric indicators between two areas
were apparent by 18 months of age and continued up to 24 months of age (Figure

113
4.2). Furthermore, children who had ever attended the CPNP session exhibited even
faster monthly weight gain (diff: 0.035/month, 95% CI: 0.017, 0.053) and WAZ (diff:
0.029 score/month, 95% CI: 0.012, 0.047) than non-CPNP participants in the
intervention area (Table 4.4).
Estimated from a longitudinal analysis by visit, differences in child growth
after 12 months follow-up were as follows: 0.33 LAZ (95% CI: 0.07, 0.59), 0.339
WAZ (95% CI: 0.07, 0.61), 0.474 WLZ (95% CI: 0.14, 0.81), 0.925 cm in length
(95% CI: 0.27, 1.58) and 0.398 kg in weight (95% CI: 0.144, 0.652) (Figure 4.3). The
differences between the two areas were apparent by visit4 (9 months follow-up) or
later and continued up to a year.
In the Cox proportional hazard models with shared frailty, adjusting for child
sex and age only, the hazard ratio had significant differences on wasting (HR 0.749,
95% CI: 0.589, 0.951) and underweight (HR 0.785, 95% CI: 0.628, 0.980) between
the groups. However, adjusted with all variables that differed at enrollment, the CPNP
program appeared not to significantly reduce the risk of child undernutrition [Hazard
Ratio (HR) 1.01, 95% CI: 0.811, 1.266 for stunting, p = 0.907; HR 0.826, 95% CI:
0.643, 1.061 for underweight, p = 0.135; and HR 1.048, 95% CI: 0.812, 1.354 for
wasting, p = 0.718, respectively] (Table 4.4). Prevalence of stunting was lower in the
intervention area by 7.5% (p = 0.037) at 9 month follow-up and by 7.3% at 12 month
of follow-up (latter was not significant) (Figure 4.4, Appendix 4.1).
4.5 DISCUSSION
Using a cluster randomized controlled trial, this study demonstrated that a
community-based participatory nutrition promotion (CPNP) program—added to the
existing government programs of ENA and CMAM—could effectively improve child

114
growth in the rural context of eastern Ethiopia, by enhancing appropriate child
feeding and hygiene in eastern rural context in Ethiopia. Specifically, the CPNP
program improved child growth in terms of z scores, length, and weight in the
intervention area. The CPNP participants, who were in a group directly exposed to the
intervention, had faster weight again and a greater increase in WAZ score than non-
CPNP participants in the same intervention area. Risk of stunting, wasting, and
underweight was not reduced by this program.
To suggest the intervention mechanism which led to these results, we need to
collectively review the implementation process of the CPNP program and its
interaction with existing programs and the potential mediating outcomes, such as
improved child feeding practices among mothers, since child growth would be the last
terminal of the causal framework. The occurrence of better child growth in the
intervention areas can be supported first by the successfully implemented intervention
process—done with high program dose and fidelity to the intervention guidelines and
active participation and contribution—with 67.8% of the children having more than
200g of weight gain after two weeks of CPNP sessions (Chapter 6). The CPNP
participants had positive attitudes towards the CPNP sessions and their messages and
practices, and continued practices related to the CPNP lessons onward. Second,
overall year-round ENA activity in the intervention area was greater than in the
control area (23.4% vs. 15.1 %; P < 0.001), which was mainly attributed to active
participation by CPNP mothers in the intervention area (Table 4.2 and Chapter 6).
Third, mothers in the intervention area showed better child feeding practices (Chapter
5). Additionally, the high proportion of weight gain (67.8%) in the two-week sessions
(Chapter 6) could in part support the possibility that children who had ever
participated in the sessions kept faster weight gain and WAZ than non-CPNP

115
participants. The continued catch-up growth in terms of weight gain among
participating children were reported elsewhere (50). The risk of stunting, wasting, and
underweight showed no differences between control and intervention areas. Despite
improvement of child growth in terms of z scores, the CPNP program did not lead to a
significant decrease in stunting, underweight, or wasting at the community level.
The results of the study were by and large consistent with previous studies on the
effect of interventions to promote complementary feeding through various behavioral
change communication channels (15, 16). In five efficacy complementary feeding
trials and four programs conducted between 1970 and 1997, improvement of child
growth rates was between 0.1 and 0.5 SD (51). A meta-analysis with 17 studies
showed that provision of appropriate complementary foods with or without nutritional
counseling led to an extra gain of 0.25 kg (± 0.18) in weight and 0.54 cm (± 0.38) in
height in children aged 6 to 12 months, whereas education about complementary
feeding resulted in an extra gain of 0.30 kg (± 0.26) in weight and 0.49 cm (± 0.50) in
height (16). Education on complementary feeding alone (fortified or unfortified, but
not micronutrients alone) resulted in significant increases in HAZ (standard mean
difference (SMD): 0.23, 95% CI: 0.09, 0.36) and WAZ (SMD 0.16, 95% CI: 0.05,
0.27) (15, 16). In food insecure settings, education on complementary feeding alone
resulted in improvements in HAZ (SMD 0.25, 95% CI: 0.09, 0.42, 1 study) (22) and
WAZ scores (SMD 0.26, 95% CI: 0.12, 0.41, 2 studies) (22, 52) and reduced the rates
of stunting (RR 0.68, 95% CI: 0.60, 0.76, 1 study) (22). In view of the above results,
our outcomes of 0.33 LAZ/month and 0.33 WAZ/month, 0.059 cm/month in length,
and 0.031 kg/month in weight seemed to be somewhat larger than anticipated but still
lie within the reasonable range of values.

116
Some studies adapting the Positive Deviance (PD) theory, as this study did,
reported inconclusive results. A trial in Vietnam on the impact of the PD Hearth
program, using randomized controlled trial design, prospectively followed up to 240
children for 12 months and showed no significant difference in growth patterns
between intervention groups (53). Among them, children whose age was less than 15
months and who were more malnourished at baseline had on average far less drop of
WAZ scores in the intervention group, while counterpart children in the control group
lost 0.25 HAZ scores (0.05 vs. 0.25) (54). A study in Haiti reported no significant
differences in nutritional status between study groups (55).
The strengths of this study included the use of a cluster randomized study design,
prospective and longitudinal data collection on a large scale, and the use of a
statistical approach to account for correlation within individual children and
geographical clusters.
There were a few limitations in this study. First, our anthropometric
measurements had considerable measurement errors despite constant error checking
and refresher training, but we improved the data by excluding suspected data with
systematic ways through sensitivity analysis. Second, allocation of intervention to the
matched clusters was made randomly, but, by chance, imbalances were found in the
enrollment characteristics at visit1 between control and intervention areas, such as
fathers’ education, household food insecurity, and type of nearest health facilities in
favor of the intervention area. These variables were included in our statistical models
and adjusted.
Third, this study had no true baseline because the first data collection was
conducted four months after the CPNP sessions started within the communities. It was
expected that the CPNP program already impacted child nutritional status in the
117
community. However, there was no significant difference in anthropometric
measurement and indicators, and comparison for such indicators was mainly done by
monthly rate comparisons. Fourth, the intervention allocation and data collection
procedures were not blinded to subject mothers and interviewers by the nature of
intervention of the CPNP. Some mothers knew of the existence of the CPNP program
in their community but had no idea of the impact comparison purpose of this study.
Interviewers were constantly reminded to conduct accurate data collection with
neutral attitudes regardless of intervention allocation. Additionally, CPNP participants
were found in the control area with 3.3% of mothers in the control area. Since the
border between clusters were not regulated, mothers living on the borders of clusters
would have opportunities to attend the CPNP session. This could be a contaminating
factor which is likely to affect the effect of CPNP on the outcomes. Nevertheless, we
did not exclude the CPNP participants in the control area, abided by the intention to
treat analyses principle. We suggested that 3.3% contamination would not be great
enough to decrease the program effect size, and that this type of intervention
contamination is expected in actual programmed settings. The effect sizes might be
presented as slightly conservative.
Further research is needed to determine the sustainability of the CPNP program
effects on child growth beyond 24 months of age in the Habro and Melka Bello
districts, and the generalizability of the intervention needs to be assessed at a wider
scale in similar communities in Ethiopia and other African countries.
Conclusion
This study showed that a community-based participatory nutrition promotion program
improved child growth when added to the existing government nutrition programs in

118
Ethiopia. Despite a few limitations, this study has implications of being an operational
research study that evaluated the effectiveness of a nutrition program using a rigorous
study design in a setting where child undernutrition is high and where effective
interventions are urgently needed. These research findings will help spur community
participation and strengthen the community health systems. We suggest that rather
than implementing the CPNP independently, the program should be adapted in
conjunction with existing government nutrition programs to increase its effectiveness
and build the community’s capacity to address child undernutrition. This will also
complement the work of the Ethiopia National Nutrition Strategies (NNS)/Programs
(NNP) and will help develop the nutrition program strategies of non-government
organizations.

119
Figure 4.1 Consort diagram for trial participants from trial enrollment through 12
months follow-up, Habro and Melka Bello districts, Ethiopia (2012-2014)
1 Control clusters: Community-based Management Acute Malnutrition (CMAM) program and
Essential Nutrition Action (ENA) counselling only were implemented in control clusters. 2 Intervention clusters: In addition to the CMAM program and ENA counselling, the Community-based
Participatory Nutrition Education (CPNP) was implemented in intervention clusters. 3 Unmet: the subject moved out of the area or was not at home at the time of the survey. 4 Refused: the subjects decided not to participate at the time of the survey, which did not mean
necessarily their complete leaving the study participation.
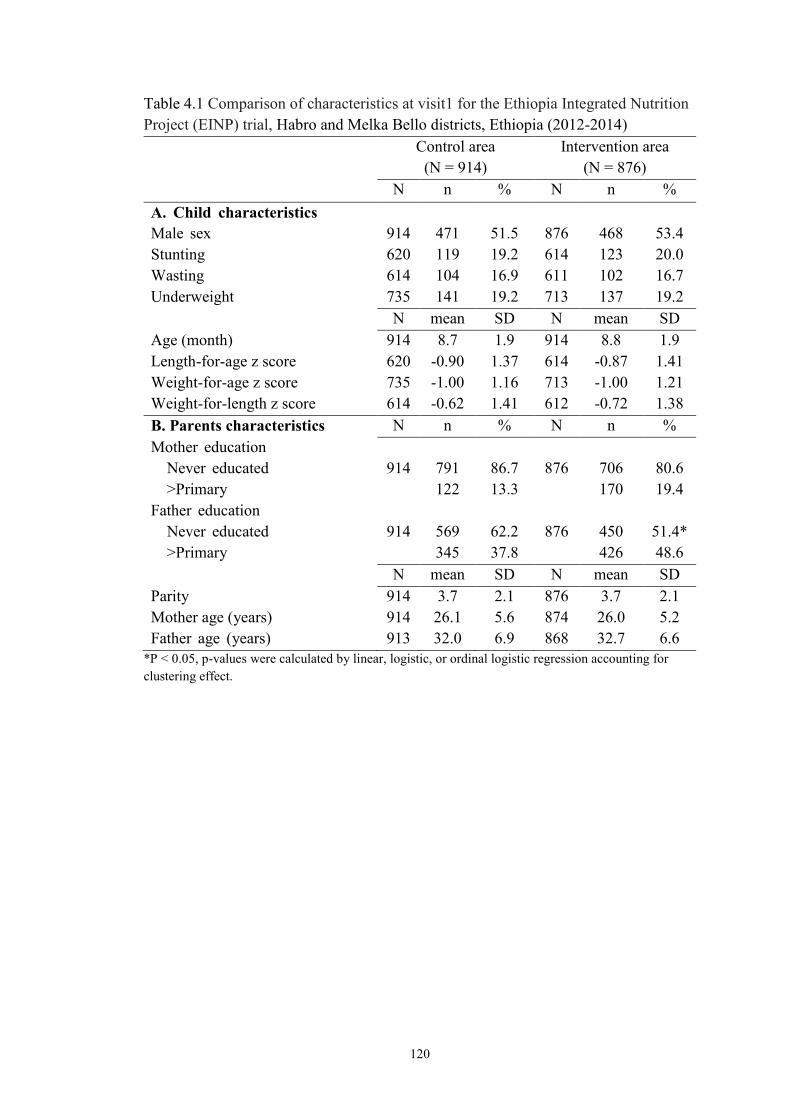
120
Table 4.1 Comparison of characteristics at visit1 for the Ethiopia Integrated Nutrition
Project (EINP) trial, Habro and Melka Bello districts, Ethiopia (2012-2014)
Control area
(N = 914)
Intervention area
(N = 876)
N n % N n %
A. Child characteristics
Male sex 914 471 51.5 876 468 53.4
Stunting 620 119 19.2 614 123 20.0
Wasting 614 104 16.9 611 102 16.7
Underweight 735 141 19.2 713 137 19.2
N mean SD N mean SD
Age (month) 914 8.7 1.9 914 8.8 1.9
Length-for-age z score 620 -0.90 1.37 614 -0.87 1.41
Weight-for-age z score 735 -1.00 1.16 713 -1.00 1.21
Weight-for-length z score 614 -0.62 1.41 612 -0.72 1.38
B. Parents characteristics N n % N n %
Mother education
Never educated
>Primary
914
791
122
86.7
13.3
876
706
170
80.6
19.4
Father education
Never educated
>Primary
914
569
345
62.2
37.8
876
450
426
51.4*
48.6
N mean SD N mean SD
Parity 914 3.7 2.1 876 3.7 2.1
Mother age (years) 914 26.1 5.6 874 26.0 5.2
Father age (years) 913 32.0 6.9 868 32.7 6.6
*P < 0.05, p-values were calculated by linear, logistic, or ordinal logistic regression accounting for
clustering effect.

121
Table 4.1 Comparison of baseline characteristics at visit1 for the Ethiopia Integrated
Nutrition Project (EINP) trial, Habro and Melka Bello districts, Ethiopia (2012-2014)
(continued)
Control area
(N = 914)
Intervention area
(N = 876)
N n % N n %
D. Socioeconomic status
Muslim religion 911 867 95.2 875 829 94.7
Father as a household head 913 857 93.8 876 857 97.8
Main living-source
Self-supporting farming
Laborer/self employed
914
817
93
89.8
10.2
872
825
47
94.6
5.4
Household wealth index
Poor
Middle
Rich
914
393
386
135
43.0
42.2
14.8
876
306
339
231
34.9*
38.7
26.4
Electricity use 900 56 6.2 863 88 10.2
Household food insecurity
Food secure
Mild food insecure
Moderately food insecure
Severely food insecure
912 180
130
286
316
19.7
14.3
31.4
34.7
876 272
340
154
110
31.1*
36.5
20.0
12.4
E. WASH
Use of protected water sources1 914 468 51.3 791 584 66.7
No latrine use 910 246 26.9 871 182 20.8
Inadequate waste disposal 909 316 34.8 874 242 27.7
F. Access to community
infrastructure
Distance to market within 1hr 913 239 26.2 871 310 35.6
Nearest health facility
Health post
Health center
Clinic/Hospital
908
420
479
9
46.3
52.8
1.0
868
292
451
20
33.6*
52.0
14.4
G. Social Capital
Membership of +2 groups 912 175 19.2 874 313 35.8
Support from +2 individuals 912 87 9.5 874 90 10.3
Active citizenship activities 912 469 51.4 874 452 51.7
High cognitive social capital 912 362 39.7 874 250 28.6 1 Protected water sources include public tap/standpipe, tube well/borehole, and protected well.
*P < 0.05, p-values were calculated by linear, logistic, or ordinal logistic regression accounting for
clustering effect.
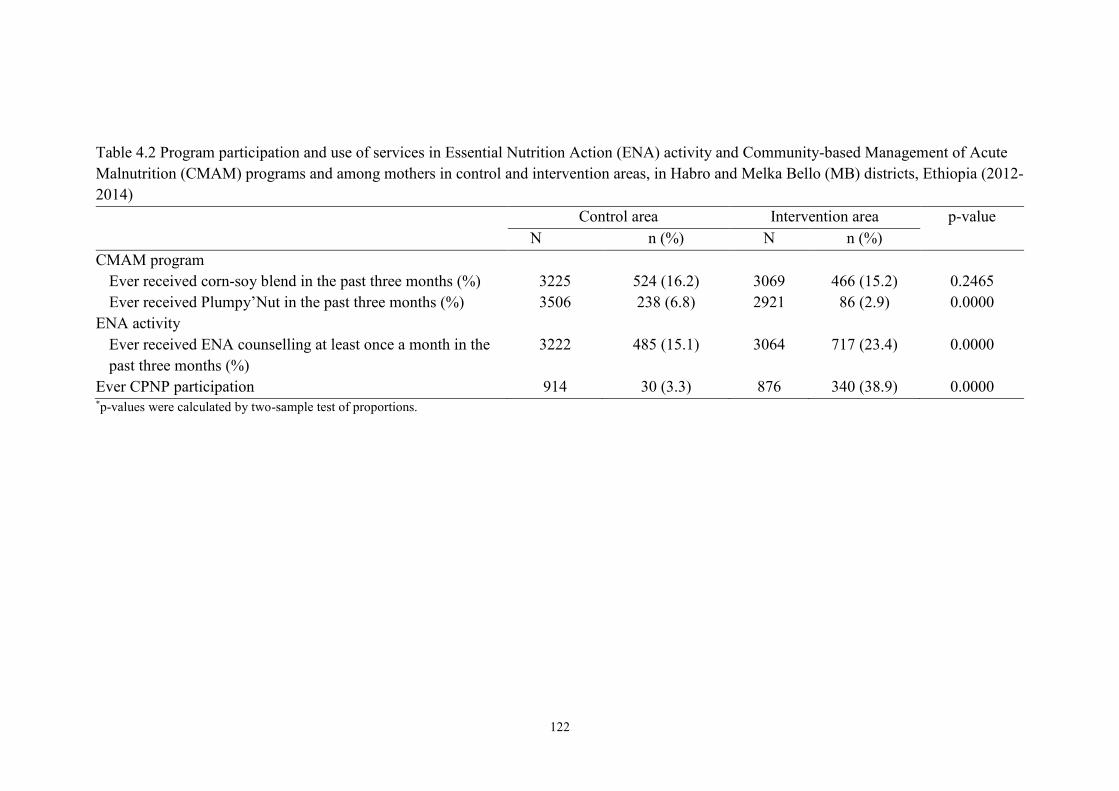
122
Table 4.2 Program participation and use of services in Essential Nutrition Action (ENA) activity and Community-based Management of Acute
Malnutrition (CMAM) programs and among mothers in control and intervention areas, in Habro and Melka Bello (MB) districts, Ethiopia (2012-
2014)
Control area Intervention area p-value
N n (%) N n (%)
CMAM program
Ever received corn-soy blend in the past three months (%) 3225 524 (16.2) 3069 466 (15.2) 0.2465
Ever received Plumpy’Nut in the past three months (%) 3506 238 (6.8) 2921 86 (2.9) 0.0000
ENA activity
Ever received ENA counselling at least once a month in the
past three months (%)
3222 485 (15.1) 3064 717 (23.4) 0.0000
Ever CPNP participation 914 30 (3.3) 876 340 (38.9) 0.0000 *p-values were calculated by two-sample test of proportions.

123
Table 4.3 Longitudinal regression models for average marginal monthly effect of intervention on child-growth outcomes compared with control
group (Cleaned observed No=6,401) in Habro and Melka Bello (MB) districts, Ethiopia (2012-2014)
1 LAZ, length-for-age z score; WAZ, Weight-for-Age z score; WLZ, Weight-for-length z score.
2 N, number of observations6 All values are β (95% CI). Adjusted for the child age, mother’s education, literacy, antenatal care, father’s education, households’ living sources,
distance from market and health facility, household food insecurity, wealth status, and type of nearest health facilities at baseline.
Outcomes1 N2 Control area N2 Intervention area Difference (95% CI) in
monthly change between
control and intervention area
p-value
Monthly change
Mean (SE)
Monthly change
Mean (SE)
Change in LAZ/month 3285 -0.095 (0.004) 3040 -0.074 (0.005) 0.021 (0.008, 0.034) 0.0011
Change in WAZ/month 3408 -0.060 (0.004) 3120 -0.032 (0.004) 0.028 (0.016, 0.039) 0.0000
Change in WLZ/month 3275 -0.030 (0.006) 3030 0.011 (0.006) 0.042 (0.024, 0.059) 0.0000
Change in length /month (cm) 3285 0.803 (0.012) 3040 0.862 (0.012) 0.059 (0.027, 0.092) 0.0004
Change in weight/month (kg) 3408 0.136 (0.004) 3120 0.167 (0.004) 0.031 (0.019, 0.042) 0.0000

124
Figure 4.2 Predicted length-for-age, weight-for-age, and weight-for-length z scores, and length and weight of children in control and intervention
areas during 6 to 24 months of age. The graphs were produced by locally weighted regression on the predicted values from a quadratic growth
model with a random intercept and random slope (56), in Habro and Melka Bello districts, Ethiopia (2012-2014)
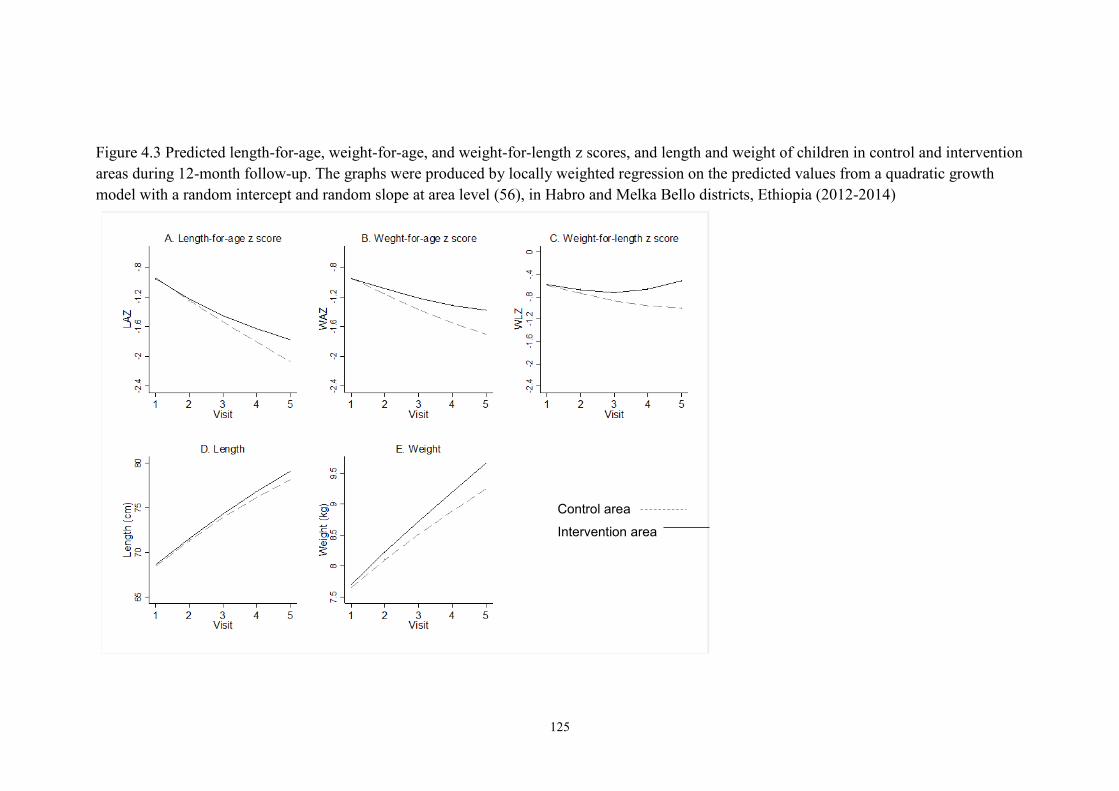
125
Figure 4.3 Predicted length-for-age, weight-for-age, and weight-for-length z scores, and length and weight of children in control and intervention
areas during 12-month follow-up. The graphs were produced by locally weighted regression on the predicted values from a quadratic growth
model with a random intercept and random slope at area level (56), in Habro and Melka Bello districts, Ethiopia (2012-2014)
Control area
Intervention area
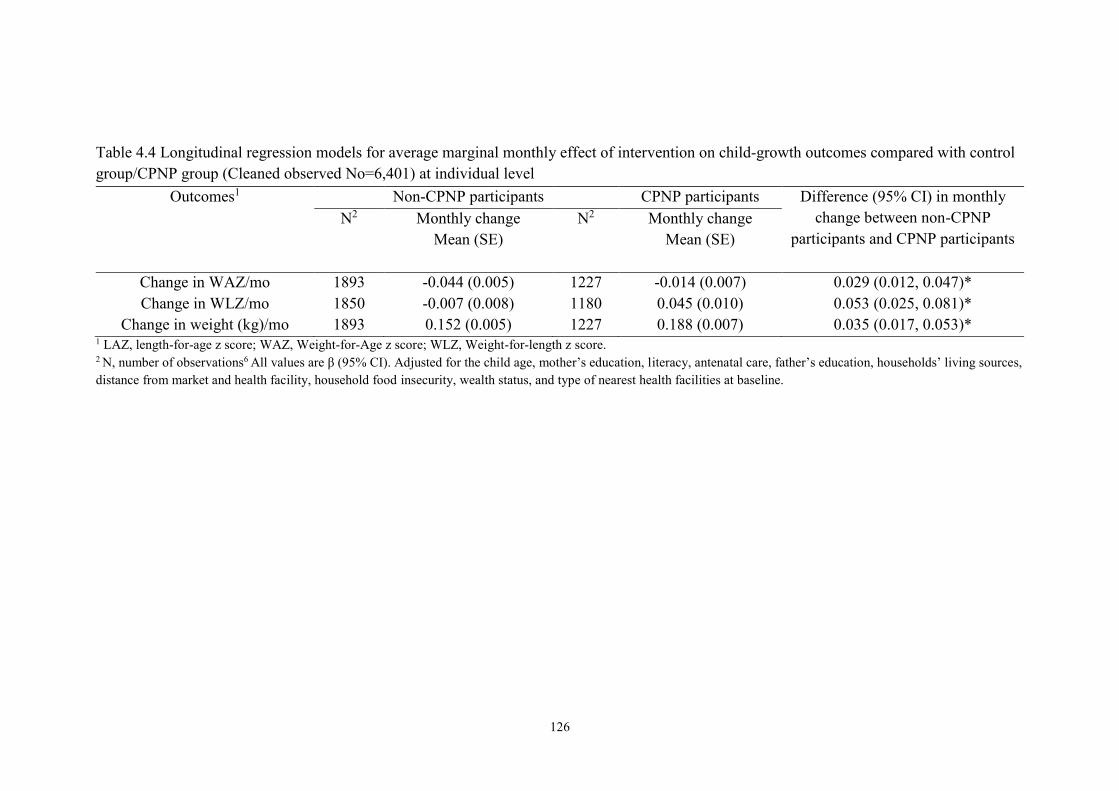
126
Table 4.4 Longitudinal regression models for average marginal monthly effect of intervention on child-growth outcomes compared with control
group/CPNP group (Cleaned observed No=6,401) at individual level
1 LAZ, length-for-age z score; WAZ, Weight-for-Age z score; WLZ, Weight-for-length z score.
2 N, number of observations6 All values are β (95% CI). Adjusted for the child age, mother’s education, literacy, antenatal care, father’s education, households’ living sources,
distance from market and health facility, household food insecurity, wealth status, and type of nearest health facilities at baseline.
Outcomes1 Non-CPNP participants CPNP participants Difference (95% CI) in monthly
change between non-CPNP
participants and CPNP participants
N2 Monthly change
Mean (SE)
N2 Monthly change
Mean (SE)
Change in WAZ/mo 1893 -0.044 (0.005) 1227 -0.014 (0.007) 0.029 (0.012, 0.047)*
Change in WLZ/mo 1850 -0.007 (0.008) 1180 0.045 (0.010) 0.053 (0.025, 0.081)*
Change in weight (kg)/mo 1893 0.152 (0.005) 1227 0.188 (0.007) 0.035 (0.017, 0.053)*
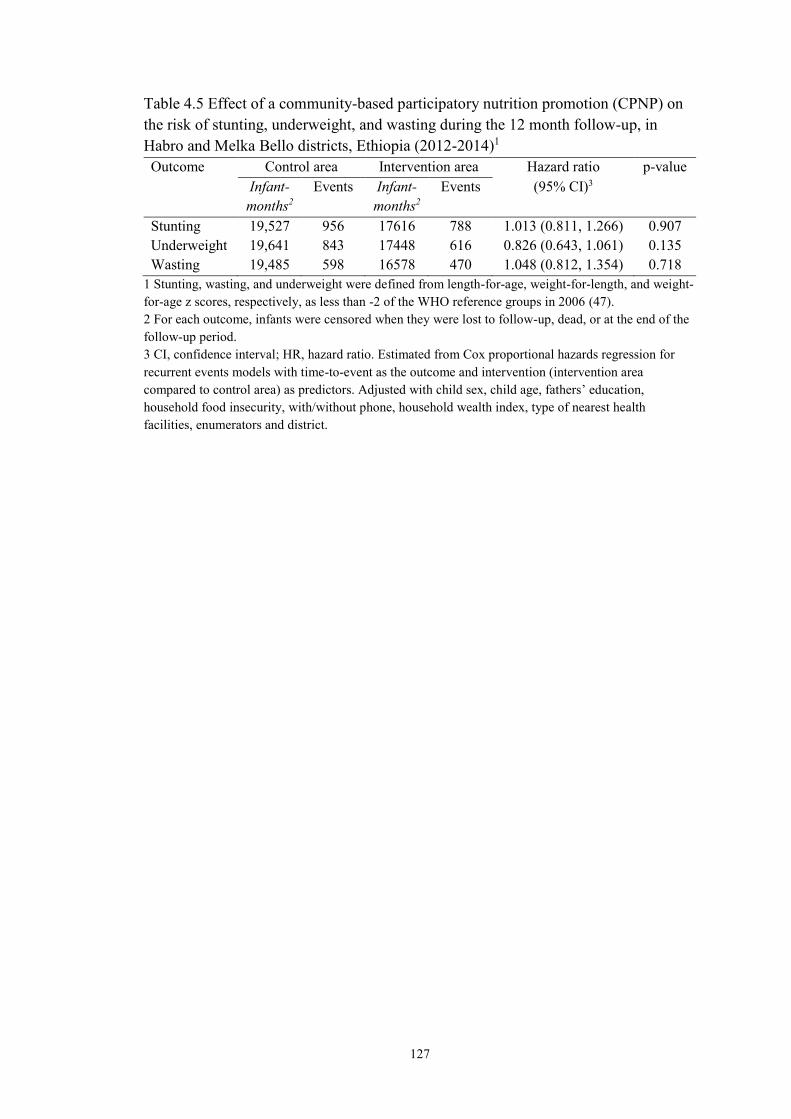
127
Table 4.5 Effect of a community-based participatory nutrition promotion (CPNP) on
the risk of stunting, underweight, and wasting during the 12 month follow-up, in
Habro and Melka Bello districts, Ethiopia (2012-2014)1
Outcome Control area Intervention area Hazard ratio p-value
Infant-
months2
Events Infant-
months2
Events (95% CI)3
Stunting 19,527 956 17616 788 1.013 (0.811, 1.266) 0.907
Underweight 19,641 843 17448 616 0.826 (0.643, 1.061) 0.135
Wasting 19,485 598 16578 470 1.048 (0.812, 1.354) 0.718
1 Stunting, wasting, and underweight were defined from length-for-age, weight-for-length, and weight-
for-age z scores, respectively, as less than -2 of the WHO reference groups in 2006 (47).
2 For each outcome, infants were censored when they were lost to follow-up, dead, or at the end of the
follow-up period.
3 CI, confidence interval; HR, hazard ratio. Estimated from Cox proportional hazards regression for
recurrent events models with time-to-event as the outcome and intervention (intervention area
compared to control area) as predictors. Adjusted with child sex, child age, fathers’ education,
household food insecurity, with/without phone, household wealth index, type of nearest health
facilities, enumerators and district.

128
Figure 4.4 Prevalence of stunting at visit 4 (9 month follow-up) and visit 5 (12 month
follow-up)1.
1 Stunting was defined from length-for-age z score as less than -2 of the WHO reference groups. 2 Groups were not different at baseline. *P < 0.05; Estimated from logistic regression for the outcome
and intervention (intervention area compared to control area). Adjusted with child sex, child age,
fathers’ education, household food insecurity, household wealth index, type of nearest health facilities,
enumerators and district at enrollment.
19.6 19.6
45.349.0
37.841.7
0
10
20
30
40
50
60
At visit4, 9 month follow-up At visit5, 12 month follow-up
Stu
nti
ng p
reval
ence
(%
)
Baseline (combined) Control area Intervention area
p = 0.037 p = 0.134

129
Appendix 4.1 Anthropometric measurements in control and intervention area over 12
month follow-up by visit1,2
Visit
No.
Control area Intervention area Difference (95%CI)
between control and
intervention area
p-
value* N mean SD N Mean SD
LAZ
Visit 1 612 -0.90 1.37 614 -0.87 1.41 -0.03 (-0.19, 0.12) 0.7028
Visit 2 703 -1.07 1.16 636 -1.16 1.33 0.09 (-0.05, 0.22) 0.1995
Visit 3 692 -1.57 1.08 647 -1.50 1.05 -0.07 (-0.19, 0.04) 0.2211
Visit 4 658 -1.94 1.09 630 -1.72 0.98 -0.22 (-0.34, -0.11) 0.0001
Visit 5 612 -1.98 1.05 513 -1.88 0.90 -0.10 (-0.22, 0.02) 0.0933
WAZ2
Visit 1 735 -1.00 1.16 713 -1.00 1.21 0.00 (-0.12, 0.12) 0.9715
Visit 2 703 -1.10 1.07 630 -0.96 1.11 -0.14 (-0.26, -0.02) 0.0217
Visit 3 690 -1.41 1.09 646 -1.30 1.08 -0.11 (-0.23, 0.01) 0.0630
Visit 4 656 -1.63 1.12 630 -1.34 1.20 -0.30 (-0.42, -0.17) 0.000
Visit 5 624 -1.69 1.18 501 -1.42 1.17 -0.27 (-0.41,-0.13) 0.001
WLZ3
Visit 1 614 -0.62 1.41 612 -0.72 1.38 0.10 (-0.06, 0.26) 0.2130
Visit 2 703 -0.75 1.26 630 -0.50 1.27 -0.25 (-0.38, -0.11) 0.0040
Visit 3 690 -0.91 1.33 645 -0.82 1.29 -0.09 (-0.23, 0.05) 0.2110
Visit 4 656 -0.97 1.40 630 -0.73 1.53 -0.24 (-0.40, -0.08) 0.0034
Visit 5 612 -1.03 1.62 513 -0.35 1.96 -0.68 (-0.89, -0.47) 0.0000
Length (cm)
Visit 1 620 68.32 3.66 614 68.51 3.60 -0.19 (-0.59, 0.22) 0.3605
Visit 2 703 71.78 3.07 636 71.75 3.24 0.03 (-0.31, 0.37) 0.8751
Visit 3 692 73.82 3.15 647 74.15 2.66 -0.32 (-0.64,-0.01) 0.0427
Visit 4 658 75.73 3.30 630 76.51 2.61 -0.77 (-1.10, -0.45) 0.0000
Visit 5 612 78.25 3.25 513 78.63 2.46 -0.38 (-0.73, -0.04) 0.0289
Weight (kg)
Visit 1 735 7.58 1.12 713 7.62 1.20 -0.04 (-0.16, 0.08) 0.4853
Visit 2 703 8.18 1.03 630 8.36 1.14 -0.18 (-0.30, -0.07) 0.0021
Visit 3 690 8.47 1.08 646 8.61 1.10 -0.14 (-0.26, -0.02) 0.0191
Visit 4 656 8.78 1.15 630 9.14 1.29 -0.36 (-0.49, -0.22) 0.000
Visit 5 624 9.25 1.25 501 9.58 1.29 -0.33 (-0.48, -0.18) 0.000 1 Every visit was 3 month apart.
2 LAZ, Length-for-Age Z score; WAZ, Weight-for-Age Z score; WLZ, Weight-for-Length Z score. *p-values were calculated by linear regression analysis (unadjusted).
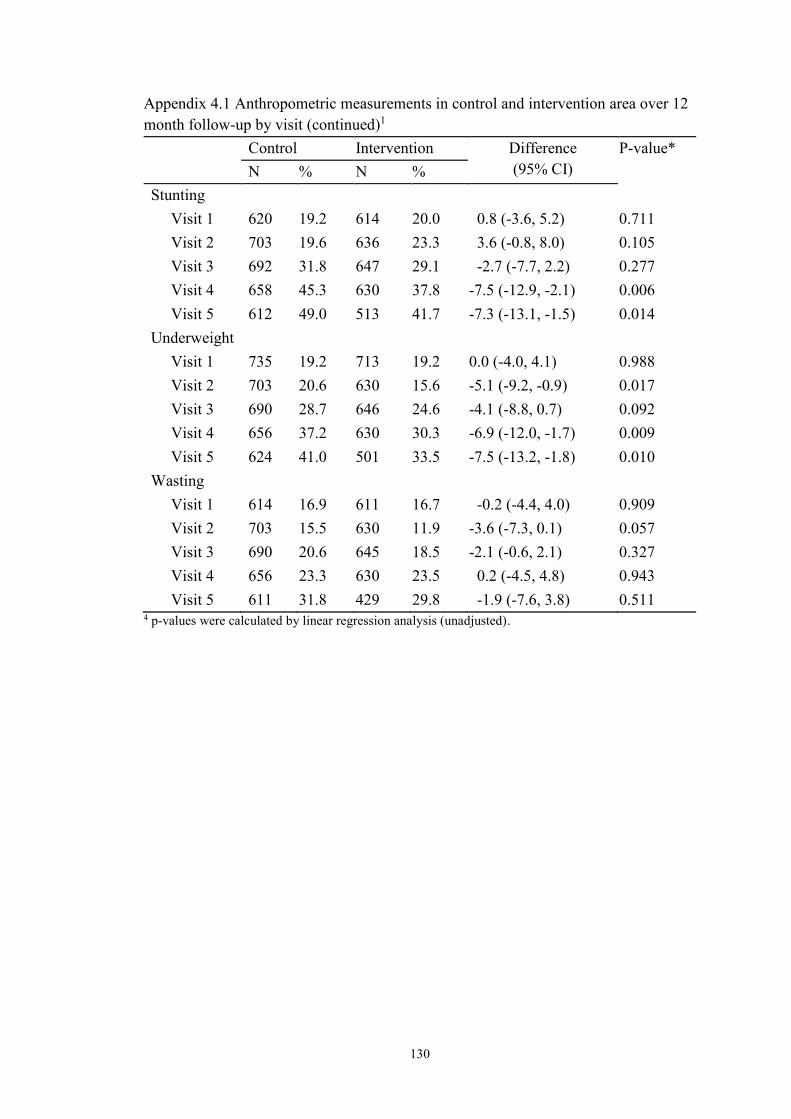
130
Appendix 4.1 Anthropometric measurements in control and intervention area over 12
month follow-up by visit (continued)1
Control Intervention Difference
(95% CI)
P-value*
N % N %
Stunting
Visit 1 620 19.2 614 20.0 0.8 (-3.6, 5.2) 0.711
Visit 2 703 19.6 636 23.3 3.6 (-0.8, 8.0) 0.105
Visit 3 692 31.8 647 29.1 -2.7 (-7.7, 2.2) 0.277
Visit 4 658 45.3 630 37.8 -7.5 (-12.9, -2.1) 0.006
Visit 5 612 49.0 513 41.7 -7.3 (-13.1, -1.5) 0.014
Underweight
Visit 1 735 19.2 713 19.2 0.0 (-4.0, 4.1) 0.988
Visit 2 703 20.6 630 15.6 -5.1 (-9.2, -0.9) 0.017
Visit 3 690 28.7 646 24.6 -4.1 (-8.8, 0.7) 0.092
Visit 4 656 37.2 630 30.3 -6.9 (-12.0, -1.7) 0.009
Visit 5 624 41.0 501 33.5 -7.5 (-13.2, -1.8) 0.010
Wasting
Visit 1 614 16.9 611 16.7 -0.2 (-4.4, 4.0) 0.909
Visit 2 703 15.5 630 11.9 -3.6 (-7.3, 0.1) 0.057
Visit 3 690 20.6 645 18.5 -2.1 (-0.6, 2.1) 0.327
Visit 4 656 23.3 630 23.5 0.2 (-4.5, 4.8) 0.943
Visit 5 611 31.8 429 29.8 -1.9 (-7.6, 3.8) 0.511 4 p-values were calculated by linear regression analysis (unadjusted).
131
REFERENCES
1. Victora CG, Adair L, Fall C, Hallal PC, Martorell R, Richter L, et al. Maternal and
child undernutrition: Consequences for adult health and human capital. Lancet. 2008
Jan 26;371(9609):340-57.
2. Global targets indicators: What is measured gets done [Internet].; 2014 [].
Available from: http://www.who.int/nutrition/
3. Bhutta ZA, Das JK, Rizvi A, Gaffey MF, Walker N, Horton S, et al. Evidence-
based interventions for improvement of maternal and child nutrition: What can be
done and at what cost? Lancet. 2013 Aug 3;382(9890):452-77.
4. Central Statistical Agency [Ethiopia] and ICF International. Ethiopia demographic
and health survey 2011. Addis Ababa, Ethiopia and Calverton, Maryland, USA:
Central Statistical Agency and ICF International.; 2012.
5. Umeta M, West CE, Verhoef H, Haidar J, Hautvast JG. Factors associated with
stunting in infants aged 5-11 months in the Dodota-sire district, rural Ethiopia. J Nutr.
2003 Apr;133(4):1064-9.
6. Horii N, Guyon AB, Quinn VJ. Determinants of delayed initiation of breastfeeding
in rural Ethiopia: Programmatic implications. Food Nutr Bull. 2011 Jun;32(2):94-102.
7. Setegn T, Gerbaba M, Belachew T. Determinants of timely initiation of
breastfeeding among mothers in Goba Woreda, south east Ethiopia: A cross sectional
study. BMC Public Health. 2011 Apr 8;11:217.
8. Gibson RS, Abebe Y, Hambidge KM, Arbide I, Teshome A, Stoecker BJ.
Inadequate feeding practices and impaired growth among children from subsistence
farming households in Sidama, southern Ethiopia. Matern Child Nutr. 2009
Jul;5(3):260-75.
9. Haidar J, Abate G, Kogi-Makau W, Sorensen P. Risk factors for child under-
nutrition with a human rights edge in rural villages of north Wollo, Ethiopia. East Afr
Med J. 2005 Dec;82(12):625-30.
10. Haidar J, Kogi-Makau W. Gender differences in the household-headship and
nutritional status of pre-school children. East Afr Med J. 2009 Feb;86(2):69-73.
11. Regassa N. Antenatal and postnatal care service utilization in southern Ethiopia: A
population-based study. Afr Health Sci. 2011 Sep;11(3):390-7.
12. Demissie T, Ali A, Mekonnen Y, Haider J, Umeta M. Demographic and health-
related risk factors of subclinical vitamin A deficiency in Ethiopia. J Health Popul
Nutr. 2009 Oct;27(5):666-73.
13. Egata G, Berhane Y, Worku A. Predictors of acute undernutrition among children
aged 6 to 36 months in east rural Ethiopia: A community based nested case - control
study. BMC Pediatr. 2014 Apr 4;14:91,2431-14-91.
132
14. Ali D, Saha KK, Nguyen PH, Diressie MT, Ruel MT, Menon P, et al. Household
food insecurity is associated with higher child undernutrition in Bangladesh, Ethiopia,
and Vietnam, but the effect is not mediated by child dietary diversity. J Nutr. 2013
Dec;143(12):2015-21.
15. Lassi ZS, Das JK, Zahid G, Imdad A, Bhutta ZA. Impact of education and
provision of complementary feeding on growth and morbidity in children less than 2
years of age in developing countries: A systematic review. BMC Public Health.
2013;13 Suppl 3:S13,2458-13-S3-S13. Epub 2013 Sep 17.
16. Imdad A, Yakoob MY, Bhutta ZA. Impact of maternal education about
complementary feeding and provision of complementary foods on child growth in
developing countries. BMC Public Health. 2011 Apr 13;11 Suppl 3:S25.
17. Penny ME, Creed-Kanashiro HM, Robert RC, Narro MR, Caulfield LE, Black
RE. Effectiveness of an educational intervention delivered through the health services
to improve nutrition in young children: A cluster-randomised controlled trial. Lancet.
2005 May 28-Jun 3;365(9474):1863-72.
18. Shi L, Zhang J, Wang Y, Caulfield LE, Guyer B. Effectiveness of an educational
intervention on complementary feeding practices and growth in rural china: A cluster
randomised controlled trial. Public Health Nutr. 2010 Apr;13(4):556-65.
19. Zhang J, Shi L, Chen DF, Wang J, Wang Y. Effectiveness of an educational
intervention to improve child feeding practices and growth in rural China: Updated
results at 18 months of age. Matern Child Nutr. 2013 Jan;9(1):118-29.
20. Guldan GS, Fan HC, Ma X, Ni ZZ, Xiang X, Tang MZ. Culturally appropriate
nutrition education improves infant feeding and growth in rural Sichuan, China. J
Nutr. 2000 May;130(5):1204-11.
21. Vazir S, Engle P, Balakrishna N, Griffiths PL, Johnson SL, Creed-Kanashiro H, et
al. Cluster-randomized trial on complementary and responsive feeding education to
caregivers found improved dietary intake, growth and development among rural
Indian toddlers. Matern Child Nutr. 2012 May 24.
22. Roy SK, Jolly SP, Shafique S, Fuchs GJ, Mahmud Z, Chakraborty B, et al.
Prevention of malnutrition among young children in rural Bangladesh by a food-
health-care educational intervention: A randomized, controlled trial. Food Nutr Bull.
2007 Dec;28(4):375-83.
23. Zaman S, Ashraf RN, Martines J. Training in complementary feeding counselling
of healthcare workers and its influence on maternal behaviours and child growth: A
cluster-randomized controlled trial in Lahore, Pakistan. J Health Popul Nutr. 2008
Jun;26(2):210-22.
24. Government of the Federal Democratic Republic of Ethiopia National. National
nutrition Programme June 2013 – June 2015.
133
25. FANTA. Review of incorporation of essential nutrition actions into public health
programs in Ethiopia. 2008.
26. USAID. End-line household survey results. southern nations, nationalities, and
people region. Essential service for health in Ethiopia/US agency for international
development: Addis Ababa. 2008.
27. Deconinck H, Swindale A, Grant F, Navarro-Colorado C. Review of community-
based management of acute malnutrition (CMAM) in the post-emergency context:
Synthesis of lessons on integration of CMAM into national health systems.
Washington, DC: FANTA Project, FHI 360; 2008.
28. Save the children. Ethiopia national nutrition strategy; review and analysis of
progress and gaps: One year on may 2009. 2009.
29. Lenters LM, Wazny K, Webb P, Ahmed T, Bhutta ZA. Treatment of severe and
moderate acute malnutrition in low- and middle-income settings: A systematic
review, meta-analysis and delphi process. BMC Public Health. 2013;13 Suppl
3:S23,2458-13-S3-S23. Epub 2013 Sep 17.
30. UNICEF. Evaluation of integreated managment of actue malnutrition (IMAM):
Kenya country case study. New York: United Nations Children’s Fund; 2012.
31. UNICEF. Evaluation of community management of acte malnutrition (CMAM):
Global synthesis report. New York: United Nations Children’s Fund; 2012.
32. Zeitlin M, Ghassemi H, Mansour M. Positive deviance in child nutrition: With
emphasis on psychosocial and behavioral aspects and implications for development.
the United Nations University, Tokyo. available at:
http://unu.edu/unupress/unupbooks/80697e/80697E00.htm [accessed 19 december
2010. 1990.
33. de Onis M, Garza C, Victora CG, Bhan MK, Norum KR. The WHO multicentre
growth reference study (MGRS): Rationale, planning, and implementation. Food and
Nutrition Bulletin. 2004;25(supplement 1):S3-S84.
34. Population census commisson. The 2007 population and housing census of
Ethiopia: Statistical report for Oromiya Region; part V: Population size of kebeles.
2008.
35. World Vision Ethiopia. Habro area development program. FY 2012 detailed
implementation plan (implementation period: October 2011 – September 2012).
Addis Ababa, Ethiopia: 2011.
36. World Vision Ethiopia. Melka bello area development program. FY 2012 detailed
implementation plan (implementation period:October 2011 – September 2012). Addis
Ababa, Ethiopia: 2011.

134
37. Bhutta ZA, Ahmed T, Black RE, Cousens S, Dewey K, Giugliani E, et al. What
works? interventions for maternal and child undernutrition and survival. Lancet. 2008
Feb 2;371(9610):417-40.
38. Dupont WD, Plummer WD,Jr. Power and sample size calculations for studies
involving linear regression. Control Clin Trials. 1998 Dec;19(6):589-601.
39. Fenn B, Morris SS, Frost C. Do childhood growth indicators in developing
countries cluster? implications for intervention strategies. Public Health Nutr. 2004
Oct;7(7):829-34.
40. WVI Nutrition Centre of Expertise. Training of positive deviance/hearth volunteer
(curriculum). 2011.
41. World Vision International Nutrition Centre of Expertise. Training of master
trainers for positive deviance/hearth. 2011.
42. LINKAGES. ENA Counsellor’s guide. Using the essential nutrition actions to
improve the nutrition of women and children in Ethiopia, including under situations
of emergencies and HIV & AIDS 2005.
43. Valid International. Community-based therapeutic care (CTC): Field manual. .
First Edition, 2006.
44. Cogill B. Anthropometric indicators measurement guide. revised edition.
Washington, D.C: Academy for Educational Development, Food and Nutrition
Technical Assistance Project; 2003. Report No.: USAID Cooperative Agreement No.
HRN-A-00-98-00046-00.
45. Food and Nutrition Technical Assistance Project (FANTA). Household food
insecurity access scale (HFIAS) for measurement of food access: Indicator guide.
August 2007.
46. De Silva MJ, Harpham T. Maternal social capital and child nutritional status in
four developing countries. Health Place. 2007 Jun;13(2):341-55.
47. WHO Multicentre Growth Reference Study Group. WHO child growth standards
based on length/height, weight and age. Acta Paediatr Suppl. 2006 Apr;450:76-85.
48. Cleveland WS, Devlin SJ. Locally weighted regression—an approach to
regression-analysis by local fitting. J Am Stat Assoc. 1988;83:596-610.
49. Twisk JW, Smidt N, de Vente W. Applied analysis of recurrent events: A practical
overview. J Epidemiol Community Health. 2005 Aug;59(8):706-10.
50. Bolles K, Speraw C, Berggren G, Lafontant JG. Ti foyer (hearth) community-
based nutrition activities informed by the positive deviance approach in Leogane,
Haiti: A programmatic description. Food Nutr Bull. 2002 Dec;23(4 Suppl):11-7.
135
51. Caulfield L, Huffman S, Piwoz E. Interventions to improve intake of
complementary foods by infants 6 to 12 months of age in developing countries:
Impact on growth and on the prevalence of malnutrition and potential contribution to
child survival. Food and nutrition bulletin. 1999;20:183-200.
52. Kilaru A, Griffiths PL, Ganapathy S, Ghosh S. Community-based nutrition
education for improving infant growth in rural Karnataka. Indian Pediatr. 2005
May;42(5):425-32.
53. Schroeder DG, Pachon H, Dearden KA, Kwon CB, Ha TT, Lang TT, et al. An
integrated child nutrition intervention improved growth of younger, more
malnourished children in northern Vietnam. Food Nutr Bull. 2002 Dec;23(4
Suppl):53-61.
54. Pachon H, Schroeder DG, Marsh DR, Dearden KA, Ha TT, Lang TT. Effect of an
integrated child nutrition intervention on the complementary food intake of young
children in rural north Vietnam. Food Nutr Bull. 2002 Dec;23(4 Suppl):62-9.
55. Burkhalter BR, Northrup RS. Hearth program at the hoˆ pital albert schweitzer in
haiti. in: Hearth nutrition model: Applications in Haiti, Vietnam, and Bangladesh.
available at: http://pdf.usaid.gov/pdf_docs/ PNACA868.pdf. Arlington: the U.S.
Agency for International Development and World Relief Corporation by the Basic
Support for Institutionalizing Child Survival (BASICS) Project; 1997.
56. Rabe-Hesketh S, Skrondal A, editors. Multilevel and longitudinal modeling using
stata. 2nd ed. college station, TX: Stata press, 2008. .

136
CHAPTER 5. EFFECTIVENESS OF A COMMUNITY-BASED
PARTICIPATORY NUTRITION PROMOTION PROGRAM
IN IMPROVING CHILD FEEDING AND HYGIENE
AMONG CAREGIVERS IN RURAL EASTERN ETHIOPIA
5.1 ABSTRACT
Background: Appropriate complementary feeding and hygiene practices reduce child
stunting. Objectives: A community-based participatory nutrition promotion (CPNP)
program was designed and its effectiveness evaluated in the context of the ongoing
Essential Nutrition Action (ENA) and Community-based Management of Acute
Malnutrition (CMAM) programs on caregivers’ feeding and hygiene practices in two
rural districts in Ethiopia. Design & Methods: A cluster randomized trial was
conducted with 12 clusters; the CPNP was implemented in 6 intervention clusters,
while the existing programs of ENA and CMAM were carried out in all 12 clusters. A
total of 1,790 mothers with children 6 to 12 months of age who were randomly
selected from the study area were enrolled in this study. Using a 24-hour diet recall
questionnaire, mothers were asked about their infant and young child feeding (IYCF)
practices, such as currently breastfeeding, meal frequency, and dietary diversity, every
three months, and hand washing practices with soap and water every six months, for a
year follow-up. We scored the condition of child feeding and hygiene at each visit,
adjusting the scores based on three age groups: 6–8, 9–11, and 12–24 months, and
summed up the scores for all five visits (three visits for hand washing). The composite
feeding score1 was computed summing the scores of current breastfeeding, meal
frequency, and dietary diversity; the composite feeding score2 was computed
summing the scores of meal frequency and dietary diversity only. Results: A total of

137
1,199 mothers (67.0%) who completed the surveys all five times—629 in the control
area and 570 in the intervention area—were included in the data analyses. The first
survey was done four months after implementation of the CPNP in the intervention
area. We assessed the condition of the feeding and hygiene over the 12-month follow-
up. Mothers in the intervention area showed higher scores of meal frequency (diff:
1.02, 95% CI: 0.33, 1.70), composite feeding1 (diff: 1.30, 95% CI: 0.41, 2.19), and
composite feeding 2 (diff: 1.39, 95% CI: 0.48, 2.23) than mothers in the control area,
but there were no differences in the scores of current breastfeeding (diff: -0.08, 95%
CI: -0.22, 0.06), dietary diversity (diff: 0.38, 95% CI: -0.21, 0.98), and hand washing
(diff: 0.41, 95% CI: -0.21, 1.02) between mothers in the two areas. Conclusion: The
new nutrition program model was effective in improving meal frequency and
composite feeding practices but did not impact current breastfeeding or dietary
diversity in a rural Ethiopian context.
5.2 INTRODUCTION
Stunting affects 165 million children worldwide. Stunting in early childhood can have
life-long implications such as adverse effects on physical and cognitive development
in later childhood, poorer performance in school, and adverse reproductive health
outcomes in adulthood (1, 2). Optimal complementary feeding can ensure adequate
child growth by providing sufficient energy and balanced nutrients, and appropriate
hygiene practices may reduce the risk of stunting by decreasing the risk of diarrheal
morbidity and environmental enteropathy, a condition considered to be an important
cause of child stunting (3, 4). Either education alone regarding complementary
feeding or providing complementary foods with or without education has shown to
improve height-for-age z scores (HAZ) and weight-for-age z (WAZ) scores, and to
138
reduce undernutrition in both food secure and food insecure populations (5, 6). In this
sense, interventions based on behavior change communication (BCC) are promising
strategies to improve feeding and hygiene practices if they are appropriately
contextualized, affordable, and sustainable (7-10).
In Ethiopia, community-based nutrition programs—including the Essential
Nutrition Action (ENA) (11, 12) and the Community-Based Management of Acute
Malnutrition (CMAM) programs—have been available (13, 14). Nutrition counselling
volunteers in the ENA program may not have adequate knowledge about child
nutrition and appropriate counselling skills, and poor community health systems may
not able to do structured managing of their activities (15). The CMAM program
focuses primarily on treating wasting (with mid-upper arm circumference less than
11cm) and lacks caregivers counseling, which results in relapse in wasting (16). It has
been reported that as high as 60% to 70% of rehabilitated children from moderately or
severely wasted conditions in supplementary feeding programs relapse to wasted
status within a year (17).
Given this background, a new community-based participatory nutrition
promotion (CPNP) program was developed to address the identified weaknesses of
the ENA and CMAM programs. The CPNP, involving a two-week group nutrition
session, adapting program components of the Positive Deviant Hearth Program (18,
19), aimed to improve child nutritional status by promoting appropriate feeding and
hygiene of mothers, attempted to utilize locally affordable resources, and boost
community participation, and was expected to strengthen the existing community
health system.
This new approach of the CPNP was integrated with the existing ENA and
CMAM programs to design, implement and test a new package—the Ethiopia

139
Integrated Nutrition Project (EINP)—by World Vision Korea in collaboration with
World Vision Ethiopia and WITH (a Korea-based NGO) from January 2012 to
August 2013 in two districts of Ethiopia (Appendix A and B). The CPNP program
attempted to impact caregiver behaviors related to feeding and hygiene practices
through intensive group-based educational sessions and to ultimately improve child
nutritional status in the study area. An effectiveness evaluation study was undertaken
aimed at examining the impact of CPNP on child feeding and hygiene practices
among mothers with children 6 to 24 months of age, in addition to growth and
stunting as primary outcomes, compared to the practices of mothers living in the
control area where only the ENA and CMAM programs were being implemented.
Indicators of infant and young child feeding (IYCF) included current breastfeeding,
24-h meal frequency, and dietary diversity and a hygiene indicator of hand washing at
critical time points. We hypothesized that the child feeding and hygiene scores would
be higher among mothers in the intervention area compared to mothers in the control
area. We also examined whether the CPNP participants maintained better feeding and
hygiene practices over the 12-month follow-up compared to others in the community
who had not been exposed to the group educational sessions in the intervention area.
5.3 SUBJECTS AND METHODS
5.3.1 Study design
This study was conducted in the Habro and Melka Bello districts in rural eastern
Ethiopia. Both districts have predominantly Muslim communities belonging to the
Oromo tribe. The districts are largely agricultural, poor, with limited development,
and are frequently subject to long periods of drought.
140
We conducted a cluster randomized effectiveness trial to evaluate the CPNP
program. We created 12 geographical clusters—3 intervention and 3 control clusters
in each district—based on 49 Kebeles (the smallest administrative unit of Ethiopia).
The agricultural officers of the local government and World Vision agricultural
officers were asked to create pairs of clusters that they considered (qualitatively) to be
similar on agricultural and economic conditions within each district. Allocation of the
interventions was made by tossing a coin in front of community leaders and local
authorities. If a cluster was assigned to an intervention area, its paired cluster became
the control area. As a result, we had six control clusters and six intervention clusters.
Intervention allocation and implementation to the study area was not blinded to
community members by the nature of public nutrition education of the CPNP
program.
5.3.2 Subject selection
The study population consisted of mothers of children 6 to 12 months of age who
lived in the study area, regardless of their preceding participation in the implemented
programs of CPNP, CMAM and ENA. For the study, 2,064 child and mother pairs
(1,032 per group) were randomly selected from a roster of children 6-12 months of
age in the two districts. There was no available birth-registration system in the two
districts, so we kindly requested the district health offices to prepare a roster of
children 0-12 months of age who resided in the area. The roster was prepared with
support of Health Extension Workers (HEWs) and community volunteers, and each
child was given an identification number. Using the random number-generating table
of the Emergency Nutrition Assessment for SMART (2011 version), 2,064 children
were randomly selected, proportional to the population size of each cluster.

141
The sample size of 2,064 was determined, accepting a type I (α) error of 5%,
power at 0.80, cluster size at 172, lost to follow-up at 10%, standard deviation of 0.9 z
score, and intra-cluster correlation coefficient (ICC) at 0.054, to see a difference of
0.2 z score in the primary outcome of length-for-age z score (LAZ) (see details in
Chapter 4).
5.3.3 Interventions
In the control area, the ENA and CMAM programs were implemented, while all three
programs including CPNP were conducted. Detailed operation of the CPNP program
is described in Chapter 3. In brief, the CPNP program involved two-week group
nutrition sessions consisting of cooking demonstrations, feeding child, messages
discussions, singing, and practicing hand washing. The sessions were organized by 23
CPNP operators recruited from their Kebele and supervised by 9 supervisors, but all
materials and food ingredients were contributed voluntarily by participants. A total of
372 CPNP sessions were held, and 3,299 mothers attended CPNP sessions in the
intervention area (data not shown).
As part of the CMAM program, severely acute malnourished children with
mid-upper arm circumferences (MUAC) of less than 11.0 cm also received
Plumpy’Nut from nearby health centers/health posts; moderately acute malnourished
children with MUAC of 11-11.9 cm occasionally received corn-soy blend and
vegetable oil.
Although the ENA program was designed to conduct community volunteer-
led monthly nutrition counselling on breastfeeding and complementary feeding
practices for mothers with children under two years of age, there was a modification
in the service delivery platform early on during the program implementation period.
142
Due to the Ethiopian government’s adoption of new cadre of health workers called the
Health Development Army (HDA)f through a local community structure called one to
five networks engagement, where one women functioned as leader of the network and
five women operated as network members, into primary health care delivery and
support, the structure of the ENA counselling was modified to include group
information sharing. Because of the nature of the group nutrition education conducted
in various places in the communities, intervention allocations were not blinded to
study mothers, other community members in the control and intervention areas, or
data collecting enumerators.
Data collectors had no interaction with the project implementation team or
government health staff, but they knew which clusters had CPNP sessions through
contact with selected mothers at survey.
5.3.4 Data collection
The effectiveness study proposal and protocol were reviewed and approved by the
Oromia Regional Health Bureau in Ethiopia (Appendix F.1 and F.2).
Study mothers enrollment and the first data collection were done four months
after the CPNP sessions due to logistical limitations; thus, we were unable to collect
true baseline information prior to program implementation. Enrollment information
collected at visit1 was used to assess comparability between the two groups. Visit1
(the 1st data collection) was conducted from November 20, 2012, to February 19,
2013, and every three months, following data collection visits (visit2 to visit5) was
done; the last data collection (visit5) was conducted from November 20, 2013, to
February 19, 2014. The current study was prepared by a Memorandum of
f “a community level group of 30 households (women) organized in a “1 to 5” network of members,
where one women functions as leader of the network and five women operate as network members.”

143
Understanding (MOU) among World Vision Korea, Wholistic Interest Through
Health (WITH), and World Vision Ethiopia (Appendix A). The present trial was
funded by World Vision Korea (USD 100,000, project number E197814). This trial
was registered with Current Controlled Trials, ISRCTN 89206590.
Data collection was conducted by 18 data collectors who had completed at
least college education, were fluent in the local Afan Oromo language, and were
recruited from the study area. The data collectors were hired by World Vision
Ethiopia Habro and Melka Bello Area Development Program (ADPs) offices. Most of
them were male workers 20-25 years of age. The data collectors were trained with
structured questionnaires translated in the local language (Appendix C). The
questionnaires included generic questions about IYCF practices of the breastfed
children in accordance with WHO guidelines (20). Questions about household
demographic and socioeconomic information, dwelling conditions and household
assets, water source and sanitation facilities were used from the Caregiver Survey-
Modules (21). The Household Food Insecurity Access Scale (HFIAS) was used to
measure household food insecurity in the past 4 weeks (22); the main domains of the
HFIAS are (1) worry and anxiety, (2) insufficient food quality, and (3) insufficient
food intake. The nine questions of HFIAS were followed by frequency questions from
which the four levels of food insecurity were computed. Maternal social capital
questions were taken from the Short Social Capital Assessment Tool (SASCAT) to
capture structural and cognitive social capital of the selected mothers (23). The
questionnaires were modified for the local setting and context by study investigators,
and were pre-tested in a neighboring Kebele outside the study area. Upon obtaining
informed consent from mothers of children who were enrolled in the study, an
enrollment and first interview (visit1) was conducted by 18 data collectors, 9 per

144
district. Selected children and households were visited every three months, a total of
five times (visit1 to visit5) during the year.
Using a structured questionnaire for a 24-hour diet recall, mothers were asked
whether they were currently breastfeeding their child, how many times they had fed
the child in the past 24 hours (meal frequency), and what type of foods they had fed
the child in the past 24 hours using a list of food items (dietary diversity). Mothers
were asked whether they had washed their hands with water and soap in the past 24
hours at four critical time points: after the mother’s defecation, after cleaning the
child’s bottom, before preparing foods, and before feeding the child (hand washing).
The hand washing practice was evaluated at visit1, 3, and 5 only.
5.3.5 Development of scores of currently breastfeeding, meal frequency, dietary
diversity score (DDS), hand washing, and composite feeding.
The age-specific feeding and hygiene scoring system is described in Table 5.1. The
scores were defined separately for three age groups: 6–8, 9–11 and 12–24 months and
examined at each five visits, except for the hygiene score, which was examined across
three visits.
Current breastfeeding score: Current breastfeeding was defined as a mother
breastfeeding the child at the time of the visit. The score ranged between 0 and 2
before the age of 11 months and between 0 and 1 after the age of 12 months for each
child at each visit. The total score summed across five visits gave a possible range of
0-7.
145
Meal frequency score: Meal frequency was defined as the number of times the
infant/child was given meals other than breast milk in the past 24 hours. The meal
frequency for the child during the previous day was categorized into three scores by
specific age range (Table 5.1). The meal frequency score had a possible range of 0-2
for each child at each visit before 12 months of age and a range of 0-3 from 12
months of age. These scores were summed across five visits, giving a possible range
of 0-15.
Dietary diversity score (DDS): Dietary diversity was calculated on the basis of the
number of different food groups the infant consumed in the past 24 hours (24). At
each visit, mothers were asked whether they had fed a food item/food group to her
child using the following 15 food items groups: breast milk; formula; animal milk
(e.g., cow milk); any food made from grains (e.g., millet, sorghum, maize, rice, wheat,
teff, or ingera); any food made from pumpkins, carrots, red sweet potatoes, mango, or
papaya; any green leafy vegetables; any other fruits (bananas, tomatoes, apples, or
avocados); any liver, kidney, heart or other organ meats; any meat (e.g., beef, lamb,
goat, chicken or duck); any food made from legumes or nuts (e.g., peas, beans, lentils,
or peanuts); any food made with oil, fat or butter; eggs; fish; cheese or yoghurt; any
sugary foods (e.g., chocolates, sweets, candies, pastries, cakes or biscuits, or sugary
juice). During data analysis, these items were grouped into seven food groups as
follows: (1) grains, (2) legumes and nuts, (3) dairy foods such as animal milk,
formula, cheese and yogurt, (4) vitamin A rich fruits and vegetables, (5) green leafy
vegetables and other fruits, (6) flesh foods such as meat, poultry, and fish, and (7)
eggs. The sum of food groups consumed by the infant during the previous day was
categorized into three scores by specific age range (Table 5.1), giving a possible range

146
of 0-2 for DDS for each child at each visit. These scores were summed across five
visits, giving a possible range of 0-10.
Hand washing score: The hand washing score was calculated by summing up the
score of hand washing practice at visit1, 3, and 5. Hand washing practice was
assessed by asking whether the mother washed her hands with soap and water in the
past 24 hours at four critical points: after defecation, after cleaning the child’s bottom,
before preparing food, and before feeding the child. Washing their hands with soap
and water at 3-4 different points was scored 2; washing at 1-2 different points was
scored 1. If they never washed their hands with soap and water, mothers were scored
0. These scores were summed across visit1, 3, and 5, giving a possible range of 0-6.
Composite feeding score1 and 2: To represent multidimensional feeding practices of
interest, we constructed two types of composite feeding scores, adapting child feeding
indices proposed by Ruel and Menon (25). The composite feeding score1 included
indicators of current breastfeeding, meal frequency, and dietary diversity; the
composite feeding score2 involved indicators of meal frequency and dietary diversity
only. Those composite feeding scores were constructed by summing the scores of
meal frequency and dietary diversity, with or without currently breastfeeding
collected at each visit. These scores gave a possible range of 0-30 for the composite
feeding score1 and of 0-25 for the composite feeding score2 over the five visits.
5.3.6 Statistical Analysis
The enrollment characteristics of mothers and children in the control and intervention
areas were compared using linear (binary variables), logistic (binary variables), or

147
multinomial logistic (ordinal variables) regression analyses accounting for geographic
clustering.
Scores of current breastfeeding, meal frequency, dietary diversity, hand
washing and composite feeding 1 and 2 were computed by visit and summed to
present scores for the 12 months follow-up.
Bar graphs were used to plot unadjusted means (95% confidence interval, CI)
of scores of the above mentioned feeding and hygiene by visit. Unadjusted means
(95% CI) of above mentioned feeding and hygiene scores were compared using
Student t-test (1) between mothers in the control area and mothers in the intervention
area or (2) between non-CPNP participants and CPNP participants in the intervention
area.
Multilevel linear regression models were run to estimate the differences in
scores of breastfeeding, meal frequency, dietary diversity, hand washing, and
composite feeding scores1 and 2, over the 12-month follow-up, accounting for the
clustering effect and adjusting for differences in enrollment characteristics, such as
household food insecurity, fathers’ education, household wealth index, type of nearest
health facility, and district location. The difference in outcome scores was compared
as follows: (1) between children in the control area and children in the intervention
areas and (2) between CPNP participants and non-CPNP participants in the
intervention area. Significance of the intervention effect was tested at p < 0.05. Data
analysis was performed using Stata version 12.0 (Stata Corporation, College Station,
TX, USA).
148
5.4 RESULTS
Out of the 2,064 mothers/children randomly selected in the study area, 914 in the
control and 876 (n = 1,790, 86.7%) in the intervention areas were enrolled and
followed up every three months for a year (Figure 5.1). Exclusions were related to not
finding children/refusal to participate (n = 89 in intervention and n = 14 in control
area) or age criteria not being met (n = 67 in the intervention area and n = 104 in the
control area). Out of 1,790 children, study groups had no difference in the percentage
of being followed by visit; 86.8% (n = 1,553) were visited at visit2, 86.4% (n = 1,547)
at visit3, 83.9% (n = 1,501) at visit4, and 77.9% (n = 1,395) at visit5 (Figure 5.1).
Out of 1,790 enrolled mothers, 1,199 (67.0%) mothers—629 (68.8% of 914)
in the control area and 570 (65.1% of 876) in the intervention areas—were completely
followed up from visit1 to visit5, and comprised a complete longitudinal dataset of
child feeding and hygiene analyses (Figure 5.1). Compared to the mothers (n = 1,199)
included in the analysis, those lost to follow-up (n = 591) had significantly greater
radio possession (36.2% vs. 26.1%, p = 0.01), more living without latrines (18.4% vs.
26.1%, p = 0.002), and included severely food insecure groups (36.0% vs. 18.5%, p <
0.001) (data not shown).
The enrollment characteristics did not differ by intervention group regarding
child age, sex, household assets, water and sanitation facilities, and social capital
adjusted for clustering effect (see Table 4.1 in Chapter 4); however, in the
intervention area, more fathers had primary school education (48.6% vs. 37.8%, p =
0.04), and fewer households showed severe household food insecurity (12.4% vs.
34.7%, p = 0.001), used clinic/hospital (14.4 % vs. 1.0%, p < 0.001), compared to the
control area. Household wealth status was marginally better in the intervention area.
The mean (SD) age of mothers was 26.1 (5.4) years and 82.3% of mothers were

149
illiterate in the control and intervention areas. The mean (SD) age of children was 8.7
(1.9) in the intervention area and 8.8 (1.9) in the control area. The mean age of the
child increased by 3 months at each visit such that the mean (SD) age at visit5 was
20.7 (1.9) and 20.8 (1.9) in the two areas, respectively.
Data are presented by visit (Figure 5.2). At visit1, the mean (SD) current
breast-feeding scores for all was 1.89 (0.32), which was the highest score, showing
that almost all children were breastfed. Since then, the current breastfeeding scores
decreased over time (Figure 5.2.A), mainly because of the reduced score range of 0-1
after 12 months of age compared to the score range of 0-2 before 12 months of age.
The mean (SD) current breastfeeding score slightly but continuously decreased by
visit5 at 0.93 ± 0.26 (Appendix 5.1.A). For our study mothers/children, the mean (SD)
meal frequency score was highest at 1.80 (0.67) at visit1, decreased by visit 2, and
persisted by visit5; 1.39 (0.84) at visit3, 1.32 (0.75) at visit4, and 1.40 (0.80) at visit5
(Appendix 5.1.A). Specifically, the unadjusted difference in meal frequency score was
largest -0.44 (95% CI: -0.54, -0.34, p < 0.001 tested by Student’s t-test) among
mothers in the intervention area at visit2, but its difference reduced by -0.10 (95% CI:
-0.19, -0.00) at visit5. The dietary diversity score increased over time (Figure 5.2.C).
The mean (SD) dietary diversity score for all increased up to 1.43 (0.73) at visit5,
from 0.70 (0.85) at visit1 (Appendix 5.1.A). With unknown reasons, the unadjusted
mean dietary diversity score was higher at visit2 (diff: 0.11, 95% CI: 0.02, 0.20, p =
0.015) and visit 3 (diff: 0.16, 95% CI: 0.07, 0.25, p = 0.0009) among mothers in the
control area compared to mothers in the intervention area. The mean (SD) of hand
washing score lingered over a year: 0.99 (0.89) at visit1 and 0.93 (0.81) at visit 5.
The mean (SD) composite feeding score1 was highest at 4.40 (1.09) at visit1,
became lowest at 3.20 (1.11) at visit3, and increased again over the next visits, while

150
composite feeding score2, which removed the scores of current breastfeeding from
composite feeding1, increased over time and presented the highest scores [Mean
(SD): 3.77 ± 1.15] at visit5. At each visit, the differences in mean composite feeding
score1 between control and intervention group was almost equal to the differences in
mean composite feeding score2 between these groups (Appendix 5.1.B). Thus, the
difference in the two composite feeding scores was mainly attributed to scores of
meal frequency and dietary diversity. The hand washing score differed by group in
visit1, but the difference in mean scores decreased from -0.29 (95% CI: -0.38, -0.29, p
< 0.001 tested by Student’s t-test) at visit 1 to 0.01 (95% CI: -0.07, 0.10, p = 0.7577)
at visit5 (Appendix 5.1.C).
Mothers in the intervention area were found to feed their children significantly
more often and practice better child feeding behaviors than their counterparts in the
control area over the 12-month follow-up with regard to meal frequency (diff: 1.02,
95% CI: 0.33, 1.70), composite feeding score1 (diff: 1.30, 95% CI: 0.41, 2.19) and
composite feeding score2 (diff: 1.39, 95% CI: 0.48, 2.23) (Table 5.2). There were no
differences in scores of current breastfeeding (diff: -0.08, 95% CI: -0.22, 0.06),
dietary diversity (diff: 0.38, 95% CI: -0.21, 0.98), and hand washing (diff: 0.41, 95%
CI: -0.21, 1.02) between mothers in these two areas.
The involvement of CPNP participants in the analyses became greater over
time as follows: 92 (16.1%) out of 570 mothers in the intervention area were at visit1,
164 (28.8%) were at visit2, 194 (34.0%) were at visit3, and 232 (40.7%) were at visit4
and 5. The CPNP program was phased out at the beginning of visit4, so there were no
additional participants at visit5. At none of the five visits, the mean scores of current
breastfeeding had no difference between non-CPNP participants and CPNP
participants (Appendix 5.2.A and Figure 5.3). The largest difference in dietary

151
diversity score between non-participants and CPNP participants presented at visit3
(diff: 0.27, 95% CI: 0.12, 0.41), but reduced onward. Composite feeding score1 and
composite feeding score2 were higher among CPNP participants at each visit except
for visit 1 (p < 0.05 tested by Student t-test) (Appendix 5.2.B). The difference in these
two composite feeding scores increased by visit4; 0.44 (95% CI: 0.24, 0.64) for
composite feeding score1 and 0.43 (95% CI: 0.23, 0.63) for composite feeding score2,
but decreased by visit5 (Figure 5.3.D and 5.3.E). The mean of hand washing score of
CPNP participants was not different from CPNP participants (Appendix 5.2.C).
Using mixed effect linear regression models and adjusting for clustering and
differences in enrollment characteristics, none of the child feeding and hygiene scores
were significantly different between non-participants and CPNP participants
specifically regarding the scores of breastfeeding (diff: 0.09, 95% CI: -0.01, 0.18),
meal frequency (diff: 0.24, 95% CI: -0.11, 0.60); dietary diversity (diff: 0.04, 95% CI:
-0.28, 0.35), composite feeding score1 (diff: 0.40, 95% CI: -0.09, 0.88), composite
feeding score2 (diff: 0.30, 95% CI: -0.17, 0.77), or hand washing (diff: 0.12, 95% CI:
-0.13, 0.37) (Table 5.3).
5.5 DISCUSSION
The CPNP—a new model of a community-based nutrition program—was added to
the ongoing ENA and CMAM programs, and improved some child feeding practices
in rural eastern Ethiopia. Using summary scores, we evaluated child feeding and
hygiene practices for one year among mothers of children 6 to 24 months of age in
intervention vs. control areas and CPNP participants vs. non-participants in the
intervention area. Two types of composite child feeding scores and the individual
meal frequency score were significantly higher among mothers in the intervention

152
area than in the control area, but we found no significant difference in breastfeeding,
dietary diversity, or hand washing scores between the two groups. CPNP participants
did not show better feeding scores than non-participants, when adjusting clusters and
enrollment characteristics, suggesting that practices were widely adopted across the
community.
It was likely that the CPNP program resulted in a positive influence on
increasing meal frequency and improving overall child feeding practices, but not on
breastfeeding. The program impact was even indicated among CPNP participants at
visit1 for dietary diversity and visit2 for meal frequency and composite feeding
(unadjusted). Given that implementation of the CPNP program preceded the first data
collection by four months, the impact of the CPNP program on feeding behaviors was
already apparent, influencing some feeding behaviors of neighboring mothers in the
same intervention area.
In our study area, 92% of mothers were found to keep breastfeeding their
children at 18-24 months of age. This proportion turned out to be higher compared to
the 96% of mothers who continued breastfeeding at one year and the 82% who
continued breastfeeding at two years from the Ethiopia Demographic Health Survey
(26). The mean (SD) of meal frequency score of 1.40 (0.80) at visit5 corresponds to 3-
4 times of complementary feeding per day. WHO defines minimum meal frequency
as receiving solid or semi-solid food at least twice a day for infants 6-8 months of age
and at least three times a day for children 9-23 months of age (27). No information
about energy density (kcal/g) was available in this study area; thus, although children
in the study area on average met the WHO guidelines of meal frequency, further study
is warranted—considering energy density of local foods—regarding the
appropriateness of this meal frequency (28). The decrease in meal frequency score

153
over visits would be related to the caregivers’ reduced concern when the child gets
older. This is also supported in part by a case in Vietnam, where mothers used the
intended franchise service less often as the children grew (29). The dietary diversity
score increased over time as children could consume more diverse family foods. In
our study setting, consumption of diverse foods was likely to be better than that of the
country average. The mean (SD) score of dietary diversity was 1.43 (0.73) at visit 5,
which corresponds to the 3-4 food group consumption for children 18-24 months of
age. In Ethiopia, consumption of 4 or more food groups was only 7.6% among
children 18 to 23 months of age (26). The hand washing score at 0.93 (0.81) could be
interpreted as using soap and water at 1-2 out of the critical four time points.
At each visit, CPNP participants showed higher meal frequency, dietary
diversity, composite feeding score1 and 2 than non-CPNP participants before
adjustment for the enrollment difference and clustering effect. However, when
summed as a year scores and adjusted with enrollment characteristics such as
household food insecurity, fathers’ education, nearest health facilities, and clustering
effect, none of these differences were significantly different. This adjustment
procedure counterbalanced the absolute difference between non-CPNP and CPNP
groups.
At visit3, differences in scores of dietary diversity, meal frequency, and
composite feeding decreased between the control and intervention areas. This may be
associated with seasonality as this marked the start of the rainy season when food
shortages increased. Against our expectations, the one-year dietary diversity score did
not show a significant difference between the control and intervention areas. Higher
dietary diversity scores in the control area at visit2 and visit3 were related to this non-

154
significant difference in the one-year dietary diversity scores between control and
intervention areas.
Over time the percentage of CPNP participants in the intervention area
increased from 16.1% at visit1 to 40.7% at visit4; however, the increase in the
proportion of CPNP participants did not translate into bigger differences in scores
between the control and intervention groups over time, but the differences in these
feeding scores generally continued by visit4.
Interestingly, the differences in the scores between control and intervention
areas turned out to be reduced at the last visit. We suggest two latent factors as
possible reasons for this decrease in score differences at the last visit: (1) a weakened
program impact after the phase-out (at visit4) of CPNP in the intervention area and (2)
increased communication about feeding messages of CPNP sessions between the
control and intervention areas. Since the borders of the control and intervention areas
were not apart, mothers in the control area might have had opportunities to get
information of CPNP lessons either from the participants or community members in
the intervention area. Anecdotally, mothers in the control area reported seeing the
CPNP participants.
The finding of no difference in the currently breastfeeding mothers between
the two areas was reasonable, considering that the programmatic nature of the CPNP
placed more emphasis on complementary feeding after exclusively breastfeeding and
because information of breastfeeding practice was given from other sources such as
the ENA, which was present in both areas. Our survey did not involve the quality of
breastfeeding such as daily breastfeeding frequency or amount of breast milk.
Contrary to our expectations, the difference in hand washing scores between
the two trial groups was mostly attributed to non-participants in the intervention area,
155
but the levels of hand washing scores were similar at visit5. It would be implausible
that non-participants had better knowledge regarding appropriate hand washing
practices. In a Kebele, mothers were exposed to hygiene information through the
Health Extension Program in Ethiopia, and knowledge of hand washing with soap
were prevalent and equal for all mothers in a Kebele unit. Rather, CPNP mothers
might have had more caution in practicing hand washing and may have been more
sensible when they truly washed their hands. Still, what contributed to the better hand
washing practices among non-CPNP mothers in the intervention area remains
inconclusive.
Overall, a few randomized trials of interventions involving group nutrition
education or counselling showed promising impact on complementary feeding
practices (8, 10, 30-34). Since such interventions were designed based on specific
contexts and the child feeding messages and communication channels were
contextualized, it would be inappropriate to consider these complex interventions to
be the same. In food secure contexts, nutrition education or counselling was delivered
by health care providers who belonged to health centers (8, 10). Enhancing specific
types of food consumption such as animal foods was possible in these settings. In
Peru, children in an intervention area had more energy intake from complementary
foods, consumed more animal foods, iron and zinc (8). Prevalence of stunting
decreased, but feeding practices based on 24-hour diet recall did not show significant
differences between the two groups. In a study in China, the intervention improved
the percentage of consumption of meat, beans, and yellow and orange colored foods
(10).
In contrast, in food insecure settings in South Asia, paraprofessional
community workers or peer mothers were often recruited, trained, and played a role of
156
delivering nutrition education to community caregivers (30, 31). In South Asia,
complementary feeding education trials increased energy intakes from complementary
foods or daily feeding frequency among intervened children (31, 32, 34). In a
randomized controlled trial (RCT) in Bangladesh, the intervention group that received
weekly nutrition education for 6 months at community nutrition centers improved
complementary feeding frequency and increased use of nutritious food (khichuri)
(33). In a longitudinal prospective RCT in Vietnam, the Hearth program based on the
theory of positive deviance increased breastfeeding frequency and the amount of food
consumption per day more for the intervention group than for the comparison children
at month 12 (30). Our study is an extension of these feeding trials and showed
consistent results with these studies such as improved meal frequency and composite
child feeding practices.
Child feeding indices (CFIs) designed to examine comprehensive feeding
practices and their associations with child growth and energy and micronutrient intake
were examined in a few African and Asian countries including Ethiopia (25, 35-38).
In general, five types of indicators—breastfeeding, dietary diversity based on 7-8 food
groups in the past 24 hours, meal frequency, bottle feeding, and food group frequency
in the past week—have been used to construct these indices (25). Our study used only
three of these indicators: breastfeeding, meal frequency, and dietary diversity based
on 24-hour recall. Bottle feeding was not appropriate to be measured in the study
settings, even though the prevalence of bottle use (11%) was considerable in Ethiopia
(26). Notably few studies of longitudinal child feeding indices were available, and all
studies were adapted from Moursi et al.’s method to construct a longitudinal index, as
indications of a long period of diet quality, and showed associations with LAZ scores
(39, 40). So far only one study has applied child feeding index scores to evaluate the
157
intervention effect (41). Their child feeding index scores were significantly higher at
each follow-up point in an intervention group.
The strength of our study was the use of a cluster randomized trial study
design to compare long-term feeding and hygiene practices by tracking a cohort of
mothers longitudinally for a year. There were a few limitations in this study. First, the
CPNP program was not blinded as the CPNP activities could be observed by any
community members; however, the data collection procedure was standardized, and
enumerators were trained to keep unbiased attitudes towards all mothers to help limit
any bias. Potential confounders adjusted in the analysis, which resulted in some
change in the findings, suggesting the potential role of these factors (such as
household food insecurity among others) in influencing the behavioral outcomes.
Child undernutrition is a major cause of child morbidity and mortality in
Ethiopia. The CPNP program improved child feeing practices of mothers in this
population. Further research is needed to determine the sustainability of the CPNP
program in Habro and Melka Bello districts and to examine the impact of the CPNP
on other behavioral aspects related to child nutrition. Further studies are also needed
to ensure the generalizability of the nutrition strategy to similar settings in Ethiopia
and East African countries.
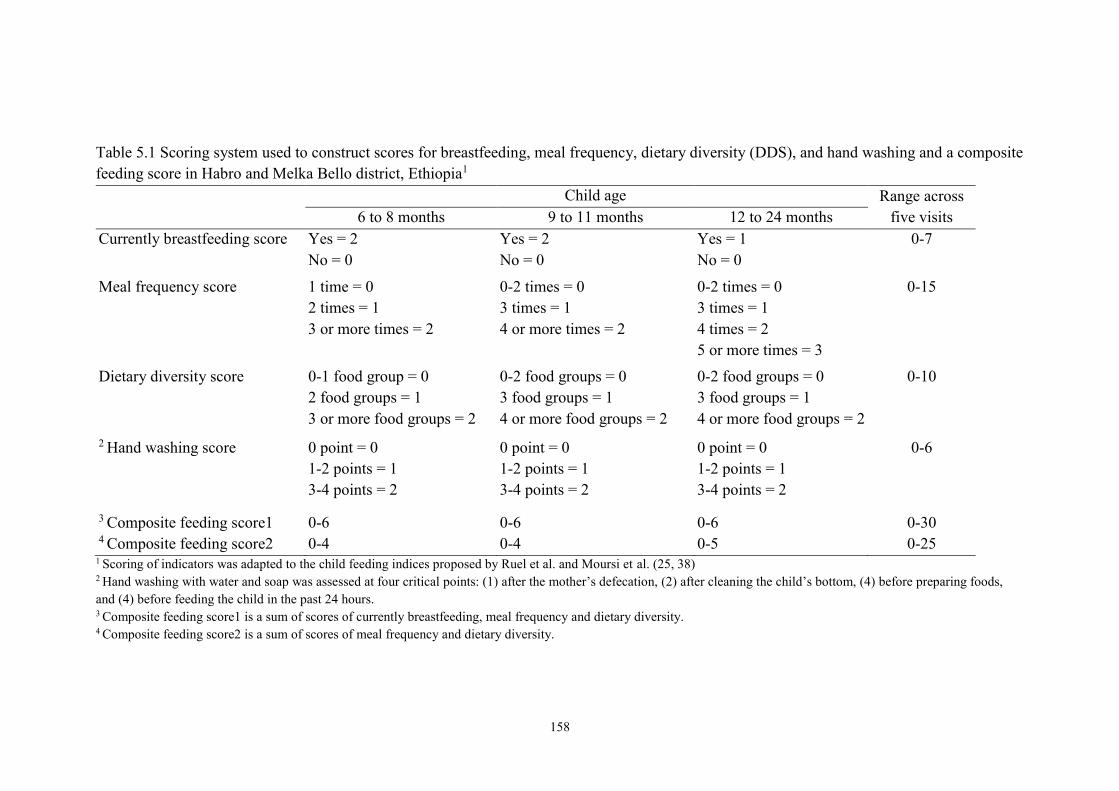
158
Table 5.1 Scoring system used to construct scores for breastfeeding, meal frequency, dietary diversity (DDS), and hand washing and a composite
feeding score in Habro and Melka Bello district, Ethiopia1
Child age Range across
five visits 6 to 8 months 9 to 11 months 12 to 24 months
Currently breastfeeding score Yes = 2
No = 0
Yes = 2
No = 0
Yes = 1
No = 0
0-7
Meal frequency score 1 time = 0
2 times = 1
3 or more times = 2
0-2 times = 0
3 times = 1
4 or more times = 2
0-2 times = 0
3 times = 1
4 times = 2
5 or more times = 3
0-15
Dietary diversity score 0-1 food group = 0
2 food groups = 1
3 or more food groups = 2
0-2 food groups = 0
3 food groups = 1
4 or more food groups = 2
0-2 food groups = 0
3 food groups = 1
4 or more food groups = 2
0-10
2 Hand washing score 0 point = 0
1-2 points = 1
3-4 points = 2
0 point = 0
1-2 points = 1
3-4 points = 2
0 point = 0
1-2 points = 1
3-4 points = 2
0-6
3 Composite feeding score1 0-6 0-6 0-6 0-30 4 Composite feeding score2 0-4 0-4 0-5 0-25
1 Scoring of indicators was adapted to the child feeding indices proposed by Ruel et al. and Moursi et al. (25, 38) 2 Hand washing with water and soap was assessed at four critical points: (1) after the mother’s defecation, (2) after cleaning the child’s bottom, (4) before preparing foods,
and (4) before feeding the child in the past 24 hours. 3 Composite feeding score1 is a sum of scores of currently breastfeeding, meal frequency and dietary diversity.
4 Composite feeding score2 is a sum of scores of meal frequency and dietary diversity.

159
Figure 5.1 Consort diagram for trial participants from enrollment through the 12-
month follow-up, Habro and Melka Bello districts, Ethiopia (2012-2014)
1 Control clusters: Community-based Management Acute Malnutrition (CMAM) program and
Essential Nutrition Action (ENA) counselling only were implemented in the control clusters. 2 Intervention clusters: In addition to CMAM and ENA programs, Community-based Participatory
Nutrition Education (CPNP) was implemented in the intervention clusters. 3 Unmet: the subject moved out of the area or was not at home at the time of the survey. 4 Refused: the subject decided not to participate at the time of the survey.
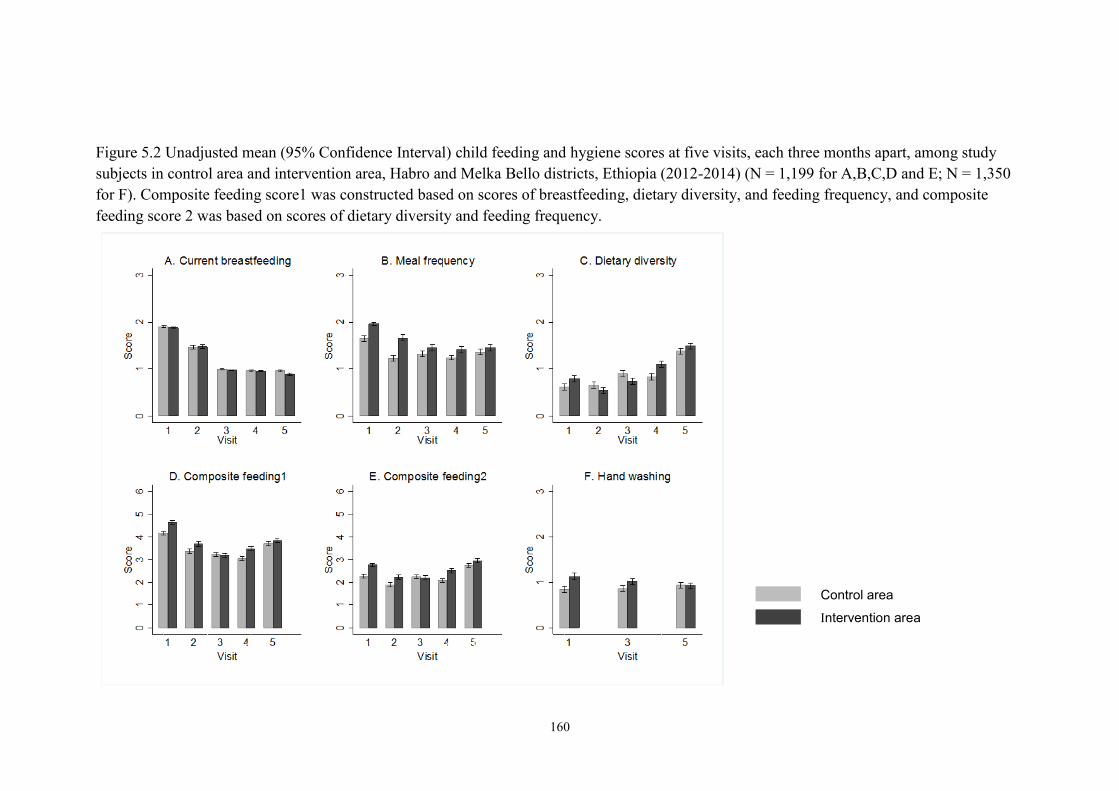
160
Figure 5.2 Unadjusted mean (95% Confidence Interval) child feeding and hygiene scores at five visits, each three months apart, among study
subjects in control area and intervention area, Habro and Melka Bello districts, Ethiopia (2012-2014) (N = 1,199 for A,B,C,D and E; N = 1,350
for F). Composite feeding score1 was constructed based on scores of breastfeeding, dietary diversity, and feeding frequency, and composite
feeding score 2 was based on scores of dietary diversity and feeding frequency.
Control area
Intervention area

161
Table 5.2 Scores of breastfeeding, meal frequency, dietary diversity (DDS), composite feeding and hand washing for all five visits among study
mothers in control and intervention areas, Habro and Melka Bello districts, Ethiopia (2012-2014)1,2
Score
range
Control Intervention Difference in score
between control and
intervention area
(95% CI)5
p-value6
N Mean ± SD N Mean ± SD
Currently breastfeeding score 0-7 629 6.29 ± 0.83 570 6.18 ± 0.93 -0.08 (-0.22, 0.06) 0.234
Meal frequency score 0-15 629 6.82 ± 1.92 570 7.95 ± 2.28 1.02 (0.33, 1.70) 0.004
Dietary diversity score 0-10 629 4.40 ± 2.39 570 4.68 ± 2.31 0.38 (-0.21, 0.98) 0.208
Composite feeding score13 0-30 629 17.50 ± 2.91 570 18.82 ± 3.39 1.30 (0.41, 2.19) 0.005
Composite feeding score24 0-25 629 11.2 ± 2.81 570 12.6 ± 3.36 1.39 (0.48, 2.23) 0.003
Hand washing score 0-6 676 2.64 ± 1.85 674 3.07 ± 1.88 0.41 (-0.21, 1.02) 0.195 1 N = 1,199 for currently breastfeeding, meal frequency, dietary diversity, composite feeding1 and composite feeding 2; N = 1,350 for hand washing.
2 Control: mothers/children enrolled from the control area; Intervention: mothers/children enrolled from the intervention area. 3 Composite feeding score1 was constructed based on scores of breastfeeding, dietary diversity, and feeding frequency. 4 Composite feeding score2 was constructed based on scores of dietary diversity, and feeding frequency. 5 95% CI: 95% confidence interval. 6 P-values were calculated by multi-level linear regression analysis accounting for clustering effect, child age and sex, father education level, type of nearest health facility,
household food insecurity, use of mobile phones, and district.

162
Figure 5.3 Unadjusted mean (95% Confidence Interval) child feeding and hygiene scores at five visits, each three months apart, among non-
CPNP participants and CPNP participants in intervention area, Habro and Melka Bello districts, Ethiopia (2012-2014) (N = 570 for A,B,C D,
and E; N = 674 for E). Composite feeding score1 was constructed based on scores of breastfeeding, dietary diversity, and feeding frequency, and
composite feeding score2 was based on scores of dietary diversity and feeding frequency.
Non-CPNP participants
CPNP participants

163
Table 5.3 Scores of breastfeeding, meal frequency, dietary diversity (DDS), composite feeding and hand washing for all five visits among non-
CPNP participants and CPNP participants in intervention area, Habro and Melka Bello districts, Ethiopia (2012-2014)1,2,
Score
range
Non-CPNP participants3 CPNP participants (95% CI)4 p-value5
N Mean ± SD N Mean ± SD
Currently breastfeeding score 0-7 338 6.20 ± 0.97 232 6.16 ± 0.88 0.09 (-0.01, 0.18) 0.079
Meal frequency score 0-15 338 7.67 ± 2.26 232 8.36 ± 2.24 0.24 (-0.11, 0.60) 0.175
Dietary diversity score 0-10 338 4.20 ± 1.94 232 5.38 ± 2.61 0.04 (-0.28, 0.35) 0.826
Composite feeding score13 0-30 338 18.08 ± 2.98 232 19.89 ± 3.65 0.40 (-0.09, 0.88) 0.110
Composite feeding score24 0-25 338 11.88 ± 3.03 232 13.73 ± 3.51 0.30 (-0.17, 0.77) 0.217
Hand washing score 0-6 413 3.55 ± 1.88 261 2.64 ± 1.87 0.12 (-0.13, 0.37) 0.333 1 N = 570 for scores of currently breastfeeding, meal frequency, dietary diversity, and composite feeding1 and composite feeding 2; N = 674 for hand washing. 2 Non-CPNP participants; mothers who never attended CPNP session in the intervention area; CPNP participants: mothers who ever attended CPNP session in the
intervention area. 3 Composite feeding score1 was constructed based on scores of breastfeeding, dietary diversity, and feeding frequency. 4 Composite feeding score2 was constructed based on scores of dietary diversity, and feeding frequency. 5 95% CI: 95% confidence interval. 6 P-values were calculated by multi-level linear regression analysis accounting for clustering effect, child age and sex, father education level, type of nearest health facility,
household food insecurity, use of mobile phones, and district.

164
Appendix 5.1 Scores of breastfeeding, feeding frequency, dietary diversity, composite feeding and hand washing among study mothers in control
area and intervention area, Habro and Melka Bello districts, Ethiopia (2012-2014) (N = 1,199)1,2
A. Current breastfeeding score, meal frequency score and dietary diversity score
Current breastfeeding score Meal frequency sore Dietary diversity score
N Mean ± SD
diff
(95% CI)5 p-value6 Mean ± SD
diff
(95% CI) p-value Mean ± SD
diff
(95% CI) p-value
Visit1 Control 629 1.90 ± 0.31 0.02 1.65 ± 0.79 -0.31 0.62 ± 0.83 -0.18
Intervention 570 1.88 ± 0.33 (-0.01, 0.06) 0.2250 1.96 ± 0.47 (-0.39, -0.24) 0.0000 0.79 ± 0.87 (-0.27, -0.08) 0.0003
Visit2 Control 629 1.47 ± 0.52 -0.01 1.23 ± 0.80 -0.44 0.66 ± 0.82 0.11
Intervention 570 1.48 ± 0.52 (-0.07, 0.05) 0.7808 1.67 ± 0.86 (-0.53, -0.34) 0.0000 0.55 ± 0.76 (0.02, 0.20) 0.0159
Visit3 Control 629 0.99 ± 0.09 0.01 1.33 ± 0.82 -0.13 0.90 ± 0.80 0.16
Intervention 570 0.98 ± 0.15 (0.00, 0.03) 0.0346 1.46 ± 0.85 (-0.22, -0.03) 0.0086 0.74 ± 0.85 (0.07, 0.25) 0.0009
Visit4 Control 629 0.96 ± 0.19 0.01 1.24 ± 0.67 -0.17 0.84 ± 0.84 -0.27
Intervention 570 0.96 ± 0.20 (-0.01, 0.03) 0.5204 1.41 ± 0.83 (-0.25, -0.08) 0.0001 1.11 ± 0.81 (-0.36, -0.18) 0.000
Visit5 Control 629 0.96 ± 0.19 0.07 1.36 ± 0.75 -0.10 1.38 ± 0.74 -0.11
Intervention 570 0.89 ± 0.31 (0.04, 0.10) 0.0000 1.45 ± 0.85 (-0.19, -0.00) 0.0401 1.49 ± 0.72 (-0.19, -0.03) 0.0108

165
Appendix 5.1 Scores of breastfeeding, feeding frequency, dietary diversity, composite feeding and hand washing among study mothers in control
area and intervention area, Habro and Melka Bello districts, Ethiopia (2012-2014) (N = 1,199) (continued)1,2
B. Composite feeding score1 and composite feeding score2 (N=1,119)
Composite feeding score13 Composite feeding score24
N Mean ± SD diff (95% CI)5 p-value Mean ± SD diff (95% CI)5 p-value
Visit1 Control 629 4.17 ± 1.11 2.27 ± 1.05
Intervention 570 4.64 ± 1.01 -0.47 (-0.59, -0.35) 0.000 2.76 ± 0.97 -0.49 (-0.60, -0.37) 0.0000
Visit2 Control 629 3.36 ± 1.29 1.89 ± 1.19
Intervention 570 3.69 ± 1.32 -0.34 (-0.48, -0.19) 0.0000 2.22 ± 1.28 -0.33 (-0.47, -0.19) 0.000
Visit3 Control 629 3.22 ± 1.05 2.23 ± 1.06
Intervention 570 3.17 ± 1.18 0.05 (-0.08, 0.17) 0.4630 2.20 ± 1.18 0.03 (-0.09, 0.16) 0.6162
Visit4 Control 629 3.04 ± 1.07 2.08 ± 1.06
Intervention 570 3.47 ± 1.21 -0.43 (-0.56, -0.30) 0.0000 2.52 ± 1.22 -0.43 (-0.56, -0.31) 0.000
Visit5 Control 629 3.70 ± 1.15 2.74 ± 1.12
Intervention 570 3.84 ± 1.15 -0.13 (-0.26, -0.00) 0.0498 2.95 ± 1.14 -0.20 (-0.33, -0.07) 0.0020
C. Hand washing score (N = 1,350)
Hand washing score
N Mean ± SD diff (95% CI)3 p-value
Visit1 Control2 676 0.84 ± 0.86
Intervention 674 1.13 ± 0.89 -0.29 (-0.38, -0.19) 0.0000
Visit3 Control 676 0.86 ± 0.82
Intervention 674 1.02 ± 0.83 -0.16 (-0.25, -0.07) 0.0004
Visit5 Control 676
Intervention 674 0.94 ± 0.79 0.01 (-0.07, 0.10) 0.7577

166
1 N = 1,199 for currently breastfeeding, meal frequency, dietary diversity, composite feeding1 and composite feeding 2; N = 1,350 for hand washing. 2 Control: mothers/children enrolled from the control area; Intervention: mothers/children enrolled from the intervention area. 3 Composite feeding score1 was constructed based on scores of breastfeeding, dietary diversity, and feeding frequency. 4 Composite feeding score2 was constructed based on scores of dietary diversity, and feeding frequency. 5 95% CI: 95% confidence interval. 6 p-values were calculated by Student’s t-test.

167
Appendix 5.2 Scores of breastfeeding, feeding frequency, dietary diversity, composite feeding and hand washing among non-CPNP participants
and CPNP participants in the intervention area, Habro and Melka Bello districts, Ethiopia (2012-2014) (N = 570)1
A. Current breastfeeding score, meal frequency score and dietary diversity score
Breastfeeding score Meal frequency sore Dietary diversity score
N Mean ± SD
diff
(95% CI)5 p-value Mean ± SD
diff
(95% CI) p-value Mean ± SD
diff
(95% CI) p-value
Visit1
Non-CPNP 478 1.88 ± 0.33 -0.01 1.98 ± 0.43 -0.10 0.76 ± 0.86 0.21
CPNP 92 1.88 ± 0.32 (-0.09, 0.06) 0.724 1.88 ± 0.63 (-0.21, 0.00) 0.059 0.97 ± 0.90 (0.01, 0.40) 0.037
Visit2
Non-CPNP 406 1.50 ± 0.52 -0.06 1.62 ± 0.85 0.16 0.50 ± 0.74 0.15
CPNP 164 1.44 ± 0.51 (-0.16, 0.03) 0.180 1.78 ± 0.88 (0.00, 0.32) 0.044 0.66 ± 0.79 (0.02, 0.29) 0.029
Visit3
Non-CPNP 376 0.98 ± 0.15 0.00 1.45 ± 0.85 0.03 0.65 ± 0.82 0.27
CPNP 194 0.98 ± 0.13 (-0.02, 0.03) 0.802 1.47 ± 0.86 (-0.12, 0.18) 0.717 0.92 ± 0.89 (0.12, 0.41) 0.000
Visit4
Non-CPNP 0.95 ± 0.21 0.01 1.33 ± 0.82 0.20 1.01 ± 0.80 0.23
CPNP 232 0.96 ± 0.19 (-0.03, 0.04) 0.625 1.53 ± 0.84 (0.06, 0.34) 0.004 1.24 ± 0.81 (0.10, 0.36) 0.001
Visit5
Non-CPNP 570 0.89 ± 0.31 0.00 1.34 ± 0.79 0.27 0.000 1.46 ± 0.75 0.07
CPNP 232 0.89 ± 0.31 (-0.05, 0.06) 0.862 1.62 ± 0.90 (0.13, 0.41) 1.53 ± 0.68 (-0.05, 0.19) 0.236
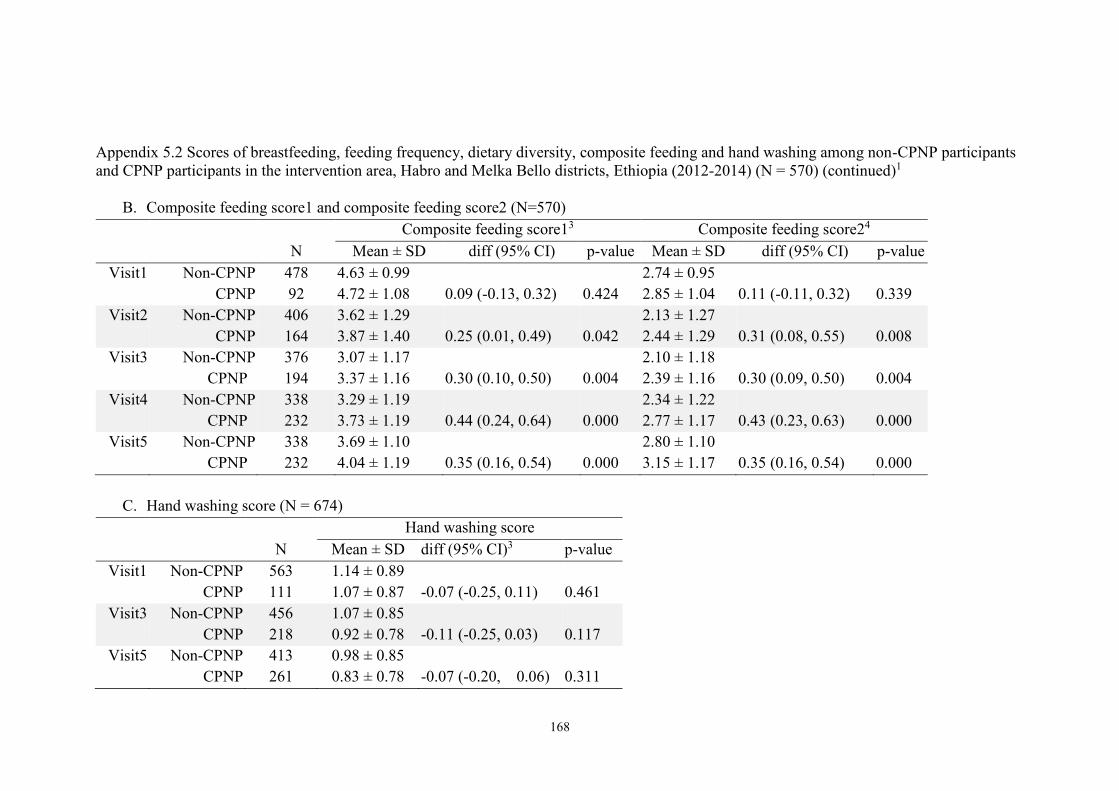
168
Appendix 5.2 Scores of breastfeeding, feeding frequency, dietary diversity, composite feeding and hand washing among non-CPNP participants
and CPNP participants in the intervention area, Habro and Melka Bello districts, Ethiopia (2012-2014) (N = 570) (continued)1
B. Composite feeding score1 and composite feeding score2 (N=570)
Composite feeding score13 Composite feeding score24
N Mean ± SD diff (95% CI) p-value Mean ± SD diff (95% CI) p-value
Visit1 Non-CPNP 478 4.63 ± 0.99 2.74 ± 0.95
CPNP 92 4.72 ± 1.08 0.09 (-0.13, 0.32) 0.424 2.85 ± 1.04 0.11 (-0.11, 0.32) 0.339
Visit2 Non-CPNP 406 3.62 ± 1.29 2.13 ± 1.27
CPNP 164 3.87 ± 1.40 0.25 (0.01, 0.49) 0.042 2.44 ± 1.29 0.31 (0.08, 0.55) 0.008
Visit3 Non-CPNP 376 3.07 ± 1.17 2.10 ± 1.18
CPNP 194 3.37 ± 1.16 0.30 (0.10, 0.50) 0.004 2.39 ± 1.16 0.30 (0.09, 0.50) 0.004
Visit4 Non-CPNP 338 3.29 ± 1.19 2.34 ± 1.22
CPNP 232 3.73 ± 1.19 0.44 (0.24, 0.64) 0.000 2.77 ± 1.17 0.43 (0.23, 0.63) 0.000
Visit5 Non-CPNP 338 3.69 ± 1.10 2.80 ± 1.10
CPNP 232 4.04 ± 1.19 0.35 (0.16, 0.54) 0.000 3.15 ± 1.17 0.35 (0.16, 0.54) 0.000
C. Hand washing score (N = 674)
Hand washing score
N Mean ± SD diff (95% CI)3 p-value
Visit1 Non-CPNP 563 1.14 ± 0.89
CPNP 111 1.07 ± 0.87 -0.07 (-0.25, 0.11) 0.461
Visit3 Non-CPNP 456 1.07 ± 0.85
CPNP 218 0.92 ± 0.78 -0.11 (-0.25, 0.03) 0.117
Visit5 Non-CPNP 413 0.98 ± 0.85
CPNP 261 0.83 ± 0.78 -0.07 (-0.20, 0.06) 0.311

169
1 N = 1,199 for currently breastfeeding, meal frequency, dietary diversity, composite feeding1 and composite feeding 2; N = 1,350 for hand washing. 2 Control: mothers/children enrolled from the control area; Intervention: mothers/children enrolled from the intervention area. 3 Composite feeding score1 was constructed based on scores of breastfeeding, dietary diversity, and feeding frequency. 4 Composite feeding score2 was constructed based on scores of dietary diversity, and feeding frequency.95% CI: 95% confidence interval. 5 5 p-values were calculated by linear regression analysis (unadjusted).

170
REFERENCES
1. UNICEF. Improving child nutrition the achievable imperative for global progress.
Division of Communication, UNICEF Attention: Permissions, H-6F 3 United Nations
Plaza, New York, NY 10017 USA: UNICEF; April 2013.
2. Black RE, Victora CG, Walker SP, Bhutta ZA, Christian P, de Onis M, et al.
Maternal and child undernutrition and overweight in low-income and middle-income
countries. Lancet. 2013 Aug 3;382(9890):427-51.
3. Ngure FM, Reid BM, Humphrey JH, Mbuya MN, Pelto G, Stoltzfus RJ. Water,
sanitation, and hygiene (WASH), environmental enteropathy, nutrition, and early
child development: Making the links. Ann N Y Acad Sci. 2014 Jan;1308:118-28.
4. Bhutta ZA, Ahmed T, Black RE, Cousens S, Dewey K, Giugliani E, et al. What
works? interventions for maternal and child undernutrition and survival. Lancet. 2008
Feb 2;371(9610):417-40.
5. Imdad A, Yakoob MY, Bhutta ZA. Impact of maternal education about
complementary feeding and provision of complementary foods on child growth in
developing countries. BMC Public Health. 2011 Apr 13;11 Suppl 3:S25.
6. Lassi ZS, Das JK, Zahid G, Imdad A, Bhutta ZA. Impact of education and
provision of complementary feeding on growth and morbidity in children less than 2
years of age in developing countries: A systematic review. BMC Public Health.
2013;13 Suppl 3:S13,2458-13-S3-S13. Epub 2013 Sep 17.
7. Stewart CP, Iannotti L, Dewey KG, Michaelsen KF, Onyango AW. Contextualising
complementary feeding in a broader framework for stunting prevention. Matern Child
Nutr. 2013 Sep;9 Suppl 2:27-45.
8. Penny ME, Creed-Kanashiro HM, Robert RC, Narro MR, Caulfield LE, Black RE.
Effectiveness of an educational intervention delivered through the health services to
improve nutrition in young children: A cluster-randomised controlled trial. Lancet.
2005 May 28-Jun 3;365(9474):1863-72.
9. Nguyen PH, Kim SS, Keithly SC, Hajeebhoy N, Tran LM, Ruel MT, et al.
Incorporating elements of social franchising in government health services improves
the quality of infant and young child feeding counselling services at commune health
centres in vietnam. Health Policy Plan. 2013 Nov 14.
10. Shi L, Zhang J, Wang Y, Caulfield LE, Guyer B. Effectiveness of an educational
intervention on complementary feeding practices and growth in rural china: A cluster
randomised controlled trial. Public Health Nutr. 2010 Apr;13(4):556-65.
11. FANTA. Review of incorporation of essential nutrition actions into public health
programs in ethiopia. . 2008.
171
12. World Vision Ethiopia. PD hearth in CMAM & ENA context report by technical
support: EARO health and nutrition team. Gelemso, Habro ADP: World Vision
Ethiopia; 2012.
13. United Nations Children’s Fund. Evaluation of community management of acute
malnutrition (CMAM): Ethiopia country case study. Three United Nations Plaza New
York, NY 10017, United States: Evaluation Office United Nations Children’s Fund;
September 2012.
14. Ethiopia MoH. CMAM rollout: Ingress to scale up nutrition. CMAM/ SUN
conference 14th - 17th november 2011 addis ababa, ethiopia. scaling up community
management of acute malnutrition and scaling up nutrition (SUN).
http://cmamconference2011.files.wordpress.com/2011/11/session-2_country-
1_ethiopia1.pdf. In press 2011.
15. Save the children. Ethiopia national nutrition strategy; review and analysis of
progress and gaps: One year on May 2009.
16. UNICEF. Evaluation of community management of acte malnutrition (CMAM):
Global synthesis report. New York: United Nations Children’s Fund; 2012.
17. Chang CY, Trehan I, Wang RJ, Thakwalakwa C, Maleta K, Deitchler M, et al.
Children successfully treated for moderate acute malnutrition remain at risk for
malnutrition and death in the subsequent year after recovery. J Nutr. 2013
Feb;143(2):215-20.
18. Zeitlin M, Ghassemi H, Mansour M. Positive deviance in child nutrition: With
emphasis on psychosocial and behavioral aspects and implications for development.
the United Nations University, Tokyo. available at:
Http://unu.edu/unupress/unupbooks/80697e/80697E00.htm [accessed 19 december
2010. 1990.
19. Bolles K, Speraw C, Berggren G, Lafontant JG. Ti foyer (hearth) community-
based nutrition activities informed by the positive deviance approach in Leogane,
Haiti: A programmatic description. Food Nutr Bull. 2002 Dec;23(4 Suppl):11-7.
20. Dewey K. Guiding principles for complementary feeding of the breastfed child.
525 Twenty-third St. N.W., Washington, D.C. 20037: WHO. Division of Health
Promotion and Protection Food and Nutrition Program; 2003.
21. World Vision International. Caregiver survey module -FY12. access to
http://www.wvdevelopment.org/. 2012.
22. Food and Nutrition Technical Assistance Project (FANTA). Household food
insecurity access scale (HFIAS) for measurement of food access: Indicator guide.
August 2007.
23. De Silva MJ, Harpham T. Maternal social capital and child nutritional status in
four developing countries. Health Place. 2007 Jun;13(2):341-55.

172
24. World Health Organization. Indicators for assessing infant and young child
feeding practices: Part 2—Measurement. Geneva, Switzerland: World Health
Organization; 2010.
25. Ruel MT, Menon P. Child feeding practices are associated with child nutritional
status in latin america: Innovative uses of the demographic and health surveys. J Nutr.
2002 Jun;132(6):1180-7.
26. Central Statistical Agency [Ethiopia] and ICF International. Ethiopia
Demographic and Health Survey 2011. Addis Ababa, Ethiopia and Calverton,
Maryland, USA: Central Statistical Agency and ICF International; 2012.
27. Pan American Health Organization. Guiding principles for complementary
feeding of the breastfed child. Washington, D.C: 2003.
28. Dewey KG, Brown KH. Update on technical issues concerning complementary
feeding of young children in developing countries and implications for intervention
programs. Food Nutr Bull. 2003 Mar;24(1):5-28.
29. Nguyen PH, Menon P, Keithly SC, Kim SS, Hajeebhoy N, Tran LM, et al.
Program impact pathway analysis of a social franchise model shows potential to
improve infant and young child feeding practices in Vietnam. J Nutr. 2014 Aug 20.
30. Pachon H, Schroeder DG, Marsh DR, Dearden KA, Ha TT, Lang TT. Effect of an
integrated child nutrition intervention on the complementary food intake of young
children in rural north Vietnam. Food Nutr Bull. 2002 Dec;23(4 Suppl):62-9.
31. Bhandari N, Mazumder S, Bahl R, Martines J, Black RE, Bhan MK, et al. An
educational intervention to promote appropriate complementary feeding practices and
physical growth in infants and young children in rural Haryana, India. J Nutr. 2004
Sep;134(9):2342-8.
32. Kilaru A, Griffiths PL, Ganapathy S, Ghosh S. Community-based nutrition
education for improving infant growth in rural Karnataka. Indian Pediatr. 2005
May;42(5):425-32.
33. Roy SK, Jolly SP, Shafique S, Fuchs GJ, Mahmud Z, Chakraborty B, et al.
Prevention of malnutrition among young children in rural Bangladesh by a food-
health-care educational intervention: A randomized, controlled trial. Food Nutr Bull.
2007 Dec;28(4):375-83.
34. Vazir S, Engle P, Balakrishna N, Griffiths PL, Johnson SL, Creed-Kanashiro H, et
al. Cluster-randomized trial on complementary and responsive feeding education to
caregivers found improved dietary intake, growth and development among rural
Indian toddlers. Matern Child Nutr. 2012 May 24.
35. Sawadogo PS, Martin-Prevel Y, Savy M, Kameli Y, Traissac P, Traore AS, et al.
An infant and child feeding index is associated with the nutritional status of 6- to 23-
month-old children in rural Burkina faso. J Nutr. 2006 Mar;136(3):656-63.
173
36. Bork K, Cames C, Barigou S, Cournil A, Diallo A. A summary index of feeding
practices is positively associated with height-for-age, but only marginally with linear
growth, in rural Senegalese infants and toddlers. J Nutr. 2012 Jun;142(6):1116-22.
37. Haile D, Belachew T, Birhanu G, Setegn T, Biadgilign S. Infant feeding practices
among HIV exposed infants using summary index in Sidama zone, southern Ethiopia:
A cross sectional study. BMC Pediatr. 2014 Feb 18;14:49,2431-14-49.
38. Moursi MM, Treche S, Martin-Prevel Y, Maire B, Delpeuch F. Association of a
summary index of child feeding with diet quality and growth of 6-23 months children
in urban Madagascar. Eur J Clin Nutr. 2009 Jun;63(6):718-24.
39. Moursi MM, Martin-Prevel Y, Eymard-Duvernay S, Capon G, Treche S, Maire B,
et al. Assessment of child feeding practices using a summary index: Stability over
time and association with child growth in urban Madagascar. Am J Clin Nutr. 2008
May;87(5):1472-9.
40. Ma JQ, Zhou LL, Hu YQ, Liu JR, Liu SS, Zhang J, et al. A summary index of
infant and child feeding practices is associated with child growth in urban Shanghai.
BMC Public Health. 2012 Jul 28;12:568,2458-12-568.
41. Zhang J, Shi L, Chen DF, Wang J, Wang Y. Effectiveness of an educational
intervention to improve child feeding practices and growth in rural China: Updated
results at 18 months of age. Matern Child Nutr. 2013 Jan;9(1):118-29.

174
CHAPTER 6. PROGRAM IMPACT PATHWAY ANALYSIS OF A
COMMUNITY-BASED PARTICIPATORY NUTRITION
PROMOTION APPROACH TO IMPROVE CHILD FEEDING
AND HYGIENE PRACTICES IN RURAL ETHIOPIA
6.1 ABSTRACT
Background: The implementation process of complex nutrition interventions need to
be examined to better understand how they achieve expected outcomes. Objectives:
We conducted a program impact pathway (PIP) analysis to evaluate how a
community-based participatory nutrition promotion (CPNP) program—involving a
two-week group nutrition session—improved the nutritional status of children in rural
Ethiopia. The PIP analysis evaluated five program components: (1) quality of the
CPNP implementation process, (2) participants’ acceptance of the CPNP program, (3)
participants’ message recall, (4) child feeding and practices and child growth at the
community level, and (5) the influence of exposure to other ongoing nutrition
programs. Methods: We reviewed the attendance records of 3,299 participants and
the observation checklists of 114 CPNP sessions and extracted process evaluation
indicators such as the percentage of dose delivered, percentage of dose received, and
score of fidelity to the intervention protocols. We conducted a household survey every
three months (a total of five times) as part of a cluster randomized trial among 914
and 876 mothers randomly selected from control and intervention areas, respectively,
to assess feeding and hygiene practices based on infant and young child feeding
(IYCF) indicators, and to ask whether the mothers were involved in the ENA and
CMAM programs. We also examined the recall of mothers’ (n = 197) experiences
related to the CPNP group sessions. Results: CPNP sessions were delivered at 81% of

175
the expectation level; fidelity to intervention protocols varied between 68% and 92%
of the expectation. Out of 197 participants, 95% ever contributed materials to a
session, 90% showed positive perception to the session practices. For each of the
session activities (e.g. food preparation), ~70% rated their participation level as
active. The participants recalled 5.0 ± 2.0 (SD) out of the 8 messages (e.g. preparing
nutritious complementary foods) asked. At the initial program stage (4 months of the
CPNP implementation), a greater percentage of CPNP participants met the minimum
dietary diversity, compared to non-participants in the intervention area (34.0% vs.
19.9%, p < 0.05). Over the 12-month follow-up, mothers in the intervention area had
better practice of meal frequency and composite feeding than mothers in the control
area (p < 0.05; details in Chapter 5). We found a higher involvement of CPNP
participants in the existing program (e.g., Essential Nutrition Action) over the project
period compared to non-participants within the same intervention area (32.3% vs.
19.8%, p < 0.001). Conclusions: Using a PIP analysis, our results suggest that the
CPNP program was adequately implemented and well-accepted among participants.
As a result, the improved feeding practices spread out at community, giving the
additional benefit of positively influencing the ongoing ENA program, and eventually
resulting in improved child nutritional status.
6.2 INTRODUCTION
Undernutrition threatens child wellbeing, and eventually weakens human capital at
national levels. As a recent international commitment to address childhood
undernutrition, the WHO global nutrition target aims to reduce by 40%—from 171
million (2010 baseline) to 100 million in 2025—the number of children under the age
of five who are stunted (1). In Ethiopia, 44.4% of children are stunted and 9.7% are

176
wasted (2). The Ethiopian government committed to address childhood undernutrition
through the National Nutrition Programme (3), of which mainly two types of
community-based nutrition programs were implemented by the local governments:
the Essential Nutrition Action (ENA) and the Community-based Management of
Acute Malnutrition (CMAM). In brief, the ENA activity provides brief nutrition
counseling by community volunteers (4), and the CMAM program treats moderately
or severely wasted children with therapeutic or supplementary foods (5, 6). Both
programs are currently operated by district health offices as part of the primary health
services, with promising program impacts being reported in a few reports (7-9).
However, in some rural areas, the limitations of these programs were often reported
among program implementing actors, such as poor capacity of community volunteers
in delivering nutrition information (10). Moreover, treated children through the
CMAM program often relapse in a short time despite extensive treatment with
therapeutic foods (11). As a result, mothers remain without appropriate capacity to
address child undernutrition on their own, depending on external food assistance (12,
13).
To address these program gaps, World Vision Korea and World Vision
Ethiopia developed a community-based participatory nutrition promotion (CPNP)
program, which was a two-week intensive group nutrition session, mainly focused on
behavior change in child feeding and hygiene of caregivers, emphasizing utilization of
locally available resources and community participation. The program was added to
the existing government programs of ENA and CMAM, and its effectiveness in
improving child feeding among caregivers and child nutritional status was
demonstrated in a cluster randomized trial in two rural districts (Chapter 4 and 5).
Indeed, despite a few significant findings of behavior change communication

177
(BCC) strategies in improving child growth and healthy practices of caregivers (14,
15), what and how such interventions were implemented, modified, and accepted
remains unexamined or only briefly described in most community-based trials.
Furthermore, lack of understanding of the implementation process of community
nutrition programs based on BCC strategies may hinder effective program
development, implementation, and scaling up to other similar settings. In response to
these questions, theory-driven process evaluation has been proposed and utilized to
open the “black box” of the implemented programs (16-19).
Program impact pathway (PIP) analysis is one of the methodological
approaches to carry out process evaluation (19). In a 2008 WHO/UNICEF meeting,
the term program impact pathway (PIP) was defined as “the pathway from an
intervention input through programmatic delivery, household and individual
utilization to its desired impact” (20).
A PIP analysis focuses on the causal mechanisms of programs and the
intention to move beyond static input-out program models, so that a PIP analysis
reveals the various operational components of a program, identifies successes and
failures in the mechanisms by which programs are expected to impact outcomes. Until
now, only a few implementation studies considering the program impact pathway
have examined the implementation processes of complementary feeding trials (21-
23). However, the need to examine pathways or the mechanisms of nutrition
intervention programs grows among program practitioners as well as policy makers.
The Alive & Thrive project, which attempted to improve infant and young
child feeding practices (IYCF) in Bangladesh, Ethiopia, and Vietnam, recently
conducted a theory-driven process evaluation, which also provided useful information
on process evaluation in large-scale nutrition programs (24-26).

178
Using a similar approach, the present study describes findings from a PIP
analysis of the CPNP program to improve child feeding and hygiene practices in rural
Ethiopia. We examined five specific program components to evaluate the levels of
implementation process of the CPNP to assess its proximal outcomes, and to
understand how the program achieved intended outcomes of change in infant and
young child feeding and hygiene behaviors.
6.2.1 Program description
The PIP analysis was carried out in the context of three nutrition programs: CPNP,
and the existing Government of Ethiopia programs—CMAM, and ENA. These
programs were implemented in Habro and Melka Bello districts under the Ethiopia
Integrated Nutrition Project (EINP), which was a 20-month-long activity (January
2012 to August 2013) conducted by World Vision Korea, in collaboration with World
Vision Ethiopia, Wholistic Interest Through Health (WITH, a Korea-based NGO),
and local Ethiopian governments, and was funded by an air-ticket solidarity levyg
entitled "Global Poverty Eradication Contribution” of Korea international cooperation
agency (KOICA).
CPNP: The CPNP was a community-based 2-week group nutrition education session,
in part adapting elements of the Positive Deviance Hearth model such as enhancing
community participation and resource utilization and rehabilitating underweight
children (27, 28). Underweight children in the community were screened ahead of
g Introduced on September 30, 2007, the levy imposes a contribution of 1000 Korean won (approx. 1
USD) for each passenger departing from Korea. It is expected to raise annual revenue of around 20
million USD for Korea’s ODA. KOICA will use this fund for various disease eradication and control
initiatives, including contributions to the UNITAID (an international drug purchase facility), mainly in
the African region.
179
each session, and mothers of the underweight children were encouraged to attend
group nutrition sessions. We planned 460 nutrition sessions for 4600 children in the
study area over the 13-month project period. Approximately seven to twelve child and
mother pairs attended each session. All 23 female operators were recruited from their
Kebeles and led group nutrition sessions at different villages within the Kebele; 8
supervisors supported and supervised the operators’ activities. The participants were
encouraged to contribute food ingredients and materials such as firewood, cooking
utensils, and feeding plates to the sessions. At the start of each session, the mothers
sang a song together about the importance of child nutrition. Next, two mothers
prepared complementary foods according to recommended recipes with locally
available and affordable food ingredients, such as grains (sorghum, maize, wheat, and
barley), bean flour, potato, sweet potato, egg, green leafy vegetables, animal milk, oil,
and tomato. All ingredients but green leafy vegetables were boiled first together into
an energy-dense porridge, and the green leafy vegetables were added into the porridge
later. As the porridge was being prepared and distributed, mothers washed their hands
and the children’s hands with soap and water and fed their children on the spot.
Nutrition message discussions with the mothers were then led by the operators. All
enrolled children were weighed on the first and twelfth day of the session and then
after one month. Their weight was recorded and the weight change was tracked. The
children who followed the program regularly had a good appetite, but no weight gain
was examined for diarrheal disease and parasitic infestations. Diarrhea cases were
treated and deworming tablets were provided as needed. The participants were
supposed to have every other day follow-up visits for two weeks by the operators or
supervisors in the following two weeks. Once a CPNP session was carried out in a

180
small village unit within a Kebele, the next session was prepared in a neighboring
village within the same Kebele.
ENA: The ENA activity was mainly intended for community volunteers to deliver
monthly nutrition-related counselling to all mothers with children under two years of
age in the study area. To support this intervention, the ENA counseling training was
preferentially provided to the HEWs, who delivered the same training to the
community volunteers in their Kebeles. Upon launching the EINP, a Health
Development Army (HDA) was adopted in the project site by the district health
offices, defined as “a community level group of 30 households (women) organized in
a 1 to 5 network of members, where one women functioned as leader of the network
and five women operated as network members” (3). In effect, community volunteers
became leaders of the networks, and the intended ENA operating structure gradually
transitioned into group discussions. The main ENA messages are on adequate
breastfeeding and appropriate complementary feeding practices, caring for sick
children, maternal nutrition, and the importance of micronutrients. The ENA training
to HEWs/ community volunteers was conducted in both districts from March to May
2012; all 54 HEWs in the Habro district and 35 HEWs in the Melka Bello district
attended the training sessions. Following the HEWs’ training, 580 (429 females and
151 males) and 395 (no sex information) community volunteers, more than 95% of all
volunteers, were trained for the ENA counseling in the Habro and Melka Bello
districts, respectively.
CMAM: The CMAM program was scaled up countrywide in 2008 and conducted as
a part of the Health Extension Program (HEP) in Ethiopia (9). In the CMAM
181
program, severely wasted children—with mid-upper arm circumference (MUAC) less
than 11cm but without other complications—were referred to the nearest health
post/health center to receive Plumpy’Nut, a type of therapeutic food, until their
recovery (5, 29). HEWs manage their admissions and follow up for maximum eight
weeks till they reach discharge criteria according to the national guidelines, recovery
and discharge, and report these records monthly to the district health office. On
occasion, families with moderately wasted children—with MUAC of 11-11.9 cm—
and pregnant and lactating women in moderately malnourished state also receive a
monthly ration of corn-soy blend (CSB) and vegetable oil for three months at
distribution sites. The first CSB distribution was put in place in August 2012 at the
same time as the start of CPNP session in the intervention area.
6.2.2 PIP of the CPNP
We created a conceptual diagram for a program impact pathway (PIP) through which
the CPNP program would be expected to impact child feeding and hygiene (Figure
6.1). The mapping of the PIP was based on the original program logic model (Refer to
Figure 3.1), review of mid- and final program evaluation report, and dialogues among
the project team and research investigators. Five key program components were
examined, as cited below. Successful outcomes at the program stages involving these
components would improve our understanding of how the CPNP achieved intended
outcomes of improving child feeding and hygiene among mothers. Following the
conceptual program pathway, this study attempted to analyze the implementation
process and proximal outcomes of program components by addressing research
questions below.
182
1) Quality of the CPNP implementation process: To what extent was the CPNP
program implemented? Process indicators such as dose delivered, dose
receipt, and fidelity to intervention protocol were created.
2) Participants’ acceptance of the CPNP program: To what extent did CPNP
participants participate, contribute materials, and perceive the CPNP sessions?
3) Participants’ message recall: To what extent did the participants recall
discussion messages and food ingredients of the CPNP menu?
4) Child feeding and hygiene at the community level: Were there differences in
practices of child feeding and hygiene among the participants compared to the
non-participants and the control group at an early stage of CPNP
implementation? Were there differences in child feeding and hygiene and
child growth between intervention and control areas over the project period?
5) Influence of exposure to the ENA and CMAM programs: Did the CPNP
program influence the degree of exposure to the ENA and the CMAM
programs?
6.3. METHODS
6.3.1 Study area and settings
This study was conducted in Habro district in the West Hararghe zone and in the
Melka Belo district in the East Hararghe zone of Oromia National Regional State. The
two districts have limited development, depend on mixed crop agriculture, and are
frequently subjected to drought and persistent poverty. World Vision Ethiopia has
implemented the area development program for more than five years, building close
ties with community members in the two districts. The two districts are ~120 km

183
apart.
6.3.2 Study design and sampling
This study was conducted in connection with a cluster randomized effectiveness trial.
To conduct the trial and to further construct matched clusters within each district, 48
Kebeles from Habro and Melka Bello districts were divided into 12 clusters, with 6
clusters per district, The procedure of 12 cluster construction and random allocation
of the intervention is described in Chapter 3. The CPNP program, together with the
ENA and CMAM programs, was implemented in 6 intervention clusters, while the
ENA and CMAM programs only were carried out in 6 control clusters. Out of the 6
intervention clusters, 3 clusters belonged to Habro district and another 3 belonged to
Melka Bello district. The study participants consisted of 1,790 randomly selected
children 6 to 12 months of age paired with their mothers, 914 in the control area and
876 pairs in the intervention area. This sample size was determined to have 0.2
length-for-age z score at the end of the 12-month follow-up between children in the
control area and children in the intervention area (see the Chapter 4 for more details
on this RCT). These selected children and mothers were visited every three months, a
total of five times for 12 months (visit1 to visit5). Eighteen locally recruited and
trained data collectors interviewed the mothers after obtaining informed consent
(Appendix C.1 and C.2).
6.3.3 Data collection
Data collection methods, outcomes, sample size, and frequency for the five program
components are listed in Table 6.1. Visit1, the first round data collection, was
conducted from November 20, 2012 to February 19, 2013; visit5, the last round data

184
collection, was conducted from November 20, 2013 to February 19, 2014. Every visit
was three months apart. Visit1 was conducted four months after the CPNP sessions
and after the corn-soy blend distribution of the CMAM program had started. The data
collectors worked independently and were not involved in project implementation
duties.
For the quality of CPNP program implementation (component 1), we reviewed
the attendance book for 3,299 CPNP participants over the 13-month CPNP
implementation period and 3-day observation checklists for 114 group nutrition
sessions over the six months, which were prepared by CPNP supervisors and
operators. (The attendance book and observation checklist forms are listed in
Appendix E.1 and E.2). We extracted the following information from the attendance
book: child age, sex, attending days, weight at first and twelfth days, session starting
dates and completion dates. The observation checklists were designed to help the
operators effectively manage the sessions. Each item in the checklists was scored 0
(not performed), 2 (moderately/modestly performed), or 4 (actively performed),
giving a range of 0-12 scores for the three days. All food ingredients contributed by
mothers at the sessions were listed.
At survey visit2, data collectors locally recruited and trained by study
investigators conducted a recall survey—using a structured questionnaire in the Afan
Oromo language—regarding the participants’ program acceptance and recall of
message and food ingredients (component 2 & 3) of the participants who had ever
attended a CPNP session by that time. Mothers were asked about how actively they
had participated in session activities such as feeding, food preparation, and hand
washing, and rated their participation at (1) I actively participated, (2) I participated,
but not actively, somewhat, or (3) I didn’t participate. Perceptions regarding the
185
session (satisfaction with the session, putting the CPNP lessons into practice
confidently, and feeling of usefulness for the session) was assessed using Likert
scales, but were later categorized into binary indicators during data analysis. The
mothers were asked whether they had contributed materials to the session and what
items they had contributed, and were asked to recall the discussed nutrition messages
and food ingredients at the session, and were also asked about currently used type of
foods.
The proximal outcomes of child feeding and hygiene at the community level
(component 4) are presented in detail in Chapter 5. At each visit (a total of five visits),
all 1,790 mothers who participated in the effectiveness evaluation study were asked
about child feeding practices based on infant and young child feeding (IYCF)
indicators that were structured based on 24-hour diet recall questionnaires. Minimum
dietary diversity and minimum meal frequency were computed according WHO
guidelines (30). In brief, minimum dietary diversity is the proportion of children 6–24
months of age who receive foods from 4 or more food groups. Minimum meal
frequency is for breastfed and non-breastfed children 6 to 24 months of age who
receive solid, semi-solid, or soft foods the minimum number of times or more. Hand
washing practice was assessed at every six months by asking whether or not the
mothers washed their hands with soap and water at four critical time points: (1) after
defecation, (2) after cleaning the child’s bottom, (3) before preparing food, and (4)
before feeding the child. Through spot-check hygiene observation, data collectors
assessed how clean the mother and child were for their hands, hair, clothes, and face
by observation at every six-month survey visit. Mother (or child) cleanliness is the
proportion of mothers (children) who were assessed as clean all for their hands, hair,
clothes, and face.

186
To assess the influence of exposure to the ENA and CMAM programs
(component 5), all 1,790 selected mothers were asked at each visit whether they had
ever received/ participated in an ENA activity from HEWs/community volunteers in
the past three months, and whether the child ever received Plumpy’Nut or corn-soy
blend in the past three months.
6.3.4 Construction of process indicators
As defined for this study, the process indicators, linked to the conceptual model,
include the following (16). The process indicators linked to the conceptual program
impact pathway (PIP) model (Fig 6.1) include the following: percentage of dose
delivered is defined as the percentage of intervention activities completed by project
staff out of the total expected; percentage dose received is defined as the percentage
of intervention received by the intervention target population out of the total expected;
Fidelity is defined as the percentage or scores of intervention activities completed by
project staff that adhered to intervention protocols; Exposure is defined as the
percentage of exposure to intervention activities by caregivers; Message recall is
defined as the percentage of recall of the intervention messages by the target
population; Proximal outcomes are the percentage of infant feeding behaviors
consistent with key project messages, as well as caregivers’ mean scores for key child
feeding and hygiene behaviors.
6.3.5 Data Analysis
Data were entered into the Microsoft Office Excel 2007 program and cleaned; data
analysis was performed using Stata version 12.0 (Stata Corporation, College Station,
TX, USA). Descriptive analyses were conducted for five critical implementation

187
components, which were identified from the program impact pathway (PIP).
Percentage of monthly CPNP program enrollment and percentage of cumulative
CPNP enrollment was calculated to the total number of CPNP participants. For
evaluation of the quality of the implementation process of CPNP (component 1),
process indicators, such as percentage dose delivered, percentage dose received, and
percentage or scores of fidelity to intervention protocol were constructed based on
extracted data from the attendance book and observation checklists, and were
compared in six intervention clusters by chi-squared test. The following variables
were evaluated regarding the participants’ program acceptance (component 2):
material contribution to the CPNP session, perceptions of the session (e.g.,
satisfaction, usefulness of CPNP message, confidence in putting the CPNP messages
into practice), and active participation in the main CPNP activities (e.g., singing, hand
washing, and feeding). These variables were presented as percentages of those
accepting/participating/perceiving specific elements out of surveyed participants.
Participants’ message recall (component 3) was presented as a percentage of those
who remembered specific CPNP messages (e.g., preparing nutritious complementary
foods) out of surveyed participants.
For proximal outcomes of child feeding and hygiene behaviors and primary
outcomes of child growth (component 4), multilevel mixed-effect models were
constructed and tested among three groups: (1) mothers in the intervention area, (2)
non-CPNP participant mothers in the intervention area, and (3) CPNP participants in
the intervention area (cf. detailed information in Chapter 5 and 6). P-values were
calculated by multilevel linear regression analysis, accounting for cluster effect to
compare control area vs. intervention area, or non-CPNP participants vs. CPNP
participants in the intervention area. Statistical significance was set at p < 0.05 with

188
all tests. Indicators of exposure to the ENA and CMAM programs (component 5)
were calculated by summing up all events from visit1 to visit5 divided by the total
number of subjects to estimate mean percentages compared by two-sample tests of
proportions. All collected data were delivered to and managed by the data
management team in the Habro district.
6.3.6 Ethical issues
The EINP was approved by the Ministry of Finance and Economic Development and
the Ministry of Health, Ethiopia (Appendix B). This study, including its effectiveness
and process evaluation, was approved by the ethical committee board, Oromia
Regional Health Bureau, Ethiopia (Appendix F.1 and F.2). This trial was registered
with Current Controlled Trials, ISRCTN 89206590.
6.4 RESULTS
6.4.1 Subject characteristics
The characteristics of the selected child and mothers for the survey are described in
Chapter 4. In brief, the age of mothers was 26.1 ± 5.4 years, and 82.3% of the mothers
were illiterate. More than 90% of households depended on mixed farming for their
livelihoods. When the clustering effect was adjusted, the intervention area had fewer
households in severe food insecurity condition (12.4% vs. 34.7%; p = 0.001), greater
access to the local hospital, and marginally better household wealth status, There were
no differences in social capital, age and education among mothers, religion, or water
sources and sanitation utilities between the control and intervention areas.
On average, 16.2 CPNP sessions were held every 3.5 weeks in each Kebele for
13 months; new CPNP sessions were operated at different locations within the

189
Kebele. Out of the 3,299 participants of the CPNP program during its 13 months of
operation, ~60% had attended at least one session by the 6th month of the program,
and ~80% had attended at least one session by the 9th month (Table 6.2). On average,
8.9 mother and child pairs attended each session.
6.4.2 Quality of CPNP implementation process
We reviewed the attendance book of 3,299 participants attending 372 sessions for 13
months (August 2012 to August 2013) and the observation checklist records for 141
sessions. Percentage of dose delivered of CPNP session was 80.9% of expected
session numbers (Table 6.3); 372 sessions were held out of 460 expected sessions.
Percentage of dose received by CPNP participants was 71.7% of 4,600 expected
number of participants, varying from 62.3% to 82.7% across the six intervention
clusters. The percentage of fidelity to the intervention protocol was overall
satisfactory; 91.7% of the sessions consisted of 7 to 12 participants, which would be
considered an appropriate number for a group activity; 95.5% of the children were 6
to 24 months of age, and 90.3% of participants attended for 10 to 12 days. As a
proximal outcome as well as fidelity indicator, the percentage of children who gained
weight of more than 200g was good at 67.8%. Admission of underweight children
was exceptionally low, with a range of 19.2% to 37.9% across the six intervention
clusters.
While dose delivered had no difference across six clusters, the percentage of
dose received of total expected and some of percentage of fidelity indicators varied by
cluster. The variation was most likely to be attributable to differences in the district
(p<0.05; chi-squared test). Intervention clusters in Harbo district indicated lower
percentage of dose received (62.3% to 70.0%) than in the Melka Bello district (76.0%

190
to 82.7%). The average number of attendants per nutrition session was higher in
Melka Bello (8.5 vs. 9.3). Children with more than a 200g weight gain after two
weeks session was higher in the Habro district (range: 72.6 to 79.7%) than in the
Melka Bello district (48.0 to 64.8%).
Each item of observation checklist was scored 0 to 12 for three days
evaluation. As the score range of 8-12 was considered as being operated with good
quality considering the scoring process of each item in the checklists being scored 0
(not performed), 2 (moderately/modestly performed), or 4 (actively performed) per
day. According to these criteria, the fidelity scores of most of the checklist items
presented a mid-to-high level (Table 6.4).
The session operation involved community support; 66.7% of the sessions
were supported by HEWs; 57.9% were supported by community volunteers. It was
likely that a reasonable amount of meals were provided to children (score: 9.8 ± 4.0,
range 0 to 12). In principle, the sessions depended entirely on the food ingredients that
CPNP participants volunteered. Mainly the following ingredients were constantly
prepared: wheat, barley, sorghum, and maize flour, shiro flour (chick-peas based food
ingredient), green leafy vegetables, vegetable oil, and milk were constantly prepared.
Additional ingredients such as sweet potatoes, tomatoes, milk, etc., were included on
occasion. For 86% of all sessions, 7 to 8 food ingredients were in place. As
recommended in the original protocol, a 5 days follow-up visit for two 2 weeks, was
also practiced at a low level of expectation; only 5.8% of CPNP participating mothers
(n = 197) received 5 or more visits by the CPNP operators. 53.9% received 1 to 2
times follow-up visits and 27.7% never had follow-up visits (data not shown).
191
6.4.3 Participants’ program acceptance
Acceptance of the program was evaluated based mainly on responses from the CPNP
participants. At visit2, out of 744 mothers surveyed in the intervention area, 197
mothers were identified to attend the CPNP sessions ahead of survey visit2. The
participants rated their participation level as active for the various activities (e.g. hand
washing, food preparation) with a range of 62.1% to 79.2% (Table 6.5). 94.9% of the
participants replied that they had ever contributed to the sessions, with most of them
bringing at least two items to the sessions (mean ± SD: 2.1 ± 1.6, range 1 to 7). More
than 90% of the participants replied that they were satisfied with the sessions, and that
the session messages were useful, and 80.2% replied that they could confidently put
the CPNP messages into practice.
6.4.4 Recall of messages and food ingredients among CPNP participants
Out of 197 CPNP participants, most of mothers (88.3%) recalled the message of
preparing nutritious complementary foods was and the mothers recalled other
messages at 61.4% to 69.0%, with the exception of messages regarding health seeking
practices (e.g., going to the Health Center when their child was sick) (31.0%) (Table
6.6). Largely they remembered about five of eight messages asked (5.0 ± 2.0, range 1
to 8); 72.6% of the participants replied that they were preparing complementary foods
as they had learned at the sessions. The participants remembered by and large about 3
food ingredients used in the sessions (3.2 ± 1.8, range 1 to 9). Food ingredients such
as grains (81.2%), oil (58.3%), sweet potato/potato/yam (42.1%), milk (41.8%), and
green-leafy vegetables (33.5%) were well recalled.

192
6.4.5 Feeding and hygiene practices at the community level
The evaluation of child feeding and hygiene practices was based on the premise that
participants vs. non-participants were exposed to the CPNP sessions at least at the
early stage of the program and before the program spread out to the whole community
as intended. The CPNP session operation preceded four months before survey visit1,
so we used the data at visit1 to compare the CPNP participants to the non-participants
or the control group. At visit1, 141 participants, out of 876 mothers in the intervention
area were found to have attended the sessions. The ages of the enrolled children
ranged from 6 to 12 months; thus, all mothers were breastfeeding across the three
groups. The percentage of those who met minimum dietary diversity was greater in
the CPNP participants compared to the non-participants in the intervention area
(34.0% vs. 19.9%, p < 0.05) as well as the control group (34.0% vs. 16.8%, p < 0.05),
adjusting for child age, sex, and variables differing at enrollment, and clustering effect
(Table 6.7). A larger portion of CPNP participants reported that they washed their
hands with water and soap at four critical time points (35.7% vs. 26.0%, p < 0.05)
than the control group, but not greater than the non-CPNP participants. At the spot-
check observation, a greater proportion of CPNP mothers looked cleaner than the
non-participant mothers (40.0% vs. 14.6%, p < 0.05) in the intervention area as well
as the mothers in the control area. Over the 12 months follow-up, mothers in the
intervention area showed higher scores of meal frequency (diff: 1.02, 95% CI: 0.33,
1.70), composite feeding involving breastfeeding, dietary diversity, and meal
frequency (diff: 1.30, 95% CI: 0.41, 2.19) than mothers in the control area, but there
were no differences in scores of current breastfeeding, dietary diversity, and hand
washing between mothers in the two areas (Refer to Chapter 5). Furthermore, children

193
in the intervention area showed improvement in length-for-age z score and weight-
for-age z score (Refer to Chapter 4).
6.4.6 Influence of CPNP on exposure to ENA program
Out of the 914 and 876 survey subjects in the control and intervention areas, 46.7%
and 52.4%, respectively, replied that they had ever participated in the ENA program.
CPNP participants showed a significantly greater tendency of being involved in the
ENA activity than the non-CPNP participants in the same intervention area (32.3% vs.
19.8 %; z-test, p < 0.05) or mothers in the control area (32.3% vs. 15.1%, p < 0.05)
(Table 6.8). Out of 1,790 subjects, 24.1% and 9.1% had ever received Plumpy’Nut in
the control and intervention areas, respectively, at a similar level in the CPNP
participants and non-CPNP participants in the intervention area.
6.5 DISCUSSION
The PIP analysis showed the degree to which the CPNP program was delivered and
received, and the degree to which caregivers accepted and utilized the intervention
components, and how the program influenced other nutrition programs ongoing in the
rural districts of Ethiopia. In summary, the CPNP were successfully performed with
an appropriate level of dose delivered and exposure, and high fidelity to the
intervention protocol for various aspects of the nutrition sessions. Participants’ active
participation and contributions, and positive perceptions supported that the program
was adequately accepted in this rural Ethiopian setting. Some of the feeding and
hygiene behaviors improved among the CPNP participants at the initial project stage,
and over the 12-month project period, the intervention mothers presented better child
feeding practices (e.g. meal frequency and composite feeding) than mothers in the
194
control group. Furthermore, the participants were more engaged in the ENA activities,
likely due to an increased demand of the existing community health service. These
linked activities and proximal outcomes would lead to better nutritional status in
children in the intervention area. This study is an example of one of few PIP studies
which have employed a process evaluation for behavior change communication
(BCC) interventions to improve infant and child feeding practices and will be used as
a useful resource for further scale up of nutrition programs to be operated by civil
societies and the Ethiopian government.
Overall, the CPNP session performance was appropriate; 80.9% of dose
delivery of the expected 460 sessions and 71.7% of dose received by the 4,600
participants were achieved. Since the numbers of 460 sessions and 4,600 participants
were considered to be maximum achievement, the CPNP had been operated at a
completely ideal level. Thus, we gauged that these process outcomes were greater
than 70% of total expected and would be judged as an operation with high quality. It
is notable that the variation across the six clusters, mostly in two districts, in the
percentage of dose received of total expected participants and some of the percentage
of fidelity indicators was attributable to differences in the districts. Process outcomes
such as dose delivered and dose received may represent CPNP supervisor and
operators’ capacity, and reciprocal action among community members, and need
further study to explore what factors in the study districts contributed to the difference
in the process indicators. The adequacy of dose received of CPNP participation was
supported by a few additional estimations; at least 30% out of the total population 6 to
24 months of age in the intervention area (data not shown) attended nutrition sessions
(31), and 38% of selected children in the intervention area for the effectiveness study
replied that they had ever attended the sessions.

195
Out of 3,299 children, 67.8% children showed weight gain of more than 200g
after two weeks. Importantly, their weight gain was likely to continue after the
program; children who had ever attended the CPNP session exhibited even faster
monthly weight gain (diff: 0.035/month, 95% CI: 0.017, 0.053) and 0.029 WAZ
score/month (95% CI: 0.012, 0.047) greater than non-CPNP children in the
intervention area (Chapter 4). Percentage of fidelity was more than 90% with regard
to sessions having 7 to 12 participants, admission age of 6 to 24 months of age, and
attending days of 10-12 days indicated that the basic elements for CPNP were well
set-up. The reason for low fidelity (29.5%) to admitting underweight children was
also indicated in the final evaluation report that over time, the operators reported
difficulty in finding underweight children, a targeted group, in their Kebele and would
admit children without applying this criteria at a later program stage (data not shown)
(32). As the CPNP was not aimed to treat the underweight condition but to
rehabilitate such children, these adjustments in admission criteria might not reduce the
program effect; rather, it could have an advantage of engaging many mothers with
interest in CPNP participation. This change in program operation needs to be
understood as a context-specific program-adapting process.
It was likely that the CPNP program was well accepted by participants. Such
positive perceptions of the CPNP program might help participants have a strong
desire to put these CPNP messages into practices with confidence and have a
sustainable program impact. Current results of the participants’ positive perceptions
has significance that this program operation entirely depended on their own resources
except for employment of CPNP operators and supervisors by World Vision. From a
programmatic aspect, these results have a greater implication because there was
196
resistance from the community at the start of the CPNP session regarding their own
material contribution to the NGO-leading program.
The participants remembered the messages discussed in the sessions and kept
utilizing the food ingredients presented in the sessions to prepare their children’s
foods. The nutrition messages discussed in the PD Hearth programs are types of
universal child feeding, caring, personal and environment hygiene, and health seeking
practices (27, 33). In our program settings, CPNP operators were supposed to discuss
one of these messages per day with participants and to repeat the messages in the
following week (detailed messages are described in Chapter 3). Given that this was an
intervention protocol, it could be a good indication of an effectively implemented
message discussion that mothers could recall 5 out of 8 messages.
It is notable that many participants replied that they were preparing child foods
as they learned at the sessions, which could be a tentative indication for the program
sustainability. Yellow-vegetables (21.8%), eggs (18.3%), and legumes (13.7%) were
recalled at a lower level than other food ingredients such as grain or milk, even
though the sessions encouraged all these foods. To strengthen the program effect on
diverse food consumption, we need to further investigate why these foods were less
available at group sessions, whether it was attributable to individual affordability or
resulted from lower fidelity to the food ingredient preparation.
Despite this lack of some types of food availability recommended at the
session, it was found that CPNP participants kept higher scores of dietary diversity
than non-CPNP participants in the intervention area over the project period (not
adjusted) (Chapter 5). At the initial stage of the program, mothers of CPNP
participating children were found to feed their children more diverse foods and be
cleaner at their face and clothes than non-participants in the intervention area. These

197
significant differences in behaviors between CPNP participants and non-CPNP
participants disappeared over time. Instead, the impact of the program was spread out
at the community level; consequently, mothers in the intervention area maintained
better child feeding and composite feeding than the control group (Chapter 5). No
difference in hand washing practice between the control and intervention areas might
be attributable to the hygiene messages of environmental and personal hygiene
provided by the existing Health Extension Program (HEP) service (34, 35).
It is noteworthy that the higher ENA activity level in the intervention area was
mostly attributed to the higher engagement of CPNP participants to the ENA activity.
The CPNP participants might be more sensitized to attaining nutrition information,
and have stronger motivation and willingness to participate in the ENA activity than
their neighbors. This change could increase demand for government health services,
spurring HEWs and community volunteers to improve their health service activity.
Given that the ENA activity level in the current context was far below the expected
monthly visit, the CPNP session operation can be a facilitating factor to supplement
the weakness of ENA activity. A probable interpretation may be that the interaction
between the CPNP and the ENA activity could bring some synergy effect in
improving mothers’ better practices across various facets of feeding and hygiene,
which might eventually lead to better child growth outcomes.
Receiving Plumpy’Nut indicated that the child was in a condition of severely
acute malnutrition. There was no difference in receiving Plumpy’Nut between non-
participants and the participants, although we had expected a lower proportion of
receiving Plumpy’Nut among the CPNP participants. There was no information
available regarding when the severely acute malnourished status was manifest, that is,
198
whether it was before or after the CPNP session participation. Further detail study is
needed to examine the effect of CPNP on preventing severely malnourished cases.
Consequently, all the above results could give useful knowledge and
influential understanding as to the mechanism of how the CPNP program led to
positive feeding behaviors and improved nutritional outcomes at the community level.
To date, only a few process evaluation studies are available for
complementary feeding trials based on BCC strategies, demonstrating the adequacy
and feasibility of these interventions (21-23, 25, 36). In these study, mixed methods
involving quantitative and qualitative methods were used, and data collection was
simultaneously carried out in control and intervention groups.
A PIP analysis for the Alive & Thrive (A&T) BCC intervention in
Bangladesh, which attempted to improve infant and young child feeding (IYCF)
practices, described the capacity of the implementation staff and the extent of fidelity
to the intervention; facilitating factors such as family support and barriers including
lack of resource were described (25). The A&T social franchise model attempted to
improve infant and young child feeding (IYCF) practices in Vietnam and indicated its
effective management of the franchise system and challenges in service utilization
(36). In a cluster randomized trial for complementary feeding in Peru—where health
personnel delivered a multicomponent intervention as part of usual care in
government health centers—various process indicators were assessed such as the
extent of delivery dose and fidelity to intervention protocol, barriers to
implementation and context; the indicators quantified the extent of program
implementation and the quality, and demonstrated additional benefits to existing
government programs by the intended interventions (37). In the same context, the
study team conducted a pathway analysis and found significant determinants to the

199
improvement outcomes such as health center implementation, caregiver exposure, and
caregiver message recall (21). Using a PIP analysis based on program theory
framework, the Homestead Food Production Program in Cambodia showed that
program components delivered as planned and utilized, and identified program gaps
in the pathway to reduce program impact and, based on the process results, suggested
increasing some intervention components to improve the impact (38).
Given the government-driven health system structure for primary health care
in Ethiopia, this research findings could be evidence on how the CPNP program could
strengthen or facilitate existing government health programs. Additionally, it will be
worthwhile to consider how to graft components of the CPNP program onto the
existing health programs, including the ENA activity and CMAM program. As such
examples, we suggest referring children who recovered from severe malnourished
status to the CPNP program or granting CPNP participants a facilitating responsibility
in ENA activities with incentives or support from HEWs.
A distinctive feature of this process evaluation study was the utilization of
various data sources, such as program attendance records and the checklists generated
from the project team, a household survey and its nested recall survey conducted by
the research team. Inter-comparison with these data resources enabled in-depth
understanding of multifaceted aspects of intervention implementation while saving on
the additional cost of collecting and processing these data.
In the process of conducting this study, it was a challenge to catch changes in
intervention modalities on a timely basis such as ENA activity, and its assessment
methods had to be adjusted promptly. The programs had to be modified in line with
government policy, implementing NGO’s capacity, and community own events or
desires for interventions. Constant communication and meetings between the project
200
team and the study investigators were necessary for mid-course corrections in the
questionnaires to be used and data collection management. Additionally, it would be
beneficial for this quantitative process evaluation to be complemented with qualitative
description, which could better explain the program context such as facilitating and
impeding factors.
This study has a few limitations. First, we had no information for the level of
knowledge, capacity, and activity of HEWs/community volunteers in the study area
due to logistical limitations, but it might confound the effect of the CPNP program on
feeding and hygiene of the study subjects. Second, indicators in the session checklists
might be biased to better performance outcomes since the project team prepared these
forms. However, since most indicators were straightforward, the conclusion that
sessions were adequately prepared and smoothly operated could still be supported.
Third, a question could arise as to whether this low percentage would represent
program acceptance of all participants and message recall. The total of 197 mothers to
be included in the recall survey was 6.0% of the 3,299 mothers who attended the
nutrition sessions.
Conclusion
In conclusion, the PIP analysis applying process evaluation at key program stages
indicated that the CPNP was successfully implemented, adequately accepted in this
context, and positively influenced service delivery of the existing ENA program.
Future application of these research findings and evaluation procedures will help the
Ethiopian government and development NGOs design appropriate and contextualized
strategies for scaling up nutrition programs.

201
Figure 6.1 Conceptual program impact pathway (PIP) of program activities, proximal outcomes, and impact outcomes of community-based
participatory nutrition promotion (CPNP), Habro and Melka Bello districts, Ethiopia

202
Table 6.1 Summary of data collection methods and main outcomes by evaluation component of community-based participatory nutrition
promotion (CPNP), Habro and Melk Bello area, Ethiopia (2012 to 2014)1
Evaluation
components
Methods Main outcomes Study group Frequency
C1. Quality of
CPNP
implementation
process
Records review
of attendance
book;
% dose delivered & dose received
% number of session and participants of expected
% fidelity to intervention protocol
e.g., % children 6 to 24 months of age on admission
e.g., % weight gain of >200g at 12th days of session
I: 3,299 participants in
6 clusters in the
intervention area
For 13 months
Records review
of observation
checklists
Fidelity scores to intervention protocol
Scores for the degree of preparedness of session, support
from community, and session activities such as hand
washing, food preparation, child feeding, and discussion)
I: 114 sessions in the
intervention area
For 6 months
C2. Participants’
program
acceptance
Survey
(recall)
Scores of active participation in session activities,
material contribution, and perception to the session
I: 197 CPNP
participants2
At visit2
C3. Participants’
message recall
Survey
(recall)
Scores of CPNP messages and food ingredients recalls I: 197 CPNP
participants
At visit2
C4: Child feeding
and hygiene and
child growth
Survey
Spot check
observation
% of infant and young child feeding (IYCF) indicators
% of hygiene practices (hand washing and cleanliness)
C: 914 mothers
I: 876 mothers
Visit1 to visit5
Every three
months apart
C5. Influence on
exposure to other
programs
Survey
% receiving ENA counseling in the past three months
% receiving Plumpy’Nut3 in the past three months
C: 914 mothers
I: 876 mothers
Visit1 to visit5
Every three
months apart 1 CPNP: Community-based participatory nutrition promotion; ENA: Essential Nutrition Action; CMAM: community-based management of acute malnutrition program; I:
intervention area; C: control area; C1 to C6: component 1 to component 6.

203
2 Survey visits started from 4 four months after CPNP session started, continued every three month, a total five times (visit1 to visit5). 3 Plumpy’Nut was provided to severely acute malnourished children through community-based management of the acute malnutrition program (CMAM).

204
Table 6.2 Enrollment in Community-based Participatory Nutrition Education (CPNP)
program by month at intervention area, Habro and Melka Bello districts, Ethiopia
(N=3,299)
Program duration
(month)
Monthly CPNP enrollment
n (%)
Cumulative CPNP
enrollment
n (%)
1st 208 (6.3) 208 (6.3)
2nd 382 (11.6) 590 (17.9)
3rd 348 (10.5) 938 (28.4)
4th 255 (7.7) 1193 (36.2)
5th 371 (11.2) 1564 (47.4)
6th 385 (11.7) 1949 (59.1)
7th 235 (7.1) 2184 (66.2)
8th 241 (7.3) 2425 (73.5)
9th 185 (5.6) 2610 (79.1)
10th 258 (7.8) 2868 (86.9)
11th 184 (5.6) 3052 (92.5)
12th 151 (4.7) 3203 (97.1)
13th 96 (2.9) 3299 (100)
All information were excerpted from EINP program monitoring report (World Vision). 1Population projection in 2012 estimated from 2007 Ethiopia Population Census. Proportion of children
<2 was estimated as 5.71%. 2CPNP program started August 2012 and ended August 2013.
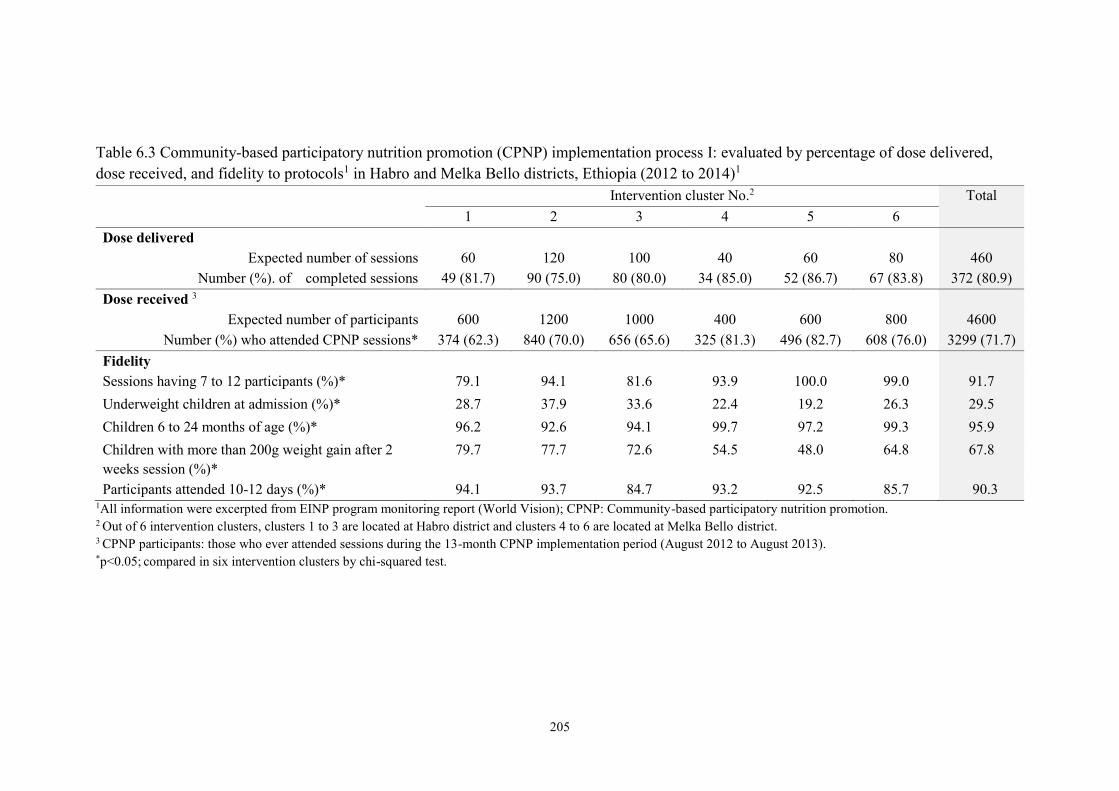
205
Table 6.3 Community-based participatory nutrition promotion (CPNP) implementation process I: evaluated by percentage of dose delivered,
dose received, and fidelity to protocols1 in Habro and Melka Bello districts, Ethiopia (2012 to 2014)1
Intervention cluster No.2 Total
1 2 3 4 5 6
Dose delivered
Expected number of sessions 60 120 100 40 60 80 460
Number (%). of completed sessions 49 (81.7) 90 (75.0) 80 (80.0) 34 (85.0) 52 (86.7) 67 (83.8) 372 (80.9)
Dose received 3
Expected number of participants 600 1200 1000 400 600 800 4600
Number (%) who attended CPNP sessions* 374 (62.3) 840 (70.0) 656 (65.6) 325 (81.3) 496 (82.7) 608 (76.0) 3299 (71.7)
Fidelity
Sessions having 7 to 12 participants (%)* 79.1 94.1 81.6 93.9 100.0 99.0 91.7
Underweight children at admission (%)* 28.7 37.9 33.6 22.4 19.2 26.3 29.5
Children 6 to 24 months of age (%)* 96.2 92.6 94.1 99.7 97.2 99.3 95.9
Children with more than 200g weight gain after 2
weeks session (%)*
79.7 77.7 72.6 54.5 48.0 64.8 67.8
Participants attended 10-12 days (%)* 94.1 93.7 84.7 93.2 92.5 85.7 90.3 1All information were excerpted from EINP program monitoring report (World Vision); CPNP: Community-based participatory nutrition promotion. 2 Out of 6 intervention clusters, clusters 1 to 3 are located at Habro district and clusters 4 to 6 are located at Melka Bello district. 3 CPNP participants: those who ever attended sessions during the 13-month CPNP implementation period (August 2012 to August 2013). *p<0.05; compared in six intervention clusters by chi-squared test.

206
Table 6.4 Community-based participatory nutrition promotion (CPNP)
implementation process II: evaluated by indicators of fidelity to protocols using
observation evaluation in Habro and Melka Bello districts, Ethiopia1
Evaluation item (fidelity indicators)2 Total (N = 114)
mean ± SD
Drinking water is treated (boiled/chlorine/covered) 8.4 ± 5.1
Latrine available 9.6 ± 4.0
Cleanliness of session place 9.4 ± 2.6
Cleanliness of food utensils 9.9 ± 2.6
Hand washing is practiced by caregivers before feeding 11.5 ± 1.3
Hand washing is practiced by caregivers before food preparation 11.2 ± 1.8
Hand washing is practiced by children before feeding 10.5 ± 2.6
Food is prepared according to menu 11.5 ± 1.9
Size of portion served is age appropriate 9.8 ± 4.0
Key nutrition/health message discussed 10.6 ± 2.8
n (%)
At least one day supported by Health Extension Workers 76 (66.7)
At least one day supported by community volunteers 66 (57.9)
Use of 7-8 food ingredients at 1st visit 101 (88.6)
Use of 7-8 food ingredients at 2nd visit 98 (86.0)
Use of 7-8 food ingredients at 3rd visit 96 (84.2) 1 All information was excerpted from observation evaluation records prepared regularly by 6
supervisors (World Vision) and analyzed for this study purpose; CPNP: Community-based
participatory nutrition promotion: SD: standard deviation. 2 each checklist item had a score range of 0 to 12 for three days evaluation.
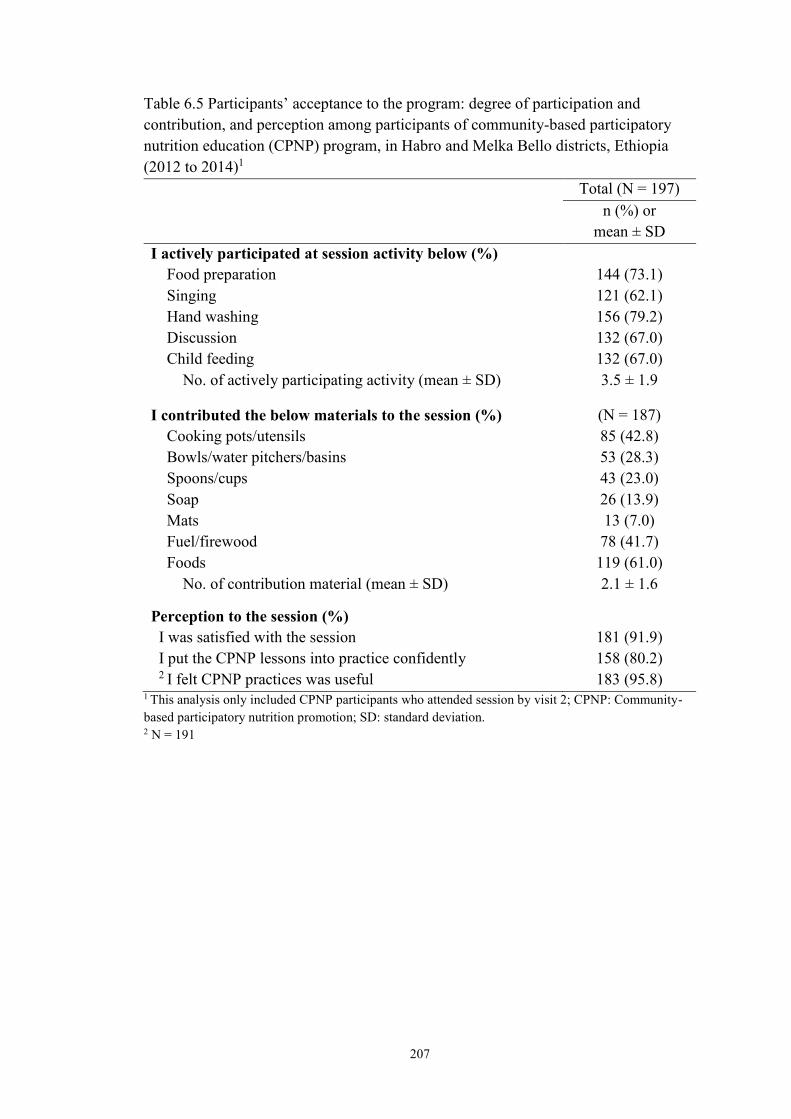
207
Table 6.5 Participants’ acceptance to the program: degree of participation and
contribution, and perception among participants of community-based participatory
nutrition education (CPNP) program, in Habro and Melka Bello districts, Ethiopia
(2012 to 2014)1
Total (N = 197)
n (%) or
mean ± SD
I actively participated at session activity below (%)
Food preparation 144 (73.1)
Singing 121 (62.1)
Hand washing 156 (79.2)
Discussion 132 (67.0)
Child feeding 132 (67.0)
No. of actively participating activity (mean ± SD) 3.5 ± 1.9
I contributed the below materials to the session (%) (N = 187)
Cooking pots/utensils
Bowls/water pitchers/basins
Spoons/cups
Soap
Mats
Fuel/firewood
Foods
85 (42.8)
53 (28.3)
43 (23.0)
26 (13.9)
13 (7.0)
78 (41.7)
119 (61.0)
No. of contribution material (mean ± SD) 2.1 ± 1.6
Perception to the session (%)
I was satisfied with the session 181 (91.9)
I put the CPNP lessons into practice confidently 158 (80.2) 2 I felt CPNP practices was useful 183 (95.8)
1 This analysis only included CPNP participants who attended session by visit 2; CPNP: Community-
based participatory nutrition promotion; SD: standard deviation. 2 N = 191

208
Table 6.6 Participants’ recall for session messages and food ingredients to the
community-based participatory nutrition promotion (CPNP) session in Habro and
Melka Bello districts, Ethiopia (2012 to 2014)1
Total
(N = 197)
n (%) or
mean ± SD
Recalled CPNP messages (%)
Preparing nutritious complementary foods
Responsive (actively) feeding.
Age appropriate feeding
Drinking water from safe source
Cleanliness of House
Cleanliness of food utensils
Hand washing
Health seeking practice
174 (88.3)
126 (64.0)
136 (69.0)
127 (64.5)
128 (65.0)
121 (61.4)
134 (68.0)
61 (31.0)
No. of recalled messages (mean ± SD) 5.0 ± 2.0
Recalled CPNP food ingredients (%)
Grains
Yellow-color vegetables
Green-leafy vegetables
Sweet potato/potato/yams
Fruits
Egg
Oil
Legumes
Milk
169 (81.2)
43 (21.8)
66 (33.5)
83 (42.1)
28 (14.2)
37 (18.3)
115 (58.3)
27 (13.7)
86 (41.8)
No. of recalled food ingredients (mean ± SD) 3.2 ± 1.8
Food ingredients in currently use (%)
Grains
Yellow-color vegetables
Green-leafy vegetables
Sweet potato/potato/yams
Fruits
Eggs
Oil
Legumes
Milk
163 (83.6)
28 (14.4)
61 (31.3)
73 (37.4)
17 (8.7)
37 (19.0)
124 (63.6)
29 (14.9)
110 (56.4)
No. of food ingredients in currently use (mean ± SD) 3.3 ± 1.6 1 Only participants who attended session by visit2 were included; CPNP: Community-based
participatory nutrition promotion; SD: standard deviation

209
Table 6.7 Infant and young child feeding (IYCF) and hygiene practices among the study subjects in control area and intervention area, and
subjects who participated CPNP session in the intervention area at first round of survey, Habro and Melka Bello districts, Ethiopia (2012 to
2014) (N = 1706)
Control area 1 Intervention area
Non-CPNP CPNP
N n (%) N n (%) N n
Feeding
Continued breastfeeding (%) 869 867 (99.8) 695 693 (99.7) 141 141 (100) 2 Minimum dietary diversity (%) 870 146 (16.8) 695 138 (19.9) 141 48 (34.0)*#
3Minimum meal frequency (%) 869 743 (85.5) 694 683 (98.4)* 141 136 (96.5)*
Hygiene 4 Mothers cleanliness (%) 865 126 (14.6) 692 166 (24.0) 140 56 (40.0)*#
4 Child cleanliness (%) 866 123 (14.2) 693 133 (19.2) 141 48 (34.0)* 5 Hand washing (%) 864 225 (26.0) 694 303 (43.7)* 140 50 (35.7)*
1 Control: mothers enrolled from the control area; Non-CPNP: mothers enrolled from the intervention area but never attended CPNP session during survey visits; CPNP:
mothers enrolled from the intervention area and ever attending CPNP session during survey visit. 2 Minimum dietary diversity: proportion of children 6–24 months of age who receive foods from 4 or more food groups. 3 Minimum meal frequency: for breastfed and non-breastfed children 6 to 24 months of age who receive solid, semi-solid, or soft foods the minimum number of times or
more. 4 Hand washing practice is assessed by asking whether or not mother washed their hands with soap and water at four critical time points, 1) after defecation, 2) after cleaning
the child’s bottom, 3) before preparing food, and 4) before feeding child. 5 Through spot-check hygiene observation, data collectors assessed how clean mother and child were for their hands, hair, clothes, and face. *p<0.05 (when compared to control group), # p<0.05 (when compared to non-CPNP participants); p-values were calculated by logistic or multinomial regression accounting
for 50 Kebeles clustering, mother and father education level, household head, household asset, household food insecurity, size of owned land, and district, compared to
control area.

210
Table 6.8 Exposure to the Essential Nutrition Action (ENA) activity and Community-based Management of Acute Malnutrition (CMAM)
program among surveyed mothers in control area, and non-CPNP participants and CPNP participants in the intervention area, in Habro and
Melka Bello districts, Ethiopia (2012 to 2014)1
Control2 Non-CPNP CPNP
N3 n (%) N n (%) N n (%)
CMAM program
Ever received Plumpy’Nut4 in the past three months (%) 3063 238 (7.8) 1903 41 (2.1)*# 1018 45 (4.4)*
ENA activity
Ever received ENA counselling at least once a month in the
past three months (%)
3222 485 (15.1) 2172 429 (19.8)* 892 288 (32.3)*#
1 CPNP: Community-based participatory nutrition promotion; ENA: Essential Nutrition Action; CMAM: community-based management of acute malnutrition program 2 Control: mothers enrolled from the control area; Non-CPNP: mothers enrolled from the intervention area but never attended CPNP session during survey visits; CPNP:
mothers enrolled from the intervention area and ever attending CPNP session during survey visit. 3 N was a total number of mothers surveyed across four visit; n was a total number of mothers exposed to the program of interest across four visits.
(visit2 to visit5 for receiving Plumpy’Nut; visit1 to visit4 for the ENA activity exposure); each visit was put in place three months apart. 4 Plumpy’Nut was provided to treat severely acute malnourished children in health centers/health posts. *p-values were calculated by two-sample test of proportions, comparison to control area.

211
Appendix 6.1 Periodical trend of participation of Community-based Participatory
Nutrition Education (CPNP) program, EINP project, Habro and Melka Bello districts,
Ethiopia (August 2012 to August 2013)
A. Cumulative number of CPNP participants for 13 months
B. Number of CPNP participants by month

212
REFERENCES
1. WHO. Comprehensive implementation plan on maternal, infant and young child
nutrition. 2012. Report No.: WHA65/6.
2. Central Statistical Agency [Ethiopia] and ICF International. Ethiopia demographic and
health survey 2011. Addis Ababa, Ethiopia and Calverton, Maryland, USA: Central
Statistical Agency and ICF International.; 2012.
3. Government of the Federal Democratic Republic of Ethiopia National. National
nutrition Programme June 2013 – June 2015.
4. FANTA. Review of incorporation of essential nutrition actions into public health
programs in Ethiopia. 2008.
5. Valid International. Community-based therapeutic care (CTC): Field manual. First
Edition, 2006.
6. Ethiopia Federal Ministry of Health. Protocol for the management of severe acute
malnutrition. March 2007.
7. Lenters LM, Wazny K, Webb P, Ahmed T, Bhutta ZA. Treatment of severe and
moderate acute malnutrition in low- and middle-income settings: A systematic review,
meta-analysis and delphi process. BMC Public Health. 2013;13 Suppl 3:S23,2458-13-S3-
S23. Epub 2013 Sep 17.
8. Deconinck H, Swindale A, Grant F, Navarro-Colorado C. Review of community-based
management of acute malnutrition (CMAM) in the post-emergency context: Synthesis of
lessons on integration of CMAM into national health systems. Washington, DC: FANTA
Project, FHI 360; 2008.
9. United Nations Children’s Fund. Evaluation of community management of acute
malnutrition (CMAM): Ethiopia country case study. Three United Nations Plaza New
York, NY 10017, United States: Evaluation Office United Nations Children’s Fund;
September 2012.
10. Save the children. Ethiopia national nutrition strategy;review and analysis of progress
and gaps: One year on may 2009. 2009.
11. Chang CY, Trehan I, Wang RJ, Thakwalakwa C, Maleta K, Deitchler M, et al.
Children successfully treated for moderate acute malnutrition remain at risk for
malnutrition and death in the subsequent year after recovery. J Nutr. 2013
Feb;143(2):215-20.
12. UNICEF. Evaluation of integreated managment of actue malnutrition (IMAM):
Kenya country case study . New York: United Nations Children’s Fund; 2012.
213
13. UNICEF. Evaluation of community management of acte malnutrition (CMAM):
Global synthesis report. New York: United Nations Children’s Fund; 2012.
14. Imdad A, Yakoob MY, Bhutta ZA. Impact of maternal education about
complementary feeding and provision of complementary foods on child growth in
developing countries. BMC Public Health. 2011 Apr 13;11 Suppl 3:S25.
15. Stewart CP, Iannotti L, Dewey KG, Michaelsen KF, Onyango AW. Contextualising
complementary feeding in a broader framework for stunting prevention. Matern Child
Nutr. 2013 Sep;9 Suppl 2:27-45.
16. Saunders RP, Evans MH, Joshi P. Developing a process-evaluation plan for assessing
health promotion program implementation: A how-to guide. Health Promot Pract. 2005
Apr;6(2):134-47.
17. Rossi P, Lipsey M, Freeman H. Evaluation: A systematic approach. Thousand Oaks,
Calif, USA: Sage Publications; 2003.
18. Oakley A, Strange V, Bonell C, Allen E, Stephenson J, RIPPLE Study Team. Process
evaluation in randomised controlled trials of complex interventions. BMJ. 2006 Feb
18;332(7538):413-6.
19. Kim S, Habicht J, Menon P, Stoltzfus R. How do programs work to improve child
nutrition? program impact pathways of three nongovernmental organization intervention
projects in the Peruvian highlands. Washington: International Food Policy Research
Institute; 2011.
20. WHO (World Health Organization). Strengthening action to improve feeding of
infants and young children 6–23 months of age in nutrition and child health programmes:
Report of proceedings, October, 6–9, 2008. 2009.
21. Robert RC, Gittelsohn J, Creed-Kanashiro HM, Penny ME, Caulfield LE, Narro MR,
et al. Process evaluation determines the pathway of success for a health center-delivered,
nutrition education intervention for infants in Trujillo, Peru. J Nutr. 2006
Mar;136(3):634-41.
22. Newman JE, Garces A, Mazariegos M, Michael Hambidge K, Manasyan A, Tshefu
A, et al. Theory-driven process evaluation of a complementary feeding trial in four
countries. Health Educ Res. 2014 Apr;29(2):297-305.
23. Gartner A, Maire B, Kameli Y, Traissac P, Delpeuch F. Process evaluation of the
senegal-community nutrition project: An adequacy assessment of a large scale urban
project. Trop Med Int Health. 2006 Jun;11(6):955-66.
24. Rawat R, Nguyen PH, Ali D, Saha K, Alayon S, Kim SS, et al. Learning how
programs achieve their impact: Embedding theory-driven process evaluation and other

214
program learning mechanisms in Alive & Thrive. Food Nutr Bull. 2013 Sep;34(3
Suppl):S212-25.
25. Avula R, Menon P, Saha KK, Bhuiyan MI, Chowdhury AS, Siraj S, et al. A program
impact pathway analysis identifies critical steps in the implementation and utilization of a
behavior change communication intervention promoting infant and child feeding
practices in Bangladesh. J Nutr. 2013 Dec;143(12):2029-37.
26. Menon P, Rawat R, Ruel M. Bringing rigor to evaluations of large-scale programs to
improve infant and young child feeding and nutrition: The evaluation designs for the
Alive & Thrive initiative. Food Nutr Bull. 2013 Sep;34(3 Suppl):S195-211.
27. World Vision International Nutrition Centre of Expertise. Training of master trainers
for positive deviance/hearth. 2011.
28. WVI Nutrition Centre of Expertise. Training of positive deviance/hearth volunteer
(curriculum). 2011.
29. Ethiopia MoH. CMAM rollout: Ingress to scale up nutrition. CMAM/ SUN
conference 14th - 17th November 2011 Addis Ababa, Ethiopia. Scaling up community
management of acute malnutrition and scaling up nutrition (SUN).
http://cmamconference2011.files.wordpress.com/2011/11/session-2_country-
1_ethiopia1.pdf. In press 2011.
30. World Health Organization. Indicators for assessing infant and young child feeding
practices: Part 2—Measurement. Geneva, Switzerland: World Health Organization; 2010.
31. Population census commisson. The 2007 population and housing census of Ethiopia:
Statistical report for OromiyaRegion; part V: Population size of kebeles. 2008.
32. World Vision Ethiopia. World Vision Ethiopia Integrated Nutrition Project (EINP)
Habro and Melka-Bello Woredas final report 2013.
33. Nutrition Working Group, Child Survival Collaborations and Resources Group
(CORE). Positive deviance / hearth: A resource guide for sustainably rehabilitating
malnourished children. Washington, D.C: December 2002.
34. Banteyerga H. Ethiopia's health extension program: Improving health through
community involvement. MEDICC Rev. 2011 Jul;13(3):46-9.
35. Federal Ministry of Health. Federal ministry of health (ET). Health extension
program in Ethiopia: Profile [internet]. Addis Ababa: Health extension and education
center; 2007 [cited 2011 may 24]. 27 p. available from:
Http://www.ethiopia.gov.et/English/MOH/Resources/Documents/HEW%20profile%20Fi
nal%2008%2007.pdf. 2007.

215
36. Nguyen PH, Menon P, Keithly SC, Kim SS, Hajeebhoy N, Tran LM, et al. Program
impact pathway analysis of a social franchise model shows potential to improve infant
and young child feeding practices in Vietnam. J Nutr. 2014 Aug 20.
37. Robert RC, Gittelsohn J, Creed-Kanashiro HM, Penny ME, Caulfield LE, Narro MR,
et al. Implementation examined in a health center-delivered, educational intervention that
improved infant growth in Trujillo, Peru: Successes and challenges. Health Educ Res.
2007 Jun;22(3):318-31.
38. Olney DK, Vicheka S, Kro M, Chakriya C, Kroeun H, Hoing LS, et al. Using
program impact pathways to understand and improve program delivery, utilization, and
potential for impact of helen keller international's homestead food production program in
Cambodia. Food Nutr Bull. 2013 Jun;34(2):169-84.

216
CHAPTER 7. DISCUSSION
Child undernutrition affects entire life stages and adversely affects next generations (1,
2). Out of the current nutrition strategies to address child undernutrition, enhancing
complementary feeding by an educational approach based on behavior change
communication (BCC) was recognized as effective intervention (3-5). Basically, in
an extension of these BCC studies, we designed a community-based participatory
nutrition promotion (CPNP) approach, which was added to the existing programs of
Essential Nutrition Action (ENA) and Community-based Management of Acute
Malnutrition (CMAM) in rural Ethiopia. The effectiveness of the CPNP to improve child
nutritional status and child feeding and hygiene among caregivers was tested in a cluster
randomized effectiveness trial. To better understand how implementation of CPNP led to
the outcomes—such as child feeding and hygiene practices among caregivers and
eventually child growth—we conducted a process evaluation using program impact
pathway (PIP) analysis for major program components.
7.1 Summary of research findings
In the first paper (Chapter 4), we compared the length-for-age (LAZ), weight-for-age
(WAZ), weight-for-length (WLZ) z scores and the risk of stunting, underweight, and
wasting among children 6 to 24 months of age in the intervention area, compared to
children in the control area. In a randomized cluster trial, 1,790 child 6 to 12 months of
age and their mothers were enrolled, 914 in the control area and 876 in the intervention
area. We found that in multi-level mixed-effect regression models based on longitudinal
data controlling for clustering effects, children in the intervention area had a significantly
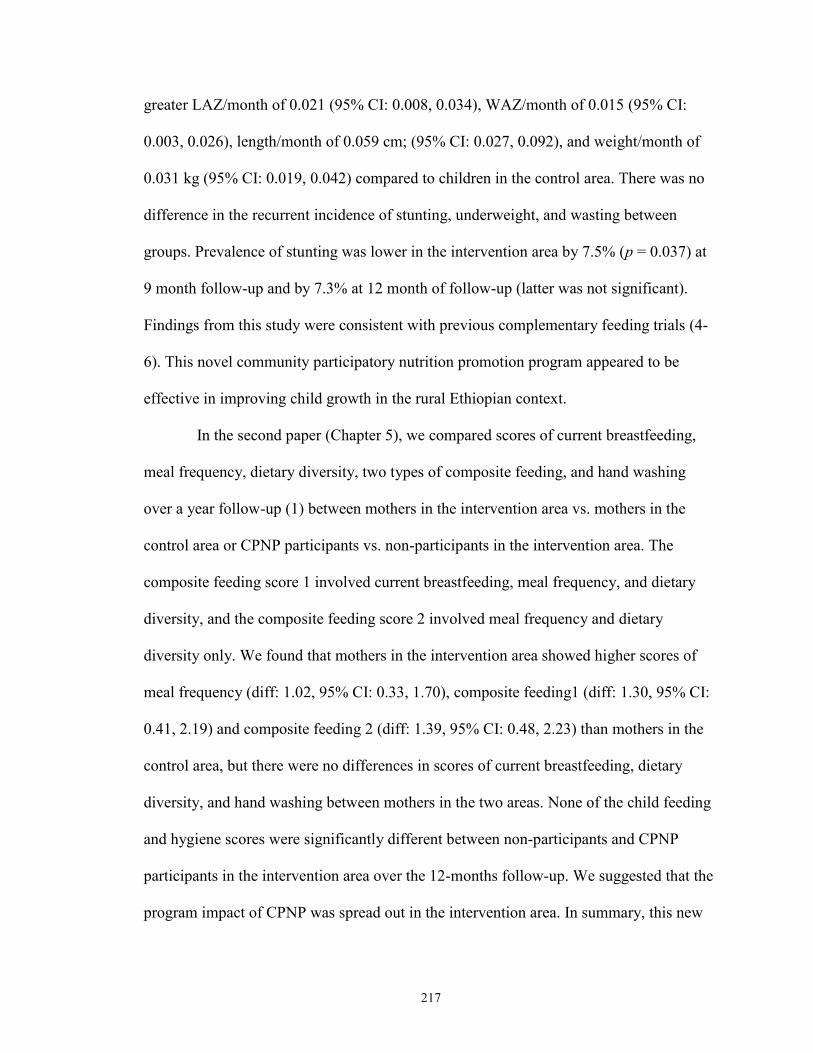
217
greater LAZ/month of 0.021 (95% CI: 0.008, 0.034), WAZ/month of 0.015 (95% CI:
0.003, 0.026), length/month of 0.059 cm; (95% CI: 0.027, 0.092), and weight/month of
0.031 kg (95% CI: 0.019, 0.042) compared to children in the control area. There was no
difference in the recurrent incidence of stunting, underweight, and wasting between
groups. Prevalence of stunting was lower in the intervention area by 7.5% (p = 0.037) at
9 month follow-up and by 7.3% at 12 month of follow-up (latter was not significant).
Findings from this study were consistent with previous complementary feeding trials (4-
6). This novel community participatory nutrition promotion program appeared to be
effective in improving child growth in the rural Ethiopian context.
In the second paper (Chapter 5), we compared scores of current breastfeeding,
meal frequency, dietary diversity, two types of composite feeding, and hand washing
over a year follow-up (1) between mothers in the intervention area vs. mothers in the
control area or CPNP participants vs. non-participants in the intervention area. The
composite feeding score 1 involved current breastfeeding, meal frequency, and dietary
diversity, and the composite feeding score 2 involved meal frequency and dietary
diversity only. We found that mothers in the intervention area showed higher scores of
meal frequency (diff: 1.02, 95% CI: 0.33, 1.70), composite feeding1 (diff: 1.30, 95% CI:
0.41, 2.19) and composite feeding 2 (diff: 1.39, 95% CI: 0.48, 2.23) than mothers in the
control area, but there were no differences in scores of current breastfeeding, dietary
diversity, and hand washing between mothers in the two areas. None of the child feeding
and hygiene scores were significantly different between non-participants and CPNP
participants in the intervention area over the 12-months follow-up. We suggested that the
program impact of CPNP was spread out in the intervention area. In summary, this new
218
community-based nutrition program model was effective in improving meal frequency
and composite feeding practices in a rural Ethiopian context, as other similar
complementary feeding trials successfully improved child feeding practices in
underdeveloped settings (7-10).
In the third paper (Chapter6), we conducted a PIP analysis for the five main
program components along the flow of the intervention pathway. Our results suggest that
the CPNP program was adequately implemented and well-accepted among participants.
Consequently, the improved feeding practices spread out beyond the community, giving
the additional benefit of positively influencing the ongoing ENA program, and eventually
resulting in improved child nutritional status. This new nutrition program approach
appeared to be effective in improving child feeding and hygienic practices among
caregivers and child growth in the rural Ethiopian context. This study contributed to
implementation science, especially behavior change communication interventions to
improve child feeding practices in other settings, as well as other similar nutrition trials
and programs (11-14).
7.2 Strengths and limitations
Strengths of the study were to use a cluster randomized effectiveness study design and
prospective data collection for 12-months follow-up for each child and mother on a large
scale. We evaluated the performance outcomes in parallel with effectiveness outcomes.
Process evaluation using a program impact pathways analysis helped understanding of
impact achievement of the CPNP program on effectiveness outcomes.
There were a few limitations in this study. First, allocation of intervention to the

219
matched clusters was made randomly, but, by chance, imbalances were found in the
enrollment characteristics at visit1 between control and intervention areas—such as
fathers’ education, household food insecurity, and type of nearest health facilities—in
favor of the intervention area. These variables were included in our statistical models and
adjusted. Second, this study had no true baseline because the first data collection was
conducted four months after the CPNP sessions started within the communities. It was
expected that the CPNP program had already impacted child nutritional status in the
community; however, there were no significant differences in anthropometric
measurement and indicators, and comparison for such indicators was mainly done by
monthly rate comparisons. Third, the intervention allocation and data collection
procedures were not blinded to subject mothers and interviewers by the nature of the
intervention of the CPNP. Some mothers knew of the existence of the CPNP program in
their community, but had no idea of the impact comparison purpose of this study.
However, to help limit any bias, the data collection procedure was standardized, and
enumerators were trained to keep unbiased attitudes toward all mothers. Fifth, there could
be recall bias regarding behavioral questions. We did not observe the mothers’ behaviors
of child feeding and hygiene but recorded their answers to our questions. Especially,
hand washing practices were higher among non-CPNP participants in the intervention
area, better than CPNP participants. It was likely that CPNP participants were more
aware of their true behaviors. Data collectors were trained to keep neutral attitudes in
doing their interviews regardless of type of study population and type of control or
intervention area. Sixth, indicators in the session checklists might be biased to better
performance outcomes since the project team prepared these forms; however, since most
220
indicators were straightforward, the conclusion that sessions were adequately prepared
and smoothly operated could still be supported.
7.3 Future directions for research
Further research is needed to determine the sustainability of the CPNP program effects on
child growth beyond 24 months of age in the Habro and Melka Bello districts, and the
generalizability of the intervention needs to be assessed on a wider scale in similar
communities in Ethiopia and other African countries.
Furthermore, research in the next phases of the CPNP will include the following: (1)
developing a better informed and integrated community-based nutrition programming
model; (2) scaling up the CPNP approach and applying it to other neighboring districts or
other African countries where feasible and appropriate; (3) tracking the long-term effects
of the current CPNP approach on a variety of health outcomes of children and caregivers,
and (4) strengthening of the community health system and building up the community
capacity to sustainably address child undernutrition.
7.4 Public health significance
The findings from this study have community and policy-level implications for several
aspects of prevention and treatment of child undernutrition, and design and development
of appropriate nutrition intervention in Ethiopia as well as in similar settings of Sub-
Saharan African countries.
Future application of these research findings and evaluation procedures will help
the Ethiopian government and development NGOs in Ethiopia design appropriate and
221
contextualized strategies for scaling up nutrition programs. World Vision Ethiopia may
want to include the CPNP approach to the nutrition strategy of area development
programs. Currently, a local health government in the Habro district, one of the study
districts, decided to continue the CPNP program after the phase out of the Ethiopia
Integrated Nutrition Project (EINP) by the World Vision team. Instead of hiring CPNP
operators, the local health government trained community volunteers to operate CPNP
group nutrition sessions in their community. This would be an example of how the CPNP
approach was integrated into ongoing government nutrition programs. Furthermore, the
study findings provide useful information to improve nutrition strategies to promote child
feeding and caring practices for children under two years of age, particularly for the
National Nutrition Program (NNP).
Lastly, there is a growing interest in process evaluation using systematic
approaches for enhancing ongoing nutrition program results. Preferentially, lessons from
this study need to be shared through various opportunities among the health communities
of World Vision, especially regarding various methods and tools of effectiveness and
process evaluation which were used in this study.
REFERENCES
1. Black RE, Victora CG, Walker SP, Bhutta ZA, Christian P, de Onis M, et al. Maternal
and child undernutrition and overweight in low-income and middle-income countries.
Lancet. 2013 Aug 3;382(9890):427-51.
2. Black RE, Allen LH, Bhutta ZA, Caulfield LE, de Onis M, Ezzati M, et al. Maternal
and child undernutrition: Global and regional exposures and health consequences. Lancet.
2008 Jan 19;371(9608):243-60.
222
3. Bhutta ZA, Das JK, Rizvi A, Gaffey MF, Walker N, Horton S, et al. Evidence-based
interventions for improvement of maternal and child nutrition: What can be done and at
what cost? Lancet. 2013 Aug 3;382(9890):452-77.
4. Lassi ZS, Das JK, Zahid G, Imdad A, Bhutta ZA. Impact of education and provision of
complementary feeding on growth and morbidity in children less than 2 years of age in
developing countries: A systematic review. BMC Public Health. 2013;13 Suppl
3:S13,2458-13-S3-S13. Epub 2013 Sep 17.
5. Imdad A, Yakoob MY, Bhutta ZA. Impact of maternal education about complementary
feeding and provision of complementary foods on child growth in developing countries.
BMC Public Health. 2011 Apr 13;11 Suppl 3:S25.
6. Caulfield L, Huffman S, Piwoz E. Interventions to improve intake of complementary
foods by infants 6 to 12 months of age in developing countries: Impact on growth and on
the prevalence of malnutrition and potential contribution to child survival. Food and
nutrition bulletin. 1999;20:183-200.
7. Pachon H, Schroeder DG, Marsh DR, Dearden KA, Ha TT, Lang TT. Effect of an
integrated child nutrition intervention on the complementary food intake of young
children in rural north Viet-nam. Food Nutr Bull. 2002 Dec;23(4 Suppl):62-9.
8. Bhandari N, Mazumder S, Bahl R, Martines J, Black RE, Bhan MK, et al. An
educational intervention to promote appropriate complementary feeding practices and
physical growth in infants and young children in rural haryana, india. J Nutr. 2004
Sep;134(9):2342-8.
9. Kilaru A, Griffiths PL, Ganapathy S, Ghosh S. Community-based nutrition education
for improving infant growth in rural karnataka. Indian Pediatr. 2005 May;42(5):425-32.
10. Roy SK, Jolly SP, Shafique S, Fuchs GJ, Mahmud Z, Chakraborty B, et al.
Prevention of malnutrition among young children in rural bangladesh by a food-health-
care educational intervention: A randomized, controlled trial. Food Nutr Bull. 2007
Dec;28(4):375-83.
11. Robert RC, Gittelsohn J, Creed-Kanashiro HM, Penny ME, Caulfield LE, Narro MR,
et al. Process evaluation determines the pathway of success for a health center-delivered,
nutrition education intervention for infants in Trujillo, Peru. J Nutr. 2006
Mar;136(3):634-41.
12. Robert RC, Gittelsohn J, Creed-Kanashiro HM, Penny ME, Caulfield LE, Narro MR,
et al. Implementation examined in a health center-delivered, educational intervention that
improved infant growth in Trujillo, Peru: Successes and challenges. Health Educ Res.
2007 Jun;22(3):318-31.
223
13. Nguyen PH, Menon P, Keithly SC, Kim SS, Hajeebhoy N, Tran LM, et al. Program
impact pathway analysis of a social franchise model shows potential to improve infant
and young child feeding practices in Vietnam. J Nutr. 2014 Aug 20.
14. Avula R, Menon P, Saha KK, Bhuiyan MI, Chowdhury AS, Siraj S, et al. A program
impact pathway analysis identifies critical steps in the implementation and utilization of a
behavior change communication intervention promoting infant and child feeding
practices in Bangladesh. J Nutr. 2013 Dec;143(12):2029-37.

224
APPENDIX
Appendix A. Memorandum of Understanding (MOU) for the present effusiveness trial of
the Ethiopia Integrated Nutrition Project (EINP) among World Vision Korea, World
Vision Ethiopia, and Wholistic Interest Through Health (WITH)

225

226

227

228
Appendix B. Approval document of Ethiopia Integrated Nutrition Project (EINP) of
World Vision Ethiopia by Oromia Regional Health Bureau, and the Regional
Government of Oromia Bureau of Finance and Economic Development
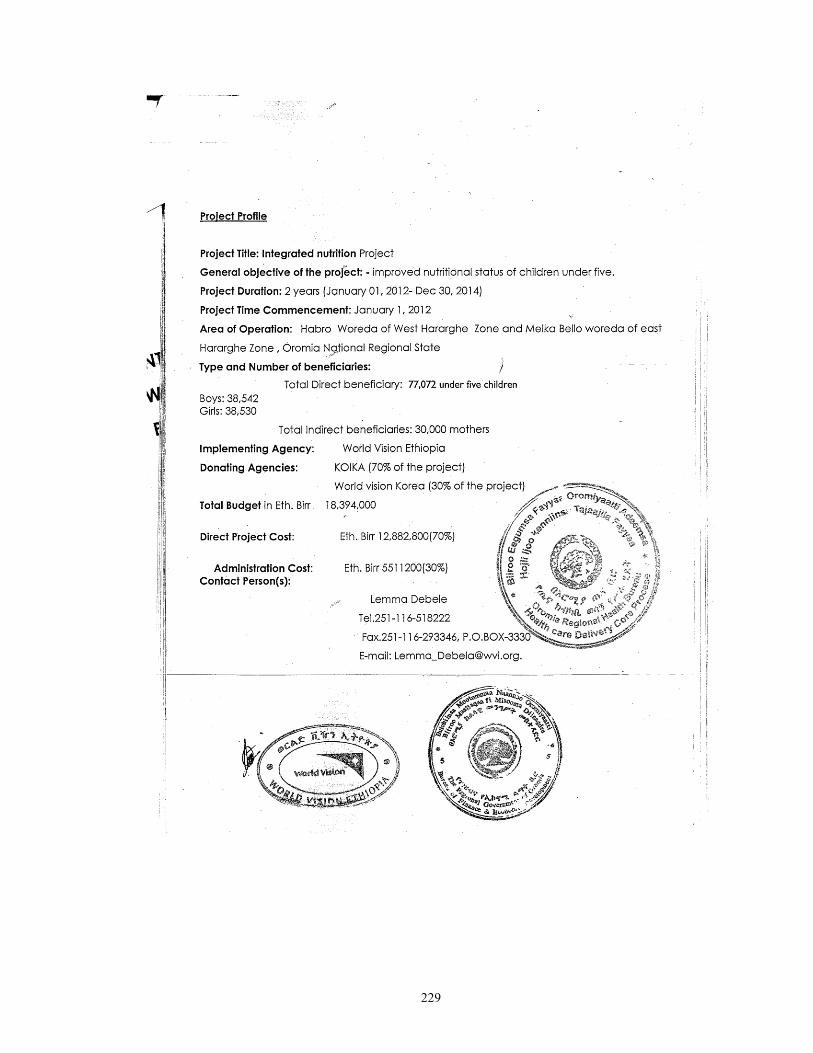
229

230
Appendix C.1 Informed consent (Afan Oromo)
231

232
Appendix C.2 Informed consent (English)

233

234

235
Appendix D. Questionnaires for effectiveness trial (English version)

236
Anthropometric measurement
Child birth date Ethiopian date
(MM/DD/YY)
International date
(MM/DD/YY)
AM101
Child birth date
/ /
/ /
AM102 Child SEX 1=Male
2=Female
CODE:
Anthropometric
measurement
1st measurement 2nd measurement
AM103 Child MUAC (cm)**
.
.
AM104 Child Weight (kg)
. N/A
AM105 Child Height (cm)
.
.
Mother’s anthropometric measurement (Record only at 3 month of follow up visit)
AM106 Mother’s weight (kg)
. .
N/A
AM107 Mother’s MUAC (cm)
.
N/A
AM108 Mother’s Height (cm)
.
N/A
Ask if the child has any younger sibling. If he/she does, measure the younger sibling’s
age, sex, weight, MUAC, and height.
Anthropometric measurement for a younger sibling
AM109 Name:
Code
AM110 Sex
1=Male
2=Female
AM111 Age
Month of age
AM112 Child MUAC (cm)
.
.
AM113 Child Weight (kg)
.
NA
AM114 Child Height (cm)
.
.
** IF THE CHILD’ MUAC IS LESS THAN 11 CM, PLEASE WITHIN TWO DAYS REFER THE CHILD TO HEW/VCHW IN THE KEBELLE IN ORDER FOR THE CHILD TO BE ENROLLED TO CMAM PROGRAM.
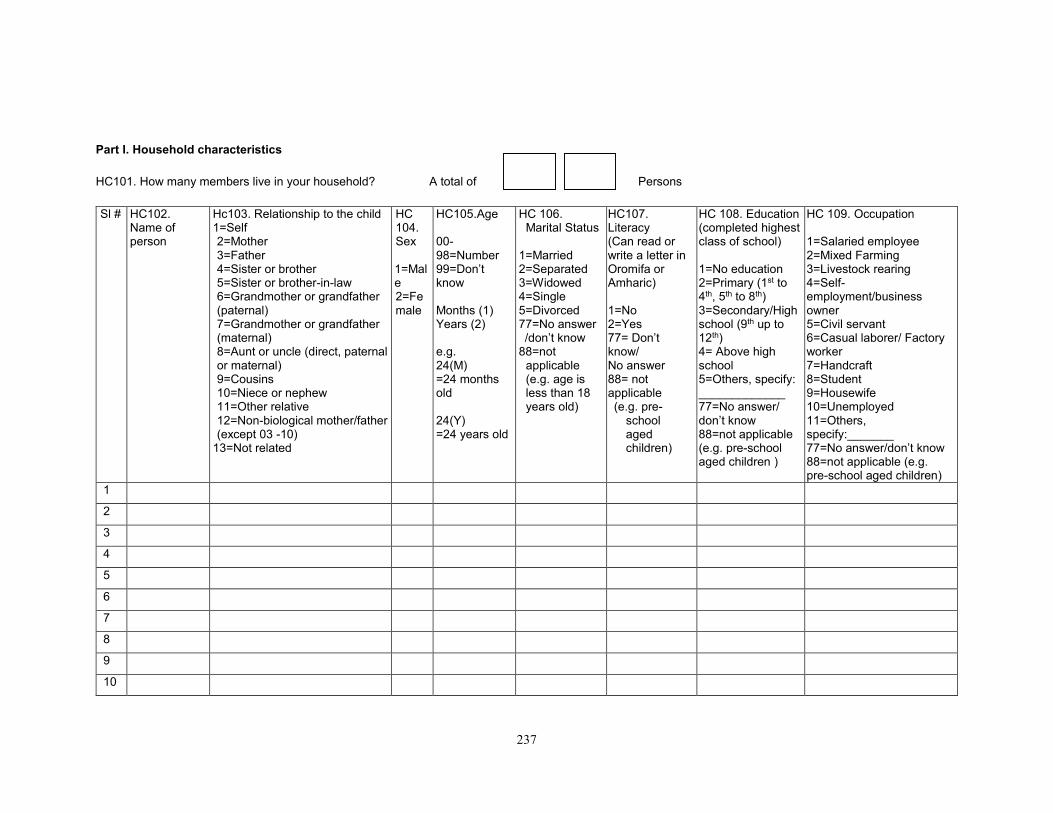
237
Part I. Household characteristics
HC101. How many members live in your household? A total of Persons
Sl # HC102. Name of person
Hc103. Relationship to the child 1=Self 2=Mother 3=Father 4=Sister or brother 5=Sister or brother-in-law 6=Grandmother or grandfather (paternal) 7=Grandmother or grandfather (maternal) 8=Aunt or uncle (direct, paternal or maternal) 9=Cousins 10=Niece or nephew 11=Other relative 12=Non-biological mother/father (except 03 -10)
13=Not related
HC 104. Sex 1=Male 2=Female
HC105.Age 00-98=Number 99=Don’t know Months (1) Years (2)
e.g. 24(M) =24 months old 24(Y) =24 years old
HC 106. Marital Status
1=Married 2=Separated 3=Widowed 4=Single 5=Divorced 77=No answer /don’t know 88=not
applicable (e.g. age is less than 18 years old)
HC107. Literacy (Can read or write a letter in Oromifa or Amharic) 1=No 2=Yes 77= Don’t know/ No answer 88= not applicable (e.g. pre-
school aged children)
HC 108. Education (completed highest class of school) 1=No education 2=Primary (1st to 4th, 5th to 8th) 3=Secondary/High school (9th up to 12th) 4= Above high school 5=Others, specify: _____________ 77=No answer/ don’t know 88=not applicable (e.g. pre-school aged children )
HC 109. Occupation 1=Salaried employee 2=Mixed Farming 3=Livestock rearing 4=Self-employment/business owner 5=Civil servant 6=Casual laborer/ Factory worker 7=Handcraft 8=Student 9=Housewife 10=Unemployed 11=Others, specify:_______ 77=No answer/don’t know 88=not applicable (e.g. pre-school aged children)
1
2
3
4
5
6
7
8
9
10
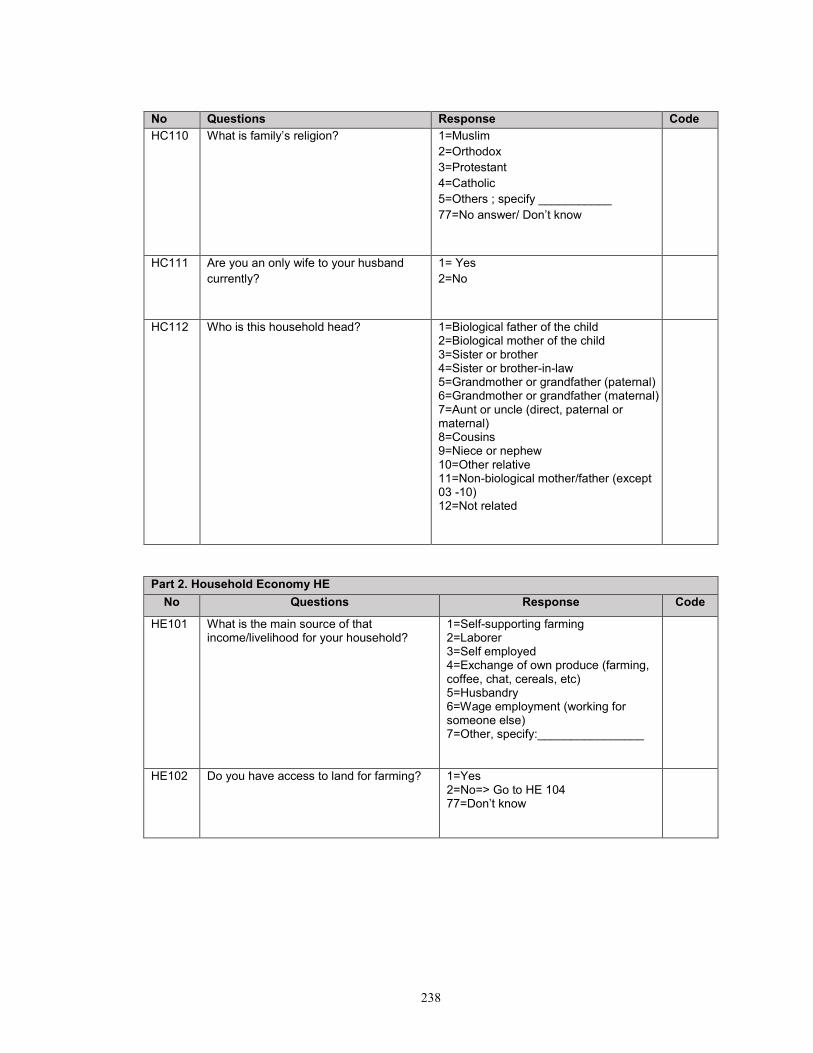
238
No Questions Response Code
HC110 What is family’s religion? 1=Muslim
2=Orthodox
3=Protestant
4=Catholic
5=Others ; specify ___________
77=No answer/ Don’t know
HC111 Are you an only wife to your husband
currently?
1= Yes
2=No
HC112 Who is this household head? 1=Biological father of the child 2=Biological mother of the child 3=Sister or brother 4=Sister or brother-in-law 5=Grandmother or grandfather (paternal) 6=Grandmother or grandfather (maternal) 7=Aunt or uncle (direct, paternal or maternal) 8=Cousins 9=Niece or nephew 10=Other relative 11=Non-biological mother/father (except 03 -10) 12=Not related
Part 2. Household Economy HE
No Questions Response Code
HE101 What is the main source of that income/livelihood for your household?
1=Self-supporting farming 2=Laborer 3=Self employed 4=Exchange of own produce (farming, coffee, chat, cereals, etc) 5=Husbandry 6=Wage employment (working for someone else) 7=Other, specify:________________
HE102 Do you have access to land for farming?
1=Yes 2=No=> Go to HE 104 77=Don’t know
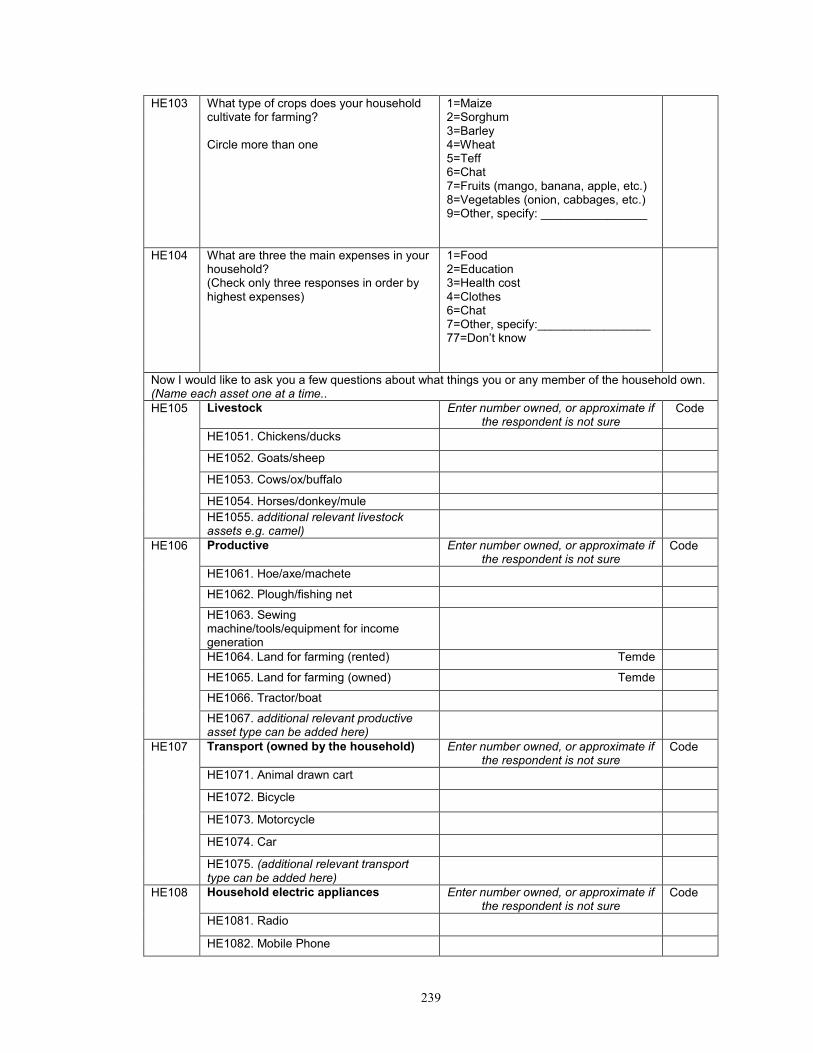
239
HE103
What type of crops does your household cultivate for farming? Circle more than one
1=Maize 2=Sorghum 3=Barley 4=Wheat 5=Teff 6=Chat 7=Fruits (mango, banana, apple, etc.) 8=Vegetables (onion, cabbages, etc.) 9=Other, specify: ________________
HE104 What are three the main expenses in your household? (Check only three responses in order by highest expenses)
1=Food 2=Education 3=Health cost 4=Clothes 6=Chat 7=Other, specify:_________________ 77=Don’t know
Now I would like to ask you a few questions about what things you or any member of the household own. (Name each asset one at a time..
HE105
Livestock
Enter number owned, or approximate if
the respondent is not sure Code
HE1051. Chickens/ducks
HE1052. Goats/sheep
HE1053. Cows/ox/buffalo
HE1054. Horses/donkey/mule
HE1055. additional relevant livestock assets e.g. camel)
HE106 Productive
Enter number owned, or approximate if the respondent is not sure
Code
HE1061. Hoe/axe/machete
HE1062. Plough/fishing net
HE1063. Sewing machine/tools/equipment for income generation
HE1064. Land for farming (rented) Temde
HE1065. Land for farming (owned) Temde
HE1066. Tractor/boat
HE1067. additional relevant productive asset type can be added here)
HE107 Transport (owned by the household) Enter number owned, or approximate if the respondent is not sure
Code
HE1071. Animal drawn cart
HE1072. Bicycle
HE1073. Motorcycle
HE1074. Car
HE1075. (additional relevant transport type can be added here)
HE108
Household electric appliances Enter number owned, or approximate if the respondent is not sure
Code
HE1081. Radio
HE1082. Mobile Phone

240
HE1083. TV
HE1084. Refrigerator
HE1085. Satellite antenna/generator
HE1086. Kerosene lamp
HE1087. (additional relevant asset can be added here)
HE109 Furniture Enter number owned, or approximate if the respondent is not sure
HE1091. Bed
HE1092. Mattress
HE1093. Pillow
HE1094. Carpet
HE1095. Table/chair/wardrobe
HE110 How long does it take from your household to the nearest market? 1 hour=60 minutes 1.5 hour=90 minutes 2 hour=120 minutes 2.5 hour=150 minutes
Minutes 77=Don’t know
HE 111
What is the closest health facility to your house? (Choose only one)
1=Health post 2=Health center 3=Clinic 4=Hospital 5=Traditional medicine facility 6=Other, specify:___parmasii_______________
HE 112
How long does it take for you to get to the health facility? 1 hour=60 minutes 1.5 hour=90 minutes 2 hour=120 minutes 2.5 hour=150 minutes
Minutes 77=Don’t know
Part 3 Status of Dwelling SD
No Questions Response Code
SD101. What is the ownership status of the dwelling you are currently living in?
1=Own without title deed 2=Own with title deed 3=Rent from a landlord without a rental contract 4=Rent from a landlord with a rental contract 5=Rent from a government with a contract 6=Living with family members, relatives 7=Living with friends 8=Squatting on land 9=Living on ancestral land / legal claim to land (no title deed, but secure) 10=Other, specify:________________

241
SD102. What is type of roof of your house made of?
1=Grass 2=Corrugated iron 3=Plastic 4=Stone 5=Other, specify:___________
SD103. What is type of floor of your house made of?
1=Earth/mud 2=Smeared with cow dung 3=Cemented 4=Other, specify:_______________
SD 104 How many rooms/partition have the residence of household to live in?
# of rooms/partition
SD105 Does the household have electricity? 1=Yes 2=No 77=Don’t know
Part III. Maternal Characteristics MC
This section is about experiences during the most recent pregnancy. "Name" is used to remind the interviewer to use the name of the youngest living child.
No Questions Response Code
MC101 Did you see anyone for antenatal care during your pregnancy with (name)?
1=Yes 2=No=> Go to MC 104 77= Don’t know /No Response
MC102 Whom did you see? Probe: Anyone else? Check all that apply.
1=Doctor 2=Nurse/midwife 3=Traditional birth attendant (TBA) 4=Health extension worker (HEW) 5=Volunteer community health worker (VCHW) 6=Another type of health provider 77=Don’t know/I can’t remember/no response
MC103 Did you receive any tetanus injection at any time before your pregnancy with (name), either to protect yourself or another baby?
1=Yes 2=No 77=Don't Know/I can’t remember/no response
MC104 When you were pregnant with (NAME), how did you eat than when you were not pregnant?
1=Less amount than when not pregnant 2=Same amount as not pregnant 3=More amount than when not pregnant77=Don't Know/I can’t remember
MC105 During your last pregnancy, did you
take any iron/folate supplements?
Please, show iron/folate tablets to
1=Yes 2=No => Go to MC107 77=Don’t know/no response
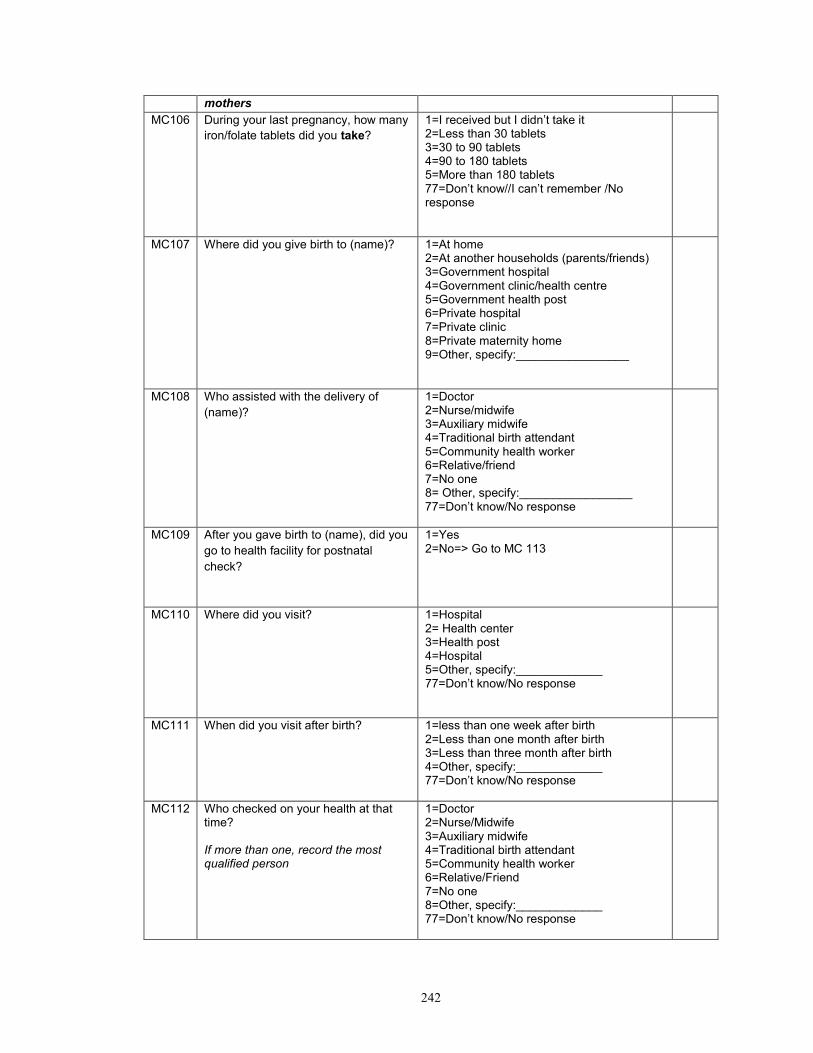
242
mothers
MC106 During your last pregnancy, how many
iron/folate tablets did you take?
1=I received but I didn’t take it 2=Less than 30 tablets 3=30 to 90 tablets 4=90 to 180 tablets 5=More than 180 tablets 77=Don’t know//I can’t remember /No response
MC107 Where did you give birth to (name)? 1=At home 2=At another households (parents/friends) 3=Government hospital 4=Government clinic/health centre 5=Government health post 6=Private hospital 7=Private clinic 8=Private maternity home 9=Other, specify:_________________
MC108 Who assisted with the delivery of
(name)?
1=Doctor 2=Nurse/midwife 3=Auxiliary midwife 4=Traditional birth attendant 5=Community health worker 6=Relative/friend 7=No one 8= Other, specify:_________________ 77=Don’t know/No response
MC109 After you gave birth to (name), did you
go to health facility for postnatal
check?
1=Yes 2=No=> Go to MC 113
MC110 Where did you visit?
1=Hospital 2= Health center 3=Health post 4=Hospital 5=Other, specify:_____________ 77=Don’t know/No response
MC111 When did you visit after birth?
1=less than one week after birth 2=Less than one month after birth 3=Less than three month after birth 4=Other, specify:_____________ 77=Don’t know/No response
MC112 Who checked on your health at that time? If more than one, record the most qualified person
1=Doctor 2=Nurse/Midwife 3=Auxiliary midwife 4=Traditional birth attendant 5=Community health worker 6=Relative/Friend 7=No one 8=Other, specify:_____________ 77=Don’t know/No response

243
MC113 In the first two months after your last delivery, did you (mother) receive a VITAMIN A dose? Show Vitamin A supplement
1=Yes 2=No 77=Don’t’ know/I don’t remember
MC114 Was the baby weighed at birth? 1=Yes 2=No => Go to Next section (K101) 77=Don’t’ know/I don’t remember
MC115 What was weight of the child at birth? .
Kg 77=I can’t remember
Part I. Child feeding and hygiene practices
Section 4. Breastfeeding practice (Asking only in 0 time)
No Questions Response Code
P101 Have you ever breast-fed the child
(name)?
1=Yes⇒Go to P103
2=No
P102 What is your reason for never breast
feeding the child (name)?
Circle all responses
1=Mother sick/weak
2=Child sick/weak
3=Breast disease
4=Not having enough breast milk
5=Breastmilk is not important to child
6=Other, specify:_________________
88=No answer
P103 How long after birth did you first put the
child (name) to the breast?
1=Within one hour
2=Within one day
3=After one day
77=I don’t know/I cannot remember
P104 Did you breast-feed the first milk
(colostrums) to your child (name) or
squeeze out and throw away?
1=Fed =>Go to P108
2=Throw away
P105 If you threw away the first milk, why did
you do so?
Circle all responses
1=Not good for the baby
2=Baby is thirsty
3=Baby cannot digest the first milk
4=It is yellow/thick
5=It is the tradition
6=Others, specify:
__________________
77=I don’t know/I cannot remember
P106 If you didn’t give the colostrums, what did
you then feed the child (name)?
1=Plain water
2=Water & sugar
3=Cow’s Milk
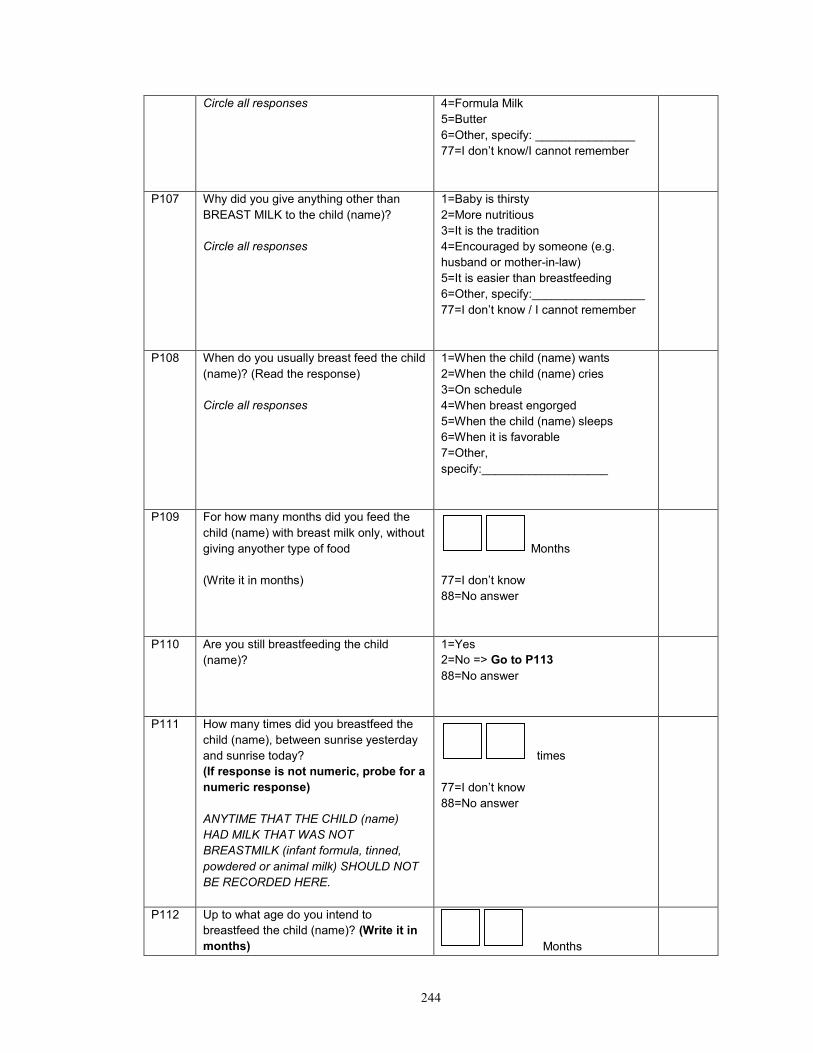
244
Circle all responses
4=Formula Milk
5=Butter
6=Other, specify: _______________
77=I don’t know/I cannot remember
P107 Why did you give anything other than
BREAST MILK to the child (name)?
Circle all responses
1=Baby is thirsty
2=More nutritious
3=It is the tradition
4=Encouraged by someone (e.g.
husband or mother-in-law)
5=It is easier than breastfeeding
6=Other, specify:_________________
77=I don’t know / I cannot remember
P108 When do you usually breast feed the child
(name)? (Read the response)
Circle all responses
1=When the child (name) wants
2=When the child (name) cries
3=On schedule
4=When breast engorged
5=When the child (name) sleeps
6=When it is favorable
7=Other,
specify:___________________
P109 For how many months did you feed the
child (name) with breast milk only, without
giving anyother type of food
(Write it in months)
Months
77=I don’t know
88=No answer
P110 Are you still breastfeeding the child
(name)?
1=Yes
2=No => Go to P113
88=No answer
P111 How many times did you breastfeed the
child (name), between sunrise yesterday
and sunrise today?
(If response is not numeric, probe for a
numeric response)
ANYTIME THAT THE CHILD (name)
HAD MILK THAT WAS NOT
BREASTMILK (infant formula, tinned,
powdered or animal milk) SHOULD NOT
BE RECORDED HERE.
times
77=I don’t know
88=No answer
P112 Up to what age do you intend to
breastfeed the child (name)? (Write it in
months)
Months

245
(After the Question112, Go to Question
115)
P113 Why did you stop breastfeeding for the
child (name)?
Circle all responses
1=Mother sick/weak
2=Child sick/weak
3=Breast nipple problem
4=Not enough milk
5=Mother return to work
6=Child refused
7=Weaning age/age to stop
8=Mother got pregnant
9=Mother started using contraceptives
10=Other,
specify:___________________
88=No answer
P114 What was the age of the child (name)
when you stopped breast feeding?
Months
77=I don’t know/ I cannot remember
88=No answer
P115 When you were pregnant or in the period
after delivery of the child (name) have you
ever been informed /advised about
breastfeeding?
1=Yes
2=No
88=No answer
Section 5. Child feeding and caring practice
No Questions Response Code
P116 Do you give any other complementary
food to the child (name) other than breast
milk?
1=Yes
2=No=> Go to P124
P117 At what age did you first introduce liquids
or foods (semi-solid or solid) other than
breast milk to the child (name)? (age in
months)
Months
77=I don’t know/I cannot remember
P118 How many times did the child (name)
have a meal over the past 24 hours,
between sunrise yesterday and sunrise
today?
Times
77=I don’t know/I cannot remember
P119 How many times did the child (name)
have a snack over the past 24 hours,
between sunrise yesterday and sunrise
Times

246
today?
77= I don’t know/I cannot remember
P120 I would like to ask you about the types of foods the child (name) has been fed over
the past 24 hours, from sunrise yesterday to sunrise today.
FOOD GROUP 1=Yes 2=No
P12001 Breast milk
P12002 Water
P12003 Formula
P12004 Animal milk (e.g. cow milk)
P12005 Honey
P12006 Other liquids (e.g. sugar water, coffee, tea, broth, soft
drinks)
P12007 Any food made from grains (e.g. millet, sorghum,
maize, rice, wheat, teff, ingera )
P12008 Any food made from pumpkins, carrots, red sweet
potatoes, mango, papaya
P12009 Any green leafy vegetables?
P12010 Any other fruits (bananas, tomatoes, apples,
avocados)
P12011 Any liver, kidney, heart or other organ meats
P12012 Any meat (e.g. beef, lamb, goat, chicken or duck)
P12013 Any food made from legumes or nuts (e.g. peas,
beans, lentils, peanuts)
P12014 Any food made with oil, fat or butter
P12015 Eggs
P12016 Fish
P12017 Cheese or yoghurt
P12018 Any sugary foods such as chocolates, sweets,
candies, pastries, cakes or biscuits, sugary juice?
P12019 Other(Specify):
Code
P121 What did you use to feed the child (name)
mashed or fluid foods between sunrise
yesterday and sunrise today?
Read responses
1=Bottle nipple
2=Cup and Spoon
3=His/her own plate
4=Family plate
5=Other, specify:_______
77=I don’t know

247
P122 According to you, at the time of preparing or
feeding porridge, what foods can you add to
make it more nutritious for the child (name)?
(mark all)
1=Add colored fruits and
vegetables
2=Add dark leafy vegetables
3=Add egg
4=Add lentils
5=Add fish or meat or liver
6=Add milk to porridge
7=Add a spoonful of oil
8=Give thicker porridge
9= Famix
77=I don’t know
Section 6. Hygiene practice
No Questions Response Code
P127 The last time the child (name) passed stools,
what was done to dispose of the stools?
1=Child used toilet/latrine
2=Put/rinsed into toilet or Latrine
3=Put/rinsed into drain or ditch
4=Thrown into garbage (solid
waste)
5=Buried
6=Left in the open field
7=Other, specify:
_______________
77= I don’t know/I cannot
remember
P128 During the last 24 hours, did you wash your
hands after you defecated? If yes, what did
you wash your hands with?
1=Yes, washed hands with running
water and soap
2=Yes, washed hands with running
water and ash
3=Yes, washed hands with running
water only
4=No, did not wash hands
P129 During the last 24 hours, did you wash your
hands after cleaning the child (name)’s
bottom? If yes, what did you wash your hands
with?
1=Yes, washed hands with running
water and soap
2=Yes, washed hands with running
water and ash
3=Yes, washed hands with running
water only
4=No, did not wash hands
P130 During the last 24 hours, did you wash your
hands before preparing food? If yes, what did
you wash your hands with?
1=Yes, washed hands with running
water and soap
2=Yes, washed hands with running
water and ash
3=Yes, washed hands with running
water only
4=No, did not wash hands

248
P131 During the last 24 hours, did you wash your
hands before feeding children? If yes, what
did you wash your hands with?
1=Yes, washed hands with running
water and soap
2=Yes, washed hands with running
water and ash
3=Yes, washed hands with running
water only
4=No, did not wash hands
Part II. Exposure to intervention
No Questions Response Code
Section 1. ENA counseling
EC101 In the past three months, has a volunteer community health worker (VCHW) or Health Extension Worker (HEW) ever visited your household?
1=Yes 2=No => Go to section 2. PD Hearth (EC 116)
EC102 How many times have you been visited by a VCHW or HEW in the last 3 months?
Times
EC103 When you were visited in the last 3 months, has the VCHW or HEW weighed your children?
1=Yes 2=No 77=I don’t know/I cannot remember
EC104 When you were visited in the last 3 months, has the VCHW or HEW measured your child’s Mid-Upper Arm Circumference (MUAC)?
1=Yes 2=No 77=I don’t know/I cannot remember
EC105 When you were visited in the last 3 months, has the VCHW or HEW given nutrition counseling on breastfeeding or complementary feeding or any nutrition related messages?
1=Yes 2=No => Go to EC114
77=I don’t know/I cannot remember => Go to EC114
EC106 What nutrition counseling messages can you remember? Circle all responses
Specify: _________________ 77=I don’t know/I cannot remember
EC107 How much were you satisfied with nutrition counseling visit by volunteer community health workers (VCHWs) or HEW? Read responses
1=Strongly agree 2=Agree 3=Neither agree nor disagree 4=Disagree 5=Strongly disagree
EC108 Why or why not were you satisfied/not satisfied with the nutrition counseling by VCHWs?
Specify____________________________

249
EC109 How much was the nutrition counseling useful for you? Read responses
1=Strongly agree 2=Agree 3=Neither agree nor disagree 4=Disagree 5=Strongly disagree
EC110 Why or why not was the nutrition counseling message useful to you?
Specify____________________________
EC111 While you are counseled by a VCHW or HEW, did she use any counseling card/booklet?
1=Yes 2=No
EC112 In the past three months, have you ever delivered or shared nutrition counseling messages to anyone?
1=Yes 2=No => Go to EC 114 77=I don’t know/I cannot remember
EC113 To whom did you share/deliver nutrition counseling messages that you’ve counseled?
1=Neighboring mothers in the same Kebelle 2=Relatives living in the same Kebelle 3=Religious members in the same Kebelle 4=Community social group in the same Kebelle 5=Friends living in the same village/Kebelle 6=Relatives living in the different Kebelle 7=Friends living in the different Kebelle 8=Others, specify____________________ 77=I don’t know/I cannot remember
EC114 In the past three months, have you heard of similar nutrition messages from neighboring mothers other than VCHWs?
1=Yes 2=No => Go to Section 2 (EC 116)
77=I don’t know
EC115 Could you recall the nutrition message heard from the neighboring mothers specifically? Circle all responses
specify: ______________ 77=I don’t know/I cannot remember
Section 2. PD Hearth session
No Questions Response Code
EC116 In the last three months, have you ever participated at PD Hearth?
1=Yes
2=No⇒Go to EC 118

250
EC117 What kind of PD practices have you still kept practicing that you learned from the PD Hearth session? Circle all responses After asking this question, go to EC121
1=Preparing of nutrient dense complementary food 2=Responsive (active) feeding 3=Feeding times appropriate for child age 4=Drinking water from safe source 5=Water is treated (Boiled/chlorine/covered) 6=Cleanness of House 7=Cleanness of food utensils 8=Hand washing 9=Feeding during illness 10=Health seeking practice (e.g. asking health professionals, health facility visiting etc.) 11=Other, specify: ______________
EC118 In the past three months, have you ever met any mother/neighbors who ever participated at PD Hearth?
1=Yes 2=No => Go to EC 128
77=I don’t know/I cannot remember
EC119 What kind of nutrition information did you receive from the mother/neighbors who participated at PD Hearth? Circle all responses
1=Preparing of nutrient dense complementary food 2=Responsive (active) feeding 3=Feeding times appropriate for child age 4=Drinking water from safe source 5=Water is treated (Boiled/chlorine/covered) 6=Cleanness of House 7=Cleanness of food utensils 8=Hand washing 9=Feeding during illness 10=Health seeking practice ( e.g. asking health professionals, health facility visiting) 11=Other, specify:_______________
EC120 What kind of practices have you kept practicing from the information that PD Hearth participating mothers/neighbors shared with you? Circle all responses
1=Preparing of nutrient dense complementary food 2=Responsive (active) feeding 3=Feeding times appropriate for child age 4=Drinking water from safe source 5=Water is treated (Boiled/chlorine/covered) 6=Cleanness of House 7=Cleanness of food utensils 8=Hand washing 9=Feeding during illness 10=Health seeking practice ( e.g. asking health professionals, health facility visiting) 11=Other, specify:_______________
EC121 In the past three months, have you ever delivered or shared PD Hearth practices to anyone?
1=Yes 2=No => Go to EC 128
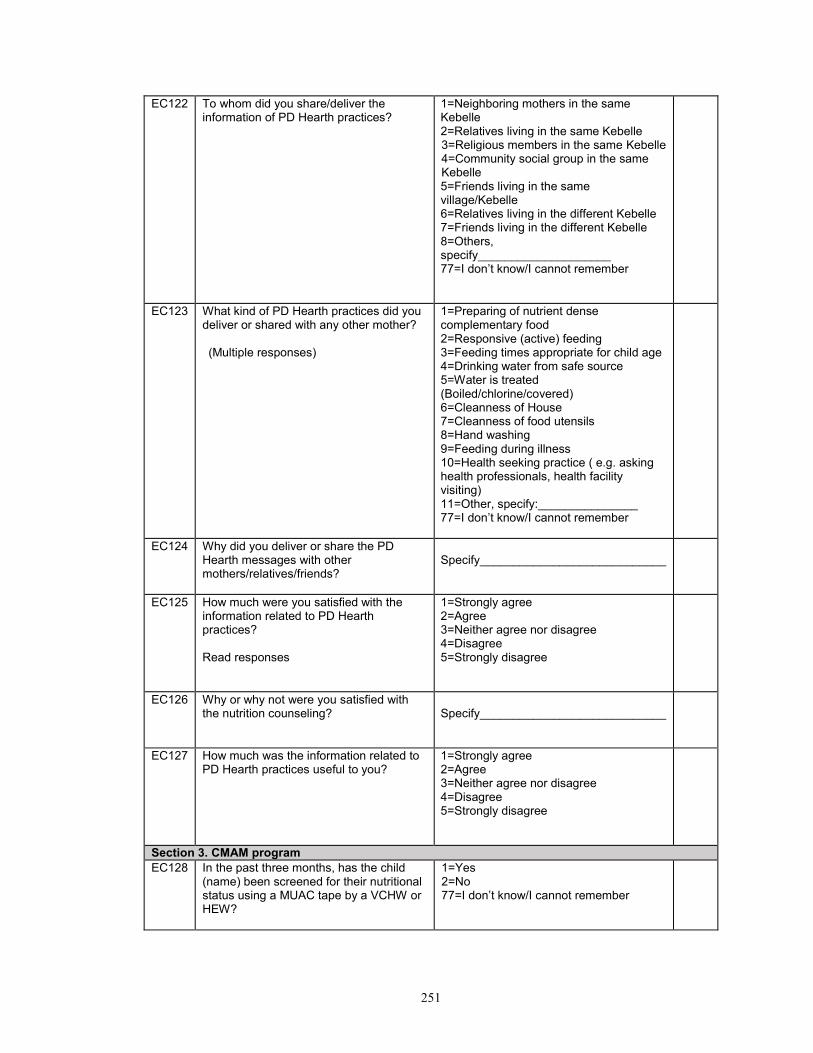
251
EC122 To whom did you share/deliver the information of PD Hearth practices?
1=Neighboring mothers in the same Kebelle 2=Relatives living in the same Kebelle 3=Religious members in the same Kebelle 4=Community social group in the same Kebelle 5=Friends living in the same village/Kebelle 6=Relatives living in the different Kebelle 7=Friends living in the different Kebelle 8=Others, specify____________________ 77=I don’t know/I cannot remember
EC123 What kind of PD Hearth practices did you deliver or shared with any other mother? (Multiple responses)
1=Preparing of nutrient dense complementary food 2=Responsive (active) feeding 3=Feeding times appropriate for child age 4=Drinking water from safe source 5=Water is treated (Boiled/chlorine/covered) 6=Cleanness of House 7=Cleanness of food utensils 8=Hand washing 9=Feeding during illness 10=Health seeking practice ( e.g. asking health professionals, health facility visiting) 11=Other, specify:_______________ 77=I don’t know/I cannot remember
EC124 Why did you deliver or share the PD Hearth messages with other mothers/relatives/friends?
Specify____________________________
EC125 How much were you satisfied with the information related to PD Hearth practices? Read responses
1=Strongly agree 2=Agree 3=Neither agree nor disagree 4=Disagree 5=Strongly disagree
EC126 Why or why not were you satisfied with the nutrition counseling?
Specify____________________________
EC127 How much was the information related to PD Hearth practices useful to you?
1=Strongly agree 2=Agree 3=Neither agree nor disagree 4=Disagree 5=Strongly disagree
Section 3. CMAM program
EC128 In the past three months, has the child (name) been screened for their nutritional status using a MUAC tape by a VCHW or HEW?
1=Yes 2=No 77=I don’t know/I cannot remember

252
EC129 Did the child (name) have a ration card from the recent screening?
1=Yes 2=No => Go toFH101 77=I cannot remember
EC130 How many times has your family (or you?) collected food rations from the time of the initial screening to the time of the recent screening?
1=Once 2=Twice 3=More than three times 77=I don’t know
Part Ⅳ. Food security and coping strategy
Section 1. Food security and hunger
No Questions Response Code
FH101 In the past four weeks, did you worry that
your household would not have enough
food?
1=Yes
2=No⇒Go to FH103
77=I don’t know⇒Go to FH103
FH102 How often did this happen? 1=Rarely (once or twice in the past four
weeks)
2=Sometimes (three to ten times in the
past four weeks)
3=Often (more than ten times in the
past four weeks)
77=I don’t know
FH103 In the past four weeks, were you or any
household member not able to eat the kinds
of foods you preferred because of a lack of
resources?
1=Yes
2=No⇒Go to FH105
77=I don’t know⇒Go to FH105
FH104 How often did this happen? 1=Rarely (once or twice in the past four
weeks)
2=Sometimes (three to ten times in the
past four weeks)
3=Often (more than ten times in the
past four weeks)
77=I don’t know
FH105 In the past four weeks, did you or any
household member have to eat a limited
variety of foods due to a lack of resources?
1=Yes
2=No⇒Go to FH107
77=I don’t know⇒Go to FH107
FH106 How often did this happen? 1=Rarely (once or twice in the past four
weeks)
2=Sometimes (three to ten times in the
past four weeks)

253
3=Often (more than ten times in the
past four weeks)
77=I don’t know
FH107 In the past four weeks, did you or any
household member have to eat some foods
that you really did not want to eat because of
a lack of resources to obtain other types of
food?
1=Yes
2=No=>Go to FH109
77=I don’t know =>Go to FH109
FH108 How often did this happen? 1=Rarely (once or twice in the past four
weeks)
2=Sometimes (three to ten times in the
past four weeks)
3=Often (more than ten times in the
past four weeks)
77=I don’t know
FH109 In the past four weeks, did you or any
household member have to eat a smaller
meal than you felt you needed because
there was not enough food?
1=Yes
2=No =>Go to FH111
77=I don’t know =>Go to FH111
FH110 How often did this happen? 1=Rarely (once or twice in the past four
weeks)
2=Sometimes (three to ten times in the
past four weeks)
3=Often (more than ten times in the
past four weeks)
77=I don’t know
FH111 In the past four weeks, did you or any other
household member have to eat fewer meals
in a day because there was not enough
food?
1=Yes
2=No=>Go to FH113
77=I don’t know =>Go to FH113
FH112 How often did this happen? 1=Rarely (once or twice in the past four
weeks)
2=Sometimes (three to ten times in the
past four weeks)
3=Often (more than ten times in the
past four weeks)
77=I don’t know
FH113 In the past four weeks, was there ever no
food to eat of any kind in your household
because of lack of resources to get food?
1=Yes
2=No =>Go to FH 115
77=I don’t know =>Go to FH 115
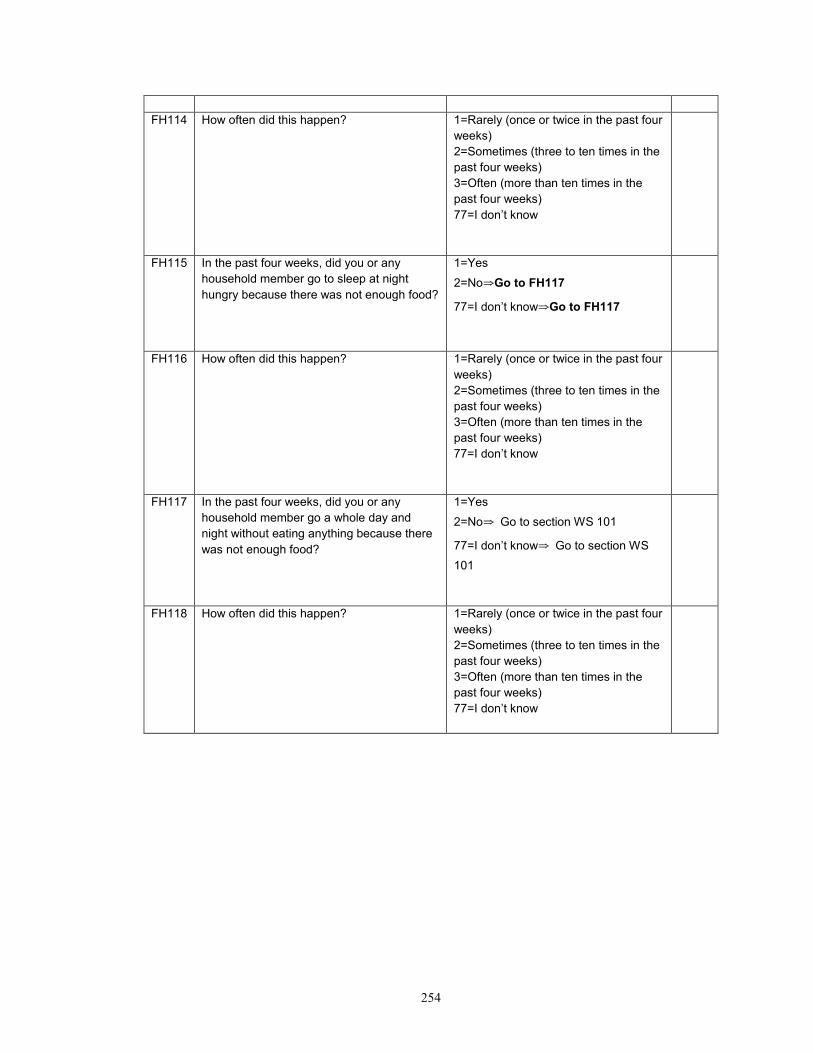
254
FH114 How often did this happen? 1=Rarely (once or twice in the past four
weeks)
2=Sometimes (three to ten times in the
past four weeks)
3=Often (more than ten times in the
past four weeks)
77=I don’t know
FH115 In the past four weeks, did you or any
household member go to sleep at night
hungry because there was not enough food?
1=Yes
2=No⇒Go to FH117
77=I don’t know⇒Go to FH117
FH116 How often did this happen? 1=Rarely (once or twice in the past four
weeks)
2=Sometimes (three to ten times in the
past four weeks)
3=Often (more than ten times in the
past four weeks)
77=I don’t know
FH117 In the past four weeks, did you or any
household member go a whole day and
night without eating anything because there
was not enough food?
1=Yes
2=No⇒ Go to section WS 101
77=I don’t know⇒ Go to section WS
101
FH118 How often did this happen? 1=Rarely (once or twice in the past four
weeks)
2=Sometimes (three to ten times in the
past four weeks)
3=Often (more than ten times in the
past four weeks)
77=I don’t know

255
Part Ⅴ. Water and sanitation (WATSAN)
No Questions Response Code
WS101 What is the main source of drinking water in your house?
1=Public tap/standpipe 2=Tube well/borehole 3=Protected well 4=Unprotected well 5=Protected spring 6=Unprotected spring 7=Surface water (river, stream, dam, lake, pond, canal, irrigation channel) 8=Collected rain water 9=Other, specify:____________________
WS102 How long does it take you to go to collect drinking water, get water and come back? If water source is piped into the house/yard/plot, record 00 minute 1 hour = 60 minutes 1.5 hour = 90 minutes 2 hour= 120 minutes 2.5 hour= 150 minutes
Minutes 77=I don’t know
WS103 How do you usually treat the drinking water?
1=Boil 2=Add bleach/chlorine/Wuha Agar 3=Strain it through a cloth 4=Use water filter 5=Let it stand and settle/sedimentation 6=Nothing 7=Other, specify:________________
WS104 Which water collection instrument
does your household use?
Read responses
1=Jar Can/Bido10L
2=Jar Can/Bido 20L (medium size)
3=Jar Can/Bido 25L
4=Traditional pot 9L (medium size)
5=Other, specify:______________________
WS105 In the past three months, with the
water collection instrument above
mentioned, how many times did you
collect water in a day on average?
Times
77=I don’t know
WS106 In the past three months, with the
water collection instrument above
mentioned
how many water collection instruments
did you use in a day on average?
Jars/Bidos/pots
77=I don’t know
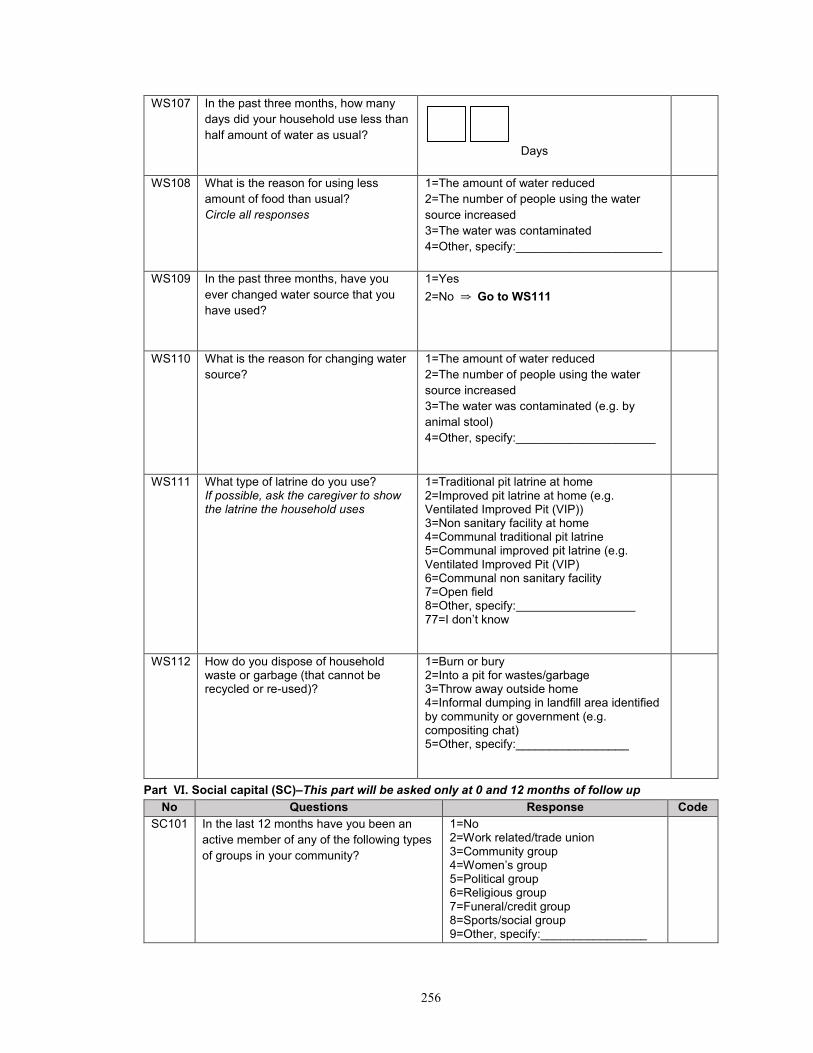
256
WS107 In the past three months, how many
days did your household use less than
half amount of water as usual?
Days
WS108 What is the reason for using less
amount of food than usual?
Circle all responses
1=The amount of water reduced
2=The number of people using the water
source increased
3=The water was contaminated
4=Other, specify:______________________
WS109 In the past three months, have you
ever changed water source that you
have used?
1=Yes
2=No ⇒ Go to WS111
WS110 What is the reason for changing water
source?
1=The amount of water reduced
2=The number of people using the water
source increased
3=The water was contaminated (e.g. by
animal stool)
4=Other, specify:_____________________
WS111 What type of latrine do you use? If possible, ask the caregiver to show the latrine the household uses
1=Traditional pit latrine at home 2=Improved pit latrine at home (e.g. Ventilated Improved Pit (VIP)) 3=Non sanitary facility at home 4=Communal traditional pit latrine 5=Communal improved pit latrine (e.g. Ventilated Improved Pit (VIP) 6=Communal non sanitary facility 7=Open field 8=Other, specify: 77=I don’t know
WS112 How do you dispose of household waste or garbage (that cannot be recycled or re-used)?
1=Burn or bury 2=Into a pit for wastes/garbage 3=Throw away outside home 4=Informal dumping in landfill area identified by community or government (e.g. compositing chat) 5=Other, specify:_________________
Part Ⅵ. Social capital (SC)–This part will be asked only at 0 and 12 months of follow up
No Questions Response Code
SC101 In the last 12 months have you been an
active member of any of the following types
of groups in your community?
1=No 2=Work related/trade union 3=Community group 4=Women’s group 5=Political group 6=Religious group 7=Funeral/credit group 8=Sports/social group 9=Other, specify:________________

257
77=I don’t know
SC102 In the last 12 months, did you receive from
the following group any emotional help,
economic help or assistance in helping you
know or do things?
1=No 2=Family 3=Neighbors 4=Friends who are not neighbors 5=Community leaders 6=Religious leader 7=Politicians 8=Government officials/civil service 9=Charitable organizations/NGO 10=Other,
specify:___________________
77=I don’t know
SC103 In the last 12 months, have you joined together with other community members to address a problem or common issue?
1=Yes
2=No
SC104 In the last 12 months, have you talked with a local authority or governmental organization about problems in this community?
1=Yes
2=No
SC105 In general, can the majority of people in this community be trusted?
1=Yes
2=No
77=I don’t know
SC106 Do the majority of people in this community generally get along with each other?
1=Yes
2=No
77=I don’t know
SC107 Do you feel as if you are really a part of this community?
1=Yes
2=No
77=I don’t know
SC108 Do you think that the majority of people in this community would try to take advantage of you if they got the chance?
1=Yes
2=No
77=I don’t know
PLEASE SAY TO MOTHER ‘THANK YOU VERY MUCH!’
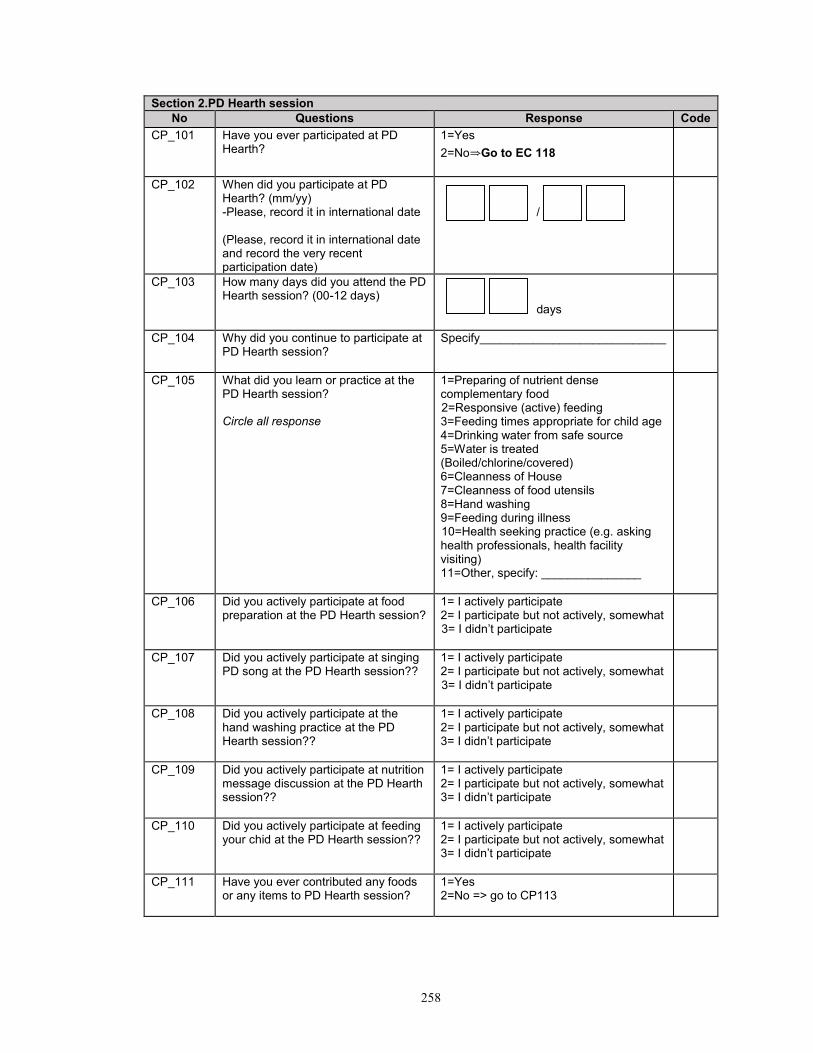
258
Section 2.PD Hearth session
No Questions Response Code
CP_101 Have you ever participated at PD Hearth?
1=Yes
2=No⇒Go to EC 118
CP_102
When did you participate at PD Hearth? (mm/yy) -Please, record it in international date (Please, record it in international date and record the very recent participation date)
/
CP_103 How many days did you attend the PD Hearth session? (00-12 days)
days
CP_104 Why did you continue to participate at PD Hearth session?
Specify____________________________
CP_105 What did you learn or practice at the PD Hearth session? Circle all response
1=Preparing of nutrient dense complementary food 2=Responsive (active) feeding 3=Feeding times appropriate for child age 4=Drinking water from safe source 5=Water is treated (Boiled/chlorine/covered) 6=Cleanness of House 7=Cleanness of food utensils 8=Hand washing 9=Feeding during illness 10=Health seeking practice (e.g. asking health professionals, health facility visiting) 11=Other, specify: _______________
CP_106 Did you actively participate at food preparation at the PD Hearth session?
1= I actively participate 2= I participate but not actively, somewhat 3= I didn’t participate
CP_107 Did you actively participate at singing PD song at the PD Hearth session??
1= I actively participate 2= I participate but not actively, somewhat 3= I didn’t participate
CP_108 Did you actively participate at the hand washing practice at the PD Hearth session??
1= I actively participate 2= I participate but not actively, somewhat 3= I didn’t participate
CP_109 Did you actively participate at nutrition message discussion at the PD Hearth session??
1= I actively participate 2= I participate but not actively, somewhat 3= I didn’t participate
CP_110 Did you actively participate at feeding your chid at the PD Hearth session??
1= I actively participate 2= I participate but not actively, somewhat 3= I didn’t participate
CP_111 Have you ever contributed any foods or any items to PD Hearth session?
1=Yes 2=No => go to CP113

259
CP_112 What did you contribute to PD Hearth session? Circle all response
1=Cooking pots/cooking utencils 2=Bowls/water pictcers/basins 3=Spoons/cups 4=Soap 5=Mats 6=Fuel/firewoods 7=foods 8=others, specify_____________
CP_113 What food items were included in the menu prepared in PD Hearth session? Circle all response
1=Grains (e.g. sorghum, teff, wheat, rice, maize, millet, barley etc) 2=Yellow-color vegetables (pumpkin, carrot, tomato) 3=Green-leafy vegetables 4=sweet potato/potato/yams 5=Fruites 6=Egg or meat 7=Oil 8=Legumes (bean, chick pea etc) 9=Milk (e.g. cow or goat milk) 10=others, specify_____________
CP_114 How many days did you contribute to PD Hearth session?
Days
CP_115 How many days did PD superviors/PD operators visit your households after the end of PD Hearth session?
1=No visit => Go to CP 117 2=1-2 visit 3=3-4 visit 4=5-6 visit 5=more than 7 days
CP_116 What comments PD supervisor/PD operator give you during follow-up visit?
1=They didn’ give any comments 2=Preparing of nutrient dense complementary food 3=Responsive (active) feeding 4=Feeding times appropriate for child age 5=Drinking water from safe source 6=Water is treated (Boiled/chlorine/covered) 7=Cleanness of House 8=Cleanness of food utensils 9=Hand washing 10=Feeding during illness 11=Health seeking practice (e.g. asking health professionals, health facility visiting) 12=Other, specify: _______________
CP_117 Do you prepare child foods as likely that you learned in PD Hearth?
1=Yes => Go to CP_118_1 2=No => Go to CP _118_2 3=I don’t know/I can’t remember

260
CP_118_1 What food items did you include in your child foods, based on the lessons in the PD Hearth session? Circle all response
1=Grains (e.g. sorghum, teff, wheat, rice, maize, millet, barley etc) 2=Yellow-color vegetables (pumpkin, carrot, tomato) 3=Green-leafy vegetables 4=sweet potato/potato/yams 5=Fruites 6=Egg or meat 7=Oil 8=Legumes (bean, chick pea etc) 9=Milk (e.g. cow or goat milk) 10=others, specify_____________
CP_118_2 What food items did you include in your child foods? Circle all response
1=Grains (e.g. sorghum, teff, wheat, rice, maize, millet, barley etc) 2=Yellow-color vegetables (pumpkin, carrot, tomato) 3=Green-leafy vegetables 4=sweet potato/potato/yams 5=Fruites 6=Egg or meat 7=Oil 8=Legumes (bean, chick pea etc) 9=Milk (e.g. cow or goat milk) 10=others, specify_____________
EC117 What kind of PD practiceshave you still kept practicing that you learned from the PD Hearth session? Circle all responses
1=Preparing of nutrient dense complementary food 2=Responsive (active) feeding 3=Feeding times appropriate for child age 4=Drinking water from safe source 5=Water is treated(Boiled/chlorine/covered) 6=Cleanness of House 7=Cleanness of food utensils 8=Hand washing 9=Feeding during illness 10=Health seeking practice (e.g. asking health professionals, health facility visiting etc.) 11=Other, specify: ______________
CP_119 Can you confidently practice what you learned in PD Hearth? Read responses
1=Strongly agree that I confidently practice 2=Agree I confidently practice 3=Neither agree nor disagree I confidently practice 4=Disagree I confidently practice 5=Strongly disagree I confidently practice
CP_120 How much were you satisfied with the information related toPD Hearth practices? Read responses
1=Strongly agree that I was satisfied 2=Agree that I was satisfied 3=Neither agree nor disagree that I was satisfied 4=Disagree that I was satisfied 5=Strongly disagree that I was satisfied

261
CP_121 Why or why not were you satisfied with the information related to PD Hearth practices?
Specify____________________________
CP_122 How much was the information related to PD Hearth practices useful to you? Read responses
1=Strongly agree that it was useful 2=Agree that it was useful 3=Neither agree nor disagree that it was useful 4=Disagree that it was useful 5=Strongly disagree that it was useful
CP_123 Why was the information related to PD Hearth usful to you? AFTER THIS QUESTION, PLEASE GO TO EC 121
Specify____________________________
EC118 In the past three months, have you ever met any mother/neighbors who ever participated at PD Hearth?
1=Yes 2=No => Go to EC 131
77=I don’t know/I cannot remember
EC119 What kind of nutrition information did you receive from the mother/neighbors who participated at PD Hearth? Circle all responses
1=Preparing of nutrient dense complementary food 2=Responsive (active) feeding 3=Feeding times appropriate for child age 4=Drinking water from safe source 5=Water is treated (Boiled/chlorine/covered) 6=Cleanness of House 7=Cleanness of food utensils 8=Hand washing 9=Feeding during illness 10=Health seeking practice ( e.g. asking health professionals, health facility visiting) 11=Other, specify:_______________
EC120 What kind of practiceshave you kept practicing from the information that PD Hearth participating mothers/neighbors shared with you? Circle all responses
1=Preparing of nutrient dense complementary food 2=Responsive (active) feeding 3=Feeding times appropriate for child age 4=Drinking water from safe source 5=Water is treated (Boiled/chlorine/covered) 6=Cleanness of House 7=Cleanness of food utensils 8=Hand washing 9=Feeding during illness 10=Health seeking practice ( e.g. asking health professionals, health facility visiting) 11=Other, specify:_______________
EC121 In the past three months, have you ever delivered or shared PD Hearth practices to anyone?
1=Yes 2=No =>Go to EC 131

262
EC122 To whom did you share/deliver the information of PD Hearth practices?
1=Neighboring mothers in the same Kebelle 2=Relatives living in the same Kebelle 3=Religious members in the same Kebelle 4=Community social group in the same Kebelle 5=Friends living in the same village/Kebelle 6=Relatives living in the different Kebelle 7=Friends living in the different Kebelle 8=Others, specify____________________ 77=I don’t know/I cannot remember
EC123 What kind of PD Hearth practices did you deliver or shared with any other mother? (Multiple responses)
1=Preparing of nutrient dense complementary food 2=Responsive (active) feeding 3=Feeding times appropriate for child age 4=Drinking water from safe source 5=Water is treated (Boiled/chlorine/covered) 6=Cleanness of House 7=Cleanness of food utensils 8=Hand washing 9=Feeding during illness 10=Health seeking practice ( e.g. asking health professionals, health facility visiting) 11=Other, specify:_______________ 77=I don’t know/I cannot remember
Section 3.CMAM program
EC131 In the last three month, did your child have Plumpy-Nut (Local name)?
1=Yes 2=No=> Go to EC134
EC132 For how many days did your child receive Plumy-Nut (or stay at OTP program)?
Days Days
EC133 Was the Plumpy Nut for your malnourished child used for other siblings in your household?
1=Yes 2=No
EC134 In the last three month, did your child have Famix (Corn soy blend) and oil?
1=Yes 2=No=> Go to SC108
EC135
How many round did your child/mother (PLW ) receive Famix and oil?
Round

263
Appendix E.1 CPNP attendance book (English version)
Part I. Child registration Part I. Child Registration (This table will be filled up by the PD Operator)
Name of Child Mother's Name
Father's Name
Child's Sex (M/F)
Date of Birth (mm/dd/yyyy)
Age (months)
Vitamin A (Y/N)
Full Immunization
(Y/N)
1
2
3
4
5
6
7
8
9
10
Name of Kebelle_______________________ Name of PD Supervisor___________________
Name of Village _______________________ Name of PD Operator ____________________
Number of Hearth session__________________ Hearth Session Dates: From___________ To____________
Name of Volunteer________________________

264
Part II. Monitoring of weight gain This table will be filled up by volunteer community health worker, managed into two copies by VCHW and PD supervisor, and PD supervisor will have ultimate responsibility of the forms)
Name of Child Day 1, Weight (Kg.g)
Day 12, Weight (Kg.g)
Day 12 – Day 1
(g)
1 month, Weight (Kg.g)
1month, Weight – Day 1(g)
3 month, Weight (Kg.g)
3 month – Day I (g)
6 month, Weight (Kg.g)
12month, Weight (Kg.g)
1
2
3
4
5
6
7
8
9
10
Name of Kebelle_______________________ Name of PD Supervisor___________________
Name of Village _______________________ Name of PD Operator ____________________
Number of Hearth session__________________ Hearth Session Dates: From_______ To___________
Name of Volunteer_______________________________

265
Part III. Child attendance form (This table will be filled up by PD Operator)
Days of Hearth A total
days of
attendance 1 2 3 4 5 6 7 8 9 10 11 12
1
2
3
4
5
6
7
8
9
10
Name of Kebelle_______________________ Name of PD Supervisor___________________
Name of Village _______________________ Name of PD Operator ____________________
Number of Hearth session__________________ Hearth Session Dates: From ____________To ____________
Name of Volunteer_____________________________

266
Appendix E.2 CPNP session observation checklists (English version)
PD Hearth_Supervision of Hearth session: module 8
OBSERVATION LIST
Day #
Day #
Day # Total
Answer with Yes (Y) or No (N) or Somewhat (S) or a number where appropriate. Add comments to explain answers.
Location of Session:
PD801 Water from safe source
PD802 Drinking water is treated (Boiled/chlorine/covered)
PD803 Latrine available
PD804 Cleanliness of PD Hearth place
PD805 Cleanliness of food utensils
PD806 Session is conducted by PD operator
PD807 Session is supported By Health Extension Workers
PD808 Evidence of being supported by HEW
PD809 Session is supported By Volunteer Community Health Workers (VCHWs)
PD810 Evidence of being supported by Session is supported By VCHWs
PD811 Number of caregivers attending
PD812 Number of children attending
PD813 Hand washing is practiced: By caregivers before feeding
PD814 Hand washing is practiced: By caregivers before food preparation
PD815 Hand washing is practiced: By children before feeding
PD816 Number of caregivers who brought food items, oil, and firewood etc.
PD817 Menu use based on local and affordable food
PD818 Food is prepared according to menu
PD819 List of food item
Day #__________ 1) 2) 3) 4) 5) 6) 7) 8)
Day #__________ 1) 2) 3) 4) 5) 6) 7) 8)
Day #__________ 1) 2) 3) 4) 5) 6) 7) 8)
Name of Kebelle________________ Name of PD Supervisor_____________
Name of Village ________________ Name of PD Operator ______________
Number of Hearth session________
This form will be filled up by PD Supervisors
Date____________________________

267
Number of caregivers present and actively participate:
PD820 in food preparation
PD821 In actively feeding their child
PD822 in singing a song
PD823 Size of portion served is age appropriate
PD824 Number of children who are offered enough food
PD825 Number of children who eat very well
PD826 Number of children who do not eat foods (e.g. sick child)
PD827 Key nutrition/health message discussed (Y/N)
PD828
Describe the key message of session
Day #__________
Day #__________
Day #__________
PD829 Caregivers express being motivated by changes in child (Please ask a few mothers, listen their reply, and check it)
PD830 Caregivers can say what to do when child is sick (Please ask a few mothers, listen their reply, and check it)

268
Appendix F.1 Institutional Review Board (IRB) approval document (original version)

269

270
Appendix F.2 Institutional Review Board (IRB) approval document (English translated
version)

271
Appendix G.1 Certification of government-registered translator

272
CURRICULUM VITAE
YUN HEE KANG , MS, PHD(C)
PERSONAL DATA
EDUCATION AND TRAINING 2009-present PhD Candidate in International Health
Human Nutrition Program, International Health Department, Johns Hopkins
Bloomberg School of Public Health, Baltimore, MD, USA
Dissertation: Effectiveness of a Community-Based Participatory Nutrition
Promotion Program to Improve Child Nutritional Status in Eastern Rural
Ethiopia: a Cluster Randomized Trial (Advisor: Dr. Parul Christian)
2001 MS, Food Science and Nutrition Food Science and Nutrition with concentration in Food Microbiology,
Department of Home Ecology, Seoul National University, Seoul, South Korea
Thesis: Development of foreign-gene expression system for Bifidobacterium
longum GE1 (Advisor: Dr. Geunok Ji).
1994-1998 BS, Food Science and Nutrition Food Science and Nutrition, Seoul National University, Seoul, South Korea
PROFESSIONAL EXPERIENCE
2012-2014
Principal Investigator
Operation Research Project of Ethiopia Integrated Nutrition Project (EINP),
World Vision Korea/World Vision Ethiopia/Wholistic Interest Through Health
(WITH), Ethiopia (Supervisor: Sungtae Kim, World Vision Korea)
Principal Responsibilities:
▪ Participated in preparing EINP proposal ($1,100,000, funded by KOICA)
▪ Prepared a research proposal ($100,000, funded by World Vision Korea)
▪ Trained data collection team and data management team, and managed data
collection
▪ Performed data analysis and wrote papers
2007-2009 Senior Researcher
Nutrition Research team, WITH, Seoul, Korea
Principal Responsibilities:
▪ Coordinated a seminar (title: Balance) on undernutrition situation and
response strategies in developing countries’ (May 2009).
Home Address
929 N Wolfe St., 519B
Baltimore, MD 21205
Phone: 1-443-742-0242
E-mail: [email protected]
Office Address
Human Nutrition Program
International Health Department
The Johns Hopkins University
Bloomberg School of Public Health
615 North Wolfe St., W2501
Baltimore, MD 21205
273
▪ Edited a journal, ‘Nutrition Action Vol.1’ to introduce nutrition and health
programs of Korean NGOs and its research results.
▪ Produced nutrition education and training manuals for individuals working in
developing countries,
▪ Coordinated a special exhibition ‘The suffering global community Yellow
Window’ in a Christian mission conference (Mission Korea 2008), Korea.
▪ Conducted community assessment surveys for nutrition program development
in Myanmar (2008), Cambodia (2008), and Bangladesh (2005), and prepared
reports on nutrition programs of NGSs.
2002-2004 Researcher
Nutrition Research team, WITH, Seoul, Korea (Supervisor: Ms. Jisung Woo)
Principal Responsibilities:
▪ Developed nutritional index to compare health and nutrition situation of
developing countries
▪ Coordinated the nutrition seminar (title: Yellow Window) to introduce
undernutrition situation in developing countries
▪ Conducted community nutrition education projects for the elderly and
children in In-jae, Korea and in Yanbian, China
RESEARCH EXPERIENCE
Field Research
2007-2008 Project Manager & Primary Instructor
Strategy Research team, WITH
Principal Responsibilities:
▪ Coordinated research projects:
“Community assessment surveys in Myanmar,”
“Community Assessment Survey of Kandal and Prey Bang, Cambodia,”
“Development of HIV/AIDS Education Course for Community Health
Worker with Cambodia”
“Malnourished Children Care and Nutrition Education for Mothers in
Truppeang-krasang, Cambodia” in Nutrition Intervention School, Phnom Phen,
Cambodia.
2006 Project coordinator & instructor
Strategy Research team, WITH
Principal Responsibilities:
▪ Trained interviewers and project staff for “Nutrition Assessment for the Pui-
tribe community, Yunnan province in China (Oct 2006),” “Review of National
Nutrition Program and Nutrition activities of NGOs in Cambodia (Jan 2006),”
Strategy Research team, WITH, Korea
2005 Project manager & instructor
Strategy Research team, WITH, Korea
Principal Responsibilities:

274
▪ ‘Nutrition survey for mothers of Khulna and Chittagong slum area in
Bangladesh (July 2005)’, ‘Strategy development of nutrition-based Christian
ministry, Shanghai, China (Feb 2005)’
Public Health Policy
2014
June-Dec Research Assistant
Nutrition and Health Status of Adolescent Girls: A Six Country Situation
Analysis (WFP project), International Health Dep., Johns Hopkins School of
Public Health, USA
Principal Responsibilities:
▪ Conducted data analysis and prepared a report for the nutrition and
reproductive health situation of adolescent girls using Burkina Faso DHS data
(PI: Dr. Parul Christian)
2014
March Nutrition consultant
Principal Responsibilities:
▪ Evaluated feasibility for WFP Maternal and Child Nutrition Project
($3,000,000) through meetings with WFP and MoH staff
▪ Produced the evaluation report, WFP Timor Leste, Timor Leste, KOICA,
(Supervisor: Jinju Choi)
2013
July-Sept Consultant
Principal Responsibilities:
▪ Consulted preparedness strategy development project for public health crisis of
North Korea, Center for Unification Medicine, Seoul National University
College of Medicine, South Korea (PI: Haewon Lee, MD)
2013-
Present Manager
On-line Global Health Seminar, South Korea
Principal Responsibilities:
▪ Arranged global health seminar every month/bi-monthly with Korean health
professionals working in academia, government, and NGOs
2010-2011
Research Assistant
International Health Dep., Johns Hopkins School of Public Health, USA
Principal Responsibilities:
▪ Conducted systematic review of folic acid and pregnancy outcomes related to
Child Health Epidemiology Reference Group (PI: Anne M. Palaia, PhD)
Laboratory Research
2005 Dec-
2007 Jan International Fellow Researcher
Enteric Microbiology Lab., Laboratory Science division, ICDDR,B Health and
Population Research, Dhaka, Bangladesh
Principal Responsibilities:
▪ Conducted experiments to evaluate plasmid isolation techniques to gain high
yields of plasmid DNA of Shigella
▪ Detected STEC in food samples, meat and livestock stools in Dhaka,
Bangladesh (Supervisor: Kaisar Ali Talukder, PhD).
2000 May-
2001 June Researcher
BIFIDO CO. Ltd, Seoul, South Korea
Principal Responsibilities:

275
▪ Developed foreign-gene expression vectors using plasmids of
Bifidobacterium spp.
▪ Measured gene expression efficiency with designed vectors (Supervisor: Dr.
Geunok Ji)
1997-1998 Researcher
Samsung Life Science Research Institute, Seoul, South Korea
Principal Responsibilities:
▪ Conducted experiments for gene expression control of p53 tumor suppressor
gene in HeLa cell (Supervisor: Dr. Eun-seung Hwang)
TEACHING EXPERIENCE
2010 Oct-
Dec 2011 Oct-
Dec
Teaching Assistant, International Health Dept., Johns Hopkins School of
Public Health, USA
▪ Supported administrative management and assignments grading for
‘Assessment of Nutritional Status’ course (Supervisor: Kerry Schulze, PhD)
Sep 2008-
Jun 2009
Instructor, Ansan College, Ansan, South Korea
▪ Gave lectures of ‘Nutrition Counseling and Practices’ to undergraduate
student
▪ Conducted nutrition counseling to elderly group at Silver Care Center
(Supervisor: Chang-soon Ahn, PhD).
Sep 1999-
Dec 1999
Teaching Assistant, Food Microbiology experiment, Food science and
Nutrition Dep., Seoul National University, South Korea
▪ Gave a lecture on ‘Principles and experimental skills for food microbiology’
to undergraduate students (Supervisor: Geunok Ji, PhD)
PROFESSIONAL ACTIVITIES MEMBERSHIP Academic Association
Korean Society of Global Health 2013-
American Society for Nutrition 2010-
Global Health Council 2015-
HONORS AND AWARDS 2015
Scholarship from the George G. Graham Professorship Endowment ($800)
2015
Asian Congress of Nutrition 2015 Travel Award, Yokohama, Japan (300,000
JPY)
2014 Elsa Orent Keiles Fellowship award, Johns Hopkins School of Public Health
($2,500)
2012 Doctors and pastors of Oak Scholarship Award, Korea ($8,000)
2011
Doctors and pastors of Oak Scholarship Award, Korea ($9,000)
2010 Scholarship Award, Weiyang Catering company, Korea ($10,000)

276
2009
DSM Scholarship Award in Human Nutrition, International Health Department,
Johns Hopkins University, Baltimore, MD, USA ($55,000)
1999
Scholarship Award, Food Science and Nutrition Department, Seoul National
University.
PUBLICATIONS
Books Nutrition Action Vol.1. Editor of field research report for developing countries, WITH, Sooyang
F&G (2009). Yellow Window Statistical Report. Report to introduce nutrition, health and regional status in
developing countries. WITH, Sooyang Co. (2004).
PRESENTATIONS Yunhee Kang, Lemma Debele, Youn Kyoung Suh, Hee-Soon Juon, and Parul Christian.
Community-Based Participatory Nutrition Promotion Program Improved Child Feeding Practices
among Caregivers in Rural Eastern Ethiopia: A Cluster Randomized Trial. 12th Asian
Congress of Nutrition 2015, Yokohama, Japan, May 15-18, 2015 (oral presentation). Kang Y.H., Sinamo S., Kim S. and Parul Christian. Effectiveness of a Community-Based
Participatory Nutrition Promotion Program Improving Linear and Ponderal Growth in
Children 6 to 24 Months of Age in Rural Eastern Ethiopia: A Cluster Randomized Trial.
Experimental Biology 2015, Mar 28-Apr 1, USA (poster presentation). Kang Y.H., Seo Y.K. The Study for the change in indicators over last 5 years, re-establishment
and the index development for Yellow Window, Korean Society of Food and Nutrition, Seoul,
Korea (2009). Seo Y.K, Kang Y.H., Yu S.J, Kim S.M, The Comparison Kandal province with Prey veng
province in Cambodia by community nutrition survey, Korean Society of Food and Nutrition,
Seoul, Korea (2009). Kang Y.H., Health and Poverty in Global society, Session lecture, Mission Korea 2008, Korea
(2008). Kang. Y.H., Malnutrition Care Centers for Children under 5 in West Africa. Sandglass Seminar,
WITH, Seoul, Korea (2006). Seo J. M., Kang Y.H., Cho S.H., Park M.S., Park J. H., Ji G.E. Expression and secretion of
Bacillus phytase gene in the Genus Bifidobacterium. Proceedings of 9th international
symposium on the Genetics of Industrial Microorganism. Ji, G.E., Kim, N.J., Lee, B.H., Kang, Y.H., Seo, J.M and Park, M.S. Strain development and
genetic manipulation of Bifidobacterium strains. 11th World Congress of Food Science and
Technology, Seoul (2001).
CERTIFICATES 2011 Jan Certificate of completion, Health Emergencies in Large Populations (H.E.L.P),
Johns Hopkins School of Public Health, USA
277
2010 June Certificate of completion, Dietary Supplement Research Practicum, Office of Dietary Supplements, National Institute of Health, USA
2008 Certificate of completion, Project Cycle Management basic course, KCOC (Korea NGOs Council Overseas Cooperation), Korea (Aug 2008 ~ Feb 2009)
2008 Certificate of Attendance, SPHERE training, KCOC, Korea (Apr 21-23, 2008)
1999 License of Nutritionist, Ministry of Health, Korea
ADDITIONAL INFORMATION
Research Interests
▪ Child undernutrition; nutrition-sensitive nutrition program (agriculture, WASH, community
empowerment)
▪ Effectiveness and process evaluation of community-based nutrition program
▪ Nutrition assessment using anthropometric indicators, biochemical test, and dietary assessment
▪ General linear/logistic regression, longitudinal/multi-level data analysis, and survival analysis