effectiveness of physical barriers as a component of ... · pdf fileeffectiveness of physical...
TRANSCRIPT

EFFECTIVENESS OF PHYSICAL BARRIERS AS A COMPONENT OF REMEDIAL SYSTEMS AT 4 SITES IN NEW HAMPSHIRE
2010 DCHWS ConferenceUSEPA-USACE Design & Construction Issues at Hazardous Waste Sites
Bette Nowack, Stone Environmental, Inc.Fred McGarry, NHDES
Robin Mongeon, NHDESScott Hilton, NHDES

4 NH SITES EVALUATED
Site 1 - Slurry Wall and Cap, LNAPL
Site 2 – Sheet Pile Wall, No Cap, DNAPL
Site 3 – Slurry Wall, No Cap, DNAPL
Site 4 – Partial Sheet Pile Wall, NAPL

SITE 1 Bentonite slurry
wall 3-4 ft wide 4,000 ft long 90 – 100 ft deep 20-acre area 40 mil HDPE cap
• GW extraction from 14 wells • Wall & cap installed 1982, P&T started 1986• SVE from 66 wells started in 1993• Pump & Treat, SVE ended 1996
This air photo is subject to Microsoft’s Terms of Service, and Microsoft is the owner of rights therein.

SITE 1
Objective: prevent migration of contaminants from site
Cleanup goals inside wall were ACLs
No Cleanup levels established for outside wall
Risk assessment justified shutdown of remediation
Source: 4th Five Year Review Report, USEPA, 2009

SITE 1 REMEDIAL SYSTEM
• 30,000 to 50,000 gpd leakage through fractured bedrock
• 300 gpm extracted• 250 gpm reinjected inside wall• 50 gpm discharged outside wall
This air photo is subject to Microsoft’s Terms of Service, and Microsoft is the owner of rights therein.

SITE 1 – CURRENT STATUS
4th 5-Year Review conducted in 2009
Remedy currently is protective
In the long-term, not protective
5-Year Review Recommendations:• Expand GMZ due to 1,4-Dioxane , Pb, As plume• Perform Vapor Intrusion Study• Evaluate effectiveness of cap & slurry wall
Adapted from Environmental Sample Collection – Feb/Mar 2009, Nobis Engineering, 2009Adapted from Environmental Sample Collection – Feb/Mar 2009, Nobis Engineering, 2009
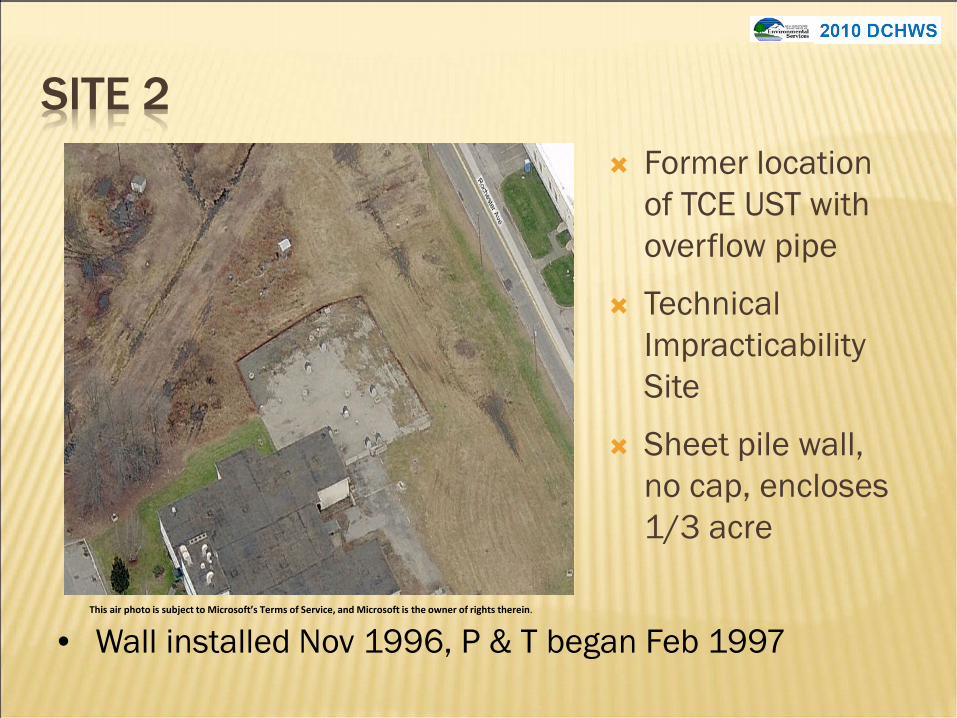
SITE 2 Former location
of TCE UST with overflow pipe
Technical Impracticability Site
Sheet pile wall, no cap, encloses 1/3 acre
• Wall installed Nov 1996, P & T began Feb 1997This air photo is subject to Microsoft’s Terms of Service, and Microsoft is the owner of rights therein.
SITE 2
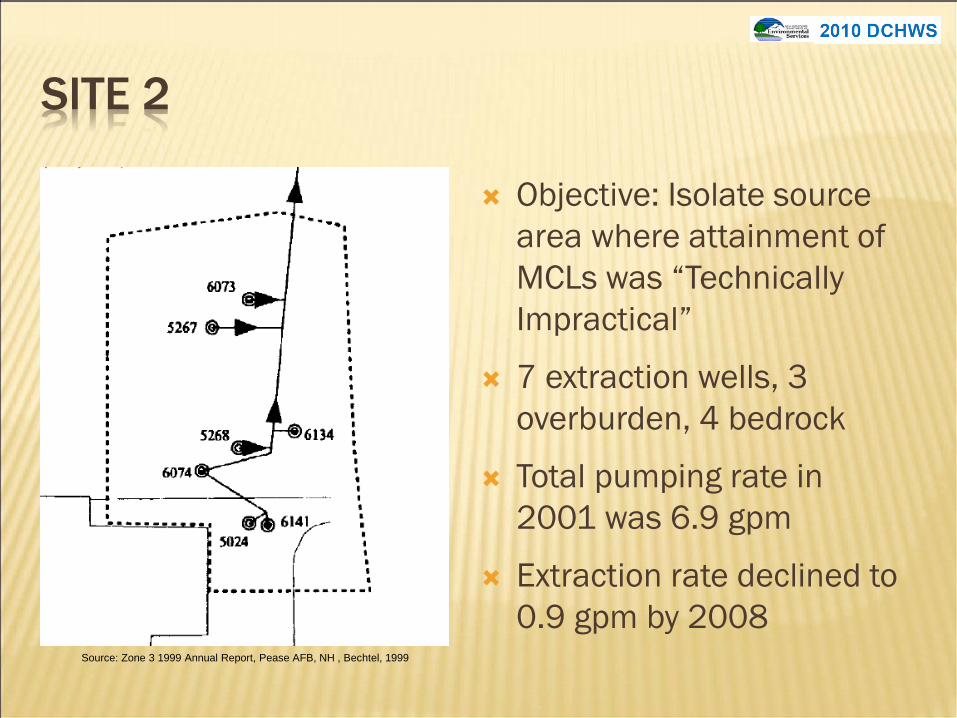
Objective: Isolate source area where attainment of MCLs was “Technically Impractical”
7 extraction wells, 3 overburden, 4 bedrock
Total pumping rate in 2001 was 6.9 gpm
Extraction rate declined to 0.9 gpm by 2008
Source: Zone 3 1999 Annual Report, Pease AFB, NH , Bechtel, 1999

SITE 2 CROSS-SECTION PRE-WALL
Adapted from Zone 3 2008 Annual Report, Former Pease AFB, URS, 2009

SITE 2 – CROSS-SECTIONS
Current status: • Decreased capacity from extraction wells• Bedrock plume of cis-1,2-DCE is expanding
Adapted from Zone 3 2008 Annual Report, Former Pease AFB, URS, 2009

SITE 3 Objective: Containment
more cost effective than P&T alone for DNAPL
Soil-bentonite slurry wall Encloses 5-acres 3-ft min wall thickness,
50 to 115 ft deep No surface cap
• Wall construction – 1998, P&T started – 1999• Two interior wells, pumping at 14 to 60 gpm• Discharge to exterior recharge gallery
This air photo is subject to Microsoft’s Terms of Service, and Microsoft is the owner of rights therein.
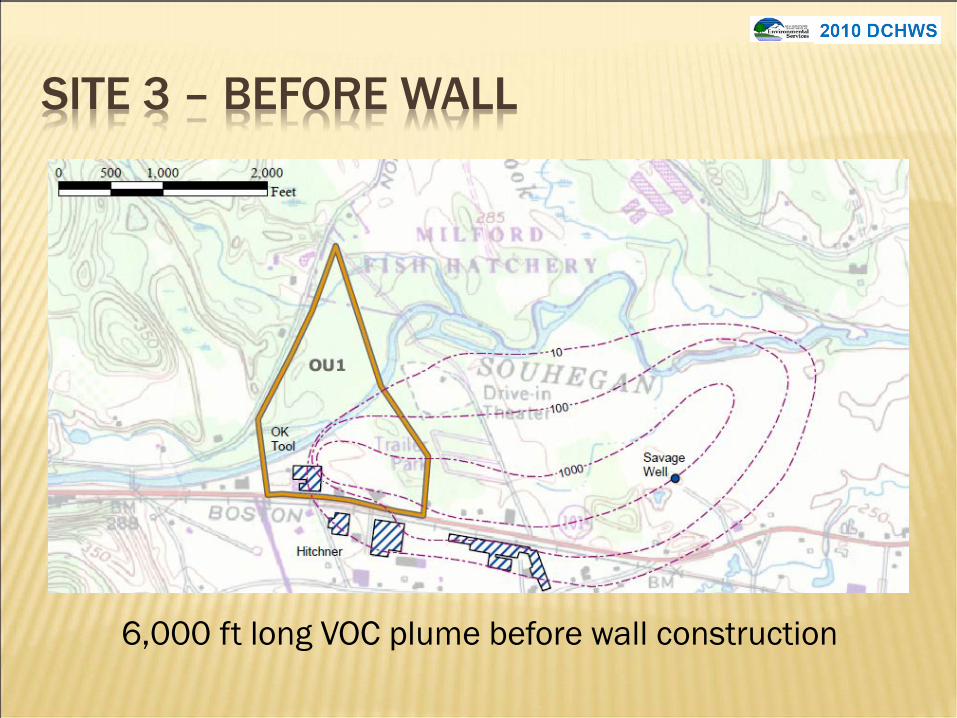
SITE 3 – BEFORE WALL
6,000 ft long VOC plume before wall construction
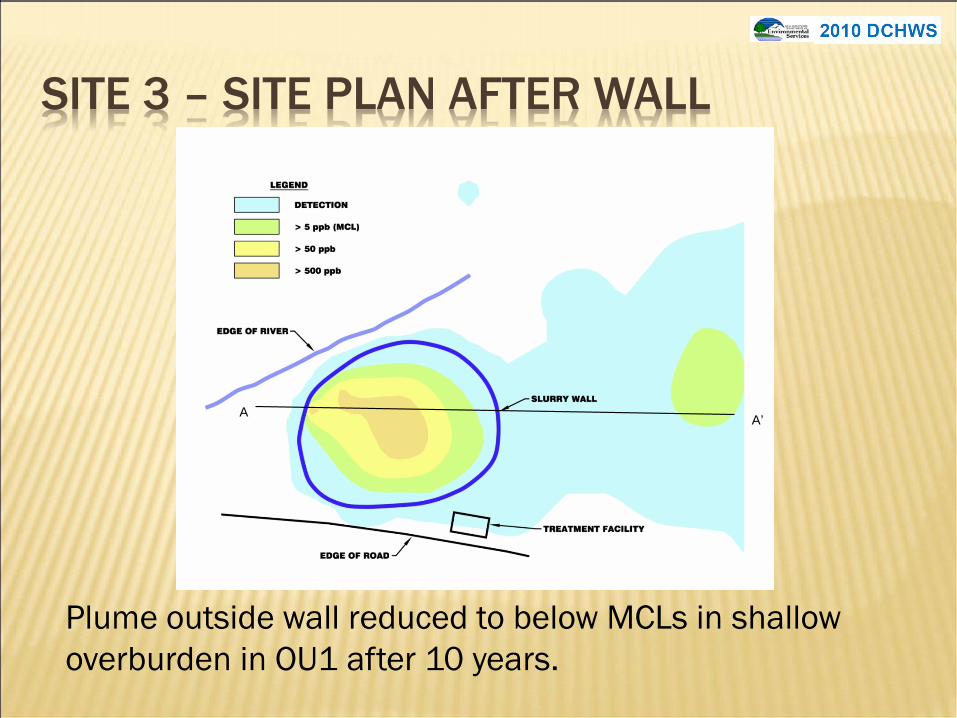
SITE 3 – SITE PLAN AFTER WALL
Plume outside wall reduced to below MCLs in shallow overburden in OU1 after 10 years.
A A’
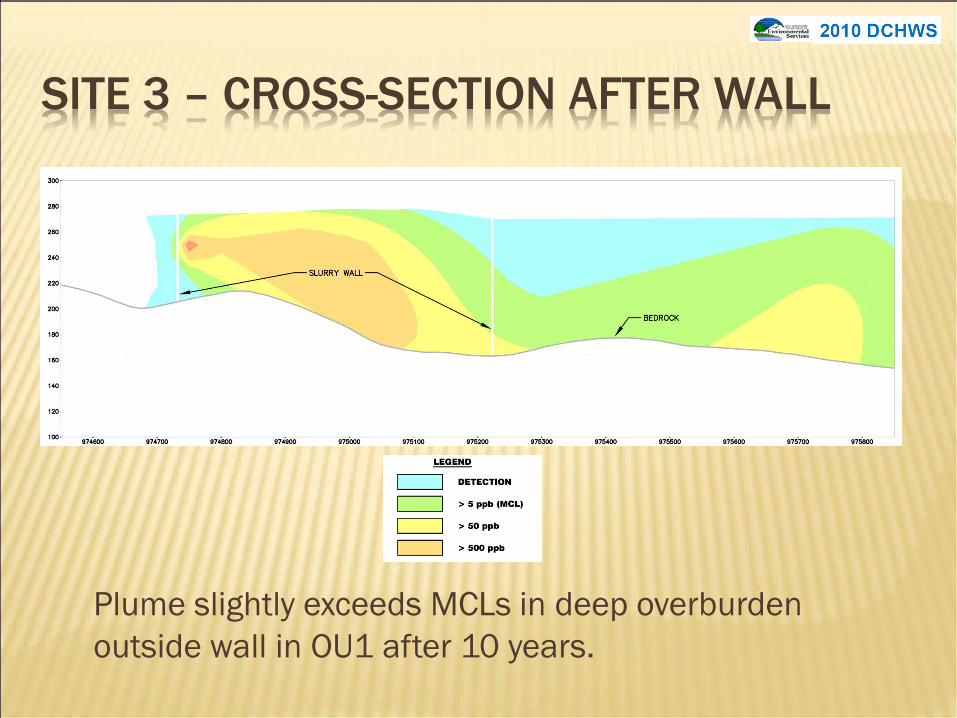
SITE 3 – CROSS-SECTION AFTER WALL
Plume slightly exceeds MCLs in deep overburden outside wall in OU1 after 10 years.

SITE 3 - GRADIENTS
Immediately after shutdown of extraction wells, groundwater gradients reverse
With sufficient pumping rate, gradients are upward and inward
Without pumping, gradients are downward and outward
Adapted from USGS, 2008

SITE 3 - CURRENT STATUS
4 deep bedrock wells installed
PCE as high as 8 ppm observed in deep bedrock beneath wall
Further investigations in bedrock are planned
Ongoing ISCO program in overburden inside wall
Locations of new bedrock wells

SITE 4
Creosote/fuel oil (NAPL)
GW & NAPL extraction & treatment 1986 to 1997
Sheet pile barrier system & product recovery wells constructed along 750 ft of river shoreline in 1997
These air photos are subject to Microsoft’s Terms of Service, and Microsoft is the owner of rights therein.
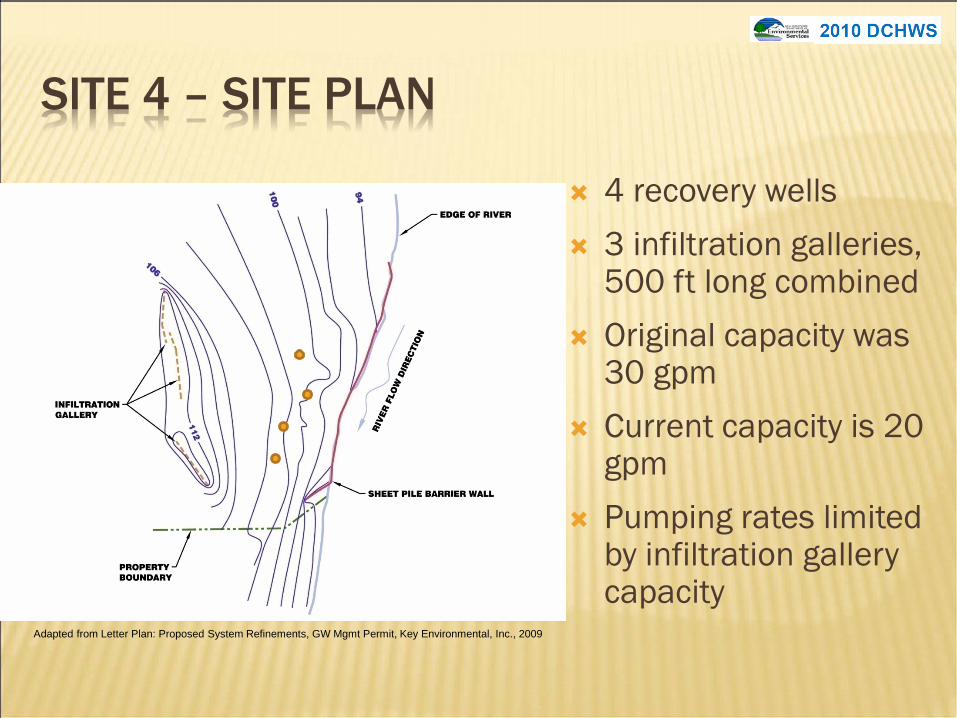
SITE 4 – SITE PLAN
4 recovery wells 3 infiltration galleries,
500 ft long combined Original capacity was
30 gpm Current capacity is 20
gpm Pumping rates limited
by infiltration gallery capacity
Adapted from Letter Plan: Proposed System Refinements, GW Mgmt Permit, Key Environmental, Inc., 2009
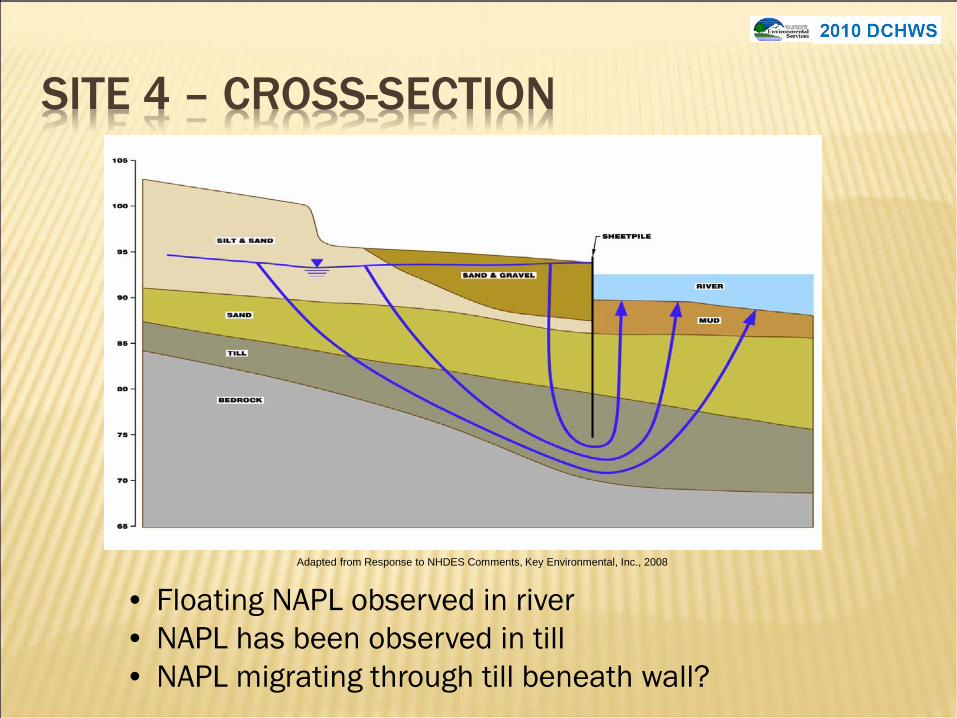
SITE 4 – CROSS-SECTION
• Floating NAPL observed in river• NAPL has been observed in till • NAPL migrating through till beneath wall?
Adapted from Response to NHDES Comments, Key Environmental, Inc., 2008
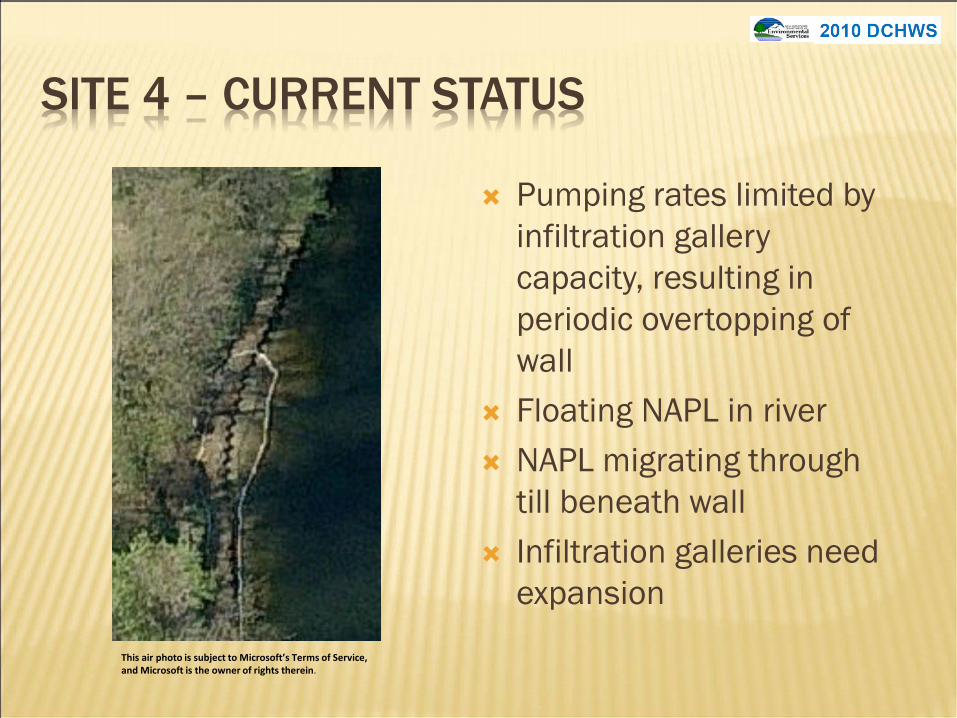
SITE 4 – CURRENT STATUS
Pumping rates limited by infiltration gallery capacity, resulting in periodic overtopping of wall
Floating NAPL in river NAPL migrating through
till beneath wall Infiltration galleries need
expansion
This air photo is subject to Microsoft’s Terms of Service, and Microsoft is the owner of rights therein.
OBSERVATIONS
Barrier walls did not completely contain contaminants and did not completely stop contaminant migration.
In most cases, contaminants were well contained in overburden, but flow beneath wall was typical.
Containment was more effective, if hydraulic control was achieved. Capping to limit infiltration
Effective groundwater extraction/reinjection
LESSONS LEARNED
Understanding site hydrogeology is extremely important – It will change after wall is constructed.
Important considerations: Type of contaminant (LNAPL vs DNAPL)
Continuity of confining layers underlying site
Maintaining preferred hydraulic gradients is critical to preventing leakage.
Keep wells and recharge galleries well maintained.