effectiveness of selection for growth rate in zebu x...
TRANSCRIPT

Aust. J . Agric. Res., 1975, 26, 1093-1108
Effectiveness of Selection for Growth Rate in Zebu x British Crossbred Cattle. 11" Post-weaning Growth and Genetic Estimates
G. W. Seifert
Division of Animal Genetics, CSIRO, Tropical Cattle Research Centre, P.O. Box 542, Rockhampton, Qld. 4700.
Abstract
The response to one generation of selection for weight per day of age at 18 months (WIA,), in Africander cross (AX) and Brahman cross (BX) cattle, was evaluated in the female offspring of the up and down selected parents. The high W/A line gained significantly more than the low line over a year from weaning. The advantage of the high W/A line occurred during flush nutritional periods.
The realized heritability (h2) of W / A , at 18 months was 0.52, while the estiamtes of h2 from mid-parental means computed within sires was higher. Heritability estimates for birth weight (W,,), weaning weight per day of age (WIA,), pre-weaning average daily gain (G,,) and total average daily gain from birth to final weight (G,) were all high, while the estimate for post-weaning average daily gain from weaning to final weight (G,,,,) was low.
The correlated responses of all the traits were high. The genetic correlations estimated from the response and thc parent-offspring regressions were all positive and high. Birth weight was the most highly correlated with G,. All phenotypic correlations were positive but lower than the genctic correlations, the correlation between Ghw and G,, being the lowest. Environn~ental correlations between birth weight and pre-weaning traits were essentially zero, and between birth weight and post-weaning traits and G,, negative.
Weight per day of age at 18 months appeared to be the most efficient and practical single trait to select beef cattle for increased growth rate.
Introduction
Post-weaning growth rate is an important component of production. It spans the larger proportion of the animal's life and is free of maternal influences. It is therefore more subject to environmental stress and consequently more variable. Genetic and environmental information on this period of the animal's life, especially in a tropical environment, is therefore necessary.
Seifert (1975) reported the results for the pre-weaning growth period of the F, progeny of Africander x British and Brahman x British cattle selected up and down for growth rate; this paper reports the results for the post-weaning period, and the estimation of genetic and environmental parameters for the pre- and post-weaning periods.
* Part I, Aust. J. Agric. Res., 1975, 26, 393.
G. W. Seifert
Animals and Methods
Animals
The environment, animals, mating design and selection procedures were described by Seifert (1975). The progeny from the F, Africander x British and Brahman x Brit- ish up and down matings were weaned on 12 June 1966 when their average age was 230 days. Except for 16 days after weaning, the males were not available for post- weaning observations and these data were analysed separately. The females were weighed at weaning and at monthly intervals following weaning, but only the weights taken on 19 August, 12 October and 20 December 1966, and 15 February, 19 April and 28 June 1967, and the successive gains between them were analysed. Weaning weight and age were taken as the average weight and age on 12 June and 28 June 1966. The above dates represent 61, 115, 184, 241, 304 and 374 days after weaning, and on 28 June 1967 the average age of the animals was 615 days. The F, dams of the 1965 calves were born during the normal calving period (October-December) from 1957 to 1962, and the F, grand-dams (dams of the F,s) from 1954 to 1959.
A random-bred British line (HSR) was included in separate analyses which are not presented, but their growth curves are shown in Fig. 1.
Statistical Methods
The weights per day of age and gains were analysed by the least squares method (Harvey 1960) by using the following model.
where Xijk, = weight per day of age at the above dates and the successive gains between these dates as well as the gains from October to February and weaning to June;
p = overall mean when all subclasses have equal frequencies;
Bi = ith breed (i = 1,2) ;
L j = j th line of selection ( j = 1,2);
A, = 12th dam age (k = 1,2,3,4);
BL,,, BAjk = interaction between the main effects;
eijk, = random error N.I.D. (0, 0;).
A model including the partial regressions on day of birth of the calf, dam gain during the pre-weaning period and weaning weight of the calf was also analysed.
The dam weights were analysed by using the following model.
where Xijklm = birth weight of the cow or W/A of the cow at weaning (average age 269 days) or W/A of the cow at c. 750 days of age;
a = overall mean when all subclasses have equal numbers and the covariate equals zero;
Yi = ith year of birth of the cow (i = 1,2,3,4);
Bj = j t h breed ( j = 1,2);
Selection for Growth Rate in Cattle. I1
L, = kth selection group of cow (k = 1,2);
A, = Ith age of the cow's dam (F,s) (I = 1,2,3,4);
YB, YL and BL = interaction between the main effects;
DijkLm = day of birth of the cow;
/3 = regression of the Xijk,, on the day of birth of the cow;
eijk,, = random error N.I.D. (0, 0:).
Genetic, phenotypic and environmental parameters
Heritabilities
The realized heritability of W/A at 16-18 months of age was calculated as:
h2 = response to selection/selection differential
= (high W/A progeny-low W/A progeny)/+(selection differential of sire+ selection differential of dams)
= R,/Si . (1)
The selection differential of the sires was taken as the difference between high W/A sires and low W/A sires at the time of their final selection. The selection differential of the dams was taken as the difference of the least squares constants for the high and low lines in the analysis of dam weights. The response to selection was calculated as the difference between the least squares constants of the high and low W/A progeny at 615 days of age.
The regressions, computed within breeds, lines and sires, of the age-corrected weights and gains of the offspring on the age-corrected mid-parent mean weights and gains, when all values were adjusted for dam age and year effects, were used to estimate h2 for all traits.
h; = b,,,, . (2)
This regression is unbiased by selection (Eisenhart 1939).
Phenotypic Correlations
The simple phenotypic correlations were computed within breed, line of selection and sire, and the data were adjusted for age of dam effects.
Genetic Correlations
The genetic correlations were estimated by the method of Hazel (1942).
r ~ i C y = ~{(boimjbm:oj)/(boimibojmj)) 7 (3)
where b,,,, and bmiOj are the regressions of the i th and j t h traits of the offspring on mid-parent and mid-parent on offspring.
Environmental Correlations
Environmental correlations were computed by solving for r,,,, in the following equation :
'pipj = rC,Cjhihj + r,,~, J{(l - h?)(l - hj2)). (4)

G. W. Seifert
Correlated Responses
The correlated response may be expressed as a fraction of the direct response, the direct selection differential, or the correlated selection differential and some meaningful genetic information derived from these.
The response in the primary trait i
and the correlated response in the secondary trait j
CRj = ( S i l o p i ) h i r c , ~ , h j g p , ,
and the correlated selection differential for trait j
where S denotes the selection differential and P and G the phenotype and genotype. The above equations can be expressed in terms of the phenotypic and genetic
variance and covariance components. Then 2 2 Ri = Si ~ G , l ~ r p , ,
cR j = ( S i / g P t ) ( o C , IoPI ) (gC ,C,/QG ,GG J ) ( g C J / g P , ) gPJ 3
csj = s i ( ~ P , P ~ / ~ P , ~ P , ) ( ~ P , / ~ P , ) . Now
C R j I S i = ((S~/~P,>(~G,/~P,>(%,G,/~C,~~;,)(~G,I~P,) ~ P , ) I ( R , QPJQG, ) , 2
= g ~ , G J I g I ' , (9 Similarly
C R j I R c = ~ G , G , / ~ ~ (6) and
c R ~ I C S j = o ~ , ~ J l g ~ , ~ J . (7)
In all three equations the numerators consist of the genetic covariances, while the denominators are the phenotypic variance, the genetic variance and the phenotypic covariance respectively. These expressions can therefore be used to obtain estimates of the genetic covariances.
If i = j, i.e, if i and j are the same trait, then equation ( 3 ) reduces to o i , / o ; , = h:. CRJCS, will therefore be referred to as the correlated realized heritability (ch;).
Results
Calf weights and gains
The analyses of variance for the post-weaning weights per day of age (WIA) and gains of the 1965 female calves are given in Tables 1 and 3, and the least squares constants in Tables 2 and 4. The gains of both sexes 16 days immediately after weaning were analysed separately but are not presented. The growth curves are shown in Fig. 1 and are typical for growth in the environment described where the winter periods are marked by weight losses.
Selection for Growth Rate in Cattle. I1
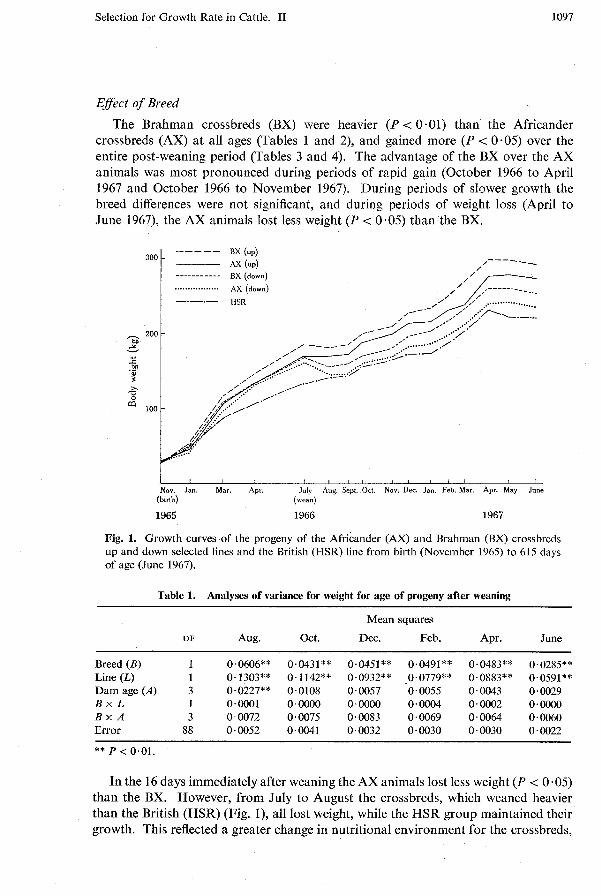
EfSect of Breed
The Brahman crossbreds (BX) were heavier (P < 0.01) than the Africander crossbreds (AX) at all ages (Tables 1 and 2), and gained more (P < 0.05) over the entire post-weaning period (Tables 3 and 4). The advantage of the BX over the AX animals was most pronounced during periods of rapid gain (October 1966 to April 1967 and October 1966 to November 1967). During periods of slower growth the breed differences were not significant, and during periods of weight loss (April to June 1967), the AX animals lost less weight (P < 0.05) than the BX.
I I I I I I , I , I l l 1 3 I
Nov. Jan. Mar. Apr. July Aug. Sept. Oct. Nov. Dec. Jan. Feb Mar. Apr. M a y June (birth) (wean)
1965 1966 1967
300
Fig. 1. Growth curves of the progeny of the Africander (AX) and Brahman (BX) crossbreds up and down selected lines and the British (HSR) line from birth (November 1965) to 615 days of age (June 1967).
----- -
Table 1. Analyses of variance for weight for age of progeny after weaning
BX (UP)
AX (up) /---- -- - - - - - -- - - - - BX (down) . . . . . . . . . . . . . . . . . AX (down) -.-.- HSR
- 200 - M 3 -
Mean squares
DF Aug. Oct. Dec. Feb. Apr. June
Breed (B) 1 0.0606** 0.0431** 0.0451** 0.0491** 0.0483** 0.0285** Line (L) 1 0.1303** 0.1142** 0.0932** .0.0779** 0.0883** 0.0591** Dam age (A) 3 0.0227** 0.0108 0.0057 0.0055 0.0043 0.0029 B x L 1 0.0001 0.0000 0.0000 0.0004 0.0002 0.0000 B X A 3 0.0072 0.0075 0.0083 0.0069 0.0064 0.0060 Error 88 0.0052 0.0041 0.0032 0.0030 0.0030 0.0022
** P < 0.01.
In the 16 days immediately after weaning the AX animals lost less weight (P < 0.05) than the BX. However, from July to August the crossbreds, which weaned heavier than the British (HSR) (Fig. I), all lost weight, while the HSR group maintained their growth. This reflected a greater change in nutritional environment for the crossbreds,

and the poorer suckling environment of the HSR dams as compared with the crossbred dams. In no other instance did the HSR animals surpass even the low W / A crossbred lines in weight gains.
Table 2. Least squares constants for significant weight for age main effects o f progeny
Aug. Oct. Dec. Feb. Apr. June
Overall Mean
P 0.6360 0.5757 0.5398 0.5116 0.5362 0.4620
Breed AX -0.0263 -0.0222 -0.0227 -0.0236 -0.0234 -0.0180 BX 0.0263 0.0222 0.0227 0.0236 0.0234 0.0180
Line High 0.0399 0.0374 0.0338 0.0309 0.0329 0.0269 LOW -0.0399 -0.0374 -0.0338 -0.0309 -0.0329 -0.0269
Eflect of Selection
The high weight for age lines were heavier (P < 0.01) than the low lines on all occasions. Although the high lines were superior in gains during all periods, with the exception of the 16 days immediately after weaning and the period April to June 1967, the differences in gains achieved significance only when considered over the
Table 3. Analyses o f variance for post-weaning average daily gains o f progeny
Mean squares
DF Wcan-Aug. Aug.-Oct. 0ct.-Dec. Dec.-Feb. Feb.-Apr. Apr.-June 0ct.-Apr. Wean-June
Breed ( B ) 1 0.0711* 0.0036 0.0591* 0.0855 0.0411 0.0343* 0.0598** 0.0056 Line (L) 1 0.0000 0.0362 0.0209 0.0081 0.1849** 0.0272 0.0498** 0.0137** Damage(A) 3 0.0072 0.0129 0.0093 0.0205 0.0079 0.0003 0.0008 0.0014 B x L 1 0.0891** 0.0024 0.0000 0.0189 0.0004 0.0048 0.0014 0.0011 B x A 3 0.0071 0.0107 0.0248 0.0499** 0.0059 0.0156 0.0163 0.0100** Error 88 0.0128 0.0141 0.0126 0.0124 0.0129 0.0081 0.0049 0.0023
Table 4. Least squares constants for average daily gain for successive post-weaning periods of progeny
Wean-Aug. Aug.-Oct. 0ct.-Dec. Dec.-Feb. Feb.-Apr. Apr.-June 0ct.-Apr. Wean-June
Overall Mean
-0.0778 0.2903 0,3782 0,3229 0.7067 -0.0699 0.4710 0.2759
Breed
AX 0.0284 -0.0064 -0.0259 -0.0312 -0.0216 0.0198 -0.0261 -0.0080 BX -0.0284 0,0064 0.0259 0.0312 0.0216 -0.0198 0.0261 0~0080
Line
H 0.0005 0~0210 0.0160 0.0099 0,0475 -0.0183 0,0247 0,0129 L -0~0005 -0.0210 -0.0160 -0.0099 -0.0475 0,0183 -0.0247 -0.0129
whole period (P < 0-05), and over periods of overall high gains (February to April 1967, and October 1966 to April 1967) (P < 0.01). During the periods of weight

Selection for Growth Rate in Cattle. TI
loss, differences between the selected lines were very small (weaning (July 1966) to August 1966) or in favour of the low line (16 days immediately after weaning, and April to June 1967).
Efect of Dam Age
The least squares constants for the dam age effects on W/A and post-weaning gains are shown in Fig. 2. Although calves from the younger cows weighed less than
t 3 4 5 6 f 3 4 5 6 f 3 4 5 6 + 3 4 5 6 f 3 4 5 6 f
Dam age
Fig. 2. The least squares deviations from the overall mean (p, Tables 2, 4,6) showing the effect of dam age on (a) weight per day of age at weaning (12.vi.66), August (19.viii.66), December (20.vii.66) and June (28.vi.67), and (6) average daily gain from weaning (12 June 1966) to 28 June 1967.
those from more mature cows at all ages, the difference tended to disappear and was significant only in August 1966. Post-weaning gains of calves from the various dam age groups tended to fluctuate widely between successive periods, but overall (June 1966 (weaning) to June 1967) the calves from the younger dams gained more (Fig. 2). The differences in the gains were not significant, but the better gains of the calves from the younger dams, which probably were due to a compensatory effect, eroded some of the weight advantage of calves from older dams, which was a continuation of the dam age influence on weaning weight.
Efect of Sex
During the immediate 16 days after weaning, males managed to hold their weight, while females lost weight. The difference in gains (0.094 kg/day) between the sexes was highly significant (P < 0.01).
Intevactions
All possible interactions between the main effects for weight for age were non- significant.

G. W. Seifert
From June 1966 (weaning) to August 1966, the AX high line gained more than the BX high line, while the BX low line gained more than the AX low line, which caused a significant breed x line interaction.
Young (3-year-old) AX cows and old (6 years and older) AX cows produced calves which gained much less than their Brahman cross contemporaries, while 4- and 5-year-old cows produced calves in which the breeds had similar gains from weaning (June 1966) to June 1967. This resulted in a significant interaction. The same interaction was particularly strong for the December 1966 to February 1967 gains and probably contributed largely to the interaction over the whole period. No plausible reason for the interaction exists, and it is therefore regarded as spurious.
Partial Regressions
Early-born calves grew faster during each successive period from weaning to December 1966, but the regression was only significant (b = -0.0034 kg gainlday, P < 0.01) from October to December 1966.
Overall, heavier calves at weaning gained more than lighter calves during the entire post-weaning period, but the regression was not significant, except for the period from February to April 1967 (b = 0.0025 kg/kg weaning weight, P < 0.01). However, over the immediate 61 days after weaning (June 1966) to August 1966, heavier calves at weaning lost significantly more weight than the lighter calves (b = -0.0031 kg gainlkg weaning weight, P < 0 -01).
Dam weights and gains
The analyses of variance for weights and gains of the dams of the 1965 drop female calves are given in Table 5 and the least squares constants in Table 6.
Table 5. Analyses of variance of dam weights and gains
Mcan squares
Source DF
Years ( Y ) 4 Breed (B) 1 Line (L) 1 Dam age (A) 3 Y x B 4 Y x L 4 B x L 1 /3 (regr. b. day) 1 Error 148
Birth Pre- wean
Wean WlA
Post- wean
800 days WIA --
0.035** 0.046** 0.081** 0.001 0.002 0.001 0.001 0.001 0.001
Total gain
Effect of Year of Birth
Year of birth had a significant effect on all the weights and gains, its contribution being lowest in birth weight (Table 5). The weights and gains, with the exception of birth weight, increased from 1958 to 1962, which reflected improved seasonal conditions.

Selection for Growth Rate in Cattle. I1
Effect of Breed
The Brahman crossbreds (BX) gained more than the Africander crossbreds (AX) during the suckling period and weighed more at weaning (P < 0.01). This gave them a significant advantage in final weight and gain from birth to weaning, in spite of the fact that the AX group were slightly heavier at birth and gained more after weaning (Table 6). The pattern of growth of the dams was very similar to that of their progeny.
Table 6. Least squares constants for significant main effects on dam weights and gains
Weight Pre- Weaning Post- Final ADG
at wean wt. for weaning wt. for from birth ADC* age A D G ~ age birth
Overall Means
Year of Birth Effects
0.063 0.082 0.110 0.034 0.031 0.017 0.008 0.005 -0.022
-0.047 -0.044 -0.055 -0.058 -0.074 -0.050
Breed
Line
High Low
Dam Age
Regression
0.0014 0.0023 -0.0001
A ADG, average daily gain. ,u = a+/3 (mean birth day). Mean birth day, 26.327.
Effect of Selection
The high W/A heifers were of course significantly heavier than the low W/A heifers at their selected 800-day weights. They had achieved this ad birth weights and faster pre- and post-weaning gains (P < 0.01).

G. W. Seifert
Effect of Dam Age
Dam age had a significant effect only on pre-weaning gain, and this resulted in a significant weaning weight advantage for calves from older cows. Four-year-old F, dams produced lighter calves than their 3-year-old contemporaries, in contrast to the results of their F2 daughters.
Interactions
At birth AX dams born in 1958 were considerably lighter than BX dams, while in 1961 the BX group were lighter than the AX group, with little difference in 1959, 1960 and 1962, and this resulted in a significant breed x year of birth interaction for birth weight.
AX cows born in 1958 and 1959 gained less than their BX contemporaries from birth to 800 days of age, but those born during 1960, 1961 and 1962 had similar gains, causing a breed x year interaction for gain from birth to 800 days.
Regression of Weights and Gains on Day of Birth
Calves born late in the season were heavier at birth and grew faster during the pre-weaning period (P < 0.01). This is in contrast to the regression of their progeny.
Heritabilities (h2)
The heritabilities estimated from the regression of offspring age-corrected weights and gains on the mid-parent age-corrected weights and gains within sires, by using various adjustments for the data, are given in Table 7.
Table 7. Heritabilities estimated from parent-offspring regressions by using
various adjustments for the data A, age-corrected weights and gains, adjusted for dam age effects and year of birth of dam; B, age-corrected weights and gains only; C, as for A, but also adjusted for day of birth
Birth Weight
The heritability of birth weight ranged from 0.530 to 0.742, and the estimates were little influenced by adjustments for year of birth of dam, dam age effects or day of birth. Day of birth adjustments would to some degree correct for gestation length, while adjustment for year effects which were significant sources of variation (Table 5) are probably necessary to obtain the best estimates. The best estimate of h2 for birth weight therefore probably lies between 0.530 and 0.656.

Selection for Growth Rate in Cattle. I1
Weaning Weight for Age (W/A,) and Pre-weaning Average Daily Gain (G,,)
Estimates for WIA, ranged from 0.046 to 0.641 and for G,, from 0.059 to 0.600, and in general were very similar. Adjustments for year of birth of dam and dam age effects, which were highly significant sources of non-genetic variation (Table 9, improved estimates from 0-046 to 0.641 and 0.059 to 0-600 for W/A, and G,, respectively. The additional continuous adjustment for the regression of W/A, and G,, on day of birth, as for birth weight, did not improve the estimates.
Post-weaning Average Daily Gain (G,,)
The h2 for G,, was the lowest of all estimates and ranged from 0.087 to 0.327. The differences between estimates from adjusted G,, and unadjusted G,, was the smallest of all the traits, except birth weight, which indicated that environmental effects, especially year of birth of dam effects, were not as important as for the pre- weaning traits.
Final Weight per Day of Age (W/A,) and Total Average Daily Gain from Birth to Weaning (G,)
Estimates of h2 from adjusted W/Af and G, were larger than unity (1 $424 and 1.219). Estimates from the unadjusted values, although very low, were the largest of all the unadjusted estimates, with the exception of birth weight.
The realized h2 for W/Af (Ri/Si = 0.524) was considerably lower than the estimated h2 of 1.424.
Phnotypic, genetic and enuivonrnental covrelations
The phenotypic, genetic and environmental correlations are given in Table 8.
Phenotypic Correlation
All the phenotypic correlations were positive, and part-whole correlations, e.g. G,, and WIA,, were high, as would be expected.
Pre-weaning traits were generally poorly correlated with WIA,, while G,, was highly correlated with W/Af. Correlations between G,, and G,,, which had no common factor, were essentially zero.
Birth weight, which was not part of the gains, showed a higher correlation with G,, than G,, and within the gain variables, was most highly correlated to G,.
Genetic Correlations
The genetic correlations were all positive and in all cases higher than the pheno- typic correlations. As with the phenotypic correlations, part-whole genetic correla- tions were the highest.
Birth weight was more highly correlated to gains then to weights, with the exception of G,,.
In contrast to the phenotypic correlations the weaning traits (WIA, and G,,) were genetically highly correlated with G,,, which indicated that similar genes were involved in weaning and post-weaning growth traits.

G. W. Seifert
Environmental Correlations
Birth weight was in general negatively and poorly correlated with all traits with the exception of G,. The poor correlation between the pre-weaning maternal environ- ment and the intra-uterine maternal environment reflects the difference between these two maternal environments on the growth of the progeny. The intra-uterine maternal environment appears to exert an opposite influence on growth, in contrast to the environment free of maternal effects, as shown by the high negative environmental correlation (r , = -0.836) between birth weight and G,.
Table 8. Phenotypic, genetic and environmental correlations
P, simple phenotypic correlations calculated within breeds, lines and sires on age-corrected weights and gains, adjusted for dam age effects (P < 0.01, r = 0.283; P < 0.05, v = 0.217).
G, genetic correlations calculated from within-sire regressions of offspring age-corrected weights and gains adjusted for dam age, on sire and dam mean age-corrected weights and gains adjusted for dam age and year effects.
E, Environmental correlations
Part-whole environmental correlations were generally positive and high with the exception of those involving birth weight, especially those that shared a large part of their environments in common, e.g. G,, and WIA,, and G, and W / A f . Post- weaning gain (G,,) was negatively and moderately highly correlated to all pre- weaning traits.
Correlated Selection Diflerentials and Responses
The correlated selection differentials and responses are given in Table 9. The selection differential for W/Af was 2.4 times as great in the sires as in the dams. The difference in the correlated selection differential between the dams and sires was greatest for post-weaning gain (3.4). The difference in selection differentials
Selection for Growth Rate in Cattle. II
between sires and dams was greatest in the post-weaning period, which indicated that selection in the sires may have been biased toward the post-weaning period.
Table 9. Primary and correlated selection differentials and responses to selection for the various weights and gains
Correlated selection Correlated diff. (CS,)" response (CR,)"
Dam Sire Av. Females - -
wb 3.154 5.965 4.560 2.266 Gbw 0.084 0.139 0.112 0.073 WIAw 0.096 0.171 0.134 0.082 Gpw (wean-J~ne)~ 0.038 0.128 0.083 0.036 G,, (O~t.-Apr.)~ 0.038 0.128 0.083 0.048 Gr 0.056 0.128 0.092 0.043 W/Af ( J ~ n e ) ~ 0.060 0.145 0.103 0.054 W/Af (APT.)' 0.060 0.145 0.103 0.066
A For W/Af the figures given are for the realized selection differential and response.
Correlated response in the progeny over the entire post- weaning period, June 1966 (weaning) to June 1967, and the period including only gains, October 1966 to April 1967.
Realized heritability for W/Af over the entire period (June 1967) and W/A prior to a period of weight loss in progeny (April 1967).
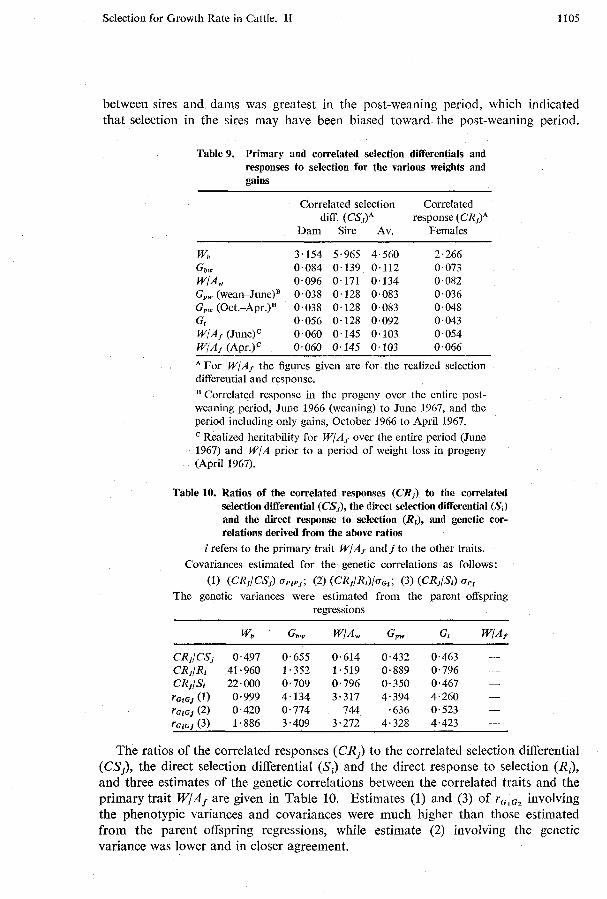
Table 10. Ratios of the correlated responses (CR,) to the correlated selection differential (CSj), the direct selection differential (S,) and the direct response to selection (Ri), and genetic cor- relations derived from the above ratios
i refers to the primary trait W/Af and j to the other traits. Covariances estimated for the genetic correlations as follows:
(1) (CRjICSj) CP~PJ; (2) (CR~IRJICJG~; (3) (CRjISi) opt The genetic variances were estimated from the parent-offspring
regressions
wb Gbw WAw Gpw Gt W A Y
CRj/CSj 0.497 0.655 0.614 0.432 0.463 -
CRj/Rt 41.960 1.352 1.519 0.889 0.796 - CRj/St 22.000 0.709 0.796 0.350 0.467 - r (1) 0.999 4.134 3.317 4.394 4.260 - Y G ~ G J (2) 0.420 0.774 744 .636 0.523 - Y G ~ G J (3) 1.886 3.409 3.272 4.328 4.423 -
The ratios of the correlated responses (CRj) to the correlated selection differential (CSj), the direct selection differential (S, ) and the direct response to selection (R,), and three estimates of the genetic correlations between the correlated traits and the primary trait W/Af are given in Table 10. Estimates (1) and (3) of r,,,, involving the phenotypic variances and covariances were much higher than those estimated from the parent-offspring regressions, while estimate (2) involving the genetic variance was lower and in closer agreement.
G. W. Seifert
Discussion
Differences in weight for age between the breeds and lines increased during the post-weaning period from those shown for weaning (Seifert 1975). However, relatively the largest differences between the breeds occurred during the suckling period, and this was similar for their F2 dams. The advantage of the BX over the AX group is in agreement with those of the F,s and F2s shown by Lampkin and Kennedy (1965). The higher weight for age of the BX animals was achieved by more rapid gains during flush nutritional conditions, which allowed for rapid gains. The AX animals on the other hand performed better during poor nutritional periods, when they lost less weight.
The more rapid gains of the BX group may have been due to their greater tolerance of parasitic burdens, which coincides with nutritional flush periods (Seifert 1971; Turner and Short 1972). On the other hand, the greater loss of weight of this group may have been due to their larger body size and therefore larger maintenance require- ments.
The immediate post-weaning period reflects a change in diet from milk and roughage to entirely roughage. The BX animals lost weight, while the HSR animals were unaffected by the event of weaning. The weight loss of the BX group therefore reflects a superior maternal environment, while the HSR group were virtually weaned while still with their dams.
Crossbred calves from 3-year-old heifers were still significantly lighter than calves from older dams 2 months after weaning. However, calves from younger dams gained more rapidly than those from older dams during the post-weaning period, reflecting compensatory gains, so that by 18 months of age the weight differences were not significant. Burgess and Bowman (1964) also found that age of cow did not influence post-weaning growth.
The highly significant response to selection for weight for age at 18 months, resulting in realized h2 values of 0.52 and 0.64, is higher than those reported by Newman et al. (1973) (0.29, 0-49, 0.50 and 0.51) and Carter (1971) (0.43).
Estimates of h2 were generally higher than those reported for similar traits in beef cattle as reviewed by Mason (1951), Shelby et al. (1963) and Koch et a/. (1973). Sex differences for the genetic parameters for the pre-weaning traits as reported by Pahnish et al. (1964) and Koch et al. (1973) were not found. The absences of any line x sex interaction also indicates that the sexes responded similarly to selection (Seifert 1975).
The estimates of h2 on the uncorrected data varied largely from those calculated from the corrected data, which were high and in general similar to those reported in the literature. Differences between the selected lines were also best expressed during flush nutritional periods. Large variations among reported h2 estimates may therefore in part be due to the analyses of the data or the conditions under which growth was being measured, and are not necessarily due to differences in the amount of additive genetic variation present in the different populations.
Year of birth of dam contributed most to the phenotypic variance of the dams. The selection of the parents was only performed on weight for age within years (Seifert 1975). This eliminated year effects, which resulted in the significant responses to selection.

Selection for Growth Rate in Cattle. 11
The high correlated responses of all the other traits with weight for age at 18 months, and the consequent high genetic correlations, are in general agreement with published results (Brinks et al. 1964; Pahnish et al. 1964; Chapman et al. 1972; Koch et al. 1973; Cartwright and Fitzhugh 1974), but higher than those reported by Pattie et al. (1970).
Phenotypic correlations between the traits were all positive and in general similar to those reported by Brinks et al. (1964) and Pahnish et al. (1964). On the other hand, the environmental correlations tended to differ largely from those reported (Brinks et al. 1964; Pahnish et al. 1964) except among the pre-weaning traits. The high negative environmental correlations between the pre-weaning and post-weaning traits and birth weight and total gain indicate that there are large opposite environ- mental influences affecting these traits.
From the environmental and genetic correlations found in this study and those published, it appears that the genes controlling growth in Bos taurus cattle in temperate environments act in a similar manner to those controlling growth in B. taurus x B. indicus cattle in tropical environments. Also, the environmental influences during the pre-natal and pre-weaning periods act in a similar manner, but the environmental influences on post-weaning growth act very differently from those during the pre- weaning period-in contrast to the temperate environment, where the environmental correlat~ons are essentially zero.
Birth weight was phenotypically and genetically more highly correlated with post-weaning gain than with pre-weaning gain, which is similar to the findings of Chapman et al. (1972) and Koch et al. (1973). The high genetic correlation of birth weight with total gain to final weight indicates that the same genes control pre- and post-natal growth. Mason (1951) reported that many workers found a correlation between birth weight and gains, and birth weight may therefore be a useful indicator of an animal's genetic potential for growth.
Hitchcock et al. (1955), Rollins et al. (1962), Brinks et al. (1964), Martin et al. (1970) and Carter (1 97 1) concluded that selection for weight at yearling or older ages, rather than gains, would be the most rapid means of improving growth rate. The response to selection for weight for age found in this study, resulting in a moderately high realized h2, would strongly support these conclusions. The high response may have been due to desirable epistatic effects in the early generations of selection (Pirchner 1968), although the high estimated h2 would tend to dispel this. Weight for age is highly related to lean growth (Martin et al. 1970), and to efficiency of gains (Lickley et al. 1960; Rollins et al. 1962; Bailey et al. 1971), and the genes for rapid growth are not antagonistic to those for the production of desirable carcasses (Cundiff et al. 1964).
Weight for age at advanced ages is largely free of maternal influences, and includes birth weight, pre-weaning gain and post-weaning gain in a biological index. It therefore eliminates the need for adjustments. Because it is measured over a long period in the life of an animal, short-term influences and fluctuations in gains probably contribute little to it. It therefore appears to be an efficient single measure to use when selecting beef cattle for improved growth rate. Its simplicity and ease of appli- cation makes it an ideal trait to promote under performance-recording schemes, especially under extensive pasture conditions.

G. W. Seifert
Acknowledgments
I wish to thank Mr A. J. Short and Mr K. G. Bean for their valuable technical assistance in compiling and analysing the data, Mr H. G. Turner for his guidance and advice, and the staff of the National Cattle Breeding Station for their assistance in handling and weighing the cattle.
References
Bailey, C. M., Harvey, W. R., Hunter, J. E., and Torell, C. R. (1971). J. Anim. Sci. 33, 541. Brinks, J. S., Clark, R. T., Kieffer, N. M., and Urich, J. J. (1964). J. Anim. Sci. 33, 711. Burgess, T. D., and Bowman, G. H. (1964). Can. J. Anim. Sci. 45, 189. Carter, A. H. (1971). Proc. N.Z. Soc. Anim. Prod. 31, 151. Cartwright, T. C., and Fitzhugh, H. A. Jnr (1974). Brahman News 22, 27. Chapman, H. D., Clyburn, T. M., and McCormich, W. C. (1972). J. Anim. Sci. 35, 321. Cundiff, L. V., Chambers, D., Stephens, D. F., and Willham, R. L. (1964). J. Anim. Sci. 23, 1133. Eisenhart, C. (1939). Ann. Math. Statist. 10, 162. Harvey, W. R. (1960). U.S. Dep. Agric., Agric. Res. Serv. No. ARS-20-8. Hazel, L. N. (1943). Genetics 28, 476. Hitchcock, R. H., Sawyer, W. A., Bogart, R., and Calvin, L. (1955). Tech. Bull. Agric. Exp. Stn.
Ore. State Coll. No. 34. Koch, R. M., Cundiff, L. V., Gregory, K. E., and Dickerson, G. E. (1973). J. Anim. Sci. 36, 235. Lampkin, G., and Kennedy, J. F. (1965). J. Agric. Sci. 64, 407. Lickley, C. R., Stonaker, H. H., Sutherland, T. M., and Riddle, K. H. (1960). Proc. West. Sect.
Am. Soc. Anim. Prod. 11, IX-1. Martin, A. H., Fredeen, H. T., and Newman, J. A., (1970). Can. J. Anim. Sci. 50, 491. Mason, I. L. (1951). Anim. Breed. Ahstr. 19, 1. Newman, J. A., Rahnefeld, G. W., and Fredeen, H. T. (1973). Can. J. Anim. Sci. 53, 1. Pahnish, 0. F., Roberson, R. L., Taylor, R. L., Brinks, J. S., Clark, R. T., and Roubicek, C. B.
(1964). J. Anim. Sci. 23, 562. Pattie, W. A., Williams, L. G., and Dettnmn, E. G. (1970). Proc. Aust. Soc. Anim. Prod. 8, 115. Pirchner, F. (1968). 'Population Genetics in Animal Breeding.' (W. H. Freeman & Co.: San
Francisco.) Rollins, W. C., Carroll, F. D., Pollock, J. W. T., and Kudoda, M. N. (1962). J. Anim. Sci. 21, 200. Seifert, G. W. (1971). Anst. J. Agric. Res. 22, 839-50. Seifert, G. W. (1975). Aust. J. Agric. Res. 26, 393406. Shelby, C. E., Harvey, W. R., Clark, R. T., Queensberry, J. R., and Woodward, R. R. (1963). J.
Anim. Sci. 22, 346. Turner, H. G., and Short, A. J. (1972). Aust. J. Agric. Res. 23, 177-93.
Manuscript received 3 April 1975