effects of a public real-time multi-modal transportation
TRANSCRIPT

Journal of Public Transportation, Vol. 20, No. 2, 2017 40
Effects of a Public Real-Time Multi-Modal Transportation
Information Display on Travel Behavior and Attitudes
Yanbo Ge, Parastoo Jabbari, Don MacKenzieUniversity of Washington
Jiarui TaoUniversity of California, Irvine
Abstract
This study reports on an experiment in downtown Seattle, Washington, to evaluate whether installing a public real-time multi-modal transportation information display screen in an office building lobby caused changes in building occupant self-reported awareness, attitudes, satisfaction, and usage of alternative transportation modes including transit, car-sharing, ride-sourcing, and bike-sharing services. Workers in the test building and two nearby control buildings were surveyed immediately before the screen was installed (N=550) and again six months later (N=455). Little evidence was found that exposure to the real-time display affected respondent travel choices, satisfaction, familiarity, or attitudes toward alternative modes. Although most respondents (70%) had noticed the screen and had generally positive reactions, two-thirds of this group never actually used it. These results, along with building occupant responses to open-ended questions, indicate limited benefits from this installation and suggest that site selection, screen placement, and marketing may help to maximize the effects of these types of displays on traveler satisfaction and mode shifting.
Keywords: Real-time information, mode choice, commute trip reduction
Introduction
Real-time information systems have emerged in recent years as a cost-effective way to make alternatives to driving more attractive, especially since traditional approaches such as expanding service areas, increasing frequency, and enhancing on-time

Effects of a Public Real-Time Multi-Modal Transportation Information Display on Travel Behavior and Attitudes
Journal of Public Transportation, Vol. 20, No. 2, 2017 41
performance tend to be expensive. Alternative transportation services such as public transit, shared-use vehicle programs, and ride-sourcing platforms (also known as transportation network companies, or TNCs) provide mobility with higher sustainability and less environmental impact than privately-owned vehicles (Poudenx 2008). However, automobile use continues to predominate for multiple reasons, including autos' convenience, flexibility, and wide availability. Thanks to continuous progress in information and computing technology, real-time transportation information systems have emerged as a relatively low-cost approach to making alternative modes more attractive (Lyons and Urry 2005). Properly implemented, a real-time transportation information system is a travel demand management tool that presents current and potential travelers with dynamic, timely, and accurate information on alternative transportation services, such as vehicle arrival times, service availability updates, and service change notifications. Transit Cooperative Research Program (TCRP) Synthesis Report 104 provides a detailed review of the technical characteristics of real-time transit information systems and best practices for installation, largely in the context of signage at transit stops (Schweiger 2013). It also documents many of the benefits of such systems, including lower perceived wait times, greater feelings of safety and security, and better overall perceptions of service. Increasingly, the provision of real-time information is seen as essential to attracting passengers, increasing revenues, and projecting the image of a state-of-the-art transportation system (Dziekan 2004; Lyons and Harman 2002).
Many jurisdictions have invested in real-time transportation information systems based on their expected economic, social, and environmental benefits (Cham et al. 2006). However, compared with the large body of research on traveler information systems and driving behavior (Lappin and Bottom 2001), less work has evaluated traveler responses to real-time information about alternative modes. Although several studies have examined associations between ridership and real-time information among transit riders, few have convincingly addressed the causal effect of real-time transportation information displays on the choices of travelers. The key contribution of this study is to use a pre-test/post-test control group research design, analyzed by difference-in-differences, to identify the causal effects of installing a real-time information display on traveler attitudes, satisfaction, and choices.
Prior Work
Prior research has used stated preference, revealed preference, and simulation approaches to assess the effects of providing real-time transit information. Initial efforts used stated preference approaches and suggested the potential to increase transit usage by providing real-time transportation information (Abdel-Aty et al. 1996; Reed and Levine 1997; Abdel-Aty 2001). Others used simulations to evaluate the potential time savings and route choices of travelers provided with real-time information (Hickman and Wilson 1995). Once real-time information systems were deployed, several revealed preference studies assessed their real world impacts. For example, Zhang et al. (2008) used a before-and-after study to test the effectiveness of deploying ShuttleTrac on the

Effects of a Public Real-Time Multi-Modal Transportation Information Display on Travel Behavior and Attitudes
Journal of Public Transportation, Vol. 20, No. 2, 2017 42
University of Maryland College Park campus. The ShuttleTrac system disseminates real-time bus arrival information via telephone, website, terminals at selected stops, and a large display at an activity center. This study found insignificant impacts on individual shuttle trip frequency, waiting anxiety, and feelings of security during the day. However, rider feelings of security after dark and their overall level of satisfaction increased with ShuttleTrac use. Recently, particular attention has been paid to evaluating effects using carefully-designed studies. In one noteworthy example, Brakewood et al. (2014) encouraged a randomly-selected subset of bus riders in Tampa, Florida, to use OneBusAway, a mobile application conveying transit arrival information. Their results provided strong evidence that the access to real-time information significantly improved the passenger experience of waiting for the bus, but found no effects on trip and transfer frequencies.
Real-time transit information may affect several outcomes, including mode choices, route choices, satisfaction, and perceptions of ease-of use, waiting time, and security. It reduces the uncertainty of accessing transportation services, so that travelers reduce their time wasted on waiting and the productivity lost to missed, delayed, or unavailable transportation service (Swanson et al. 1997). Smith et al. (1994) evaluated the effects of the application of advanced transport telematics in London, namely the Countdown project. The London Countdown system led to increased positive attitudes towards bus travel, the bus operator, and the local public transportation authority. For a ferry system along the Thames River in London, real-time information also enhanced the general impression of that particular travel option (Cassidy and White 1995). A conjoint analysis found that real-time information was expected to reduce the burden of waiting as the degree of certainty increased (Reed 1995). Thus, access to real-time information promotes feelings of reliability and convenience (Zito et al. 2011). When customer evaluations were conducted of bus status video monitor programs known as Transit Watch and Transit Tracker in Seattle, Washington, and Portland, Oregon, passengers felt less uncertainty and more in control after each implementation (Science Applications International Corporation 2003). Several studies have reported that real-time information affects wait times at transit stations in a positive way. The shortened wait time is associated with reduced disutility, less anxiety, and an increased feeling of personal security during the wait (Forsyth and Silcock 1985). In a before-and-after study, McCord et al. (2015) found that users of the Ohio State University’s real-time bus information system reported more positive attitudes about the bus system’s environmental and congestion benefits. Another recent study showed that real-time information via web-enabled and mobile devices caused modest increases in public transit ridership in New York City, particularly on heavily-traveled routes (Brakewood et al. 2015).
Earlier studies pertained primarily to information presented to travelers at transit stops, but in recent years mobile applications have emerged as a medium for providing real-time information directly to travelers. An example is the CTA Bus Tracker in the Chicago Transit Authority bus system. To investigate its impact on bus ridership, Tang and Thakuriah (2012) analyzed longitudinal data of route-level ridership. The incremental implementation of CTA Bus Tracker on different routes enabled their quasi-

Effects of a Public Real-Time Multi-Modal Transportation Information Display on Travel Behavior and Attitudes
Journal of Public Transportation, Vol. 20, No. 2, 2017 43
experimental design. They estimated linear mixed models that indicated a significant, modest, time-varying increase in monthly average weekday ridership after the provision of Bus Tracker service than before. Watkins et al. (2011) found that both the actual and perceived wait times of transit passengers with access to real-time information (via the OneBusAway mobile app) were shorter than those of passengers without.
In general, prior research provides more support for the notion that real-time information improves attitudes and satisfaction with alternative modes, but less compelling evidence that it directly affects mode choices or trip frequency using the alternative modes. Notably, past work has focused primarily on real-time information provided through displays at transit stops or via mobile apps. The present work focused on both the travel behavior and perceptual effects of a different medium: real-time information provided through a display screen at a public location other than a transit stop, specifically the lobby of an office building.
Hypotheses
This study tested the following hypotheses about the effects on traveler perceptual and behavioral responses of a real-time transportation information display in a public location:
1. Individuals exposed to the real-time information display are more likely to agree that sufficient resources exist for transportation information.
2. Individuals exposed to the real-time information display report higher levels of familiarity with alternatives to personal car travel.
3. Individuals exposed to the real-time information display report more favorable attitudes toward the modes featured on the information display.
4. Individuals exposed to the real-time information display are more likely to choose alternative travel modes for their commutes in particular, and for travel in general.
Methodology
A field experiment was conducted to test the hypotheses that exposure to a real-time transportation information display affects travel behavior and perceptions of alternative modes. The experiment was based on a pre-test/post-test control group design and was analyzed using a difference-in-difference analysis (Card and Krueger 1993). First, workers in three office buildings were divided into a treatment group (“Building A”) and a control group (“Building B” and “Building C”). Both groups participated in a web-based survey that measured travel behaviors, perceptions, and selected background variables. This pre-test survey was completed between late May and early June 2015. A real-time information display screen was installed in the treatment group building on June 15, 2015, and building occupants completed a post-test survey in December 2015.

Effects of a Public Real-Time Multi-Modal Transportation Information Display on Travel Behavior and Attitudes
Journal of Public Transportation, Vol. 20, No. 2, 2017 44
Research Location and Transportation Context
The location for this experiment was selected based on several criteria. First, the location needed to have convenient access to alternative transportation modes so commuters would have viable alternatives to driving alone. Second, the treatment and control sites had to be physically close to one another so the difference-in-difference experimental design would be valid. Third, the sites needed to be large enough to provide a sufficient sample size. Finally, a property manager was needed who would be a willing partner in allowing the installation of the real-time display and helping to contact building occupants. These criteria led to selecting a site in downtown Seattle after reviewing several candidate sites suggested by the Seattle Department of Transportation.
This experiment was conducted in three buildings located in the 11-acre area of downtown Seattle known as the Metropolitan Tract. Managed by a single property management company, all three buildings are within 400–600 ft of one another, with similar access to transportation infrastructure and resources. Within a quarter mile of the buildings studied in this experiment are 167 different transit routes. In the half-mile circular area around the three buildings is access to ferry, water taxi, and the South Lake Union streetcar. Downtown Seattle is also well-served by TNCs (Uber and Lyft), carsharing (car2go and Zipcar), and traditional taxis. Due to the central location, excellent bike lanes, and convenient public transportation services, Walk Score has rated the area a walk score of 99, a transit score of 100, and a bike score of 64 to 74.
The plethora of viable alternatives to driving alone has led to high usage of alternative modes in downtown Seattle. According to the latest commuter survey (Commute Seattle 2015) among downtown Seattle’s estimated 228,000 employees, 31% of commuters drove alone to work, down from 35% in 2010 and 34% in 2012. Public transit was the most popular choice for downtown commuters (45%), followed by driving alone (31%), ridesharing (9%), walking (7%), teleworking (4%), and bicycling (3%).
Data Collection
Occupants (i.e., employees whose regular workplace is in the building) of the three office buildings were surveyed in May and June 2015. Subjects were recruited via emails sent by property managers to tenant companies, who forwarded the emails on to individual workers. As an incentive to complete the survey, respondents were entered into a drawing to receive one of two iPads valued at $499 each. Out of a total of 2,575 occupants in the three buildings, 808 clicked through to the survey and 550 (21%) submitted usable responses. The second survey was conducted between December 7 and 21, 2015, approximately six months after the real-time information display was installed at the treatment site on June 15. Prior studies have suggested that a study period of six months should be sufficient to detect some longer-term responses to the availability of real-time information (Dziekan and Vermeulen 2006; Brakewood et al. 2014). Respondents again were offered the chance to win an iPad. In total, 709 of 2,579 occupants viewed the post-test survey, and 455 (18%) submitted valid responses. Also

Effects of a Public Real-Time Multi-Modal Transportation Information Display on Travel Behavior and Attitudes
Journal of Public Transportation, Vol. 20, No. 2, 2017 45
identified were 137 respondents (5%) who completed both waves of the survey, which were analyzed separately.
The research team developed the survey instrument specifically for this project to elicit data on four measures of interest: (1) familiarity with, (2) attitudes toward, (3) satisfaction with, and (4) usage of alternative travel modes. Survey items included a question about commute mode to and from work for the past five days and asked respondents to complete a one-day, recall-based travel diary. The average time to complete the survey was 20 minutes. Full details of the survey instrument are reported by MacKenzie et al. (2016).
Experimental Intervention
The treatment in this study was the installation of a real-time multimodal transportation information display in the lobby of Building A on June 15, 2015. Like many other public real-time transportation information systems, the display used in this study incorporated countdown information for nearby transit stops. However, as shown in Figure 1, it also provided information on the quantity and location of available carsharing vehicles, the estimated arrival time of TNC vehicles, and the availability of nearby bikeshare bicycles, obtained from service providers’ application programming interfaces (APIs). During the interface design stage, transit stations and stops were prioritized based on their proximity to Building A and their ability to serve the home ZIP codes of pre-test survey respondents. The content and design of the screen was updated in the initial few weeks after installation based on feedback from the building’s property managers and Seattle Department of Transportation. A snapshot of the final version of the public display is illustrated in Figure 1.
The screen used in this experiment was a 65-inch, 1080p edge-lit LED LCD Planar display. It was installed along a wall near the main entrance, information desk, and elevators in the ground-floor lobby of Building A so most people could easily see the display upon entering and exiting and drivers who needed to use the garage elevator would also be exposed to the information. No displays were installed at Buildings B or C, and none of the three buildings was equipped with a real-time transportation information display before the study. For purposes of our analysis, it was assumed that people who worked in Buildings B or C would not go to Building A just to use the public display.

Effects of a Public Real-Time Multi-Modal Transportation Information Display on Travel Behavior and Attitudes
Journal of Public Transportation, Vol. 20, No. 2, 2017 46
FIGURE 1. Screenshot of real-time multi-modal transportation information display

Effects of a Public Real-Time Multi-Modal Transportation Information Display on Travel Behavior and Attitudes
Journal of Public Transportation, Vol. 20, No. 2, 2017 47
Data Analysis
This study used a difference-in-difference quasi-experimental design to control for time-varying factors and estimate the causal effects of introducing a real-time information display. In an experiment involving habitual behaviors such as travel, treatment effects may take time to materialize. Thus, we waited approximately six months after the installation of the display before conducting the posttest survey. However, simply comparing responses before and after the intervention does not provide a credible estimate of the causal effects, since many other factors (weather, gasoline prices, service quality, etc.) might also affect respondent choices and attitudes even if the screen had never been installed.
The intuition of the difference-in-difference design is simple (Card and Krueger 1993). There are two groups (treatment and control) and two time periods (before and after treatment), and the interests is in some outcome variable(s). The difference in outcomes for the control group is measured before and after the treatment, and the difference in the treatment group before and after treatment. It is then assumed that whatever difference is observed in the control group represents what would have been observed in the treatment group if the latter had not received the treatment. When this assumption is made, it can be concluded that the causal effect of the treatment is the difference between the two differences calculated previously: the “difference in differences.” This is illustrated graphically in Figure 2 for a generic outcome variable y. Note that there is no assumption that the treatment and control groups are exactly the same, only that their changes over time would have been the same if not for the treatment being administered.
Control Treatment Difference Treatment Effect
Before C0 T0 D0 = T0 - C0D1 - D0= (T1 - C1) - (T0 - C0)
After C1 T1 D1 = T1 - C1

Effects of a Public Real-Time Multi-Modal Transportation Information Display on Travel Behavior and Attitudes
Journal of Public Transportation, Vol. 20, No. 2, 2017 48
The difference-in-difference estimator was developed into a regression modeling framework. To represent the group assignment and time period, two dummy variables were created, as shown by equation (1) and equation (2).
(1)
(2)
For simple, continuous outcome variables, an ordinary-least-squares regression model typically would be used, where εi is a random disturbance that is assumed to be independent of the explanatory variables, as shown in equation (3).
(3)
In the pre-test survey (t = 0), no treatment takes effect. The expected value of the dependent variable among the control group (gi = 0) can be represented as equation (4):
(4)
The expected value in the treatment group (gi = 1) can be represented as equation (5):
(5)
Thus, β1 represents the baseline difference between the two groups. In the post-test survey (t = 1), the treatment is applied only to the treatment group. The expected value of the outcome among the control group (gi = 0) can be represented as equation (6).
(6)
Among the treatment group, (gi = 1), the expected value can be represented as equation (7).
FIGURE 2.Difference-in-difference
estimator; β3 is estimated average treatment effect
Effects of a Public Real-Time Multi-Modal Transportation Information Display on Travel Behavior and Attitudes
Journal of Public Transportation, Vol. 20, No. 2, 2017 49
(7)
Thus, β2 denotes the change over time in the control group, which is assumed to represent the change that would have occurred in the treatment group if it had not received the treatment. The coefficient β3 captures the additional change in the treatment group beyond any initial differences with the control group and the change over time within the control group. Thus, β3 is the estimate of the causal effect of the treatment on the outcome.
Since many variables were non-continuous or non-normally distributed, various generalized linear models were used, each using the basic specification above as its linear predictor (i.e., the “right-hand side”). For mode choices, which are discrete, a logistic regression model was used. For attitudinal measures, which were measured on a Likert-type ordinal scale, an ordered logistic regression model was used. For daily vehicle miles traveled (which is often exactly zero, a condition known as zero-inflation), a gamma hurdle model was used, which allows first modeling whether or not miles traveled is zero, and if it is nonzero, modeling its magnitude. In cases in which there were repeated observations from the same respondent, mixed-effects variants of these models were used to capture respondent-specific characteristics.
Results
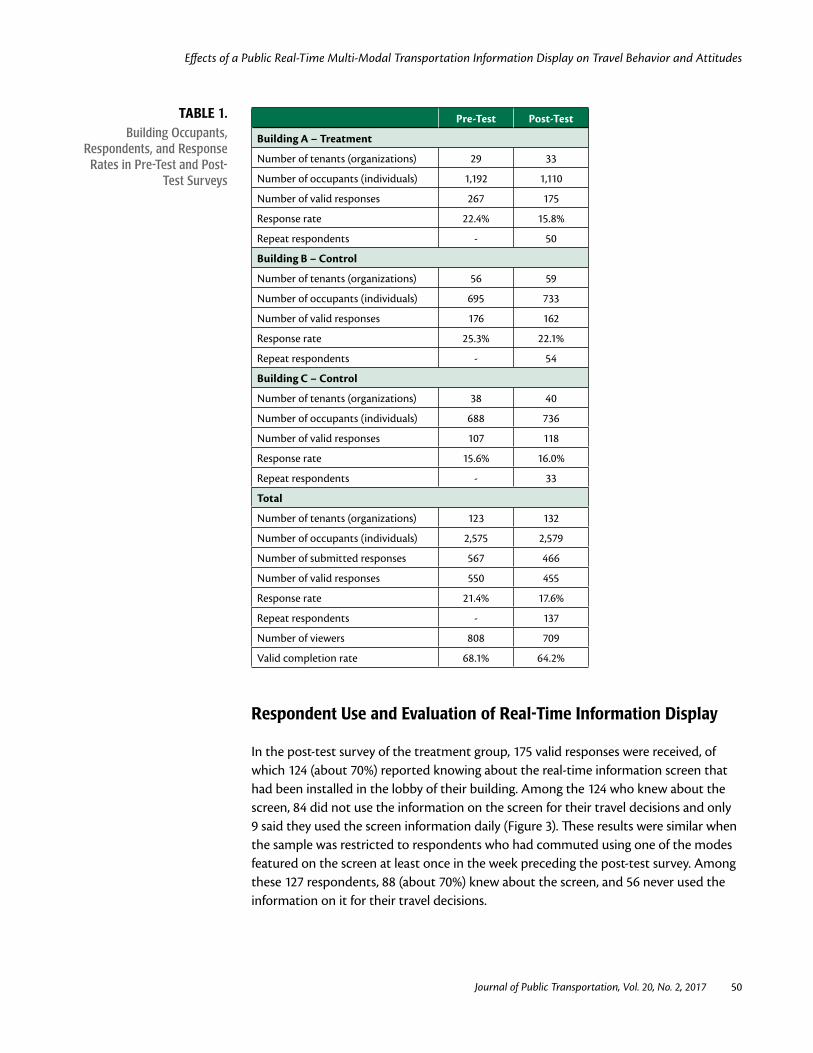
Table 1 summarizes the number of workers and respondents from each building in each wave of the survey. About one-third of the post-test respondents were linked to responses in the pre-test survey, based on email addresses they provided. Therefore, two parallel sets of analyses were conducted. First, the full pre-test and post-test samples were considered as independent cross-sections. Second, the 137 respondents who could be positively identified as having completed both waves of the survey were analyzed as a panel data set. This section reports the effects of the real-time information display on traveler awareness, attitudes, and satisfaction toward various transportation modes and its effects on self-reported travel behavior and reviews respondent awareness, usage, attitudes, and comments regarding the real-time information display itself. More detailed results are reported by MacKenzie et al. (2016).
Effects of a Public Real-Time Multi-Modal Transportation Information Display on Travel Behavior and Attitudes
Journal of Public Transportation, Vol. 20, No. 2, 2017 50
Pre-Test Post-Test
Building A – Treatment
Number of tenants (organizations) 29 33
Number of occupants (individuals) 1,192 1,110
Number of valid responses 267 175
Response rate 22.4% 15.8%
Repeat respondents - 50
Building B – Control
Number of tenants (organizations) 56 59
Number of occupants (individuals) 695 733
Number of valid responses 176 162
Response rate 25.3% 22.1%
Repeat respondents - 54
Building C – Control
Number of tenants (organizations) 38 40
Number of occupants (individuals) 688 736
Number of valid responses 107 118
Response rate 15.6% 16.0%
Repeat respondents - 33
Total
Number of tenants (organizations) 123 132
Number of occupants (individuals) 2,575 2,579
Number of submitted responses 567 466
Number of valid responses 550 455
Response rate 21.4% 17.6%
Repeat respondents - 137
Number of viewers 808 709
Valid completion rate 68.1% 64.2%
Respondent Use and Evaluation of Real-Time Information Display
In the post-test survey of the treatment group, 175 valid responses were received, of which 124 (about 70%) reported knowing about the real-time information screen that had been installed in the lobby of their building. Among the 124 who knew about the screen, 84 did not use the information on the screen for their travel decisions and only 9 said they used the screen information daily (Figure 3). These results were similar when the sample was restricted to respondents who had commuted using one of the modes featured on the screen at least once in the week preceding the post-test survey. Among these 127 respondents, 88 (about 70%) knew about the screen, and 56 never used the information on it for their travel decisions.
TABLE 1.Building Occupants,
Respondents, and Response Rates in Pre-Test and Post-
Test Surveys

Effects of a Public Real-Time Multi-Modal Transportation Information Display on Travel Behavior and Attitudes
Journal of Public Transportation, Vol. 20, No. 2, 2017 51
FIGURE 3. Screen usage frequency among treatment group respondents who knew about screen
Treatment group respondents who were aware of the screen were asked if the screen was easy to read and understand, if it displayed accurate and reliable travel information, if they were satisfied with it, and if it met their expectations. As shown in Figure 4, most thought the screen was easy to understand and reliable and met their expectations.
FIGURE 4.Perceptions of real-time
display screen among treatment group respondents
who were aware of its presence.

Effects of a Public Real-Time Multi-Modal Transportation Information Display on Travel Behavior and Attitudes
Journal of Public Transportation, Vol. 20, No. 2, 2017 52
To gain a deeper understanding of people’s perceptions of the screen, responses to an open-ended question about the screen and how it might be improved were reviewed. The full responses are provided in Appendix B of MacKenzie et al. (2016), and the following themes among the responses were noted:
• Numerous respondents noted that they prefer to use OneBusAway or similar smartphone apps to get the same information shown on the screen.
• Several comments implied that the respondent thought the display screen was showing schedule information, not real-time information.
• Several comments noted that the screen did not show route information for their transit routes.
• Several commented on the location of the screen—that it was difficult to see, in a corner, or too close to the building’s security guard.
Effects of Real-Time Display on Awareness, Attitudes and Satisfaction
This section presents detailed results for the effects of the real-time information display on awareness, attitudes, and satisfaction with public transportation. Also presented are some key summary results for driving and other alternative modes (full results for these modes are reported by MacKenzie et al. [2016]). The results of the statistical analyses generally do not provide evidence that the real-time information display caused a change in satisfaction, attitudes, or awareness of any modes.
Table 2 summarizes the median ratings of perceptual indicators relating to various travel modes. A minimum score of 0 and a maximum score of 10 apply to each of these indicators. Across the treatment and control groups and both survey waves, respondents were very familiar with the local public transportation systems, moderately familiar with TNC services, and only slightly familiar with car-share and bike-share services. (Although “TNC” is used in this paper, “Hired car service [e.g., Uber, Lyft]” was used in the questionnaire to avoid confusing respondents; Table 2 reflects the language used in the questionnaire.) Respondents considered public transportation the most important among all travel options, followed by driving and walking. In terms of satisfaction, travel by walking received the highest evaluation, followed by public transportation, TNC service, and car-share service. For service quality factors such as convenience and reliability, TNC service had the highest ratings, even exceeding driving and public transportation.

Effects of a Public Real-Time Multi-Modal Transportation Information Display on Travel Behavior and Attitudes
Journal of Public Transportation, Vol. 20, No. 2, 2017 53
TABLE 2. Perceptual Indicators by Group (0–10 scale)
Perception by Mode
Control Group Pre-Test N = 283
Control Group Post-Test N = 280
Treatment Group Pre-Test
N = 267
Treatment Group Post-Test
N = 175
Median Median Median Median
How familiar are you with the following travel options around the Seattle area? (0=not at all, 10=extremely familiar)
Public transportation (e.g., buses, light rail) 9 9 8 9
Hired car service (e.g., Uber, Lyft) 5 6 5 7
Car-share services (e.g., Zipcar, car2go) 3 3 3 3
Bike-share service (e.g., Pronto) 1 1 1 1
How important are the following travel options for your daily travel? (0=not at all, 10=extremely important)
Driving 6 6 7 7
Bicycling 0 0 0 0
Walking 7 6 5 7
Public transportation (e.g., buses, light rail) 10 10 10 10
Hired car service (e.g., Uber, Lyft) 0 1 1 1
Car-share services (e.g., Zipcar, car2go) 0 0 0 0
Bike-share service (e.g., Pronto) 0 0 0 0
Overall, how satisfied are you with the following travel options around the Seattle area? (0=extremely dissatisfied, 10=extremely satisfied)
Driving 5 4 5 4
Bicycling 5 5 5 5
Walking 7 6 7 7
Public transportation (e.g., buses, light rail) 7 7 7 7
Hired car service (e.g., Uber, Lyft) 7 7 7 7
Car-share services (e.g., Zipcar, car2go) 6 5 5 5
Bike-share service (e.g., Pronto) 5 5 5 4
Convenience: X is convenient. (0=strongly disagree, 10=strongly agree)
Driving 5 5 6 5.5
Riding public transportation 7 7 7 7
Using hired car services 8 8 8 9
Using car-share vehicle services 6 5 5 5
Using bike-share services 3.5 3 3 3.5
Reliability: X is reliable. (0=strongly disagree, 10=strongly agree)
Driving 6 6 7 7
Riding public transportation 6 6 6 6
Using hired car services 7 8 7 8
Using car-share vehicle services 6 5 5 5
Using bike-share services 5 5 5 5
Sufficient information is available aboutX. (0=strongly disagree, 10=strongly agree)
Driving 7 7 7 8
Using public transportation 7 7 7 8
Using hired car services 7 7 7 7

Effects of a Public Real-Time Multi-Modal Transportation Information Display on Travel Behavior and Attitudes
Journal of Public Transportation, Vol. 20, No. 2, 2017 54
Perception by Mode
Control Group Pre-Test N = 283
Control Group Post-Test N = 280
Treatment Group Pre-Test
N = 267
Treatment Group Post-Test
N = 175
Median Median Median Median
Using car-share vehicle services 5 5 4 5
Using bike-share services 4 3 3 3
Expanding X is beneficial. (0=strongly disagree, 10=strongly agree)
Public transportation services 10 10 10 10
Hired car services 6 7 6 7
Car-share vehicle services 7 7 6 7
Bike-share services 6 5 5 6
I prefer to X whenever possible. (0=strongly disagree, 10=strongly agree)
Drive 3 3 5 5
Ride public transportation 7 7 5 6
Use hired car services 3 2 3 3
Use car-share vehicle services 2 1 2 1
Use bike-share services 1 0 0 0
Figures 5 through 9 summarize the distributions of reported familiarity, attitudes, and satisfaction with public transportation in the control and treatment groups, before and after the screen was installed. Overall, all groups were fairly similar in these metrics. Some small differences can be identified in the figures and are discussed here. Later in this section, whether these differences were statistically significant or if they could have occurred by chance are discussed. Figure 5 shows that both groups were very familiar with public transportation, with similar distributions before and after the screen was installed. Both groups also consider public transportation to be important to their daily travel (Figure 6), and its importance may have increased slightly between the pre-test and post-test. A large majority in both groups was satisfied with public transportation (Figure 7), but satisfaction appears to decrease slightly between the pre-test and post-test. In all groups, less than 20% disagreed with the idea that sufficient information was available about public transportation (Figure 8). Curiously, between the pre-test and post-test, the treatment group showed an increase in both the fraction strongly agreeing and the fraction disagreeing that sufficient information was available. A majority agreed that they preferred to ride public transportation whenever possible (Figure 9), and there may have been a small shift in the tendency of the treatment group to agree with this statement.
TABLE 2. (CONT'D.) Perceptual Indicators by Group (0–10 scale)

Effects of a Public Real-Time Multi-Modal Transportation Information Display on Travel Behavior and Attitudes
Journal of Public Transportation, Vol. 20, No. 2, 2017 55
FIGURE 5.Stated familiarity with public transportation for treatment
and control groups before and after screen installation
FIGURE 6.Stated importance of public
transportation for treatment and control groups before and
after screen installation

Effects of a Public Real-Time Multi-Modal Transportation Information Display on Travel Behavior and Attitudes
Journal of Public Transportation, Vol. 20, No. 2, 2017 56
FIGURE 7.Stated satisfaction with public
transportation for treatment and control groups before and
after screen installation
FIGURE 8.Views on sufficiency of
information about public transportation for treatment
and control groups before and after screen installation

Effects of a Public Real-Time Multi-Modal Transportation Information Display on Travel Behavior and Attitudes
Journal of Public Transportation, Vol. 20, No. 2, 2017 57
Ordered logistic regression was used to test whether the real-time display screen had a significant effect on satisfaction with or attitudes toward public transportation, using the model specification in equation (3). The estimated treatment effects and associated p-values from these analyses are summarized in Table 3. Each row corresponds to a single perceptual indicator. The first column is the estimated effect of the real-time display on that perceptual indicator, for the full sample of respondents. The second column contains the corresponding p-value for the causal effect estimate, based on a likelihood ratio test on the treatment-posttest interaction term. The third column contains the estimated effect of the real-time display on the perceptual indicator for the subset of 137 respondents who answered both waves of the survey. The fourth column contains the p-value of the estimate in column three, based on a likelihood ratio test. None of the estimated treatment effects related to public transportation were statistically significant at the α=0.05 level. Table 3 also summarizes the estimated causal effects of the real-time display on familiarity, satisfaction, and attitudes toward driving and other alternative modes. Several of these estimates (noted in boldface) are statistically significant at conventional levels (α=0.05). However, in an experiment such as this where multiple comparisons are being made, there is an increased risk of false positives. Since there were approximately 40 outcomes of interest and 2 modeling approaches (full-sample and repeat-respondents only), 80 comparisons in total were made. The large number of comparisons means more opportunities to make a type I error (a “false positive”). To mitigate this risk, a Bonferroni correction was applied, dividing the significance threshold by 80 (the number of comparisons). This reduces
FIGURE 9.Stated preferences for public transportation for treatment
and control groups before and after screen installation

Effects of a Public Real-Time Multi-Modal Transportation Information Display on Travel Behavior and Attitudes
Journal of Public Transportation, Vol. 20, No. 2, 2017 58
the significance threshold from α=0.05 to α=0.0006. Once this was done, none of the effects in Table 3 appear to be significant. These results are consistent with a multivariate analysis of variance (MANOVA), which failed to reject the null hypothesis that perceptions are the same across all groups (p=0.52).
All Respondents Repeat Respondents Only
Est. Treatment Effect p Est. Treatment Effect p
Public transportation
Familiarity 0.083 0.722 -0.179 0.740
Importance 0.041 0.872 1.130 0.169
Satisfaction 0.089 0.701 0.282 0.565
Convenience -0.078 0.731 -0.278 0.572
Reliability 0.055 0.810 -0.528 0.283
Information sufficiency 0.080 0.729 -0.099 0.840
Expansion is beneficial 0.271 0.314 0.419 0.512
Prefer to use 0.357 0.117 0.732 0.173
TNC services
Familiarity 0.052 0.818 -0.219 0.662
Importance 0.263 0.274 -0.108 0.831
Satisfaction 0.145 0.635 -0.629 0.347
Convenience 0.027 0.925 -0.725 0.256
Reliability 0.001 0.996 -0.744 0.232
Information sufficiency 0.104 0.703 -0.907 0.129
Expansion is beneficial 0.342 0.220 0.437 0.480
Prefer to use 0.457 0.095 1.261 0.042
Carsharing
Familiarity 0.049 0.828 -0.615 0.209
Importance 0.428 0.103 0.593 0.191
Satisfaction 0.549 0.168 0.358 0.677
Convenience 0.362 0.331 0.762 0.351
Reliability 0.717 0.071 0.849 0.301
Information sufficiency 0.654 0.055 0.553 0.424
Expansion is beneficial 0.696 0.046 0.597 0.383
Prefer to use 0.429 0.215 1.292 0.114
Bikesharing
Familiarity 0.205 0.384 -0.360 0.497
Importance 0.173 0.597 0.967 0.265
Satisfaction -0.571 0.250 -1.519 0.234
Convenience 0.526 0.231 0.058 0.957
Reliability 0.153 0.748 -0.181 0.871
Information sufficiency 0.397 0.300 0.559 0.500
Expansion is beneficial 0.752 0.047 0.101 0.917
Prefer to use 0.828 0.040 3.355 0.002
TABLE 3. Estimated Treatment Effects for Real-Time Multi-Modal Display
Screen on Familiarity, Attitudes, and
Satisfaction with Various Modes, and Associated
p-Values

Effects of a Public Real-Time Multi-Modal Transportation Information Display on Travel Behavior and Attitudes
Journal of Public Transportation, Vol. 20, No. 2, 2017 59
All Respondents Repeat Respondents Only
Est. Treatment Effect p Est. Treatment Effect p
Driving
Satisfaction -0.342 0.143 -0.340 0.484
Convenience -0.126 0.582 0.508 0.304
Reliability -0.134 0.561 0.504 0.320
Information sufficiency 0.053 0.821 0.157 0.759
Desire for another car 0.334 0.208 0.405 0.522
Prefer to use -0.298 0.195 -0.185 0.730
TABLE 3. (CONT'D) Estimated Treatment Effects for Real-Time Multi-Modal Display
Screen on Familiarity, Attitudes, and
Satisfaction with Various Modes, and Associated
p-Values
Effects of Real-time Display on Travel Behavior
The commute mode shares for the control group and the treatment group, before and after the installation of the real-time display, are shown in Figure 10. Public transportation was the top choice for most commute trips, followed by driving alone. Very few respondents used TNC services, car-share services, bike-share services, taxicab, private shuttle or bus, or other modes for commuting. Between the pre-test survey and the post-test, the percentage of respondents who reported driving alone as their commute mode decreased on all days for the treatment group, and four out of five days for the control group.
FIGURE 10.Commute mode shares in
control and treatment groups, before and after installation
of real-time display

Effects of a Public Real-Time Multi-Modal Transportation Information Display on Travel Behavior and Attitudes
Journal of Public Transportation, Vol. 20, No. 2, 2017 60
A mixed-effect binary logistic regression model was estimated to test whether the installation of the screen had a significant effect on commute mode choices. In this model, the dependent variable was whether the traveler chose to drive alone or used some other mode for their commutes. A random intercept term was included to account for correlation in repeated choices made by the same individual, since each individual reported modes for 10 commute trips. The model produced an estimated regression coefficient of -0.096 for the treatment effect, but this effect was not statistically significant (p=0.92).
The analysis was repeated for only the 137 respondents who participated in both waves of the survey, and the results yielded an estimated regression coefficient of 1.88 (p=0.0005). This reflects the reported commute modes shown in Table 4—repeat respondents in the control group showed a 5.0 percentage point decrease in drive-alone commute trips, whereas those in the treatment group showed a 0.7 percentage point increase in drive-alone trips. This result suggests that the installation of the real-time display was associated with a significantly higher probability of driving alone. Considered in the context of the other results reported here, this may be a spurious correlation.
TABLE 4.Commute Modes Reported by 137 Respondents Who
Completed Both Survey Waves
Group Pre-Test / Post-Test % Drive Alone
ControlPre 17.4%
Post 12.4%
TreatmentPre 17.7%
Post 18.4%
Comparing the pre-test and post-test surveys, average automobile miles traveled decreased slightly in the control group (from 11.6 miles to 10.8 miles) and more substantially in the treatment group (14.1 miles to 8.7 miles). However, upon analyzing these data using a gamma hurdle model, it was found that this difference was not significant at the 0.05 level. This was the case when both the full data set and the panel data including only the 137 respondents who responded to both waves of the survey were used.
Conclusions and Recommendations
A well-designed real-time multi-modal transportation information display can provide clear and reliable information and a satisfying experience for users. However, little evidence was found that the installation of a real-time multi-modal display screen in an office building lobby changed the building occupant travel choices, satisfaction, familiarity, or attitudes toward alternatives to private car travel over the course of a six-month study period. Based on the quantitative data collected in the survey as well as open-ended comments from respondents, the following recommendations for future installations of public real-time information displays are offered:

Effects of a Public Real-Time Multi-Modal Transportation Information Display on Travel Behavior and Attitudes
Journal of Public Transportation, Vol. 20, No. 2, 2017 61
• Target gaps in awareness and use. Future investments in public information displays may be more effective if they target locations with lower usage, satisfaction, and/or awareness of alternative transportation modes. Even in the absence of the real-time information display, respondents in this study were very familiar with alternative modes, especially transit, and many reported using transit on a regular basis. A real-time information display might be more effective at shifting attitudes and behaviors if installed in a location with more “low-hanging fruit,” i.e., room to increase awareness and use of alternative modes.
• Target gaps in information. Many respondents in this study felt that adequate information about transit was already available from other sources. In particular, many mentioned their reliance on the OneBusAway smartphone app for obtaining real-time transit information. A real-time information display may have more to offer in locations in which real-time information is not available via smartphone apps or smartphone adoption is low or in areas with poor mobile data coverage.
• Consider usability and location in installation. Although most respondents were aware of the display screen, a majority never used it. Several respondents noted the physical location of the real-time display in this study was inconvenient, located out of the way and close to a security guard’s desk. Future installations should strive to locate the screen where it is easy and comfortable for travelers, including both building occupants and visitors, to view.
• Consider marketing/public information at launch. Some respondent comments revealed a lack of understanding of the screen’s purpose and the information it contained, indicating that they believed the screen contained schedule information, not real-time information. Although the display screen showed information on services other than transit, we did not detect changes in usage, satisfaction, or attitudes toward other services were not detected, and respondent open-ended comments suggested that they primarily viewed it as a source of transit information. Future installations might be more successful if the installation were accompanied by a marketing or public information campaign to ensure that potential users understand that the screen is displaying real-time information on multiple services.
In closing, some recommendations for future research in this area specifically and in the transportation field more broadly are presented. First, it may be worthwhile to evaluate the effects of real-time information displays that are responsive to the above site selection and installation recommendations. Second, future work may want to consider route choice as a behavioral outcome, since providing information in workplaces or other public locations may support choices between transit routes more effectively than providing the same information after someone has walked to a particular transit stop or station. Third, this work considered only building occupants whose regular workplace was in the study buildings, but visitors to the buildings may have different responses than occupants. Fourth, it may be worth evaluating impacts over a longer time horizons than the six months used in this study, especially since behaviors and

Effects of a Public Real-Time Multi-Modal Transportation Information Display on Travel Behavior and Attitudes
Journal of Public Transportation, Vol. 20, No. 2, 2017 62
attitudes take time to evolve. Finally, other transportation researchers are urged to conduct more careful evaluations of interventions, using appropriate experimental or quasi-experimental research designs (Campbell and Stanley 1963). Sound evaluations should be planned in advance and should use control groups and, where possible, randomization. The use of control groups becomes particularly important in longer-term studies, in which time-varying confounders can undermine the validity of a simple before-and-after evaluation, with sometimes embarrassing results (e.g., Degraeuwe and Beusen 2013).
References
Abdel-Aty, Mohamed A. 2001. “Using Ordered Probit Modeling to Study the Effect of ATIS on Transit Ridership.” Transportation Research Part C: Emerging Technologies 9 (4): 265-77. doi:10.1016/S0968-090X(00)00037-1.
Abdel-Aty, Mohamed, Ryuichi Kitamura, and Paul Jovanis. 1996. “Investigating Effect of Advanced Traveler Information on Commuter Tendency To Use Transit.” Transportation Research Record, 1550 (January): 65-72. doi:10.3141/1550-09.
Brakewood C., G. Macfarlane, and K. Watkins. 2015. “The Impact of Real-Time Information on Bus Ridership in New York City.” Transportation Research Part C: Emerging Technologies 53:59-75.
Brakewood, Candace, Sean Barbeau, and Kari Watkins. 2014. “An Experiment Evaluating the Impacts of Real-Time Transit Information on Bus Riders in Tampa, Florida.” Transportation Research Part A: Policy and Practice 69 (November): 409-22. doi:10.1016/j.tra.2014.09.003.
Campbell, D. T., and J. C. Stanley. 1963. Experimental and Quasi-Experimental Designs for Research. New York: Houghton Mifflin.
Cassidy, S., and P. R. White. 1995. “Use and Perceptions of a Real Time Passenger Information System.” Journal of Advanced Transportation 29(1): 27-39. doi:10.1002/atr.5670290105.
Cham, Laura, Georges Darido, David Jackson, Richard Laver, and Donald Schneck. 2006. “Real-Time Bus Arrival Information Systems Return-on-Investment Study.” Federal Transit Administration. http://trid.trb.org/view.aspx?id=793114.
Commute Seattle. 2015. “2014 Center City Commuter Mode Split Survey Results.” http://commuteseattle.com/2014-modesplit-survey/.
Degraeuwe, B., and B. Beusen. 2013. “Using On-Board Data Logging Devices to Study the Longer-Term Impact of an Eco-Driving Course.” Transportation Research Part D: Transport and Environment, 19: 48-49.
Dziekan, K. 2004. “Customer Perceptions and Behavioural Responses to IT-Based Public Transport Information: Literature Review and What the Experts Say.” TRITA-INFRA, No. 04-012. http://trid.trb.org/view.aspx?id=840810.

Effects of a Public Real-Time Multi-Modal Transportation Information Display on Travel Behavior and Attitudes
Journal of Public Transportation, Vol. 20, No. 2, 2017 63
Dziekan, Katrin, and Arjan Vermeulen. 2006. “Psychological Effects of and Design Preferences for Real-Time Information Displays.” Journal of Public Transportation, 9(1). http://trid.trb.org/view.aspx?id=780950.
Forsyth, E., and D. T. Silcock. 1985. “Evaluation of Real-Time Information on the Arrival of Urban Public Transport Services.” Seminar on Public Transport Operations Research. http://trid.trb.org/view.aspx?id=238584.
Hickman, M., and N. H. M. Wilson. 1995. “Passenger Travel Time and Path Choice Implications of Real-Time Transit Information.” Transportation Research Part C: Emerging Technologies, 3(4):211-226.
Lappin, J., and J. Bottom. 2001. “Understanding and Predicting Traveler Response to Information: A Literature Review.” Volpe National Transportation Systems Center. http://trid.trb.org/view.aspx?id=697629.
Lyons, Glenn, and Reg Harman. 2002. “The UK Public Transport Industry and Provision of Multi-Modal Traveller Information.” International Journal of Transport Management, 1(1): 1-13. doi:10.1016/S1471-4051(01)00002-7.
Lyons, Glenn, and John Urry. 2005. “Travel Time Use in the Information Age.” Transportation Research Part A: Policy and Practice, 39 (2-3): 257-76. doi:10.1016/j.tra.2004.09.004.
MacKenzie, D., Y. Ge, P. Jabbari, and J. Tao. 2016. “Evaluation of Effects of Real Time-Multi-Modal Transportation Information Displays: Final Report.” Prepared for Seattle Department of Transportation, February. http://faculty.washington.edu/dwhm/publications/.
McCord, M., R. Mishalani, and M. Ettefagh. 2015. “Effect of Real-Time Passenger Information Systems on Perceptions of Transit’s Favorable Environmental and Traffic Reduction Roles.” Transportation Research Record, 2538: 102-109.
Poudenx, Pascal. 2008. “The Effect of Transportation Policies on Energy Consumption and Greenhouse Gas Emission from Urban Passenger Transportation.” Transportation Research Part A: Policy and Practice, 42(6): 901-9. doi:10.1016/j.tra.2008.01.013.
Reed, T. B. 1995. “Reduction in the Burden of Waiting for Public Transit due to Real-Time Schedule Information: A Conjoint Analysis Study.” Vehicle Navigation and Information Systems Conference, 1995. Proceedings. In conjunction with the Pacific Rim TransTech Conference, 6th International VNIS, “A Ride into the Future”: 83-89. doi:10.1109/VNIS.1995.518822.
Reed, T. B., and J. C. Levine. 1997. “Changes in Traveler Stated Preference for Bus and Car Modes Due to Real-Time Schedule Information: A Conjoint Analysis.” Journal of Public Transportation, 1(2). http://trid.trb.org/view.aspx?id=481513.
Schweiger, C. L. 2013. “Use of Electronic Passenger Information Signage in Transit.” TCRP Synthesis 104. Transportation Research Board. Washington, DC.
Effects of a Public Real-Time Multi-Modal Transportation Information Display on Travel Behavior and Attitudes
Journal of Public Transportation, Vol. 20, No. 2, 2017 64
Smith, R., S. Atkins, and R. Sheldon. 1994. “London Transport Buses: ATT in Action and the London Countdown Route 18 Project.” Proceedings of the First World Congress on Applications of Transport Telematics and Intelligent Vehicle-Highway Systems. http://trid.trb.org/view.aspx?id=424466.
Swanson, J., L. Ampt, and P. Jones. 1997. “Measuring Bus Passenger Preferences.” Traffic Engineering and Control, 38(6): 330-36.
Science Applications International Corporation. 2003. “Oregon Regional Intelligent Transportation Systems (ITS) Integration Program Final Phase III Report: Transit Tracker Information Displays.” Available through National Technical Information Services.
Tang, Lei, and Piyushimita (Vonu) Thakuriah. 2012. “Ridership Effects of Real-Time Bus Information System: A Case Study in the City of Chicago.” Transportation Research Part C: Emerging Technologies, 22: 146-61. doi:10.1016/j.trc.2012.01.001.
Tseng, Yin-Yen, Jasper Knockaert, and Erik T. Verhoef. 2013. “A Revealed-Preference Study of Behavioural Impacts of Real-Time Traffic Information.” Transportation Research Part C: Emerging Technologies, 30: 196-209. doi:10.1016/j.trc.2011.11.006.
Watkins, K., B. Ferris, A. Borning, G. S. Rutherford, and D. Layton. 2011. “Where Is My Bus? Impact of Mobile Real-Time Information on the Perceived and Actual Wait Time of Transit Riders.” Transportation Research Part A: Policy and Practice, 45(8): 839-848.
Zhang, Feng, Qing Shen, and Kelly Clifton. 2008. “Examination of Traveler Responses to Real-Time Information About Bus Arrivals Using Panel Data.” Transportation Research Record, 2082: 107-15. doi:10.3141/2082-13.
Zito, Pietro, Gianfranco Amato, Salvatore Amoroso, and Maria Berrittella. 2011. “The Effect of Advanced Traveller Information Systems on Public Transport Demand and Its Uncertainty.” Transportmetrica, 7(1): 31-43. doi:10.1080/18128600903244727.
About the Authors
Yanbo Ge ([email protected]) is a Ph.D. student in Civil and Environmental Engineering at the University of Washington. She currently works as a research assistant in the Sustainable Transportation Lab and is interested in vehicle electrification, transit-oriented development, non-motorized transportation modes, and shared-use mobility services. She holds a B.S. in Transportation Engineering and an M.S. in Urban Planning, both from Tongji University, China
Parastoo Jabbari ( [email protected]) is a master’s student in Civil and Environmental Engineering at the University of Washington. She is a research assistant in the Sustainable Transportation Lab and is interested in energy and environmental aspects of transportation systems, particularly vehicle electrification, vehicle automation, and their relationships with public policy. She holds a bachelor’s degree in Civil Engineering from Sharif University of Technology in Tehran, Iran.

Effects of a Public Real-Time Multi-Modal Transportation Information Display on Travel Behavior and Attitudes
Journal of Public Transportation, Vol. 20, No. 2, 2017 65
Don MacKenzie ([email protected]) is an Assistant Professor of Civil and Environmental Engineering at the University of Washington. He leads the Sustainable Transportation Lab, which develops and evaluates technical and policy solutions for making our transportation system more economically-viable and environmentally-benign while providing access to opportunities for all. He holds a Ph.D. in Engineering Systems and an S.M. in Technology and Policy, both from the Massachusetts Institute of Technology, and a B.A.Sc. in Chemical and Biological Engineering from the University of British Columbia. He is a member of the Transportation Research Board’s Standing Committee on Transportation Energy and chairs its Subcommittee on Energy and Demand Implications of Connected and Automated Vehicles.
Jiarui Tao ( [email protected]) is a Ph.D. student in Transportation Science at the University of California, Irvine. He was previously a master’s student in Urban Design and Planning at the University of Washington and holds a bachelor’s degree in City Management from Renmin University of China.