effects of agricultural commercialization on land use and...
TRANSCRIPT

University of Hohenheim
Institute of Agricultural Economics and Social Sciences in Tropics and Subtropics
Department of Land-use Economics in the Tropics and Subtropics
Prof. Dr. Thomas Berger
Effects of agricultural commercialization on land use and pest
management of smallholder upland farms in Thailand
Dissertation
Submitted in fulfilment of the requirements for the degree
“Doktor der Agrarwissenschaften”
(Dr. sc. Agr./PhD in Agricultural Sciences)
to the Faculty of Agricultural Sciences
Presented by
Suthathip Grovermann, née Riwthong
Place of Birth: Lampang, Thailand
Stuttgart-Hohenheim, 2016

Declaration
I
Declaration
I can guarantee that this doctoral thesis is a result of my personal work and that no other than
the indicated aids were used during its completion. All the quotations and statements used are
indicated as such; furthermore, I can also provide assurance that this work has not been used,
whether in whole or in part, for the achievement of any other academic degree.
Stuttgart, Hohenheim, July 2015
Suthathip Grovermann
This thesis was accepted as a doctoral dissertation in fulfillment of the requirements for the
degree ‘Doktor der Agrarwissenschaften’ (Dr. sc. Agr. / Ph.D.) by the faculty of Agricultural
Sciences at the University of Hohenheim on January 12, 2016
Date of oral examination: April 25, 2016
Examination committee
Supervisor and reviewer: Prof. Dr. Thomas Berger
Co-reviewer: Prof. Dr. Georg Cadisch
Additional examiner: Prof. Dr. Regina Birner
Head of the committee: Prof. Dr. Markus Rodehutscord

Summary
II
Summary
Over recent years, economic development, policy changes, new technologies and population
growth have been motivating farmers in Thailand to intensify and commercialize their
production activities. As part of this agricultural commercialization and intensification
process, Thai upland farmers have adapted their farming practices to increase crop production
and productivity levels. This thesis clearly demonstrates that there is a positive relationship
between land use intensification/commercialization and the use of chemical-based pest
management activities, i.e. farmers have increasingly relied on the use of chemicals for the
protection of their crops.
As part of the agricultural intensification and commercialization process, concerns about the
potentially negative impact of pesticide use is often downplayed, while the benefits of
pesticide use in terms of improved crop returns ignore the indirect costs they also incur. This
has also led to a situation in which local farmers do not always use pesticides in an
appropriate way; they tend to overuse and misuse the chemicals, to avoid losses among their
high-value crops. Due to farmers’ limited awareness of and lack of protection against the
potential dangers inherent in chemical pesticide use, they still use pesticides which contain
cheap compounds such as the herbicides Paraquat and Glyphosate. The application of these
chemicals is restricted in a number of other countries, but these represent two of the three
most commonly used pesticides in the study area.
The survey described here sought to provide evidence that agricultural commercialization in
Thailand over recent years has led to a reduction in the variety of pest management practices
applied, and that many Thai farmers have become completely dependent on the use of
agrochemicals, expecting that this approach will fully prevent any losses in crop yields. In
this context, it can be observed that farmers have become locked into using chemical pest
control methods, creating a situation in which attempting to control one risk through the
increasingly heavy and exclusive use of pesticides, has led to a number of other, new risks
developing.
This research also reveals that market prices, pests and diseases have become the dominant
risks affecting farm performance within the Thai commercial farm sector, while among Thai
subsistence farmers the loss of family labor is of key concern. The farmers in the study area

Summary
III
have a variety of attitudes towards risk, and differences in expected rates of return influence
the types of risk protection tools used. The findings show that agricultural commercialization
is associated with a rapid adoption of synthetic pesticides and an exponential growth in the
quantity of pesticides applied per hectare. As the risk management strategies used by
commercial farmers are mostly aimed at crop protection, they use large quantities of synthetic
pesticides to manage crop pests and diseases. The present research also finds that the
effectiveness of pesticide use increases significantly as levels of commercialization increase.
Pesticide use is perceived as increasingly useful in this process, being considered an essential
factor for raising agricultural output and farm income. However, there is a need to pay more
attention to the potentially adverse effects of pesticide use on human health and the
environment and to improve producers’ level of understanding of the risks involved in
pesticide use, which will help them make better decisions regarding the risks and
consequences involved.
A number of studies have suggested that pesticide regulations in Thailand should be better
enforced, that consumer demand for certified products should be encouraged, and that
training on food safety should be offered to farmers. The Thai government has reacted to
these calls by introducing policies and projects aimed at the adoption of sustainable
agricultural practices; however, these policies have not been promoted effectively, and so
have not fixed the core problem. The Q-GAP program is a good example of this. This thesis
reveals that Thai upland farmers still do not understand the logic behind the program
introduced, and so lack any motivation to follow sustainable farming practices. This situation
is made worse by the lack of any effective program implementation and follow-up activities,
such as farm auditing. The Q-GAP program has been implemented with a strong focus on
farm auditing and residue testing, and little focus on the positive consequences of a reduction
in pesticide use levels. The program also does not provide farmers with suitable alternatives
to manage their pest problems. Certified farmers continue to almost entirely depend on
synthetic pest control. In principle, under the program farmers are encouraged to practice
integrated pest management (IPM) methods in order to achieve Q-GAP certification. But it
was found that a considerable number of farmers were not familiar with the term IPM and
have a limited understanding of the approach. IPM offers alternative pest management
methods to farmers and also takes into account traditional pest control methods, not just the
use of pesticides. Therefore it could have a positive role to play in helping to reduce pesticide
Summary
IV
use. However, in reality, the promotion of integrated pest management methods is not enough
in isolation. As this thesis shows by means of an ex-ante assessment of pesticide use
reduction strategies with the MPMAS simulation package, the use of a combination of
measures, such as the promotion of IPM through financial adoption incentives combined with
the introduction of a sizeable sales tax on pesticides, could lead to a very substantial
reduction in pesticide use – by up to 34% on current levels, without adversely effecting
general farm income levels. Thus, policymakers should promote alternative pesticide use
reduction strategies by combining pesticide taxation with the introduction of integrated pest
management methods, the application of a price premium on safe agricultural produce or the
introduction of subsidies for bio-pesticides.
Furthermore, there is a need to raise farmers' awareness about pesticide risks and to increase
investment in the diffusion of integrated pest management practices. Thai upland farmers
might be willing to introduce more sustainable agricultural methods if they were to fully
understand the consequences of pesticide use on their health and the environment, as well as
know more about the biology, behaviors and physiology of the pests themselves. Building
knowledge is critical in this regard. To achieve this, there needs to be more interaction
between researchers, extension workers and farmers, plus more policy options introduced to
support farmers in their transition to a more market-oriented production environment.
Zusammenfassung
V
Zusammenfassung
Wirtschaftliche Entwicklung, politischer Wandel, die Verfügbarkeit neuer Technologien und
ein rasantes Bevölkerungswachstum haben zur Intensivierung und Kommerzialisierung der
landwirtschaftlichen Produktion in Thailand beigetragen. Als Teil dieses Prozesses haben die
thailändischen Bergbauern ihre Anbaupraktiken angepasst um Produktion und Produktivität
zu steigern. Diese Forschungsarbeit zeigt eindeutig, dass ein positiver Zusammenhang
zwischen der Intensivierung der Landnutzung und dem Einsatz chemisch ausgerichteter
Schädlingsbekämpfungsmaßnahmen besteht. Kleinbauern in Thailand verlassen sich in
zunehmendem Masse auf synthetische Pflanzenschutzmittel.
Im Verlauf der landwirtschaftlichen Intensivierung und Kommerzialisierung werden
Bedenken über die negativen Auswirkungen des hohen Pestizideinsatzes oftmals
heruntergespielt, während bei der Bewertung des Nutzens für Ernteerträge die externen
Kosten vernachlässigt werden. Mitunter auf Grund dieser Situation verwenden die Bauern
vor Ort Pestizide auf unangemessene Weise. Übernutzung und fälschlicher Gebrauch sind
weit verbreitet um Ernteausfälle bei Kulturpflanzen von hohem Produktionswert zu
vermeiden. Die Bergbauern, welche die Pestizide regelmäßig einsetzen, steigern stetig die
ausgebrachten Mengen. Auf Grund des begrenzten Bewusstseins gegenüber und trotz des
Mangels an Schutz vor den potenziellen Gefahren der Pestizidnutzung, kommen billige
toxische Präparate, wie Paraquat und Glyphosat, häufig zum Einsatz. Wohingegen die
Anwendung dieser Chemikalien in anderen Ländern reglementiert und beschränkt ist,
gehören Sie im Untersuchungsgebiet zu den meist verwendeten Pestiziden.
Die für diese Arbeit durchgeführte Umfrage weist nach, dass die Kommerzialisierung der
Landwirtschaft in Thailand in den vergangenen Jahren die Vielfalt der verwendeten
Schädlingsbekämpfungsmaßnahmen verringert hat und dass viele Bauern in Thailand sich
ausschließlich auf den Einsatz von Agrochemikalien verlassen. Dies geschieht in der
Erwartung dadurch Ernteausfälle vollständig vermeiden zu können. In diesem
Zusammenhang, ist ein sogenannter „Lock-In-Effekt“ zu beobachten. Dabei entsteht eine
Situation, in der die eigentliche Kontrolle von Risiken durch verstärkten und heftigen
Pestizideinsatz eine Reihe anderer Risiken mit sich bringt.
Zusammenfassung
VI
Durch diese Forschungsarbeit tritt zutage, dass in der kommerziellen Landwirtschaft in
Nordthailand neben Marktpreisen, Schädlinge und Pflanzenkrankheiten zu den
bestimmenden Risikofaktoren für die Leistungsfähigkeit kleinbäuerlicher Betriebe gehören.
Für Subsistenzbauern spielt das Risiko Arbeitskräfte zu verlieren eine Schlüsselrolle. Die
Bauern, die Teil dieser Untersuchung sind, weisen eine Vielzahl an Einstellungen und
Schutzmechanismen gegenüber Risiken auf. Diese werden vom zu erwarteten jeweiligen
Betriebsergebnis beeinflusst. Anhand der Untersuchungsergebnisse wird ersichtlich, dass die
Kommerzialisierung der Landwirtschaft mit einer rasanten Übernahme synthetischer
Spritzmittel und einem exponentiellen Anstieg der pro Hektar ausgebrachten Pestizidmengen
einhergeht. Da Strategien des Risikomanagements der kommerziell orientierten Betriebe
hauptsächlich zur Vorsorge gegen Pflanzenschäden dienen, werden dort große Mengen von
Spritzmitteln eingesetzt. Die vorliegende Forschungsarbeit stellt fest, dass die Wirkung des
Pestizideinsatzes sich erhöht mit dem Grad an Kommerzialisierung. Im Verlauf der
Kommerzialisierung werden Spritzmittel von den befragten Bauern als zunehmend nützlich
und als unentbehrlicher Faktor für steigende Erträge und Einkommen betrachtet. Es ist jedoch
von Nöten, dass auch Gesundheits- und Umweltaspekte vermehrt berücksichtigt werden. Das
Verständnis der Produzenten bezüglich der Risiken, welche die Nutzung von Pestiziden mit
sich bringt, kann dabei helfen die mit der Nutzung verbundenen Risiken und Konsequenzen
auf ausgewogenere Weise zu betrachten.
Etliche Studien legen nahe, dass Vorschriften zu Pestiziden in Thailand besser durchgesetzt,
die Verbrauchernachfrage nach zertifizierten Erzeugnissen gestärkt und Schulungen für
Bauern zu Lebensmittelsicherheit und Handhabung von Pestiziden angeboten werden sollten.
Die thailändische Regierung hat auf diese Forderungen mit der Einführung politischer
Maßnahmen und mit gezielten Projekten zur Förderung nachhaltiger Anbaupraktiken
reagiert. Diese wurden jedoch nicht mit Nachdruck vorangetrieben und konnten bisher das
Kernproblem nicht beheben. Der von der Regierung eingeführte Q-GAP Standard ist ein
Beleg dafür. Diese Dissertation offenbart, dass den Bergbauern in Nordthailand die Logik der
Vielzahl an Programmen oftmals schwer verständlich ist. Dies wird durch die mangelnde
Effektivität der Umsetzung und des Monitorings, wie z.B. der Betriebsprüfung,
verschlimmert. Der Q-GAP Standard wurde mit einem Schwerpunkt auf Betriebsprüfung und
Rückstandsanalyse ins Leben gerufen, wobei die betriebliche Reduzierung des
Spritzmitteleinsatzes und die damit verbundenen positiven Effekte zu wenig Bedeutung
Zusammenfassung
VII
erhalten. Der Standard bietet den Landwirten keine geeigneten Alternativen zur
Schädlingsbekämpfung an. Zertifizierte Betriebe verlassen sich nach wie vor fast
ausschließlich auf synthetische Pflanzenschutzmittel. Im Prinzip werden Bauern dazu
ermutigt für die Erlangung der Zertifizierung integrierten Pflanzenschutz (IPM) zu
praktizieren. Aus der vorliegenden Untersuchung wurde jedoch ersichtlich, dass der Begriff
IPM und der damit verbundene Ansatz zur Schädlingsbekämpfung vielen mit dem Standard
versehenen Bauern unbekannt ist. Unter Berücksichtigung traditioneller und anderer
Pflanzenschutzmethoden bietet IPM den Bauern eine Vielzahl an
Schädlingsbekämpfungsalternativen zur ausschließlichen Pestizidnutzung und könnte somit
zur Reduzierung des Spritzmitteleinsatzes beitragen. Die Verfügbarkeit von IPM für
kleinbäuerliche Betriebe allein ist allerdings nicht ausreichend. Im Rahmen dieser
Forschungsarbeit wurde mit dem Agenten-basierten Simulationsmodell MPMAS eine
Evaluierung verschiedener Nachhaltigkeitsstrategien durchgeführt. Diese zeigt, inwiefern es
möglich ist durch ein Maßnahmenbündel aus Einführung von IPM Praktiken, Pestizidsteuer,
gestaffelt nach Toxizität, und finanziellen Anreizen zur Übernahme von IPM das Niveau des
Spritzmitteleinsatzes in der Landwirtschaft in Nordthailand erheblich zu senken. Gemäß den
Simulationsergebnissen kann eine Reduktion von bis zu 34% erreicht werden, ohne dass
dadurch das allgemeine Einkommensniveau der Agenten negativ beeinträchtigt wird.
Entscheidungsträger sollten eine nachhaltigere Landwirtschaft durch ein Bündel aus
Reduktionsmaßnahmen fördern.
Zudem besteht die Notwendigkeit das Bewusstsein der Bauern bezüglich der Risiken des
verstärkten Pestizideinsatzes zu schärfen und Investitionen in die Verbreitung von
integrierten Schädlingsbekämpfungsmethoden zu erhöhen. Es gilt das Wissen der Bauern
über die gesundheitlichen und ökologischen Konsequenzen des übermäßigen
Pestizideinsatzes auszubauen, ebenso wie deren Wissen über die Biologie und das Verhalten
von Schädlingen. Um dies zu erreichen, muss, neben den richtigen Impulsen aus der Politik,
welchen einen Übergang zur einer nachhaltigen marktorientierten Landwirtschaft erlauben,
das Zusammenspiel von Forschung, landwirtschaftlicher Beratung und kleinbäuerlichen
Betrieben erleichtert werden.

Acknowledgements
VIII
Acknowledgements
Foremost, I would like to express my sincere gratitude to Mrs. Edith-Karla Eiselen for her
continuous funding of my PhD studies. I appreciate her constant support, encouragement, her
caring, and her advice. Without her this thesis would not have been achievable.
My sincere thanks also go to my advisor Prof. Dr. Thomas Berger for the continuous support
of my Ph.D studies and research, for his patience, motivation, enthusiasm, and immense
knowledge. I could not have imagined having a better advisor and mentor for my Ph.D
studies.
Besides my advisor, I would like to express the deepest appreciation to Dr. Pepijn
Schreinemachers for his encouragement and insightful comments, for his guidance and
persistence help during all the time of my research, for offering me the internship opportunity
at the World Vegetable Center in Taiwan, which allowed me to experience the diverse and
exciting work under the Humidtropics project. Without him this thesis would not have been
completed.
Special thanks to Dr. Christian Grovermann who is my colleague, my friend and my husband
for personal support and scientific support during all the years. I am truly appreciative of all
that he has done for me.
Furthermore, I would like to thank the three assistants (Noi, Anyun and Peauk) for their great
help during the data collection process. I am pleased to thank all colleagues in Thailand and
Hohenheim for their friendship and expertise. I am grateful to the Collaborative Research
Centre SFB 564 “Research for Sustainable Land Use and Rural Development in Mountainous
Regions of Southeast Asia” that hosted my research and would like to also acknowledge the
Deutsche Forschungsgemeinschaft (DFG).
I also thank my father and my brother for their incessant encouragement, support and
attention. I am also grateful to all my friends who supported me through this venture. I am
also deeply thankful to my informants. Their names cannot be disclosed, but I want to
acknowledge and appreciate their help and transparency during my research. Their
information has helped me complete this thesis.
Table of contents
IX
Table of contents
Declaration ................................................................................................................................. I
Summary ................................................................................................................................... II
Zusammenfassung..................................................................................................................... V
Acknowledgements ............................................................................................................... VIII
Table of contents ...................................................................................................................... IX
List of abbreviations ............................................................................................................. XIII
1 General introduction .......................................................................................................... 1
1.1 The transformation of agriculture in the tropics and the case of the Thai uplands ..... 1
1.2 Agricultural commercialization and land use intensification ...................................... 2
1.3 Commercialization and risk ......................................................................................... 3
1.4 Positive and negative externalities of pesticide use ..................................................... 5
1.5 Facts about agricultural pesticide management in Thailand and beyond .................... 6
1.6 Alternatives to chemical pest management ................................................................. 7
1.7 Pesticide policies in Thailand ...................................................................................... 8
1.8 Pesticide use reduction policies ................................................................................. 10
1.9 Research objectives ................................................................................................... 11
1.10 Structure of the thesis ................................................................................................ 12
1.11 References .................................................................................................................. 13
2 Publication I ..................................................................................................................... 17
2.1 Abstract ...................................................................................................................... 18
2.2 Introduction ................................................................................................................ 19
2.3 Materials and methods ............................................................................................... 20
2.4 Results........................................................................................................................ 24
2.4.1 Land use change ................................................................................................. 24
2.4.2 Pests and pest management ................................................................................ 27
Table of contents
X
2.5 Discussion .................................................................................................................. 31
2.6 Conclusion ................................................................................................................. 33
2.7 Acknowledgments ..................................................................................................... 33
2.8 References .................................................................................................................. 33
3 Publication II .................................................................................................................... 36
3.1 Abstract ...................................................................................................................... 37
3.2 Introduction ................................................................................................................ 38
3.3 Material and methods ................................................................................................ 39
3.3.1 Data .................................................................................................................... 39
3.3.2 Quantifying commercialization ......................................................................... 40
3.3.3 Regression model ............................................................................................... 41
3.4 Results........................................................................................................................ 43
3.4.1 Commercialization ............................................................................................. 43
3.4.2 Perceptions and management of risk ................................................................. 44
3.4.3 Role of pesticides ............................................................................................... 47
3.5 Discussion .................................................................................................................. 50
3.6 Conclusion ................................................................................................................. 51
3.7 Acknowledgement ..................................................................................................... 52
3.8 References .................................................................................................................. 52
4 Publication III .................................................................................................................. 54
4.1 Abstract ...................................................................................................................... 55
4.2 Introduction ................................................................................................................ 56
4.3 Methods and data ....................................................................................................... 58
4.3.1 Combining qualitative with quantitative methods ............................................. 58
4.3.2 Study area........................................................................................................... 59
4.3.3 The development of GAP standards in Thailand ............................................... 60
4.3.4 Comparing the intensity of pesticide use between farmers ............................... 63
Table of contents
XI
4.3.5 Farm level constraints and incentives regarding GAP compliance ................... 65
4.4 Discussion and conclusion ......................................................................................... 68
4.5 Acknowledgments ..................................................................................................... 70
4.6 References .................................................................................................................. 71
5 Publication IV .................................................................................................................. 73
5.1 Abstract ...................................................................................................................... 74
5.2 Introduction ................................................................................................................ 75
5.3 Materials .................................................................................................................... 76
5.3.1 Study area and data collection ........................................................................... 76
5.3.2 Land use, pesticide use and farm characteristics ............................................... 78
5.3.3 Integrated pest management .............................................................................. 80
5.4 Methods ..................................................................................................................... 81
5.4.1 Mathematical Programming-based Multi-Agent Systems ................................. 81
5.4.2 Pesticide use decisions ....................................................................................... 83
5.4.3 IPM adoption ..................................................................................................... 86
5.4.4 Investment in IPM.............................................................................................. 87
5.4.5 Resource constraints .......................................................................................... 89
5.4.6 Pesticide use reduction strategies....................................................................... 89
5.5 Model verification and validation .............................................................................. 91
5.6 Results........................................................................................................................ 92
5.6.1 Introduction of a progressive tax ....................................................................... 92
5.6.2 IPM introduction and promotion ....................................................................... 93
5.7 Discussion .................................................................................................................. 96
5.8 Conclusion ................................................................................................................. 98
5.9 Acknowledgements .................................................................................................... 99
5.10 References .................................................................................................................. 99
6 Final discussion .............................................................................................................. 102

Table of contents
XII
6.1 Conceptual framework and approaches ................................................................... 102
6.2 Land use change and pest management methods .................................................... 104
6.3 Commercialization and risk management ............................................................... 105
6.4 Pesticide use reduction strategies ............................................................................ 107
6.5 Constraints on pesticide use reduction in the Thai highlands .................................. 109
6.6 Opportunities for sustainable farming within Thai highland agriculture ................ 111
6.7 References ................................................................................................................ 112
Abbreviations
XIII
List of abbreviations
ACFS National Bureau of Agricultural Commodity and Food Standards
ANOVA Analysis of variance
ASEAN Association of South East Asian Nations
DoA Department of Agriculture
DoAE Department of Agricultural Extension
EU European Union
GAP Good Agricultural Practices
IPM Integrated Pest Management
LTP Land Titling Program
MoAC Ministry of Agriculture and Cooperatives
MPMAS Mathematical Programming-based Multi-Agent Systems
MRL Maximum Residue Limit
OLS Ordinary least squares
OVF Organic vegetable farming
PCA Principle component analysis
PCD Pollution Control Department
PEA Pesticide Environmental Accounting
SPG Sor Por Gor (land without a title), is an allotment of land from the land
reformative committee and land may be used for agriculture only. It confers
the right to occupy only and be transferred only by inheritance, can’t be
bought or sold.
STG Sor Tor Gor (land without a title), is a land certificate issued by the Thailand
Forest Department only in the zone of national reserved forest. The holder of
this document has the right to reside and live on the land. This land can be
passed on heir by inheritance and is prohibited for sale.
UN United Nations
WHO The World Health Organization
General introduction
1
1 General introduction
1.1 The transformation of agriculture in the tropics and the case of the Thai uplands
Agricultural production in the tropics and subtropics is generally characterized by semi-
commercial smallholder farms. In the past, growth in agricultural output was measured in
terms of increases in the land area under cultivation, but more recently growth in terms of
output has mostly stemmed from increases in land use intensity (Upton, 1996). The adoption
of cash crops and associated farming technologies has boosted both agricultural production
and farm incomes, in turn contributing towards economic development and poverty reduction
in many low and lower-middle income countries. In the wake of the Green Revolution,
agricultural systems in many Asian countries have undergone steady commercialization
(Pingali and Rosegrant, 1995). As part of this, the high demand for agricultural products and
better access to input and output markets have both created incentives for farmers to change
their agricultural cultivation practices. Increased commercialization has shifted farm
households away from subsistence farming; moving them towards more intensive forms of
farming, those which entail growing high value fruit and vegetable crops, as well as staple
cash crops, on a larger scale based on the principles of profit maximization. Production
systems across Asia have been profoundly transformed by the increased availability and use
of new varieties, growth hormones, fertilizers, machinery and chemical pesticides.
Population growth has placed pressure on the land, and alongside increased levels of
accessibility, has pushed agricultural commercialization and intensification into highland
areas (Burgers et al., 2005). Highland farmers in the north of Thailand have, as a result,
started to focus more on commercially driven production methods aimed at producing higher
yields, while at the same time using less labor and less land. Most upland farmers’
agricultural activities in northern Thailand used to be associated with shifting cultivation
practices, with upland rice being the main crop grown and a variety of vegetables also grown
for home consumption. However, shifting cultivation methods led to soil erosion and were
considered to be unsustainable (Keen, 1978). In 1961, the Thai government designated most
of the nation’s forests, and especially those in the northern highlands, as protected areas
(Delang, 2002). As a result, the expansion of agricultural land in such areas was thereafter
restricted by the Royal Forestry Department, with traditional farming practices in particular
considered inappropriate (Delang, 2002; Forsyth and Walker, 2008). At that time, pioneer
General introduction
2
shifting cultivation largely stopped in the country (Rerkasem, 1998), and Thai farmers faced
a number of changes and challenges to their livelihoods. These challenges included land
scarcity and the pursuit of industrialization, for which a large number of workers were
required. As a result, in the 1980s and early 1990s many farmers moved off their farms in
pursuit of work in the industrial sector (Rigg, 1993, 1995). In 1997, however, many such
workers lost their jobs due to the Asian financial crisis, and at this time farmers returned
home and entered the farming sector again. With limited agricultural land available and yet
rising demand for agricultural products, farmers were motivated to modernize their
agricultural systems, causing the sector to move from a largely agrarian focus, to a more
industrialized approach, with agriculture becoming more profit-oriented at the same time
(Ecobichon, 2001). As a result, subsistence farming was no longer seen as able to meet the
needs of a growing population, or provide decent incomes for farm households. Since that
time, some farms have moved straight from subsistence farming into cash cropping, as driven
by the steady agricultural commercialization process (Vanwambeke et al., 2007; Zeller et al.,
2013).
1.2 Agricultural commercialization and land use intensification
There are different concepts in relation to what agricultural commercialization actually
means. Market access is one of the most obvious criteria used to measure commercialization,
while Jayne et al. (2011) refer to commercialization as the more intensive use of technologies
to increase productivity and output, and to create a greater surplus, that helps increase market
participation and enhances farmers' livelihoods. Mahaliyanaarachchi and Bandara (2006)
define commercialization as the amount of market surplus produced as a proportion of total
production. The higher the amount of surplus, the more commercially-oriented a farmer is.
The use of inputs has also been considered an indicator of commercialization in a number of
studies; for example, in 1995 Pingali and Rosegrant stated that “Agricultural
commercialization means more than the marketing of agricultural output; it means [that] the
product choice[s] and input use decisions are based on the principles of profit maximization”
Similarly, von Braun and Kennedy (1995) and Zeller et al. (2013) looked at agricultural
commercialization from an output and input perspective. This research is based on
quantitative data gathered in relation to both inputs and outputs, with inputs including
bought-in items such as seeds, fertilizers, hormones and labor, and with outputs being gross
farm outputs. For the purpose of classifying the level of market orientation, Farm household

General introduction
3
in the study area were divided into three: (i) subsistence, (ii) semi-commercial and (iii)
commercial systems. Whereas the objective of commercial farms is to maximize profits and
trade inputs, through the use of irrigation systems and chemical fertilizers, the opposite of
this, the objective of subsistence farming is to achieve food self-sufficiency based on
household generated inputs, using rain-fed land and farmyard manure.
The concept of land use intensification is defined in a different way to commercialization.
Netting (1993) described intensification as the greater utilization of a given area of land under
production, while Shriar (2000) described intensification as the process of enhancing land
productivity through the use of more inputs within a given area. Intensification can be
measured using any combination of the substitution of labor, capital or technology for land,
based on a constant land area used to acquire long-term production (Brookfield, 1993).
Dietrich (2012) meanwhile, defined land use intensification as the process used by humans to
increase land productivity through their interaction with agricultural activities, but without
the influence of environmental interactions. Land use intensification can be measured either
in terms of agricultural output or input use levels. Outputs can be measured in production
units or values, while inputs can be measure based on the amounts or values of input use. For
the purpose of this thesis, five variables were used to define land use intensification, these
being the value of crop outputs, the value of variable inputs used (e.g. fertilizers, seeds and
labor), the value of fixed costs, and the length of both fallow and irrigation periods. Hence,
land use intensification is measured in a different way to commercialization, as it is based not
only on inputs and outputs, but also takes into account factors influenced by human
interactions, such as the influence of increasing agricultural production.
1.3 Commercialization and risk
Risk can affect an individual’s welfare, and is associated with difficulty and loss (Zeller et al.,
2013). Agriculture is a unique sector, and is exposed to risk to a greater extent than many
other business sectors, with the sources of such risk being multi-faceted, including inter alia
production, marketing, financial, institutional and human risks. These risks are not
independent of each other and are all closely linked to farm outcomes (Akcaoz, 2012;
Girdžiūtė, 2012; Kahan, 2008). Farmers face a great number of risks, and their decisions
regarding these risks directly affect the performance of their farms, and so pose many
challenges. Many negative factors that influence farm outcomes cannot be predicted, such as

General introduction
4
variable weather conditions, low prices during the harvest season, and a loss of labor due to
accidents or unfavorable government policies (Aimin, 2010; Akcaoz, 2012). Each of these
risks can play an important role in farmers’ decision making processes, meaning they have to
find ways to deal with such risks in order to reduce uncertainty. However, farmers are able to
tolerate risk to different degrees, and some are willing themselves to take more risks than
others (Kahan, 2008). In the production process, there are several stages at which farmers
have to make decisions, but there is only one result: crop outputs. At the time when decisions
are made, outcomes are usually uncertain, so farmers have to make the best decisions they
can, based on their knowledge and experience. Even though there are some sources of risk in
farming which are beyond the control of any individual farmer, farmers still need to
understand the relevant risks they face and have the appropriate risk management skills
needed to better anticipate and cope with such problems, and so reduce the impact of any
negative consequences (Harwood et al., 1999). To sum up, risk and uncertainty are inherent
to agricultural production and affect farming systems in different ways. As farming systems
in developing countries transit from subsistence to market-oriented forms of production, so
the sources of risk to which farm households are exposed will also change (Kahan, 2008).
Within the commercialization process, agricultural input and output markets play a major
role. In particular, farmers benefit from improved access to credit, increasingly depend on
traded inputs and start participating more fully in output markets. Farmers are thus faced with
an array of new potential market and financial risks, such as those arising from the loans they
take out. At the same time, the intensification of crop cultivation activities and the
introduction of high-value crops augment these production risks. One source of risk which is
usually of great concern to farmers, as well as to consumers, is crop pests (Byrne et al., 1991;
Roitner-Schobesberger et al., 2008). Farmers' pest management approaches are determined
by how they evaluate the economic losses caused by pests and what management strategies
are available to them in order to mitigate such losses. Some farmers use traditional, cultural
methods to control this risk, while many farmers choose to spray pesticides curatively as well
as prophylactically, to increase the odds of a good harvest at the end of the cropping season.
A perceived high risk of pest infestation is often met with increased levels of pesticide use, if
such chemicals are available, but although the benefits of using pesticides are real, at the
same time they also cause a number of problems. Previous studies have shown that, based on
their limited level of knowledge, farmers tend to underestimate or fail to correctly assess the
General introduction
5
risks they face when using pesticides (Atreya, 2008; Lamers et al., 2013). For instance, rural
producers tend to neglect the health and environmental risks associated with the increased use
of synthetic pesticides (Liu and Huang, 2013; Obopile et al., 2008). Agricultural policies such
as crop insurance and input subsidies can help mitigate certain risks; however, effective
policymaking requires information to be available regarding the sources of risks faced by
farm households and the risk management methods available to them. Although
commercialization in Asia has been widely studied (Pingali and Rosegrant, 1995; Tipraqsa
and Schreinemachers, 2009), its overall relationship with risk perception and risk
management has been neglected.
1.4 Positive and negative externalities of pesticide use
Pesticides are applied to control pests such as weeds, insects and fungi, and so
correspondingly, the most common classes of pesticide used are herbicides, insecticides and
fungicides. Chemical pesticides are most widely used in the agricultural sector to prevent
damage to crops and so enhance crop yields. Early broad-spectrum pesticides had a toxic
effect on most organisms, and required the application of large amounts of active ingredients,
while more recent pesticide types are more specific and theoretically require smaller amounts
to be applied. Pesticides are used worldwide to manage agricultural pests, and the benefits of
such pesticides are real and important to farmers. Studying the benefits of pesticides to
mankind and the environment, Cooper and Dobson (2007) explained the positive outcomes of
pesticide use in terms of their primary and secondary benefits. The primary benefits of
pesticides are a direct consequence of their use; controlling pests and plant diseases,
controlling human and animal diseases, and controlling organisms that harm other human
activities and structures. The secondary benefits of using pesticides are less obvious but
manifest themselves at a later stage. First, there are benefits to communities that can be
measured in terms of food security, children's education and an improved quality of life
among farmers. Secondly, national benefits are derived from export revenues and reductions
in urban migration. Lastly, global benefits can be estimated through the diversity of crop
species which contribute to the world's food supplies, as well as prevention of the spread of a
range of transboundary diseases.
Even though farmers and societies as a whole obtain considerable of benefits from chemical
pesticides, undesired and unintended consequences also frequently occur, those which go far
General introduction
6
beyond the main purpose and site of pesticide application. Pesticide use is widely seen to
harm ecosystems and human health, and especially the health of farmers. The negative and
external effects of pesticide use have been recorded in a number of studies. For example,
pesticides have been found to contaminate water bodies and soils, disturb natural pest control
and poison animals, before finally being transferred to humans through residues accumulated
in the food chain (Thapinta and Hudak, 2000; Van Hoi et al., 2009). One study conducted
Mae Sa watershed, Thailand, found that the concentration of pesticides in surface water
exceeded toxicity criteria for both aquatic vertebrate and invertebrates (Ciglasch, 2006).
During the pesticide application process, farmers often experience the direct, negative health
impacts of pesticides, which include headaches, dizziness, fainting, numb fingers, a loss of
appetite and skin problems (Van Der Hoek et al., 1998). Consumers are also exposed to the
negative effects of pesticide use when they consume polluted fruit and vegetables.
1.5 Facts about agricultural pesticide management in Thailand and beyond
Pesticides have become an important agricultural input in Thailand as a whole (Thapinta and
Hudak, 2000); for example, from 2000 to 2009, Thailand increased its pesticide use by 9.1%
per hectare. In the highlands of northern Thailand, farmers have gradually come to rely more
on pesticide use than on traditional pest control methods to manage pest risks
(Schreinemachers et al., 2011). As the importance of cash crops has increased, so farmers in
northern Thailand have adapted their agricultural practices by using more industrially
produced inputs. Rice is no longer the main crop grown in the area (Vanwambeke et al.,
2007); the commercial production of high-value crops such as vegetables, soybeans and fruit
has instead become widespread (Rerkasem, 1998). Farmers growing high-value crops in
particular, often carry high risks and so spray pesticides indiscriminately. At the same time,
such farmers often do not have to hand information and data on the exact effects of pesticide
use on the environment and human health. Often, they also do not have enough knowledge on
how to handle pesticides properly (Snelder et al., 2008). Similar problems exist in other
countries. A study in Nepal found that most farmers accept that pesticides are harmful to
human health, livestock and plant diversity, nevertheless only a small number of farmers
wear protective clothing, gloves or mouthpieces (Atreya, 2007). Meanwhile, a study in Sri
Lanka found that although farmers are aware of the health risks posed by pesticide use, they
do not read the usage instructions, as to do so is not convenient (Van Der Hoek et al., 1998).
It has been shown that farmers exposed to high levels of health risk from the use of
General introduction
7
pesticides, increasingly heavy pesticide use is related to their limited awareness of the
adverse impacts of such pesticides on their health (Praneetvatakul et al., 2013). In general, the
heavy use of pesticides reduces an ecosystem’s natural capacity to control pests, and leads to
the development of pesticide resistance, secondary pest outbreaks and eventually pest
resurgence (Liu and Huang, 2013; Pimentel et al., 1993; Wilson and Tisdell, 2001). Studying
pesticide distribution and use in the Red River Delta in Vietnam, Van Hoi et al. (2009) found
that most farmers use pesticides excessively; 75% apply higher amounts than are
recommended. However, it was also found that crop losses in the area have not declined in
line with this increase in pesticide use. Adopting a total system approach to sustainable pest
management, Lewis et al. (1997) also showed that global crop losses due to pests grew from
34.9% in 1965 to 42.1% over the period 1988 to 1990, despite the intensification of chemical
pest control. In fact, a general resistance to pesticide use has been an important, global pest
management problem over the last four decades.
1.6 Alternatives to chemical pest management
Current agricultural practices focused on high value crops, improved varieties and mono-
cropping have increased the need for pesticides to be used, and the steady expansion of
agricultural land has brought with it heavy applications of fertilizers and pesticides (Thapinta
and Hudak, 2000). The use of traditional pest management techniques can be seen as an
alternative to pesticide application for controlling pests, and such techniques also help
regenerate and sustain the health of farmland, which will be particularly important as the
global demand for food continues to rise (Rai, 2011). Traditional pest management involves
several farm activities, such as soil management, the timing of planting and harvesting,
intercropping, mechanical control, the use of repellents and traps, site selection, slash and
burn activities, and natural crop resistance. Traditional farming methods have the potential to
control pests effectively, and their use should be considered as a part of modern Integrated
Pest Management (IPM) activities (Morales, 2002; Zehrer, 1986). As a technique used for
pest control based on predicted economic, ecological and sociological consequences, those
related to biological knowledge and principles. IPM is not a new concept. IPM combines the
appropriate selection of pest control actions based upon dynamic principles, and helps
identify the most threatening pest economically (Bottrell, 1979; DeMoranville et al., 1996;
Sandler, 2010; Tweedy, 1976). The basic IPM process involves the use of education,
monitoring and appropriate decision making. Farmers first learn about IPM concepts,
General introduction
8
including the techniques used to monitor pests and choose the right management options,
before continuing on to the practical processes involved (DeMoranville et al., 1996; Sandler,
2010). However, limited knowledge is a major constraint on the use of effective and
sustainable pest management activities. Studying agricultural transformation in Nepal, Rai et
al. (2011) analysed a sample of 100 farm households, many of which lacked ecological
knowledge. While some farmers said they did not classify insects as pests if they did not
cause economic damage, other farmers considered all insects to be pests. Farmers in many
developing countries grow-up learning about traditional cultivation systems; however, this
situation is changing rapidly, as their knowledge tries to catch-up with the new, commercial
realities they face. Even pest management professionals have been used to improve pest
control practices, but many barriers to effective practice exist; for example, ecological theory
and pest management practices have not been integrated, there is a lack of coordination
between social and biological scientists, and also not enough effort is made to work with
farmers on an equitable basis and improve the transfer of knowledge from researchers to
farmers (Morales, 2002).
1.7 Pesticide policies in Thailand
Pesticides are now widely used in Thailand, and according to the Thai Ministry of
Agriculture and Cooperatives, sales of pesticides such as insecticides, fungicides and
herbicides are worth around €220 million per year. The largest players in the Thai pesticides
market include Bayer, Monsanto, Syngenta and Dow (Bartlett and Bijlmakers, 2003). The use
of chemical pesticides in Thailand started in the early 1950s, when most pesticides were
imported. In 1967, a policy of free pesticide distribution was introduced to deal with major
pest outbreaks. Due to the indirect subsidies provided, pesticide prices, when compared to
other agricultural inputs, have tended to stay low over the last 50 years in Thailand. Before
1991, the tax rate for pesticides was set at 6.9%, as compared to 32.4% for fertilizers and
27.6% for agricultural machinery (Waibel, 1990). In the 1990s, there were 298 active
ingredients registered in Thailand with a wide range of product names, and the trend since
then has been for this number to keep on increasing (Jungbluth, 1996). At the same time,
many illegal pesticide products have circulated in the Thai market (Grandstaff, 1992). In
1991, the Thai government completely eliminated import taxes on pesticides, if they were to
be used only for agricultural purposes (Jungbluth, 1996). In 1992, it was revealed that more
than 60% of imported pesticides belonged to the classes “extremely“ and “highly hazardous“,

General introduction
9
according to the standard WHO classification (Sinhaseni, 1994). Over the period 1976 to
1995, the quantity of insecticide imports increased from 5,960 tons to 10,560 tons at an
average annual growth rate of 2.9%, while herbicide imports increased from 2,293 tons to
19,954 tons at an average annual growth rate of 11.4%, and fungicide imports increased from
1,299 tons to 6,937 tons at an annual average growth rate of 8.7% (Jungbluth, 1996). A recent
study by Praneetvatakul et al. (2013) for the period 1997 to 2010 used the Pesticide
Environmental Accounting (PEA) tool to estimate the external cost of pesticide use in
agriculture, and showed that 83% of farm workers suffer external impacts from pesticide use,
while the same figure for consumers is around 11%. The study also found, for the years
2006/7, that 15% of the fruit and vegetable products examined exceeded the maximum
allowable pesticide residue levels, representing a total pesticide use cost of USD 228.13
million – taking into account the health, research and Q-GAP program costs incurred from
such use.
However, some studies have revealed that Thailand took seriously sustainable agricultural
development policies in the early 1990s, those based on the sufficiency economy concept. At
this time, many policies were introduced aimed at crop diversification, a reduction in
chemical fertilizer and pesticide use, and the promotion of organic farming and healthy food
(Kasem and Thapa, 2012). In 2010, the Thai government spent about USD 15.77 million on
controlling a brown plant hopper outbreak, one that led to insecticide misuse, and it also
spent USD 38.85 million on pesticide research and another USD 0.48 million on research and
development for pesticide inputs. Another USD 60.34 million is budgeted for the public GAP
program, the aim of which is to prevent pesticide residues from appearing on food.
Furthermore, the National Bureau of Agricultural Commodity and Food Standards also has
also set-aside USD 5.89 million for setting-up and monitoring food safety standards
(Praneetvatakul et al., 2013). Even though a number of policies have been implemented in
order to support sustainable agriculture, the results have not been impressive (Kasem and
Thapa, 2012). In fact, official policies play an important role in supporting the pesticide
industry in Thailand, meaning that the chances of achieving sustainable agriculture will
remain rather slim unless major changes in government policy take place.
General introduction
10
1.8 Pesticide use reduction policies
At present in Thailand, pesticide use is widely considered necessary to improve crop
productivity (Madhaiyan et al., 2006). The use of pesticides has been shown to be effective at
controlling pests, avoiding crop damage and increasing agricultural output (Ecobichon,
2001), as well as directly and positively affecting farm revenues and household welfare
(Cooper and Dobson, 2007). However, and as described above, the use of pesticides does not
only influence agricultural production, but also has an adverse impact on ecosystems and the
safety and quality of water sources, threatening human health (Margni et al., 2002). In
response to these problems, pesticide monitoring programs have been implemented in
Thailand by both the Pollution Control Department (PCD) and Department of Agriculture
(DOA), though these two programs have different objectives. The PCD’s objective is to
measure the contamination and health impacts caused by pesticide use, while the DOA is
focused on agricultural research projects (Thapinta and Hudak, 2000). To improve food
safety, the good agricultural practice (GAP) initiative was first introduced in Thailand in
1988, and this was then followed by the Organic Agriculture Certification Thailand scheme.
The general idea of the GAP programs is to support small-scale farmers by ensuring food
safety, creating market channels, improving working conditions, improving production
efficiency, ensuring safer production practices are introduced, reducing poverty among
farmer and protecting the environment around farms. Since 2004, the Q-GAP program has
expanded rapidly in Thailand, providing free extension and inspection services in support of
GAP certification. This scheme is focused on ensuring food safety at the local, domestic and
export market levels (Amekawa, 2013). In 2005, attainment of the Global GAP standard
became mandatory for those companies trading with countries in the European Union (EU)
(Holzapfel and Wollni, 2014). To obtain Global GAP certification, farmers are required to
adjust their farm management and production practices, this requires significant investment in
farm infrastructure and equipment, such as sanitary facilities and appropriate pesticide
storage (Asfaw et al., 2009; Holzapfel and Wollni, 2014; Mausch et al., 2009). However,
small-scale farmers in developing countries are often not familiar with practices such as IPM,
traceability and record-keeping, all of which are required by the Global GAP standards, and
the information provided by Thai extension services regarding these standards is limited
(Humphrey, 2008). A study into the sustainability of Global GAP certification among small-
scale farmers by Holzapfel and Wollni (2014) found that Global GAP certification might not

General introduction
11
be a feasible option for small-scale farmers in developing countries, and that the
implementation of good agricultural practices focused on the domestic market are likely to be
more achievable and sustainable.
Although GAP was first introduced into Thailand over 20 years ago, chemical pesticides –
including herbicides, insecticides and fungicides – continue to play a prominent role in
relation to pest management within the Thai agriculture sector. The public GAP standard has
been shown not to act as a catalyst for the introduction of alternative pest control practices,
and has not contributed significantly to any reduction in agricultural pesticide use in northern
Thailand. Therefore it can be useful to understand the reasons why public GAP standards do
not contribute to reducing agricultural pesticide use as well as to better understand how the
workings of the public GAP certification process in Thailand.
1.9 Research objectives
The first objective of this thesis is to analyze the pest management activities that take place
within the Thai smallholder agriculture sector – which is undergoing a rapid process of land
use intensification – in order to understand the constraints farmers face and identify policy
approaches that may be taken to achieve a more sustainable pest management framework in
the country. More specifically, this thesis studies the relationship between land use
intensification and the number of pest problems perceived by farmers, the intensity of such
pest problems, the pest management methods used and the health problems associated with
pesticide use. The second objective is to improve the level of understanding on how risk
perceptions and risk management strategies have changed as part of the agricultural
commercialization process. To explore the relationship between commercialization, risk
perception and risk management more closely, the analysis in this study focuses on a
particular risk: pest infestations and their management through the use of pesticides. The third
objective is to examine the public GAP certification process in Thailand, and especially its
impact on pesticide use. The fourth objective is to ex-ante assess with the agent-based
simulation model MPMAS what impact possible pesticide use reduction policies in Thailand,
such as pesticide taxes, the promotion of integrated pest management (IPM), premium prices
for safe products and the provision of subsidies for bio-pesticides, could have on levels of
pesticide use and farm agent incomes.
The above four main objectives can be classified into the following six activities:
General introduction
12
i) To describe and analyze how the agricultural system in the mountainous areas of
northern Thailand has moved from one based on shifting agriculture to a more
intensive cultivation form aimed at profit maximization, and which relies on
pesticide use and a decrease in the use of integrated pest control methods.
ii) To analyse the number of pest problems and any increases in pest intensities as
farmers have come to increasingly rely on synthetic pesticides. This will include a
description of any non-anticipated problems such as pesticide resistance and
health problems that may have arisen.
iii) To investigate how agricultural commercialization has exposed farmers to
relatively greater levels of production risk, leading them to resort to the use of
synthetic pesticides to control these risks.
iv) To identify farmers’ perceptions of the risks they face, and the risk management
strategies they use at different levels of commercialization.
v) To assess whether fruit and vegetable farmers who follow the public GAP
standard use less pesticides than those farmers who do not follow the standard.
vi) To evaluate alternative pesticide use reduction strategies in terms of economic and
environmental effects. .
1.10 Structure of the thesis
This thesis consists of six chapters. Chapters 2 and 4 contain articles which have already been
published – in the ‘Journal of Environmental Science and Policy’, and ‘Agriculture and
Human Values’ respectively. Chapter 3 has been submitted to Asian Journal of Agriculture
and Development, while Chapter 5 has been submitted for publication in Ecological
Economics. Chapter 2 describes how pest and plant disease management methods used by
smallholder farmers in the highlands of northern Thailand have changed as part of the land
use intensification process. It also assesses for which crops pesticide use is particularly high,
and also the health problems experienced by farmers in relation to pesticide use. Chapter 3
describes how perceptions related to pest risks and risk management strategies have changed
as part of the agricultural commercialization process, as well as the relationship between
commercialization, the quantities of pesticides used and the ways in which commercialization
have taken place, that is, based on moving from subsistence crops to perennial crops, or to
seasonal crops. Chapter 4 presents the results of the study’s analysis of how public GAP
standards have performed in practice in Thailand, how farm audits have been implemented as
General introduction
13
part of the program, and also the level of understanding that exists among farmers regarding
the program. Chapter 5 assesses the impacts of policies aimed at encouraging alternative
pesticide use reduction strategies, including the application of pesticide taxes, the
introduction of integrated pest management activities, the use of price premiums on safe
agricultural produce, and the provision of subsidies for the use of bio-pesticides. Chapter 6
discusses the implications of the studies’ finding in terms of commercialization, land-use
patterns and agricultural practices, as well as crop choices, perceptions related to pests and
pesticide use, and the constraints on reducing pesticide use in the highland areas of northern
Thailand. It also highlights the opportunities available for introducing sustainable farming
practices into such areas, and offers directions for future research.
1.11 References
Aimin, H., 2010. Uncertainty, Risk Aversion and Risk Management in Agriculture.
Agriculture and Agricultural Science Procedia 1, 152-156.
Akcaoz, H., 2012. Risk Management in Agricultural Production: Case Studies from Turkey.
Academy Publish, Wyoming, U.S.A.
Amekawa, Y., 2013. Can a public GAP approach ensure safety and fairness? A comparative
study of Q-GAP in Thailand. The Journal of Peasant Studies 40, 189-217.
Asfaw, S., Mithöfer, D., Waibel, H., 2009. Investment in compliance with GlobalGAP
standards: Does it pay off for small-scale producers in Kenya? Quarterly Journal of
International Agriculture 48, 337-362.
Atreya, K., 2007. Pesticide use knowledge and practices: A gender differences in Nepal.
Environmental Research 104, 305-311.
Atreya, K., 2008. Health costs from short-term exposure to pesticides in Nepal. Social
Science & Medicine 67, 511-519.
Bartlett, A., Bijlmakers, H., 2003. Did you take your poison today? IPM Danida Project,
Department of Agriculture: Bangkok.
Bottrell, D.R., 1979. Integrated pest management. Integrated pest management.
Brookfield, H.C., 1993. Notes on the theory of land management. PLEC News and Views 1,
28-32.
Burgers, P., Ketterings, Q.M., Garrity, D.P., 2005. Fallow management strategies and issues
in Southeast Asia. Agriculture, Ecosystems & Environment 110, 1-13.
Byrne, P.J., Gempesaw, C.M., Toensmeyer, U.C., 1991. An evaluation of consumer pesticide
residue concerns and risk information sources. SOUTH. J. AGRIC. ECON. 23, 167-
174.
Ciglasch, H., 2006. Insecticide dynamics in the soil environment of a tropical lychee
plantation - A case study from Northern Thailand.
Cooper, J., Dobson, H., 2007. The benefits of pesticides to mankind and the environment.
Crop Protection 26, 1337-1348.
Delang, C.O., 2002. Deforestation in Northern Thailand: the result of Hmong farming
practices or Thai development strategies. Society and Natural Resources 15, 483–501.
DeMoranville, C.J., Sandler, H.A., Bicki, T., 1996. Integrated Pest Management.

General introduction
14
Dietrich, J.P., Schmitz, C., Müller, C., Fader, M., Lotze-Campen, H., Popp, A., 2012.
Measuring agricultural land-use intensity – A global analysis using a model-assisted
approach. Ecological Modelling 232, 109-118.
Ecobichon, D.J., 2001. Pesticide use in developing countries. Toxicology 160, 27-33.
Forsyth, T., Walker, A., 2008. Forest Guardians, Forest Destroyers: The Politics of
Environmental Knowledge in Northern Thailand. University of Washington Press.
Girdžiūtė, L., 2012. Risks in Agriculture and Opportunities of their Integrated Evaluation.
Procedia - Social and Behavioral Sciences 62, 783-790.
Grandstaff, S., 1992. Pesticide policy in Thailand. Thailand Development Research Institute,
Bangkok.
Harwood, J.L., Heifner, R., Coble, K., Perry, J., Somwaru, A., 1999. Managing risk in
farming: concepts, research, and analysis. US Department of Agriculture, Economic
Research Service.
Holzapfel, S., Wollni, M., 2014. Is GlobalGAP certification of small-Scale farmers
sustainable? Evidence from Thailand. Journal of Development Studies 50, 731-747.
Humphrey, J., 2008. Private standards, small farmers and donor policy: EUREPGAP in
Kenya.
Jayne, T.S., Haggblade, S., Minot, N., Rashid., S., 2011. Agricultural Commercialization,
Rural Transformation and Poverty Reduction: What have We Learned about How to
Achieve This? Synthesis Report.
Jungbluth, F., 1996. Crop protection policy in Thailand: economic and political factors
influencing pesticide use. Pesticide Policy Project Hannover.
Kahan, D., 2008. Managing risk in farming. Food and agriculture organization of the united
nations.
Kasem, S., Thapa, G.B., 2012. Sustainable development policies and achievements in the
context of the agriculture sector in Thailand. Sustainable Development 20, 98-114.
Keen, F.G.B., 1978. Ecological relationships in a Hmong (Meo) economy. Farmers in the
Forest, 210-221.
Lamers, M., Schreinemachers, P., Ingwersen, J., Sangchan, W., Grovermann, C., Berger, T.,
2013. Agricultural Pesticide Use in Mountainous Areas of Thailand and Vietnam:
Towards Reducing Exposure and Rationalizing Use, Sustainable Land Use and Rural
Development in Southeast Asia: Innovations and Policies for Mountainous Areas.
Springer, pp. 149-173.
Lewis, W.J., van Lenteren, J.C., Phatak, S.C., Tumlinson, J.H., 1997. A total system
approach to sustainable pest management. Proceedings of the National Academy of
Sciences 94, 12243-12248.
Liu, E.M., Huang, J., 2013. Risk preferences and pesticide use by cotton farmers in China.
Journal of Development Economics 103, 202-215.
Madhaiyan, M., Poonguzhali, S., Hari, K., Saravanan, V.S., Sa, T., 2006. Influence of
pesticides on the growth rate and plant-growth promoting traits of Gluconacetobacter
diazotrophicus. Pesticide Biochemistry and Physiology 84, 143-154.
Mahaliyanaarachchi, R.P., Bandara, R., 2006. Commercialization of agriculture and role of
agricultural extension. Sabaragamuwa University Journal 6, 13-22.
Margni, M., Rossier, D., Crettaz, P., Jolliet, O., 2002. Life cycle impact assessment of
pesticides on human health and ecosystems. Agriculture, Ecosystems & Environment
93, 379-392.
Mausch, K., Mithöfer, D., Asfaw, S., Waibel, H., 2009. Export vegetable production in
Kenya under the EurepGAP standard: Is large more beautiful than small? Journal of
Food Distribution Research 40, 115-129.

General introduction
15
Morales, H., 2002. Pest Management in Traditional Tropical Agroecosystems: Lessons for
Pest Prevention Research and Extension. Integrated Pest Management Reviews 7,
145-163.
Netting, R.M., 1993. Smallholders, householders: farm families and the ecology of intensive,
sustainable agriculture. Stanford University Press.
Obopile, M., Munthali, D.C., Matilo, B., 2008. Farmers’ knowledge, perceptions and
management of vegetable pests and diseases in Botswana. Crop Protection 27, 1220-
1224.
Pimentel, D., McLaughlin, L., Zepp, A., Lakitan, B., Kraus, T., Kleinman, P., Vancini, F.,
Roach, W.J., Graap, E., Keeton, W.S., Selig, G., 1993. Environmental and economic
effects of reducing pesticide use in agriculture. Agriculture, Ecosystems &
Environment 46, 273-288.
Pingali, P.L., Rosegrant, M.W., 1995. Agricultural commercialization and diversification:
processes and policies. Food Policy 20, 171-185.
Praneetvatakul, S., Schreinemachers, P., Pananurak, P., Tipraqsa, P., 2013. Pesticides,
external costs and policy options for Thai agriculture. Environmental Science &
Policy 27, 103-113.
Rai, M.R., Timothy G. & Pandey, Shivaji. & Collette, Linda. & Food and Agriculture
Organization of the United Nations, 2011. Save and grow: a policymaker's guide to
sustainable intensification of smallholder crop production / [final technical editing,
Mangala Rai, Timothy Reeves and Shivaji Pandey; lead authors: Linda Collette ... [et
al.] Food and Agriculture Organization of the United Nations, Rome.
Rerkasem, K., 1998. Shifting Cultivation in Thailand: Land Use Changes in the Context of
National Development. ACIAR Proceedings 87, 54-63.
Rigg, J., 1993. Forests and farmers, land and livelihoods, changing resource realities in
Thailand. Global Ecology and Biogeography Letters, 277-289.
Rigg, J., 1995. 'In the fields there is dust': Thailand's water crisis. Geography, 23-32.
Riwthong, S., Schreinemachers, P., Grovermann, C., Berger, T., 2015. Land use
intensification, commercialization and changes in pest management of smallholder
upland agriculture in Thailand. Environmental Science & Policy 45, 11-19.
Roitner-Schobesberger, B., Darnhofer, I., Somsook, S., Vogl, C.R., 2008. Consumer
perceptions of organic foods in Bangkok, Thailand. Food Policy 33, 112-121.
Sandler, H.A., 2010. Integrated Pest Management.
Schreinemachers, P., Sringarm, S., Sirijinda, A., 2011. The role of synthetic pesticides in the
intensification of highland agriculture in Thailand. Crop Protection 30, 1430-1437.
Shriar, A.J., 2000. Agricultural intensity and its measurement in frontier regions.
Agroforestry Systems 49, 301-318.
Sinhaseni, P., 1994. Toxicological concepts, regulatory provision and appropriate technology
for pesticide safe use: an experience in Thailand. Bangkok: Pesticide Safe Use Unit,
Faculty of Pharmaceutical Sciences, Chulalongkorn University, Thailand.
Snelder, D.J., Masipiqueña, M.D., de Snoo, G.R., 2008. Risk assessment of pesticide usage
by smallholder farmers in the Cagayan Valley (Philippines). Crop Protection 27, 747-
762.
Thapinta, A., Hudak, P.F., 2000. Pesticide Use and Residual Occurrence in Thailand.
Environmental Monitoring and Assessment 60, 103-114.
Tipraqsa, P., Schreinemachers, P., 2009. Agricultural commercialization of Karen Hill tribes
in northern Thailand. Agricultural Economics 40, 43-53.
Tweedy, B.G., 1976. Integrated pest management. Environmental Health Perspectives 14,
165.
General introduction
16
Upton, M., 1996. The economics of tropical farming systems. Cambridge University Press.
Van Der Hoek, W., Konradsen, F., Athukorala, K., Wanigadewa, T., 1998. Pesticide
poisoning: A major health problem in Sri Lanka. Social Science & Medicine 46, 495-
504.
Van Hoi, P., Mol, A.P.J., Oosterveer, P., van den Brink, P.J., 2009. Pesticide distribution and
use in vegetable production in the Red River Delta of Vietnam. Renewable
Agriculture and Food Systems 24, 174-185.
Vanwambeke, S.O., Somboon, P., Lambin, E.F., 2007. Rural transformation and land use
change in northern Thailand. Journal of Land Use Science 2, 1-29.
von Braun, J., 1995. Agricultural commercialization: impacts on income and nutrition and
implications for policy. Food Policy 20, 187-202.
Waibel, H., 1990. Pesticide subsidies and the diffusion of IPM in rice in Southeast Asia: the
case of Thailand. Plant Protection Bulletin, FAO 38, 105-111.
Wilson, C., Tisdell, C., 2001. Why farmers continue to use pesticides despite environmental,
health and sustainability costs. Ecological Economics 39, 449-462.
Zehrer, W., 1986. Traditional agriculture and integrated pest management. ILEIA (Low
External Input for Sustainable Agriculture) Newsl 6, 4-6.
Zeller, M., Ufer, S., Van, D.T.T., Nielsen, T., Schreinemachers, P., Tipraqsa, P., Berger, T.,
Saint-Macary, C., Keil, A., Dung, P.T.M., 2013. Policies for sustainable development:
the commercialization of smallholder agriculture, Sustainable Land Use and Rural
Development in Southeast Asia: Innovations and Policies for Mountainous Areas.
Springer, pp. 463-490.
Publication I: Land use intensification
17
2 Publication I
Land use intensification, commercialization and changes in pest
management of smallholder upland agriculture in Thailand1
Suthathip Riwthong a, Pepijn Schreinemachers b, Christian Grovermann a, Thomas Berger a.
a Dept. of Land Use Economics in the Tropics and Subtropics (490d), Universität
Hohenheim, 70593 Stuttgart, Germany
b AVRDC – The World Vegetable Center, P.O. Box 42, Shanhua, Tainan, 74199 Taiwan
1 Paper has been published with Journal of Environmental Science and Policy, 2015, Vol. 45(0),
Pages 11-19. DOI: http://dx.doi.org/10.1016/j.envsci.2014.09.003
Publication I: Land use intensification
18
2.1 Abstract
Agricultural development in lower-income countries and resulting increases in agricultural
productivity are generally accompanied by a shift from extensive to more intensive types of
land use. The objective of this paper is to analyze how pest and plant disease management
among smallholder farmers has changed along with the process of land use intensification,
the aim being to identify constraints as well as possible approaches to the use of more
sustainable pest and plant disease control practices. Using survey data from 240 smallholder
farms located in the upland areas of northern Thailand, we show that land use intensification
is accompanied by a reduction in the use of traditional methods of pest management and an
increase in the use of synthetic pesticides. While farms with a low level of land use intensity
sprayed on average twice a year and used a total of 1.4 kg of active ingredients per ha, farms
with a high level of land use intensity sprayed on average 16 times per year and used 22.0
kg/ha. They also used a greater number of different products and tended to mix them
together. The intensity of pesticide use was particularly high for cash crops such as tomatoes,
chilies and strawberries. Many farmers experienced health problems related to pesticide use
because pesticides were not correctly handled. Greater investment is needed in the
development of integrated pest management in the long-term, and health problems may be
reduced in the short-term by raising awareness among farmers regarding the risks they are
exposing themselves to, as well as by promoting good agricultural practices.
Keywords: Agricultural development, developing countries, Thailand, pesticide, pesticide risk

Publication I: Land use intensification
19
2.2 Introduction
Agricultural development in lower-income countries generally implies an increase in
agricultural productivity, associated with a shift from extensive to more intensive land use
methods (Nesheim et al., 2014). This form of development is normally associated with
shorter fallow periods, a simplification of agro-ecosystems, the use of irrigation, and the
adoption of external inputs such as synthetic pesticides, fertilizers, improved crop varieties
and farm equipment (Ecobichon, 2001; Grovermann et al., 2013; Pandey, 2006; Pingali,
2001). Whereas higher-income countries have generally experienced a gradual land use
intensification process, farmers in many lower-income countries have seen very rapid
changes taking place in their farming systems. This fast pace of change has often led to
dramatic improvements in farmer livelihoods, but has also created frictions as knowledge
systems and institutions – including policies, take longer to catch up with the new reality of
farming (Rai, 2011; Van Hoi et al., 2009).
One such area of friction relates to a rapid increase in the use of synthetic pesticides in
developing countries (Ecobichon, 2001; Lewis et al., 1997); for example, Argentina, Brazil,
Cameroon, China, Malaysia, Mexico, Nicaragua, Pakistan, Thailand and Uruguay have
recently experienced an average annual growth in their pesticide use per hectare of 9 percent
or more (Jin et al., 2010; Schreinemachers and Tipraqsa, 2012). Frequent reports of pesticide
misuse in these and other developing countries are associated with the fact that farmers and
consumers are still largely unaware of the risks they and their family members are exposed
to, and also the absence of an enforceable legal framework to address the problems
experienced (Panuwet et al., 2012; Xu et al., 2008).
The objective of this paper is to analyze pest management activities within Thai smallholder
agriculture which is undergoing a rapid process of land use intensification, in order to
understand the constraints farmers face and to identify policy approaches that may be taken to
achieve a more sustainable pest management. More specifically, we study the relationship
between land use intensification and the number of pest problems perceived by farmers, the
intensity of such pest problems, the pest management methods used and the health problems
associated with pesticide use.
Most previous studies analyzing this situation have been static in nature, as panel data related
to changes in pest management activities are rarely available. One way to circumvent this is

Publication I: Land use intensification
20
to use cross-sectional data from farms cultivating their land at different levels of intensity.
Agricultural systems in mountainous areas offer an ideal setting for collecting such data,
because differences in road infrastructure and distances to urban centers, as well as variations
in agro-climatic conditions, provide varying opportunities for land use intensification to take
place within a relatively small geographical area. Therefore, this study is based on data drawn
from the highlands of northern Thailand.
The mountainous north of Thailand is home to numerous ethnic minorities who traditionally
engaged in rice farming to meet their subsistence needs, as well as commercial crops (such as
maize and poppies) to meet their cash needs. The area has been subject to rapid land use
change since the 1980s, as driven by restrictive land use policies, population growth, general
economic development, infrastructure development and agricultural innovation
(Schreinemachers et al., 2013). Farming systems nowadays are much more diverse, and
although traditional farming systems remain in some villages, maize, coffee, fruit trees,
vegetables and flowers are also widely grown (Jiang et al., 2007; Jungbluth, 1996; Rerkasem,
1998; Vanwambeke et al., 2007). Previous studies have found that that there is a strong
association between the amounts of synthetic pesticide used and the gross margins generated
by different cropping activities (Schreinemachers et al., 2011), but also that farmers
practicing commercial agriculture in mountainous areas are exposed to significant health
risks due to pesticide use (Panuwet et al., 2008; Praneetvatakul et al., 2013; Stuetz et al.,
2001).
The paper is organized as follows. Section 2 describes the data collection and method to
quantify land use intensification. Section 3 presents the results of our analysis regarding the
process of agricultural intensification, and identifies the factors associated with pesticide use,
pest pressure and pest/plant disease control methods. Section 4 discusses the empirical
findings and Section 5 concludes.
2.3 Materials and methods
For this study, we collected data in three provinces of northern Thailand, as shown in Figure
2.1. There are a total of 1,079 upland villages in these provinces, with a total of about 85
thousand rural households. Twelve villages were selected for our study. We first ranked the
villages by their level of agricultural development, which was assessed based on secondary
data obtained from the Highland Research and Development Institute (personal

Publication I: Land use intensification
21
communication) regarding the average income per adult working in agriculture. The villages
were divided into ten equal segments. From each segment, the village situated at the 50th
percentile was selected for the study. Those villages situated at the 25th percentile in the first
segment and at the 75th percentile in the last segment were also included, in order to ensure
that villages with a very low and a very high level of agricultural development would be
included in the study.
A list of all farm households in each sample village was compiled with the help of the local
village headmen, and these lists were used to randomly select 20 households for an interview.
This gave a sample of 240 households. The stratified sampling procedure applied here
ensured that the data had a large variation in terms of farming systems and much diversity in
terms of ethnicity, as shown in Table 2.1. The sample included households of Karen, Lua,
Hmong and Thai ethnic origin. Farming systems that are oriented towards meeting the
household subsistence needs are mainly characterized by the growing of upland rice and
paddy rice, and also a range of fruit and vegetables in home gardens, while the more
commercially-oriented systems include strawberries, chilies, tea and various other cash crops.
Figure 2.1a: Location of Thailand; and 1b: Location of the sub-districts in northern Thailand
in which the sample villages are located (the numbers in the map refer to the villages listed in
Table 2.1)
(a)
(b)

Publication I: Land use intensification
22
Table 2.1: Ethnicity and land use types in the twelve sample villages, ranked in ascending
order by average agricultural income per adult person working in agriculture
Village name Ethnic group Main cash crops Main food crops
1. Teelerperkee Karen Soybeans Upland rice, home gardens
2. Khokuang Lua None Upland rice, maize, home gardens
3. Pongkao Karen Peanuts Paddy rice, home gardens
4. Jarangluang Lua Maize Upland/paddy rice, home gardens
5. Maejew Karen Coffee, bananas Upland rice, home gardens
6. Palapiklang Karen Maize Upland/paddy rice
7. Yongkeau 3 Karen Tomatoes, chilies, pumpkins Paddy rice
8. Maemam Karen Tea Upland/paddy rice, home gardens
9. Namzum Hmong Cabbages, maize, litchis Upland rice
10. Maetala Hmong Maize, cabbages, spring onions Upland rice
11. Poknai Thai Tea, coffee, persimmon Home gardens
12. Nongkrizu Karen Strawberries, peanuts, chilies Upland/paddy rice
Farm-level data were collected using structured questionnaires completed during face-to-face
interviews with farm managers. Prior to the individual interviews, general information about
each relevant village was collected through focus group discussions. Interviews were
conducted in the Thai language, but the enumerators were also able to ask questions in the
Karen and Hmong languages, in case the respondents were not fluent in Thai. The survey was
conducted between November 2011 and March 2012, and questions were based on a 12-
month recall covering the period November 2010 to October 2011. Information was collected
about general farm characteristics, crops grown, inputs and outputs, as well as sources of
income. Respondents were asked to identify crop pest and disease problems using a photo
album prepared specifically for the survey. For each problem identified, detailed questions
were asked about its intensity and, if applicable, the methods used to control it. If respondents
said they were using pesticides, product names, quantities and expenditures were also
recorded. This information was later matched with secondary data on the types and
percentages of active ingredients contained within the pesticides being used. Pesticides
included insecticides, fungicides, herbicides, rodenticides and other chemicals used to
manage biotic stresses.
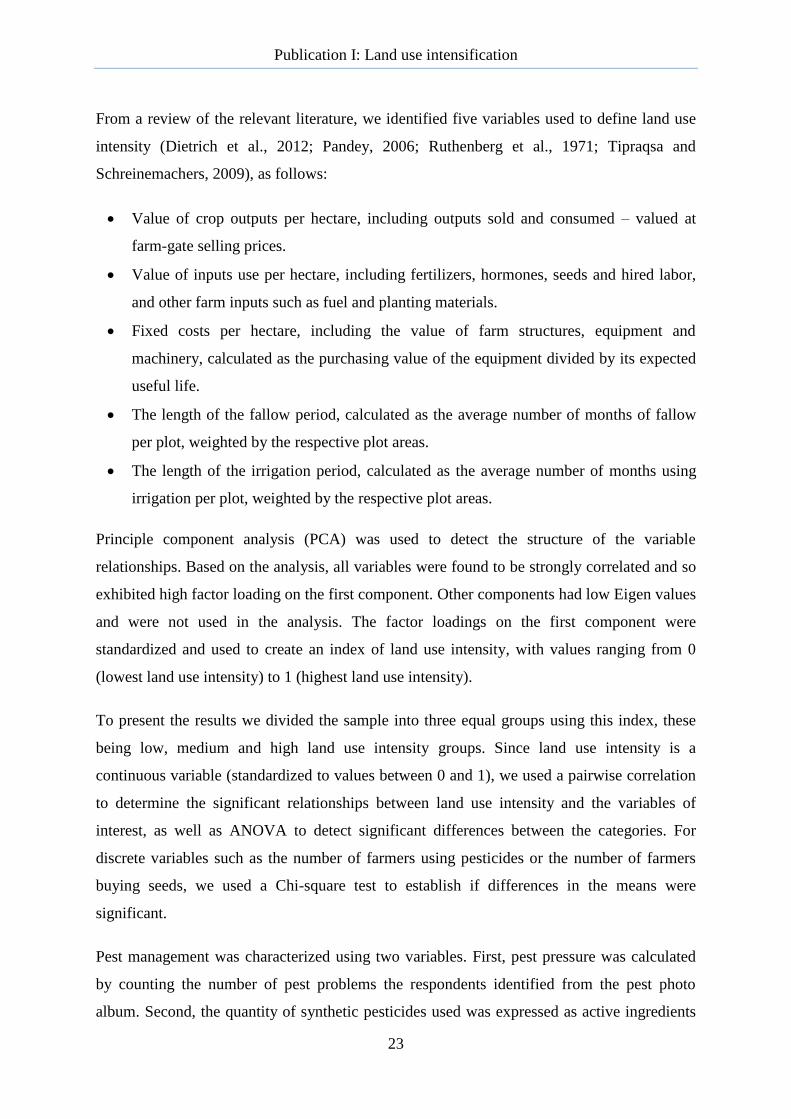
Publication I: Land use intensification
23
From a review of the relevant literature, we identified five variables used to define land use
intensity (Dietrich et al., 2012; Pandey, 2006; Ruthenberg et al., 1971; Tipraqsa and
Schreinemachers, 2009), as follows:
Value of crop outputs per hectare, including outputs sold and consumed – valued at
farm-gate selling prices.
Value of inputs use per hectare, including fertilizers, hormones, seeds and hired labor,
and other farm inputs such as fuel and planting materials.
Fixed costs per hectare, including the value of farm structures, equipment and
machinery, calculated as the purchasing value of the equipment divided by its expected
useful life.
The length of the fallow period, calculated as the average number of months of fallow
per plot, weighted by the respective plot areas.
The length of the irrigation period, calculated as the average number of months using
irrigation per plot, weighted by the respective plot areas.
Principle component analysis (PCA) was used to detect the structure of the variable
relationships. Based on the analysis, all variables were found to be strongly correlated and so
exhibited high factor loading on the first component. Other components had low Eigen values
and were not used in the analysis. The factor loadings on the first component were
standardized and used to create an index of land use intensity, with values ranging from 0
(lowest land use intensity) to 1 (highest land use intensity).
To present the results we divided the sample into three equal groups using this index, these
being low, medium and high land use intensity groups. Since land use intensity is a
continuous variable (standardized to values between 0 and 1), we used a pairwise correlation
to determine the significant relationships between land use intensity and the variables of
interest, as well as ANOVA to detect significant differences between the categories. For
discrete variables such as the number of farmers using pesticides or the number of farmers
buying seeds, we used a Chi-square test to establish if differences in the means were
significant.
Pest management was characterized using two variables. First, pest pressure was calculated
by counting the number of pest problems the respondents identified from the pest photo
album. Second, the quantity of synthetic pesticides used was expressed as active ingredients

Publication I: Land use intensification
24
(in kg) and calculated from the undiluted quantity of pesticides used per application, the
application frequency per cropping cycle and the percentage of active ingredients the
products contained (obtained from secondary data). Various alternative methods of pest
management were recorded in the survey in addition to the use of pesticides, these being
handpicking, trapping, slashing and burning, plus the use of bio-pesticides.
2.4 Results
2.4.1 Land use change
Table 2.2 shows the variables used to quantify land use intensity. It illustrates that land
productivity, variable and fixed input use per hectare, and months using irrigation, all
increased with land use intensity, while the length of the fallow period decreased
dramatically. The gross output per hectare for farms with high levels of land use intensity was
found to be about 15 times greater than that of farms with low levels of land use intensity,
while per-hectare variable costs were also about 15 times higher. These results reveal striking
differences in land use intensity, and suggest that the process of land use intensification has
led to a marked divergence in economic performance in the study area.
Table 2.2: Variables used to quantify land use intensity for the 240 study farm households in
northern Thailand, 2011
Land use
intensity
Land
productivity
(USD/ha)
Variable
inputs used
(USD/ha)
Fixed inputs
used
(USD/ha)
Irrigation
applied
(months/
year)
Fallow
period
(months)
Land use
intensity
index (0-1)
Low (A) 324c 82c 18c 0.04c 20.55bc 0.17bc
Medium (B) 777c 249c 61c 0.23c 2.31a 0.23ac
High (C) 4367ab 1198ab 308ab 1.54ab 0.19a 0.45ab
Average 1823 509 129 0.61 7.68 0.29
Correlation 0.82 0.62 0.44 0.69 -0.53 -
P-value <0.0001 <0.0001 <0.0001 <0.0001 <0.0001 -
Notes: The letters a, b and c indicate that the value in question is significantly different from those categories
(based on ANOVA). Correlation values reflect a pairwise correlation coefficient.
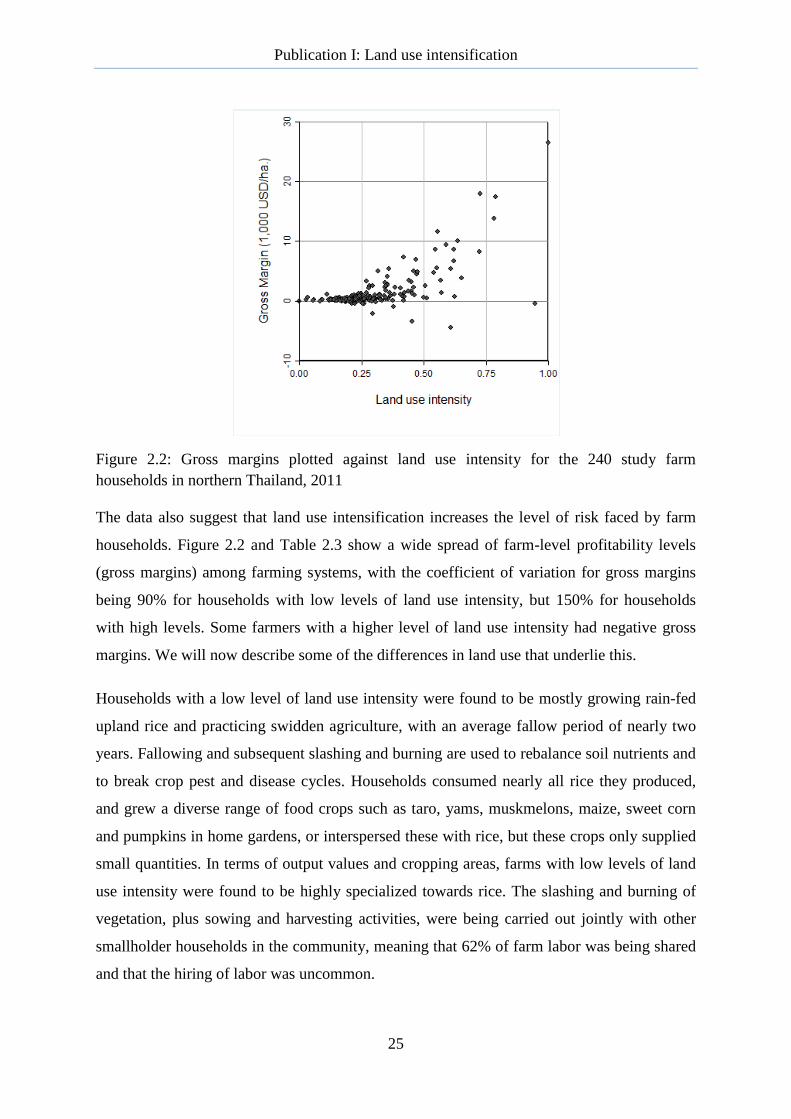
Publication I: Land use intensification
25
Figure 2.2: Gross margins plotted against land use intensity for the 240 study farm
households in northern Thailand, 2011
The data also suggest that land use intensification increases the level of risk faced by farm
households. Figure 2.2 and Table 2.3 show a wide spread of farm-level profitability levels
(gross margins) among farming systems, with the coefficient of variation for gross margins
being 90% for households with low levels of land use intensity, but 150% for households
with high levels. Some farmers with a higher level of land use intensity had negative gross
margins. We will now describe some of the differences in land use that underlie this.
Households with a low level of land use intensity were found to be mostly growing rain-fed
upland rice and practicing swidden agriculture, with an average fallow period of nearly two
years. Fallowing and subsequent slashing and burning are used to rebalance soil nutrients and
to break crop pest and disease cycles. Households consumed nearly all rice they produced,
and grew a diverse range of food crops such as taro, yams, muskmelons, maize, sweet corn
and pumpkins in home gardens, or interspersed these with rice, but these crops only supplied
small quantities. In terms of output values and cropping areas, farms with low levels of land
use intensity were found to be highly specialized towards rice. The slashing and burning of
vegetation, plus sowing and harvesting activities, were being carried out jointly with other
smallholder households in the community, meaning that 62% of farm labor was being shared
and that the hiring of labor was uncommon.

Publication I: Land use intensification
26
For households with medium or high levels of land use intensity, irrigated paddy rice was
relatively more important than rain-fed upland rice. No vegetables or other crops were
combined with rice in the paddies, but most households continued to grow vegetables in their
home gardens for their own use. Perhaps surprisingly, with increasing land use
intensification, rice had not disappeared from the farming system, with 88% of farmers in the
high intensity group continuing to grow it. This shows that households in the area place great
importance on being able to secure at least a part of their rice consumption needs, although
they may also purchase rice from the market. The information obtained from the focus group
discussions confirmed this. The share of the harvest sold increased with land use intensity,
but still 43% of farm output was home consumed – even among the high land use intensity
group (Table 2.3).
As fallow periods shortened and cash crops became more important, the use of mineral
fertilizers increased dramatically, from 17 kg/ha for farms with low levels of land use
intensity, to 414 kg/ha for farms with high levels (Table 2.3). In addition, households became
more reliant on external seed supplies, with 65% of households in the high land use intensity
group buying seeds as compared to 39% in the low land use intensity group. Hired labor also
became more important as land use intensification increased, but even for the high land use
intensity farms, it only constituted 7% of total labor use, and was used exclusively for cash
crops, whereas labor sharing continued to dominate rice cultivation.
Table 2.3: Variables correlated with land use intensity for the 240 study farm households in
northern Thailand, 2011
Land use
intensity
Gross
margins
(USD/ha)
Percentage
of harvest
sold
Percentage of
farmers
buying seeds
Mineral
fertilizer use
(kg/ha)
Source of agricultural
labor (% of total labor)d
Shared Hired
Low (A) 242c 27bc 39 17c 62 1c
Medium (B) 529c 58a 53 102c 60 3c
High (C) 3168ab 57a 65 414ab 52 7ab
Average 1313 47 52 178 58 3
Correlation 0.69 0.30 - 0.60 -0.14 0.27
P-value <0.0001 <0.0001 0.004 <0.0001 0.0317 <0.0001
Notes: The letters a, b and c indicate that the value in question is significantly different from those categories
(based on ANOVA). Correlation refers to a pairwise correlation coefficient. Where the variable is expressed in
"% of farmers", a Chi2 test was conducted instead of ANOVA or pairwise correlation. d The remainder is own
household labor.
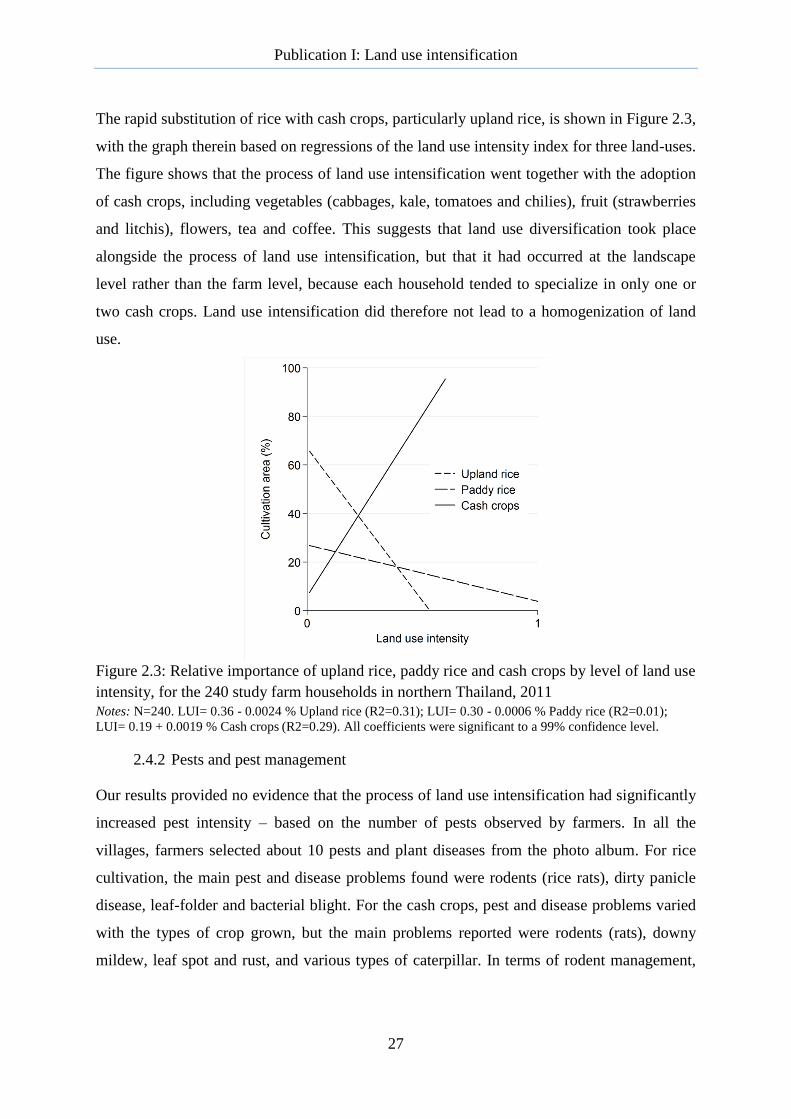
Publication I: Land use intensification
27
The rapid substitution of rice with cash crops, particularly upland rice, is shown in Figure 2.3,
with the graph therein based on regressions of the land use intensity index for three land-uses.
The figure shows that the process of land use intensification went together with the adoption
of cash crops, including vegetables (cabbages, kale, tomatoes and chilies), fruit (strawberries
and litchis), flowers, tea and coffee. This suggests that land use diversification took place
alongside the process of land use intensification, but that it had occurred at the landscape
level rather than the farm level, because each household tended to specialize in only one or
two cash crops. Land use intensification did therefore not lead to a homogenization of land
use.
Figure 2.3: Relative importance of upland rice, paddy rice and cash crops by level of land use
intensity, for the 240 study farm households in northern Thailand, 2011
Notes: N=240. LUI= 0.36 - 0.0024 % Upland rice (R2=0.31); LUI= 0.30 - 0.0006 % Paddy rice (R2=0.01);
LUI= 0.19 + 0.0019 % Cash crops (R2=0.29). All coefficients were significant to a 99% confidence level.
2.4.2 Pests and pest management
Our results provided no evidence that the process of land use intensification had significantly
increased pest intensity – based on the number of pests observed by farmers. In all the
villages, farmers selected about 10 pests and plant diseases from the photo album. For rice
cultivation, the main pest and disease problems found were rodents (rice rats), dirty panicle
disease, leaf-folder and bacterial blight. For the cash crops, pest and disease problems varied
with the types of crop grown, but the main problems reported were rodents (rats), downy
mildew, leaf spot and rust, and various types of caterpillar. In terms of rodent management,

Publication I: Land use intensification
28
55% of the low land use intensity farmers used trapping devices, but only 13% of the high
land use intensity farmers did so.
Weeds were the main problem faced by low level land use intensity farmers. Slashing and
burning was commonly carried out (Table 2.4) to control weeds, but this did not create
temperatures high enough to destroy most of the seeds, particularly during short fallow cycles
when not enough biomass has accumulated. Hand hoes and machetes were the most common
methods of weed control used, but 35% of the farmers said they also used salt (sodium
chloride) as an inorganic herbicide (defoliator). The use of synthetic herbicides was also
common, with 51% of farmers in the low intensity land use group applying them. Within the
high land use intensity group, the use of synthetic herbicides was even more widespread, with
79% of farmers spraying herbicides at an average rate of 5.4 kg/ha, as compared to 1.4 kg/ha
within the low intensity group. Farmers mentioned that the use of inorganic herbicides had
tended to disappear as land use intensified, with the most commonly applied synthetic
herbicides among the study households including paraquat dichloride, glyphosate and
atrazine.
Table 2.4: Pest management methods used and levels of land use intensity for the 240 study
households in northern Thailand, 2011 (% of farmers using a method)
Land use
intensity
Weed management
Trapping Hand-
picking
Synthetic
insecticides
Synthetic
fungicides Slash and
burn
Mech-
anical
Inorganic
herbicides
(salts)
Synthetic
herbicides
Low 58 100 35 51 55 13 19 3
Medium 51 91 18 60 24 9 28 9
High 34 74 8 79 13 5 65 46
Average 48 88 20 63 30 9 37 19
P-valuea 0.008 <0.001 <0.001 0.001 <0.001 0.244 <0.001 <0.001
Note: a Chi2-test
Table 2.5 confirms that the use of synthetic pesticides had become more common as land use
intensity increased (Table 2.5), with the quantity of synthetic pesticides used being 1.4, 4.0
and 22.0 kg of active ingredients per hectare in the low, medium and high land use intensity
groups respectively. The use of fungicides such as mancozeb, and insecticides such as
methomyl and cypermethrin, also increased dramatically. The average quantity of synthetic
pesticides applied depended much on the cash crops grown, and was particularly high for
tomatoes (40 kg/ha), chilies (50 kg/ha) and strawberries (52 kg/ha).

Publication I: Land use intensification
29
Table 2.5: Quantity of synthetic pesticides used by land use intensity for the 240 study farm
households in northern Thailand, 2011 (active ingredients: kg/ha/year)
Land use
intensity Herbicides Insecticides Fungicides
Other
pesticides All pesticides
Low (A) 1.4c <0.1c <0.1c <0.1 1.4c
Medium (B) 3.9 <0.1c <0.1c <0.1 4.0c
High (C) 5.4a 2.3ab 13.5ab 0.4 22.0ab
Average 3.6 0.8 4.5 0.1 9.0
Correlation 0.13 0.40 0.40 0.07 0.44
P-value 0.0468 <0.0001 <0.0001 0.2629 <0.0001
Notes: The letters a, b and c indicate that the value in question is significantly different from those categories
(based on ANOVA). Correlation figures refer to a pairwise correlation coefficient.
The data in Table 2.6 show farmers’ increasing reliance on synthetic pesticides as land use
intensifies. Of the farmers in the high land use intensity group, 16% reported they only used
synthetic pesticides, applying them 16 times a year, while the low land use intensity farmers
said they only applied them twice a year. An increase in the number of different pesticides
used was also accompanied by an increase in the mixing of different pesticide products – a
practice not recommended because chemical reactions between different products can
increase health risks to farmers and reduce the effectiveness of their application.
Farmers did not seem to be aware of the impact of pesticide use on their health, and generally
had only limited knowledge of their correct usage (Table 2.7). In total, 16% of the households
using pesticides were storing them inside their homes, while 32% mentioned they simply left
containers in the fields. Of this group, 38% said they never followed the instructions shown
on the containers’ labels. The fact that 52% of the respondents were not able to read Thai
largely explains this because the information on the label is only given in Thai language.
Other farmers were the main major source of information about health and safety issues
related to pesticide use as 67% of the respondents said they received such information from
their peers, 28% from pesticide sellers, and only 3% from government officers.

Publication I: Land use intensification
30
Table 2.6: Use of synthetic pesticides by level of land use intensity for the 240 study farm
households in northern Thailand, 2011
Land use
intensity
% of farmers
using
% of farmers
using as only
method
Applications
per year
Number of
different
pesticides
used
% of farmers
mixing
pesticides
Share of
input costs
(%)
Low (A) 51 0 2c 1.7c 18 12
Medium (B) 63 3 3c 2.4c 14 10c
High (C) 85 16 16ab 4.5ab 35 16b
Average 66 6 7 2.9 22 13
Correlation - - 0.56 0.44 - 0.23
P-value <0.001 <0.001 <0.0001 <0.0001 0.003 <0.001
Notes: The letters a, b and c indicate that the value is significantly different from categories A, B and C,
respectively, based on ANOVA. Correlation figures refer to a pairwise correlation coefficient. Where the
variable is expressed as "% of farmers", a Chi2 test was conducted instead of ANOVA or pairwise correlation.
Table 2.7: Pesticide usage and health impacts for the 240 study farm households in northern
Thailand, 2011 (% of farmers using synthetic pesticides)
Land use
intensity Store pesticides
inside the house
Always leave
empty
containers in or
near the fields
Do not follow
instructions on
the labels
Regularly
experience
dizziness after
spraying
Regularly
experience
nausea or
vomiting after
spraying Low 24 46 51 56 34
Medium 10 27 41 43 18
High 16 27 27 43 24
Average 16 32 38 47 25
P-valuea 0.263 0.593 0.819 0.432 0.303
Note: a Chi2 test
No significant correlation was found between the level of land use intensity and these
handling practices, which suggests that pesticide handling practices did not improve with
higher levels of land use intensity. Due to the limited awareness of their impact and the lack
of protection used during spraying, farm workers applying the pesticides – male in 80% of
cases – were being highly exposed. The results show that 47% of the applicators reported
they regularly felt dizzy and 25% that they regularly experienced nausea or vomited after
applying the chemicals (Table 2.7).
Publication I: Land use intensification
31
2.5 Discussion
Our results show that farmers who cultivate their land more intensively use a greater number
and greater quantity of synthetic pesticides and use fewer alternative methods of pest control
than farmers who cultivate their land less intensively. These results suggest that the process
of land use intensification is accompanied by an increasing reliance on synthetic pesticides.
The fact that there is a strong correlation between gross margins, land use intensity and
pesticide use suggests that the increase in pesticide use is largely driven by farmers seeking
higher profits. It was not the objective of our study to identify the drivers of pesticide use, but
we think that other factors might also play an important role. One such factor is the easy
availability of pesticides in all locations in the Thai uplands and an active private sector
promoting their use. Another factor is labor saving, which particularly drives herbicide use
and has been identified in other country studies as well (e.g. Pedlowski et al., 2012). Cash
crops also require relatively large investments for which credit is used, and farmers tend to
overuse pesticides to reduce the risk of crop losses and subsequent indebtedness
(Grovermann et al., 2013). Another factor that was apparent in our study is that integrated
pest management had not been promoted yet and farmers therefore had only limited
knowledge about this management option. They seemed to perceive pesticides as the only
control method available to them.
Our results do not confirm that homogenization of land use is a driver of pesticide use
because we found that the adoption of cash crops actually diversified agricultural land use, as
compared to the traditional system dominated by rice cultivation. Diversification, however, is
more apparent at the landscape level than at the individual farm level because different
farmers adopted different cash crops. Our findings do also not confirm that farmers have
entered into a vicious cycle of pesticide resistance buildup, increasing pesticide use and
increasing withdrawal costs as, for instance, described by Cowan and Gunby (1996) and
Wilson and Tisdell (2001). We did not find that high intensity farms had a greater number or
greater intensity of pest problems, nor had farmers noticed a marked decrease in the
effectiveness of pesticides. We must caution, however, that most farmers had only recently
started using pesticides, and pesticide resistance might be observed at a later stage. We can
therefore not rule out the existence of such a vicious circle.

Publication I: Land use intensification
32
Our empirical analysis was based on a land-use intensity index constructed using PCA. We
checked the robustness of our findings, by repeating the analysis using an alternative index,
one constructed by first standardizing the five variables listed above – from 0 to 1, then
averaging across all variables. This gave slightly different results for some variables, but our
findings and conclusions remain the same.
Some aspects relevant to the process of land use intensification were not well-captured in our
study, including changes in the level of knowledge among farmers about pests and diseases,
and also changes in the roles of men and women with regard to pest and plant disease
management. It was also difficult to fully capture the diversity of crop species grown by
farmers operating with low levels of land use intensity, since estimating crop areas and output
quantities proved difficult for minor crops used only for home consumption.
Within the group of farmers with intensive land use, the variation in pesticide use was high.
Average levels of pesticide use on cash crops such as tomatoes, chilies and strawberries were
alarmingly high, while levels were relatively low for cash crops such as coffee and tea. This
confirms earlier findings of Tipraqsa and Schreinemachers (2009). This information can be
used to better target interventions aimed at reducing pesticide risk. Farmers cultivating
tomato, chili and strawberry would benefit most from training in pest and disease diagnosis
and management. As a consequence, extension services could target their efforts at locations
where these crops are predominantly grown.
Such training efforts can include rather simple methods to reduce health risks to farmers,
such as the use of protective clothing or following application instructions, as we found that
these were not generally being used, and it appeared that farmers’ practices did not improve
as land use intensified. Farmers with a high land use intensity commonly mixed different
pesticide products together into single sprays. As a result of incorrect handling practices,
respondents reported to suffer from health problems such as dizziness, nausea and vomiting
after applying pesticides, which corresponds to the findings for other countries (Ngowi et al.,
2007; Van Der Hoek et al., 1998). The focus group discussions revealed that most farmers
experienced such problems, but concerns that side-effects could do long-term damage to their
health appeared to play a secondary role for farmers. On the contrary, farmers were generally
satisfied with the level of crop protection offered by synthetic pesticides. There is therefore
an urgent need to raise the level of awareness of such impacts. If farmers were more aware of
Publication I: Land use intensification
33
the potential danger of pesticides, they would probably have greater incentives to reduce
usage and exposure.
2.6 Conclusion
Land use intensification in the upland areas of northern Thailand are accompanied by a
reduction in the use of traditional methods of pest management and an increase in the use of
synthetic insecticides, fungicides and herbicides. Farms with a low level of land use intensity
sprayed on average twice a year and used a total of 1.4 kg of active ingredients per ha, while
those at a high level of land use intensity sprayed on average 16 times and used 22.0 kg/ha.
They also used a greater number of different products and tended to mix them together.
Extremely high levels of pesticide were found in tomatoes (40 kg/ha), chilies (50 kg/ha) and
strawberries (52 kg/ha). Many farmers experienced harmful side-effects such as dizziness,
nausea and vomiting after spraying, but only few were truly concerned. Awareness raising
and training in good agricultural practices together with the development and promotion of
integrated pest management will be needed to reduce the risk of pesticide exposure.
2.7 Acknowledgments
The authors would like to acknowledge Mrs. Edith-Karla Eiselen for her continuous support
of this research study. We also acknowledge the Deutsche Forschungsgemeinschaft (DFG)
and Humidtropics, a CGIAR Research Program that aims to develop new opportunities for
improved livelihoods in a sustainable environment, for partially funding this work. We thank
Prasnee Tipraqsa and the reviewers of this journal for their helpful comments and Gary
Morrison for reading through the English.
2.8 References
Cowan, R., Gunby, P., 1996. Sprayed to death: path dependence, lock-in and pest control
strategies. The Economic Journal, 521-542.
Dietrich, J.P., Schmitz, C., Müller, C., Fader, M., Lotze-Campen, H., Popp, A., 2012.
Measuring agricultural land-use intensity – A global analysis using a model-assisted
approach. Ecological Modelling 232, 109-118.
Ecobichon, D.J., 2001. Pesticide use in developing countries. Toxicology 160, 27-33.
Grovermann, C., Schreinemachers, P., Berger, T., 2013. Quantifying pesticide overuse from
farmer and societal points of view: An application to Thailand. Crop Protection 53,
161-168.
Jiang, Y., Kang, M., Schmidt-Vogt, D., Schrestha, R.P., 2007. Identification of agricultural
factors for improving sustainable land resource management in northern Thailand: A
Publication I: Land use intensification
34
case study in Chiang Mai Province. The International Journal of Sustainable
Development & World Ecology 14, 382-390.
Jin, F., Wang, J., Shao, H., Jin, M., 2010. Pesticide use and residue control in China. Journal
of Pesticide Science 35, 138-142.
Jungbluth, F., 1996. Crop protection policy in Thailand: economic and political factors
influencing pesticide use. Pesticide Policy Project Hannover.
Lewis, W.J., van Lenteren, J.C., Phatak, S.C., Tumlinson, J.H., 1997. A total system
approach to sustainable pest management. Proceedings of the National Academy of
Sciences 94, 12243-12248.
Nesheim, I., Reidsma, P., Bezlepkina, I., Verburg, R., Abdeladhim, M.A., Bursztyn, M.,
Chen, L., Cissé, Y., Feng, S., Gicheru, P., Jochen König, H., Novira, N.,
Purushothaman, S., Rodrigues-Filho, S., Sghaier, M., 2014. Causal chains, policy
tradeoffs and sustainability: Analysing land (mis)use in seven countries in the South.
Land Use Policy 37, 60-70.
Ngowi, A.V.F., Mbise, T.J., Ijani, A.S.M., London, L., Ajayi, O.C., 2007. Smallholder
vegetable farmers in Northern Tanzania: Pesticides use practices, perceptions, cost
and health effects. Crop Protection 26, 1617-1624.
Pandey, S., 2006. Upland rice, household food security, and commercialization of upland
agriculture in Vietnam. Int. Rice Res. Inst.
Panuwet, P., Prapamontol, T., Chantara, S., Thavornyuthikarn, P., Montesano, M.A.,
Whitehead, R.D., Barr, D.B., 2008. Concentrations of urinary pesticide metabolites in
small-scale farmers in Chiang Mai Province, Thailand. Science of the Total
Environment 407, 655-668.
Panuwet, P., Siriwong, W., Prapamontol, T., Ryan, P.B., Fiedler, N., Robson, M.G., Barr,
D.B., 2012. Agricultural pesticide management in Thailand: status and population
health risk. Environmental Science & Policy 17, 72-81.
Pedlowski, M.A., Canela, M.C., da Costa Terra, M.A., Ramos de Faria, R.M., 2012. Modes
of pesticides utilization by Brazilian smallholders and their implications for human
health and the environment. Crop Protection 31, 113-118.
Pingali, P.L., 2001. Environmental consequences of agricultural commercialization in Asia.
Environment and Development Economics 6, 483-502.
Praneetvatakul, S., Schreinemachers, P., Pananurak, P., Tipraqsa, P., 2013. Pesticides,
external costs and policy options for Thai agriculture. Environmental Science &
Policy 27, 103-113.
Rai, M.R., Timothy G. & Pandey, Shivaji. & Collette, Linda. & Food and Agriculture
Organization of the United Nations. , 2011. Save and grow: a policymaker's guide to
sustainable intensification of smallholder crop production / [final technical editing,
Mangala Rai, Timothy Reeves and Shivaji Pandey; lead authors: Linda Collette ... [et
al.]. Food and Agriculture Organization of the United Nations, Rome.
Rerkasem, K., 1998. Shifting Cultivation in Thailand: Land Use Changes in the Context of
National Development. ACIAR Proceedings 87, 54-63.
Ruthenberg, H., MacArthur, J., Zandstra, H., Collinson, M.P., 1971. Farming systems in the
tropics. Cambridge Univ Press.
Schreinemachers, P., Fröhlich, H.L., Clemens, G., Stahr, K., 2013. From Challenges to
Sustainable Solutions for Upland Agriculture in Southeast Asia, Sustainable Land Use
and Rural Development in Southeast Asia: Innovations and Policies for Mountainous
Areas. Springer, pp. 3-27.
Schreinemachers, P., Sringarm, S., Sirijinda, A., 2011. The role of synthetic pesticides in the
intensification of highland agriculture in Thailand. Crop Protection 30, 1430-1437.
Publication I: Land use intensification
35
Schreinemachers, P., Tipraqsa, P., 2012. Agricultural pesticides and land use intensification
in high, middle and low income countries. Food Policy 37, 616-626.
Stuetz, W., Prapamontol, T., Erhardt, J.G., Classen, H.G., 2001. Organochlorine pesticide
residues in human milk of a Hmong hill tribe living in Northern Thailand. Science of
the Total Environment 273, 53-60.
Tipraqsa, P., Schreinemachers, P., 2009. Agricultural commercialization of Karen Hill tribes
in northern Thailand. Agricultural Economics 40, 43-53.
Van Der Hoek, W., Konradsen, F., Athukorala, K., Wanigadewa, T., 1998. Pesticide
poisoning: A major health problem in Sri Lanka. Social Science & Medicine 46, 495-
504.
Van Hoi, P., Mol, A.P.J., Oosterveer, P., van den Brink, P.J., 2009. Pesticide distribution and
use in vegetable production in the Red River Delta of Vietnam. Renewable
Agriculture and Food Systems 24, 174-185.
Vanwambeke, S.O., Somboon, P., Lambin, E.F., 2007. Rural transformation and land use
change in northern Thailand. Journal of Land Use Science 2, 1-29.
Wilson, C., Tisdell, C., 2001. Why farmers continue to use pesticides despite environmental,
health and sustainability costs. Ecological Economics 39, 449-462.
Xu, R., Kuang, R., Pay, E., Dou, H., de Snoo, G.R., 2008. Factors contributing to overuse of
pesticides in western China. Environmental Sciences 5, 235-249.

Publication II: Risk perception and pesticide use
36
3 Publication II
Agricultural commercialization: Risk perceptions, risk management
and the role of pesticides in Thailand2
Suthathip Riwthong a, Pepijn Schreinemachers b, Christian Grovermann c, Thomas Berger a
a Dept. of Land Use Economics in the Tropics and Subtropics (490d), Universität
Hohenheim, 70593 Stuttgart, Germany
b AVRDC – The World Vegetable Center, P.O. Box 42, Shanhua, Tainan, 74199 Taiwan
c FAO – Food and Agriculture Organization of the United Nations – Viale delle Terme di
Caracalla, 00153 Rome, Italy
2 Paper submitted to Asian Journal of Agriculture and Development on 30 March 2016.

Publication II: Risk perception and pesticide use
37
3.1 Abstract
The transformation of agriculture in lower income countries from subsistence- to market-
oriented production systems has important implications for farmers' risk exposure and risk
management yet only few studies have paid attention to this. This paper fills this gap and
particularly focuses on the role of pesticides in managing the risk from crop pests and
diseases, which is major source of risk to farmers. Data were collected for 240 Thai upland
farmers stratified by ten levels of agricultural commercialization. The results show that risk
perceptions and management strategies are strongly associated with levels of agricultural
commercialization. Key strategies for commercial farmers included monitoring market
prices, diversifying sales channels and applying large quantities of pesticides, while crop
diversification and debt avoidance were more important for subsistence-oriented farmers.
High levels of pesticide use at commercial farms were not accompanied by a safer handling
practices, as farmers largely neglected pesticide health risks. The results point at the
importance of tailored agricultural policies to strengthen farmers' resilience against risk at
varying levels of commercialization, rather than following a one size fits all approach.
Keywords: Land use intensification, pest management, developing countries, Thailand
Publication II: Risk perception and pesticide use
38
3.2 Introduction
Risk and uncertainty are inherent to agricultural production. In the context of lower income
countries, risk and uncertainty are closely linked to vulnerability of farm households to
remaining in or falling into poverty. Yet sources of risk and uncertainty are not uniformly
spread over all farmers, neither are they constant over time. As farming systems in lower
income countries transform from subsistence- to market-oriented production, the sources of
risk to which farm households are exposed change (Kahan 2008). Understanding the change
brought about by commercialization is important for policy-makers to better manage the
sustainable intensification of agriculture.
Whereas commercialization and land use change in Asia have been widely studied (e.g.
(Pingali and Rosegrant 1995, Tipraqsa and Schreinemachers 2009, Vanwambeke, Somboon,
and Lambin 2007, von Braun 1995), the relationship of commercialization to risk and risk
management has received little attention. Most likely this is because commercialization and
changes in risk are difficult to study as they require longitudinal data. Some studies have
examined commercialization as a driver of farm productivity and rising farm household
incomes, partly also considering market risk (Jayne et al. 2011, Pandey 2006, Zeller et al.
2013). Other studies have put a focus on analyzing farmer decision-making under risk (Aimin
2010, Akcaoz 2012, Harwood et al. 1999, Liu and Huang 2013, Waibel 1990).
However, the role of risk that farmers face in the process of commercialization and market
integration is underappreciated. It is therefore the first objective of this study is to improve
the understanding of how risk and risk management of farmers change in the course of
agricultural commercialization.
One of the sources of risk of greatest concern to farmers is crop pests and diseases. The
unpredictability of pest and disease incidence and resulting crop damage creates much
anxiety among farmers. Lack of functioning extension services, absence of pest and disease
monitoring systems, and poor levels of education, magnify such anxieties. The introduction
of cash crops that are often ecologically unsuitable and the simplification of cultivation
patterns with widespread mono-cropping characterize agricultural commercialization. This
heightens pest pressure. Therefore, in the process of commercialization, farmers turn to using
synthetic pesticides, which also become more accessible, to lower their risk exposure and to
increase the odds of a good harvest. The second objective of this study thus is to analyze the
Publication II: Risk perception and pesticide use
39
relationship between commercialization and the role of synthetic pesticides in managing the
risk of crop pests and diseases.
The paper starts in Section 2 by describing our methods and data. Section 3 identifies the
various sources of risk as perceived by the farmers, shows their main risk management
strategies, and shows how these vary with the level of agricultural commercialization. The
second part of the results section then concentrate on the role of pesticides in risk
management and estimates a regression model to identify drivers of pesticide use. Section 4
discusses our findings and Section 5 concludes.
3.3 Material and methods
3.3.1 Data
The uplands of northern Thailand are ideal for this type of study because the mountainous
terrain creates unequal opportunities for agricultural development within a relatively small
geographical area. A few decades ago, rice was the main crop grown virtually everywhere.
Yet current land use patterns are much more diverse and include rice alongside many high-
value crops such as maize, soybean, vegetables, fruits and flowers (Rerkasem 1998,
Vanwambeke, Somboon, and Lambin 2007).
We selected three northern provinces for our research: Nan, Chiang Rai and Chiang Mai
because they form a north-south axis from the main urban center of Chiang Mai. It appeared
logical to assume that opportunities for commercial agriculture increase with the proximity to
a major urban center. These provinces have 1,079 rural upland villages. We used secondary
data from the Highland Research and Development Institute in Chiang Mai to find a proxy
for agricultural commercialization. The best available proxy variable was the average income
per adult employed in agriculture. We ranked the villages by this variable and divided them
into ten equal segments. We selected the median village from each segment. To represent the
extremes, we additionally selected the village at the 25th percentile of the first segment and at
the 75th percentile in the last segment. This resulted in 12 villages on a spectrum of
agricultural commercialization.
We developed a structured questionnaire to collect data on risk perceptions and risk
management strategies as well as about farm production and farm household characteristics.
The questionnaire was tested in three out-of-sample villages (one subsistence, one semi-

Publication II: Risk perception and pesticide use
40
subsistence and one commercial village) and refined after each test. Survey data were
collected over a five-month period between November 2011 and March 2012, using a 12-
month recall period. In each sample village we first conducted a focus group discussion with
a small group of farmers and then compiled a list of all households with the village headmen.
From this list we randomly selected 20 farm households for an interview.
Respondents were asked to indicate the level of importance of various sources of risk using a
5-point Likert scale ranging from one (not important) to five (very important). Sources of risk
were grouped into four categories, including production, market, financial as well as human
and personal risk. For each source, respondents were asked to explain how they tried to
control it and how effective each of the mentioned control methods were; again, using a 5-
point Likert scale ranging from one (useless) to five (very useful). These risk management
strategies were initially taken from the literature and refined through the pre-tests and focus
group discussions. We also quantified the value of input use and output for each crop. For
pesticide use, we recorded the product name and the quantity applied. Secondary data were
collected for each pesticide product to convert quantities of formulated product into quantities
of active ingredients.
3.3.2 Quantifying commercialization
Agricultural commercialization was quantified using farm performance indicators as
originally suggested by Dillon et al. (1993) and later applied by Tipraqsa and
Schreinemachers (2009) for a study in northern Thailand. More specifically, we used two
indicators: (1) integration into farm input markets, defined as the value of variable inputs
bought relative to the total value of variable inputs used on the farm (including seeds,
fertilizers, hormones, labor and any other inputs, but excluding pesticides); and (2)
integration into farm output markets or marketable surplus, defined as the gross farm output
sold as a quotient of the total gross farm output at average farm gate selling prices.
Integration into variable input markets = Value of variable inputs bought
Total value of variable inputs used (1)
Integration into farm output markets = Gross farm output sold
Total gross farm output (2)

Publication II: Risk perception and pesticide use
41
These two variables were transformed into z scores and then combined additively into a
single index, ranging from zero (subsistence farming) to unity (fully commercialized
farming). As based on terciles of this index, households were classified into three equal
groups, of subsistence, semi-subsistence and commercial. This allowed exploring differences
between farming systems at distinct stages of commercialization.
For ordinal variables such as Likert scales, we used the non-parametric Kruskal-Wallis test to
test if the relationship to agricultural commercialization was statistically significant. For
continuous variables, we used a pairwise t-test and Bonferroni post-hoc test. For categorical
variables including binary variables, we used a Chi-square test.
3.3.3 Regression model
Regression analysis was used to identify determinants of pesticide use and to test the
hypothesis that agricultural commercialization leads to greater pesticide use. The selected
method follows previous studies that have identified determinants of pesticide use (Carlberg,
Kostandini, and Dankyi 2012, Gong 2012, Rejesus et al. 2009).
The use of ordinary least squares to regress pesticide quantities on a set of household-level
determinants would yield incorrect results for two reasons. First, a substantial proportion of
farm households practicing subsistence agriculture have not yet adopted pesticides. Partial
adoption at the farm-level results in incidental truncation and, possibly, sample selection bias
(Baum 2006). Second, the pesticide use variable for adopters contains excess zeros because
some farm households that previously adopted pesticides decided not to use pesticides on
certain crops, such as crops used for home consumption (e.g. upland rice and taro), and
certain perennial crops that had little pest problems (e.g. coffee and tea). The former problem
can be addressed by using a stepwise estimation approach with two sequential equations, the
latter by estimating the model at the crop-level. The first equation explains farmers’ choice to
apply or not to apply pesticides, while the second equation explains farmers' choice about the
quantity of pesticides to apply.
Starting with the second equation, the amount of pesticide use is the dependent variable y and
reflects the scale of adoption. The vector of strictly exogenous variables that determines y is
denoted as xj, while zj is the vector of strictly exogenous variables that determine pesticide
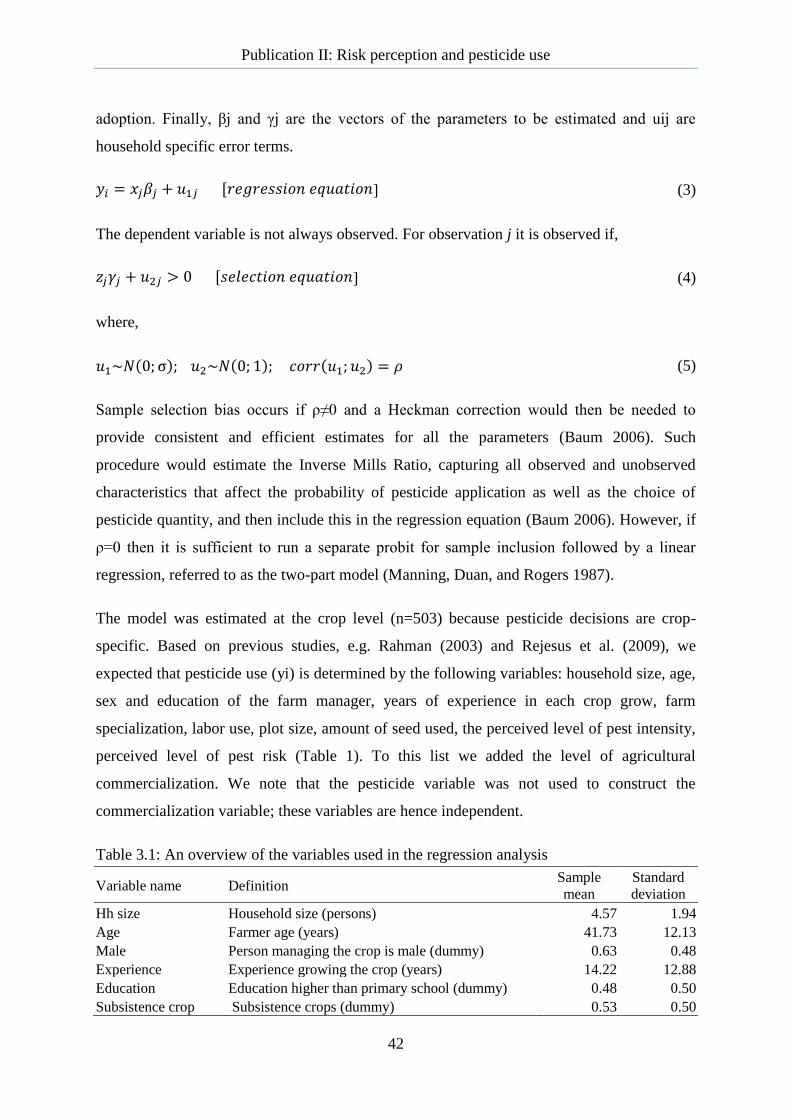
Publication II: Risk perception and pesticide use
42
adoption. Finally, βj and γj are the vectors of the parameters to be estimated and uij are
household specific error terms.
𝑦𝑖 = 𝑥𝑗𝛽𝑗 + 𝑢1𝑗 [𝑟𝑒𝑔𝑟𝑒𝑠𝑠𝑖𝑜𝑛 𝑒𝑞𝑢𝑎𝑡𝑖𝑜𝑛] (3)
The dependent variable is not always observed. For observation j it is observed if,
𝑧𝑗𝛾𝑗 + 𝑢2𝑗 > 0 [𝑠𝑒𝑙𝑒𝑐𝑡𝑖𝑜𝑛 𝑒𝑞𝑢𝑎𝑡𝑖𝑜𝑛] (4)
where,
𝑢1~𝑁(0; σ); 𝑢2~𝑁(0; 1); 𝑐𝑜𝑟𝑟(𝑢1; 𝑢2) = 𝜌 (5)
Sample selection bias occurs if ρ≠0 and a Heckman correction would then be needed to
provide consistent and efficient estimates for all the parameters (Baum 2006). Such
procedure would estimate the Inverse Mills Ratio, capturing all observed and unobserved
characteristics that affect the probability of pesticide application as well as the choice of
pesticide quantity, and then include this in the regression equation (Baum 2006). However, if
ρ=0 then it is sufficient to run a separate probit for sample inclusion followed by a linear
regression, referred to as the two-part model (Manning, Duan, and Rogers 1987).
The model was estimated at the crop level (n=503) because pesticide decisions are crop-
specific. Based on previous studies, e.g. Rahman (2003) and Rejesus et al. (2009), we
expected that pesticide use (yi) is determined by the following variables: household size, age,
sex and education of the farm manager, years of experience in each crop grow, farm
specialization, labor use, plot size, amount of seed used, the perceived level of pest intensity,
perceived level of pest risk (Table 1). To this list we added the level of agricultural
commercialization. We note that the pesticide variable was not used to construct the
commercialization variable; these variables are hence independent.
Table 3.1: An overview of the variables used in the regression analysis
Variable name Definition Sample
mean
Standard
deviation
Hh size Household size (persons) 4.57 1.94
Age Farmer age (years) 41.73 12.13
Male Person managing the crop is male (dummy) 0.63 0.48
Experience Experience growing the crop (years) 14.22 12.88
Education Education higher than primary school (dummy) 0.48 0.50
Subsistence crop Subsistence crops (dummy) 0.53 0.50
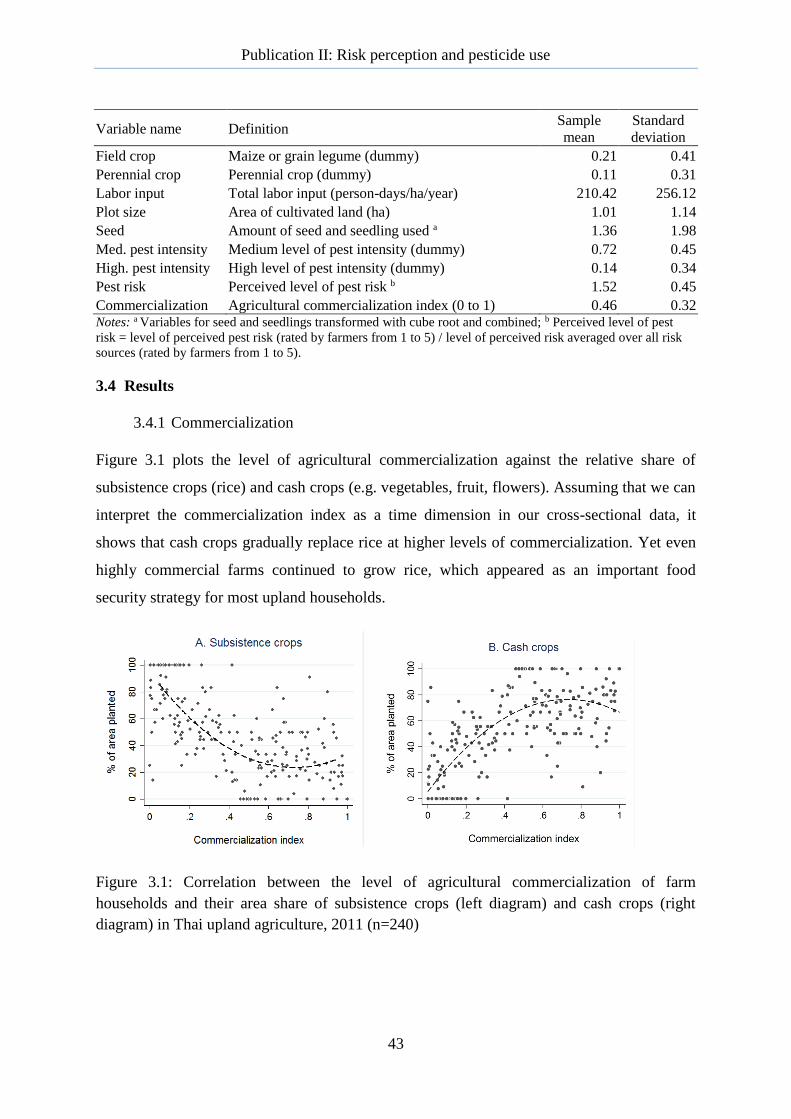
Publication II: Risk perception and pesticide use
43
Variable name Definition Sample
mean
Standard
deviation
Field crop Maize or grain legume (dummy) 0.21 0.41
Perennial crop Perennial crop (dummy) 0.11 0.31
Labor input Total labor input (person-days/ha/year) 210.42 256.12
Plot size Area of cultivated land (ha) 1.01 1.14
Seed Amount of seed and seedling used a 1.36 1.98
Med. pest intensity Medium level of pest intensity (dummy) 0.72 0.45
High. pest intensity High level of pest intensity (dummy) 0.14 0.34
Pest risk Perceived level of pest risk b 1.52 0.45
Commercialization Agricultural commercialization index (0 to 1) 0.46 0.32 Notes: a Variables for seed and seedlings transformed with cube root and combined; b Perceived level of pest
risk = level of perceived pest risk (rated by farmers from 1 to 5) / level of perceived risk averaged over all risk
sources (rated by farmers from 1 to 5).
3.4 Results
3.4.1 Commercialization
Figure 3.1 plots the level of agricultural commercialization against the relative share of
subsistence crops (rice) and cash crops (e.g. vegetables, fruit, flowers). Assuming that we can
interpret the commercialization index as a time dimension in our cross-sectional data, it
shows that cash crops gradually replace rice at higher levels of commercialization. Yet even
highly commercial farms continued to grow rice, which appeared as an important food
security strategy for most upland households.
Figure 3.1: Correlation between the level of agricultural commercialization of farm
households and their area share of subsistence crops (left diagram) and cash crops (right
diagram) in Thai upland agriculture, 2011 (n=240)
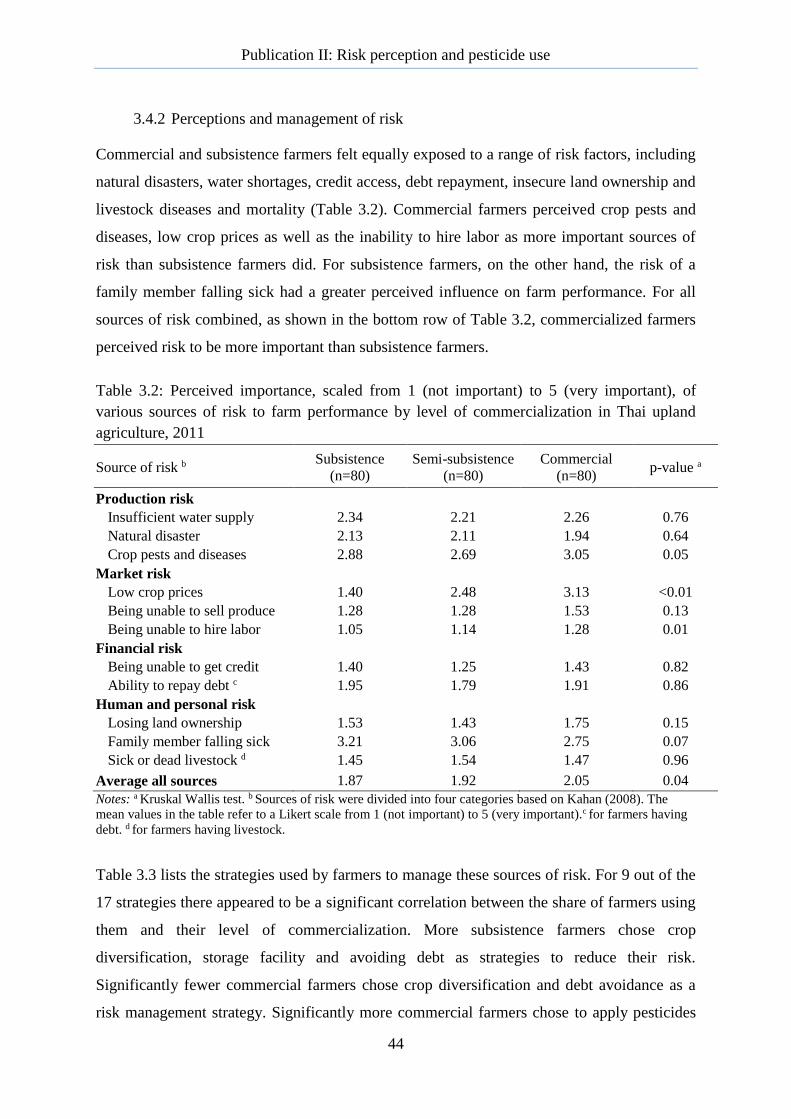
Publication II: Risk perception and pesticide use
44
3.4.2 Perceptions and management of risk
Commercial and subsistence farmers felt equally exposed to a range of risk factors, including
natural disasters, water shortages, credit access, debt repayment, insecure land ownership and
livestock diseases and mortality (Table 3.2). Commercial farmers perceived crop pests and
diseases, low crop prices as well as the inability to hire labor as more important sources of
risk than subsistence farmers did. For subsistence farmers, on the other hand, the risk of a
family member falling sick had a greater perceived influence on farm performance. For all
sources of risk combined, as shown in the bottom row of Table 3.2, commercialized farmers
perceived risk to be more important than subsistence farmers.
Table 3.2: Perceived importance, scaled from 1 (not important) to 5 (very important), of
various sources of risk to farm performance by level of commercialization in Thai upland
agriculture, 2011
Source of risk b Subsistence
(n=80)
Semi-subsistence
(n=80)
Commercial
(n=80) p-value a
Production risk
Insufficient water supply 2.34 2.21 2.26 0.76
Natural disaster 2.13 2.11 1.94 0.64
Crop pests and diseases 2.88 2.69 3.05 0.05
Market risk
Low crop prices 1.40 2.48 3.13 <0.01
Being unable to sell produce 1.28 1.28 1.53 0.13
Being unable to hire labor 1.05 1.14 1.28 0.01
Financial risk
Being unable to get credit 1.40 1.25 1.43 0.82
Ability to repay debt c 1.95 1.79 1.91 0.86
Human and personal risk
Losing land ownership 1.53 1.43 1.75 0.15
Family member falling sick 3.21 3.06 2.75 0.07
Sick or dead livestock d 1.45 1.54 1.47 0.96
Average all sources 1.87 1.92 2.05 0.04
Notes: a Kruskal Wallis test. b Sources of risk were divided into four categories based on Kahan (2008). The
mean values in the table refer to a Likert scale from 1 (not important) to 5 (very important).c for farmers having
debt. d for farmers having livestock.
Table 3.3 lists the strategies used by farmers to manage these sources of risk. For 9 out of the
17 strategies there appeared to be a significant correlation between the share of farmers using
them and their level of commercialization. More subsistence farmers chose crop
diversification, storage facility and avoiding debt as strategies to reduce their risk.
Significantly fewer commercial farmers chose crop diversification and debt avoidance as a
risk management strategy. Significantly more commercial farmers chose to apply pesticides
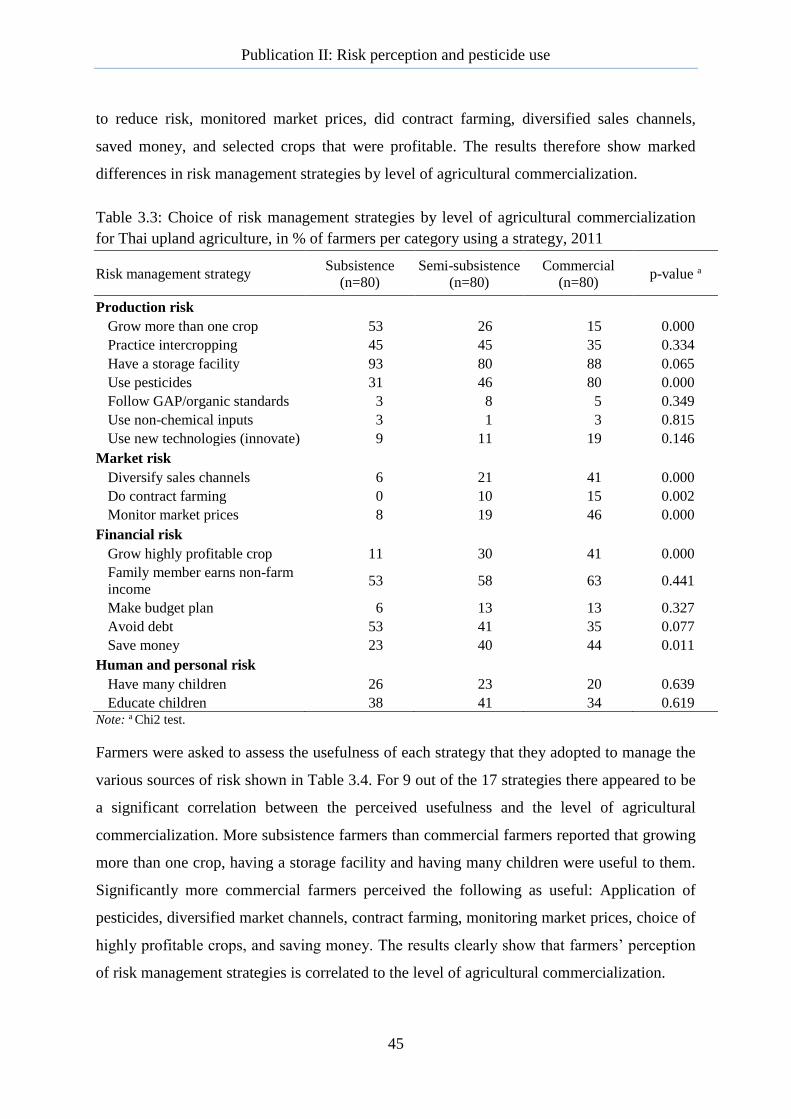
Publication II: Risk perception and pesticide use
45
to reduce risk, monitored market prices, did contract farming, diversified sales channels,
saved money, and selected crops that were profitable. The results therefore show marked
differences in risk management strategies by level of agricultural commercialization.
Table 3.3: Choice of risk management strategies by level of agricultural commercialization
for Thai upland agriculture, in % of farmers per category using a strategy, 2011
Risk management strategy Subsistence
(n=80)
Semi-subsistence
(n=80)
Commercial
(n=80) p-value a
Production risk
Grow more than one crop 53 26 15 0.000
Practice intercropping 45 45 35 0.334
Have a storage facility 93 80 88 0.065
Use pesticides 31 46 80 0.000
Follow GAP/organic standards 3 8 5 0.349
Use non-chemical inputs 3 1 3 0.815
Use new technologies (innovate) 9 11 19 0.146
Market risk
Diversify sales channels 6 21 41 0.000
Do contract farming 0 10 15 0.002
Monitor market prices 8 19 46 0.000
Financial risk
Grow highly profitable crop 11 30 41 0.000
Family member earns non-farm
income 53 58 63 0.441
Make budget plan 6 13 13 0.327
Avoid debt 53 41 35 0.077
Save money 23 40 44 0.011
Human and personal risk
Have many children 26 23 20 0.639
Educate children 38 41 34 0.619 Note: a Chi2 test.
Farmers were asked to assess the usefulness of each strategy that they adopted to manage the
various sources of risk shown in Table 3.4. For 9 out of the 17 strategies there appeared to be
a significant correlation between the perceived usefulness and the level of agricultural
commercialization. More subsistence farmers than commercial farmers reported that growing
more than one crop, having a storage facility and having many children were useful to them.
Significantly more commercial farmers perceived the following as useful: Application of
pesticides, diversified market channels, contract farming, monitoring market prices, choice of
highly profitable crops, and saving money. The results clearly show that farmers’ perception
of risk management strategies is correlated to the level of agricultural commercialization.
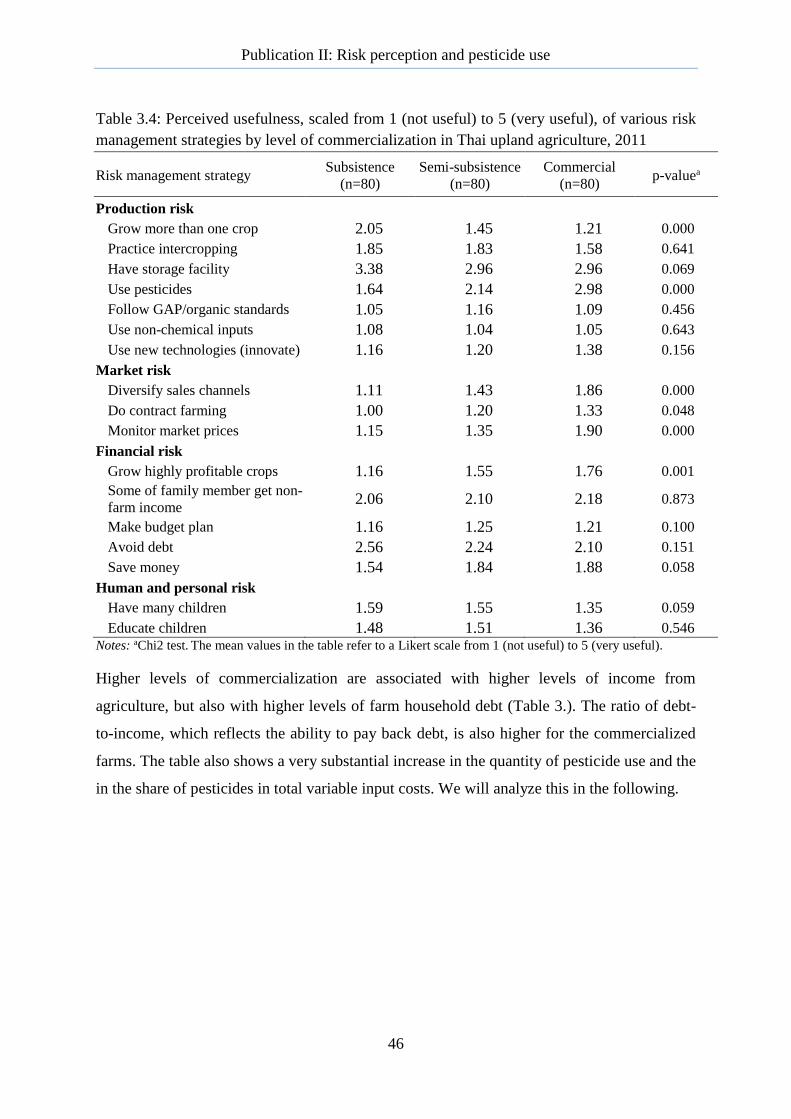
Publication II: Risk perception and pesticide use
46
Table 3.4: Perceived usefulness, scaled from 1 (not useful) to 5 (very useful), of various risk
management strategies by level of commercialization in Thai upland agriculture, 2011
Risk management strategy Subsistence
(n=80)
Semi-subsistence
(n=80)
Commercial
(n=80) p-valuea
Production risk
Grow more than one crop 2.05 1.45 1.21 0.000
Practice intercropping 1.85 1.83 1.58 0.641
Have storage facility 3.38 2.96 2.96 0.069
Use pesticides 1.64 2.14 2.98 0.000
Follow GAP/organic standards 1.05 1.16 1.09 0.456
Use non-chemical inputs 1.08 1.04 1.05 0.643
Use new technologies (innovate) 1.16 1.20 1.38 0.156
Market risk
Diversify sales channels 1.11 1.43 1.86 0.000
Do contract farming 1.00 1.20 1.33 0.048
Monitor market prices 1.15 1.35 1.90 0.000
Financial risk
Grow highly profitable crops 1.16 1.55 1.76 0.001
Some of family member get non-
farm income 2.06 2.10 2.18 0.873
Make budget plan 1.16 1.25 1.21 0.100
Avoid debt 2.56 2.24 2.10 0.151
Save money 1.54 1.84 1.88 0.058
Human and personal risk
Have many children 1.59 1.55 1.35 0.059
Educate children 1.48 1.51 1.36 0.546
Notes: aChi2 test. The mean values in the table refer to a Likert scale from 1 (not useful) to 5 (very useful).
Higher levels of commercialization are associated with higher levels of income from
agriculture, but also with higher levels of farm household debt (Table 3.). The ratio of debt-
to-income, which reflects the ability to pay back debt, is also higher for the commercialized
farms. The table also shows a very substantial increase in the quantity of pesticide use and the
in the share of pesticides in total variable input costs. We will analyze this in the following.

Publication II: Risk perception and pesticide use
47
Table 3.5 Pesticide use, agricultural income, pesticide costs and household debt by level of
agricultural commercialization for Thai upland agriculture, 2011
Subsistence
(n=80)
Semi-
subsistence
(n=80)
Commercial
(n=80)
Correlation
coefficienta p-valuea
Cash income from agriculture
(USD/hh/year)
59 908 3,563 0.37 <0.01
Household debt (USD/hh) 299 432 1,020 0.26 <0.01
Quantity of pesticide use
(kg/ha/year)
2.7 2.8 21.5 0.33 <0.01
Share of pesticide cost in total
variable cost (%)
3.32 4.18 21.63 0.33 <0.01
Note: a Pairwise correlation (t-test); n=240.
3.4.3 Role of pesticides
Agricultural commercialization is associated with an exponential increase in pesticide use
(Figure 3.2). Yet there is high level of variation in pesticide quantities, which was analyzed
using the regression model.
Figure 3.2: Amount of pesticide use by farm household plotted against the level of
agricultural commercialization for Thai upland agriculture, 2011
The correlation between the error terms of the equations (1) and (2) was ρ=0.343, but it was
not statistically significant (p>|z|=0.576). This suggests that sample selection bias is not an
issue in our data. It is therefore not necessary to use a Heckman correction and a simple two-
part model is sufficient. Multicollinearity was also not an issue in the regression equations as
the variance inflation factor was below 3.5 for all independent variables.

Publication II: Risk perception and pesticide use
48
The selection model had a goodness-of-fit of 0.31 (pseudo R2) and the model explaining the
quantity of pesticide use had a goodness-of-fit of 0.32 (R2) as shown in Table 3.6. The
marginal effects in the probit regression suggest that a switch from subsistence to commercial
farming increases the probability of pesticide use by 38%; and the exposure to high pest
intensity increases the probability of pesticide use by 23%. The level of perceived pest risk is
not a significant determinant of whether or not pesticides are used. The coefficients also show
that subsistence and perennial crops are negatively associated with pesticide use while a
larger plot size is positively associated with pesticide use.
The right-hand side of the table shows factors that explain the level of pesticide use
conditional on households having adopted pesticides on a particular crop. Interpreting the
exponentiated coefficient, it can be said that an increase in agricultural commercialization
proliferates the quantity of pesticide use by 105% for those households who apply pesticides.
The results also show that pesticide risk perception is significantly (p<0.05) and positively
associated with levels of pesticide use. This confirms that farmers apply greater quantities of
pesticides as a strategy to reduce risk.
Contrary to the probit selection model, the OLS regression shows that farmers use a lower
application rate if they cultivate larger plots. This is consistent with the idea that smaller plots
are cultivated more intensively. The results also show that farmers apply fewer pesticides on
subsistence crops than on cash crops. Contrary to the results of the selection equation, a high
intensity of pest pressure is associated with a higher application of pesticides. Labor use per
hectare has a positive and significant effect on the pesticide application rate, which makes
sense because spraying is done manually.
Table 3.6: Determinants of pesticide adoption (left equation) and pesticide application rate
(conditional on adoption; right equation) for Thai upland agriculture, 2011
Explanatory variables
Pesticide application
(Probit selection equation)
Quantity of pesticide use,
ln(kg/ha)
Coefficient SE p-value Coefficient SE p-value
Hh size (persons, lna) 0.222 0.171 0.193 0.041 0.403 0.920
Age (years, lna) -0.053 0.260 0.838 -0.110 0.557 0.843
Male farmer (=1) 0.084 0.145 0.562 -0.203 0.331 0.539
Experience (years, lna) 0.009 0.071 0.895 0.123 0.156 0.430
Education (high = 1) -0.220 0.158 0.164 0.578 0.351 0.101
Subsistence crops ( = 1) -1.248 0.279 0.000 -1.784 0.517 0.001
Maize or grain legume (=1) -0.470 0.311 0.131 0.545 0.521 0.297
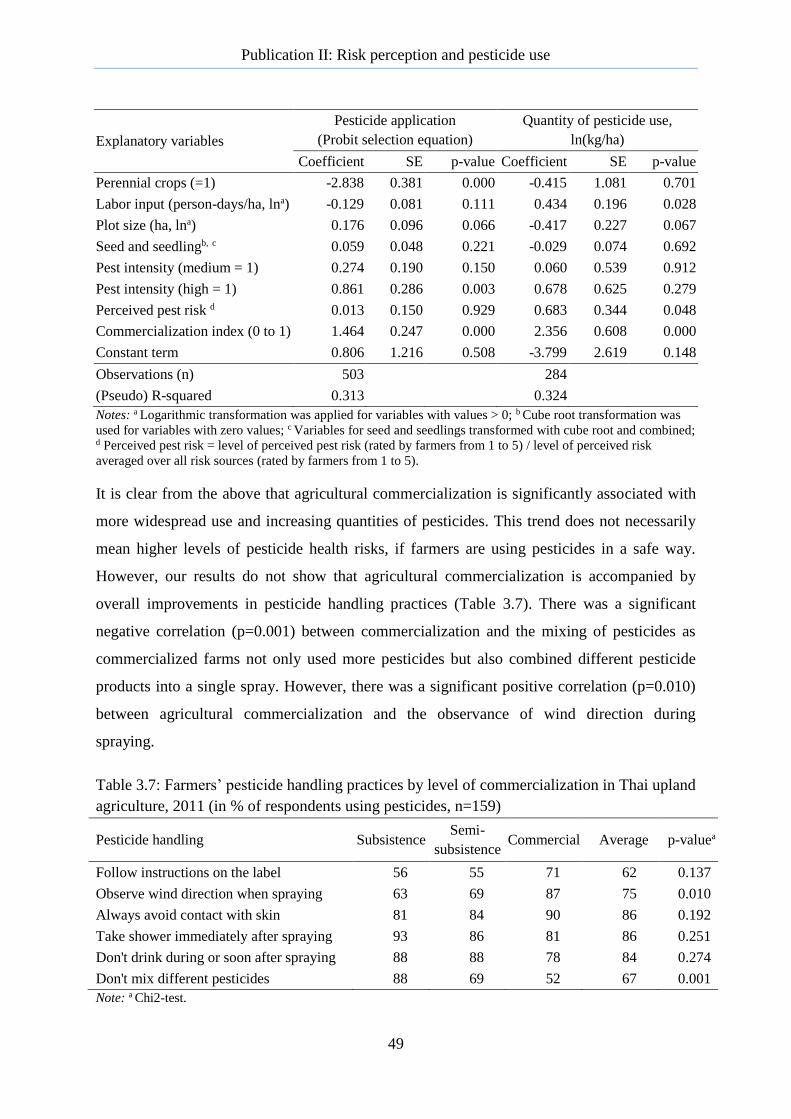
Publication II: Risk perception and pesticide use
49
Explanatory variables
Pesticide application
(Probit selection equation)
Quantity of pesticide use,
ln(kg/ha)
Coefficient SE p-value Coefficient SE p-value
Perennial crops (=1) -2.838 0.381 0.000 -0.415 1.081 0.701
Labor input (person-days/ha, lna) -0.129 0.081 0.111 0.434 0.196 0.028
Plot size (ha, lna) 0.176 0.096 0.066 -0.417 0.227 0.067
Seed and seedlingb, c 0.059 0.048 0.221 -0.029 0.074 0.692
Pest intensity (medium = 1) 0.274 0.190 0.150 0.060 0.539 0.912
Pest intensity (high = 1) 0.861 0.286 0.003 0.678 0.625 0.279
Perceived pest risk d 0.013 0.150 0.929 0.683 0.344 0.048
Commercialization index (0 to 1) 1.464 0.247 0.000 2.356 0.608 0.000
Constant term 0.806 1.216 0.508 -3.799 2.619 0.148
Observations (n) 503 284
(Pseudo) R-squared 0.313 0.324
Notes: a Logarithmic transformation was applied for variables with values > 0; b Cube root transformation was
used for variables with zero values; c Variables for seed and seedlings transformed with cube root and combined; d Perceived pest risk = level of perceived pest risk (rated by farmers from 1 to 5) / level of perceived risk
averaged over all risk sources (rated by farmers from 1 to 5).
It is clear from the above that agricultural commercialization is significantly associated with
more widespread use and increasing quantities of pesticides. This trend does not necessarily
mean higher levels of pesticide health risks, if farmers are using pesticides in a safe way.
However, our results do not show that agricultural commercialization is accompanied by
overall improvements in pesticide handling practices (Table 3.7). There was a significant
negative correlation (p=0.001) between commercialization and the mixing of pesticides as
commercialized farms not only used more pesticides but also combined different pesticide
products into a single spray. However, there was a significant positive correlation (p=0.010)
between agricultural commercialization and the observance of wind direction during
spraying.
Table 3.7: Farmers’ pesticide handling practices by level of commercialization in Thai upland
agriculture, 2011 (in % of respondents using pesticides, n=159)
Pesticide handling Subsistence Semi-
subsistence Commercial Average p-valuea
Follow instructions on the label 56 55 71 62 0.137
Observe wind direction when spraying 63 69 87 75 0.010
Always avoid contact with skin 81 84 90 86 0.192
Take shower immediately after spraying 93 86 81 86 0.251
Don't drink during or soon after spraying 88 88 78 84 0.274
Don't mix different pesticides 88 69 52 67 0.001
Note: a Chi2-test.
Publication II: Risk perception and pesticide use
50
3.5 Discussion
Agriculture inherently is a risky business. This is especially true for developing countries
where government support for agriculture is much weaker than in developed countries, with
limited public social security guarantees to fall back onto if farm operations fail. Therefore it
is important to better understand the sources of risk to which farm operations are exposed.
The contribution of this paper is to show that not all farms are equally exposed to each source
of risk and that there is much variation in farm-level decisions on how to manage risk. Most
importantly, the study illustrated that risk sources and management are strongly associated
with the level of agricultural commercialization.
For farmers who are predominantly subsistence-oriented, personal health is a major source of
risk to farm performance, as are factors affecting crop production, such as water supply,
natural disasters and crop pests and diseases. Predominantly market-oriented farmers are even
more concerned with crop pests and diseases, but also with low crop prices and the ability to
hire enough outside labor for their farm. This finding is important for social as well as
agricultural policies and shows that a diversity of approaches towards mitigating risks is
needed.
To manage risk in subsistence agriculture, farmers use crop diversification and intercropping,
try to store enough rice for own consumption on the farm, try to employ household members
outside agriculture, and avoid debt. Storing enough food on the farm and employing family
members outside agriculture were also important for commercially-oriented farmers. Other
key strategies for these farmers included diversification of sales channels, growing crops that
are profitable, monitoring market prices, using pesticides and saving money all of which
were only of minor importance to subsistence-oriented farmers. Hence, there are marked
differences in risk management by levels of commercialization. Agricultural policies thus
need to strengthen farmers' risk management capacities in more than one way. For instance,
Thai government agencies could focus on crop diversification in areas where farming is
subsistence-oriented, while promoting market diversification in places where commercial
farming dominates.
Another key finding of our study is the strong association between agricultural
commercialization and the use of pesticides. The average subsistence farm used pesticides at
2.7 kg/ha, while the average commercial farms used 21.5 kg/ha (the global average is about

Publication II: Risk perception and pesticide use
51
3.6 kg/ha according to Schreinemachers and Tipraqsa, (2012)). We showed that this increase
has not been accompanied by a safer use of these chemicals, potentially increasing health
risks. Amplified pesticide health risk tends to be neglected or underappreciated by farmers.
As a case in point, such hazards were not mentioned as a major source of risk by the farmers
during the focus group discussions that preceded the questionnaire survey. It is well-
documented that farmers in lower income countries have limited awareness about the risk of
pesticides and therefore do not use enough protection (Ngowi et al. 2007, Oluwole and Cheke
2009, Riwthong et al. 2015, Snelder, Masipiqueña, and de Snoo 2008).
The logical conclusion is that the promotion of cash crops such as vegetables, fruit and
flowers needs to be accompanied by greater efforts to support alternative methods of pest
management and to raise awareness about the negative health effects of pesticides. Our study
also found that farmers growing high-value perennial crops, such as tea and coffee, use much
less pesticides than seasonal cash crops (0.14 kg/ha for perennials as compared to 24.5 kg/ha
for seasonal cash crops), while having a comparable level of income. However, the
production of quality coffee and tea requires particular agro-ecological conditions, and is not
equally suitable everywhere in the Thai uplands. Production is furthermore prone to supply
gluts on global markets; hence farmers face increased market risks.
The findings of this study are relevant to other developing countries, because land use
intensification and agricultural commercialization are global phenomena. More detailed
policy-oriented studies would be useful to identify policy options that support farmers in their
transition to market-oriented production. This study supports the notion that pathways to
sustainable agriculture are location-specific. It highlights the consequent need to strengthen
local capacities in agricultural research and extension to deal with the challenges rather than
formulating a one size fits all policy for all farmers.
3.6 Conclusion
Thai upland agriculture is transforming from subsistence-based rice farming to the intensive
production of high value cash crops. This process has a profound impact on farmers’ risk
exposure, perceptions of risk and their choice of risk management strategies. With
commercialization, market prices and pests and diseases become the most prominent sources
of risk to farm performance. Farmers respond by monitoring market prices, diversifying sales
channels and applying large quantities of synthetic pesticides. Crop diversification, on the

Publication II: Risk perception and pesticide use
52
other hand, tends to become a less important risk management strategy for commercial farms,
which might further stimulate pesticide use. Average levels of pesticide use on subsistence
farms was 2.7 kg/ha, while commercial farms used 21.5 kg/ha. This rapid increase, under
conditions of poor pesticide handling practices, exposes farmers to health risks, which they,
however, do not fully recognize. There is a need for a diversified approach to agricultural
research and extension that captures the different challenges and opportunities of farmers at
varying levels of commercialization.
3.7 Acknowledgement
This study was financially supported by Mrs. Edith-Karla Eiselen commemorating her late
husband Dr Hermann Eiselen, founder of the Fiat Panis Foundation. Additional contributions
from the Deutsche Forschungsgemeinschaft (DFG) for SFB-564 are acknowledged. The
second author acknowledges Humidtropics, a CGIAR Research Program that aims to develop
new opportunities for improved livelihoods in a sustainable environment.
3.8 References
Aimin, H., 2010. Uncertainty, Risk Aversion and Risk Management in Agriculture.
Agriculture and Agricultural Science Procedia 1, 152-156.
Akcaoz, H., 2012. Risk Management in Agricultural Production: Case Studies from Turkey.
Academy Publish, Wyoming, U.S.A.
Baum, C.F., 2006. An introduction to modern econometrics using Stata. Stata press, Texas.
Carlberg, Eric, Genti Kostandini, and Awere Dankyi. 2012. The Effects of Integrated Pest
Management Techniques (IPM) Farmer Field Schools on Groundnut Productivity:
Evidence from Ghana, selected paper prepared for presentation at the Agricultural &
Applied Economics Associations 2012 Annual Meeting.
Dillon, J.L., Hardaker, J.B., Food, Nations, A.O.o.t.U., 1993. Farm management research for
small farmer development. Food and Agriculture Organization of the United Nations.
Gong, Yazhen. 2012. Farmers' risk preferences and pesticide use decisions: evidence from
field experiments in China. College of Environmental Sciences and Engineering and
National School of Development, Peking University, Beijing 100871 China.
Harwood, J.L., Heifner, R., Coble, K., Perry, J., Somwaru, A., 1999. Managing risk in
farming: concepts, research, and analysis. US Department of Agriculture, Economic
Research Service.
Jayne, T.S., Haggblade, S., Minot, N., Rashid., S., 2011. Agricultural Commercialization,
Rural Transformation and Poverty Reduction: What have We Learned about How to
Achieve This? Synthesis Report.
Kahan, D., 2008. Managing risk in farming. Food and agriculture organization of the united
nations.
Liu, E.M., Huang, J., 2013. Risk preferences and pesticide use by cotton farmers in China.
Journal of Development Economics 103, 202-215.

Publication II: Risk perception and pesticide use
53
Manning, W.G., Duan, N., Rogers, W.H., 1987. Monte Carlo evidence on the choice between
sample selection and two-part models. Journal of econometrics 35, 59-82.
Ngowi, A.V.F., Mbise, T.J., Ijani, A.S.M., London, L., Ajayi, O.C., 2007. Smallholder
vegetable farmers in Northern Tanzania: Pesticides use practices, perceptions, cost
and health effects. Crop Protection 26, 1617-1624.
Oluwole, O., Cheke, R.A., 2009. Health and environmental impacts of pesticide use
practices: a case study of farmers in Ekiti State, Nigeria. International Journal of
Agricultural Sustainability 7, 153-163.
Pandey, S., 2006. Upland rice, household food security, and commercialization of upland
agriculture in Vietnam. International Rice Research Institute (IRRI), Los Banos,
Philippines.
Pingali, P.L., Rosegrant, M.W., 1995. Agricultural commercialization and diversification:
processes and policies. Food Policy 20, 171-185.
Rahman, S., 2003. Farm-level pesticide use in Bangladesh: determinants and awareness.
Agriculture, Ecosystems & Environment 95, 241-252.
Rejesus, R.M., Palis, F.G., Lapitan, A.V., Chi, T.T.N., Hossain, M., 2009. The impact of
integrated pest management information dissemination methods on insecticide use
and efficiency: evidence from rice producers in South Vietnam. Applied Economic
Perspectives and Policy 31, 814-833.
Rerkasem, K., 1998. Shifting Cultivation in Thailand: Land Use Changes in the Context of
National Development. ACIAR Proceedings 87, 54-63.
Riwthong, S., Schreinemachers, P., Grovermann, C., Berger, T., 2015. Land use
intensification, commercialization and changes in pest management of smallholder
upland agriculture in Thailand. Environmental Science & Policy 45, 11-19.
Schreinemachers, P., Tipraqsa, P., 2012. Agricultural pesticides and land use intensification
in high, middle and low income countries. Food Policy 37, 616-626.
Snelder, D.J., Masipiqueña, M.D., de Snoo, G.R., 2008. Risk assessment of pesticide usage
by smallholder farmers in the Cagayan Valley (Philippines). Crop Protection 27, 747-
762.
Tipraqsa, P., Schreinemachers, P., 2009. Agricultural commercialization of Karen Hill tribes
in northern Thailand. Agricultural Economics 40, 43-53.
Vanwambeke, S.O., Somboon, P., Lambin, E.F., 2007. Rural transformation and land use
change in northern Thailand. Journal of Land Use Science 2, 1-29.
von Braun, J., 1995. Agricultural commercialization: impacts on income and nutrition and
implications for policy. Food Policy 20, 187-202.
Waibel, Hermann. 1990. Pesticide subsidies and the diffusion of IPM in rice in Southeast
Asia: the case of Thailand. Plant Protection Bulletin, FAO 38 (2):105-111.
Zeller, M., Ufer, S., Van, D.T.T., Nielsen, T., Schreinemachers, P., Tipraqsa, P., Berger, T.,
Saint-Macary, C., Keil, A., Dung, P.T.M., 2013. Policies for sustainable development:
the commercialization of smallholder agriculture, Sustainable Land Use and Rural
Development in Southeast Asia: Innovations and Policies for Mountainous Areas.
Springer, pp. 463-490.
Publication III: Can public GAP standards reduce agricultural pesticide use?
54
4 Publication III
Can Public GAP Standards Reduce Agricultural Pesticide Use?
The Case of Fruit and Vegetable Farming in Northern Thailand3
Pepijn Schreinemachers a,b, Iven Schad b,c, Prasnee Tipraqsa b, Pakakrong M. Williams b,c,
Andreas Neef d, Suthathip Riwthong a,b, Walaya Sangchan b,e, Christian Grovermann a,b
a Dept. of Land Use Economics in the Tropics and Subtropics, Universität Hohenheim, 70593
Stuttgart, Germany
b The Uplands Program, Faculty of Agriculture, Chiang Mai University, Chiang Mai 50200,
Thailand
c Dept. of Agricultural Communication and Extension, Universität Hohenheim, 70593
Stuttgart, Germany
d Graduate School of Global Environmental Studies, Kyoto University, Yoshida-Honmachi,
Sakyo-ku, Kyoto, 606-8501, Japan
e Biogeophysics Section, Institute of Soil Science and Land Evaluation, Universität
Hohenheim, 70593 Stuttgart Germany
3 Paper has been published with Agriculture and Human Values, 2012, Vol. 29(4), Pages 519-529. DOI:
10.1007/s10460-012-9378-6

Publication III: Can public GAP standards reduce agricultural pesticide use?
55
4.1 Abstract
In response to the chronic overuse and misuse of pesticides in agriculture, governments in
Southeast Asia have sought to improve food safety by introducing public standards of Good
Agricultural Practices (GAP). Using quantitative farm-level data from an intensive horticultural
production system in northern Thailand, we test if fruit and vegetable producers who follow the
public GAP standard use fewer and less hazardous pesticides than producers who do not adhere
to the standard. The results show that this is not the case. By drawing on qualitative data from
expert interviews and an action research project with local litchi producers we explain the
underlying reasons for the absence of significant differences. The qualitative evidence points at
poor implementation of farm auditing related to a program expansion that was too rapid, at a
lack of understanding among farmers about the logic of the control points in the standard, and
at a lack of alternatives given to farmers to manage their pest problems. We argue that by
focusing on the testing of farm produce for pesticide residues, the public GAP program is
paying too much attention to the consequences rather than the root cause of the pesticide
problem; it needs to balance this by making a greater effort to changing on-farm practices.
Keywords: Certification; food safety; food standards; Good Agricultural Practice; pesticide
contamination; Southeast Asia.

Publication III: Can public GAP standards reduce agricultural pesticide use?
56
4.2 Introduction
Chronic overuse and misuse of agricultural pesticides characterizes crop production in many
parts of Southeast Asia as well as in China, exposing farmers, consumers and ecological
systems to the risk of pesticides (Xu et al. 2008; Schreinemachers et al. 2011; Mazlan and
Mumford 2005; Van Hoi et al. 2009; Lamers et al. 2011; Panuwet et al. 2008). To address this
problem, several countries in the region have recently introduced public standards of Good
Agricultural Practices (GAP) aimed at increasing the supply of safe and high quality food by
promoting a more sustainable crop production that uses fewer pesticides.
Like many other countries undergoing rapid economic development, Thailand is experiencing a
very sharp increase in pesticide use, such that per hectare use of active ingredients grew by 11
percent per annum from 1997 to 2010 (Praneetvatakul et al. 2011). The contamination of food
with pesticides is a serious problem in Thailand, as has been highlighted by many scholars (e.g.
Athisook et al. 2007, Hongsibsong et al. 2007, Posri et al. 2006, Tanabe et al. 1991). Recent
instances of contamination of food exports with pesticide residues and the resulting restrictions
imposed by importing countries point to the importance of the issue. At the same time the Thai
government is trying to strengthen the country’s position as a major exporter of fresh fruit and
vegetables.
The first objective of this study is to test whether farm managers using a public GAP standard
do indeed apply fewer synthetic pesticides than farmers who do not follow such a standard and
whether they select pesticides that are on average less hazardous to human health. The second
objective is to understand the reasons why public GAP standards do or do not contribute to
reducing agricultural pesticide use. These two objectives are addressed by combining
quantitative data from a random sample of farm managers in northern Thailand with qualitative
data from interviews with Thai government authorities and an action research project which
focuses on a group of farmers using the public GAP standard.
The wider empirical relevance of our study stems from the fact that although many countries in
Southeast Asia, such as Indonesia, Malaysia, Philippines, Thailand and Vietnam, have recently
introduced public GAP standards, published studies on the impact of these programs remain
few in number. This study hence examines the public GAP standard in Thailand as a test case
for other countries in the region. Studying pomelo (Citrus maxima) growers in the Northeast of
Thailand, Amekawa (forthcoming) observed a broad participation of small-scale farmers in the
Publication III: Can public GAP standards reduce agricultural pesticide use?
57
program, while at the same time concluded that their compliance with control points was very
poor. He attributed this to a lack of understanding among farmers of the GAP principles and a
lack of economic rewards as certification did not give farmers access to higher value markets.
Understanding the strengths and weaknesses of public GAP standards is important also because
member countries of the Association of South East Asian Nations (ASEAN) are in the process
of harmonizing their national public GAP standards in order to promote the mutual acceptance
of standards across their borders, and thereby enhance trade opportunities.
Our study is of particular relevance as it helps to understand in how far public standards could
be a viable alternative to private standards such as GlobalGAP—a standard developed by a
consortium of European retailers, which has become the leading GAP standard globally
(Humphrey 2006, Tallontire et al. 2011). Although some studies have shown that the use of
private standards in developing countries increases farm incomes and lowers pesticide-related
health costs (e.g. Okello and Swinton 2010), the majority of studies has been rather critical.
Some studies have shown that having to comply with private standards acts as a non-tariff trade
barrier, which limits the competitiveness of lower income countries (e.g. Chen et al. 2008;
Wilson and Otsuki 2004, Henson and Jaffee 2008). Other studies have raised concerns about
the democratic legitimacy of private standards (e.g. Busch 2009, Fuchs et al. 2011), while
others have pointed at the high levels of investment that favor large-scale producers over
smallholder farmers (e.g. DeLind and Howard 2008, Amekawa 2009). As smallholder farming
is the dominant form of agriculture in Southeast Asia, public GAP certification, which is free
of charge to farmers, might be a better alternative in the region. Yet we note that a direct
comparison between public and private standards is beyond the scope of this study.
The next section begins with an account of the three types of data used in this study:
Qualitative data from interviews with government officers, quantitative data from a farm
household survey and qualitative data based on action research. The subsequent three sections
will present the results of each type of data collected: First, describing the development of GAP
standards in Thailand based on interviews with the government officers; second, comparing
pest management practices and pesticide use between farmers who do and farmers who do not
follow the public GAP guidelines based on quantitative data from structured farm surveys; and
third, analyzing the underlying incentives for farmers to comply with the standard as well as
potential constraints on compliance based on action research data. The final section reflects
Publication III: Can public GAP standards reduce agricultural pesticide use?
58
upon the results in light of previous studies and draws policy relevant conclusions with respect
to improving public standards.
4.3 Methods and data
4.3.1 Combining qualitative with quantitative methods
To better understand the workings of the public GAP certification process in Thailand, we
conducted expert interviews with senior government officials in charge of the program. We
interviewed the head of the Q-GAP program in Bangkok to determine the objectives of the
program, its organization, its size and current challenges. We also interviewed the regional
program director in Chiang Mai to better understand how the GAP standard is implemented
and how the auditing is being conducted. Lastly, we interviewed an officer at a government
laboratory in Chiang Mai to learn how the testing for pesticide residues is being carried out.
Using a structured questionnaire, we further interviewed 295 farm managers in one watershed
in northern Thailand who use an intensive horticultural production system, as introduced in the
following subsection. The survey involved a twelve month recall period, from April 2009 to
March 2010, and recorded detailed information on crop management practices, pesticide use,
pesticide handling and household characteristics. It was found that 50 farm managers follow
the public GAP guidelines on at least one of their plots, with five also following GlobalGAP.
We dropped these latter five from our analysis, as our focus is on the public GAP. The survey
data allowed us to quantify factual differences between the farmers and their cropping cycle,
which is those using and those not using the public GAP standard. In order to explain these
differences and to obtain a more thorough understanding of how public GAP standards change
farming practices, we complemented the survey data with qualitative data collected in the same
study area, but independently from the survey. Both the quantitative and qualitative data were
collected as part of a larger research program with more broadly defined objectives.
The qualitative part of the project employed an action research method in which two
researchers supported by two assistants linked a group of about 100 farm managers growing
litchis directly to high value markets, and then observed the opportunities and constraints that
this situation brought about. Litchi was selected because it is the most important crop by area in
the study site and because several authors of this study have been involved in an action-
research project on litchi marketing networks in the area, providing direct and unique insights
Publication III: Can public GAP standards reduce agricultural pesticide use?
59
into the reality of the public certification process (see Tremblay and Neef 2009). The high
value markets consisted of a British hypermarket chain that aims to buy directly from growers
and requires public GAP certification, and of exporters to the European Union, which require
GlobalGAP certification. As the emphasis of this paper is on public certification, we will report
only on the first marketing channel. The role of the researchers was to facilitate the contact
between the group of farmers, the government agencies implementing the public GAP scheme
and the agent for the hypermarket chain. Through this role, the researchers were able to collect
data from participant observations during farmer meetings. Additional data were gathered from
individual interviews that focused on farmers’ perceptions of the standard as well as the
motivations and constraints they experience in terms of standard compliance. All interviews
were recorded and transcribed, and observational data was kept in a standardized form which
was analyzed using content analysis, in line with Mayring (2003).
The combination of three data collection methods allows us to look at the public GAP program
from different angles. While the quantitative part makes it possible to statistically test for
differences in pesticide use, the action-research approach is more useful for explaining possible
differences, while the expert interviews help seeing the case study in the wider context of
program objectives and their implementation.
4.3.2 Study area
We selected the Mae Sa watershed in Chiang Mai Province in the north of Thailand as the
study area for farm-level data collection (Figure 4.1). This watershed is characterized as having
a good level of access to input and output markets, and contains intensive upland agriculture.
The combination of high levels of pesticide use and a relatively large number of farmers in the
public GAP program made it a suitable area to use for the study. The main crops grown in the
area are litchis, which are grown on the slopes, and bell peppers, which are grown in
greenhouses in the watershed’s central valley. Other crops grown include tomatoes and
cucumbers—both grown in greenhouses, and chayote (Sechium edule), cabbages, lettuce,
chrysanthemum and roses.
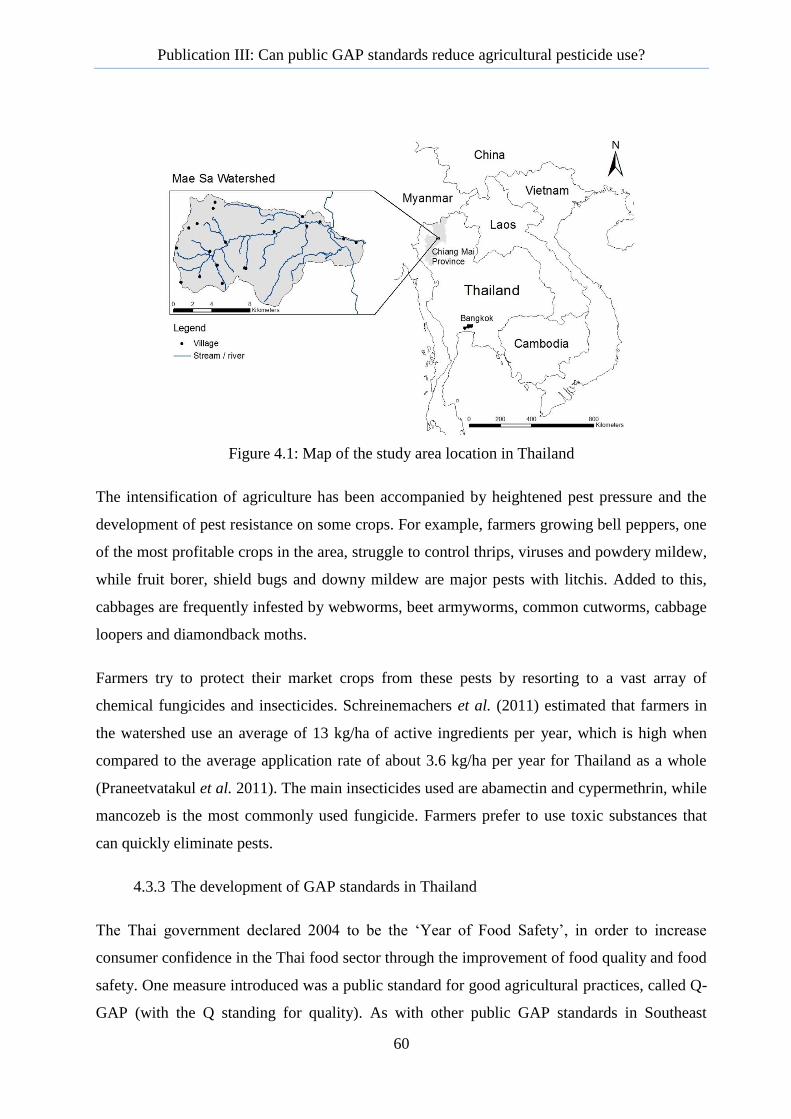
Publication III: Can public GAP standards reduce agricultural pesticide use?
60
Figure 4.1: Map of the study area location in Thailand
The intensification of agriculture has been accompanied by heightened pest pressure and the
development of pest resistance on some crops. For example, farmers growing bell peppers, one
of the most profitable crops in the area, struggle to control thrips, viruses and powdery mildew,
while fruit borer, shield bugs and downy mildew are major pests with litchis. Added to this,
cabbages are frequently infested by webworms, beet armyworms, common cutworms, cabbage
loopers and diamondback moths.
Farmers try to protect their market crops from these pests by resorting to a vast array of
chemical fungicides and insecticides. Schreinemachers et al. (2011) estimated that farmers in
the watershed use an average of 13 kg/ha of active ingredients per year, which is high when
compared to the average application rate of about 3.6 kg/ha per year for Thailand as a whole
(Praneetvatakul et al. 2011). The main insecticides used are abamectin and cypermethrin, while
mancozeb is the most commonly used fungicide. Farmers prefer to use toxic substances that
can quickly eliminate pests.
4.3.3 The development of GAP standards in Thailand
The Thai government declared 2004 to be the ‘Year of Food Safety’, in order to increase
consumer confidence in the Thai food sector through the improvement of food quality and food
safety. One measure introduced was a public standard for good agricultural practices, called Q-
GAP (with the Q standing for quality). As with other public GAP standards in Southeast
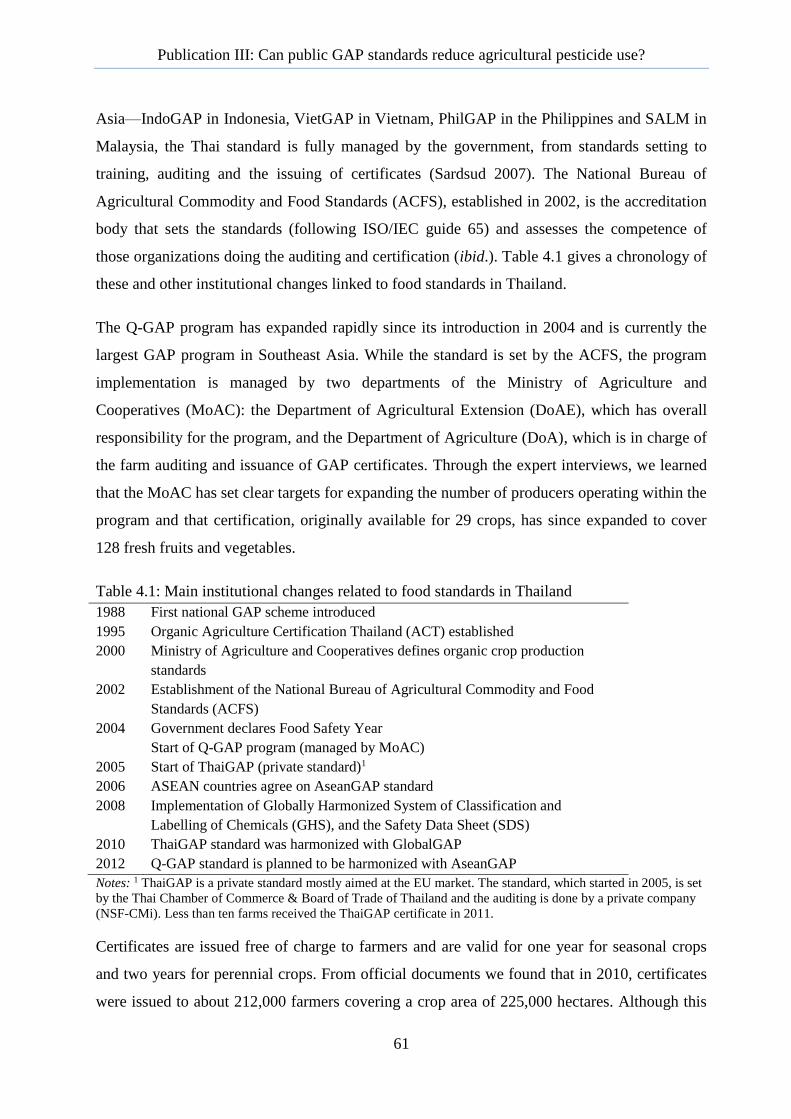
Publication III: Can public GAP standards reduce agricultural pesticide use?
61
Asia—IndoGAP in Indonesia, VietGAP in Vietnam, PhilGAP in the Philippines and SALM in
Malaysia, the Thai standard is fully managed by the government, from standards setting to
training, auditing and the issuing of certificates (Sardsud 2007). The National Bureau of
Agricultural Commodity and Food Standards (ACFS), established in 2002, is the accreditation
body that sets the standards (following ISO/IEC guide 65) and assesses the competence of
those organizations doing the auditing and certification (ibid.). Table 4.1 gives a chronology of
these and other institutional changes linked to food standards in Thailand.
The Q-GAP program has expanded rapidly since its introduction in 2004 and is currently the
largest GAP program in Southeast Asia. While the standard is set by the ACFS, the program
implementation is managed by two departments of the Ministry of Agriculture and
Cooperatives (MoAC): the Department of Agricultural Extension (DoAE), which has overall
responsibility for the program, and the Department of Agriculture (DoA), which is in charge of
the farm auditing and issuance of GAP certificates. Through the expert interviews, we learned
that the MoAC has set clear targets for expanding the number of producers operating within the
program and that certification, originally available for 29 crops, has since expanded to cover
128 fresh fruits and vegetables.
Table 4.1: Main institutional changes related to food standards in Thailand
1988 First national GAP scheme introduced
1995 Organic Agriculture Certification Thailand (ACT) established
2000 Ministry of Agriculture and Cooperatives defines organic crop production
standards
2002 Establishment of the National Bureau of Agricultural Commodity and Food
Standards (ACFS)
2004 Government declares Food Safety Year
Start of Q-GAP program (managed by MoAC)
2005 Start of ThaiGAP (private standard)1
2006 ASEAN countries agree on AseanGAP standard
2008 Implementation of Globally Harmonized System of Classification and
Labelling of Chemicals (GHS), and the Safety Data Sheet (SDS)
2010 ThaiGAP standard was harmonized with GlobalGAP
2012 Q-GAP standard is planned to be harmonized with AseanGAP
Notes: 1 ThaiGAP is a private standard mostly aimed at the EU market. The standard, which started in 2005, is set
by the Thai Chamber of Commerce & Board of Trade of Thailand and the auditing is done by a private company
(NSF-CMi). Less than ten farms received the ThaiGAP certificate in 2011.
Certificates are issued free of charge to farmers and are valid for one year for seasonal crops
and two years for perennial crops. From official documents we found that in 2010, certificates
were issued to about 212,000 farmers covering a crop area of 225,000 hectares. Although this

Publication III: Can public GAP standards reduce agricultural pesticide use?
62
area seems large, it represents only 3.7% of the country’s farm households and 1.2% of the area
of arable and permanent cropland.
The auditing of farms under the Q-GAP program has strained the handling capacity of the
DoA, which is the certifying body for the program. For instance, in the northern region there
are about 120 DoA auditors but about 140,000 registered farmers, suggesting that each auditor
is responsible for processing over 1,000 farmers a year. According to the same DoA officer,
there is current nationwide capacity to audit about 10,000 farms a year.
In recent years, auditing has been increasingly carried out by local contractors in a system
designed to ensure the expansion of the Q-GAP program. The DoAE provides training in GAP
auditing to government officers through a four-day training course, with a refresher course
after three to six months. These trained government auditors in turn train a large number of
other people who are hired on a temporary basis to conduct GAP audits and are paid per audit.
According to a DoA officer in Chiang Mai, about 70 percent of the auditing is currently done
by contractors. Privatization of the entire monitoring system is being considered, but a decision
on this has been delayed as the costs are unclear. Government laboratories, together with a few
accredited private laboratories, do all the residue testing but have been overloaded with
samples.
The Q-GAP guidelines are based on eight principles that cover a wide range of farm
management issues, such as site selection and management, agrochemical use and water
supplies (DoA, 2009). The clear emphasis is, however, on food safety, and more narrowly on
the contamination of farm produce with pesticide residues. The Q-GAP auditing reflects this,
as the main effort goes into the testing of harvested products for pesticide residues. While Q-
GAP guidelines emphasize farm practices that are pre-farm gate, auditing focuses on the final
stages of production. The standard requires farmers to record their use of agrochemicals and to
use them in a proper way, but farmers are likely to receive a certificate as long as they observe
the prescribed pre-harvest spraying interval (that is, a number of days before the harvest during
which time farmers are not allowed to spray pesticides). In addition, we observed that official
documents recognize Integrated Pest Management (IPM) to be an integral part of Q-GAP, yet
guidelines mostly tell farmers how to apply certain chemicals, with little or no mention of
alternatives.

Publication III: Can public GAP standards reduce agricultural pesticide use?
63
The emphasis on pesticide contamination shows the importance of this issue for the Thai food
sector. Local media regularly report about high concentrations of chemicals in the blood
samples of farmers and consumers, and in 2010, EU customs officials detected pesticide
residues on Thai vegetables which exceeded the maximum residue limits (MRLs) by 55 times.
In early 2011, Thailand voluntarily suspended exports of sixteen types of vegetables to the EU,
after the EU threatened to ban imports of Thai vegetables due to pest and pesticide residues
having been found. Thereafter, random sampling in Thailand was increased to cover 50% of
vegetable shipments to the EU for a period of six months.
The bulk of Thailand’s fruit and vegetable exports are shipped to other countries in Southeast
Asia, with only a relatively small volume shipped to the EU and Japan (Sardsud 2007). Trade
in agricultural products within Southeast Asia and with China is likely to continue to increase
as the region moves towards a single market in 2015 - the ASEAN Economic Community. To
reduce barriers in agricultural trade, ASEAN countries in 2006 agreed to harmonize their
national public GAP standards to form a new AseanGAP standard by 2012. The AseanGAP
standard is more comprehensive than the Q-GAP standard, as it includes five additional areas
including planting materials, soil and substrates, biodiversity, worker welfare and reviewing
practices. Unlike the Q-GAP standard, AseanGAP will require using IPM whenever possible
(ASEAN, 2008; DoA, 2009).
4.3.4 Comparing the intensity of pesticide use between Q-GAP and non-GAP farmers
Table 4.2 compares pest management practices between farmers from the study area who do
and do not follow the Q-GAP guidelines. As can be seen from the table, nearly all farmers use
synthetic pesticides, with just four out of 290 farmers only using non-synthetic methods of pest
control, and with 84% of the Q-GAP farmers and 77% of the other farmers relying solely on
synthetic pesticides to control crop pests (the difference not being significant). Only 14% of the
Q-GAP farmers apply non-synthetic methods such as insect traps, bio-pesticides or mechanical
control methods.
In terms of pesticide handling, no significant differences were found between farmers who do
and do not follow the Q-GAP guidelines. Of those Q-GAP farmers who use synthetic
pesticides, 41% spray at regular intervals irrespective of the level of pest infestation. The
majority of farmers (78% of the Q-GAP group) determine the dosage by following product
labels. When asked an open question as to what climate factors they take into account when

Publication III: Can public GAP standards reduce agricultural pesticide use?
64
spraying pesticides, 88% of the Q-GAP respondents indicated that temperature or radiation
(sunshine) are important, but only 27% mentioned wind, wind speed or wind direction.
Regarding protective clothing, we found that the majority of farmers cover their mouths, arms
and legs during spraying, but much fewer respondents said that they take a shower or change
their clothes afterwards. These findings suggest that the majority of farmers in both groups
make efforts to reduce the direct risk of pesticide spraying on their health, yet depend heavily
on synthetic pesticides in their pest control practices.
Table 4.2: Pest control and pesticide handling by the non-GAP farmers as compared to the Q-
GAP farmers, as a percentage of all farmers in the group
Pesticide Handling Aspect Non-GAP Q-GAP t-test3
Methods of pest control1
Use synthetic pesticides 96 98 NS
Rely solely on synthetic pesticides to control pests 77 84 NS
Use non-synthetic methods to control pests 21 14 NS
Pesticide handling2
Use pesticides in a preventive way (regular spraying) 41 45 NS
Follow product labelling to decide on the dosage to use 80 78 NS
Take temperature or radiation into account when spraying 86 88 NS
Take wind speed and/or direction into account when spraying 24 27 NS
Cover mouth when spraying 76 81 NS
Cover arms and legs when spraying 86 95 NS
Take a shower and wash clothes after spraying 47 60 NS
Number of farm managers interviewed 245 45
Notes: 1 Percentage of all farmers in the group. 2 Percentage of farmers using synthetic pesticides. 3 Two-tailed
two-sample mean comparison test with unequal variances. *** Significant at 0.01, ** significant at 0.05, *
significant at 0.10, NS not significant at 0.10.
We further compared pesticide use between the Q-GAP and non-GAP farmers at the crop level,
because certificates are assigned not to farmers but to plot-crop combinations. We had a
relatively large number of crop-level observations for bell peppers, cabbages and lettuce, but
much fewer observations for other crops. Only for those crops with a minimum of five
observations did we carry out a t-test to assess the differences in mean values.
The results in Table 4.3 confirm those seen in Table 4.2 that the majority of farmers rely solely
on synthetic pesticides for their pest management. The exception is chayote, which is not
significantly affected by pests. In terms of the average quantity of pesticides applied, Q-GAP
farmers use smaller quantities on average for all crops mentioned in the table, but as variations

Publication III: Can public GAP standards reduce agricultural pesticide use?
65
in pesticide use are large, these differences are not significant (p>0.10) for any crop. We
further compared the share of pesticides used that are classified as extremely hazardous (WHO
class Ia), highly hazardous (Ib) and moderately hazardous (II) in terms of the total quantity of
active ingredients, as the use of these pesticides should be minimized under the Q-GAP
standard. Table 4.3 shows that for bell peppers (p<0.05), the share of these hazardous
chemicals used as a proportion of the total pesticide quantity applied is lower in fields using Q-
GAP than in fields not using GAP. However, for lettuce (p<0.01) and Chinese cabbage
(p<0.10) we find the opposite: the share of hazardous chemicals in total pesticide use is greater
for Q-GAP. For the four other crops tested we did not find a significant difference.
Table 4.3 Pesticide use by crop—with and without Q-GAP standards applied
Crop
Non-GAP Q-GAP
n
Use
Pesticides
Only (%)
Active
Ingredients
(kg/ha) (SD)
WHO 1a,
1b, II (%)1 n
Use
Pesticides
Only (%)
Active
Ingredients
(kg/ha) (SD)
WHO 1a,
1b, II (%)1
Bell peppers 157 79 43.02 39 41 72 23.69 NS
27 **
(126.04) (28.7)
Cabbage
(white/pointed) 131 87 4.60 62 21 89 1.20
NS 59
NS
(22.83) (1.33)
Carrots/
potatoes 33 85 4.78 16 6 78 0.56
NS 25
NS
(11.35) (0.53)
Chayote 86 20 1.32 66 4 0 0.00 †
0 †
(6.54) (0)
Chinese
cabbage 123 87 4.31 38 21 98 1.53
NS 55
*
(8.82) (2.18)
Lettuce
(various) 50 72 1.88 26 22 95 1.29
NS 78
***
(3.27) (2.29)
Litchis 121 43 4.50 33 9 89 3.38 NS
17 NS
(42.05) (5.93)
Tomatoes
18 78 21.02 32 10 100 20.61
NS 30
NS
(28.3) (18.01)
Notes: n is the number of crop cycles observed. 1 Share of active ingredients of WHO hazard classes Ia, Ib and II
in the total quantity of active ingredients used. Two-tailed two-sample mean comparison test with unequal
variances. *** Significant at 0.01, ** significant at 0.05, * significant at 0.10, NS not significant at 0.10. † No t-test
was performed for chayote (n<5).
4.3.5 Farm level constraints and incentives regarding GAP compliance
Having shown that Q-GAP certification has no significant effect on pesticide handling or the
amount of pesticides used and only significantly reduces the use of highly hazardous pesticides
for one out of eight crops, we now turn to the qualitative data to understand the underlying
reasons.
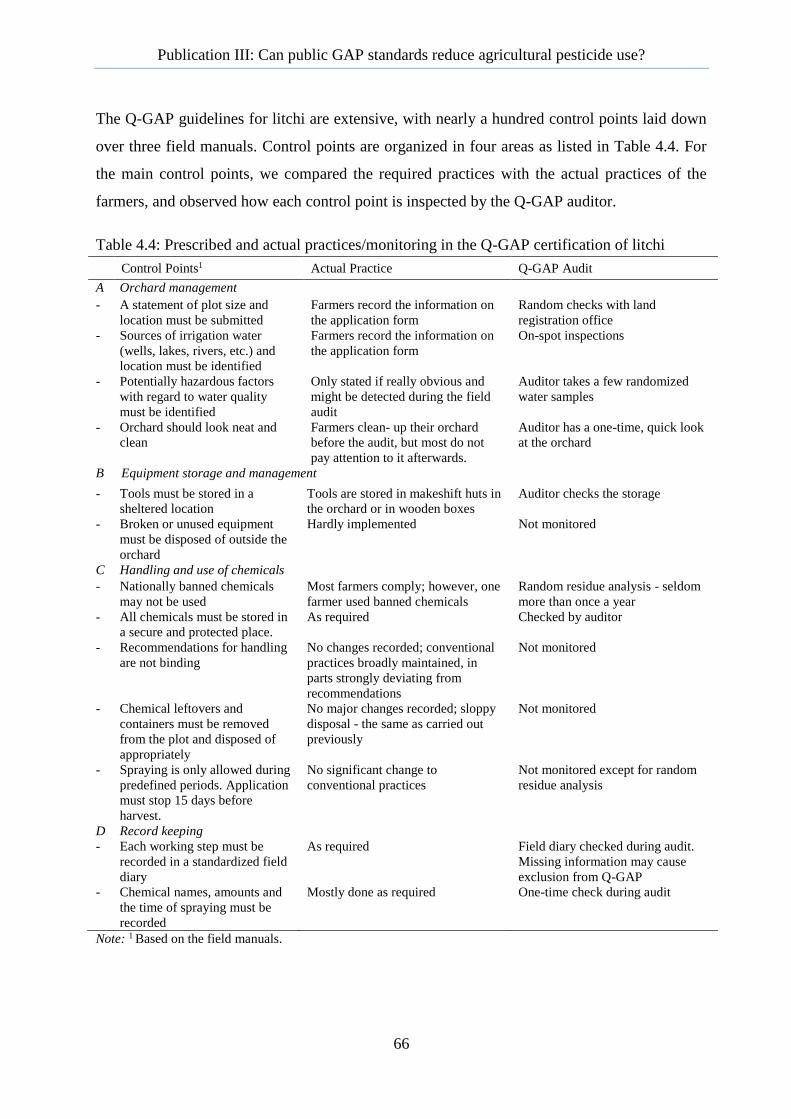
Publication III: Can public GAP standards reduce agricultural pesticide use?
66
The Q-GAP guidelines for litchi are extensive, with nearly a hundred control points laid down
over three field manuals. Control points are organized in four areas as listed in Table 4.4. For
the main control points, we compared the required practices with the actual practices of the
farmers, and observed how each control point is inspected by the Q-GAP auditor.
Table 4.4: Prescribed and actual practices/monitoring in the Q-GAP certification of litchi
Control Points1 Actual Practice Q-GAP Audit
A Orchard management
- A statement of plot size and
location must be submitted
Farmers record the information on
the application form
Random checks with land
registration office
- Sources of irrigation water
(wells, lakes, rivers, etc.) and
location must be identified
Farmers record the information on
the application form
On-spot inspections
- Potentially hazardous factors
with regard to water quality
must be identified
Only stated if really obvious and
might be detected during the field
audit
Auditor takes a few randomized
water samples
- Orchard should look neat and
clean
Farmers clean- up their orchard
before the audit, but most do not
pay attention to it afterwards.
Auditor has a one-time, quick look
at the orchard
B Equipment storage and management
- Tools must be stored in a
sheltered location
Tools are stored in makeshift huts in
the orchard or in wooden boxes
Auditor checks the storage
- Broken or unused equipment
must be disposed of outside the
orchard
Hardly implemented Not monitored
C Handling and use of chemicals
- Nationally banned chemicals
may not be used
Most farmers comply; however, one
farmer used banned chemicals
Random residue analysis - seldom
more than once a year
- All chemicals must be stored in
a secure and protected place.
As required Checked by auditor
- Recommendations for handling
are not binding
No changes recorded; conventional
practices broadly maintained, in
parts strongly deviating from
recommendations
Not monitored
- Chemical leftovers and
containers must be removed
from the plot and disposed of
appropriately
No major changes recorded; sloppy
disposal - the same as carried out
previously
Not monitored
- Spraying is only allowed during
predefined periods. Application
must stop 15 days before
harvest.
No significant change to
conventional practices
Not monitored except for random
residue analysis
D Record keeping
- Each working step must be
recorded in a standardized field
diary
As required Field diary checked during audit.
Missing information may cause
exclusion from Q-GAP
- Chemical names, amounts and
the time of spraying must be
recorded
Mostly done as required One-time check during audit
Note: 1 Based on the field manuals.
Publication III: Can public GAP standards reduce agricultural pesticide use?
67
According to the Q-GAP guidelines, farmers registered in the Q-GAP program should receive
technical assistance from the DoAE about IPM, integrated crop management and organic
compost making. In reality, no technical assistance was provided to any of the farmers.
Although farmers are supposed to reduce their synthetic pesticide use, there was hence no
training provided and also the field manuals gave no information on how to replace synthetic
pesticides with alternative methods of pest control.
According to the Q-GAP guidelines, first-time certification should involve three audits, to take
place without advance notification in terms of the date and time. In reality, the farmers had
been visited only once and were informed about the date and time of the audit in advance.
Auditing of the litchi orchards was done by relatively young and inexperienced government
auditors who spent as little as five minutes with each farmer and largely avoided walking into
the orchard because of the limited time available. Perhaps because of the large age difference
between the auditor and the farmers, critical remarks towards the farmers were mostly avoided
during the audit, reflecting a society in which hierarchy and respect for seniors are very
important. The friendly style of the auditing suggested that farmers were unlikely to fail.
The farmers said that categories A (orchard management) and B (equipment storage and
management) of the standard are relatively unproblematic in terms of implementation.
Submitting basic plot information and making the orchard look “neat and clean” before the
auditor’s visit is perceived as an easy task. Farmers said that category C (handling and use of
chemicals) is a bit more difficult, as they need to find out what chemicals can be used, place
them in a storage and change their chemical handling processes as well as the timing of
pesticide applications. However, the required changes are minor as compared to conventional
practices, and are therefore feasible to adopt. Moreover, these changes do not require additional
labor or other costs, and the spraying schedule defined in the field manual is largely the same
as what the farmers were used to before, except for the prescribed pre-harvest interval, as
farmers used to spray right up until harvesting. While all the farmers stated during the
interviews that they comply with the pre-harvest intervals, field observations showed that
several farmers do spray right up to the harvest. However, the farmers know that only a few
fruit samples will be collected for residue analysis and that the risk of getting caught by the
audit is therefore low, whereas the risk of losing a part of the harvest due to pests is high. The
most difficult standard to follow is record keeping (category D), because farmers are unfamiliar
with this and a few of the older farmers we spoke to possess a low level of literacy.
Publication III: Can public GAP standards reduce agricultural pesticide use?
68
In most cases farmers do not understand the underlying rationale for these guidelines and
therefore do not feel intrinsically motivated to follow them, but rather perceive the guidelines
as requirements that need to be fulfilled explicitly and exclusively for the audit. As a result,
most guidelines are only implemented immediately prior to the audit. Since auditing involves a
one-time visit and very few samples for pesticide residue analysis, the incentive for long-term
compliance is low. In addition, there is a lot of leeway allowing farmers to bypass certain
guidelines such as those about the handling and appropriate disposal of pesticide containers and
leftovers. Not long after the audit, we observed that some of the farmers returned to their
conventional practice of randomly disposing leftover pesticides and empty containers in their
orchards.
Despite the lack of real changes in pest management practices, the farmers acknowledged that
they have become more concerned about the impacts of pesticide use, mostly on human health,
as an indirect effect of Q-GAP introduction. One farmer mentioned in the interview: “Since
some chemicals had been banned following Q-GAP, we had to go around and look for
alternatives […] Therefore, we had a chance to get into contact with new pesticides suppliers
who provided us with additional information on how to handle them safely and prevent them
from affecting our health.” Farmers also mentioned that they have developed a greater
awareness about those substances that are legally banned, and learned the reasons for their
being banned.
At an information sharing meeting on GlobalGAP organized by a lecturer from a local
university, the participants agreed that Q-GAP has given them a basic understanding that
quality goes beyond mere product appearance—such as the color and size of the fruit, and that
they would feel motivated to adopt the stricter GlobalGAP standard in the future if there were a
market for certified litchis.
4.4 Discussion and conclusion
It is impossible to generalize our findings from studying a small group of farmers following the
Q-GAP standard to the entire public GAP program. We interviewed less than 0.1% of farmers
in northern Thailand and less than 0.1% of Q-GAP certified farmers in Thailand. Levels of
pesticide use in our study area are also much above the Thai average, and therefore not
representative of Thai agriculture. Yet our findings are strikingly similar to those of Amekawa
(forthcoming) for pomelo growers in the Northeast of Thailand, who also found a lack of

Publication III: Can public GAP standards reduce agricultural pesticide use?
69
standard compliance due to a low motivation of farmers and a lack of understanding of control
points among farmers. The information we obtained from the expert interviews also broadly
confirms our field observations, which suggests that our results are valid.
The main strength of public GAP certification in Thailand is that it comes at no charge to the
farmers, which lowers the hurdle for smallholders to participate as is demonstrated by the large
overall number of farmers that are Q-GAP certified. Our study gives evidence, however, that
the quality of certification is poor as program resources for training and auditing are spread too
sparingly over the large group of participating farmers. The Q-GAP standard, as implemented
at present, is therefore no real alternative for more stringent private standards to guarantee food
safety. We note that data collected in the Q-GAP program through standardized field diaries,
residue testing and farm audits are not currently used to manage the program. However, these
data can provide valuable feedback and could, for instance, be used to optimize training and
auditing efforts.
Our study shows that in the case of litchis, of the long list of control points set by the standards,
maximum residue limits are perhaps the only control point systematically audited, although
statistically the auditing frequency is only once every ten years. Yet during the interviews held
with the farmers, they mentioned that even when spraying during the pre-harvest intervals, they
believe that simply rinsing the produce allows them to stay within MRLs, which points at the
lack of intrinsic motivation among farmers to change their pest management practices.
However, our study showed that farmers were interested to learn about the risk of pesticides
and that they also had a reasonable level of knowledge about how to reduce their own exposure
to pesticide risk. Creating more awareness about the risk of pesticide, including the risk of
pesticide residues to consumers and the environment, would improve farmers’ understanding
of control points and give them a stronger motivation to comply with these.
Another problem with the focus on pesticide residue testing is that it merely gives a snapshot of
the final stages of the farm production process and does not adequately address the root causes
of the pesticide problem. The Q-GAP program does not provide farmers with suitable
alternatives to their current practices. In line with this, our study shows that farmers almost
entirely depend on synthetic pest control, with non-synthetic alternatives rarely being used.
Although the concept of IPM frequently appears in connection with Q-GAP in policy
documents, farmers did not receive IPM training, nor did the Q-GAP field manuals make

Publication III: Can public GAP standards reduce agricultural pesticide use?
70
concrete suggestions for farmers’ voluntary use of IPM techniques. Instead, they only noted
how to improve spraying practices.
To more effectively reduce pesticide use, the Q-GAP program therefore needs to pay more
attention to on-farm practices and ensure that farmers have suitable alternatives to synthetic
pesticides when managing pests. Q-GAP auditors, having received a two-day training only and
spending as little as five minutes auditing a field in practice, are not qualified for this and it is
also not part of their auditing task. The DoAE needs to complement the Q-GAP program by
providing standardized IPM methods for each crop and providing training to farmers on how to
use these. It is illustrative that none of the litchi farmers participating in the Q-GAP program
had received technical assistance or training from the DoAE.
The findings of our study raise the question as to whether the Q-GAP program in its present
form is the best policy response to the pesticide problem in the Thai agricultural sector. The
strong focus on food safety—narrowly defined as the monitoring of pesticide residues on fruits
and vegetables—suggests that the government is more concerned with limiting the
consequences of pesticide overuse and misuse, presumably to avoid negative repercussions on
food export opportunities, rather than addressing the root cause of the problem. With 41
percent of the Thai labor force working in agriculture, and hence having direct contact with
pesticides, the task is indeed daunting. Yet re-orienting the focus of the Q-GAP program to
give greater attention to changing on-farm practices would benefit farmers and consumers
alike.
4.5 Acknowledgments
Funding by the Deutsche Forschungsgemeinschaft for the project SFB 564 is gratefully
acknowledged. The sixth author thanks the Hermann Eiselen Gedächtnisstiftung for its
financial support. Aer Sirijinda and Sureeporn Sringarm managed the farm survey;
Chomphoonut Yotpranan, Narin Vannavijit and Rungaroon Kantapa provided valuable
research assistance. We thank Harvey James and three anonymous reviewers for their
thoughtful comments that helped to improve this paper. Gary Morrison helped with reading
through the English.
Publication III: Can public GAP standards reduce agricultural pesticide use?
71
4.6 References
Amekawa, Y. 2009. Reflections on the growing influence of good agricultural practices in the
global South. Journal of Agricultural and Environmental Ethics 22 (6):531-557.
Amekawa, Y. Can public GAP approach ensure safety and fairness? A comparative study of Q-
GAP in Thailand. Journal of Peasant Studies, forthcoming.
ASEAN. 2008. Interpretive guides for ASEAN GAP. ASEAN Secretariat, Jakarta, Indonesia.
Athisook, K., B. Sungwaranon, Y. Lertreungdej, P. Jongmeevasana, T. Payanant, and R.
Chaipol-ngam. 2007. Pesticide residue in foods monitored in Thailand, 1999-2003. In
Pesticides in Southeast Asia: Environmental, biomedical, and economic uses and
effects, ed. P. Kunstadter, 151-159. Chiang Mai: Silkworm Books.
Busch, L. 2009. The private governance of food: equitable exchange or bizarre bazaar?
Agriculture and Human Values: 36 (3):1-8.
Chen, C., J. Yang, and C. Findlay. 2008. Measuring the effect of food safety standards on
China's agricultural exports. Review of World Economics 144 (1):83-106.
DeLind, L., and P. Howard. 2008. Safe at any scale? Food scares, food regulation, and scaled
alternatives. Agriculture and Human Values 25 (3):301-317.
Department of Agriculture (DoA). 2009. Quality Assurance System: GAP Crops (Mango,
Longan and Litchi) (in Thai). Ministry of Agriculture and Cooperatives, Bangkok,
Thailand.
Fuchs, D., A. Kalfagianni, and T. Havinga. 2011. Actors in private food governance: the
legitimacy of retail standards and multistakeholder initiatives with civil society
participation. Agriculture and Human Values 28 (3):353-367.
Henson, S., and S. Jaffee. 2008. Understanding Developing Country Strategic Responses to the
Enhancement of Food Safety Standards. World Economy 31 (4):548-568.
doi:10.1111/j.1467-9701.2007.01034.x.
Hongsibsong, S., W. Jit-Aree, A. Mungklabruks, P. Kunstadter, and T. Prapamontol. 2007.
Survey of pesticide residues in cabbages and kale from traditional wet markets during a
high-risk season, Chiang Mai city. In Pesticides in Southeast Asia: Environmental,
biomedical, and economic uses and effects, ed. P. Kunstadter, 149-150. Chiang Mai:
Silkworm Books.
Humphrey, J. 2006. Policy Implications of Trends in Agribusiness Value Chains. The
European Journal of Development Research 18 (4):572-592.
Jaffee, S., and S.J. Henson. 2004. Standards and agro-food exports from developing countries:
rebalancing the debate. In Policy Research Working Paper 3348. Washington, D.C.:
World Bank.
Lamers, M., M. Anyusheva, N. La, V. V. Nguyen, and T. Streck. 2011. Pesticide Pollution in
Surface- and Groundwater by Paddy Rice Cultivation: A Case Study from Northern
Vietnam. Clean - Soil, Air, Water 39 (4):356-361.
Mayring, P. 2003. Qualitative Inhaltsanalyse. Beltz Verlag, Weinheim & Basel.
Mazlan, N., and J. Mumford. 2005. Insecticide use in cabbage pest management in the
Cameron Highlands, Malaysia. Crop Protection 24 (1):31-39.
Okello, J.J., and S.M. Swinton. 2010. From Circle of Poison to Circle of Virtue: Pesticides,
Export Standards and Kenya's Green Bean Farmers. Journal of Agricultural Economics
61 (2):209-224.
Panuwet, P., T. Prapamontol, S. Chantara, P. Thavornyuthikarn, M.A Montesano, R.D.Jr.
Whitehead, and D.B. Barr. 2008. Concentrations of urinary pesticide metabolites in
small-scale farmers in Chiang Mai Province, Thailand. Science of the Total
Environment 407:655-668.
Publication III: Can public GAP standards reduce agricultural pesticide use?
72
Posri, W., B. Shankar, and S. Chadbunchachai. 2006. Consumer Attitudes Towards and
Willingness to Pay for Pesticide Residue Limit Compliant "Safe" Vegetables in
Northeast Thailand. Journal of International Food & Agribusiness Marketing 19 (1):81 -
101.
Praneetvatakul, S., P. Schreinemachers, P. Pananurak, and P. Tipraqsa. 2011. Economic Impact
of Chemical Pesticide Use in Agriculture. Report prepared for the Thai Health
Promotion Foundation (in Thai). Bangkok: Kasetsart University.
Sardsud, V. 2007. National experiences: Thailand. In Challenges and Opportunities Arising
from Private Standards on Food Safety and Environment for Exporters of Fresh Fruit
and Vegetables in Asia: Experiences of Malaysia, Thailand and Viet Nam, eds. U.
Hoffmann and R. Vossenaar, 53-69. New York and Geneva: United Nations
Conference on Trade and Development.
Schreinemachers, P., S. Sringarm, and A. Sirijinda. 2011. The Role of Synthetic Pesticides in
the Intensification of Highland Agriculture in Thailand. Crop Protection 30 (11):1430-
1437. doi:10.1016/j.cropro.2011.07.011
Tallontire, A., M. Opondo, V. Nelson, and A. Martin. 2011. Beyond the vertical? Using value
chains and governance as a framework to analyse private standards initiatives in agri-
food chains. Agriculture and Human Values 28 (3):427-441.
Tanabe, S., K. Kannan, M.S. Tabucanon, C. Siriwong, Y. Ambe, and R. Tatsukawa. 1991.
Organochlorine pesticide and polychlorinated biphenyl residues in foodstuffs from
Bangkok, Thailand. Environmental Pollution 72 (3):191-203.
Tremblay, A.-M., and A. Neef. 2009. Collaborative market development as a pro-poor and pro-
environmental strategy. Enterprise Development & Microfinance 20 (3):220-234.
Van Hoi, P., A.P.J. Mol, P. Oosterveer, and P.J. van den Brink. 2009. Pesticide distribution and
use in vegetable production in the Red River Delta of Vietnam. Renewable Agriculture
and Food Systems 24 (03):174-185.
Wilson, J.S., and T. Otsuki. 2004. To spray or not to spray: pesticides, banana exports, and
food safety. Food Policy 29 (2):131-146.
Xu, R., R. Kuang, E. Pay, H. Dou, and G.R. de Snoo. 2008. Factors contributing to overuse of
pesticides in western China. Environmental Sciences 5 (4):235-249.
Publication IV: ‘Smart’ policies to reduce pesticide use
73
5 Publication IV
‘Smart’ policies to reduce pesticide use and avoid income trade-offs:
An agent-based model applied to Thai agriculture4
Christian Grovermanna,c, Pepijn Schreinemachersb, Suthathip Riwthonga, Thomas Bergera
a Dept. of Land Use Economics in the Tropics and Subtropics (490d), Universität
Hohenheim, 70593 Stuttgart, Germany
b AVRDC – The World Vegetable Center, P.O. Box 42, Shanhua, Tainan, 74199 Taiwan
c FAO – Food and Agriculture Organization of the United Nations – Viale delle Terme di
Caracalla, 00153 Rome, Italy
4 Paper submitted to Ecological Economics on 30 June 2015.
Publication IV: ‘Smart’ policies to reduce pesticide use
74
5.1 Abstract
Agricultural pesticide use is rapidly increasing in many developing countries, often
stimulated by policies that directly or indirectly promote their use. Policy makers need better
evidence of how changes in pesticide regulation would affect pesticide reduction as well as
farm incomes but there are only few modeling tools that can provide such information. The
present study uses an agent-based modeling approach built on the software MPMAS with the
objective to assess ex-ante the impact of alternative pesticide use reduction strategies,
including combinations of pesticide taxes, the introduction of integrated pest management, a
price premium for safe agricultural produce, and subsidies for biopesticides. The model is
parameterized with farm and plot level data from northern of Thailand, where the adoption of
high-value cash crops has been accompanied by a rapid increase in pesticide use. Simulation
results suggest that a pesticide tax alone has little effect on pesticide use. However, if a
pesticide tax is combined with the promotion of integrated pest management methods then
this could lead to a very substantial reduction in pesticide use. Using the right combination of
measures, it is possible to reduce pesticide use by up to 34% over current levels without
adverse effects on farm income.
Keywords: Multi-agent systems, ex-ante assessment, pesticide policy, integrated pest
management, developing countries

Publication IV: ‘Smart’ policies to reduce pesticide use
75
5.2 Introduction
The intensification of crop production in many low and middle income countries is
accompanied by a rapid increase in agricultural pesticide use, often leading to overuse and
misuse (Ecobichon, 2001; Schreinemachers and Tipraqsa, 2012). This not only harms human
health, but also threatens the resilience and long-term productivity of agro-ecosystems as
beneficial organisms disappear and pests become resistant (Cowan and Gunby, 1996).
Despite high internal as well as external costs, farmers continue using pesticides due to the
perceived high withdrawal costs (Wilson and Tisdell, 2001). Developing countries often do
not adequately address pesticide risks, as policy-makers fear that taxing or otherwise
discouraging pesticide use would harm food production and rural livelihoods (Carvalho,
2006). In fact, policies are often in place that give farmers direct or indirect incentives to use
more pesticides. Uncertainty over the impacts of alternative policies is a major obstacle to
policy change.
There is thus a need to support policy-making with sound data about the potential economic
and environmental consequences of changes in pesticide regulation. Still, there are only few
scientific studies on this topic and all of these focused on high income countries. First,
Falconer and Hodge (2000, 2001) developed a case-study farm model for the UK to evaluate
low-input farming in combination with pesticide taxation. They found significant trade-offs
between economic and environmental objectives, with only high taxes showing impacts.
Second, Jacquet et al. (2011) developed a mathematical programming model (MP) at the
national level for the French agricultural sector. Their model suggested that taxation would
help reduce pesticide use considerably and not lead to income losses as long as integrated
farming techniques were widely adopted. Third, Skevas et al. (2012) conducted an
econometric study of the effects of pesticide use reduction policies on Dutch cash crop
producers. Their study revealed that even extremely high taxes and penalties result in only
small reductions in pesticide use. The authors also pointed out the lack of empirical research
on the impact of various economic instruments on farm income, pesticide use and the
environment. This research gap is even more apparent in the context of developing countries,
where agricultural pesticides use has increased dramatically ‒ exposing ecosystems and
millions of farmers and consumers to the risk of pesticides.

Publication IV: ‘Smart’ policies to reduce pesticide use
76
This paper addresses the lack of sound evidence on which to base policy recommendations by
developing a modeling tool to ex-ante assess a range of pesticide reduction strategies. It
employs a bio-economic simulation model with several novel aspects as compared to the
above-mentioned studies: (a) the study combines a simulation model with econometrically
estimated production functions with damage control specifications for pesticides; (b) the
study simulates the diffusion of integrated pest management (IPM) as based on the theory of
innovation diffusion (Rogers, 2003); and (c) the study uses an agent-based framework rather
than a representative farm model to avoid aggregation bias, which might occur in using a
representative farm- or sector-level model.
The model was built using the agent-based simulation software MPMAS, which was
specifically developed and widely tested for ex-ante assessments of changes in technology,
policies or environmental conditions in agriculture (Schreinemachers and Berger, 2011). We
apply it to agricultural production systems in the mountainous north of Thailand, which have
experienced rapid land use intensification through the adoption of high-value cash crops
(Riwthong et al., 2015). The extent and adverse effects of heavy pesticide use in this area are
increasingly becoming apparent (Praneetvatakul et al., 2013; Sangchan et al., 2013; Schreinemachers et al., 2011).
The paper starts by giving the relevant background information on the study area, which is
important to understand the choice of model features described in the methods section. The
latter focuses on how the substitution between different pesticides was captured in the model
and how the model simulated the diffusion of integrated pest management (IPM) under
alternative pesticide policy options. The parameterized and validated model is then used to
explore the introduction of IPM with a tax on pesticides, a price premium for safe agricultural
produce, and subsidies on biopesticides. Alternative combinations are compared in terms of
their impact on pesticide use and farm income, and possible trade-offs between these,
providing a reference for evidence-based policy-making.
5.3 Materials
5.3.1 Study area and data collection
This study was part of the Uplands Program, a long-term research program on sustainable
land use and rural livelihoods in mountainous regions of Southeast Asia (Heidhues and Pape,
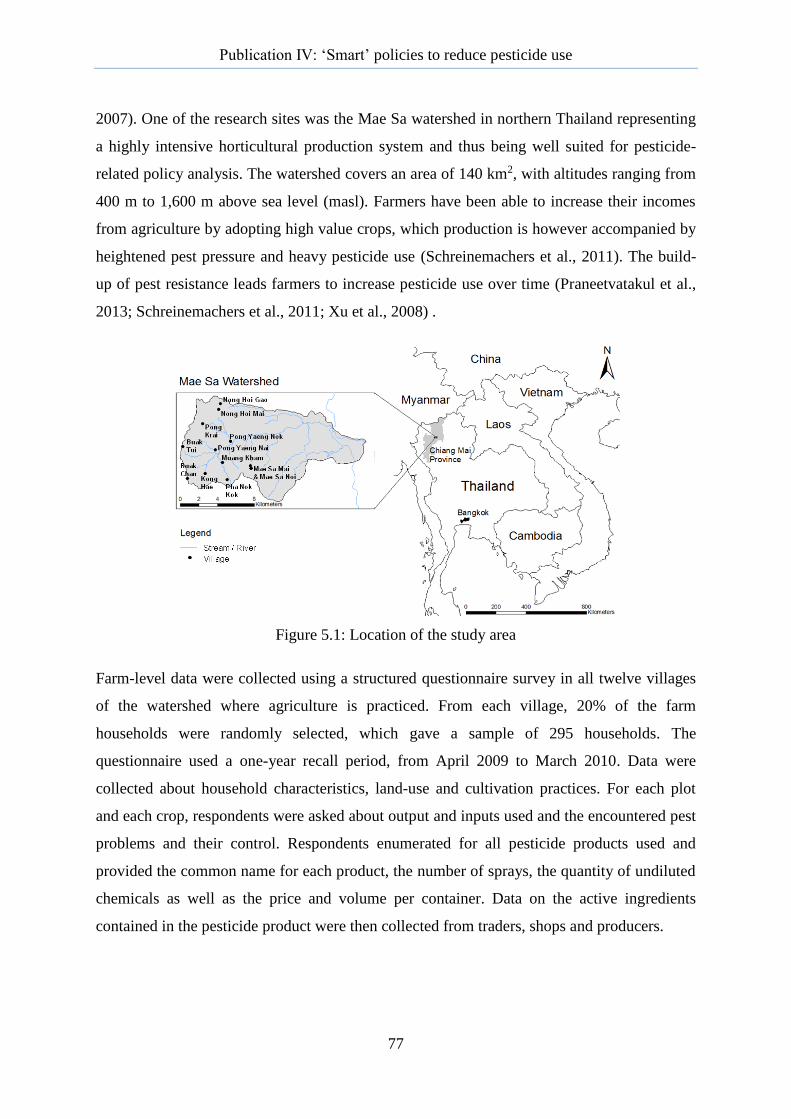
Publication IV: ‘Smart’ policies to reduce pesticide use
77
2007). One of the research sites was the Mae Sa watershed in northern Thailand representing
a highly intensive horticultural production system and thus being well suited for pesticide-
related policy analysis. The watershed covers an area of 140 km2, with altitudes ranging from
400 m to 1,600 m above sea level (masl). Farmers have been able to increase their incomes
from agriculture by adopting high value crops, which production is however accompanied by
heightened pest pressure and heavy pesticide use (Schreinemachers et al., 2011). The build-
up of pest resistance leads farmers to increase pesticide use over time (Praneetvatakul et al.,
2013; Schreinemachers et al., 2011; Xu et al., 2008) .
Figure 5.1: Location of the study area
Farm-level data were collected using a structured questionnaire survey in all twelve villages
of the watershed where agriculture is practiced. From each village, 20% of the farm
households were randomly selected, which gave a sample of 295 households. The
questionnaire used a one-year recall period, from April 2009 to March 2010. Data were
collected about household characteristics, land-use and cultivation practices. For each plot
and each crop, respondents were asked about output and inputs used and the encountered pest
problems and their control. Respondents enumerated for all pesticide products used and
provided the common name for each product, the number of sprays, the quantity of undiluted
chemicals as well as the price and volume per container. Data on the active ingredients
contained in the pesticide product were then collected from traders, shops and producers.

Publication IV: ‘Smart’ policies to reduce pesticide use
78
5.3.2 Land use, pesticide use and farm characteristics
Cropping patterns in the Mae Sa watershed vary according to land suitability (elevation and
slope), accessibility and the contact of farmers to traders and the Royal Project, which is the
main extension service in the area. This results in a diverse agricultural land use, 58 crops
being recorded in the survey. Many of these crops are minor in terms of planted area,
pesticide applications and revenues, and it was impossible to collect detailed input-output
data for each crop. We therefore focused on the major crops that jointly account for 80% of
the revenues and planting area. The crops can be categorized as: (a) leafy vegetables: Chinese
cabbage, white cabbage, Chinese kale and lettuce; (b) greenhouse vegetables: bell peppers
and tomatoes; (c) other vegetables: chayote, fresh beans and onions; (d) flowers:
chrysanthemums and roses; (e) cereals: upland rice and maize; and (f) litchi fruit trees.
The left diagram in Figure 5.2 describes the relationship between profitability and pesticide
use for each category, which shows that farmers tend to use greater quantities of pesticides on
crops that give a higher profit. The risk of losing valuable crops to pests triggers preventive
as well as curative pesticide applications, which are high for greenhouse vegetables and
flowers in particular. Many farmers are indebted and so especially afraid of pest damage.
There are clear signs of growing pest resistance and resurgence problems as farmers
mentioned that certain pesticide products are no longer effective.
Figure 5.2: Pesticide use vs. profitability (left diagram) and relative toxicity of pesticides
applied (right diagram) per category of crops for the Mae Sa watershed, Thailand 2009/10
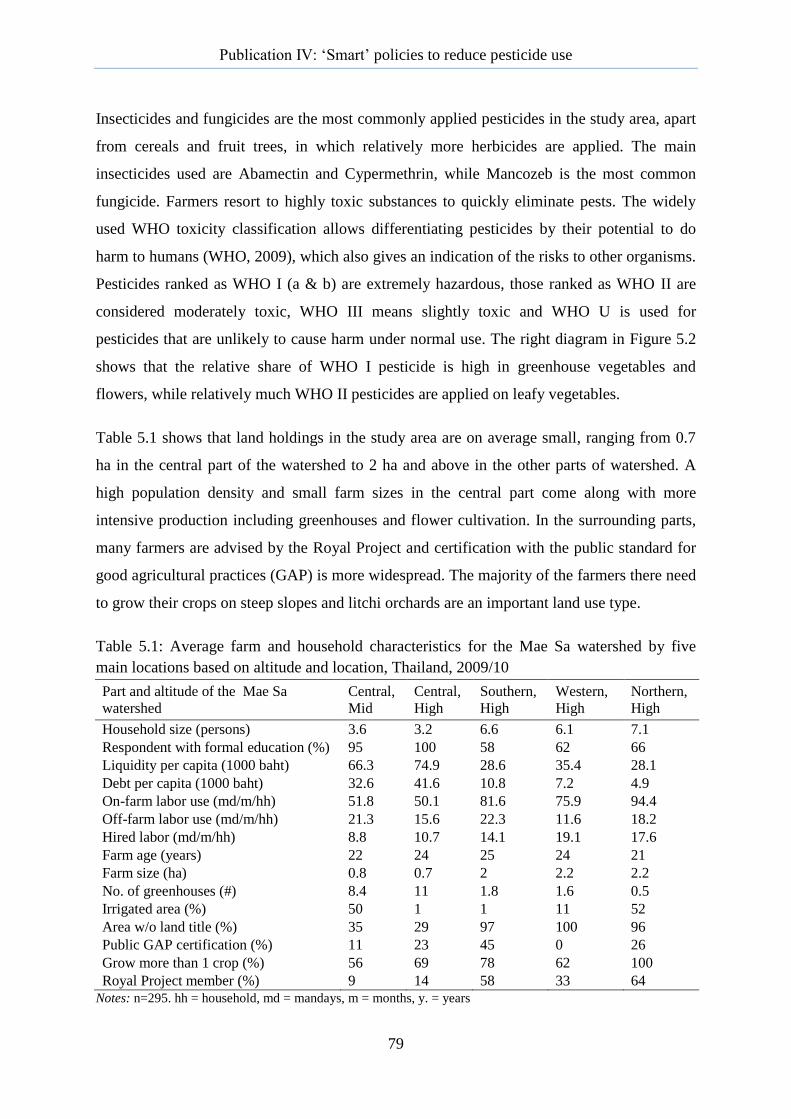
Publication IV: ‘Smart’ policies to reduce pesticide use
79
Insecticides and fungicides are the most commonly applied pesticides in the study area, apart
from cereals and fruit trees, in which relatively more herbicides are applied. The main
insecticides used are Abamectin and Cypermethrin, while Mancozeb is the most common
fungicide. Farmers resort to highly toxic substances to quickly eliminate pests. The widely
used WHO toxicity classification allows differentiating pesticides by their potential to do
harm to humans (WHO, 2009), which also gives an indication of the risks to other organisms.
Pesticides ranked as WHO I (a & b) are extremely hazardous, those ranked as WHO II are
considered moderately toxic, WHO III means slightly toxic and WHO U is used for
pesticides that are unlikely to cause harm under normal use. The right diagram in Figure 5.2
shows that the relative share of WHO I pesticide is high in greenhouse vegetables and
flowers, while relatively much WHO II pesticides are applied on leafy vegetables.
Table 5.1 shows that land holdings in the study area are on average small, ranging from 0.7
ha in the central part of the watershed to 2 ha and above in the other parts of watershed. A
high population density and small farm sizes in the central part come along with more
intensive production including greenhouses and flower cultivation. In the surrounding parts,
many farmers are advised by the Royal Project and certification with the public standard for
good agricultural practices (GAP) is more widespread. The majority of the farmers there need
to grow their crops on steep slopes and litchi orchards are an important land use type.
Table 5.1: Average farm and household characteristics for the Mae Sa watershed by five
main locations based on altitude and location, Thailand, 2009/10
Part and altitude of the Mae Sa
watershed Central, Mid
Central,
High Southern,
High Western,
High Northern,
High
Household size (persons) 3.6 3.2 6.6 6.1 7.1 Respondent with formal education (%) 95 100 58 62 66 Liquidity per capita (1000 baht) 66.3 74.9 28.6 35.4 28.1 Debt per capita (1000 baht) 32.6 41.6 10.8 7.2 4.9 On-farm labor use (md/m/hh) 51.8 50.1 81.6 75.9 94.4 Off-farm labor use (md/m/hh) 21.3 15.6 22.3 11.6 18.2 Hired labor (md/m/hh) 8.8 10.7 14.1 19.1 17.6 Farm age (years) 22 24 25 24 21 Farm size (ha) 0.8 0.7 2 2.2 2.2 No. of greenhouses (#) 8.4 11 1.8 1.6 0.5 Irrigated area (%) 50 1 1 11 52 Area w/o land title (%) 35 29 97 100 96 Public GAP certification (%) 11 23 45 0 26 Grow more than 1 crop (%) 56 69 78 62 100 Royal Project member (%) 9 14 58 33 64
Notes: n=295. hh = household, md = mandays, m = months, y. = years
Publication IV: ‘Smart’ policies to reduce pesticide use
80
5.3.3 Integrated pest management
IPM here refers to an agro-ecological approach to pest management that incorporates factors
such as the preservation of healthy soils, diverse cropping patterns and beneficial insects.
Farmers need profound knowledge of the agro-ecosystem and regularly monitor their crops.
Cultural, biological, mechanical methods and pesticides are combined in a way that
guarantees the long term environmental and economic viability of the farming system,
avoiding harm to farmers’ and consumers’ health. In reality, pest control practices are often
labeled as IPM, even if only a few of the above aspects are observed.
In the uplands of northern Thailand the practice of IPM has remained rather insignificant.
Lack of data on IPM practices in the Mae Sa watershed, required us to use data from another
location. The Doi Angkhang IPM program, managed by the Royal Project, exemplifies the
agro-ecological intensification of vegetable production through IPM. There, the Royal Project
has supported farmers to practice IPM in leafy vegetables for several years. Farmers combine
rotations to break the pest cycle and soil conservation with high levels of agro-biodiversity,
including many natural predators, traps and well-monitored biopesticide applications. The
climate and terrain at Doi Angkhang, located at 1400 masl, is similar to that of the Mae Sa
watershed. The land-use and the pest complex are also comparable.
One third (n=34) of the IPM farmers in Doi Angkhang were interviewed using a structured
questionnaire to record their input use, yield and farm gate selling prices. Since production is
very homogenous among farmers and strictly controlled, a small number of observations was
sufficient. Average yields for the selected crops were slightly lower than in the Mae Sa
watershed, and labor use was higher, but input costs were lower and prices were higher and
more uniform. Table 5.2 shows data for three typical rotations of the three main leafy
vegetables grown in Doi Angkhang: cabbages, lettuce and spinach. Each crop is managed
according to a recommended cultivation plan, with specified quantities of biopesticides,
developed and monitored by the Royal Project. For cabbages, this involves the application of
manure after planting, the spraying of a diluted organic fertilizer and the application of
biopesticides. Adjustments are made when pest pressure crosses a particular threshold.
Farmers closely observe their crops and also use insect traps and hand-picking.
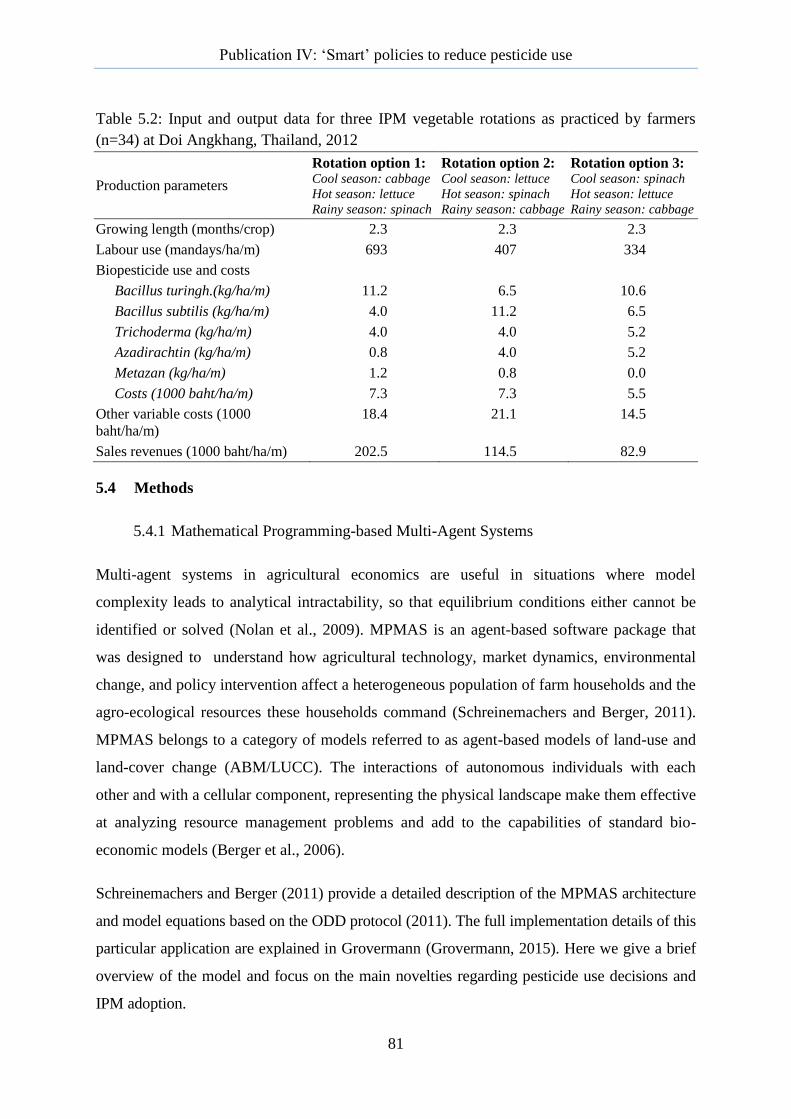
Publication IV: ‘Smart’ policies to reduce pesticide use
81
Table 5.2: Input and output data for three IPM vegetable rotations as practiced by farmers
(n=34) at Doi Angkhang, Thailand, 2012
Production parameters
Rotation option 1: Cool season: cabbage
Hot season: lettuce
Rainy season: spinach
Rotation option 2: Cool season: lettuce
Hot season: spinach
Rainy season: cabbage
Rotation option 3: Cool season: spinach
Hot season: lettuce
Rainy season: cabbage
Growing length (months/crop) 2.3 2.3 2.3
Labour use (mandays/ha/m) 693 407 334
Biopesticide use and costs
Bacillus turingh.(kg/ha/m) 11.2 6.5 10.6
Bacillus subtilis (kg/ha/m) 4.0 11.2 6.5
Trichoderma (kg/ha/m) 4.0 4.0 5.2
Azadirachtin (kg/ha/m) 0.8 4.0 5.2
Metazan (kg/ha/m) 1.2 0.8 0.0
Costs (1000 baht/ha/m) 7.3 7.3 5.5
Other variable costs (1000
baht/ha/m)
18.4 21.1 14.5
Sales revenues (1000 baht/ha/m) 202.5 114.5 82.9
5.4 Methods
5.4.1 Mathematical Programming-based Multi-Agent Systems
Multi-agent systems in agricultural economics are useful in situations where model
complexity leads to analytical intractability, so that equilibrium conditions either cannot be
identified or solved (Nolan et al., 2009). MPMAS is an agent-based software package that
was designed to understand how agricultural technology, market dynamics, environmental
change, and policy intervention affect a heterogeneous population of farm households and the
agro-ecological resources these households command (Schreinemachers and Berger, 2011).
MPMAS belongs to a category of models referred to as agent-based models of land-use and
land-cover change (ABM/LUCC). The interactions of autonomous individuals with each
other and with a cellular component, representing the physical landscape make them effective
at analyzing resource management problems and add to the capabilities of standard bio-
economic models (Berger et al., 2006).
Schreinemachers and Berger (2011) provide a detailed description of the MPMAS architecture
and model equations based on the ODD protocol (2011). The full implementation details of this
particular application are explained in Grovermann (Grovermann, 2015). Here we give a brief
overview of the model and focus on the main novelties regarding pesticide use decisions and
IPM adoption.

Publication IV: ‘Smart’ policies to reduce pesticide use
82
For the present application a subset of available MPMAS features was used. Figure 5.3
illustrates how the various model components are connected. Agent decision-making depends
on market prices, the availability of resources (cash, land and assets), the access to
innovations, and past information about crop yields, which are endogenous in the model. The
model is recursive, meaning that agent resources are carried over in each simulation year and
agent expectations of market prices and crop yields are updated.
Figure 5.3: Dynamics of the MPMAS Mae Sa watershed model
Agents form expectations about crop yields, water supply and market prices based on past
experience, following the theory of adaptive expectations. Agents revise expectations
annually in proportion to the difference between actual and expected values as described in
Schreinemachers and Berger (2011). The simulation period was set to five years, which we
judged as a realistic time frame for pesticide reduction strategies to make an impact. The
same buying prices for inputs and farm-gate selling prices for the harvested produce were
assumed for all agents and were kept constant over time. Due to the small share of the Mae
Sa watershed in overall horticulture in northern Thailand, it was assumed that changes in
production did not affect prices. Mathematically, the individual agent decision problem can
be described as follows:
Maximize𝑓(𝑋) = ∑ 𝑝𝑖𝑥𝑖
𝑛
𝑖=1
(1)
Subject to ∑ ∑ 𝑏𝑖𝑗𝑥𝑖 ≤ 𝑦𝑗
𝑚
𝑗=1
𝑛
𝑖=1
(2)
Subject to ∑ 𝑥𝑖 ≥ 0
𝑛
𝑖=1
(3)
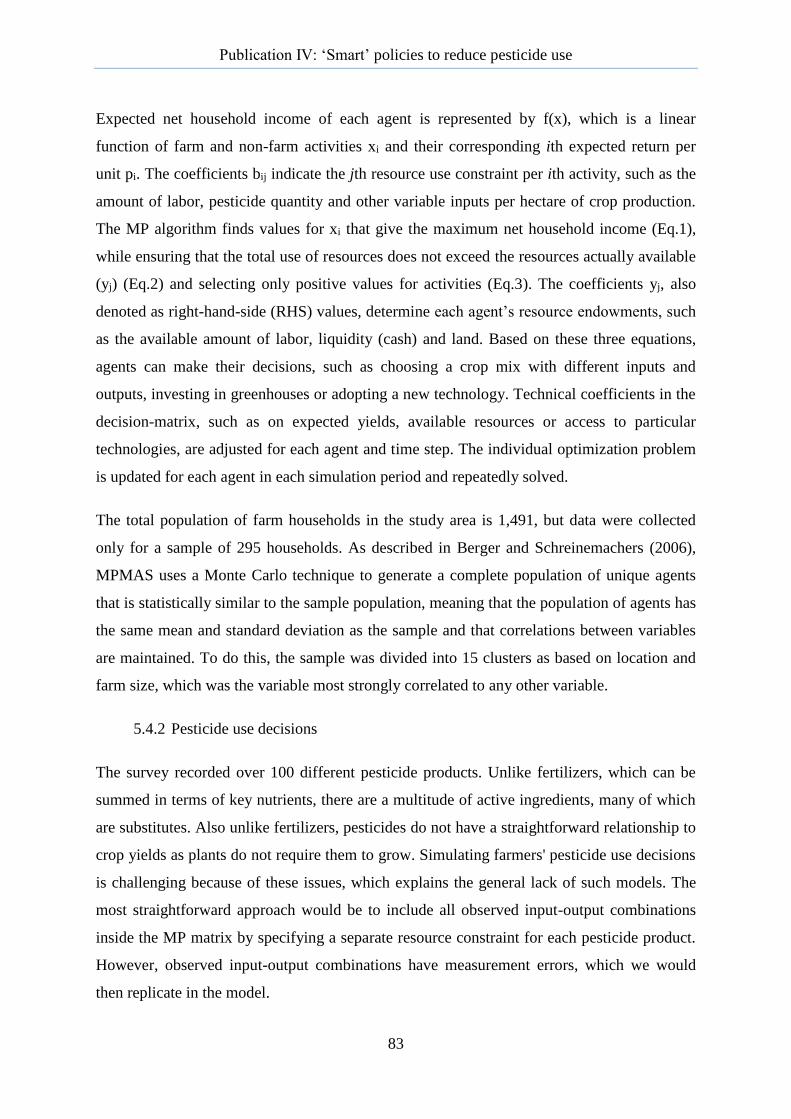
Publication IV: ‘Smart’ policies to reduce pesticide use
83
Expected net household income of each agent is represented by f(x), which is a linear
function of farm and non-farm activities xi and their corresponding ith expected return per
unit pi. The coefficients bij indicate the jth resource use constraint per ith activity, such as the
amount of labor, pesticide quantity and other variable inputs per hectare of crop production.
The MP algorithm finds values for xi that give the maximum net household income (Eq.1),
while ensuring that the total use of resources does not exceed the resources actually available
(yj) (Eq.2) and selecting only positive values for activities (Eq.3). The coefficients yj, also
denoted as right-hand-side (RHS) values, determine each agent’s resource endowments, such
as the available amount of labor, liquidity (cash) and land. Based on these three equations,
agents can make their decisions, such as choosing a crop mix with different inputs and
outputs, investing in greenhouses or adopting a new technology. Technical coefficients in the
decision-matrix, such as on expected yields, available resources or access to particular
technologies, are adjusted for each agent and time step. The individual optimization problem
is updated for each agent in each simulation period and repeatedly solved.
The total population of farm households in the study area is 1,491, but data were collected
only for a sample of 295 households. As described in Berger and Schreinemachers (2006),
MPMAS uses a Monte Carlo technique to generate a complete population of unique agents
that is statistically similar to the sample population, meaning that the population of agents has
the same mean and standard deviation as the sample and that correlations between variables
are maintained. To do this, the sample was divided into 15 clusters as based on location and
farm size, which was the variable most strongly correlated to any other variable.
5.4.2 Pesticide use decisions
The survey recorded over 100 different pesticide products. Unlike fertilizers, which can be
summed in terms of key nutrients, there are a multitude of active ingredients, many of which
are substitutes. Also unlike fertilizers, pesticides do not have a straightforward relationship to
crop yields as plants do not require them to grow. Simulating farmers' pesticide use decisions
is challenging because of these issues, which explains the general lack of such models. The
most straightforward approach would be to include all observed input-output combinations
inside the MP matrix by specifying a separate resource constraint for each pesticide product.
However, observed input-output combinations have measurement errors, which we would
then replicate in the model.
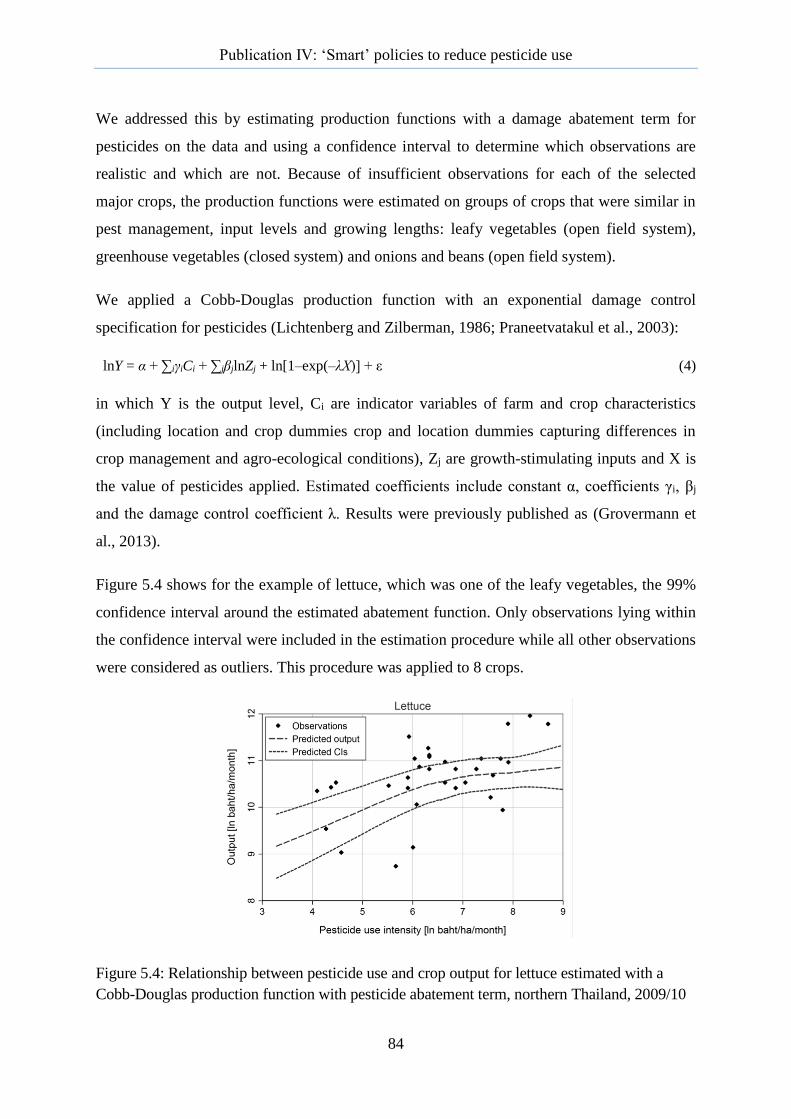
Publication IV: ‘Smart’ policies to reduce pesticide use
84
We addressed this by estimating production functions with a damage abatement term for
pesticides on the data and using a confidence interval to determine which observations are
realistic and which are not. Because of insufficient observations for each of the selected
major crops, the production functions were estimated on groups of crops that were similar in
pest management, input levels and growing lengths: leafy vegetables (open field system),
greenhouse vegetables (closed system) and onions and beans (open field system).
We applied a Cobb-Douglas production function with an exponential damage control
specification for pesticides (Lichtenberg and Zilberman, 1986; Praneetvatakul et al., 2003):
lnY = α + ∑iγiCi + ∑jβjlnZj + ln[1–exp(–λX)] + ε (4)
in which Y is the output level, Ci are indicator variables of farm and crop characteristics
(including location and crop dummies crop and location dummies capturing differences in
crop management and agro-ecological conditions), Zj are growth-stimulating inputs and X is
the value of pesticides applied. Estimated coefficients include constant α, coefficients γi, βj
and the damage control coefficient λ. Results were previously published as (Grovermann et
al., 2013).
Figure 5.4 shows for the example of lettuce, which was one of the leafy vegetables, the 99%
confidence interval around the estimated abatement function. Only observations lying within
the confidence interval were included in the estimation procedure while all other observations
were considered as outliers. This procedure was applied to 8 crops.
Figure 5.4: Relationship between pesticide use and crop output for lettuce estimated with a
Cobb-Douglas production function with pesticide abatement term, northern Thailand, 2009/10

Publication IV: ‘Smart’ policies to reduce pesticide use
85
For maize, rice, chayote and chrysanthemums there were too few observations to reliably
estimate a production function while there were no other similar crops with which they could
be grouped together. For these crops we calculated the mean quantity of pesticide use and
included all observations ± one standard deviation of the mean. For litchi, cluster analysis
was used to generate three management options with different input-output levels, while for
roses we specified only average management option because of the limited number of
observations that were available.
This approach gave 417 crop activities, for which 82 active ingredients were used, plus
fallow and IPM activities. Each active ingredient was included as a separate constraint in the
MP matrix and a separate buying activity. This made it possible to simulate the effect of a
price change of a particular pesticide or of a regulatory ban on a pesticide. All other variable
inputs (seeds, fertilizers, planting materials, hormones, etc.) were aggregated and expressed
as costs per hectare. Summary statistics for the selected crop activities are shown in Table
5.3. The complete MP matrix had 1,129 columns (activities) and 862 rows (constraints).
Table 5.3: Number of conventional crop activities (without IPM and fallow) in the model and
average crop output and input requirements per activity, Mae Sa watershed, Thailand,
2009/10.
Crop Activities
per crop
Growing
length
Yield Labour Pesticide
Use
Other
variable
inputs
Area
irrigated
months tons/ha mandays/ha kg/ha 1000
baht/ha %
Upland rice 9 5.7 1.68 15.61 0.20 2.04 0
Maize 11 4.7 2.24 9.79 0.07 0.59 9
White cabbage 66 3.4 25.64 95.19 1.58 30.55 26
Chinese cabbage 66 2.5 23.66 97.84 2.09 21.17 56
Chinese kale 23 2.3 5.93 211.83 1.62 15.91 96
Lettuce 24 2.5 9.45 100.12 0.94 23.68 54
Bell pepper 55 5.6 45.99 247.02 29.45 434.08 100
Tomato 15 5.2 68.68 416.18 14.34 591.52 100
Onion 12 4.0 26.30 165.29 8.61 85.72 100
Fresh bean 28 3.0 8.97 152.06 1.59 13.25 89
Chayote 27 6.2 18.67 178.99 0.09 85.76 96
Chrysanthemum 25 4.3 52.12 198.85 12.23 32.91 100
Roses 8 12.0 164.37 133.46 19.44 131.92 100
Litchi 48 12.0 4.05 11.80 0.82 3.32 67
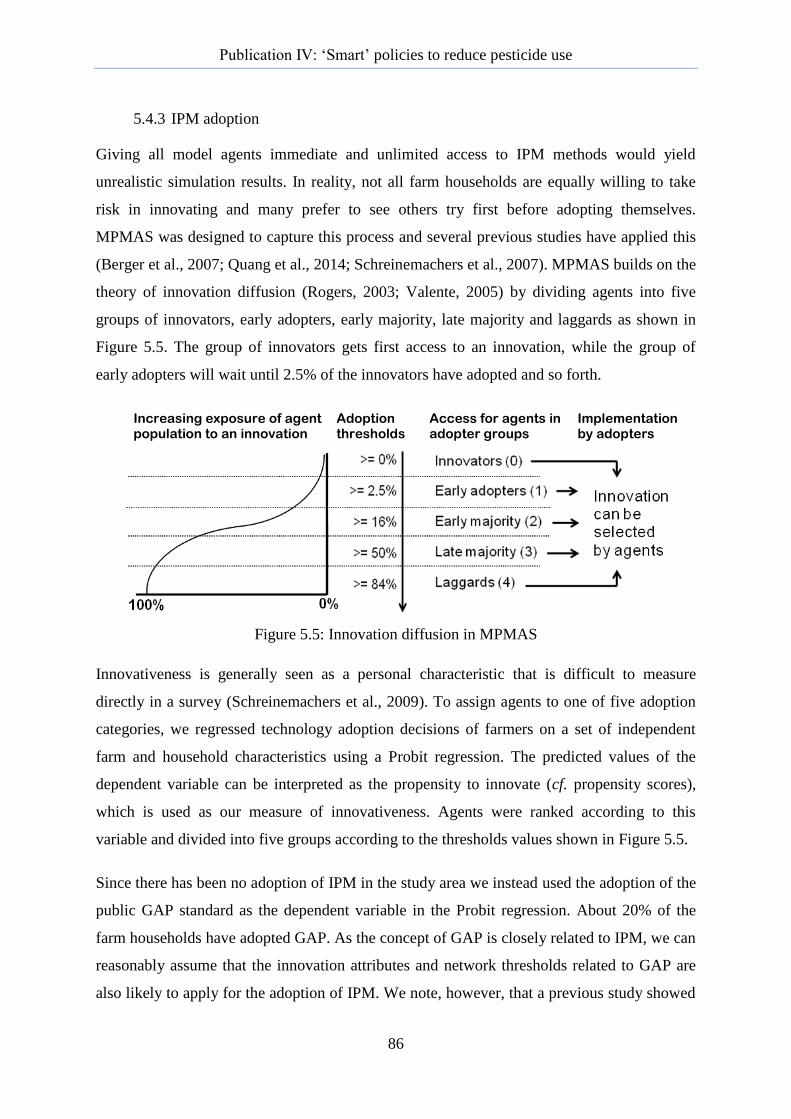
Publication IV: ‘Smart’ policies to reduce pesticide use
86
5.4.3 IPM adoption
Giving all model agents immediate and unlimited access to IPM methods would yield
unrealistic simulation results. In reality, not all farm households are equally willing to take
risk in innovating and many prefer to see others try first before adopting themselves.
MPMAS was designed to capture this process and several previous studies have applied this
(Berger et al., 2007; Quang et al., 2014; Schreinemachers et al., 2007). MPMAS builds on the
theory of innovation diffusion (Rogers, 2003; Valente, 2005) by dividing agents into five
groups of innovators, early adopters, early majority, late majority and laggards as shown in
Figure 5.5. The group of innovators gets first access to an innovation, while the group of
early adopters will wait until 2.5% of the innovators have adopted and so forth.
Increasing exposure of agent population to an innovation
Adoption thresholds
Access for agents in adopter groups
Implementation by adopters
Figure 5.5: Innovation diffusion in MPMAS
Innovativeness is generally seen as a personal characteristic that is difficult to measure
directly in a survey (Schreinemachers et al., 2009). To assign agents to one of five adoption
categories, we regressed technology adoption decisions of farmers on a set of independent
farm and household characteristics using a Probit regression. The predicted values of the
dependent variable can be interpreted as the propensity to innovate (cf. propensity scores),
which is used as our measure of innovativeness. Agents were ranked according to this
variable and divided into five groups according to the thresholds values shown in Figure 5.5.
Since there has been no adoption of IPM in the study area we instead used the adoption of the
public GAP standard as the dependent variable in the Probit regression. About 20% of the
farm households have adopted GAP. As the concept of GAP is closely related to IPM, we can
reasonably assume that the innovation attributes and network thresholds related to GAP are
also likely to apply for the adoption of IPM. We note, however, that a previous study showed
Publication IV: ‘Smart’ policies to reduce pesticide use
87
that GAP adoption did not lower pesticide use in the study area and we thus do not consider it
is a pesticide reduction strategy in our study (Schreinemachers et al., 2012).
Empirically, we used a two-stage econometric estimation that first explains whether or not
farmers know about the GAP standard (selection equation) and secondly whether or not they
have actually adopted it (Probit equation). The first stage corresponds to the knowledge and
persuasion stage of the adoption process, which is a pre-condition for adoption: If a farmer
does not know about GAP then the adoption decision cannot be observed. The likelihood-
ratio (LR) test of independent equations was significant (Chi2 = 3.88; Prob. > chi2 = 0.049),
indicating that it was necessary to correct for sample selection bias with a Heckman
procedure. The analysis was based on a set of explanatory variables, which represent farm
characteristics as well as selected network characteristics, such as the links of an individual
farm household to those households being aware of the innovation, the ties of an actor with
the outside world and the prominence of a person in a network (Valente, 2005). For more
detailed regression results we refer to Grovermann (2015).
5.4.4 Investment in IPM
The adoption of IPM requires a long-term commitment of farmers to certain production
practices. It is therefore a long-term investment rather than a recurrent production decision.
Conveniently, MPMAS separates between such investment decisions, which also include
planting trees or buying assets, and recurrent production decisions about variable inputs and
choice of seasonal crops. MPMAS simulates these agent decisions by solving two separate
MP matrices: one with long-term agent expectations about resources, yields and prices and
one with the current expectations about these factors (Berger, 2001). This separation captures
the trade-off between short-term income from production and long-term income from
investment (Schreinemachers et al., 2010).
Table 5.4 shows how IPM vegetables were implemented in the MP matrix. In the investment
stage, agents that have access to IPM through the innovation module can select one of three
alternative crop rotations for IPM. Once adopted, it is assumed that agents will continue to
practice IPM for at least 6 years before possibly returning to conventional agriculture.
IPM is knowledge intensive and comes with some upfront (acquisition) costs for light
terracing, for planting of grass strips and for simple plastic shelters to protect the plants from
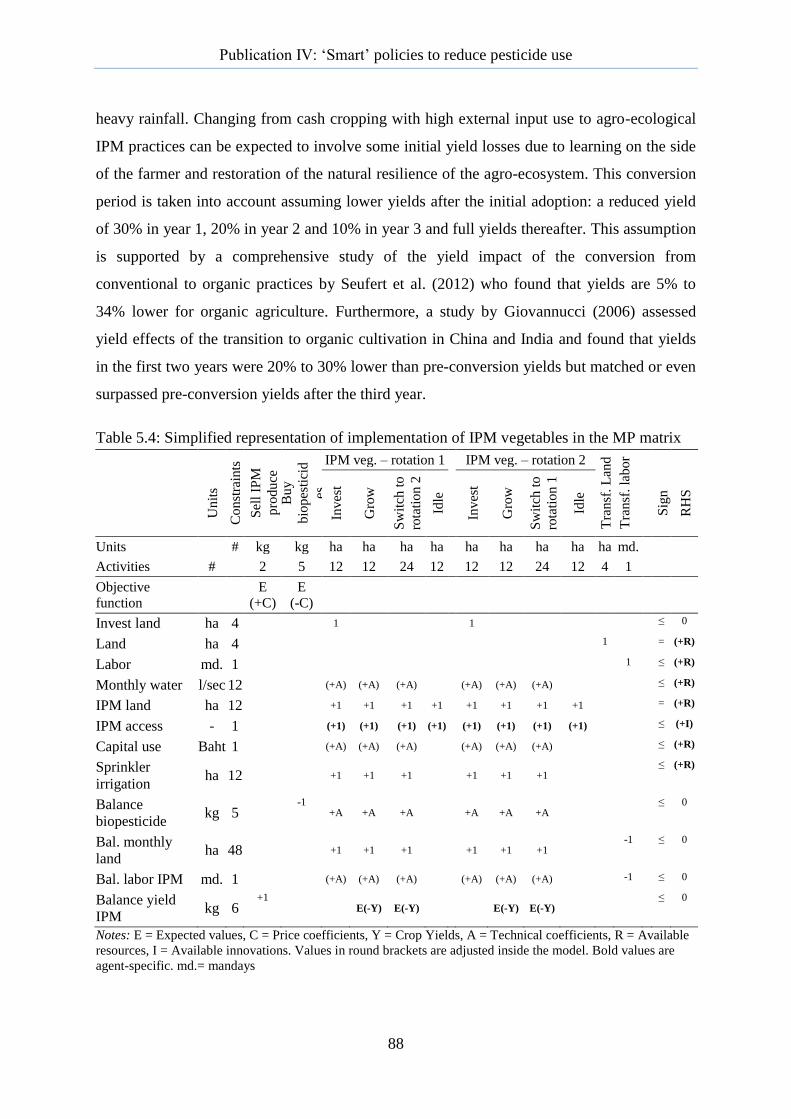
Publication IV: ‘Smart’ policies to reduce pesticide use
88
heavy rainfall. Changing from cash cropping with high external input use to agro-ecological
IPM practices can be expected to involve some initial yield losses due to learning on the side
of the farmer and restoration of the natural resilience of the agro-ecosystem. This conversion
period is taken into account assuming lower yields after the initial adoption: a reduced yield
of 30% in year 1, 20% in year 2 and 10% in year 3 and full yields thereafter. This assumption
is supported by a comprehensive study of the yield impact of the conversion from
conventional to organic practices by Seufert et al. (2012) who found that yields are 5% to
34% lower for organic agriculture. Furthermore, a study by Giovannucci (2006) assessed
yield effects of the transition to organic cultivation in China and India and found that yields
in the first two years were 20% to 30% lower than pre-conversion yields but matched or even
surpassed pre-conversion yields after the third year.
Table 5.4: Simplified representation of implementation of IPM vegetables in the MP matrix
Const
rain
ts
Sel
l IP
M
pro
duce
B
uy
bio
pes
tici
d
es
IPM veg. – rotation 1 IPM veg. – rotation 2
Tra
nsf
. L
and
Tra
nsf
. la
bor
Unit
s
Inves
t
Gro
w
Sw
itch
to
rota
tion 2
Idle
Inves
t
Gro
w
Sw
itch
to
rota
tion 1
Idle
Sig
n
RH
S
Units # kg kg ha ha ha ha ha ha ha ha ha md.
Activities # 2 5 12 12 24 12 12 12 24 12 4 1
Objective
function
E
(+C)
E
(-C)
Invest land ha 4 1
1 ≤ 0
Land ha 4
1 = (+R)
Labor md. 1
1 ≤ (+R)
Monthly water l/sec 12 (+A) (+A) (+A) (+A) (+A) (+A) ≤ (+R)
IPM land ha 12 +1 +1 +1 +1 +1 +1 +1 +1 = (+R)
IPM access - 1 (+1) (+1) (+1) (+1) (+1) (+1) (+1) (+1) ≤ (+I)
Capital use Baht 1 (+A) (+A) (+A) (+A) (+A) (+A) ≤ (+R)
Sprinkler
irrigation ha 12
+1 +1 +1
+1 +1 +1
≤ (+R)
Balance
biopesticide kg 5
-1 +A +A +A
+A +A +A
≤ 0
Bal. monthly
land ha 48
+1 +1 +1
+1 +1 +1
-1 ≤ 0
Bal. labor IPM md. 1 (+A) (+A) (+A) (+A) (+A) (+A) -1 ≤ 0
Balance yield
IPM kg 6
+1
E(-Y) E(-Y)
E(-Y) E(-Y)
≤ 0
Notes: E = Expected values, C = Price coefficients, Y = Crop Yields, A = Technical coefficients, R = Available
resources, I = Available innovations. Values in round brackets are adjusted inside the model. Bold values are
agent-specific. md.= mandays

Publication IV: ‘Smart’ policies to reduce pesticide use
89
5.4.5 Resource constraints
Water is an important production constraint during the dry season when rainfall shows high
variability. Following a previous application of MPMAS to the same watershed
(Schreinemachers et al., 2009; Schreinemachers et al., 2010), this study integrated the
CropWat model (Allen, 1998; Doorenbos et al., 1979) to simulate the crop yield response to
variations in the water supply. Monthly water requirements are specified for each cropping
activity while the monthly water supply is controlled by a spatial routing module in MPMAS.
Weather data from the Royal Project station plus the CropWat software were used to
calculate effective monthly rainfall, which was assumed constant for each year of the
simulation.
Cash is an important constraint in agricultural production yet available amounts of cash vary
widely over the year and cannot be observed through a survey. We therefore calculated for
each farm household the total expenditures on crop inputs and depreciation on investment
and assumed that this was the amount of cash that a household has available. Like other
assets such as land, labor, greenhouses and orchards, we endowed each agent with cash at the
start of the simulation. A cash constraint was included in the MP matrix and values were
updated at each simulation period. Agents had access to short-term credit at a 9% annual
interest rate or could deposit cash at a 2% interest rate. These interest rates were assumed
constant over time. Agents can choose, to a limited extend, to perform off-farm labor (at 70
baht per manday) and have access to hired labor (at 96 baht per manday). They can resort to
both according to their individual allocations.
5.4.6 Pesticide use reduction strategies
The baseline simulation resembles the actual situation as observed in the farm household
survey. The alternative scenarios A-D make changes to the baseline assumptions. The focus
of this study is on financial instruments and the adoption of IPM, assessing the impact of the
following strategies to reduce pesticide use:
A. Introduction of IPM: IPM is not available and not adopted by agents in the baseline
simulation. As part of the scenario analysis, access to IPM, being a complete innovation, is
granted to the innovator segment and can consequently diffuse through the network.
Publication IV: ‘Smart’ policies to reduce pesticide use
90
B. Progressive pesticide tax based on toxicity: In a range of scenarios, a sales tax on
pesticides is introduced with the rate increasing with toxicity following the WHO
classification system. The alternative rates are shown in Table 5.5 and follow the logic of
economic disincentives, which offer the prospect of reducing pollution beyond set pollution
limits and of encouraging polluters with lower abatement costs to reduce their environmental
impacts, more so than polluters with higher abatement costs (Jaeger, 2005). The rates were
set to levels that were reasonable from a policy implementation perspective. Owing to the
increasing tax burden with increasing pollution levels, farmers are likely to oppose pesticide
taxes. Yet, a tax policy is said to be more acceptable to farmers if the tax revenues are
redistributed to the farmers in the form of lump sum payments (Buchanan and Tullock,
1975). To maintain effectiveness of the tax (dis)incentive, the level of the reimbursement
must be decoupled from the level of the tax (i.e. big polluters should not receive a higher
reimbursement). This study therefore distributed the reimbursement based on farm size (i.e.
payments per hectare) as this variable is easy to observe and relatively static.
C. Price premium for IPM produce: Rather than redistributing tax revenues through lump
sum payments, they could be used as an incentive to encourage more sustainable production
of safer agricultural produce. Simulation experiments tested the effect of a price premium for
IPM produce of 2, 5 and 10%, respectively.
D. Biopesticide subsidy: As for the price premiums, the biopesticide subsidy was picked as a
pesticide use reduction strategy due to its practicability and implementation potential. Prices
of biopesticides were lowered by 20, 40 and 60% in the simulation experiments.
The scenarios applied combinations of the above strategies as shown in Table 5.5. Several
intervention levels, denoted as low, medium and high, were used to evaluate the effect of the
policies. Outcome indicators were compared between the baseline scenarios and the
alternative scenarios to assess the impact on:
Overall pesticide use: All chemical pesticides applied in the study area.
Use of highly toxic pesticides: Pesticides applied in the study area belonging to WHO
toxicity classes Ia, Ib and II.
Farm income: Money earned by farm households.
Cost-effectiveness: Costs of the respective policy, e.g. biopesticide subsidy, divided
by the average change in highly toxic pesticide use.
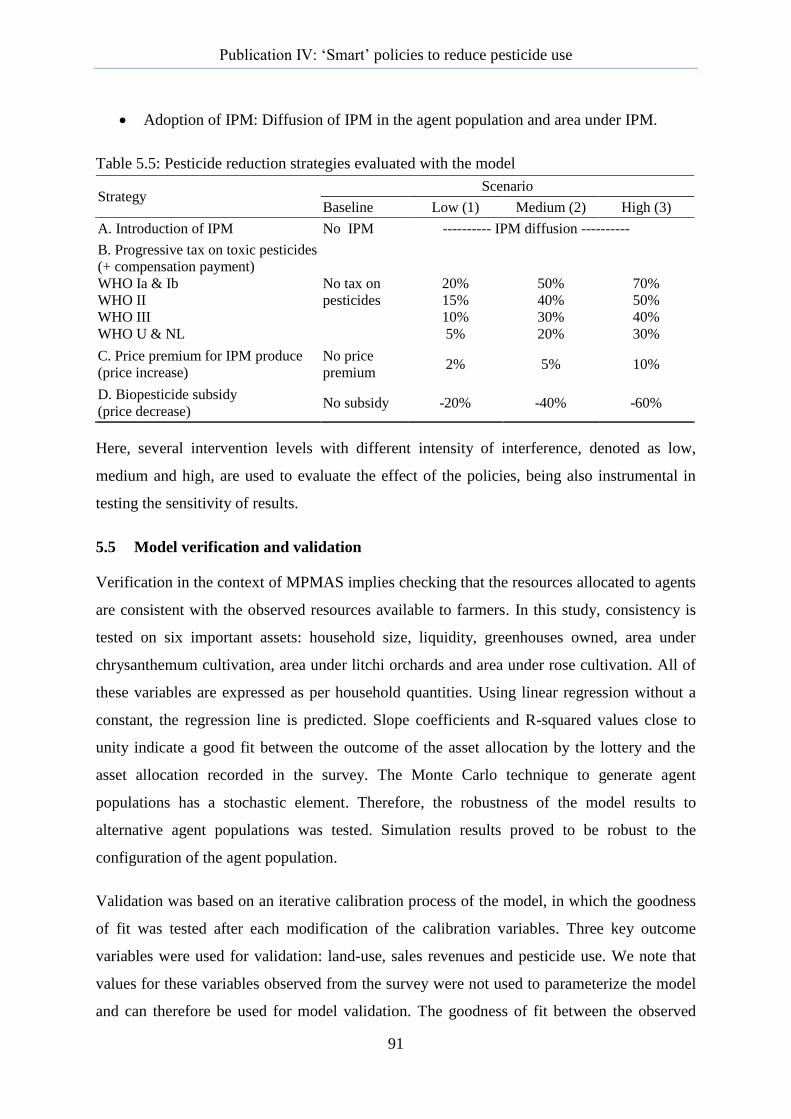
Publication IV: ‘Smart’ policies to reduce pesticide use
91
Adoption of IPM: Diffusion of IPM in the agent population and area under IPM.
Table 5.5: Pesticide reduction strategies evaluated with the model
Strategy Scenario
Baseline Low (1) Medium (2) High (3)
A. Introduction of IPM No IPM ---------- IPM diffusion ----------
B. Progressive tax on toxic pesticides
(+ compensation payment)
WHO Ia & Ib
WHO II
WHO III
WHO U & NL
No tax on
pesticides
20%
15%
10%
5%
50%
40%
30%
20%
70%
50%
40%
30%
C. Price premium for IPM produce
(price increase)
No price
premium 2% 5% 10%
D. Biopesticide subsidy
(price decrease) No subsidy -20% -40% -60%
Here, several intervention levels with different intensity of interference, denoted as low,
medium and high, are used to evaluate the effect of the policies, being also instrumental in
testing the sensitivity of results.
5.5 Model verification and validation
Verification in the context of MPMAS implies checking that the resources allocated to agents
are consistent with the observed resources available to farmers. In this study, consistency is
tested on six important assets: household size, liquidity, greenhouses owned, area under
chrysanthemum cultivation, area under litchi orchards and area under rose cultivation. All of
these variables are expressed as per household quantities. Using linear regression without a
constant, the regression line is predicted. Slope coefficients and R-squared values close to
unity indicate a good fit between the outcome of the asset allocation by the lottery and the
asset allocation recorded in the survey. The Monte Carlo technique to generate agent
populations has a stochastic element. Therefore, the robustness of the model results to
alternative agent populations was tested. Simulation results proved to be robust to the
configuration of the agent population.
Validation was based on an iterative calibration process of the model, in which the goodness
of fit was tested after each modification of the calibration variables. Three key outcome
variables were used for validation: land-use, sales revenues and pesticide use. We note that
values for these variables observed from the survey were not used to parameterize the model
and can therefore be used for model validation. The goodness of fit between the observed

Publication IV: ‘Smart’ policies to reduce pesticide use
92
situation from the survey and the model outcomes was determined by regressing observed
data on simulated data (again forcing the intercept through the origin) and by then evaluating
the slope coefficient o and R-squared. Coefficients ranged between 0.95 and 1.05 and R-
squared values ranged between 0.95 and 1, which indicates that the model was able to closely
replicate the observed situation for these key variables. Table 5.6 shows that the criteria are
met across 19 alternative configurations of the agent population. The model thus gives a
robust representation of farming in the study area.
Table 5.6: Validation results for land use, sales revenues and pesticide use
Land-use Sales revenues Pesticide use
Coef. R2 Coef. R2 Coef. R2
Obs. 19 19 19 19 19 19
Mean 0.991 0.995 0.960 0.962 0.980 0.981
Std. dev. 0.008 0.001 0.008 0.004 0.001 0.001
Min. 0.976 0.994 0.944 0.951 0.978 0.980
Max. 1.004 0.997 0.973 0.970 0.985 0.982
As the agent population was subdivided into clusters, the model can also be validated at a less
aggregate level. For testing goodness of fit at the cluster level, regressions were run for all
three outcome variables in each cluster. Coefficients at disaggregate level ranged from 0.805
to 1.040, with standard deviations between 0.075 and 0.207, which we regarded as
acceptable. The same applies to the R-squared values.
5.6 Results
5.6.1 Introduction of a progressive tax
Table 5.7 shows that even high taxes have only a moderate impact on pesticide use in our
simulations. The highest tax rate gives a pesticide reduction of 7.3%, and reduces net agent
income by 6.6%. A comparison of the high progressive tax with and without compensation
payments shows that the effect of compensation on pesticide reduction is negligible, but it
partially offsets the income loss. With regard to land use change, agents select crops using
fewer pesticides, such as chayote, increase in area, whereas pesticide-intensive crops, such as
onions or bell peppers, decrease in area.

Publication IV: ‘Smart’ policies to reduce pesticide use
93
Table 5.7: Simulation results showing the effect of a pesticide sales tax on income, tax
revenues and pesticide use as compared to the baseline scenario without a sales tax
Scenario Δ income Tax revenues Δ pesticide use Δ highly toxic p. use
%
1000
baht/hh
1000
baht/hh
% kg/ha
% kg/ha
Low progressive tax -1.24 -3.17 1.48 -2.06 -0.33 -2.67 -0.07
Medium progressive tax -3.96 -10.10 4.21 -5.03 -0.86 -6.26 -0.16
High progressive tax -6.56 -16.71 6.74 -7.34 -1.25 -8.26 -0.21
High progressive tax + compensation -4.81 -12.28 6.73 -7.47 -1.27 -8.27 -0.22
Note: Averages over all agents and simulation periods.
5.6.2 IPM introduction and promotion
The following simulation experiments aim at promoting the adoption of IPM rather than
penalizing pesticides. Price premiums are used as a mechanism to increase the attractiveness
of IPM, and subsidies for IPM inputs are introduced as a production support measure.
Crop activities using IPM are profitable compared to the conventional crop activities in the
model as they diffuse quickly through the agent population after becoming available. The
diffusion of IPM does not differ between the IPM stand-alone scenario, the low and medium
price premium as well as all the biopesticide subsidy scenarios. In year 4 agents in the early
majority segment can already adopt IPM. For the high price bonus level, access to IPM even
becomes available to agents in the late majority segment in year 5. The reduction in pesticide
use is also the highest for this scenario, reaching 22% in the fifth year. Compared to the
baseline, the income of agents increased in all IPM scenarios.
Even though pesticide use is most reduced through a high price premium for IPM produce,
the scenario creates a high cost that far exceeds pesticide tax revenues. In the case of the high
progressive tax, as Table 5.7 shows, the government could generate revenues of about 6,000
baht per agent. Put simply, apart from the high price premium scenario, all the other IPM
adoption scenarios could be financed with the tax returns. The cost-effectiveness values in
Table 5.8 evaluate the policy costs against the reduction in use of highly toxic pesticides.
Biopesticide subsidies appear as the most cost-effective.
Land-use changes clearly differ across the scenarios in terms of the reduction of area under
leafy and greenhouse vegetables. Compared to the IPM stand-alone scenario, the area under
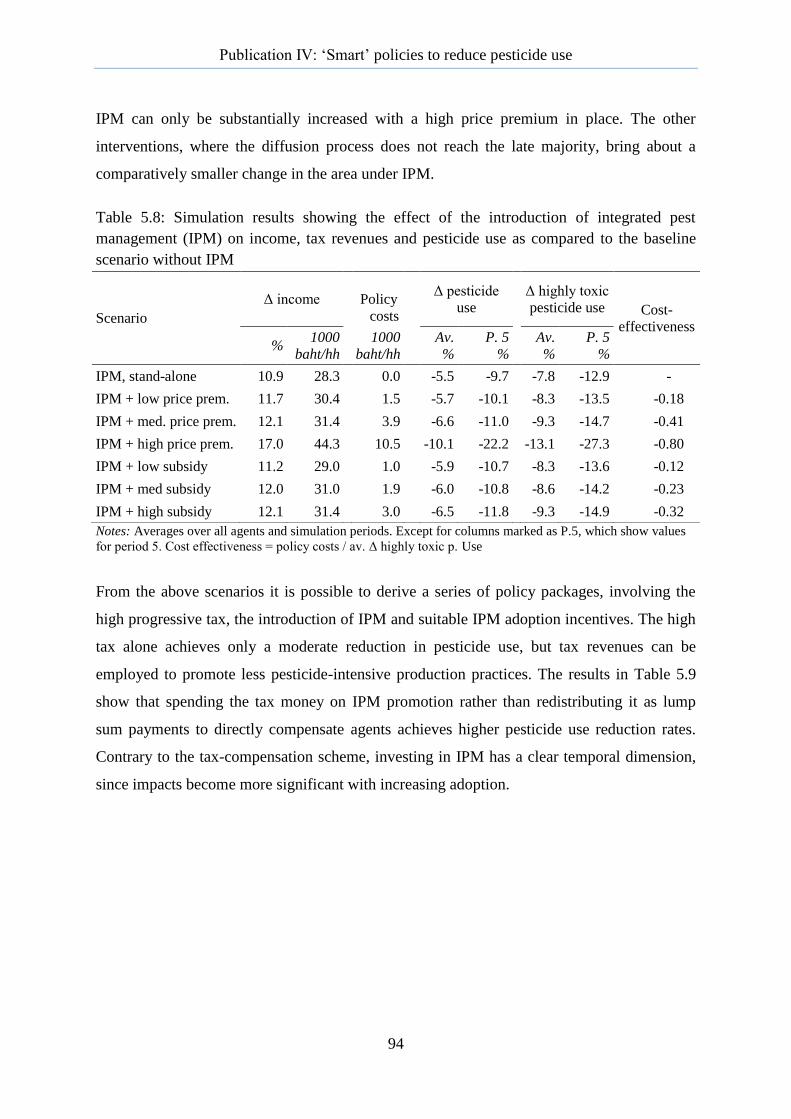
Publication IV: ‘Smart’ policies to reduce pesticide use
94
IPM can only be substantially increased with a high price premium in place. The other
interventions, where the diffusion process does not reach the late majority, bring about a
comparatively smaller change in the area under IPM.
Table 5.8: Simulation results showing the effect of the introduction of integrated pest
management (IPM) on income, tax revenues and pesticide use as compared to the baseline
scenario without IPM
Notes: Averages over all agents and simulation periods. Except for columns marked as P.5, which show values
for period 5. Cost effectiveness = policy costs / av. Δ highly toxic p. Use
From the above scenarios it is possible to derive a series of policy packages, involving the
high progressive tax, the introduction of IPM and suitable IPM adoption incentives. The high
tax alone achieves only a moderate reduction in pesticide use, but tax revenues can be
employed to promote less pesticide-intensive production practices. The results in Table 5.9
show that spending the tax money on IPM promotion rather than redistributing it as lump
sum payments to directly compensate agents achieves higher pesticide use reduction rates.
Contrary to the tax-compensation scheme, investing in IPM has a clear temporal dimension,
since impacts become more significant with increasing adoption.
Scenario
Δ income
Policy
costs
Δ pesticide
use
Δ highly toxic
pesticide use Cost-
effectiveness
% 1000
baht/hh
1000
baht/hh
Av.
%
P. 5
%
Av.
%
P. 5
%
IPM, stand-alone 10.9 28.3 0.0 -5.5 -9.7 -7.8 -12.9 -
IPM + low price prem. 11.7 30.4 1.5 -5.7 -10.1 -8.3 -13.5 -0.18
IPM + med. price prem. 12.1 31.4 3.9 -6.6 -11.0 -9.3 -14.7 -0.41
IPM + high price prem. 17.0 44.3 10.5 -10.1 -22.2 -13.1 -27.3 -0.80
IPM + low subsidy 11.2 29.0 1.0 -5.9 -10.7 -8.3 -13.6 -0.12
IPM + med subsidy 12.0 31.0 1.9 -6.0 -10.8 -8.6 -14.2 -0.23
IPM + high subsidy 12.1 31.4 3.0 -6.5 -11.8 -9.3 -14.9 -0.32
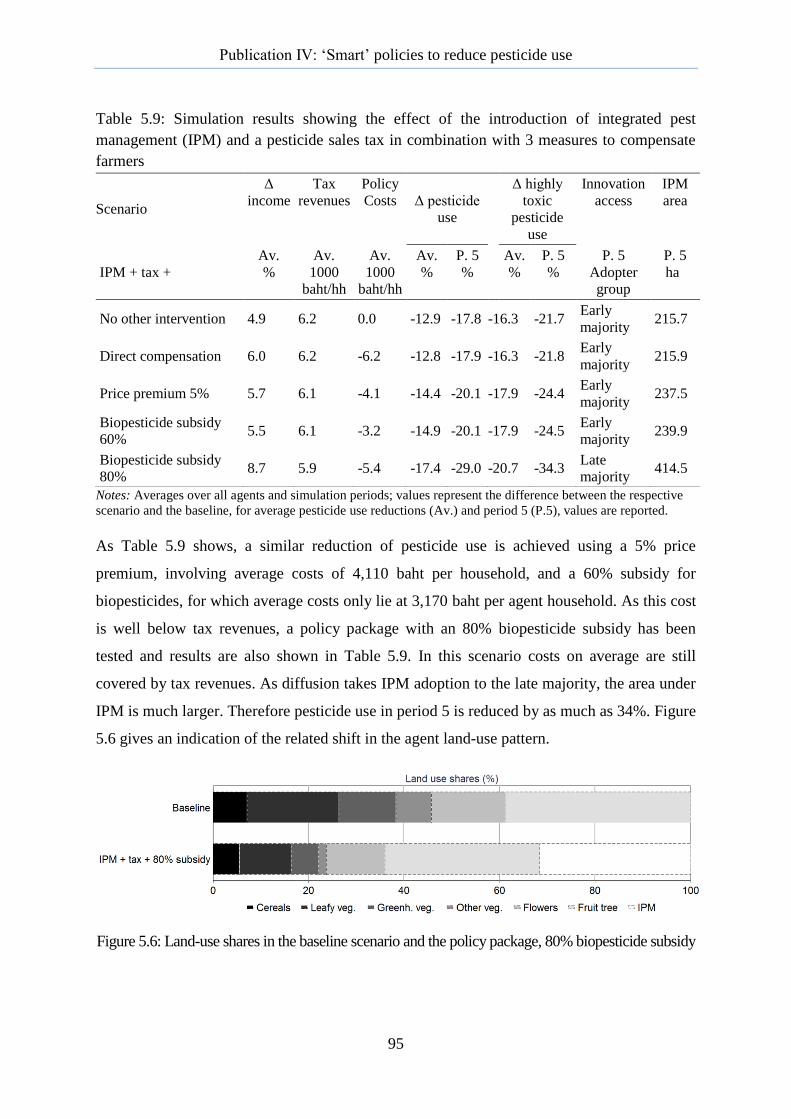
Publication IV: ‘Smart’ policies to reduce pesticide use
95
Table 5.9: Simulation results showing the effect of the introduction of integrated pest
management (IPM) and a pesticide sales tax in combination with 3 measures to compensate
farmers
Notes: Averages over all agents and simulation periods; values represent the difference between the respective
scenario and the baseline, for average pesticide use reductions (Av.) and period 5 (P.5), values are reported.
As Table 5.9 shows, a similar reduction of pesticide use is achieved using a 5% price
premium, involving average costs of 4,110 baht per household, and a 60% subsidy for
biopesticides, for which average costs only lie at 3,170 baht per agent household. As this cost
is well below tax revenues, a policy package with an 80% biopesticide subsidy has been
tested and results are also shown in Table 5.9. In this scenario costs on average are still
covered by tax revenues. As diffusion takes IPM adoption to the late majority, the area under
IPM is much larger. Therefore pesticide use in period 5 is reduced by as much as 34%. Figure
5.6 gives an indication of the related shift in the agent land-use pattern.
Figure 5.6: Land-use shares in the baseline scenario and the policy package, 80% biopesticide subsidy
Scenario
Δ
income
Tax
revenues
Policy
Costs Δ pesticide
use
Δ highly
toxic
pesticide
use
Innovation
access
IPM
area
IPM + tax +
Av.
%
Av.
1000
baht/hh
Av.
1000
baht/hh
Av.
%
P. 5
%
Av.
%
P. 5
%
P. 5
Adopter
group
P. 5
ha
No other intervention 4.9 6.2 0.0 -12.9 -17.8 -16.3 -21.7 Early
majority 215.7
Direct compensation 6.0 6.2 -6.2 -12.8 -17.9 -16.3 -21.8 Early
majority 215.9
Price premium 5% 5.7 6.1 -4.1 -14.4 -20.1 -17.9 -24.4 Early
majority 237.5
Biopesticide subsidy
60% 5.5 6.1 -3.2 -14.9 -20.1 -17.9 -24.5
Early
majority 239.9
Biopesticide subsidy
80% 8.7 5.9 -5.4 -17.4 -29.0 -20.7 -34.3
Late
majority 414.5
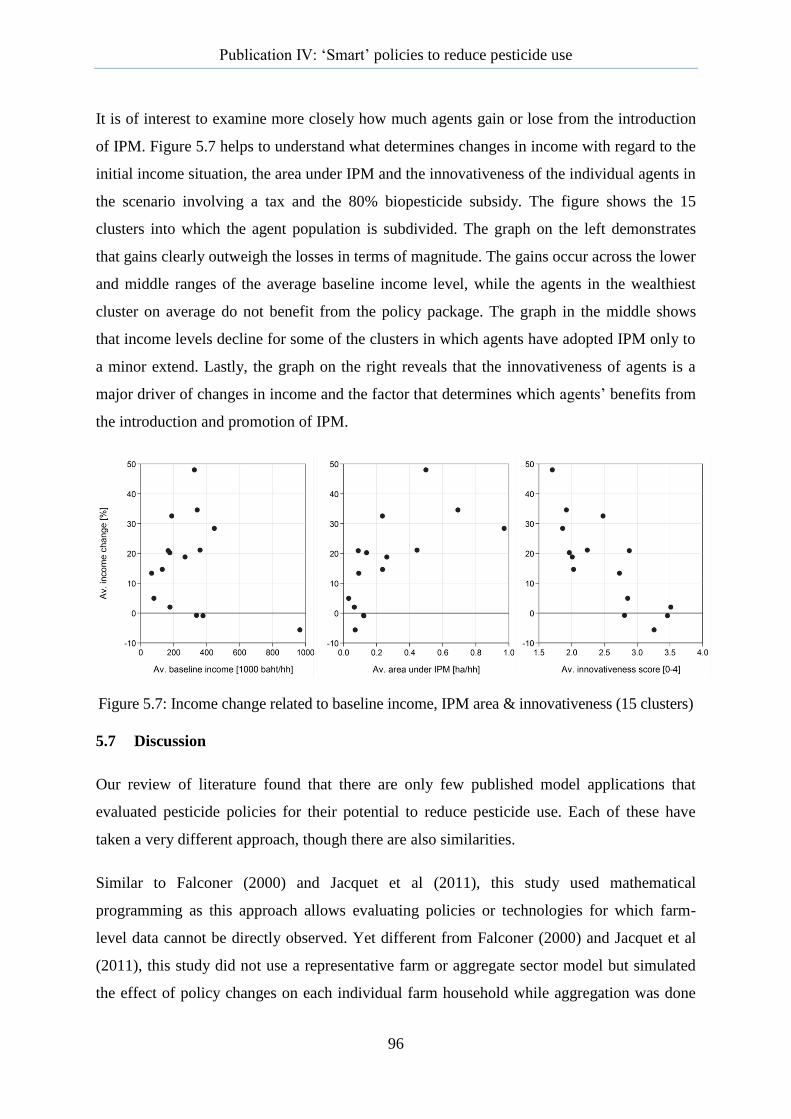
Publication IV: ‘Smart’ policies to reduce pesticide use
96
It is of interest to examine more closely how much agents gain or lose from the introduction
of IPM. Figure 5.7 helps to understand what determines changes in income with regard to the
initial income situation, the area under IPM and the innovativeness of the individual agents in
the scenario involving a tax and the 80% biopesticide subsidy. The figure shows the 15
clusters into which the agent population is subdivided. The graph on the left demonstrates
that gains clearly outweigh the losses in terms of magnitude. The gains occur across the lower
and middle ranges of the average baseline income level, while the agents in the wealthiest
cluster on average do not benefit from the policy package. The graph in the middle shows
that income levels decline for some of the clusters in which agents have adopted IPM only to
a minor extend. Lastly, the graph on the right reveals that the innovativeness of agents is a
major driver of changes in income and the factor that determines which agents’ benefits from
the introduction and promotion of IPM.
Figure 5.7: Income change related to baseline income, IPM area & innovativeness (15 clusters)
5.7 Discussion
Our review of literature found that there are only few published model applications that
evaluated pesticide policies for their potential to reduce pesticide use. Each of these have
taken a very different approach, though there are also similarities.
Similar to Falconer (2000) and Jacquet et al (2011), this study used mathematical
programming as this approach allows evaluating policies or technologies for which farm-
level data cannot be directly observed. Yet different from Falconer (2000) and Jacquet et al
(2011), this study did not use a representative farm or aggregate sector model but simulated
the effect of policy changes on each individual farm household while aggregation was done
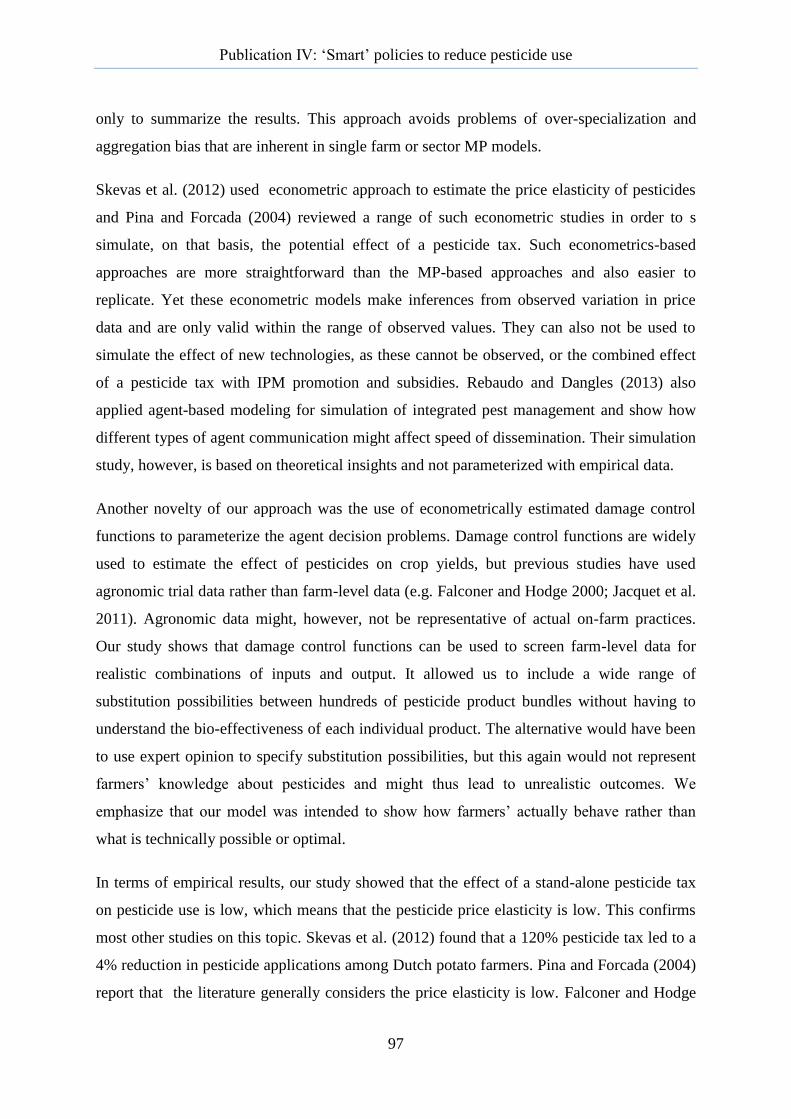
Publication IV: ‘Smart’ policies to reduce pesticide use
97
only to summarize the results. This approach avoids problems of over-specialization and
aggregation bias that are inherent in single farm or sector MP models.
Skevas et al. (2012) used econometric approach to estimate the price elasticity of pesticides
and Pina and Forcada (2004) reviewed a range of such econometric studies in order to s
simulate, on that basis, the potential effect of a pesticide tax. Such econometrics-based
approaches are more straightforward than the MP-based approaches and also easier to
replicate. Yet these econometric models make inferences from observed variation in price
data and are only valid within the range of observed values. They can also not be used to
simulate the effect of new technologies, as these cannot be observed, or the combined effect
of a pesticide tax with IPM promotion and subsidies. Rebaudo and Dangles (2013) also
applied agent-based modeling for simulation of integrated pest management and show how
different types of agent communication might affect speed of dissemination. Their simulation
study, however, is based on theoretical insights and not parameterized with empirical data.
Another novelty of our approach was the use of econometrically estimated damage control
functions to parameterize the agent decision problems. Damage control functions are widely
used to estimate the effect of pesticides on crop yields, but previous studies have used
agronomic trial data rather than farm-level data (e.g. Falconer and Hodge 2000; Jacquet et al.
2011). Agronomic data might, however, not be representative of actual on-farm practices.
Our study shows that damage control functions can be used to screen farm-level data for
realistic combinations of inputs and output. It allowed us to include a wide range of
substitution possibilities between hundreds of pesticide product bundles without having to
understand the bio-effectiveness of each individual product. The alternative would have been
to use expert opinion to specify substitution possibilities, but this again would not represent
farmers’ knowledge about pesticides and might thus lead to unrealistic outcomes. We
emphasize that our model was intended to show how farmers’ actually behave rather than
what is technically possible or optimal.
In terms of empirical results, our study showed that the effect of a stand-alone pesticide tax
on pesticide use is low, which means that the pesticide price elasticity is low. This confirms
most other studies on this topic. Skevas et al. (2012) found that a 120% pesticide tax led to a
4% reduction in pesticide applications among Dutch potato farmers. Pina and Forcada (2004)
report that the literature generally considers the price elasticity is low. Falconer and Hodge
Publication IV: ‘Smart’ policies to reduce pesticide use
98
(2000, 2001) also showed that only high taxes can achieve significant pesticide use
reductions.
The most important finding of our study is that promotion of IPM and subsidies for
biopesticides are much more effective policies for reducing pesticide use than a stand-alone
pesticide tax. Yet taxes create government revenues, while subsidies create costs. Our study
therefore showed the cost effectiveness of combining pesticide taxes with supportive
measures, such as price premiums for safer vegetables and subsidies for biopesticides. The
simulation experiments showed that subsidies for biopesticides are the most cost effective
policy. A combination of a high progressive tax and a 60% biopesticide subsidy financed by
the tax revenues, reduced overall pesticide use after five simulation periods by 18%, and
reduced the use of highly toxic pesticides by almost 25%. With additional funds, especially if
resources can be shifted from general subsidies for conventional agriculture to targeted
financing of sustainable agriculture, it could be possible to sustain an 80% biopesticide
subsidy and reduce the use of highly toxic pesticide by almost 35% within five years. These
findings confirm Falconer and Hodge (2000) who also found that taxes can be more effective
if farmers are provided with pest control alternatives. It also confirms Jacquet et al. (2011)
who showed that financially supporting sustainable farming technologies is much more
effective at lowering pesticide use than taxes.
The lack of alternatives to synthetic pesticides among farmers has been described as one of
the main factors for the high levels of pesticide use observed in Thailand and Vietnam
(Lamers et al., 2013; Schreinemachers et al., 2011). Praneetvatakul et al. (2013) concluded
that it is best to introduce a package of policies that combines an environmental tax with
supportive measures to help farmers change their on-farm practices. This research has
substantiated this proposition. Biopesticide subsides are also from a policy implementation
perspective practicable, as infrastructure for input subsidies is often in place. With IPM
available for crops other than leafy vegetables, in particular bell peppers and tomato, it can be
assumed that even substantially higher pesticide use reductions can be achieved.
5.8 Conclusion
A smart policy package can bring down levels of pesticide significantly without negatively
affecting livelihoods at large. This study has contributed to clarifying that a trade-off between
environmental protection and farm household incomes can be avoided if policy-makers use
Publication IV: ‘Smart’ policies to reduce pesticide use
99
the right economic instruments to constrain chemical pesticide use and motivate changes
towards more integrated growing practices. In this pesticide policy context, it has been shown
how the use of production functions with damage control specifications, the inclusion of
adoption and diffusion of pesticide use reduction technologies and the use of an agent-based
framework can refine the overall modeling approach.
5.9 Acknowledgements
The authors would like to acknowledge the Deutsche Forschungsgemeinschaft (DFG) for
financially supporting this simulation study, which was carried out under Project SFB-564
(the Uplands Program). Suthathip Riwthong, in addition, acknowledges funding of her
doctoral studies by Edith-Karla Eiselen commemorating her late husband Dr. Hermann
Eiselen. Finally, we would like to thank Dr. Suwanna Praneetvatakul and Dr. Chakrit
Potchanasin for their help at various stages of the research.
5.10 References
Allen, R.G., 1998. Crop evapotranspiration: guidelines for computing crop water
requirements, Irrigation and Drainage Series No. 56. Food and Agriculture
Organization of the United Nations, Rome.
Berger, T., 2001. Agent-based spatial models applied to agriculture: a simulation tool for
technology diffusion, resource use changes and policy analysis. Agricultural
Economics 25, 245.
Berger, T., Birner, R., Díaz, J., McCarthy, N., Wittmer, H., 2007. Capturing the complexity
of water uses and water users within a multi-agent framework Water Resources
Management 21, 129-148.
Berger, T., Schreinemachers, P., 2006. Creating agents and landscapes for multiagent systems
from random samples. Ecology and Society 11, 10 - 19.
Berger, T., Schreinemachers, P., Woelcke, J., 2006. Multi-agent simulation for the targeting
of development policies in less-favored areas. Agricultural Systems 88, 28-43.
Buchanan, J., Tullock, G., 1975. Polluters' Profits and Political Response: Direct Controls
versus Taxes. The American Economic Review 65, 139-147.
Carvalho, F.P., 2006. Agriculture, pesticides, food security and food safety. Environmental
Science & Policy 9, 685-692.
Cowan, R., Gunby, P., 1996. Sprayed to Death: Path Dependence, Lock-in and Pest Control
Strategies. The Economic Journal 106, 521-542.
Doorenbos, J., Kassam, A.H., Bentvelsen, C.I.M., 1979. Yield response to water, Irrigation
and Drainage Series No. 33. Food and Agriculture Organization of the United
Nations, Rome.
Ecobichon, D.J., 2001. Pesticide use in developing countries. Toxicology 160, 27-33.
Falconer, K., Hodge, I., 2000. Using economic incentives for pesticide usage reductions:
responsiveness to input taxation and agricultural systems. Agricultural Systems 63,
175-194.

Publication IV: ‘Smart’ policies to reduce pesticide use
100
Falconer, K., Hodge, I., 2001. Pesticide taxation and multi-objective policy-making: farm
modelling to evaluate profit: environment trade-offs. Ecological Economics 36, 263 -
279.
Giovannucci, D., 2006. Evaluation of Organic Agriculture and Poverty Reduction in Asia.
IFAD, Rome.
Grovermann, C., 2015. Assessment of Pesticide Use Reduction Strategies for Thai Highland
Agriculture: Combining Econometrics and Agent-based Modelling Peter Lang,
Frankfurt am Main.
Grovermann, C., Schreinemachers, P., Berger, T., 2013. Quantifying pesticide overuse from
farmer and societal points of view: An application to Thailand. Crop Protection 53,
161-168.
Heidhues, F., Pape, J., 2007. Sustainable Land Use and Sustainable Rural Livelihoods in
Mountainous Regions of Southeast Asia - Meeting the Challanges of Ecological,
Socio-Economic and Cultural Diversity, In: Heidhues, F., Herrmann, L., Neef, A.,
Neidhart, S., Pape, J., Sruamsiri, P., Thu, D.C., Valle Zárate, A. (Eds.), Sustainable
Land Use in Mountainous Regions of Southeast Asia. Springer, Heidelberg.
Jacquet, F., Butault, J.-P., Guichard, L., 2011. An economic analysis of the possibility of
reducing pesticides in French field crops. Ecological Economics 70, 1638-1648.
Jaeger, W.K., 2005. Environmental economics for tree huggers and other skeptics. Island
Press, London.
Lamers, M., Schreinemachers, P., Ingwersen, J., Sangchan, W., Grovermann, C., Berger, T.,
2013. Agricultural Pesticide Use in Mountainous Areas of Thailand and Vietnam:
Towards Reducing Exposure and Rationalizing Use, In: Fröhlich, H.L.,
Schreinemachers, P., Stahr, K., Clemens, G. (Eds.), Sustainable Land Use and Rural
Development in Southeast Asia: Innovations and Policies for Mountainous Areas.
Springer Berlin Heidelberg, pp. 149-173.
Lichtenberg, E., Zilberman, D., 1986. The Econometrics of Damage Control: Why
Specification Matters. American Journal of Agricultural Economics 68, 261-273.
Nolan, J., Parker, D., Van Kooten, G.C., Berger, T., 2009. An Overview of Computational
Modeling in Agricultural and Resource Economics. Canadian Journal of Agricultural
Economics/Revue canadienne d'agroeconomie 57, 417-429.
Pina, C.M., Forcada, S.A., 2004. Effects of an environmental tax on pesticides in Mexico.
Industry and Environment 27, 34 - 38.
Praneetvatakul, S., Kuwattanasiri, S.D., Waibel, H., 2003. The Productivity of Pesticide use
in rice production of Thailand: A damage control approach. Thai Journal of
Agricultural Economics 22.
Praneetvatakul, S., Schreinemachers, P., Pananurak, P., Tipraqsa, P., 2013. Pesticides,
external costs and policy options for Thai agriculture. Environmental Science &
Policy 27, 103-113.
Quang, D.V., Schreinemachers, P., Berger, T., 2014. Ex-ante assessment of soil conservation
methods in the uplands of Vietnam: An agent-based modeling approach. Agricultural
Systems 123, 108-119.
Riwthong, S., Schreinemachers, P., Grovermann, C., Berger, T., 2015. Land use
intensification, commercialization and changes in pest management of smallholder
upland agriculture in Thailand. Environmental Science & Policy 45, 11-19.
Rogers, E.M., 2003. Diffusion of Innovations, 5 ed. Simon and Schuster.
Sangchan, W., Bannwarth, M., Ingwersen, J., Hugenschmidt, C., Schwadorf, K.,
Thavornyutikarn, P., Pansombat, K., Streck, T., 2013. Monitoring and risk assessment
Publication IV: ‘Smart’ policies to reduce pesticide use
101
of pesticides in a tropical river of an agricultural watershed in northern Thailand.
Environmental Monitoring and Assessment, 1-17.
Schreinemachers, P., Berger, T., 2011. An agent-based simulation model of human–
environment interactions in agricultural systems. Environmental Modelling &
Software 26, 845-859.
Schreinemachers, P., Berger, T., Aune, J.B., 2007. Simulating soil fertility and poverty
dynamics in Uganda: A bio-economic multi-agent systems approach. Ecological
Economics 64, 387-401.
Schreinemachers, P., Berger, T., Sirijinda, A., Praneetvatakul, S., 2009. The diffusion of
greenhouse agriculture in Northern Thailand: Combining econometrics and Agent-
Based Modeling. Canadian Journal of Agricultural Economics/Revue canadienne
d'agroeconomie 57, 513-536.
Schreinemachers, P., Potchanasin, C., Berger, T., Roygrong, S., 2010. Agent-based modeling
for ex-ante assessment of tree crop technologies: litchis in northern Thailand.
Agricultural Economics 41, 519-536.
Schreinemachers, P., Schad, I., Tipraqsa, P., Williams, P., Neef, A., Riwthong, S., Sangchan,
W., Grovermann, C., 2012. Can public GAP standards reduce agricultural pesticide
use? The case of fruit and vegetable farming in northern Thailand. Agriculture and
Human Values 29, 519-529.
Schreinemachers, P., Sringarm, S., Sirijinda, A., 2011. The role of synthetic pesticides in the
intensification of highland agriculture in Thailand. Crop Protection 30, 1430-1437.
Schreinemachers, P., Tipraqsa, P., 2012. Agricultural pesticides and land use intensification
in high, middle and low income countries. Food Policy 37, 616-626.
Seufert, V., Ramankutty, N., Foley, J.A., 2012. Comparing the yields of organic and
conventional agriculture. Nature 485, 229-232.
Skevas, T., Stefanou, S.E., Lansink, A.O., 2012. Can economic incentives encourage actual
reductions in pesticide use and environmental spillovers? Agricultural Economics 43,
267-276.
Valente, T.W., 2005. Models and methods for innovation diffusion, In: P. J. Carrington, J.
Scott, S. Wasserman (Eds.), Models and Methods in Social Network Analysis.
Cambridge University Press, Cambridge, UK.
WHO, 2009. The WHO recommended classification of pesticides by hazard and guidelines to
classification. World Health Organization, Geneva.
Wilson, C., Tisdell, C., 2001. Why farmers continue to use pesticides despite environmental,
health and sustainability costs. Ecological Economics 39, 449-462.
Xu, R., Kuang, R., Pay, E., Dou, H., de Snoo, G., 2008. Factors contributing to overuse of
pesticides in western China. Environmental Sciences 5, 235-249.

Final discussion
102
6 Final discussion
6.1 Conceptual framework and approaches
This thesis first described and analyzed the relationship between the transformation of
agriculture in northern Thailand and changes in the pest management activities carried out in
the area, highlighting in particular the trend among farmers to exclusively and heavily rely on
chemical pesticides. Second, the thesis provided evidence on possible policy options aimed at
reducing the currently high levels of pesticide use, evaluated the GAP certification process
and its effect on on-farm pesticide handling and use, and ultimately assessed through an
agent-based simulation model pesticide sales taxes and economic incentives provided to
encourage the adoption of IPM techniques.
The study of transformation processes that took place during this research was focused on
two related, yet distinct, farm system characteristics: land use intensification and
commercialization, both of which reflect a market orientation. Both variables were used in
order to understand the differences between three farming systems: subsistence, semi-
commercial and commercial. Using two variables helped to address the key research
questions outlined in the first chapter. The land-use intensity index was used to measure the
differences to be found among farming systems in terms of the pest problems experienced,
pest management methods used and health problems suffered due to the use of pesticides.
Furthermore, the commercialization index was used to improve the level of understanding of
how the perceptions of risk among farmers and the risk management strategies they use have
changed over time.
One limitation here is that it was not possible to use time-series data to observe the changes
taking place within the farming systems, due to time and budgetary limitations, so cross-
sectional data was used. This thesis is based on data drawn from the highlands of northern
Thailand, where agricultural systems offer an ideal setting for collecting cross-sectional data,
as differences in road infrastructure conditions and distances to urban centers create a wide
variety of agriculture systems within small geographical areas. However, during the survey it
was difficult to fully capture changes in the level of pest and disease knowledge among
farmers, as well as changes in the roles of men and women with regard to pest and plant
disease management. It was also difficult to take into account the minor crops grown only for

Final discussion
103
home consumption when detailing the diversity of crop species grown, the crop areas used
and output quantities produced. It should also be noted that the survey gathered information
is based on farmers’ memories, and this may have resulted in the capture of partially
inaccurate information. A generally one-sided bias was not observed however, when
collecting the data. Also, prior to individual interviews, general information about each
relevant village was captured during focus group discussions to help develop a general level
of understanding of the situation in the area prior to conducting interviews, as well as of the
village context and the villagers’ daily activities.
This thesis demonstrates that increased commercialization and land use intensity has shifted
farm households away from subsistence farming towards more intensive forms of farming,
those which entail producing large quantities of high value crops based on the principle of
profit maximization. The agricultural systems themselves have also changed, characterized as
they are now by the increased use of new technologies such as new crop varieties, growth
hormones, fertilizers, machinery and chemical pesticides. Pesticides – including herbicides,
insecticides and fungicides – play a major role in the pest management activities employed in
modern forms of agriculture, much more so than traditional pest management practices.
Chemical inputs have become part of modern farmers’ lives, with high yields and good
looking products being the main benefits derived from their use. However, while pesticides
can control pest populations effectively during their initial application, over time pests can
develop resistance to the chemicals used, and at such times pest populations can increase
suddenly, necessitating the even greater use of pesticides. Over the long run, it is inevitable
that such farmers will not be able to avoid both crop losses and incurring higher costs, which
together can lead to agricultural failure. Intensive pesticide applications not only influence
agricultural production; the residues left can be found in the air, in food, soil and water
sources, causing a number of negative side-effects. Furthermore, the use of such chemicals
can damage agricultural land by harming beneficial insect species and reducing
concentrations of essential plant nutrients in the soil, as well as cause severe health problems
for local people. In response to the chronic overuse and misuse of pesticides in agriculture,
there is a need to improve the understanding of the effects of the implementation of good
agricultural practices. This thesis also provides an evaluation of the effectiveness of the Thai
Q-GAP standard, with the results showing that farmers who follow the public GAP standards
use pesticides in the same way as those who do not, due to a lack of farm auditing, an overly

Final discussion
104
rapid introduction and expansion of the program, a lack of understanding of the purpose of
the program among farmers, and a lack of alternative pest management methods being
available. This thesis also sheds lights on the introduction of a range of pesticide use
reduction strategies, such as an environmental tax and incentives for the adoption of IPM.
The results show that IPM needs to be promoted in a policy package, if it is to achieve the
desired reduction in pesticide use. The following paragraphs highlight some of the constraints
on pesticide use reduction in Thailand, and also the opportunities available to introduce
sustainable farming in the highland areas of the country.
6.2 Land use change and pest management methods
The results of this study, as well as that of Schreinemachers (2013), show that agriculture in
Thailand has over recent decades shifted from the use of farming systems based on swidden
agriculture, to the more intensive use of land based on shorter fallow periods, as well as the
use of permanent fields, irrigation and agro-chemicals. Industrialization has had a significant
influence on agricultural production in the country in terms of creating a shortage of rural
labour, which in turn has increased the use of chemicals and other labour-productivity
enhancing inputs. Also the demand for Thai agricultural products has become global creating
additional pressure on land use. This thesis illustrates clearly that rice has been replaced by a
number of cash crops. New crops based on market demand, such as strawberries, tomatoes
and Japanese spring onions, have been introduced. Due to the need to increase productivity,
the use of variable inputs as well as fixed costs has risen constantly. Irrigation periods have
also been extended. As many farmers have started to grow high profit crops in response to
market demand rather than based on land capacity, so investment in land improvement
initiatives has become highly significant, in order to match high agricultural yield
expectations. This thesis has also provided evidence that land use intensification across the
whole region has led to a reduction in the variety of pest management methods used.
Pesticides have been progressively and more generously applied as land use intensity levels
have increased, and as farmers have given up their traditional pest management practices
such as pulling-out weeds, and trapping or handpicking insects. Due to farmers’ lack of skills
in terms of cash crop cultivation and the pressure brought-about by pest infestations, farmers
in the region have had to increasingly rely on the use of synthetic pesticides. They reported to
be generally satisfied with the level of crop protection offered by pesticides. The results of
this research show that there is a strong correlation between gross margins, land use intensity
Final discussion
105
and pesticide application levels. Farmers with high levels of land use intensity tend to rely
solely on pesticides, especially insecticides and fungicides, to control pests. Such farmers
also apply 16 times the amount of pesticides than those who farm at lower levels of intensity,
believing that using more chemicals will enhance profits. However, this thesis has found that
there are also other factors that may influence pesticide use levels. For example, the
availability of pesticides on the market has an influence, as does private sector marketing
activities carried out by middlemen, the labor savings that can be made, a reduction in the
risk of crop losses – those that directly affect farmers’ credit repayment ability, and a lack of
information regarding IPM being made available. All these influences render pesticides the
only pest control choice for farmers (Atreya, 2007; Castella et al., 1999; Grovermann et al.,
2013; Pedlowski et al., 2012). This thesis demonstrates that land use intensification was not
associated with a safer use of pesticides, pesticide handling practices do not improve in
accordance with land use intensity, and the number of farmers who mix the pesticides before
spraying is even higher when land use intensity is high. The lack of awareness about the risks
associated with pesticide use and the incorrect assessment of pesticides’ benefits incentivize
farmers to use more of the chemicals, and this has an adverse impact on human health
(Lamers et al., 2013; Ngowi et al., 2007; Thapinta and Hudak, 2000). This thesis has revealed
that many farmers in the study area experience dizziness, nausea and vomiting after handling
pesticides, 47% of the applicators reported they regularly felt dizzy and 25% that they
regularly experienced nausea or vomited. Similar studies carried out in northern Tanzania
found that 68% of farmers feel sick after spraying pesticides, with the most common
symptoms including dizziness, headaches and nausea (Ngowi et al., 2007). A study in Sri
Lanka also found that farmers mentioned suffering negative side-effects from pesticide use,
including headaches, dizziness and fainting (Van Der Hoek et al., 1998). However, pesticides
not only harm farm workers, but also those who live in local communities, consumers and
local wildlife.
6.3 Commercialization and risk management
Commercialization has been accompanied by changes in the types of crop grown. In the past,
the key crops grown in the upland areas of Thailand used to be upland rice, maize and
legumes, often intercropped with various types of vegetable which were grown for home
consumption. These subsistence activities were eventually replaced by the commercial
growing of vegetables, fruit, flowers, coffee and tea. However, farmers' exposure to risk and

Final discussion
106
their risk management approach as part of this commercialization process – moving from
subsistence to market-oriented production systems. The results of this thesis show that the
sources of risk for subsistence farms are mainly related to production activities, such as
threats to water supplies, natural disasters, and crop pests and disease, as well as the loss of
family labor. For commercial farming, the sources of risk are more diverse, being related to
weather conditions, crop pests and diseases, plus market prices for agricultural products,
input prices and credit access levels. In fact, market prices, pests and diseases become the
dominant sources of risk to farm performance in the process of agricultural
commercialization. Since different risks require different responses, farmers must adapt their
farming practices to suit the risks they face. As a result, commercial farmers choose to
monitor market prices, carry out contract farming, use diversified market channels, save
money and choose the most profitable crops in order to minimize market risk. With regard to
pests, commercial farmers tend to rely more on agrochemicals and pesticides, and their use
has become a common strategy among such farmers. The results of this thesis clearly show
that agricultural commercialization is associated with a rapid adoption of synthetic pesticides
and an exponential growth in the quantity of pesticides applied per hectare. Also, with
increasing commercialization levels, pesticide use is perceived as more useful.
Commercialized farmers focus on the use of pesticides to reduce the risks posed by pests,
subsistence farmers meanwhile, choose different strategies to manage risk; for example,
through crop diversification, by improving storage facilities and by avoiding debt. This
research also demonstrates that the level of commercialization helps determine whether
pesticides are used or not, as well as the quantity of pesticides used. Furthermore, farmers’
perceptions of the level of risk posed by pests also determine the amounts of pesticide used.
The pest management strategies used by commercial farmers are also influenced by the crop
types grown. For example, in the study area, it is clear that the percentage of farmers using
pesticides, and the amount of pesticides used, is much higher among farmers who grow
strawberries, chilies, Chinese cabbages, tomatoes and white cabbages when compared to
those who grow subsistence crops such as rice and taro. The increase in cash cropping
activities in the highlands of northern Thailand has provided farmers with higher incomes,
but the internal costs of chemical pesticide use have also increased alongside this
commercialization process, as have the external costs, and these latter costs have tended to be
ignored by academic studies, which have tended to focus thus far on pest control and
pesticide efficacy (Beach and Carlson, 1993; Burrows, 1983; Pingali and Carlson, 1985). The
Final discussion
107
underestimation of the total costs of pesticide use has led to farmers using more pesticides
than necessary and also to mishandling them. This thesis has shown that pesticide handling
has not improved with increased commercialization in northern Thailand. On average, around
38% of farmers who use pesticides said they do not follow the instructions given on the
product labels, 25% said they do not take into account the direction of the wind while
spraying, and 48% of commercial farmers said they mix pesticides before spraying (the same
figure being 12% among subsistence farmers). These results are similar to those of Atreya
(2007), who also found that many farmers do not take note of the wind direction before and
during spraying, nor do they read the pesticide labels.
As the Thai population continues to increase and the demand for food rises, it cannot be
denied that farmers in the country will need to adapt their farming practices in order to
increase crop production levels. The loss of crops due to pests is a serious problem for all
farmers, and especially commercially-focused farmers, as pests can cause crop failures and
have an adverse impact on farm incomes. As a result, it is likely that pesticides will continue
to be used widely as a key part of farmers’ pest management programs (Ruberson et al.,
1998). Although the benefits of using pesticides are real, they may provide higher incomes
and alleviate poverty in the short term (Cooper and Dobson, 2007); however, at the same
time they also cause a number of problems. Farmers need to be made aware of the negative
impacts their practices will have on the environment and on theirs’ and others’ health over
the longer term, as well the economic sustainability of using pesticides.
6.4 Pesticide use reduction strategies
The change-over from using pesticides to practicing sustainable agriculture requires farmers
to accumulate a lot of knowledge in order to combat pests and diseases. For example, they
must improve their pest and disease observation and prevention skills, plus must try to reduce
the amount of pesticides they use, and where they do use them, do so safely and wisely
(Somers, 1997). Traditional pest control practices should not be completely ignored as part of
such a move. The practices were designed by farmers over many generations. Farmers inherit
this knowledge from within the family, and the practices display significant ingenuity and
generally control pests quite efficiently. Traditional knowledge is quite rich (Altieri, 1984;
Gliessman et al., 1981; Morales and Perfecto, 2000; Oldfield and Alcorn, 1987); therefore,
farmers should adapt it based upon their own experimentations, experience and new
Final discussion
108
information they receive. Traditional pest control practices represent a viable alternative to
modern practices, and may be suited to sustainable agriculture in terms of reducing crop
losses while at the same time minimizing any adverse environmental impacts (Kiruba et al.,
2006). To adopt traditional pest control practices, it is necessary to understand farmers’
traditional agricultural knowledge in relation to technical and cultural aspects, plus it is
important to understand the ecological mechanisms which form the basis of such practices, so
they can be adjusted to new situations (Gliessman et al., 1981; Morales and Perfecto, 2000).
IPM programs can help farmers in this regard, as they can enhance farmers’ knowledge about
natural enemies, pest control practices and reducing pesticide use. As part of food safety
initiatives, IPM has received increased attention among Thai policymakers in recent years,
but information on possible interventions is scarce and pesticide tax policies have had little
effect on pesticide use in the country thus far. There are only a few tools able to model how
changes in pesticide regulation affect pesticide reduction. Praneetvatakul et al. (2013)
concluded that the combination of an environmental tax and additional, supportive measures
is the best way to encourage farmers to change their farming practices. The MPMAS
simulation results that are part of this thesis support the above proposition, and show that a
trade-off between environmental protection and farm household incomes can be avoided if
policymakers use the right economic instruments to constrain chemical pesticide use and
motivate changes towards more integrated growing practices. A range of simulation
experiments assess the effect of pesticide price increases through a tax without and with the
introduction of integrated pest management methods and various other interventions that give
farmers an incentive to switch to more sustainable methods of agricultural production. The
simulation results have shown that pesticide taxes and subsidies given for using bio-
pesticides, combined with the promotion of integrated pest management methods, are the
most effective ways to reduce pesticide use. A tax alone has little effect on pesticide use, but
the effect is substantial if combined with IPM. The right policy package can reduce average
levels of pesticide use by up to 34%. Therefore, from a policy implementation perspective,
bio-pesticide subsides can be introduced, as the infrastructure needed for input subsidies to be
given is often in place. Also, promoting IPM among crops such as bell peppers and tomatoes
may achieve factually higher pesticide use reductions. Also, in Thailand there is often
disconnect between the commitments given and plans developed by policymakers, and actual
practice. For example, not enough practical support comes from the government in relation to
Final discussion
109
ecologically sound production methods, nor in relation to Thai products being sold on the
domestic market (Kasem and Thapa, 2012). If there was a policy in place which allowed IPM
innovations to take root among local communities, through support for IPM educational
programs, maybe producers' low rate of IPM adoption would be tackled positively
(McNamara et al., 1991). If this were to occur, sustainable pest control methods might be
more widely adopted and implemented in Thailand. The introduction of public standards in
relation to good agricultural practices (GAP) at the farm level might be an interesting
alternative when wishing to address food safety among consumers and minimizing any
negative impacts experienced by growers and the environment. Such best practices would
also have significant potential in the development of agricultural sustainability if farmers
understood correctly the role of the national GAP program. Some important issues with
regard to implementing a national GAP program would also need to be addressed; for
example, the need to clarify the roles and responsibilities of government agencies and the
private sector, developing follow-up plans, and providing GAP training programs for farmers
(Wannamolee, 2008).
6.5 Constraints on pesticide use reduction in the Thai highlands
Reducing farmers’ level of reliance on pesticides has become an important issue in Thailand,
as it has in many other countries which have experienced a rapid growth in pesticide use, and
where the negative health and other impacts of this are having an adverse impact on society
(Jungbluth, 1996). In Thailand, according to Agenda 215 and the Sufficiency Economy
philosophy introduced in 1997 by His Majesty King Bhumibol, the country should pursue
and pay attention to sustainable agricultural development policies. Many policies and projects
aimed at sustainable agriculture have since that time been introduced, but have had little or no
effect. The reason for this is that while supporting and promoting sustainable agriculture, the
Thai government has at the same time supported conventional agriculture also. Likewise,
there has been a lack of support given for the promotion for pesticide free or organic products
on the Thai domestic market, as well as few policies introduced to influence customers to buy
such products (Kasem and Thapa, 2012). Good agricultural practices were originally
designed to be an effective tool introduced in response to pesticide overuse and misuse in the
Thai agricultural sector. However, the findings of this thesis show that the fruit and
5 Non-binding, voluntarily United Nations action plan on sustainable development.
Final discussion
110
vegetables grown under the public GAP standard do not use less hazardous pesticides than
those grown outside the standards. The reasons for this include farmers’ lack of
understanding of the logic behind of the program, as well their lack of motivation to follow
the guidelines, plus that the Q-GAP program does not recommend any alternative practices
that are suitable for farmers, especially in relation to pest management. Farmers almost
entirely depend on synthetic pest control. This thesis has also found evidence that the quality
of GAP certification is poor as program resources for training and auditing are spread too
sparingly over the large group of participating farmers. Likewise the strong focus on food
safety suggests that the government is mostly concerned with limiting the consequences of
pesticide overuse and misuse rather than addressing the root cause of the problem. There is
also a problem of overlap between Q-GAP and IPM. IPM as a concept is linked to Q-GAP in
the policy documents, but most farmers never receive IPM training or concrete suggestions as
to how to use the techniques therein. Q-GAP and IPM implementation challenges can be
assessed on two levels. First, at the producer level there are several challenges, such as a lack
of understanding, low motivation levels, insufficient awareness about food safety issues and
labor shortages. Second, at the institutional level there is a lack of collaboration between
researchers and extension services, and farmers are generally not involved in the research
process. Also, there are insufficient training programs run, plus government auditors tend to
be inexperienced (Morales and Perfecto, 2000; Wannamolee, 2008).
As mentioned above, a major problem faced when wishing to promote sustainable agriculture
and food safety among farmers is that they do not fully understand the underlying rationale
behind such programs, nor the guidelines used, and this prevents them from being motivated
to adapt or follow such practices. Even though policies are an important driver of change in
agricultural systems, farmers themselves still need to learn about and become more aware of
the impacts of their behavior. Many studies ascribe the mishandling of pesticides to a lack of
knowledge, as many farmers are under trained and even illiterate (Hashemi et al., 2012;
Ibitayo, 2006; Mokhele, 2011; Palis et al., 2006). The results of this thesis show that farmers
with more experience in the agricultural sector are less likely to use pesticides. Farmers’
education and knowledge levels have an important impact at every stage of the decision
making process, so are important in determining agricultural performance, that which ensures
the best economic outcomes for their farms, while minimizing ecosystem damage. In general;
however, farmers in the rural areas of South and Southeast Asia have a lower level of
Final discussion
111
education than those in other sectors (Sanne et al., 2004). This research found that 53% of
highland farmers have no education certificates, and that 30% have completed only to
primary school level. In general, farmers in such rural areas do not have the most up-to-date
information on how to manage farms efficiently and economically; therefore, education is
needed to help them keep abreast of fast-moving developments in agricultural technology and
business management, as well as improve their agricultural skills. Another constraint faced
by a large number of farmers in the rural areas of less developed and developing countries is
insecure land tenure, which was however not examined in depth by this research. In Thailand,
the Department of Land previously produced a 20-year plan that finished in 2004, and this
included a Land Titling Program (LTP). The aim of this program was to extend land rights to
a larger proportion of the population, helping to address rural poverty, increase land tenure
security, and improve access to credit among land title holders. The program had a positive
effect on regional economic growth, as it brought greater social stability, and facilitated
sustainable resource management practices. However, the project did not complete its key
task, as there are still 12 million people living in the country‘s uplands and forests, including
‘hill tribes’ and other communities, which live under communal forms of tenure which have
no legal basis. A significant number of these people have not benefited from the
government’s land titling activity (Bowman, 2004; Burns, 2004; USAID, 2011). This thesis
confirms that in the study areas, the percentage of highland farmers who hold secure land title
is rather low, at only 16%, while 76% of farmers have no title to the land under cultivation. It
also found that 8% of farmers hold insecure land title documents such as the STG and SPG.
This may explain why it is difficult to incentivize Thai highland farmers to make their
agricultural activities more sustainable. As farmers who have insecure land rights are unlikely
to make an effort at improving their management of the land over the longer term
(Deininger, 2004; Feder and Onchan, 1987).
6.6 Opportunities for sustainable farming within Thai highland agriculture
The appropriate use of pesticides requires, not only an understanding of their proper use and
their impacts, but also responsibility on the part of governments, the pesticide industry,
pesticide users and also consumers. At the national level in Thailand, stricter pesticide
regulations, the removal of pesticide subsidies and the introduction of an environmental tax
on pesticides need to be implemented; however, even these actions will not be enough to
address the problem of high pesticide demand. This thesis demonstrates that the most
Final discussion
112
effective solution to this problem is to introduce pesticide reduction policies while at the
same time encouraging farmers to change their farm practices; for example, by promoting
integrated pest management activities through introducing ‘Farmer Field Schools’ or
government considers establishing special schools in highland areas at which farmers can
acquire farming knowledge. Policymakers, researchers and farmers need to work together in
order to encourage the use of sustainable pest management activities. More detailed policy-
oriented studies are needed to identify policy options to support farmers in their transition to
market-oriented production. Policy makers should support scientists with their research, as
well as support the dissemination of traditional pest management knowledge, promote locally
available resources and adapt any pest management approaches to the more intensive
production context. They should also promote soil health as a part of a conservation
agriculture approach, support farmers in their use of good seeds – because a healthy plant can
better resist pest attacks – and pass knowledge on to farmers regarding the negative impacts
of chemical product use, as well as offer training at the local level on how to use pesticides
wisely. Meanwhile, agricultural research should try to adjust traditional methods to the
current conditions experienced by commercial farms, and so facilitate the re-adoption of such
methods. Researchers should also introduce alternative crops suitable for the Thai highland
climate. However, the challenges faced not only exist on the producers’ side. Consumer
demand is also an indispensable factor in helping to achieve agricultural sustainability, and
has a strong effect on the agricultural market. Consumers want the highest quality at the
lowest costs, but for them to figure out what the best quality is tricky. The provision of
information alone may not resolve this problem, as information can be ignored,
misinterpreted or simply create confusion (Grunert, 2005). To understand the role of a
consumer need to be clarified by further research. Therefore, to achieve sustainable
agriculture is a complex challenge, requiring cooperation among all relevant sectors as well
as a true understanding of the problems and limitations that exist. Most importantly, the level
of social responsibility held by farmers, consumers, the pesticide industry and the
government is an integral part of this development.
6.7 References
Altieri, M.A., 1984. Towards a grassroots approach to rural development in the Third World.
Agriculture and Human Values 1, 45-48.
Atreya, K., 2007. Pesticide use knowledge and practices: A gender differences in Nepal.
Environmental Research 104, 305-311.
Final discussion
113
Beach, E.D., Carlson, G.A., 1993. A hedonic analysis of herbicides: do user safety and water
quality matter? American Journal of Agricultural Economics 75, 612-623.
Bowman, C., 2004. Thailand Land Titling Project, Conference on Scaling up Poverty
Reduction, Shanghai, May, pp. 25-27.
Burns, A., 2004. Thailand's 20 Year Program to Title Rural Land.
Burrows, T.M., 1983. Pesticide demand and integrated pest management: a limited dependent
variable analysis. American Journal of Agricultural Economics 65, 806-810.
Castella, J.-C., Jourdain, D., Trébuil, G., Napompeth, B., 1999. A systems approach to
understanding obstacles to effective implementation of IPM in Thailand: key issues
for the cotton industry. Agriculture, Ecosystems & Environment 72, 17-34.
Cooper, J., Dobson, H., 2007. The benefits of pesticides to mankind and the environment.
Crop Protection 26, 1337-1348.
Deininger, K., 2004. Land policies for growth and poverty reduction: key issues and
challenges ahead, Inter-Regional Special Forum on the Building of Land Information
Policies in the Americas, Aguascalientes, Mexico, pp. 26-27.
Feder, G., Onchan, T., 1987. Land ownership security and farm investment in Thailand.
American Journal of Agricultural Economics 69, 311-320.
Gliessman, S.R., Garcia, R.E., Amador, M.A., 1981. The ecological basis for the application
of traditional agricultural technology in the management of tropical agro-ecosystems.
Agro-Ecosystems 7, 173-185.
Grovermann, C., Schreinemachers, P., Berger, T., 2013. Quantifying pesticide overuse from
farmer and societal points of view: An application to Thailand. Crop Protection 53,
161-168.
Grunert, K.G., 2005. Food quality and safety: consumer perception and demand. European
Review of Agricultural Economics 32, 369-391.
Hashemi, S.M., Hosseini, S.M., Hashemi, M.K., 2012. Farmer's perceptions of safe use of
pesticides: determinants and training needs. International archives of occupational and
environmental health 85, 57-66.
Ibitayo, O.O., 2006. Egyptian farmers' attitudes and behaviors regarding agricultural
pesticides: implications for pesticide risk communication. Risk analysis 26, 989-995.
Jungbluth, F., 1996. Crop protection policy in Thailand: economic and political factors
influencing pesticide use. Pesticide Policy Project Hannover.
Kasem, S., Thapa, G.B., 2012. Sustainable development policies and achievements in the
context of the agriculture sector in Thailand. Sustainable Development 20, 98-114.
Kiruba, S., Mishra, B.P., Stalin, S.I., Jeeva, S., Dhas, S.S.M., 2006. Traditional pest
management practices in Kanyakumari district, southern peninsular India. Indian
Journal of Traditional Knowledge 5, 71-74.
Lamers, M., Schreinemachers, P., Ingwersen, J., Sangchan, W., Grovermann, C., Berger, T.,
2013. Agricultural Pesticide Use in Mountainous Areas of Thailand and Vietnam:
Towards Reducing Exposure and Rationalizing Use, Sustainable Land Use and Rural
Development in Southeast Asia: Innovations and Policies for Mountainous Areas.
Springer, pp. 149-173.
McNamara, K.T., Wetzstein, M.E., Douce, G.K., 1991. Factors affecting peanut producer
adoption of integrated pest management. Review of Agricultural Economics 13, 129-
139.
Mokhele, T.A., 2011. Potential health effects of pesticide use on farmworkers in Lesotho.
South African Journal of Science 107, 29-35.
Morales, H., Perfecto, I., 2000. Traditional knowledge and pest management in the
Guatemalan highlands. Agriculture and Human Values 17, 49-63.
Final discussion
114
Ngowi, A.V.F., Mbise, T.J., Ijani, A.S.M., London, L., Ajayi, O.C., 2007. Smallholder
vegetable farmers in Northern Tanzania: Pesticides use practices, perceptions, cost
and health effects. Crop Protection 26, 1617-1624.
Oldfield, M.L., Alcorn, J.B., 1987. Conservation of traditional agroecosystems. BioScience,
199-208.
Palis, F.G., Flor, R.J., Warburton, H., Hossain, M., 2006. Our farmers at risk: behaviour and
belief system in pesticide safety. Journal of Public Health 28, 43-48.
Pedlowski, M.A., Canela, M.C., da Costa Terra, M.A., Ramos de Faria, R.M., 2012. Modes
of pesticides utilization by Brazilian smallholders and their implications for human
health and the environment. Crop Protection 31, 113-118.
Pingali, P.L., Carlson, G.A., 1985. Human capital, adjustments in subjective probabilities,
and the demand for pest controls. American Journal of Agricultural Economics 67,
853-861.
Praneetvatakul, S., Schreinemachers, P., Pananurak, P., Tipraqsa, P., 2013. Pesticides,
external costs and policy options for Thai agriculture. Environmental Science &
Policy 27, 103-113.
Ruberson, J., Nemoto, H., Hirose, Y., Pedro, B., 1998. Pesticides and conservation of natural
enemies in pest management, Conservation Biological Control. Academic Press, San
Diego, pp. 207-220.
Sanne, B., Mykletun, A., Moen, B.E., Dahl, A.A., Tell, G.S., 2004. Farmers are at risk for
anxiety and depression: the Hordaland Health Study. Occupational Medicine 54, 92-
100.
Schreinemachers, P., Fröhlich, H.L., Clemens, G., Stahr, K., 2013. From Challenges to
Sustainable Solutions for Upland Agriculture in Southeast Asia, Sustainable Land Use
and Rural Development in Southeast Asia: Innovations and Policies for Mountainous
Areas. Springer, pp. 3-27.
Schreinemachers, P., Schad, I., Tipraqsa, P., Williams, P.M., Neef, A., Riwthong, S.,
Sangchan, W., Grovermann, C., 2012. Can public GAP standards reduce agricultural
pesticide use? The case of fruit and vegetable farming in northern Thailand.
Agriculture and Human Values 29, 519-529.
Somers, B.M., 1997. Learning for sustainable agriculture, In: Ittersum, M.K.v., Geijn,
S.C.v.d. (Eds.), Developments in Crop Science. Elsevier, pp. 353-359.
Thapinta, A., Hudak, P.F., 2000. Pesticide Use and Residual Occurrence in Thailand.
Environmental Monitoring and Assessment 60, 103-114.
USAID, 2011. Property Rights and Resource Governance Country Profile: Thailand
Van Der Hoek, W., Konradsen, F., Athukorala, K., Wanigadewa, T., 1998. Pesticide
poisoning: A major health problem in Sri Lanka. Social Science & Medicine 46, 495-
504.
Wannamolee, W., 2008. Development of Good Agricultural Practices (GAP) for fruit and
vegetables in Thailand. Sheraton Subang Hotel & Towers for Training of Trainers in
Good Agricultural Practices (GAP) and Benchmarking: GLOBALGAP for Fruit and
Vegetables, 14-23.