effects of al concentration on structural and optical
TRANSCRIPT

Structural and Optical Properties of AZO Thin Films Bull. Korean Chem. Soc. 2012, Vol. 33, No. 4 1235
http://dx.doi.org/10.5012/bkcs.2012.33.4.1235
Effects of Al Concentration on Structural and Optical Properties
of Al-doped ZnO Thin Films
Min Su Kim, Kwang Gug Yim, Jeong-Sik Son,† and Jae-Young Leem*
Department of Nano Systems Engineering, Center for Nano Manufacturing, Inje University, Gimhae, Gyungnam 621-749, Korea*E-mail: [email protected]
†Department of Visual Optics, Kyungwoon University, Gumi, Gyongsanbuk-do 730-850, Korea
Received October 24, 2011, Accepted January 9, 2012
Aluminium (Al)-doped zinc oxide (AZO) thin films with different Al concentrations were prepared by the sol-
gel spin-coating method. Optical parameters such as the optical band gap, absorption coefficient, refractive
index, dispersion parameter, and optical conductivity were studied in order to investigate the effects of the Al
concentration on the optical properties of AZO thin films. The dispersion energy, single-oscillator energy,
average oscillator wavelength, average oscillator strength, and refractive index at infinite wavelength of the
AZO thin films were found to be affected by Al incorporation. The optical conductivity of the AZO thin films
also increases with increasing photon energy.
Key Words : Zinc oxide, Aluminum, Thin film, Sol-gel, Optical parameter
Introduction
Zinc oxide (ZnO) is a direct band gap semiconductor with
a band gap of 3.37 eV and large exciton binding energy of
60 meV.1,2 ZnO thin films have attracted considerable
interest in recent years for application as a transparent
conducting material in liquid crystal displays,3 solar cells,4
etc. The conventional transparent conductive oxide (TCO)
material is indium tin oxide (ITO). However, ITO materials
are very expensive and low stability to H2 plasma and
toxicity. Undoped and doped ZnO thin films are widely used
in transparent conducting layers because of their thermal
stability and better resistance against hydrogen plasma pro-
cessing damage compared to ITO.5,6
Various techniques such as molecular beam epitaxy
(MBE),7 pulse laser deposition (PLD),8 magnetron sputter-
ing,9 chemical vapor deposition (CVD),10 atomic layer
deposition,11 electron beam evaporation,12 hydrothermal
method,13 and sol-gel process14 have been applied to ZnO
thin film preparation. The sol-gel method has distinct poten-
tial advantages over these other techniques owing to its
lower crystallization temperature, low cost, simple deposition
procedure, easier compositional control, ability to tune the
microstructure via sol-gel chemistry, and large surface area
coating capability.
As-prepared ZnO usually exhibits n-type conductivity,
which may be caused by intrinsic defects such as interstitial
zinc and oxygen vacancies. The conductivity can be en-
hanced by introducing elements such as B, Al, Ga, and In.
Al-doped ZnO (AZO) thin films exhibit high transparency
and low resistivity.15 However, there have been few reports
detailing the optical properties of AZO thin films.
In this work, undoped ZnO and AZO thin films were
prepared by the sol-gel method with different Al concen-
trations. The structural and optical properties of the AZO
thin films were investigated. In particular, optical parameters
such as the optical band gap, absorption coefficient, Urbach
energy, refractive index, dispersion parameter, and optical
conductivity were comprehensively studied in order to
investigate the effects of Al doping on the optical properties
of AZO thin films.
Experimental Details
AZO thin films were deposited on quartz substrates by
the sol-gel spin-coating method. Zinc acetate dihydrate
[Zn(CH3COO)2·2H2O] was used as a starting material.
Monoethanolamine [C2H7NO] and 2-methoxyethanol
[CH3OCH2CH2OH] were used as the stabilizer and solvent,
respectively. The dopant source was aluminum nitrate
[Al(NO3)2·9H2O]. The zinc acetate dihydrate and aluminum
nitrate were dissolved in a mixture of 2-methoxyethanol and
monoethanolamine (MEA). The molar ratio of dopant in the
starting solution was varied to give a [Al/Zn] ratio of 1-3
at.%. The molar ratio of MEA to zinc acetate was
maintained at 1.0 and the concentration of zinc acetate was
0.6 M. The resultant solution was stirred at 60 oC for 2 h to
yield a clear and homogeneous solution. Finally, the solution
was aged at room temperature for 24 h. Prior to deposition,
the quartz substrates were carefully cleaned with distilled
water, acetone, and ethanol in sequence under ultrasonic
irradiation; they were then rinsed with distilled water and
lastly dried with N2 (99.9999%) gas. The solution was
dropped on quartz substrates, which were rotated at 3000
rpm for 20 s. The AZO thin films were heated at 300 °C for
10 min to evaporate the solvent and remove the organic
residuals (named as pre-heat treatment). After the pre-heat
treatment, the AZO thin films were cooled at a cooling rate
of 5 oC/min to avoid cracks. The spin-coating and pre-
heating processes were repeated five times. For crystalli-

1236 Bull. Korean Chem. Soc. 2012, Vol. 33, No. 4 Min Su Kim et al.
zation, the AZO thin films were heated in a furnace in air
atmosphere at 550 °C for 60 min (named as post-heat treat-
ment). The thicknesses of the AZO thin films were about
250 nm for 0 at.%, 230 nm for 1 at.%, 225 nm for 2 at.%,
and 220 nm for 3 at.%. The microstructure was investigated
by using a scanning electron microscope (SEM). The
crystallinity and orientation of the AZO thin films were
measured by X-ray diffraction (XRD). The optical trans-
mittance and reflectance of the AZO thin films were
measured as a function of wavelength by UV-visible spectro-
scopy.
Results and Discussion
Surface Morphological and Structural Properties of
the AZO Thin Films. Figure 1 shows SEM images of the
AZO thin films with different Al concentrations: (a) 0, (b) 1,
(c) 2, and (d) 3 at.%. All the thin films exhibited a rough
surface with three-dimensional (3D) island growth due to
the lattice and chemical mismatches between the thin films
and substrates. These factors made the surface of the thin
films rough. The particle size was significantly reduced by
Al incorporation into the AZO thin films.
Figure 2 shows XRD spectra of the AZO thin films with
different Al concentrations: (a) 0, (b) 1, (c) 2, and (d) 3 at.%.
The diffraction peaks of undoped ZnO and AZO thin films
indicate the hexagonal wurtzite structure of the thin films.16
Figure 3 shows the full width at half maximum (FWHM) of
the ZnO (002) diffraction peak and average grain size of the
AZO thin films as a function of the Al concentration. The
FWHM increased from 0.16o to 0.32o as the Al concen-
trations were increased. The FWHM was closely related to
the grain size of the thin films. The average grain size was
determined using Scherrer’s equation17:
(1)
where λ is the X-ray wavelength, θ is the Bragg angle of the
ZnO (002) diffraction peak, and β is the FWHM in radians.
The average grain size decreased from 60 to 30 nm when the
Al concentration was increased from 0 to 3 at.%. The AZO
thin films exhibited a smaller grain size than the undoped
ZnO thin films; this can be attributed to the increase in Al.18
These results were in good agreement with the SEM images.
For Al doping, the concentration of the zinc interstitials was
reduced for charge compensation; this resulted in suppressed
ZnO grain growth and deteriorated crystallinity.19
Figure 4 shows the residual stress and bond length in the
AZO thin films as a function of the Al concentration. The
residual stress (σ) in the AZO thin films can be expressed
as20
(2)
where Cij are elastic stiffness constants for ZnO (C11 = 207.0
GPa, C33 = 209.5 GPa, C12 = 117.7 GPa, and C13 = 106.1
GPa). c and c0 are the lattice constants of the AZO thin films
and strain-free ZnO thin films, respectively. If the stress is
positive, the biaxial stress is tensile; if the residual stress is
negative, the biaxial stress is compressive. The residual
stress of the undoped ZnO thin films was smaller than that of
the AZO thin films. The residual stress of the AZO thin
films increased as the Al concentration was increased to
2 at.%. There seems to be a critical value for the Al
D = 0.9λ
βcosθ---------------
σ = 2C13
2C33 C11 C12+( )–
2C13
------------------------------------------------ × c c0–
c0
-----------
Figure 1. SEM images of the AZO thin films with different Alconcentration: (a) 0, (b) 1, (c) 2, and (d) 3 at.%.
Figure 2. XRD spectra of the AZO thin films with different Alconcentration: (a) 0, (b) 1, (c) 2, and (d) 3 at.%.
Figure 3. FWHM of the ZnO (002) diffraction peak and theaverage grain size of the AZO thin films as a function of the Alconcentration.
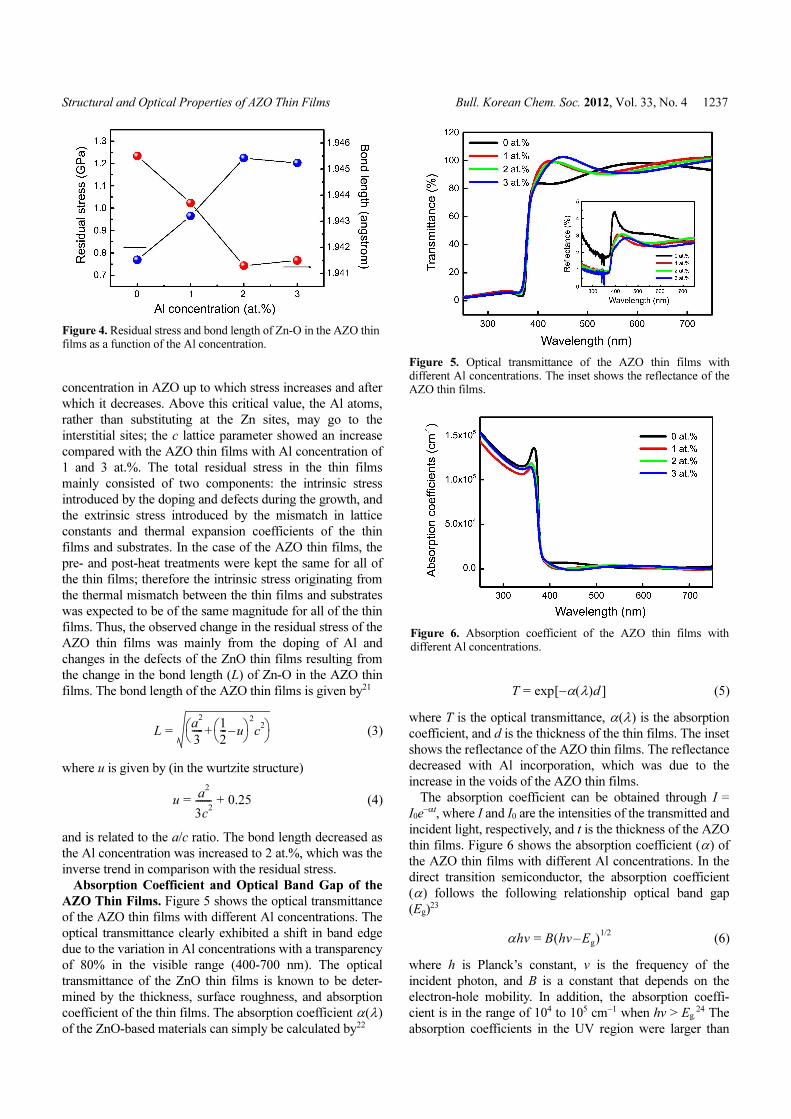
Structural and Optical Properties of AZO Thin Films Bull. Korean Chem. Soc. 2012, Vol. 33, No. 4 1237
concentration in AZO up to which stress increases and after
which it decreases. Above this critical value, the Al atoms,
rather than substituting at the Zn sites, may go to the
interstitial sites; the c lattice parameter showed an increase
compared with the AZO thin films with Al concentration of
1 and 3 at.%. The total residual stress in the thin films
mainly consisted of two components: the intrinsic stress
introduced by the doping and defects during the growth, and
the extrinsic stress introduced by the mismatch in lattice
constants and thermal expansion coefficients of the thin
films and substrates. In the case of the AZO thin films, the
pre- and post-heat treatments were kept the same for all of
the thin films; therefore the intrinsic stress originating from
the thermal mismatch between the thin films and substrates
was expected to be of the same magnitude for all of the thin
films. Thus, the observed change in the residual stress of the
AZO thin films was mainly from the doping of Al and
changes in the defects of the ZnO thin films resulting from
the change in the bond length (L) of Zn-O in the AZO thin
films. The bond length of the AZO thin films is given by21
(3)
where u is given by (in the wurtzite structure)
(4)
and is related to the a/c ratio. The bond length decreased as
the Al concentration was increased to 2 at.%, which was the
inverse trend in comparison with the residual stress.
Absorption Coefficient and Optical Band Gap of the
AZO Thin Films. Figure 5 shows the optical transmittance
of the AZO thin films with different Al concentrations. The
optical transmittance clearly exhibited a shift in band edge
due to the variation in Al concentrations with a transparency
of 80% in the visible range (400-700 nm). The optical
transmittance of the ZnO thin films is known to be deter-
mined by the thickness, surface roughness, and absorption
coefficient of the thin films. The absorption coefficient α(λ)
of the ZnO-based materials can simply be calculated by22
(5)
where T is the optical transmittance, α(λ) is the absorption
coefficient, and d is the thickness of the thin films. The inset
shows the reflectance of the AZO thin films. The reflectance
decreased with Al incorporation, which was due to the
increase in the voids of the AZO thin films.
The absorption coefficient can be obtained through I =
I0e−αt, where I and I0 are the intensities of the transmitted and
incident light, respectively, and t is the thickness of the AZO
thin films. Figure 6 shows the absorption coefficient (α) of
the AZO thin films with different Al concentrations. In the
direct transition semiconductor, the absorption coefficient
(α) follows the following relationship optical band gap
(Eg)23
(6)
where h is Planck’s constant, v is the frequency of the
incident photon, and B is a constant that depends on the
electron-hole mobility. In addition, the absorption coeffi-
cient is in the range of 104 to 105 cm−1 when hv > Eg.24 The
absorption coefficients in the UV region were larger than
L = a2
3-----
1
2--- u–⎝ ⎠⎛ ⎞
2
c2
+⎝ ⎠⎛ ⎞
u = a2
3c2
------- + 0.25
T = exp α– λ( )d[ ]
αhv = B hv Eg–( )1/2
Figure 4. Residual stress and bond length of Zn-O in the AZO thinfilms as a function of the Al concentration.
Figure 5. Optical transmittance of the AZO thin films withdifferent Al concentrations. The inset shows the reflectance of theAZO thin films.
Figure 6. Absorption coefficient of the AZO thin films withdifferent Al concentrations.

1238 Bull. Korean Chem. Soc. 2012, Vol. 33, No. 4 Min Su Kim et al.
those in the visible region and decreased with Al incorpo-
ration. Nevertheless, those in the UV region changed little
with Al incorporation, which may be due to the decrease in
the optical band gap. These results imply that the optical
absorption in the UV region of the AZO thin films can be
decreased by Al incorporation and the absorption coefficient
is a wave-number-dependent function.
The optical band gap can be determined by extrapolation
of the linear region from the α2 vs. hv plot near the onset of
the absorption edge to the energy axis. Figure 7 shows the
plots of (αhv)2 vs. photon energy of AZO thin films with
different Al concentrations. The optical band gap of the
undoped ZnO thin films was found to be about 3.291 eV.
The optical band gap of the AZO thin films slightly decreas-
ed with Al incorporation, which agrees with the literature.25
Generally, the literature has shown that the optical band gap
of the AZO films increases with increasing Al doping con-
centration.26 However, our experiment showed the opposite
effect, which may be attributed to the band shrinkage effect
because of increasing carrier concentration.27
Refractive Index and Dielectric Constants of the AZO
Thin Films. The refractive index is an important parameter
for optical materials and applications. Thus, it is important to
determine optical constants of the thin films and the com-
plex optical refractive index is described by the following
relation28:
(7)
where n is the real part and k is the imaginary part (ex-
tinction coefficient) of the complex refractive index. The
refractive index of the films was determined from the
following relation29:
(8)
where k (k = αλ/4π) is the extinction coefficient. The ex-
tinction coefficient can be calculated from the optical
transmittance. Figure 8 shows the (a) refractive index (n)
and (b) extinction coefficient (k) of the AZO thin films with
different Al concentrations. The refractive index and ex-
tinction coefficient of the AZO thin films decreased with Al
incorporation. The decrease in the refractive index with Al
incorporation was mainly attributed to an increase in the
carrier concentration in the AZO thin films. For all of the
AZO thin films, the refractive index in visible region
changed only slightly and tended to be a constant at ~1.4,
which is in good agreement with the results calculated by
Bandyopadhyay et al..30
The refractive index dispersion plays an important role in
optical communication and the design of optical devices.
Thus, it is important to determine the dispersion parameters
of the films. The dispersion parameters of the films were
determined from the relation given by31
(9)
where Eo is the single-oscillator energy and Ed is the
dispersion energy, which is a measure of the intensity of the
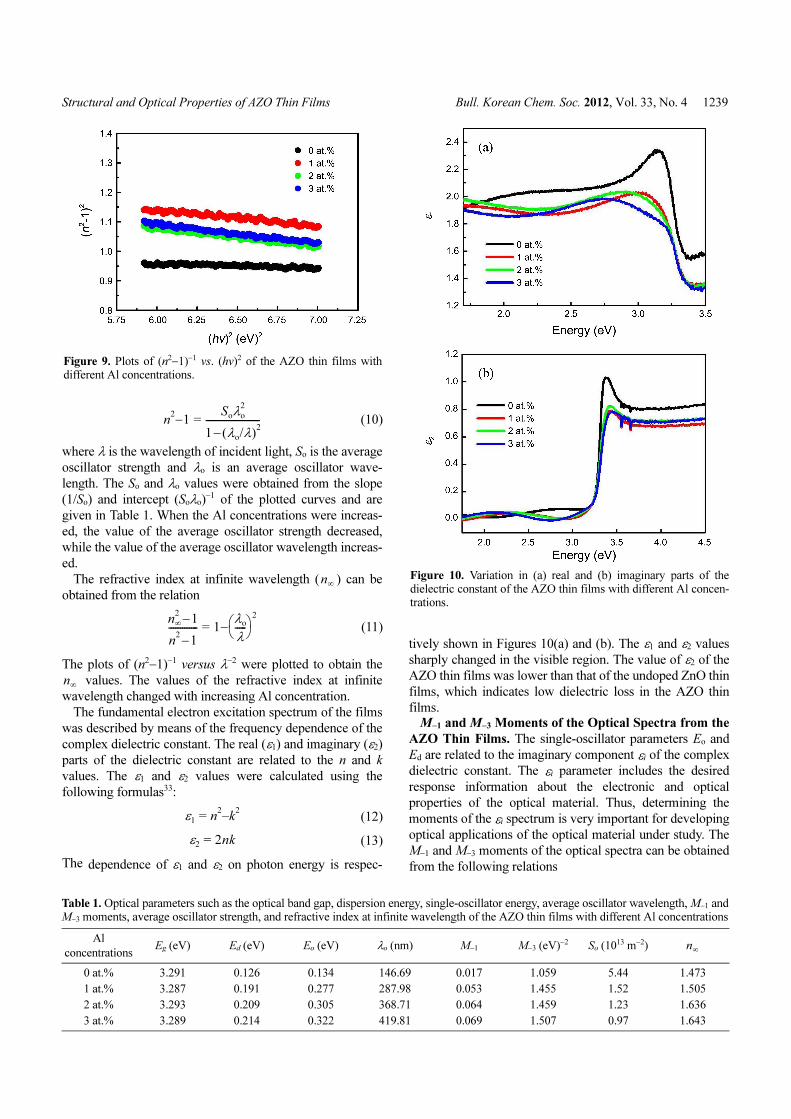
inter band optical transitions. Figure 9 shows the plots of
(n2−1)−1 vs. (hv)2 of the AZO thin films with different Al
concentrations. The Eo and Ed values were determined from
the slope (EoEd)−1 and intercept (Eo/Ed) on the vertical axis
and are given in Table 1. The values of the single-oscillator
and dispersion energy increased with increasing Al concen-
tration. The increase in dispersion energy is usually associat-
ed with the evolution of the AZO thin films microstructure
to a more ordered phase.32
The dispersion data of refractive index was also fitted by
the following relation:
n̂ = n ω( ) + ik ω( )
n = 1 R+
1 R–-----------⎝ ⎠⎛ ⎞ +
4R
1 R–( )2----------------- k
2–
n2−1 =
EoEd
Eo
2E2
–---------------
Figure 7. Plots of (αhv)2 vs. photon energy of the AZO thin filmswith different Al concentrations.
Figure 8. (a) Refractive index and (b) extinction coefficient of theAZO thin films with different Al concentrations.
Structural and Optical Properties of AZO Thin Films Bull. Korean Chem. Soc. 2012, Vol. 33, No. 4 1239
(10)
where λ is the wavelength of incident light, So is the average
oscillator strength and λo is an average oscillator wave-
length. The So and λo values were obtained from the slope
(1/So) and intercept (Soλo)−1 of the plotted curves and are
given in Table 1. When the Al concentrations were increas-
ed, the value of the average oscillator strength decreased,
while the value of the average oscillator wavelength increas-
ed.
The refractive index at infinite wavelength ( ) can be
obtained from the relation
(11)
The plots of (n2−1)−1 versus λ−2 were plotted to obtain the
values. The values of the refractive index at infinite
wavelength changed with increasing Al concentration.
The fundamental electron excitation spectrum of the films
was described by means of the frequency dependence of the
complex dielectric constant. The real (ε1) and imaginary (ε2)
parts of the dielectric constant are related to the n and k
values. The ε1 and ε2 values were calculated using the
following formulas33:
(12)
(13)
The dependence of ε1 and ε2 on photon energy is respec-
tively shown in Figures 10(a) and (b). The ε1 and ε2 values
sharply changed in the visible region. The value of ε2 of the
AZO thin films was lower than that of the undoped ZnO thin
films, which indicates low dielectric loss in the AZO thin
films.M
−1 and M−3 Moments of the Optical Spectra from the
AZO Thin Films. The single-oscillator parameters Eo and
Ed are related to the imaginary component εi of the complex
dielectric constant. The εi parameter includes the desired
response information about the electronic and optical
properties of the optical material. Thus, determining the
moments of the εi spectrum is very important for developing
optical applications of the optical material under study. The
M−1 and M−3 moments of the optical spectra can be obtained
from the following relations
n2−1 =
Soλo
2
1 λo/λ( )2–------------------------
n∞
n∞
21–
n2
1–------------- = 1−
λo
λ-----⎝ ⎠⎛ ⎞
2
n∞
ε1 = n2
k2
–
ε2 = 2nk
Figure 9. Plots of (n2−1)−1 vs. (hv)2 of the AZO thin films with
different Al concentrations.
Table 1. Optical parameters such as the optical band gap, dispersion energy, single-oscillator energy, average oscillator wavelength, M−1 and
M−3 moments, average oscillator strength, and refractive index at infinite wavelength of the AZO thin films with different Al concentrations
Al
concentrationsEg (eV) Ed (eV) Eo (eV) λo (nm) M
−1 M−3 (eV)−2 So (1013 m−2)
0 at.% 3.291 0.126 0.134 146.69 0.017 1.059 5.44 1.473
1 at.% 3.287 0.191 0.277 287.98 0.053 1.455 1.52 1.505
2 at.% 3.293 0.209 0.305 368.71 0.064 1.459 1.23 1.636
3 at.% 3.289 0.214 0.322 419.81 0.069 1.507 0.97 1.643
n∞
Figure 10. Variation in (a) real and (b) imaginary parts of thedielectric constant of the AZO thin films with different Al concen-trations.

1240 Bull. Korean Chem. Soc. 2012, Vol. 33, No. 4 Min Su Kim et al.
(14)
(15)
The obtained values are given in Table 1. The obtained M−1
and M−3 moments increased with the Al concentrations.
Optical Conductivity Properties of the AZO Thin
Films. The real σ' and imaginary σ" parts of the optical
conductivity are described as33
(16)
(17)
where ω is the angular frequency and ε0 is the free space
dielectric constant. The real and imaginary parts of the
optical conductivity dependence of energy are shown in
Figures 11(a) and (b), respectively. Both of the σ' and σ"
values were also affected by the Al incorporation. σ' of the
AZO thin films was low for low values of energy and
drastically increased with energy corresponding to the band
gap energy, which may be due to electrons excited by photon
energy. σ' decreased at higher energies than the optical band
gap with Al incorporation. This may be because the absorp-
tion coefficient of the AZO thin films decreased with Al
incorporation as shown in Figure 6.
Conclusions
AZO thin films were prepared with different Al concen-
trations by the sol-gel spin-coating method and their optical
parameters at wavelengths of 250-750 nm were investigated.
The optical band gap of the AZO thin films was not signi-
ficantly affected by Al incorporation. However, the dis-
persion energy, single-oscillator energy, average oscillator
wavelength, average oscillator strength, and refractive index
at infinite wavelength of the AZO thin films were affected
by Al incorporation. In addition, the optical conductivity of
the AZO thin films increased with increasing energy.
Acknowledgments. This work was supported by the 2012
Inje University research grant.
References
1. Hümmer, K. Phys. Status Solidi B 1943, 56, 249. 2. Wong, E. M.; Searson, P. C. Appl. Phys. Lett. 1999, 74, 2939.
3. Oh, B.-Y.; Jeong, M.-C.; Moon, T.-H.; Lee, M. W.; Myoung, J.-M.
J. Appl. Phys. 2006, 99, 124505. 4. Keis, K.; Magnusson, E.; Lindström, H.; Lindquist, S.-E.; Hagfeldt,
A. Sol. Energy Mater. Sol. Cells 2002, 73, 51.
5. Song, Y.; Kim, E. S.; Kapila, A. J. Electron. Mater. 1995, 24, 83. 6. Ip, K.; Overberg, M. E.; Heo, Y. W.; Norton, D. P.; Pearton, S. J.;
Kucheyev, S. O.; Jagadish, C.; Wiliams, J. S.; Wilson, R. G.;
Zavada, J. M. Appl. Phys. Lett. 2002, 81, 3996. 7. Yim, K. G.; Cho, M. Y.; Jeon, S. M.; Kim, M. S.; Leem, J.-Y. J.
Korean Phys. Soc. 2011, 58, 520.
8. Kaidashev, E. M.; Lorenz, M.; Wenckstern, H.; Rahm, A.;
Semmelhack, H.-C.; Han, K.-H.; Benndorf, G.; Bundesmann, C.;Hochmuth, H.; Grundmann, M. Appl. Phys. Lett. 2003, 82, 3901.
9. Carcia, P. F.; Mclean, R. S.; Reilly, M. H.; Nunes, G. Appl. Phys.
Lett. 2003, 82, 1117.10. Gorla, C. R.; Emanetoglu, N. W.; Liang, S.; Mayo, W. E.; Lu, Y.;
Wraback, M.; Shen, H. J. Appl. Phys. 1999, 85, 2595.
11. Kim, Y.-S.; An, C. J.; Kim, S. K.; Song, J.; Hwang, C. S. Bull.Korean Chem. Soc. 2010, 31, 2503.
12. Kuroyanagi, A. Jpn. J. Appl. Phys. 1989, 28, 219.
13. Kim, M. S.; Yim, K. G.; Jeon, S. M.; Lee, D.-Y.; Kim, J. S.; Kim,J. S.; Son, J.-S.; Leem, J.-Y. Jpn. J. Appl. Phys. 2011, 50, 035003.
14. Kim, M. S.; Yim, K. G.; Leem, J.-Y.; Kim, S.; Nam, G.; Kim, D.
Y.; Kim, S.-O.; Lee, D.-Y.; Kim, J. S.; Kim, J. S. J. Korean Phys.Soc. 2011, 59, 346.
15. Agura, H.; Suzuki, A.; Matsushita, T.; Aoki, T.; Okuda, M. Thin
Solid Films 2003, 445, 263.16. Berber, M.; Bulto, V.; Kliß, R.; Hahn, H. Scripta Mater. 2005, 53,
547.
17. Williamson, G. B.; Smallman, R. C. Philos. Mag. 1956, 1, 34.18. Gupta, B.; Jain, A.; Mehra, R. M. J. Mater. Sci. Technol. 2010,
26(3), 223.
19. Fujihara, S.; Suzuki, A.; Kimura, T. J. Appl. Phys. 2003, 94, 2411.20. Hong, R. J.; Huang, J. B.; He, H. B.; Fan, Z. X.; Shao, J. D. Appl.
Surf. Sci. 2005, 242, 346.
21. Barret, C. S.; Massalski, T. B. Structure of Metals; PergamonPress: Oxford, 1980.
22. Kim, K. H.; Park, K. C.; Ma, D. Y. J. Appl. Phys. 1997, 81, 7764.
23. Jain, A.; Sagar, P.; Mehra, R. M. Solid State Electron. 2006, 50,1420.
24. Dragoman, D.; Dragoman, M. Optical Characterization of Solids;
Springer-Verlag: Heidelberg, 2002.25. Wang, M.; Lee, K. E.; Hahn, S. H.; Kim, E. J.; Chung, J. S.; Shin,
E. W.; Park, C. Mater. Lett. 2007, 61, 1118.
26. Rozati, S. M.; Akesteh, S. Mater. Charact. 2007, 58, 319.
Eo
2 =
M 1–
M 3–
---------
Ed
2 =
M 1–
3
M 3–
---------
σ′ = ωε2ε0
σ″ = ωε1ε0
Figure 11. Variation in (a) real and (b) imaginary parts of theoptical conductivity of the AZO thin films with different Alconcentrations.

Structural and Optical Properties of AZO Thin Films Bull. Korean Chem. Soc. 2012, Vol. 33, No. 4 1241
27. Minami, T.; Kakumu, T.; Takeda, Y. Thin Solid Films 1996, 290-291, 1.
28. Yakuphanoglu, F.; Cukurovali, A.; Yilmaz, I. Opt. Mater. 2005,
27, 1363.29. Abeles, F. Optical Properties of Solids; North-Holland Publishing
Company: London, UK, 1972.
30. Bandyopadhyay, S.; Paul, G. K.; Sen, S. K. Sol. Energy Mater. Sol.
C 2002, 71, 103.31. Shim, H. S.; Han, N. S.; Seo, J. H.; Park, S. M.; Song, J. K. Bull.
Korean Chem. Soc. 2010, 31, 2675.
32. Quasrawi, A. F.; Shukri Ahmad, M. M. Cryst. Res. Technol. 2006,41, 364.
33. Hodgson, J. N. Optical Absorption and Dispersion in Solids;
Chapman and Hall Ltd.: 11 New fetter Lane London EC4, 1970.