effects of axis ratio on the vortex-induced vibration and
TRANSCRIPT

1 Copyright © 2014 by ASME
EFFECTS OF AXIS RATIO ON THE VORTEX-INDUCED VIBRATION AND ENERGY HARVESTING OF RHOMBUS CYLINDER
Li Zhang [email protected]
Key Laboratory of Low-grade Energy Utilization Technologies
and Systems of Ministry of Education of China(Chongqing
University) Chongqing , China
Heng Li [email protected]
Key Laboratory of Low-grade Energy Utilization Technologies
and Systems of Ministry of Education of China(Chongqing
University) Chongqing , China
Lin Ding [email protected]
Key Laboratory of Low-grade Energy Utilization Technologies
and Systems of Ministry of Education of China(Chongqing
University) Chongqing , China
ABSTRACT The vortex-induced vibrations of a rhombus cylinder are
investigated using two-dimensional unsteady Reynolds-
Averaged Navier-Stokes simulations at high Reynolds numbers
ranging from 10,000 to 120,000. The rhombus cylinder is
constrained to oscillate in the transverse direction, which is
perpendicular to the flow velocity direction. Three rhombus
cylinders with different axis ratio (AR=0.5, 1.0, 1.5) are
considered for comparison. The simulation results indicate that
the vibration response and the wake modes are dependent on
the axis ratio of the rhombus cylinder. The amplitude ratios are
functions of the Reynolds numbers. And as the AR increases,
higher peak amplitudes can be made over a significant wide
band of Re. On the other hand, a narrow lock-in area is
observed for AR=0.5 and AR=1.5 when 30,000<Re<50,000, but
the frequency ratio of AR=1.0 monotonically increases at a
nearly constant slope in the whole Re range. The vortex
shedding mode is always 2S mode in the whole Re range for
AR=0.5. However, the wake patterns become diverse with the
increasing of Re for AR=1.0 and 1.5. In addition, the
mechanical power output of each oscillating rhombus cylinder
is calculated to evaluate the efficiency of energy transfer in this
paper. The theoretical mechanical power P between water
and a transversely oscillating cylinder is achieved. On the base
of analysis and comparison, the rhombus cylinder with AR=1.0
is more suitable for harvesting energy from fluid.
INTRODUCTION Flow-induced motion (FIM) is a canonical problem of
fluid-structure interaction. Elastically mounted, rigid, bluff
bodies that are long in one direction perpendicular to a free
stream are susceptible to this phenomenon. The classic research
on FIM is that of a circular cylinder, elastically mounted,
immersed in a free stream. Much research has been made in this
field for the past decades. Generally speaking, vortex-induced
vibration is affected by a large number of system parameters,
which include the mass ratio, structure stiffness, system
damping, surface roughness of the cylinder, etc (1-5).
The oscillating amplitude is an extremely important
measurement, which can quantify the displacement response of
vortex-induced vibration (VIV). Moreover, the frequency is
another crucial measurement to describe the dynamic
characteristic of the oscillation system. As for a circular
cylinder subjected to flow-induced motion, several different
frequencies are defined to fully describe the phenomenon, such
as the natural frequency of the cylinder, the oscillating
frequency and the vortex shedding frequency. With the
increasing of flow velocity, the oscillating frequency will
remain around the natural frequency over a range of flow
velocity, this is called a lock-in area and the cylinder will
oscillate at a relatively high amplitude. An experimental study
of a circular cylinder with different mass ratios were conducted
by Govardhan and Williamson (7), the results show that the
oscillation frequency is a function that depends on the reduced
velocity.
On the other hand, in order to gain a better understanding
of VIV, Williamson and Roshko (9) studied the relationship
between the vibration amplitude and the vortex shedding mode.
Digital Particle Image Velocimetry (DPIV) was adopted in the
experiments to identify the vortex shedding patterns behind the
oscillating cylinder. Based on a large number of tests results, the
Williamson-Roshko wake mode maps (6, 9) were established.
Proceedings of the ASME 2014 Power Conference POWER2014
July 28-31, 2014, Baltimore, Maryland, USA
POWER2014-32156

2 Copyright © 2014 by ASME
Their findings suggest that the vortex shedding mode is closely
related to the vibration of the cylinder. Different wake modes
can be observed for a rigid cylinder with low mass and low
damping undergoing vortex-induced vibration, including the
“2S”, “2P”, “P+S” and “2P+2S”, etc(7-11). Here, the “S”
represents a single vortex and the “P” represents a pair of
vortices. Need to add that, more complicated wake modes could
be created in some circumstances, but these complex modes are
also made up of some basic modes.
Flow-induced motion is the product of the interaction
between fluid and the cylinder. This kind of interaction depends
upon two factors: the density and velocity of the fluid, the
stiffness and mass distribution of the structure. It’s significant to
note that the influence of the geometry of the oscillating
cylinder is one that has received little attention with regard to
VIV (12). Actually, geometrical features can have a significant
impact on the exciting force of flow-induced motion and the
study on this effect can offer some insight into the excitation
mechanism. After studying the flow-induced motion of two-
dimensional bluff body, Pakinson and Simith (13) pointed out
that the shape and size of a bluff body are the most important
parameters affecting the exciting force. Deniz and Staubli (14,
15) performed controlled oscillation experiments of
rectangular- and octagonal- section cylinders. The visualization
analysis of the flow field was adopted to show the process of
vortex shedding and collision. The research highlighted that the
length of the after-body (the body downstream of the separation
points of the shear layers) can have a substantial impact on the
oscillation response of the cylinder.
It can be inferred from the existing literature that data on
the flow over rhombus cylinders is limited, especially at high
Reynolds numbers. Meanwhile, research on the energy transfer
of rhombus cylinders has not been reported yet. Hence, the
focus of this numerical study is to investigate the influence of
geometry on vortex-induced vibration of rhombus cylinder and
to identify the passive geometric features that can be used to
generate large amplitude oscillations suitable to drive a
generator. In the present work, two-dimensional unsteady
turbulent flow over a rhombus cylinder with different axis ratio
(AR) was investigated numerically. The rhombus cylinder is
constrained to oscillate in the transverse direction. Numerical
simulations were performed for high Reynolds numbers ranging
from 10,000 to 120,000 in three different axis ratios, AR=0.5,
1.0 and 1.5. The influences of the AR on the amplitude and
frequency ratio, wake structure, and theoretical mechanical
power are obtained.
PHYSICAL SYSTEM The physical model considered in this paper consists of an
oscillatory system as depicted in Fig.1. The elements of the
oscillatory system are a rigid rhombus cylinder, K is the
stiffness of two supporting linear springs, and the system
damping C due to friction. The rhombus cylinders are
constrained to oscillate in the y-direction, which is
perpendicular to the flow direction (x). Three rhombus cylinders
with different axis ratio (AR=0.5, 1.0, 1.5) are considered for
comparison, where AR=L/D and L is the length of diagonal of
the rhombus cylinder parallel to the flow direction, D is the
length of diagonal vertical to the flow direction. The Reynolds
number is defined as Re =UD/ν.
Fig. 1 Schematic of the physical model
In this paper, the system parameters of the models in the 2-
D URANS simulation are listed in Table 1 and Table 2.
Table 1 Nomenclature
peakA Peak amplitude
rmsA Root-mean-square amplitude
D Length of diagonal vertical to the flow
direction
L Length of diagonal parallel to the flow
direction
Re Reynolds number
K Spring constant
,1/n n waterT f Natural period in water
U Flow velocity
systemC Structural damping
, / ( ) / 2n water osc af K m m System natural frequency in water
oscf Oscillating frequency of cylinder
dm Displaced fluid mass
a a dm C m Added mass
oscm Oscillating system mass
* /osc dm m m Mass ratio
Kinematic molecular viscosity
Density of the fluid
aC Added mass coef.

3 Copyright © 2014 by ASME
Table 2 Physical model parameters
Item AR=0.5 AR=1.0 AR=1.5
Diameter D [m] 0.0889 0.0889 0.0889
Length l [m] 0.9144 0.9144 0.9144
Oscillating system mass oscm [kg] 10.94 10.94 10.94
Spring const. K [N/m] 400 400 400
Damping systemC 14.98 14.98 14.98
Natural freq. in water ,n waterf 0.89 0.83 0.78
GOVERNING EQUATION In this section, the mathematical modeling for the fluid
dynamics is provided.
In this study, the flow is assumed to be two-dimensional
and unsteady, and the fluid is incompressible. The flow is
modeled using the Unsteady Reynolds-Averaged Navier-Stokes
(URANS) equations together with the one-equation Spalart–
Allmaras (S–A) turbulence model. The basic URANS equations
are:
0i
i
U
x
(1)
1( ) (2 )i
i j ij i j
j i j
U pU U S u u
t x x x
(2)
where, is the molecular kinematic viscosity and ijS is the
mean strain-rate tensor.
1( )
2
jiij
j i
UUS
x x
(3)
iU is the mean flow velocity vector. ij i ju u is known as
the Reynolds-stress tensor. The Boussinesq eddy-viscosity
approximation is employed to solve the URANS equations for
the mean-flow properties of the turbulence flow.
The dynamics of the rhombus cylinder is modeled by the
classical linear oscillator model.
( )oscm y cy Ky f t (4)
Here, oscm is the total oscillating mass of cylinder, c is
the damping of the system, and K is the linear spring
constant.
COMPUTATIONAL DOMAIN AND GRID GENERATION The computational domain is 50D×50D for the single
rhombus cylinder. As shown in Fig.2 (a), the entire domain
includes five boundaries: inflow, outflow, top, bottom, and the
cylinder. The cylinder is located in the center of the
computational domain. The inflow velocity is considered as
uniform and constant velocity. At the out flow boundary, a zero
gradient condition is specified for velocity. The bottom and top
conditions are defined the same as the inflow boundary. A
moving wall boundary condition is applied for the cylinder
when the cylinder is in FIM. In order to see the effect of the
axis ratio (AR) on the vortex-induced vibration of rhombus
cylinder, numerical simulations were done for high Reynolds
numbers ranging from 10,000 to 120,000 in three different axis
ratios, AR=0.5, 1.0 and 1.5.
(a)
(b)
Fig. 2 (a) Computational domain. (b) Sample of the
grid points for AR=1.5.
A grid sensitivity study was conducted on three different
grid levels for the rhombus cylinder with different AR. The
vibration displacement and lift coefficient were calculated for
comparison. For the present study, all three grids obtain similar
results. In view of the computer resources and computing time,
grid number 240×200 was chosen for all simulations. Fig.2 (b)
displays a sample of the grid points for AR=1.5.
RESULTS AND DISCUSSION Simulations were conducted to study the effect of axis ratio
(AR=0.5, 1.0, 1.5) on the fluid flow around a rhombus cylinder.
In particular, the correlations between the geometry and the
vibration response, the energy output have been analyzed.
The traditional measure of flow-induced motion response
has been the peak amplitude of oscillation. This measure admits
only harmonic body oscillations, meaning that the peak

4 Copyright © 2014 by ASME
amplitude and frequency of the oscillating cylinder are required
to fully describe the motion. It’s not a problem during fully
synchronized VIV. However, the vibration properties are not
clear when the flow is not completely synchronized to the body
motion. In order to get a better description of the amplitude
response of rhombus cylinder, the peak amplitude (peakA ) and
the root-mean-square (RMS) amplitude (rmsA ) are presented in
this paper.
The peak amplitude ratio (peakA /D) for the numerical
study are plotted in Fig.3a. Fig.3b presents a measure of the
RMS amplitude ratio (rmsA /D), and provides a more
meaningful measure of magnitude for asymmetric oscillations.
(a)
(b)
Fig. 3 (a) Peak amplitude ratio ( peakA /D). (b) RMS
amplitude ratio (rmsA /D).
Fig.3 shows the peak amplitude and the root-mean-square
amplitude of oscillation for all three geometries as functions of
Reynolds number:
a) AR=0.5: It should be noted that the peak amplitude ratio
and the RMS amplitude ratio follow the same trends as the
Re increases. A number of regions have been identified for
this cylinder in two different amplitude ratio curves. The
first region is the “initial” branch in VIV for Re<30,000.
The peak amplitude is below 0.1D in this region. Further
increasing Re sees the onset of the “upper branch” for
40,000<Re<60,000. The peak amplitude risen steeply from
0.08D to 0.68D when the Reynolds number reaches
40,000, then stays around 0.7D. With the increasing of
Reynolds number, the following region is identified as the
“lower branch” in which the peak amplitude gradually
dropped to about 0.4D and stays stable when Re increases
from 70,000 to 120,000.
b) AR=1.0: No obvious branches are observed in the
amplitude response of this rhombus cylinder. When Re
increases from 10,000 to 70,000, the peak amplitude rises
sharply from 0.05D to 0.97D. Then it stays around 1D and
the maximum amplitude 1.07D is obtained when
Re=120,000.
c) AR=1.5: No obvious branches are observed in the
amplitude response of this rhombus cylinder. As can be
seen from Fig. 3a, the peak amplitude increases
continuously with Re in the whole Re range. The
maximum amplitude 1.52D is achieved when Re=120,000.
However, the RMS amplitude has a different changing
trend, this difference indicates that the oscillating loses its
periodicity. Fig. 3b shows that the RMS amplitude stays
around 0.5D when Re>60,000.
Fast Fourier Transform (FFT) is used to process the
simulation records for each run and for each cylinder. The
major harmonic frequency of oscillation for each cylinder is
non-dimensionalized by the corresponding system natural
frequency in water,,n waterf . The frequency ratio is plotted versus
Reynolds number in Fig.4.
Fig. 4 Frequency ratio ( ,/osc n waterf f )
a) AR=0.5: As shown in Fig.4, The frequency ratio quickly
rises to 1.1 when Re reaches 30,000. With the increases of
Re, a narrow lock-in area is observed for
30,000<Re<50,000, which corresponding to the “upper
branch”. Following the lock-in area, the curve shows a

5 Copyright © 2014 by ASME
nearly constant slope when Re>50,000. Eventually, the
maximum frequency ratio 2.84 is achieved at Re=120,000.
b) AR=1.0: The frequency ratio of this cylinder
monotonically increases at a nearly constant slope in the
whole Re range. It's important to point out that the
frequency ratio curve of AR=1.0 keeps above the other
two curves when Re>50,000. The maximum value reaches
up to 4.1 at Re=120,000.
c) AR=1.5: As the Re increases to 30,000, the frequency ratio
reaches 0.98. After Re=30,000, frequency ratio stabilizes
around 1.1 for a narrow Re range, with the oscillation
frequency of the cylinder being very close to the system
natural frequency. When Re>60,000, the frequency ratio
increases sharply to relatively high value.
In fact, amplitude and frequency are integral properties of
the fluid-structure dynamics. The differences in vortex shedding
patterns are caused by the interaction of vortices being shed
from the sharp corners (including the leading edge and the
trailing edge) of the cylinder. To get a better understanding of
the relationship between the oscillation response and the vortex
shedding process, the vortex structures around the cylinder are
presented.
The simulation results of three typical Reynolds numbers
are presented. The vortex structure for each rhombus cylinder at
Re=30,000, Re=60,000, Re=90,000, and Re=120,000 are
presented in Figs.5-8, respectively.
The most striking feature of rhombus cylinders is the sharp
trailing edge can have a significant impact on the wake response,
and the vortex pattern becomes more complex when the AR
increases. It's important to note that the vortex shedding mode is
always 2S mode in the whole Re range for AR=0.5. However,
the wake patterns become diverse with the increasing of Re for
AR=1.0 and 1.5.
As for AR=0.5, the size of the trailing edge is relatively
small and the trailing edge has slight effect on the interaction
between the two shear layers. The two separating shear layers
could interact with each other freely, the vortex formed on one
side of the cylinder will be chopped by the shear layer from
another side of the cylinder. In this process, “2S” mode is
formed. However, the impact of the sharp trailing edge can no
longer be ignored for AR=1.0 and AR=1.5. The vortex
formation is influenced by the interaction between the shear
layer and the sharp trailing edge. As can be observed in the
images of vorticity, the sharp trailing edge delays the interaction
of the separation shear layers and snips the vortices formed
from the shear layers. For the “2P” mode, both forming vortices
are snipped by the sharp trailing edge. During the development
of “P+S”, “P+S+S” and “P+S+P” mode, a similar effect of
trailing edge can be observed in the vortex shedding process.
a) Re=30,000
In Fig.5, images of vorticity clearly describe the vortex
structure of a rhombus cylinder. For AR=0.5, the “2S” mode of
vortex shedding is observed for the rhombus cylinder. Two
single vortices shed from the cylinder per cycle of oscillation,
one by the top shear layer and another one by the bottom shear
layer. For AR=1.0, the wake is in a “P+S” mode, consisting of a
pair of vortices on one side, and a single vortex on the other
side per oscillation cycle. “2P” mode is observed for AR=1.5,
consisting of two pairs of vortices per oscillation cycle.
(a)
(b)
(c)
Fig. 5 Vortex structures for different rhombus cylinders at
Re=30,000. (a) AR=0.5, (b) AR=1.0, (c) AR=1.5.
b) Re= 60,000
The wake is still in “2S” mode for AR=0.5. But for
AR=1.0, two different modes are observed. For a period of
oscillation at a relatively low amplitude, the mode is “P+S”.
However, this mode is not stable. Fig.6 (b) shows that a
“P+S+S” mode is observed. During the downstroke of the first
cycle, the top shear layer forms a pair of vortices shed from the
trailing edge at first, then another single vortex shed from the
top shear layer. This change in wake mode corresponding to a
peak amplitude which can be seen in the displacement curve.
For AR=1.5, the wake modes are “2P” and “P+S+P”. One more
“S” shed from the shear layer per oscillation cycle, which lead
to development from “2P” to “P+S+P”. This development in the
wake pattern also generates a sudden change in the
displacement of the cylinder.
6 Copyright © 2014 by ASME
(a)
(b)
(c)
Fig. 6 Vortex structures for different rhombus cylinders at
Re=60,000. (a) AR=0.5, (b) AR=1.0, (c) AR=1.5.
It should be mentioned that the wake mode (AR=1.0 and
1.5) becomes very unstable when Re>60,000. It will transform
between several different modes. The unstable wake pattern
creates chaos in the wake of a cylinder.
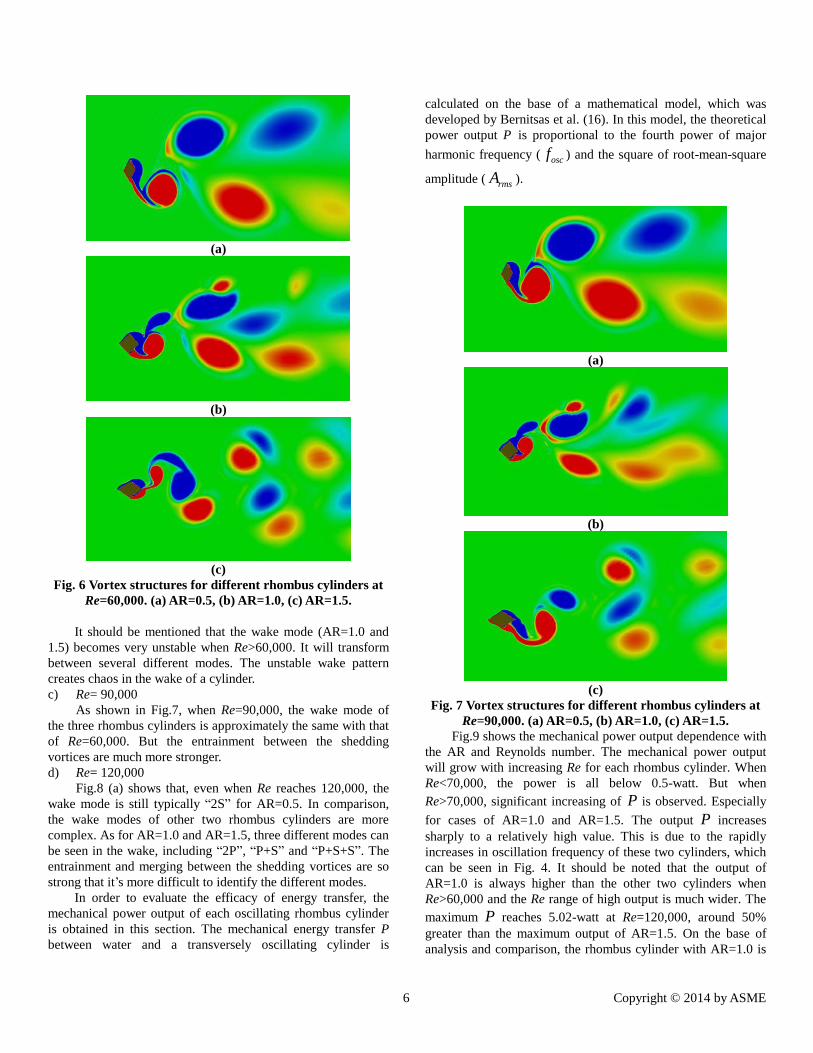
c) Re= 90,000
As shown in Fig.7, when Re=90,000, the wake mode of
the three rhombus cylinders is approximately the same with that
of Re=60,000. But the entrainment between the shedding
vortices are much more stronger.
d) Re= 120,000
Fig.8 (a) shows that, even when Re reaches 120,000, the
wake mode is still typically “2S” for AR=0.5. In comparison,
the wake modes of other two rhombus cylinders are more
complex. As for AR=1.0 and AR=1.5, three different modes can
be seen in the wake, including “2P”, “P+S” and “P+S+S”. The
entrainment and merging between the shedding vortices are so
strong that it’s more difficult to identify the different modes.
In order to evaluate the efficacy of energy transfer, the
mechanical power output of each oscillating rhombus cylinder
is obtained in this section. The mechanical energy transfer P between water and a transversely oscillating cylinder is
calculated on the base of a mathematical model, which was
developed by Bernitsas et al. (16). In this model, the theoretical
power output P is proportional to the fourth power of major
harmonic frequency ( oscf ) and the square of root-mean-square
amplitude ( rmsA ).
(a)
(b)
(c)
Fig. 7 Vortex structures for different rhombus cylinders at
Re=90,000. (a) AR=0.5, (b) AR=1.0, (c) AR=1.5.
Fig.9 shows the mechanical power output dependence with
the AR and Reynolds number. The mechanical power output
will grow with increasing Re for each rhombus cylinder. When
Re<70,000, the power is all below 0.5-watt. But when
Re>70,000, significant increasing of P is observed. Especially
for cases of AR=1.0 and AR=1.5. The output P increases
sharply to a relatively high value. This is due to the rapidly
increases in oscillation frequency of these two cylinders, which
can be seen in Fig. 4. It should be noted that the output of
AR=1.0 is always higher than the other two cylinders when
Re>60,000 and the Re range of high output is much wider. The
maximum P reaches 5.02-watt at Re=120,000, around 50%
greater than the maximum output of AR=1.5. On the base of
analysis and comparison, the rhombus cylinder with AR=1.0 is

7 Copyright © 2014 by ASME
more suitable for harvesting energy from fluid. In other words,
it has a greater potential to drive a generator among these three
rhombus cylinders.
(a)
(b)
(c)
Fig.8. Vortex structures for different rhombus cylinders at
Re=120,000. (a) AR=0.5, (b) AR=1.0, (c) AR=1.5.
Fig. 9 Mechanical power output P (in watts).
CONCLUSIONS In this study, two-dimensional unsteady turbulent flow
over a rhombus cylinder with different axis ratio (AR) was
investigated numerically. The rhombus cylinder is constrained
to oscillate in the transverse direction. Numerical simulations
were performed for high Reynolds numbers ranging from
10,000 to 120,000 in three different axis ratios, AR=0.5, 1.0,
and 1.5. The influences of the AR on the amplitude and
frequency ratio, wake structure, and theoretical mechanical
power are obtained: 1) Both the peak amplitude ratio and root-mean-square
amplitude ratio are functions of the Reynolds numbers. As
the AR increases, higher peak amplitudes can be achieved
over a significant wide band of Re. For AR=0.5, three
branches have been observed, including the “initial
branch”, the “upper branch” and the “lower branch”.
However, the branches can not be clearly observed in the
amplitude response of the other two cylinders.
2) The frequency-ratio results show that a narrow lock-in
area is observed for AR=0.5 and AR=1.5 when
30,000<Re<50,000, but the frequency ratio of AR=1.0
monotonically increases at a nearly constant slope in the
whole Re range. It should be noted that the frequency ratio
curve of AR=1.0 keeps above the other two curves when
Re>50,000 and the maximum value reaches up to 4.1
finally.
3) The most striking feature of rhombus cylinders is the sharp
trailing edge can have a significant impact on the wake
response, and the vortex pattern becomes more complex
when the AR increases. The vortex shedding mode is
always 2S mode in the whole Re range for AR=0.5.
However, the wake patterns become diverse with the
increasing of Re for AR=1.0 and 1.5. When Re>60,000, it
will transform between several different modes.
4) The mechanical power output will grow with increasing Re
for each rhombus cylinder. For AR=1.0, the output is
always higher than the other two cylinders when
Re>60,000 and the Re range of high output is also much
wider. Thus, it can be concluded that the cylinder with
AR=1.0 has a greater potential to drive a generator among
these three rhombus cylinders.
5) The results of this paper are only limited to three different
axis ratios, the case of AR=1.0 may not be the most
appropriate rhombus cylinder for energy harvesting.
Hence, much more work must be done to fully analyze the
vibration response of rhombus with plenty of different axis
ratios. Moreover, passive control can also be used to
improve the disorder and chaos in the wake of a rhombus
cylinder, such as rounding or chamfering the corners of a
rhombus cylinder.
ACKNOWLEDGMENTS This work was supported by the Specialized Research
Fund for the Doctoral Program of Higher Education of China
(Grant No. 20120191130003).

8 Copyright © 2014 by ASME
REFERENCES 1 Govardhan R, Williamson C H K. Critical mass in vortex-
induced vibration of a cylinder[J]. European Journal of
Mechanics B-Fluids, 2004, 23(1): 17-27.
2 Vikestad K, Vandiver J K, Larsen C M. Added mass and
oscillation frequency for a circular cylinder subjected to
vortex-induced vibrations and external disturbance[J].
Journal of Fluids and Structures, 2000, 14(7): 1071-1088.
3 Skop R A, Luo G. An inverse-direct method for predicting
the vortex-induced vibrations of cylinders in uniform and
nonuniform flows[J]. Journal of Fluids and Structures,
2001, 15(6): 867-884.
4 Guilmineau E, Queutey P. Numerical simulation of vortex-
induced vibration of a circular cylinder with low mass-
damping in a turbulent flow[J]. Journal of Fluids and
Structures, 2004, 19(4): 449-466.
5 Jauvtis N, Williamson C H K. The effect of two degrees of
freedom on vortex-induced vibration at low mass and
damping[J]. Journal of Fluid Mechanics, 2004, 509: 23-62.
6 Khalak A, Williamson C H K. Motions, forces and mode
transitions in vortex-induced vibrations at low mass-
damping[J]. Journal of Fluids and Structures, 1999, 13(7-
8): 813-851.
7 Williamson C H K, Govardhan R. Vortex-induced
vibrations[J]. Annual Review of Fluid Mechanics, 2004,
36: 413-455.
8 Govardhan R, Williamson C H K. Modes of vortex
formation and frequency response of a freely vibrating
cylinder[J]. Journal of Fluid Mechanics, 2000, 420: 85-
130.
9 Williamson C H K, Roshko A. Vortex formation in the
wake of an oscillating cylinder[J]. Journal of Fluids and
Structures, 1988, 2(4): 355-381.
10 Williamson C H K. Sinusoidal flow relative to circular-
cylinders[J]. Journal of Fluid Mechanics, 1985, 155(1):
141-174.
11 Jauvtis N, Williamson C H K. Vortex-induced vibration of
a cylinder with two degrees of freedom[J]. Journal of
Fluids and Structures, 2003, 17(7): 1035-1042.
12 Leontini J S, Thompson M C. Vortex-induced vibrations
of a diamond cross-section: Sensitivity to corner
sharpness[J]. Journal of Fluids and Structures, 2013.
13 Parkinson G V, Smith J D. The square prism as an
aeroelastic non-linear oscillator[J]. The Quarterly Journal
of Mechanics and Applied Mathematics, 1964, 17(2): 225-
239.
14 Deniz S, Staubli T. Oscillating rectangular and octagonal
profiles: modelling of fluid forces[J]. Journal of fluids and
structures, 1998, 12(7): 859-882.
15 Deniz S, Staubli T. Oscillating rectangular and octagonal
profiles: Interaction of leading-and trailing-edge vortex
formation[J]. Journal of Fluids and Structures, 1997, 11(1):
3-31.
16 Bernitsas M M, Raghavan K, Ben-Simon Y, et al.
VIVACE (vortex induced vibration aquatic clean energy):
A new concept in generation of clean and renewable
energy from fluid flow[J]. Journal of Offshore Mechanics
and Arctic Engineering, 2008, 130(4): 41101.