effects of bicarbonate limitation and salinity … · salinity from 10 to 100 ppt, as well as the...
TRANSCRIPT

Effects of bicarbonate limitation and salinity stress on growth... Annan and Henley
EFFECTS OF BICARBONATE LIMITATION AND SALINITY STRESS
ON GROWTH AND PHOTOSYNTHESIS IN THE GREEN ALGA
PICOCHLORUM OKLAHOMENSIS
J. N. Annan1 and W. J. Henley2
1Department of Biology Education, University of Education,
P. O. Box 25, Winneba. Ghana 2Department of Botany, Oklahoma State University, Stillwater, OK. U.S.A.
ABSTRACT
Photosynthetic organisms rarely experience optimal growth conditions in their natural habitat,
and at any given time, two or more physical and chemical variables are likely to be suboptimal.
The extreme environment of the Great Salt Plains (GSP) results in low algal biomass, such that
natural selection is likely driven by survival of multiple abiotic stresses rather than rapid growth
and biotic interactions. The objective of this study is to determine the effect of combined salinity
stress and carbon limitation on growth and photosynthesis in the green alga Picochlorum okla-
homensis isolated from the GSP habitat. Algal cells were grown in batch cultures under bicar-
bonate sufficiency (control) or low bicarbonate at salinities of 10, 50 and100 ppt. in artificial
seawater (AS 100) medium. Cells were physiologically characterized by initial growth rates, cell
yields, photosynthetic light-response curves (oxygen evolution), pigment composition, and the
chlorophyll fluorescence parameters Fv/Fm, ФPSII, qP and NPQ. Low bicarbonate and increasing
salinity from 10 to 100 ppt, as well as the bicarbonate-salinity interaction resulted in significant
lower cell yields and initial growth rates. In general, high salinity resulted in significant primary
effects for the majority of variables but a significant effect of bicarbonate and bicarbonate-
salinity interaction were less common among the physiological variables.
INTRODUCTION
Picochlorum oklahomensis, a unicellular
halotolerant green alga, was isolated from shal-
low evaporitic pools at the Salt Plains National
Wildlife Refuge (SPNWR) in northwestern
Oklahoma, USA. Picochlorum sp. is classified
as belonging to the Domain Eukarya, Kingdom
Protista, Division Chlorophyta and Class Tre-
bouxiophyceae (Graham and Wilcox, 2000;
Henley et al., 2002; 2004).
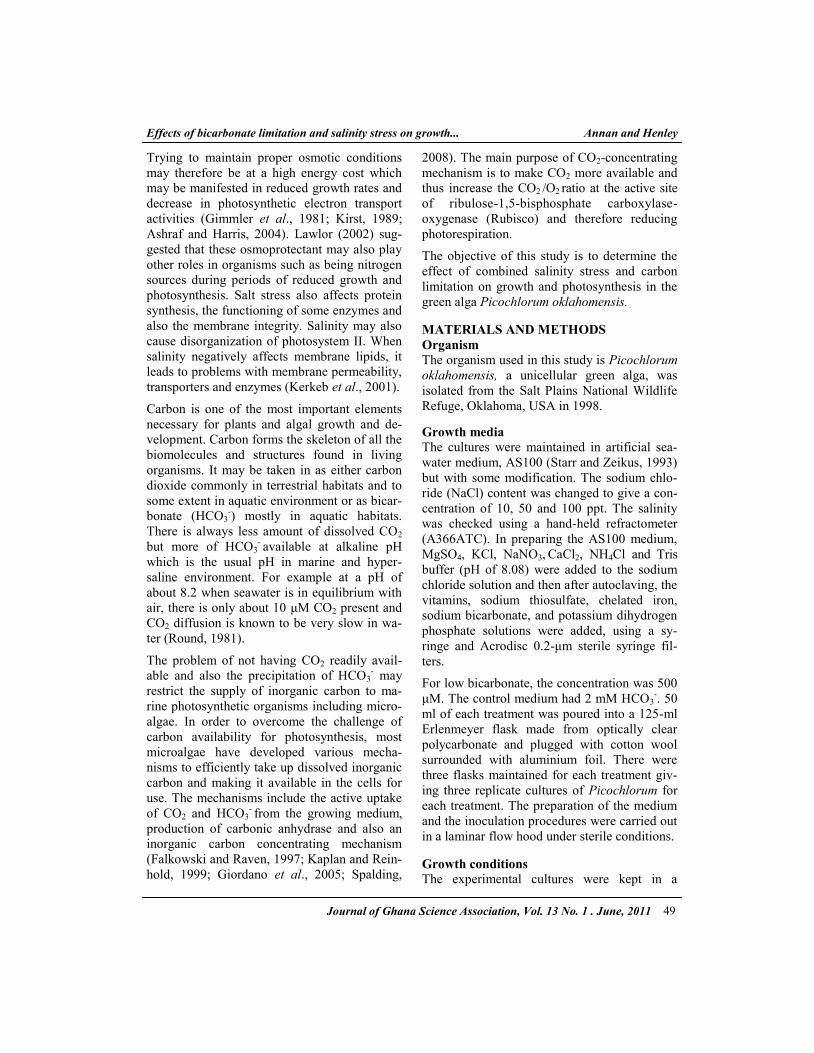
Picochlorum is a spherical green alga of ap-
proximately 2 μm in diameter. It has a nucleus,
one lateral chloroplast and one mitochondrion
(Fig. 1). Members of the Trebouxiophyceae
generally contain chlorophylls a and b, lutein,
neoxanthin and ß-carotene. Plasmalemma and
cell walls are present but it lacks flagella and it
is known to reproduce by autosporulation
(Henley et al., 2002; 2004).
The SPNWR is characterized as being a hyper-
saline environment which has a warm-
temperate, semiarid, continental climate
Journal of Ghana Science Association, Vol. 13 No. 1 . June, 2011 47

Effects of bicarbonate limitation and salinity stress on growth... Annan and Henley
(Henley et al., 2002). Hypersaline environ-
ments, including the SPNWR usually have high
salinity, exhibit fluctuations in their salt con-
centration over time because they are generally
found in areas which are occasionally flooded
by rain or seawater and are also subject to
evaporation. Some minerals may precipitate as
a result of the evaporation and this could lead
to changes in the brine composition (Eugster
and Jones, 1979; Nissenbaum, 1980). Nutrient
concentrations and ratios do vary with salinity
and anion composition in saline lakes and these
changes in salinity can potentially affect algal
nutrient requirements (Schobert, 1974; Cole et
al., 1986). Organisms living in the SPNWR are
exposed to these variations in environmental
factors and may have developed ways to cope
with these changes.
There is uncertainty about the effects of high
and variable salinity on nutrient solubility and
bioavailability. It is anticipated that high salin-
ity would make nutrient less bioavailable to the
organism because of precipitation and therefore
organisms found in such environments may
become adapted to low nutrient levels. There
have been various interests in looking at the
effect of salinity on algal and plant growth as
well as separate studies investigating the effect
of low nutrients on algae and plants. However,
there have been very few studies looking at the
effects of both salinity and low nutrients con-
currently in algae or plants. Recent effort has
been looking at either, salinity and temperature,
temperature and light or salinity and light, but
no previous study has examined the effect of
salinity and nutrients limitation relating to
plants and algae particularly those from the
SPNWR.
Salinity refers to the salt content of water or the
soil. It is considered to be a very important en-
vironmental factor because of its role in reduc-
ing crop yield in most part of the world
(Komori et al., 2003). Apart from challenges
experienced by organisms in the natural habi-
tats such as marine and hypersaline environ-
ment, increases in salinity is also encountered
as a result of inappropriate irrigation techniques
employed by farmers in soils considered to be
arid or semiarid. Salinity stress may affect
plants and algae through osmotic and ionic
stress. Water deficit bring about osmotic stress
while as a result of excess Na+ and Cl- and re-
duction in the uptake of other mineral nutrients
can bring about ionic imbalances or stress
(Ashraf and Harris, 2004).
Plants and algae may differ in the way they
respond to salt stress. Some are able to tolerate
the salt stress within certain limits without any
problem. Others are able to exclude the salts
through their leaves or salt glands. Still others
produce compounds making their tissues toler-
ant to the salt concentration. One of such com-
mon ways is the production of osmoprotectants
or compatible solutes to lower the internal wa-
ter potential of the cell and thus being able to
take up water from the environment. The com-
patible solutes include mannitol and proline.
Proline is produced in the cell from glutamate
and the synthesis requires ATP and NADPH.
Fig. 1: Transmission electron micrograph of
Picochlorum oklahomensis showing cell wall
(CW), nucleus (N), mitochondrion (M),
chloroplast (C) and starch grain (S). Diame-
ter is approximately 2 μm. (Source: Henley
et al., 2002).
Journal of Ghana Science Association, Vol. 13 No. 1 . June, 2011 48
Effects of bicarbonate limitation and salinity stress on growth... Annan and Henley
Trying to maintain proper osmotic conditions
may therefore be at a high energy cost which
may be manifested in reduced growth rates and
decrease in photosynthetic electron transport
activities (Gimmler et al., 1981; Kirst, 1989;
Ashraf and Harris, 2004). Lawlor (2002) sug-
gested that these osmoprotectant may also play
other roles in organisms such as being nitrogen
sources during periods of reduced growth and
photosynthesis. Salt stress also affects protein
synthesis, the functioning of some enzymes and
also the membrane integrity. Salinity may also
cause disorganization of photosystem II. When
salinity negatively affects membrane lipids, it
leads to problems with membrane permeability,
transporters and enzymes (Kerkeb et al., 2001).
Carbon is one of the most important elements
necessary for plants and algal growth and de-
velopment. Carbon forms the skeleton of all the
biomolecules and structures found in living
organisms. It may be taken in as either carbon
dioxide commonly in terrestrial habitats and to
some extent in aquatic environment or as bicar-
bonate (HCO3-) mostly in aquatic habitats.
There is always less amount of dissolved CO2
but more of HCO3- available at alkaline pH
which is the usual pH in marine and hyper-
saline environment. For example at a pH of
about 8.2 when seawater is in equilibrium with
air, there is only about 10 μM CO2 present and
CO2 diffusion is known to be very slow in wa-
ter (Round, 1981).
The problem of not having CO2 readily avail-
able and also the precipitation of HCO3- may
restrict the supply of inorganic carbon to ma-
rine photosynthetic organisms including micro-
algae. In order to overcome the challenge of
carbon availability for photosynthesis, most
microalgae have developed various mecha-
nisms to efficiently take up dissolved inorganic
carbon and making it available in the cells for
use. The mechanisms include the active uptake
of CO2 and HCO3- from the growing medium,
production of carbonic anhydrase and also an
inorganic carbon concentrating mechanism
(Falkowski and Raven, 1997; Kaplan and Rein-
hold, 1999; Giordano et al., 2005; Spalding,
2008). The main purpose of CO2-concentrating
mechanism is to make CO2 more available and
thus increase the CO2 /O2 ratio at the active site
of ribulose-1,5-bisphosphate carboxylase-
oxygenase (Rubisco) and therefore reducing
photorespiration.
The objective of this study is to determine the
effect of combined salinity stress and carbon
limitation on growth and photosynthesis in the
green alga Picochlorum oklahomensis.
MATERIALS AND METHODS
Organism
The organism used in this study is Picochlorum
oklahomensis, a unicellular green alga, was
isolated from the Salt Plains National Wildlife
Refuge, Oklahoma, USA in 1998.
Growth media
The cultures were maintained in artificial sea-
water medium, AS100 (Starr and Zeikus, 1993)
but with some modification. The sodium chlo-
ride (NaCl) content was changed to give a con-
centration of 10, 50 and 100 ppt. The salinity
was checked using a hand-held refractometer
(A366ATC). In preparing the AS100 medium,
MgSO4, KCl, NaNO3, CaCl2, NH4Cl and Tris
buffer (pH of 8.08) were added to the sodium
chloride solution and then after autoclaving, the
vitamins, sodium thiosulfate, chelated iron,
sodium bicarbonate, and potassium dihydrogen
phosphate solutions were added, using a sy-
ringe and Acrodisc 0.2-μm sterile syringe fil-
ters.
For low bicarbonate, the concentration was 500
μM. The control medium had 2 mM HCO3-. 50
ml of each treatment was poured into a 125-ml
Erlenmeyer flask made from optically clear
polycarbonate and plugged with cotton wool
surrounded with aluminium foil. There were
three flasks maintained for each treatment giv-
ing three replicate cultures of Picochlorum for
each treatment. The preparation of the medium
and the inoculation procedures were carried out
in a laminar flow hood under sterile conditions.
Growth conditions
The experimental cultures were kept in a
Journal of Ghana Science Association, Vol. 13 No. 1 . June, 2011 49

Effects of bicarbonate limitation and salinity stress on growth... Annan and Henley
growth room at a day/night temperature regime
of about 27° to 35°C and a photon fluence rate
(PFD) of about 200 μmol photons·m -2· s-1. The
source of light was a 1000-watt metal halide
lamp at a 14:10-h light:dark (L:D) cycle. For
the experiments, the inoculum from the stock
culture in Salt Plain medium (prepared from
salt brine from the salt plains) was preaccli-
mated in a 50 ppt AS 100 medium for seven
days before inoculating for the beginning of the
two-stage experiment. Samples from the first
culture were used to inoculate the second set of
cultures in triplicate after ten days of growth.
The first stage of culture enabled the Picochlo-
rum cells to acclimate to the nutrient treatments
and to ensure that most of the stored nutrients
had been completely used. Each treatment had
three replicates.
Determination of cell numbers and initial
growth rate
Samples were taken daily from each of the cul-
tures throughout the experiment and actual cell
counts performed. Total cell densities were
determined by transferring 10 μl of each sample
unto a hemacytometer and performing total cell
count. The initial growth rate (μ, d-1) was deter-
mined by fitting Jassby and Platt (1976), func-
tion of a nonlinear curve to the graph of ln (cell
density) versus time for each replicate culture
using Sigma Plot 2000 software. The mathe-
matical function by Jassby and Platt (1976) is
given below:
F = CDm x tanh {(µ x T)/CDm} + CDo
where CDm is increase in In cell density, CDo
is Initial In cell density, µ is growth rate (in d-1,
which is the initial slope) and T is time in days.
This equation was used because there was no
prolonged exponential phase giving a linear
line for the determination of initial growth rate.
The cell densities at the end of day 10 were
used as the final cell yield.
In order to further analyze the curvature of the
graphs as a way of getting more information
from the growth data, Bannister’s function
(1979) was used to obtain the convexity values.
F= CDm x (µxd/{CDmc + (µ x d)c) (1/c)}+CDo
where CDm is Final In cell density, CDo is
initial ln cell density, µ is growth rate (in d-1,
which is the initial slope), T is time in days, and
c is convexity.
Photosynthetic Measurement
Six days old second stage cultures were used
for this experiment. Some of the cells were
concentrated in order to obtain cell densities
almost equal to all treatments and spiked with 8
mM NaHCO3. Photosynthetic light-response (P
-I) curves were measured as whole cell oxygen
exchange at 27oC in a Hansatech DW water-
jacketed, 9-mL electrode chamber with con-
tinuous stirring and connected to a computer.
Samples were exposed to a series of 12 incre-
ments of photon flux densities (PFD) from
darkness to > 1500 μmol photons m-2 s-1 using a
slide projector as source of light fitted with
neutral density filters. Exposure to each PFD
was 4 min after a 30-second equilibration pe-
riod.
Photosynthetic rates (μmol O2 hr-1) were auto-
matically calculated in real time by linear re-
gression after each PFD. The calculated photo-
synthetic rates were also checked manually
from the data generated and normalized to cell
density. Light saturated photosynthesis (Pmax),
initial slope (α) and dark respiration (Rd) were
determined by fitting individual curves to a
Jassby and Platt (1976) function using Sigma
Plot 2000 software.
F = Pm x tanh {(α x I)/Pm} - Rd
where Pm is light-saturated photosynthetic rate,
Rd is rate of respiration in darkness, α is the
initial ascending slope and I is light intensity.
Pigment Content In order to understand the effect of low bicar-bonate and salinity stress on the pigments in Picochlorum, cultures in the second stage were harvested on day 6 and the chlorophyll content determined by filtering 3 mL of each culture suspension and transferring the cells together with filter paper into 3.5 mL dimethyl-formamide (DMF) and keeping them in the dark for 24 hours. DMF was used because it has been identified as being able to chemically
Journal of Ghana Science Association, Vol. 13 No. 1 . June, 2011 50

Effects of bicarbonate limitation and salinity stress on growth... Annan and Henley
stabilize chlorophyll and as well as preventing its oxidation. DMF is also able to extract a lot of chlorophyll from samples compared to other solvents commonly used (Porra et al., 1989). Extracts were centrifuged to remove cellular debris and the absorption spectra measured from 400 to 750 nm using a spectrophotometer with 2-nm band pass. The concentrations of chlorophylls a and b were determined using the equations by Porra et al. (1989):
Chlorophyll a = 12.00 A664 – 3.11 A647
Chlorophyll b = 20.78 A647 – 4.88 A664
where A is the absorbance at the specified
wavelength, corrected for scattering by sub-
tracting A750.
Total carotenoids were calculated using Well-
burn’s equation (1994).
Total carotenoids = (1000 A480–0.89 Ca–52.02
Cb)/245
where A480 is the absorbance at 480 nm, and Ca
and Cb are concentrations of chlorophyll a and
b respectively.
Chlorophyll fluorescence Six days old second stage cultures were used for this experiment. Chlorophyll fluorescence quenching analysis was carried out at room temperature using a Dual–Modulation Kinetic fluorometer (PhotoSystems Instruments, Czech Republic). The fluorometer was connected to a computer with data acquisition software, Fluowin. Two mL of culture was put into a cuvette and the cuvette placed into the sample compartment for the measurement to proceed. Each sample was dark-adapted for 10 min be-fore starting with the measurement. The mini-mal fluorescence level in the dark-adapted state (Fo) was measured by activating the modulated light (ML) which was very low in order to pre-vent the induction of significant variable fluo-rescence.
A 0.8 s flash of saturating white light (>1000 μmol photons·m -2· s-1) was then applied to de-termine the maximal fluorescence in the dark-adapted state, (Fm). After a lag phase of 20 sec-onds, the actinic light, AL (about 400 μmol
photons·m -2· s-1) from light-emitting diode was turned on to provide continuous white illumina-tion for 30 seconds. In order to determine the light-adapted maximal chlorophyll fluorescence (Fm’), saturating pulses were applied to the sample at different intervals during the period of actinic light driving photosynthesis.
Using both the dark and light fluorescence pa-rameters, the following were calculated for the fluorescence analysis: the maximum efficiency also known as optimal quantum yield of PS II photochemistry in the dark-adapted state, (Fv / Fm); the actual quantum yield of PSII electron transport in the light-adapted state, ΦPSII = (Fm’ - F’)/Fm’; the photochemical quenching coeffi-cient, qP = (Fm’ - F’) / (Fm’- Fo’), which gives a measure of the proportion of open PSII reaction
centers and the non-photochemical quenching, NPQ = (Fm – Fm’) / Fm’ (Genty et al., 1989; Bilger and Björkman, 1990). The fluorescence nomenclature used in this section follows van Kooten and Snel (1990).
Experimental design and Statistical analysis
A factorial design was used for the experiments
with salinity as one factor at three levels (10
ppt, 50 ppt and 100 ppt) and nutrient (bicar-
bonate) as the other factor at two levels (control
and low). Data of the initial growth rates, cell
densities, photosynthetic parameters, pigment
content and the fluorescence parameters were
analyzed by using two-way analysis of variance
(ANOVA) with replication at p = 0.05. The
significance of difference between treatments
was analyzed using Tukey HSD multiple com-
parison. The software used for all the statistical
analysis was SYSTAT version 10.
RESULTS
Growth Rates and Cell growth
Picochlorum growth rate is largely unaffected
by salinity below 50 ppt, but is reduced by
about one-third at 100 ppt in control (Figs. 2
and 3). Low bicarbonate (LC) cultures exhib-
ited the same pattern as the control but are
shifted to lower growth rates (Fig. 2). Primary
effects of both salinity and bicarbonate were
highly significant in two-way ANOVA
(p=0.000). All individual treatments were sig-
Journal of Ghana Science Association, Vol. 13 No. 1 . June, 2011 51

Effects of bicarbonate limitation and salinity stress on growth... Annan and Henley
Salinity [ppt]
10 50 100
Gro
wth
rate
[u.d
-1]
0.2
0.4
0.6
0.8
1.2
1.4
0.0
1.0
Control LC
a a
b
e
cd
Fig. 2: Initial growth rate of Picochlorum sp. in control (shaded cicles) and
low bicarbonate (open circles, LC) at different salinities of 10, 50 and 100 ppt.
Mean values ± Standard deviation, n = 3 for all treatments (Error bars
smaller than symbols). Different letters indicate significance.
nificantly different except control at 10 and 50
ppt (p=0.718). In addition, bicarbonate-salinity
interaction was significant, because initial
growth rates in control were the same at 10 ppt
and 50 ppt but were reduced in the low bicar-
bonate treatment at 10 ppt. The effect of low
bicarbonate was proportionately the same at 10
and 50 ppt (LC/Control = 0.6), but greater at
100 ppt. The absolute reduction of 0.2 d-1 at
100 ppt was the lowest compared to twice that
value at 10 and 50 ppt.
Cell yields at day 10 exhibited much the same
patterns as initial growth rate, with the excep-
tion that control yields at 10 and 50 ppt dif-
fered, whereas low bicarbonate yields at 10 and
50 ppt did not (Fig. 3). Both primary effects of
salinity and low bicarbonate and their interac-
tion were significant for cell yields (p=0.000).
The effect of low bicarbonate was greater on
initial growth rate than on cell yields at day 10.
Photosynthetic Measurements
In order to investigate the effect of low bicar-
bonate and salinity stress on photosynthesis in
Picochlorum, oxygen evolution was measured
and the following three fundamental parameters
were calculated: The rate of respiration in dark-
ness (Rd), the slope at limiting PFDs, α, (which
comprises both light-harvesting efficiency and
photosynthetic energy conversion efficiency),
and the light-saturated photosynthetic rate
(Pmax). Photosynthetic rates (μmol O2 hr-1) were
automatically calculated in real time by linear
regression after 270 sec exposures to PFD. Pho-
tosynthetic light-response (P-I) curves are
shown in figure 4. These parameters were ob-
tained for each replicate of a particular treat-
ment (3 per treatment) and then were analyzed
using ANOVA.
Neither salinity nor low bicarbonate signifi-
cantly affected dark respiration, since variabil-
Journal of Ghana Science Association, Vol. 13 No. 1 . June, 2011 52

Effects of bicarbonate limitation and salinity stress on growth... Annan and Henley
Salinity [ppt]
10 50 100
Cell
Num
ber
per
mL
0
1e+7
2e+7
3e+7
4e+7
5e+7
ControlLC
a
b
c
d
e
c
Fig. 3: Cell yield of Picochlorum sp. at day 10 in low bicarbonate (LC) com-
pared to control at different salinities. Mean values ± Standard deviation, n
= 3 for all treatments. Different letters indicate significance.
Photon flux density (umol.m-2.s-1 )
0 500 1000 1500
Net oxy
gen e
xchange (
um
ol.1
0-9.c
ells
-1.h
r-1)
-5
0
5
10
15
20
25
30
10 Control 10 LC 50 Control 50 LC100 Control100 LC
Fig. 4: Photosynthetic light-response curves of Picochlorum sp. cultured in
control (shaded symbols) and in low bicarbonate (LC, open symbols) at dif-
ferent salinities (indicated by the numbers next to symbols). Mean values, n
= 3 for all treatments (Error bars not shown for clarity).
Journal of Ghana Science Association, Vol. 13 No. 1 . June, 2011 53

Effects of bicarbonate limitation and salinity stress on growth... Annan and Henley
Pmax (fmol O2.cell-1.hr-1)
Control Low Bicarbonate
10 ppt
50 ppt
100 ppt
21.51 ± 0.32 a
20.96 ± 1.17 a
13.31 ± 1.37 b
25.29 ± 3.87 a
23.50 ± 0.50 a
15.15 ± 0.58 b
α fmol O2.cell-1 (µmol photons m-2 s-1) -1 hr -1
Control Low Bicarbonate
10 ppt
50 ppt
100 ppt
0.12 ± 0.03 a
0.14 ± 0.05 a
0.11 ± 0.06 a
0.14 ± 0.03 a
0.15 ± 0.02 a
0.07 ± 0.02 b
Dark Respiration (Rd )[fmol O2.cell-1.hr-1]
Control Low Bicarbonate
10 ppt
50 ppt
100 ppt
-0.30 ± 0.93 a
-0.40 ± 0.49 a
-0.27 ± 0.28 a
-0.03 ± 0.87 a
-0.43 ± 0.76 a
-0.15 ± 0.22 a
Table 1: P-I parameters Pmax (fmol O2. cell-
1.hr-1), α and Rd (fmol O2.cell-1.hr-1) meas-
ured for Picochlorum sp. in high and low
bicarbonate at different salinities. Mean ±
Standard deviation, n = 3. Different letters
indicate significance
ity was large relative to rate values (Table 1).
Salinity, but not low bicarbonate, significantly
affected α, (p=0.044). However, none of the
individual treatments differed in multiple pair-
wise comparisons (p=0.202), probably due to
inadequate statistical power with n=3. Both
salinity and bicarbonate treatments significantly
affected Pmax (p=0.007). In both control and
low bicarbonate treatments, Pmax was signifi-
cantly lower at 100 ppt than at lower salinities.
Salinity, carbon limitation and pigments
Total chlorophyll (a + b) per cell was signifi-
cantly affected by salinity but not bicarbonate
treatment. The interaction between salinity and
bicarbonate was also significant (Fig. 5;
p=0.000). Chlorophyll decreased with increas-
ing salinity, with most of the decrease occur-
ring at 100 ppt. Chlorophyll levels were re-
duced by about 28% and 46% at 100 ppt in
control and low bicarbonate cells, respectively,
relative to 10 and 50 ppt. Chlorophyll a/
chlorophyll b ratio was not significantly af-
fected by salinity or bicarbonate. Total carote-
noids per cell were significantly affected by
Salinity (PPT)
10 50 100
Tota
l Chlo
rophyl
l (fg
.cell-1
)
0
20
40
60
80
100
120
Control LC
a
a
a a
b
c
Fig. 5: Average total chlorophyll of Picochlorum sp. grown in control and low bicarbonate
(LC) and at different salinities. Mean values ± Standard deviation, n = 3 for all treatments.
Different letters indicate significance.
Journal of Ghana Science Association, Vol. 13 No. 1 . June, 2011 54

Effects of bicarbonate limitation and salinity stress on growth... Annan and Henley
salinity, bicarbonate treatment and the interac-
tion between these factors (Fig. 6; p=0.038).
Carotenoids decreased with increasing salinity,
with most of the decrease occurring at 100 ppt
in both control and low bicarbonate treatment.
Differences among 10 and 50 ppt cultures were
small (<14 %). At 100 ppt, carotenoids de-
creased by about 21-38 % relative to 10 and 50
ppt. Chlorophyll/carotenoids ratio was signifi-
cantly affected by salinity and the salinity-
bicarbonate interaction (p=0.000), but not by
bicarbonate alone (p=0.051). Low bicarbonate
effect was inconsistent among salinities, and
salinity effect differed between bicarbonate
treatments. However, none of the differences
exceeded 17%.
Determination of Fluorescence Parameters
The determination of the chlorophyll a fluores-
cence parameters in Picochlorum by the satura-
tion pulse method were calculated from the
fluorescence measurements as demonstrated by
those cultured in control medium (Fig. 7).
Salinity, bicarbonate and fluorescence
The maximum quantum yield of PS II photo-
chemistry in the dark-adapted state, (Fv/Fm) was
significantly affected by salinity but not low
bicarbonate or the interaction between salinity
and bicarbonate treatment (Fig. 8; p=0.081).
Within the control cultures, there was a de-
crease of approximately 5% in Fv / Fm at 50 ppt
relative to 10 ppt. Low bicarbonate slightly
increased Fv / Fm at 10 and 50 ppt. The effec-
tive quantum yield of PSII electron transport in
the light-adapted state, ΦPSII given by (Fm’ –
F’) / Fm’, was significantly affected by salinity
and bicarbonate treatment (Fig. 8a; p=0.001)
but not the interaction between these factors.
Increasing salinity resulted in a decrease in
ΦPSII. In control cultures, the reduction was
26% and 21% respectively at 50 and 100 ppt
compared to 10 ppt. Low bicarbonate signifi-
cantly increased ΦPSII by 35% at 50 ppt
(p=0.024) and an insignificant increase of about
23% at 10 ppt and 100 ppt.
Salinity (PPT)
10 50 100
Tota
l C
aro
tenoid
s (
fg.c
ell-1
)
0
10
20
30ControlLCa
aa
a
b
b
Fig. 6: Average total carotenoids of Picochlorum sp. grown in control and low bicarbonate
(LC) and at different salinities. Mean values ± Standard deviation, n = 3 for all treatments.
Different letters indicate significance.
Journal of Ghana Science Association, Vol. 13 No. 1 . June, 2011 55

Effects of bicarbonate limitation and salinity stress on growth... Annan and Henley
Time (s)
20 40 60 80 100 120 140
Flu
ore
scence
(V) 0.2
0.3
0.4
0.5
0.6
0.7
0.8
0.9
Fo
Fm
Fm'
Fo'
Ft
SL +AL -AL
Fig. 7: Chlorophyll fluorescence of Picochlorum sp. grown in control media at 10 ppt
by the saturation pulse method. SL is saturating flash of light to determine maximum
fluorescence, Fm from initial fluorescence, Fo. Actinic light, +AL, was switched on to
drive photosynthesis, -AL indicate when actinic light was switched off.
The photochemical quenching coefficient, qP,
was significantly affected by salinity and bicar-
bonate treatment (Fig. 8b; p=0.003) but not the
interaction between these factors. In the control
treatment, increasing salinity decreased photo-
chemical quenching by 25% and 31% at 50 and
100 ppt respectively compared to 10 ppt
(p=0.034). Low bicarbonate increased photo-
chemical quenching by 10%, 27% and 20% at
10, 50 and 100 ppt respectively. Neither salin-
ity nor bicarbonate treatment significantly af-
fected non-photochemical quenching, NPQ,
although low bicarbonate reduced non-
photochemical quenching at all salinities (Fig.
8b). Large variability in NPQ values resulted in
low statistical power.
DISCUSSION
The hypothesis for this study is that the effect
of salinity stress on growth and photosynthesis
in Picochlorum will be different under control
conditions compared to low bicarbonate levels.
In other words the pattern of response by Pi-
cochlorum to the three different salinities of 10,
50 and 100 ppt will not follow the same pattern
at the two nutrient levels. This may be due to
the influence of the amount of the nutrient pre-
sent. If there is a change in the response pattern
from 10 ppt through 50 ppt to 100 ppt for the
two nutrient levels, then there is a salinity-
nutrient interaction. Examining the two factors
together may result in the intensification of the
stress in organisms or possibly the effect of one
may reduce the effect of the other factor. The
response of Picochlorum to the three salinities
was investigated under control and low bicar-
bonate.
Salinity did not affect initial growth rate, µ,
(Fig. 2) and Pmax (Table 1) at 10 and 50 ppt but
Journal of Ghana Science Association, Vol. 13 No. 1 . June, 2011 56

Effects of bicarbonate limitation and salinity stress on growth... Annan and Henley
Salinity (PPT)
10 50 100
Rela
tive u
nit
0.0
0.1
0.2
0.3
0.4
0.5
0.6
0.7Fv/Fm Control Fv/Fm LC PSII Control
PSII LC
Salinity (PPT)
10 50 100
Rela
tive u
nit
0.0
0.1
0.2
0.3
0.4
0.5
0.6
0.7
qP Control qP LC NPQ Control NPQ LC
a
a
b
ab
ab
b
Fig. 8: Changes in fluorescence parameters in Picochlorum sp. due to growth in low bicar-
bonate (LC) compared to control at different salinities. Fv/Fm is PSII maximum quantum effi-
ciency, ФPSII is Quantum yield electron transport of PSII, qP, Photochemical quenching and
NPQ, Non-photochemical quenching. Mean values ± Standard deviation, n = 3 for all treat-
ments. Different letters indicate significance.
Journal of Ghana Science Association, Vol. 13 No. 1 . June, 2011 57

Effects of bicarbonate limitation and salinity stress on growth... Annan and Henley
significantly reduced these parameters at 100
ppt at both bicarbonate levels. However, in-
creasing salinity from 10 ppt to 50 ppt to 100
ppt also decreased cell yield on day 10 in con-
trol (Fig. 3). The decreases caused by salinity
are expected considering the problems posed by
high salinity in algae and plants. In order to
overcome salinity stress and the problems they
face such as osmotic and ionic stresses, these
organisms may channel their efforts into pro-
ducing compatible solutes for their survival.
For example, Picochlorum produces proline as
an osmoticum (Hironaka, 2000) and the biosyn-
thesis of this compound from glutamate re-
quires ATP and NADPH. Glutamate used in
this synthesis will also not be available for
growth. This may be produced at the expense
of growth. Maximum quantum yield of PSII,
Fv/Fm, was only reduced slightly at 50 ppt and
effective quantum yield of PSII electron trans-
port in light adapted state, Φ PSII, was not af-
fected by salinity at both carbon levels, indicat-
ing that photoinhibition of photosynthesis was
not influenced by salinity in Picochlorum, at
least under the growth conditions used (Powles,
1984; Adams et al., 1990). Since Pmax ex-
pressed per cell was reduced at higher salinity
and α was not affected (Table 1), this suggests
that the size of the photosynthetic unit was not
changed (Prézelin, 1981). This is consistent
with negligible changes in alpha and it is also
consistent with relatively small changes in Chl
a/b ratio.
Higher salinity decreased ΦPSII and photo-chemical quenching, qP, by about 20-25% compared to 10 ppt under HC (Fig. 8), an indi-cation that actual electron flow was inhibited (Lu and Vonshak, 2002). When there is less water due to salt stress, the water oxidation complex and PSII may be affected and subse-quently electron transfer. When membrane po-tential is affected by salinity, ATP synthesis is also inhibited. Salinity affected reduced total chlorophylls and total carotenoids only at 100 ppt (Figs. 5 and 6). Even though the pigments may not be affected, electron flow is inter-rupted and this may finally affect the dark reac-tions. El-Sheekh (2004), has reported that elec-
tron transfer from QA to QB was decreased by salinity stress in the green alga Chlorella vul-garis, a relative of Picochlorum (Henley et al., 2004). Salt stress can inhibit protein synthesis such as the D1 protein which will in turn affect the rates at which damaged D1 proteins are replaced and subsequently affect photosynthe-sis (Allakhverdiev et al., 2002; Mohanty et al., 2007). In affecting protein synthesis, enzymes in the Calvin cycle may also be affected result-ing in a decrease in carbon fixation. Mem-branes and the transport proteins associated with them are also affected by salinity stress and therefore may affect uptake of some nutri-
ents.
Low bicarbonate (LC) significantly decreased
initial growth rate and cell yield at day 10 but
did not affect Pmax and α at all salinities. Low
bicarbonate reduced initial growth rate by 38%,
36% and 30% at 10, 50 and 100 ppt respec-
tively (Fig. 4), while Pmax was increased by
18%, 12% and 14% at 10, 50 and 100 ppt re-
spectively (Table 1). In LC, the cell yield at
day 10 was decreased by 27%, 20% and 18% at
10, 50 and 100 ppt respectively (Fig. 3).
The decrease in initial growth rate and cell
yield at day 10 is expected. Considering that
carbon is an important component of all bio-
molecules found in organisms, if it is limited in
supply, then carbon fixation is likely to decline
as well as the biosynthesis and build up of com-
pounds which may lead to a reduction in
growth. This is consistent with the report by
Huertas et al. (2000) that the green alga, Nan-
nochloris exhibited growth limitation at lower
CO2 concentration. Marine members of the
genus Nannochloris have been reassigned as
Picochlorum (Henley et al., 2004) and there-
fore this is related to P. oklahomensis.
Analysis of the curvatures of the growth curves
revealed significantly lower convexity values
for cells grown in LC medium compared to
those in control medium. Control-grown cells
had convexity between 1.77 and 2.33 while
those grown in LC medium ranged from 0.25 to
0.66. The lower values indicate that Picochlo-
rum grown in LC were stressed as indicated by
Journal of Ghana Science Association, Vol. 13 No. 1 . June, 2011 58
Effects of bicarbonate limitation and salinity stress on growth... Annan and Henley
the nature of the curvature of the curves al-
though this is not evident in the higher Pmax
values in LC (Table 1). The increase in Pmax in
LC is intuitively unexpected, although it was
accompanied by increases by LC in maximum
quantum yield of PS II photochemistry in dark-
adapted state cells, Fv/Fm (except at 100 ppt),
effective quantum yield of PS II electron trans-
port in light-adapted state, ΦPSII, and photo-
chemical quenching, qP (Fig. 8 a and b) com-
pared to control.
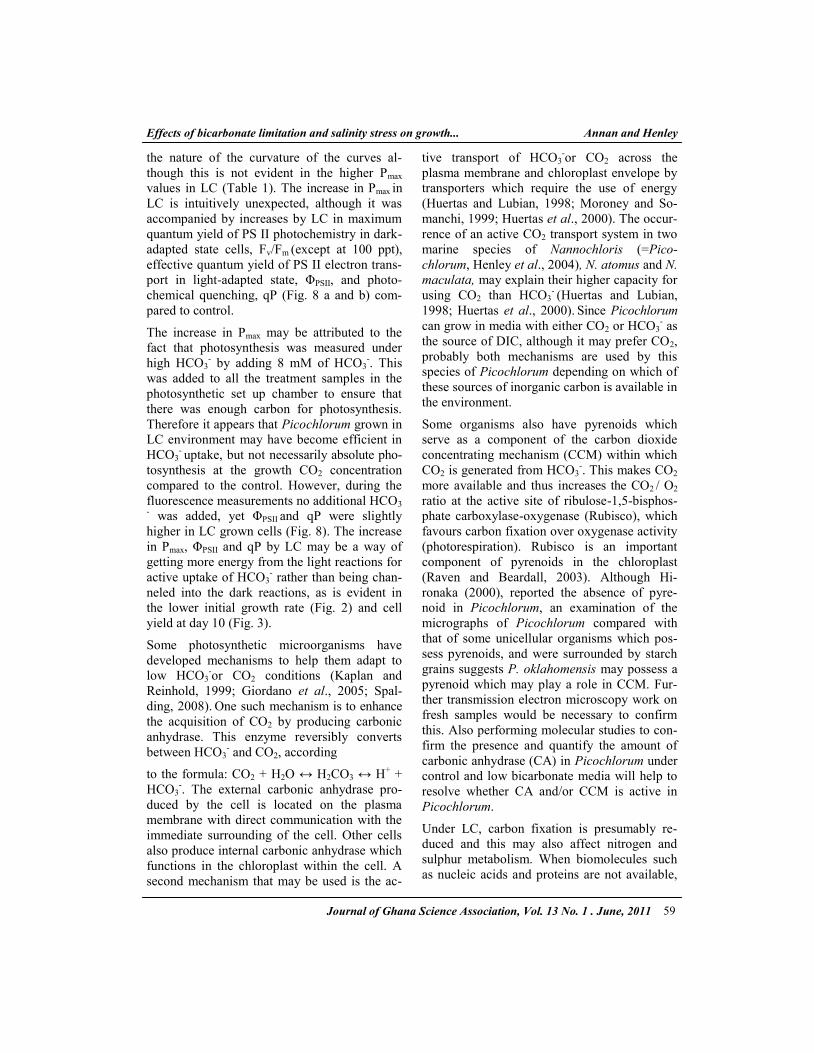
The increase in Pmax may be attributed to the
fact that photosynthesis was measured under
high HCO3- by adding 8 mM of HCO3
-. This
was added to all the treatment samples in the
photosynthetic set up chamber to ensure that
there was enough carbon for photosynthesis.
Therefore it appears that Picochlorum grown in
LC environment may have become efficient in
HCO3- uptake, but not necessarily absolute pho-
tosynthesis at the growth CO2 concentration
compared to the control. However, during the
fluorescence measurements no additional HCO3- was added, yet ΦPSII and qP were slightly
higher in LC grown cells (Fig. 8). The increase
in Pmax, ΦPSII and qP by LC may be a way of
getting more energy from the light reactions for
active uptake of HCO3- rather than being chan-
neled into the dark reactions, as is evident in
the lower initial growth rate (Fig. 2) and cell
yield at day 10 (Fig. 3).
Some photosynthetic microorganisms have
developed mechanisms to help them adapt to
low HCO3-or CO2 conditions (Kaplan and
Reinhold, 1999; Giordano et al., 2005; Spal-
ding, 2008). One such mechanism is to enhance
the acquisition of CO2 by producing carbonic
anhydrase. This enzyme reversibly converts
between HCO3- and CO2, according
to the formula: CO2 + H2O ↔ H2CO3 ↔ H+ +
HCO3-. The external carbonic anhydrase pro-
duced by the cell is located on the plasma
membrane with direct communication with the
immediate surrounding of the cell. Other cells
also produce internal carbonic anhydrase which
functions in the chloroplast within the cell. A
second mechanism that may be used is the ac-
tive transport of HCO3-or CO2 across the
plasma membrane and chloroplast envelope by
transporters which require the use of energy
(Huertas and Lubian, 1998; Moroney and So-
manchi, 1999; Huertas et al., 2000). The occur-
rence of an active CO2 transport system in two
marine species of Nannochloris (=Pico-
chlorum, Henley et al., 2004), N. atomus and N.
maculata, may explain their higher capacity for
using CO2 than HCO3- (Huertas and Lubian,
1998; Huertas et al., 2000). Since Picochlorum
can grow in media with either CO2 or HCO3- as
the source of DIC, although it may prefer CO2,
probably both mechanisms are used by this
species of Picochlorum depending on which of
these sources of inorganic carbon is available in
the environment.
Some organisms also have pyrenoids which
serve as a component of the carbon dioxide
concentrating mechanism (CCM) within which
CO2 is generated from HCO3-. This makes CO2
more available and thus increases the CO2 / O2
ratio at the active site of ribulose-1,5-bisphos-
phate carboxylase-oxygenase (Rubisco), which
favours carbon fixation over oxygenase activity
(photorespiration). Rubisco is an important
component of pyrenoids in the chloroplast
(Raven and Beardall, 2003). Although Hi-
ronaka (2000), reported the absence of pyre-
noid in Picochlorum, an examination of the
micrographs of Picochlorum compared with
that of some unicellular organisms which pos-
sess pyrenoids, and were surrounded by starch
grains suggests P. oklahomensis may possess a
pyrenoid which may play a role in CCM. Fur-
ther transmission electron microscopy work on
fresh samples would be necessary to confirm
this. Also performing molecular studies to con-
firm the presence and quantify the amount of
carbonic anhydrase (CA) in Picochlorum under
control and low bicarbonate media will help to
resolve whether CA and/or CCM is active in
Picochlorum.
Under LC, carbon fixation is presumably re-
duced and this may also affect nitrogen and
sulphur metabolism. When biomolecules such
as nucleic acids and proteins are not available,
Journal of Ghana Science Association, Vol. 13 No. 1 . June, 2011 59

Effects of bicarbonate limitation and salinity stress on growth... Annan and Henley
cell division and growth rates are slowed down
and eventually yield is also reduced. It appears
that at LC, Picochlorum maintained and/or in-
creased the light reaction process to supply
energy (ATP) to meet the high energy require-
ment of active transport of HCO3- and, at
higher salinities, Na+ efflux and synthesis of
glycerol. As a result of limiting carbon in the
environment and consequent diversion of en-
ergy, carbon fixation to support growth was
reduced. The cells were probably producing
only needed molecules to help them survive. In
general, high salinity and low bicarbonate sig-
nificantly reduced growth rates and yield, but a
significant effect of bicarbonate and bicarbon-
ate-salinity interaction were less common
among the physiological variables.
REFERENCES
Adams, W. W. III, Demmig-Adams, B., Win-
ter, K. and Schreiber, U. (1990). The ratio
of variable to maximum chlorophyll fluo-
rescence from photosystem II, measured in
leaves at ambient temperature and at 77K,
as an indicator of the photon yield of pho-
tosynthesis. Planta, 180: 166-174.
Allakhverdiev, S., Nishiyama, Y., Miyairi, S.,
Yamamoto, H., Inagaki, N., Kanesaki, Y.,
and Murata, N. (2002). Salt Stress Inhibits
the Repair of Photodamaged Photosystem
II by Suppressing the Transcription and
Translation of psbA Genes in Synechocys-
tis. Plant Physiol., 130: 1443-1453.
Ashraf, M. and Harris, P. J. C. (2004). Potential
biochemical indicators of salinity tolerance
in plants. Plant Science, 166: 3-16.
Bannister, T. T. (1979). Quantitative descrip-
tion of steady state, nutrient-saturated algal
growth, including adaptation. Limnol.
Oceanogr., 24: 76-96.
Bilger, W. and Björkman, O. (1990). Role of
the xanthophylls cycle in photoprotection
elucidated by measurements of light-
induced absorbance changes, fluorescence
and photosynthesis in leaves of Hedera
canariensis. Photosynth. Res., 25:173-185.
Cole, J. J., Howarth, R. W., Nolan, S. S. and
Marino, R. (1986). Sulfate inhibition of
molybdate assimilation by planktonic algae
and bacteria: some implications for the
aquatic nitrogen cycle. Biochemistry, 2:
179-196.
EL-Sheekh, M. M. (2004). Inhibition of the
water splitting system by sodium chlorid-
estress in the green alga Chlorella vulgaris.
Braz. J. Plant Physiol., 16(1):25-29.
Eugster, H. P. and Jones, B. F. (1979). Behav-
ior of major solutes during closed-basin
brine evolution. American Journal of Sci-
ence, 279: 609-631.
Falkowski, P.G. and Raven, J.A. (1997). Car-
bon acquisition and assimilation. In:
Aquatic Photosynthesis. Blackwell Sci-
ence, Inc., Malden, Massachusetts, pp. 128
–162.
Genty, B., Britais, J. M. and Baker, N. R.
(1989). The relationship between the quan-
tum yield of photosynthetic electron trans-
port and quenching of chlorophyll fluores-
cence. Biochem. Biophys. Acta, 990: 87-
92.
Gimmler, H., Wiedemann, C. and Möller, E.
M. (1981). The metabolic response of the
halotolerant green alga Dunaliella parva to
hyperosmotic shocks. Ber. Dtsch. Bot.
Gesell., 94:613–34.
Giordano, M., Beardall, J. and Raven, J. A.
(2005). CO2 concentrating mechanisms in
algae: mechanisms, environmental modu-
lation, and evolution. Annu. Rev. Plant.
Biol., 56: 99 – 131.
Graham, L. E. and Wilcox, L. W. (2000). Al-
gae. Prentice Hall. Upper Saddle River, NJ
650pp.
Henley, W. J., Hironaka, J. L., Buchheim, M.
A., Buchheim, J. A., Fawley, M. W. and
Fawley, K. P. (2004). Phylogenetic analy-
sis of the “Nannochloris-like” algae and
diagnoses of Picochlorum oklahomensis
gen. et sp. nov. (Trebouxiophyceae,
Chlorophyta). Phycologia, 43:641-652.
Journal of Ghana Science Association, Vol. 13 No. 1 . June, 2011 60

Effects of bicarbonate limitation and salinity stress on growth... Annan and Henley
Henley, W. J., Major, K. M. and Hironaka, J. L.
(2002). Response to salinity and heat stress
in two halotolerant chlorophyte algae.
Journal of Phycology, 38: 757-766.
Hironaka, J. (2000). Characterization of a uni-
cellular coccoid green alga collected from
the Salt Plains National Wildlife Refuge,
Oklahoma. MS thesis, Oklahoma State
University.
Huertas, I. E., Colman, B., Espie, G. S. and
Lubian, L. M. (2000). Active transport of
CO2 by three species of marine microalgae.
Journal of Phycology, 36 (2), 314-320.
Huertas, I. E. and Lubian, L. M. (1998). Com-
parative study of dissolved inorganic car-
bon utilization and photosynthetic re-
sponses in Nannochloris (Chlorophyceae)
and Nannochloropsis (Eustigmatophyceae)
species. Can. J. Bot., 76:1104-1108.
Jassby, A. A. and Platt, T. (1976) Mathematical
formulation of the relationship between
photosynthesis and light for phytoplankton.
Limnol. Oceanogr., 21: 540-547.
Kaplan, A., and Reinhold, L. (1999). CO2 con-
centrating mechanisms in photosynthetic
microorganisms. Annu. Rev. Plant.
Physiol. Plant Mol. Biol., 50: 539 – 570.
Kerkeb, L., Donaire, J. P., Venema, K. and
Rodríguez-Rosales, M. P. (2001). Toler-
ance to NaCl induces exchanges in plasma
membrane lipid composition, fluidity and
H+-ATPase activity of tomato calli.
Physiol. Plant., 113: 217-224.
Kirst, G. O. (1989). Salinity tolerance of eu-
karyotic marine algae. Annu. Rev. Plant
Physiol. Plant Mol. Biol., 40:21-53.
Komori, T., Yamada, S., Myers, P. and
Imaseki, H. (2003). Biphasic response to
elevated levels of NaCl in Nicotiana occi-
dentalis subspecies oblique Burbidge.
Plant Sci., 165: 159 – 165.
Lawlor, D. W. (2002). Carbon and Nitrogen
assimilation in relation to yield: Mecha-
nisms are the key to understanding produc-
tion systems. J. Exp. Bot. 53: 773–787.
Lu, C. and Vonshak, A. (2002). Effects of sa-
linity stress on photosystem II function in
cyanobacterial Spirulina platensis cells.
Physiologia Plantarum, 114: 405-413.
Mohanty, P., Allakhverdiev, S. I. and Murata,
N. (2007). Application of low tempera-
tures during photoinhibition allows charac-
terization of individual steps in photodam-
age and the repair of photosystem II. Pho-
tosynthesis Research, 94: 217-224.
Moroney, J. V. and Somanchi, A. (1999). How
do Algae concentrate CO2 to increase the
efficiency of photosynthetic carbon fixa-
tion? Plant Physiol., 119: 9-16.
Nissenbaum, A. [Ed] (1980). Hypersaline
Brines and Evaporitic Environments. Pro-
ceedinds of the Bat Sheva Seminar on Sa-
line Lakes and Batural Brines. Develop-
ments in Sedimentology. Vol. 28. Elservier,
Amsterdam, 270 pp.
Porra, R. J., Thompson, W. A. and Kriede-
mann, P. E. (1989). Determination of ac-
curate extinction coefficients and simulta-
neous-equations for assaying chlorophylls
a and b extracted with four different sol-
vents: Verification of the concentration of
chlorophyll standards by atomic absorption
spectroscopy. Biochim. Biophys. Acta,
975:384-394.
Powles, S. B. (1984). Photoinhibition of photo-
synthesis induced by visible light. Annu.
Rev.Plant Physiol., 35:15-44.
Prézelin, B. B. (1981). Light Reactions in Pho-
tosynthesis. In Platt, T. (ed.) Physiological
Bases of Phytoplankton Ecology. Canan-
dian Bulletin of Fisheries and Aquatic Sci-
ence, 210: 1-43.
Raven, J. A. and Beardall, J. (2003). Carbohy-
drate metabolism and respiration in algae.
In: Larkum, A. W. D., Douglas, S. E. and
Raven, J. A. (ed.) Advances in photosyn-
thesis and respiration – Photosynthesis in
algae. Kluwer Academic Publ. London. pp
205-224.
Journal of Ghana Science Association, Vol. 13 No. 1 . June, 2011 61

Effects of bicarbonate limitation and salinity stress on growth... Annan and Henley
Round, F. E., (1981). The physical and chemi-
cal characteristics of the environment. In:
Round, F.E. (ed.) The Ecology of Algae
Cambridge University Press, Cambridge,
pp. 7–26.
Schobert, B. (1974). The influence of water
stress on the metabolism of diatoms. I.
Osmotic resistance and proline accumula-
tion in Cyclotella meneghiniana. Zeitscrift
für Pflanzenphysiology, 74: 106-120.
Spalding, M. H. (2008). Microalgal carbon-
dioxide-concentrating mechanisms: Chla-
mydomonas inorganic carbon transporters.
J. Exp. Bot., 59: 1463-1473.
Starr, R. C. and Zeikus, J. A. (1993). UTEX -
The culture collection of algae at the Uni-
versity of Texas at Austin. J. Phycol., 29 (2
Suppl.): 90-91.
van Kooten, O and Snel J. F. H. (1990). The
use of chlorophyll fluorescence nomencla-
ture in plant stress physiology. Photosyn-
thesis Research, 25, 147–150.
Wellburn, A. R. (1994). The spectral determi-
nation of chlorophylls a and b, as well as
total carotenoids, using various solvents
with spectrophotometers of different reso-
lutions. J. Plant Physiol., 144:307-313.
Journal of Ghana Science Association, Vol. 13 No. 1 . June, 2011 62