effects of bottom trawling on the ebro continental shelf sedimentary system (nw mediterranean)
TRANSCRIPT

Research papers
Effects of bottom trawling on the Ebro continental shelf sedimentarysystem (NW Mediterranean)
Albert Palanques n, Pere Puig, Jorge Guillén, Montserrat Demestre, Jacobo MartínInstitut de Ciències del Mar (CSIC), Passeig Marítim de la Barceloneta, 37–49, E-08003 Barcelona, Spain
a r t i c l e i n f o
Article history:Received 25 April 2013Received in revised form3 September 2013Accepted 15 October 2013Available online 28 October 2013
Keywords:TrawlingSediment resuspensionMud disturbanceAnthropogenic impactTurbidityMediterranean Sea
a b s t r a c t
A monitoring effort to address the physical effects of bottom trawling was conducted on the Ebroprodeltaic mud belt during the RESPONSE project. The monitoring was carried out for 14 monthscovering periods of different trawling intensities and a close season for the trawling fleet. The seabedmorphology was studied by side-scan sonar and sediment texture and organic carbon content wereanalysed. Suspended sediment vertical distribution was recorded by CTDþturbidity hydrographicprofiles and sediment transport was computed using time series from moored turbidimeters and currentmeters. The results show that the seabed of the fishing ground is strongly affected by scraping andploughing induced by bottom trawling. Part of the finer fraction of the prodeltaic mud resuspended bytrawling is winnowed, increasing the silt content of the settling sediment and also near-bottom turbidity.Sediment resuspended by trawling is incorporated in the bottom nepheloid layer and transported across-and along-shelf, increasing sediment fluxes. Trawling also induces an increase in the organic carboncontent in the bottom sediment. All these effects induced by trawling have occurred during the last fewdecades, changing natural conditions in the fishing ground.
& 2013 Elsevier Ltd. All rights reserved.
1. Introduction
Natural systems undergo constant evolution, including multiplechanges induced by human activities. Many of these changes arevisible on the continent but under the sea most of them gorelatively unnoticed. One intense anthropogenic activity that has asignificant and widespread effect on the seabed is bottom trawling,because it is very common on most continental shelves of theworld. The direct physical effects of this fishing technique includescraping and ploughing of the seabed and increases in near-bottomturbidity due to sediment resuspension (Jones, 1992; Pilskaln et al.,1998; Palanques et al., 2001; Durrieu de Madron et al., 2005;Karageorgis et al., 2005a; Dellapenna et al., 2006; O’Neill andSummerbell, 2011). The degree of environmental perturbationcaused by bottom trawling is related to the characteristics of thegear, the towing speed, the nature of the surface sediment, thestructure of the benthic communities, and the currents in the studyarea (de Groot and Lindeboom, 1994; Fonteyne, 2000; O’Neill andSummerbell, 2011; Ivanovic et al., 2011).
The effects on cohesive and uncohesive sediments are different.Whereas scars caused by gears on sandy uncohesive sediments ofenergetic areas are covered by ripples in a few hours (Beon, 1990),trawling on muddy sediment can have longer-term effects on theseabed and on the water column. Krost et al. (1990) observed that
intensely fished muddy areas have a high density of trawl tracks onthe bottom and Tuck et al. (1998) and Palanques et al. (2001) observedthat trawling tracks remain longer than one year on shelf muddysediment.
Therefore, trawling has been changing the characteristics of theseabed, particularly because it incorporated important technolo-gical improvements several decades ago and is now carried outwith powerful engines, fishing echosounder and accurate posi-tional systems. In the Mediterranean trawlers are considered asemi-industrial fleet, having increased their power and capacityparticularly in the 1970s and 1980s (Lleonart and Maynou, 2003).It is important to discriminate the effects of these human activitiesfrom those of natural processes, such as wave storms, and bottomcurrents, in order to better understand the present sedimentdynamics and the consequences that may arise from it (Brownet al., 2005; Ferré et al., 2008).
In this paper we study the physical changes induced bytrawling, analysing seafloor morphology, sediment characteristicsand turbidity in trawled and untrawled zones located on theprodeltaic mud of the Ebro continental shelf (northwesternMediterranean), comparing periods of high fishing intensity, lowfishing intensity and seasonal fishing closure.
2. Study area
The studied fishing ground is located on the Ebro continentalshelf (northwestern Mediterranean) (Fig. 1). This shelf receives
Contents lists available at ScienceDirect
journal homepage: www.elsevier.com/locate/csr
Continental Shelf Research
0278-4343/$ - see front matter & 2013 Elsevier Ltd. All rights reserved.http://dx.doi.org/10.1016/j.csr.2013.10.008
n Corresponding author. Tel.: þ34 932309500; fax: þ34 932309555.E-mail address: [email protected] (A. Palanques).
Continental Shelf Research 72 (2014) 83–98
sediment supplies mainly from the Ebro River, which has anaverage annual water discharge rate ranging between 300 and600 m3 s�1 and quite an irregular flow regime. Maximum waterdischarge (4900 m3 s�1) takes place in spring and autumn, whileminimum water discharge (o200 m3 s�1) takes place mainly insummer (Maldonado, 1972). The present sediment discharge ofthis river is highly affected by the many dams constructed along itshydrographic basin and is less than 1% of the discharge in pre-damconditions (Palanques et al., 1990; Guillén and Palanques, 1992).
The Ebro continental shelf has a microtidal (o0.3 m) regimewith a low-period mean wave climate. Wave periods rangebetween 2 and 10 s and heights are lower than 4 m for 98% ofthe time. Maximum significant wave heights are about 5–6 m froma northeastern direction. The average offshore significant waveheight is 1 m and the average wave period is about 3.5 s (Graciaet al., 1989; Jiménez, 1996). Over the inner and mid-partsof the shelf, surface wind-generated currents are increasinglyimportant landward (Font, 1983) and on the outer shelf the flow
is dominated by the geostrophic Northern Current, which flowssouthward at speeds of about 15 cm s�1 and appears to be littleaffected by local wind variations. This southward flow also extendsshoreward onto the shelf but with decreased velocities (Fontet al., 1990). In this context, fine sediment is mainly distributedby dominant SW along-shelf currents and modern depositiontakes place on the inner and mid-shelf during prolonged low-energy conditions, mainly of southwest transport (Palanques andDrake, 1990; Cacchione et al., 1990). A prodeltaic mud depositextends along this continental shelf between 20 and 80 m waterdepth up to 110 km southward from the present river mouth,showing a gentle slope and relatively homogenous sediment andphysical parameters (Díaz et al., 1990). The mean grain size of theprodeltaic mud ranges from 1 to 4 mm and the finest sedimentaccumulates in a mud belt at a water depth of between about 60and 80 m.
South from the Ebro Delta, a major fishing ground is located onthe prodeltaic mud deposit, with a surface area of approximately
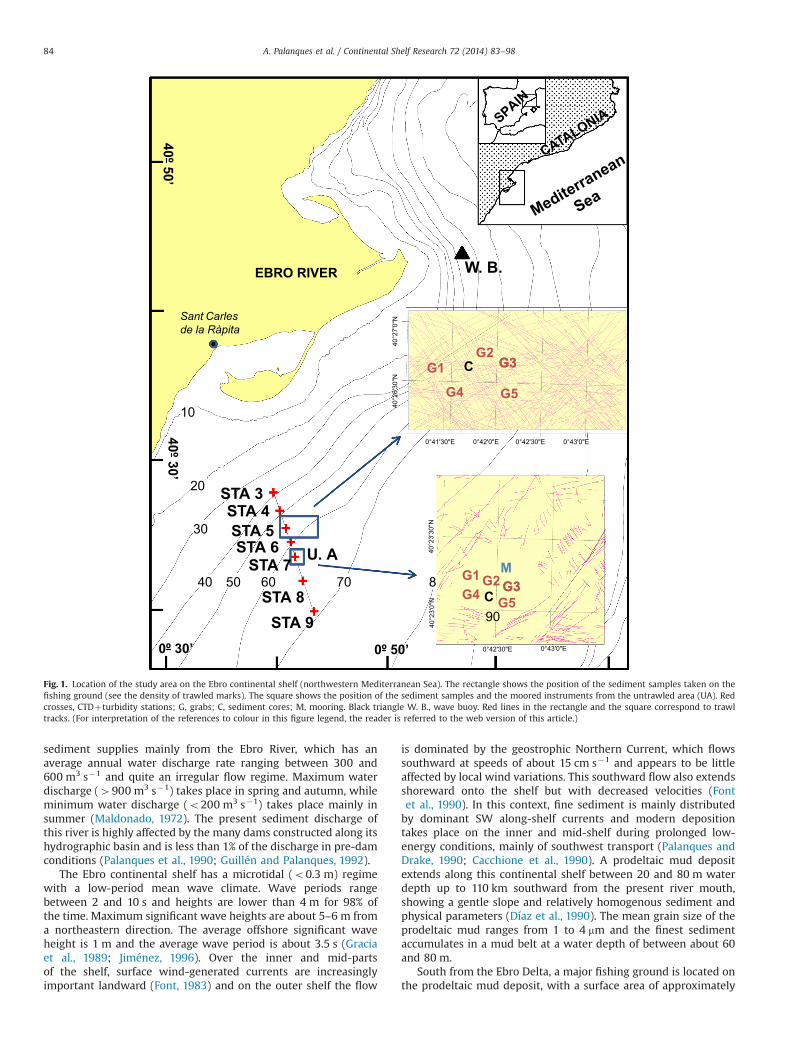
Fig. 1. Location of the study area on the Ebro continental shelf (northwestern Mediterranean Sea). The rectangle shows the position of the sediment samples taken on thefishing ground (see the density of trawled marks). The square shows the position of the sediment samples and the moored instruments from the untrawled area (UA). Redcrosses, CTDþturbidity stations; G, grabs; C, sediment cores; M, mooring. Black triangle W. B., wave buoy. Red lines in the rectangle and the square correspond to trawltracks. (For interpretation of the references to colour in this figure legend, the reader is referred to the web version of this article.)
A. Palanques et al. / Continental Shelf Research 72 (2014) 83–9884
400 km2 and a depth of between 35 and 75 m (Fig. 1). This groundalso encompasses an untrawled area of �2.7 km2 at �60 m depththat has remained undisturbed for decades because an oil platformwas constructed there in 1970 (Comisión Nacional de Energía, 2006).The platform was blown up afterwards, leaving scattered remainsthat cause trawlers to avoid towing within this area.
The fishing ground is exploited by the St. Carles de la Ràpitatrawling fleet, whose activity is seasonal, with periods of highactivity in autumn and winter, low activity in spring and a two-monthfishing closure in summer every year (Demestre et al., 2008). The SantCarles de la Ràpita fishing fleet was composed of a total of 118 vesselsat the end of 2003, of which 59 were otter trawlers operating atdepths greater than 35m. Among these otter trawlers, 18 were large(460 GT) (GT: gross tonnage), 18 were medium (40–60 GT) and 23were small (o40 GT). The fishing activity of this fleet is conducteddaily from Monday to Friday from 6:30 AM to 4:30 PM, except duringlocal holidays, and all vessels return to the harbour every day. Thisinvolves an effective fishing time of 6–8 h per working day. The trawlgear that use these otter trawlers consists of a net, sweeplines, doors,and warps (Palanques et al., 2001). The doors are oval or rectangularand made of iron. The footrope is at the front of the bottom part of thenet and has lead weights that hold it against the bottom on the trawlpath. The trawl gears of the otter trawlers from the Sant Carles de laRàpita fishing fleet have the typical dimensions of most commercialdemersal otter trawler of the Mediterranean Sea. The dimensions arevariable depending on the fishing depth and the species to becaptured. The doors can reach a maximum weigh around 1 tonne,and during trawling the distance between these doors can be about60 m.
3. Methods
In the framework of the European project RESPONSE (Q5RS-2002-00787, Fifth Framework Programme: Quality of life), a studyto determine the effect of trawling and the efficiency of closureseasons, seven cruises were carried out on the Ebro continentalshelf. Two cruises were conducted during the low-activity period(March and June), three cruises during the close season (mid-July,late July and mid-August) and two cruises during the high-activityperiod (September and November). A mooring array was alsodeployed from December 2002 to March 2004 in the untrawledarea (Fig. 1). This study included sampling of surface sediment,
sediment cores and monitoring of fishing effort and natural forcingconditions.
3.1. Monitoring of fishing effort
Direct information on the fishing effort in the studied fishingground was obtained by sampling on board local trawlers on twoto three days every month from December 2002 to March 2004.From the radar screen of the trawlers, the other trawlers wereobserved and identified and the positions of other boats workingin the surrounding area were recorded. In addition, the census ofthe fleet for the period 2002–2004 was obtained from the officialinformation of the Fishermen's Association of Sant Carles de laRàpita, and the daily sales records from each vessel (June 2002 toFebruary 2004) were used to determine the number of days permonth that each vessel was working in the study area. For eachvessel, technical characteristics (HP, TRB, GT, length) and type ofgear were determined. Interviews with fishermen were carried outto determine more accurately the fishing effort in the study area(see Demestre et al., 2007 and 2008 for further details). Fishingeffort on the study area is estimated by number of fishing hoursper month (Fig. 2).
3.2. Side-scan sonar and video photographs
Seabed morphology was observed by recording acoustic imageswith a C-MAX CM2 side-scan sonar (SSS) at 325 Khz. A 1-km2 areaof high-density trawling tracks was selected to record a mosaic ofsonographs with the SSS and for sediment sampling duringdifferent fishing conditions. SSS images were recorded ten timesduring different levels of fishing intensity. Images were analysedby digitising all detectable otter trawl tracks. Tests were done inorder to choose a proper direction to record the greater number oftrawling tracks. Video images were obtained by a towed videowith a Panasonic 1/3′′ CCD colour camera.
3.3. Surface sediment
The sampling strategy for surface sediment was to take five vanVeen grabs and one sediment core using a KC HAPS corer from thesame stations on each cruise, both in the selected high-densitytrawling track area of the fishing ground and in the undisturbed
Jan-
03
Feb-
03
Mar-0
3
Apr-0
3
May-0
3
Jun-
03
Jul-0
3
Aug-
03
Sep-
03
Oct-0
3
Nov-
03
Dec-
03
Jan-
04
Feb-
04
0123450
1000
2000
3000
400050006000700080009000 High trawling activity
Low trawling activityFishing effort (h mo-1)
Significant wave height (m)
CLOSE S.Ebro water discharge (m3s-1)
Dec-
02
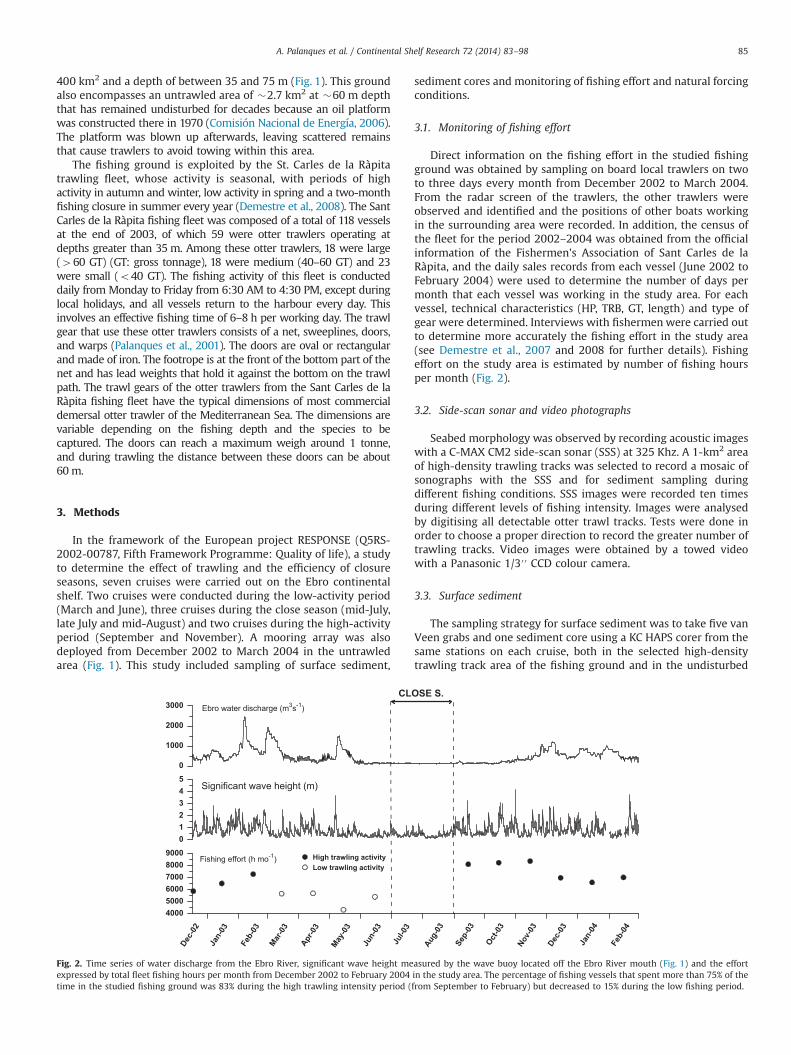
Fig. 2. Time series of water discharge from the Ebro River, significant wave height measured by the wave buoy located off the Ebro River mouth (Fig. 1) and the effortexpressed by total fleet fishing hours per month from December 2002 to February 2004 in the study area. The percentage of fishing vessels that spent more than 75% of thetime in the studied fishing ground was 83% during the high trawling intensity period (from September to February) but decreased to 15% during the low fishing period.
A. Palanques et al. / Continental Shelf Research 72 (2014) 83–98 85
area. One sample of the surficial sediment was taken from eachgrab. Cores were sampled at 0–1, 1–2, 2–3, 3–4, 4–5, 9–10, 14–15,19–20, 24–25 and 29–30 cm depth. The locations of the grabs andcores in the fishing ground and untrawled area are shown in Fig. 1.
Bottom sediment samples were analysed to determine their grainsize and organic carbon (OC) content. The grain size distribution wasdetermined by a settling tube for the 450 mm-fraction and by aSedigraph for the o50 mm fraction following the method describedby Giró and Maldonado (1985). Both fractions were integrated andprocessed to estimate granulometric parameters. Carbon was mea-sured in duplicate using a LECO CN 2000 analyser. Two subsampleswere used to determine the total carbon percentage (TC %) aftercombustion at 1050 1C. Another two subsamples were digested withHCl in a LECO CC 100 digester and the resulting CO2 was measuredby the same LECO CN 2000 analyser and assigned to inorganiccarbon content (IC%). The difference between the two values is thepercentage of OC
3.4. Turbidity vertical distribution
Vertical profiles of water turbidity were recorded by a Sea Tech25 cm path length transmissometer installed in a Seabird 25conductivity-temperature-depth (CTD) profiler mounted in aframe that was able to record down to 0.5 m above bottom(mab). A transect of six hydrographic stations was performed oneach of the seven cruises carried out during periods of differentfishing activity (Fig. 1). No calibration was done in situ so lighttransmission values recorded in BAC (beam attenuation coeffi-cient) by the transmissometer were converted into estimates ofsuspended sediment concentration (SSC), following the generalcalibration curve reported in Guillén et al. (2000):
SSC¼ 1:43� BAC�0:26 ðr2 ¼ 0:85Þ
3.5. Near-bottom current and turbidity time series
The mooring line deployed in the untrawled area within thefishing ground included an RCM9 Aanderaa current meterequipped with a turbidity sensor installed at 2 mab, and a 25-m-long Aanderaa thermistor chain with 5 turbidimeters placed 5 mapart at 5, 10, 15, 20 and 25 mab. A second RCM9 Aanderaa currentmeter with a turbidimeter was installed at 30 mab. The samplinginterval of these instruments was set to 10 min.
The total recording period lasted from December 2002 toFebruary 2004 and was divided into five consecutive deployments(mid-December 2002 to late March 2003, late March to late June2003, late June to mid-August 2003, mid-August to mid-November2003, and mid-November 2003 to Mid-March 2004). During someperiods, and particularly at the end of the recording period,turbidity data showed a progressive increase in the backgroundlevel because of biofouling. In some cases the signal was correctedby removing the increasing trend, but in others the signals wereabove the sensor range and were therefore eliminated. Signalsabove the sensor range occurred mainly from late January to lateMarch 2003, from early May to late June 2003, and from lateFebruary to mid-March 2004.
No calibration was done in situ so turbidity values, recorded inFTU (formazin turbidity units) by the sensors installed in thecurrent meters and at the base of the thermistor chain, wereconverted into estimates of SSC, following the general calibrationcurves for the northwestern Mediterranean presented in Guillénet al. (2000):
SSC¼ 1:74� FTU�1:32 ðr2 ¼ 0:99ÞAlthough calibrations of BAC and FTU into SSC for vertical
profiles and time series have been previously obtained with the
same instruments, the use of generic equations may introducesome uncertainty in the estimations, because these calibrationsare highly sensitive to variations in particle size, shape androughness characteristics, so SSC and SS fluxes calculations maybe biased.
3.6. Near-bottom suspended sediment fluxes
Instantaneous sediment fluxes 2 mab were obtained by multi-plying the 10-min burst-averaged current speed by the instanta-neous SSC measurement recorded at the end of the samplinginterval. Because of the general anisotropy of the currents, weconsidered components along and across the local isobaths, andthe current components were rotated 501 clockwise. For the along-isobath component NE orientation flux values are positive,whereas for the SW orientation they are negative. For theacross-isobath component SE (offshore) orientation flux valuesare positive, whereas for the NW (landward) orientation they arenegative. The integration of the instantaneous fluxes for theduration of the considered time period yields the cumulatedacross- and along-shelf suspended sediment (SS) fluxes. Instanta-neous fluxes for both current components averaged over time gavethe net across- and along-shelf suspended sediment fluxes. Fromthe resultant vector of those flux components, the estimatedmagnitude of the net horizontal flux of SS and the flux directionat each site were obtained. Long biofouling periods during the firstsemester of 2003 prevented the estimation of cumulative fluxesduring this time period.
3.7. Waves and water discharge
The significant wave height was obtained from a wave buoylocated off the Ebro River mouth (Fig. 1). Gaps in the wavebuoy time-series record were filled with data from another buoyinstalled off Tarragona (60 km northward from the Ebro Delta).Wave height from the Tarragona buoy was corrected according toa previously established correlation with the data of the Ebro wavebuoy (Jiménez et al., 1999). The Ebro River's daily water dischargewas obtained from a gauging station located at Tortosa, 35 kmupstream from the river mouth.
4. Results
4.1. Forcing conditions
During the deployment period, the Ebro River annual dischargeshowed a dry season from June to mid-October and a wet seasonfrom November to May. During the dry season, water dischargewas lower than 200 m3 s�1 during most of the time with mini-mum values around 82 m3 s�1. During the 2002–2003 wet season,the river discharge increased three times to over 1500 m3 s�1 inFebruary and May, whereas during the 2003–2004 wet season(until February 2004) it only reached 1000 m3 s�1 on a few days inearly December (Fig. 2).
Significant wave height showed some moderate storms (Hs:2–3 m) from December 2002 to April 2003 and from September2003 to January 2004. Three storms reached a significant waveheight of between 3 and 4 m in early May, late October and lateFebruary 2004. From mid-May to late August significant waveheight was lower than 1 m during most of the time (Fig. 2).
4.2. Fleet activity
In the studied fishing ground, the activity of the fishing fleetranged from 4300 to 8370 h per month (h mo�1) during the
A. Palanques et al. / Continental Shelf Research 72 (2014) 83–9886

trawling season. The period of highest fishing effort of the ottertrawl fleet was from September to November, when it rangedbetween 8100 and 8370 h mo�1 (Fig. 2). During the months ofDecember and January the fishing effort was also high but withless effective fishing time (from 5800 to 6900 h mo�1) than inprevious months due to winter holidays and bad weather condi-tions. In February the activity reached 7000 h mo�1, marking theend of the high-activity period. From March to June the fishingactivity decreased to 4300 h mo�1, so it is considered a low-activity period. The close season took place in July and August.
According to the temporal distribution of fishing effort in thestudy area, three basic periods of fishing activity can be defined:high, low and nil (the close season). In addition to the fishing time,there was also a big difference in the areas where the fleet carriedout trawling activities during high and low periods. During thehigh-activity period (from September to February) the percentageof vessels working more than 75% of the time in the studiedfishing ground was 83%, compared with only 15% during the low-activity period (from February to June), when the majority of the
trawling fleet was working outside the studied fishing ground indeeper areas.
4.3. Seafloor morphology
The SSS images from the fishing ground show a high density oftrawl tracks overlapping and of different intensities. As expected,in the untrawled area, there were no trawl marks (Fig. 1). Thedense distribution of trawl tracks in the trawled area was recordedthroughout the year, even during the close season. A higher detailof the sea floor morphology was obtained with video imaging,which showed track marks from trawl doors and scrape marksprobably caused by sweeps and footropes (Fig. 3).
In the sonographs, there was no dominant trawling direction inthe fishing ground. The total length of tracks in the selected areawas calculated by digitising the otter trawl tracks (Fig. 3). The totallength of tracks in the selected 1-km2 area ranged from 41 to89 km. However, it should also be considered that not all the otter
10 m
Fig. 3. (a) Mosaic of side-scan sonar (SSS) images showing trawling tracks in the study area. (b) Fresh trawl tracks from vessels fishing in the studied fishing ground duringthe SSS survey. (c) Video image of the seabed showing trawling tracks.
A. Palanques et al. / Continental Shelf Research 72 (2014) 83–98 87
trawl tracks were detected with the same definition. The tracksparallel and subparallel to the route of the transducer weredetected with greater definition than those perpendiculars to it.Thus, because of this and because residence time of trawl marks inmud can be longer than one year (Palanques et al., 2001), seafloormorphology in the studied fishing ground reflects the accumula-tive action of trawling and it was not possible to discriminate theeffects caused during different seasonal fishing conditions bycomparing different surveys.
To estimate the area impacted by trawling in the studiedfishing ground, a simple approach is to determine the distancebetween trawling doors and the length of tracks. It was not easy toidentify paired doors with the high density of trawling tracks.However, we obtained about 30 measurements of paired tracksand the average distance between trawling doors was 59.5 m, witha standard deviation of 26.6 m. Considering the residence time ofthe trawl marks, the length of the tracks, the width between doorsand that it is not only the doors but the sweeplines and thefootrope what scrapes and ploughs the seabed, it can be deter-mined that the selected area of the fishing ground has been100% affected by the action of trawling and that there is track
overlapping very often (Figs. 1 and 3a). From all the observationsmade in the studied fishing ground it is possible that this effectcould be easily extrapolated to the whole fishing ground.
4.4. Surface sediment
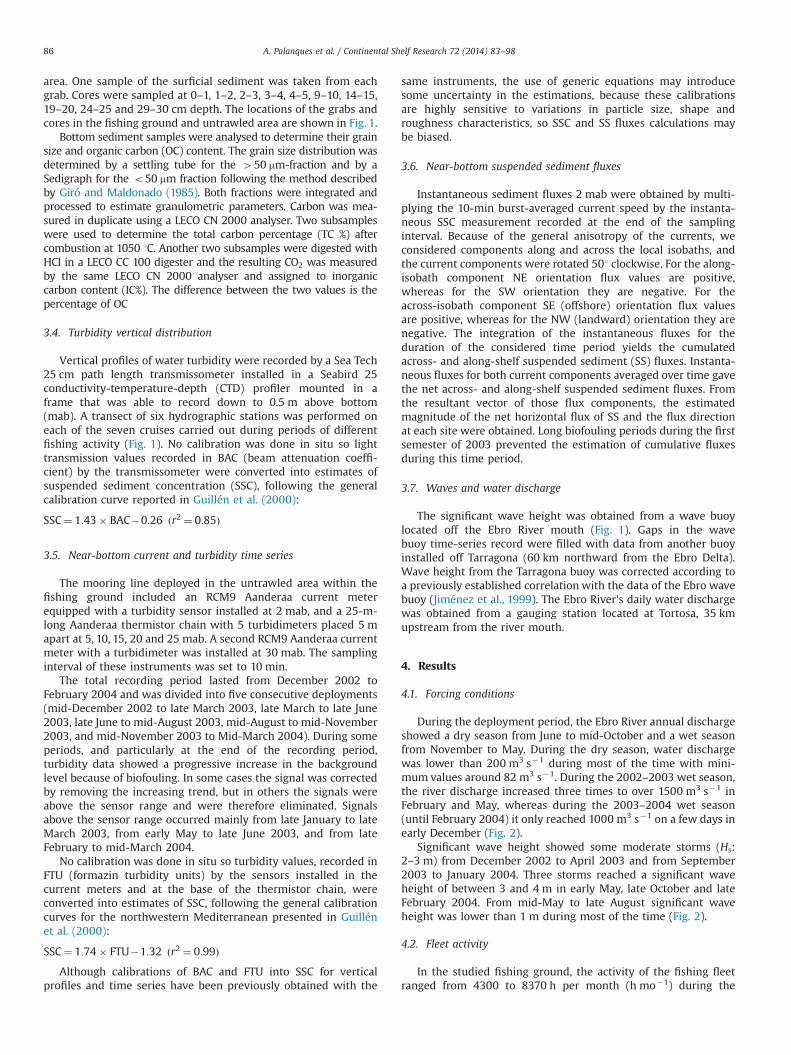
Sediment in the study area is fine prodeltaic mud, but thesurface sediment from the heavily trawled area and that from theuntrawled area had a different textural composition. The sandfraction was lower than 2% in both the trawled and the untrawledarea. However, the sediment of the trawled area had a higher siltcontent (40–58%) and median grain size (4.5 and 5.5 mm) than thatof the untrawled area (32–40% and 2.4-3 mm, respectively).
In the trawled area, the surface sediment during the trawlingseason tended to have a silt content between 2% and 4% higher and amedian grain size about 0.5 mm coarser than that sampled during theclose season (Fig. 4). This difference was not observed for the low-activity period. However, in the untrawled area, there were nosignificant differences in grain size in the surface sediment betweenseasons.
1 2 3 4 5
50
52
54
56
58
60
SUR
FAC
E SI
LT C
ON
TEN
T (%
)
TRAWLED AREA
1 2 3 4 5
32
34
36
38
40
42
HIGH TRAWLING ACT.
SeptemberNovember
UNTRAWLED AREA
1 2 3 4 5GRAB NUMBER
4
4.5
5
5.5
6
MED
IAN
GR
AIN
SIZ
E (m
icro
ns)
CLOSE SEASON
Mid-JulyLate JulyAugust
1 2 3 4 5GRAB NUMBER
2
2.5
3
3.5
4
LOW TRAWLING ACT.
JuneMarch
Fig. 4. Silt content and median grain size of the surface sediment samples from each of the five grabs taken on the trawled and untrawled area during the seven cruisescarried out during the close season (blue), the low activity period (green) and the high-activity period (red). Location in Fig. 1. Note the slight increasing trend during thehigh-activity period (in red), only observed in the trawled area. The Y-axis shows the same ranges of different values. (For interpretation of the references to colour in thisfigure legend, the reader is referred to the web version of this article.) In addition to colours, the data recorded during the different trawling seasons (low, close and high) canalso be identified by the symbols and the legend.
A. Palanques et al. / Continental Shelf Research 72 (2014) 83–9888
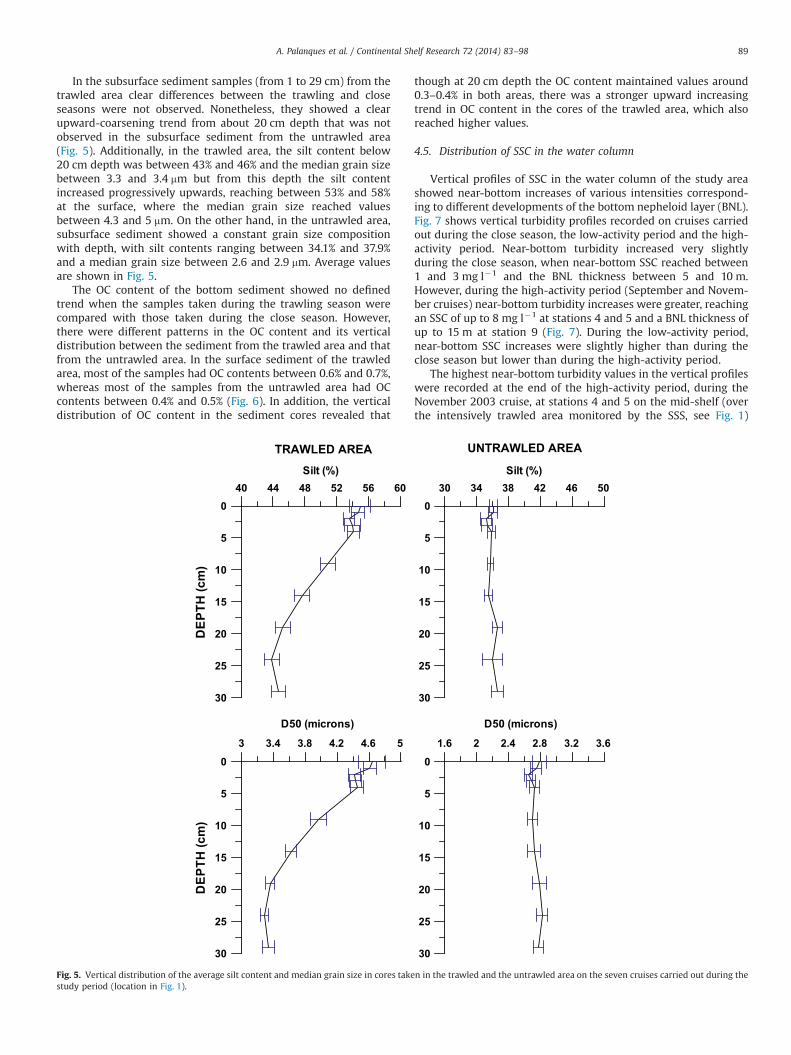
In the subsurface sediment samples (from 1 to 29 cm) from thetrawled area clear differences between the trawling and closeseasons were not observed. Nonetheless, they showed a clearupward-coarsening trend from about 20 cm depth that was notobserved in the subsurface sediment from the untrawled area(Fig. 5). Additionally, in the trawled area, the silt content below20 cm depth was between 43% and 46% and the median grain sizebetween 3.3 and 3.4 mm but from this depth the silt contentincreased progressively upwards, reaching between 53% and 58%at the surface, where the median grain size reached valuesbetween 4.3 and 5 mm. On the other hand, in the untrawled area,subsurface sediment showed a constant grain size compositionwith depth, with silt contents ranging between 34.1% and 37.9%and a median grain size between 2.6 and 2.9 mm. Average valuesare shown in Fig. 5.
The OC content of the bottom sediment showed no definedtrend when the samples taken during the trawling season werecompared with those taken during the close season. However,there were different patterns in the OC content and its verticaldistribution between the sediment from the trawled area and thatfrom the untrawled area. In the surface sediment of the trawledarea, most of the samples had OC contents between 0.6% and 0.7%,whereas most of the samples from the untrawled area had OCcontents between 0.4% and 0.5% (Fig. 6). In addition, the verticaldistribution of OC content in the sediment cores revealed that
though at 20 cm depth the OC content maintained values around0.3–0.4% in both areas, there was a stronger upward increasingtrend in OC content in the cores of the trawled area, which alsoreached higher values.
4.5. Distribution of SSC in the water column
Vertical profiles of SSC in the water column of the study areashowed near-bottom increases of various intensities correspond-ing to different developments of the bottom nepheloid layer (BNL).Fig. 7 shows vertical turbidity profiles recorded on cruises carriedout during the close season, the low-activity period and the high-activity period. Near-bottom turbidity increased very slightlyduring the close season, when near-bottom SSC reached between1 and 3 mg l�1 and the BNL thickness between 5 and 10 m.However, during the high-activity period (September and Novem-ber cruises) near-bottom turbidity increases were greater, reachingan SSC of up to 8 mg l�1 at stations 4 and 5 and a BNL thickness ofup to 15 m at station 9 (Fig. 7). During the low-activity period,near-bottom SSC increases were slightly higher than during theclose season but lower than during the high-activity period.
The highest near-bottom turbidity values in the vertical profileswere recorded at the end of the high-activity period, during theNovember 2003 cruise, at stations 4 and 5 on the mid-shelf (overthe intensively trawled area monitored by the SSS, see Fig. 1)
30 34 38 42 46 50Silt (%)
30
25
20
15
10
5
040 44 48 52 56 60
Silt (%)
30
25
20
15
10
5
0
DE
PTH
(cm
)
TRAWLED AREA UNTRAWLED AREA
1.6 2 2.4 2.8 3.2 3.6
D50 (microns)
30
25
20
15
10
5
0
3 3.4 3.8 4.2 4.6 5
D50 (microns)
30
25
20
15
10
5
0
DEP
TH (c
m)
Fig. 5. Vertical distribution of the average silt content and median grain size in cores taken in the trawled and the untrawled area on the seven cruises carried out during thestudy period (location in Fig. 1).
A. Palanques et al. / Continental Shelf Research 72 (2014) 83–98 89
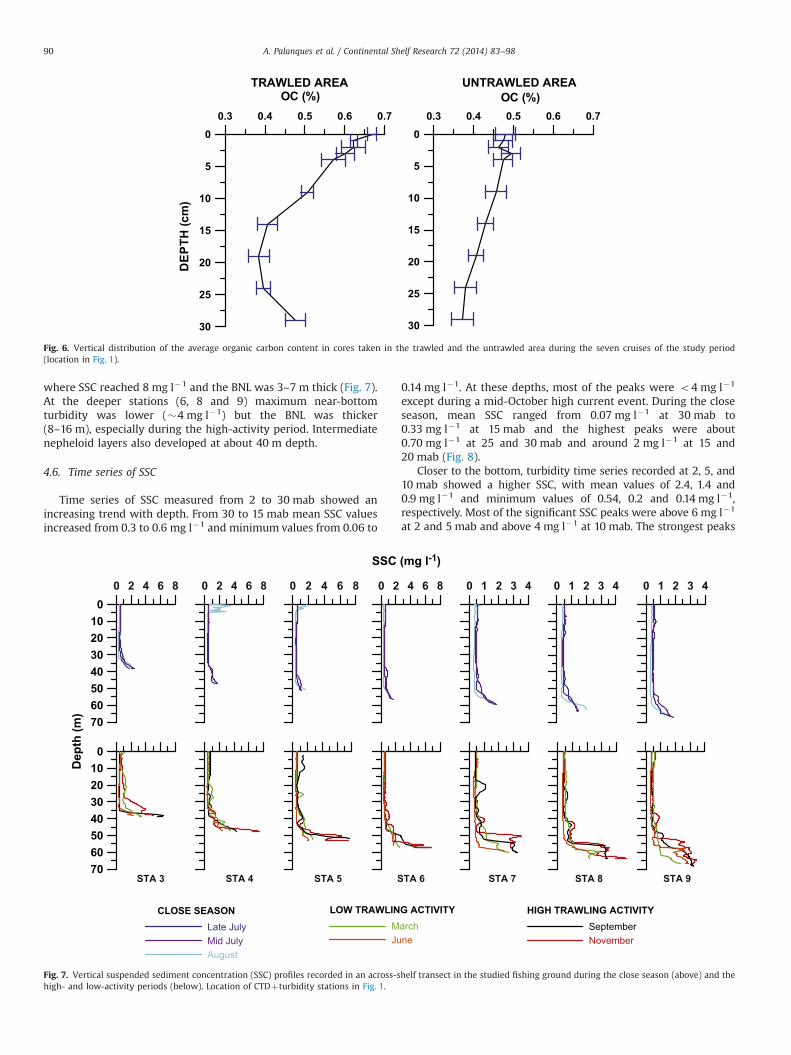
where SSC reached 8 mg l�1 and the BNL was 3–7 m thick (Fig. 7).At the deeper stations (6, 8 and 9) maximum near-bottomturbidity was lower (�4 mg l�1) but the BNL was thicker(8–16 m), especially during the high-activity period. Intermediatenepheloid layers also developed at about 40 m depth.
4.6. Time series of SSC
Time series of SSC measured from 2 to 30 mab showed anincreasing trend with depth. From 30 to 15 mab mean SSC valuesincreased from 0.3 to 0.6 mg l�1 and minimum values from 0.06 to
0.14 mg l�1. At these depths, most of the peaks were o4 mg l�1
except during a mid-October high current event. During the closeseason, mean SSC ranged from 0.07 mg l�1 at 30 mab to0.33 mg l�1 at 15 mab and the highest peaks were about0.70 mg l�1 at 25 and 30 mab and around 2 mg l�1 at 15 and20 mab (Fig. 8).
Closer to the bottom, turbidity time series recorded at 2, 5, and10 mab showed a higher SSC, with mean values of 2.4, 1.4 and0.9 mg l�1 and minimum values of 0.54, 0.2 and 0.14 mg l�1,respectively. Most of the significant SSC peaks were above 6 mg l�1
at 2 and 5 mab and above 4 mg l�1 at 10 mab. The strongest peaks
70605040302010
0
LOW TRAWLING ACTIVITYMarchJune
HIGH TRAWLING ACTIVITYSeptemberNovember
0 2 4 6 8
70605040302010
00 2 4 6 8 0 2 4 6 8 0 2 4 6 8
SSC (mg l-1)
0 1 2 3 4 0 1 2 3 4
CLOSE SEASONLate JulyMid JulyAugust
0 1 2 3 4
Dep
th (m
)
STA 3 STA 4 STA 5 STA 6 STA 7 STA 8 STA 9
Fig. 7. Vertical suspended sediment concentration (SSC) profiles recorded in an across-shelf transect in the studied fishing ground during the close season (above) and thehigh- and low-activity periods (below). Location of CTDþturbidity stations in Fig. 1.
0.3 0.4 0.5 0.6 0.7OC (%)
30
25
20
15
10
5
00.3 0.4 0.5 0.6 0.7
OC (%)
30
25
20
15
10
5
0
DEP
TH (c
m)
TRAWLED AREA UNTRAWLED AREA
Fig. 6. Vertical distribution of the average organic carbon content in cores taken in the trawled and the untrawled area during the seven cruises of the study period(location in Fig. 1).
A. Palanques et al. / Continental Shelf Research 72 (2014) 83–9890

(421.3 mg l�1 at 2 mab) were observed in early September duringthe high trawling season, some days after the end of the closeseason, and also in mid-October during a high current event (seebelow). During the close season mean SSC was 1.4, 0.9 and0.3 mg l�1 at 2, 5 and 10 mab, respectively, with values rangingbetween 0.5 and 3.6 mg l�1at 2 mab, 0.2 and 3.2 mg l�1 at 5 mab,and 0.14 and 2.3 mg l�1 at 10 mab (Fig. 8).
4.7. Near-bottom currents
The near-bottom current time series at 2 mab (Fig. 9) showedvelocity fluctuations mainly between 0.3 and 14 cm s�1, withsome peaks between 18 and 26 cm s�1 and a mean value of5.4 cm s�1. During the close season currents had a mean velocityof 4.1 cm s�1 and reached a maximum value of 14.2 cm s�1 with adominant direction towards the SE. During the trawling seasoncurrent speed peaked at 26 and 25 cm s�1 in early April and mid-October, respectively. Other peaks of between 20 and 22 cm s�1
were recorded in mid-September, mid-November and late Decem-ber 2003. The near-bottom current was mainly along-shelf, with adirection fluctuating from NNW to SSE and from SSW to NNE.From December 2002 to March 2003 the dominant direction wasNNW. During the low season fromMarch to June the mean currentwas 5.2 cm s�1 and the main direction was SSE. During the highintensity trawling period, from September 2003 to February 2004,the mean current was 5.8 cm s�1 and the current direction was
dominantly SSW from September to December and NNE fromDecember to February (Fig. 10).
4.8. Sediment transport
During the deployment period, instantaneous SS fluxes 2 mabat the mooring site ranged between 0.01 and 4.72 g m�2 s�1, witha mean value of 0.13 g m�2 s�1. The maximum flux of4.72 g m�2 s�1 was reached during the mid-October event, inwhich currents increased to 26 cm s�1 and the SSC exceeded theturbidity sensor range (i.e., 21.3 mg l�1). These fluxes thereforerepresent conservative estimates of the maximum values. Instan-taneous fluxes were much lower during the close season (between0.01 and 0.39 g m�2 s�1, with a mean value of 0.06 g m�2 s�1)than during the high-activity period from September to February(between 0.01 and 4.72 g m�2 s�1, with a mean value of0.20 g m�2 s�1) (Fig. 9).
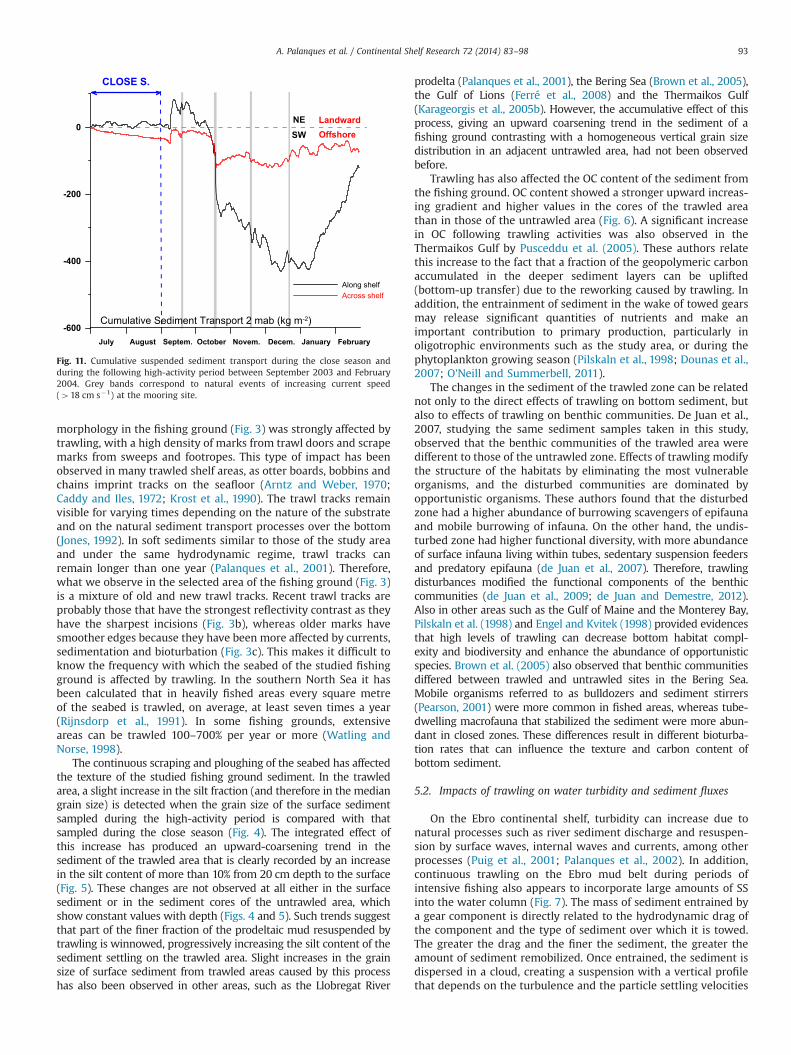
The cumulative SS transport 2 mab could not be well determinedfor the first semester of 2003 due to the fouling affecting theturbidity sensor during long periods of time. However, cumulativesediment transport was estimated during the close season (July andAugust 2003) and during the high-activity period until February2004 (Fig. 11). During the close season, the along-shelf cumulativesediment transport was very low (8.3 kg m�2 towards the NE),whereas the across-shelf cumulative transport was slightly higher(33.8 kg m�2 towards offshore). During the high-activity period thecumulative sediment transport had a predominant along-shelf
048
121620
048
121620
048
121620
048
121620
048
12048048 CLOSE S.
SSC 2 mab (mg l-1)
SSC 5 mab (mg l-1)
SSC 10 mab (mg l-1)
SSC 15 mab (mg l-1)
SSC 20 mab (mg l-1)
SSC 25 mab (mg l-1)
SSC 30 mab (mg l-1)
Jan 03 Feb 03 Mar 03 Apr 03 May 03 Jun 03 Jul 03 Aug 03 Sep 03 Oct 03 Nov 03 Dec 03 Jan 04 Feb 04Dec 02
Fig. 8. Suspended sediment concentrations (SSC) recorded by the turbidity sensors installed at the mooring site at different depths during the deployment period. The closeseason is indicated by the grey band. Discontinuous grey lines correspond to natural events of increasing current speed (418 cm s�1) at the mooring site. Only some of theminduced significant increases in SSC.
A. Palanques et al. / Continental Shelf Research 72 (2014) 83–98 91

component. In early September the along-shelf component wastowards the NE (reaching 83.2 kg m�2), but from mid-Septemberto mid-December it was mainly towards the SW (reaching431.2 kg m�2). This trend changed in late December to be dom-inantly towards the NE in January and February, reaching312.3 kg m�2 for the period from mid-December 2003 to February2004. The resulting cumulative flux for the period from September2003 to February 2004, with two opposite transport directions, was119.4 kg m�2 (Fig. 11). During the trawling season, the across-shelfcomponent had small landward-offshore oscillations and onlyincreased significantly offshore during the high current event occur-ring in mid-October (reaching 112.9 kg m2).
The net SS flux at 2 mab for the close season was 6.6 mgm�2 s�1
towards 116.21. During the high trawling activity season, the sedimenttransport was dominantly to the SW for the period from September tomid-December, with a net SS flux of 48.3 mgm�2 s�1 towards 210.11,and dominantly to the NE for the period from mid-December to lateJanuary, with a net SS flux of 53.2 mgm�2 s�1 towards 331.
5. Discussion
5.1. Impacts of bottom trawling on the seafloor
The physical impact of bottom trawling on the studied Ebroshelf fishing ground consists mainly of changes in seabed mor-phology, sediment characteristics and water turbidity. The seafloor
048
121620
048
1216202428
012345
0
1
2
3
Current speed (cm s-1)
Wave height (m)
CLOSE S.
Instantaneous SS fluxes 2 mab (g m-2 s-1)
SSC 2 mab (mg l-1)
Mar 03 Apr 03Jan 03 Feb 03 May 03 Jun 03 Jul 03 Aug 03 Sep 03 Oct 03 Nov 03Dec 02 Dic 03 Jan 04 Feb 04
4.7
Fig. 9. Time series of significant wave height, near-bottom current speed, suspended sediment concentration (SSC) and instantaneous suspended sediment (SS) fluxesrecorded during the study period. The close season is indicated by the grey band. Gaps in SSC and SS fluxes were periods during which fouling altered the turbidity data.Discontinuous grey lines correspond to natural events of increasing current speed (418 cm s�1) at the mooring site. Only some of them induced significant increases in SSCand SS flux.
-200-200
-100
0
100
200
December 2002July 2003 September 2003
December 2003
February 2004
March 2003
-100 0 100 200
N-S
E-W
Progressive vector (km)
Fig. 10. Progressive vector plot of the currents measured 2 mab at the mooring siteduring the deployment period (December 2002 to February 2004). Crossesrepresent time periods of 1 month.
A. Palanques et al. / Continental Shelf Research 72 (2014) 83–9892
morphology in the fishing ground (Fig. 3) was strongly affected bytrawling, with a high density of marks from trawl doors and scrapemarks from sweeps and footropes. This type of impact has beenobserved in many trawled shelf areas, as otter boards, bobbins andchains imprint tracks on the seafloor (Arntz and Weber, 1970;Caddy and Iles, 1972; Krost et al., 1990). The trawl tracks remainvisible for varying times depending on the nature of the substrateand on the natural sediment transport processes over the bottom(Jones, 1992). In soft sediments similar to those of the study areaand under the same hydrodynamic regime, trawl tracks canremain longer than one year (Palanques et al., 2001). Therefore,what we observe in the selected area of the fishing ground (Fig. 3)is a mixture of old and new trawl tracks. Recent trawl tracks areprobably those that have the strongest reflectivity contrast as theyhave the sharpest incisions (Fig. 3b), whereas older marks havesmoother edges because they have been more affected by currents,sedimentation and bioturbation (Fig. 3c). This makes it difficult toknow the frequency with which the seabed of the studied fishingground is affected by trawling. In the southern North Sea it hasbeen calculated that in heavily fished areas every square metreof the seabed is trawled, on average, at least seven times a year(Rijnsdorp et al., 1991). In some fishing grounds, extensiveareas can be trawled 100–700% per year or more (Watling andNorse, 1998).
The continuous scraping and ploughing of the seabed has affectedthe texture of the studied fishing ground sediment. In the trawledarea, a slight increase in the silt fraction (and therefore in the mediangrain size) is detected when the grain size of the surface sedimentsampled during the high-activity period is compared with thatsampled during the close season (Fig. 4). The integrated effect ofthis increase has produced an upward-coarsening trend in thesediment of the trawled area that is clearly recorded by an increasein the silt content of more than 10% from 20 cm depth to the surface(Fig. 5). These changes are not observed at all either in the surfacesediment or in the sediment cores of the untrawled area, whichshow constant values with depth (Figs. 4 and 5). Such trends suggestthat part of the finer fraction of the prodeltaic mud resuspended bytrawling is winnowed, progressively increasing the silt content of thesediment settling on the trawled area. Slight increases in the grainsize of surface sediment from trawled areas caused by this processhas also been observed in other areas, such as the Llobregat River
prodelta (Palanques et al., 2001), the Bering Sea (Brown et al., 2005),the Gulf of Lions (Ferré et al., 2008) and the Thermaikos Gulf(Karageorgis et al., 2005b). However, the accumulative effect of thisprocess, giving an upward coarsening trend in the sediment of afishing ground contrasting with a homogeneous vertical grain sizedistribution in an adjacent untrawled area, had not been observedbefore.
Trawling has also affected the OC content of the sediment fromthe fishing ground. OC content showed a stronger upward increas-ing gradient and higher values in the cores of the trawled areathan in those of the untrawled area (Fig. 6). A significant increasein OC following trawling activities was also observed in theThermaikos Gulf by Pusceddu et al. (2005). These authors relatethis increase to the fact that a fraction of the geopolymeric carbonaccumulated in the deeper sediment layers can be uplifted(bottom-up transfer) due to the reworking caused by trawling. Inaddition, the entrainment of sediment in the wake of towed gearsmay release significant quantities of nutrients and make animportant contribution to primary production, particularly inoligotrophic environments such as the study area, or during thephytoplankton growing season (Pilskaln et al., 1998; Dounas et al.,2007; O’Neill and Summerbell, 2011).
The changes in the sediment of the trawled zone can be relatednot only to the direct effects of trawling on bottom sediment, butalso to effects of trawling on benthic communities. De Juan et al.,2007, studying the same sediment samples taken in this study,observed that the benthic communities of the trawled area weredifferent to those of the untrawled zone. Effects of trawling modifythe structure of the habitats by eliminating the most vulnerableorganisms, and the disturbed communities are dominated byopportunistic organisms. These authors found that the disturbedzone had a higher abundance of burrowing scavengers of epifaunaand mobile burrowing of infauna. On the other hand, the undis-turbed zone had higher functional diversity, with more abundanceof surface infauna living within tubes, sedentary suspension feedersand predatory epifauna (de Juan et al., 2007). Therefore, trawlingdisturbances modified the functional components of the benthiccommunities (de Juan et al., 2009; de Juan and Demestre, 2012).Also in other areas such as the Gulf of Maine and the Monterey Bay,Pilskaln et al. (1998) and Engel and Kvitek (1998) provided evidencesthat high levels of trawling can decrease bottom habitat compl-exity and biodiversity and enhance the abundance of opportunisticspecies. Brown et al. (2005) also observed that benthic communitiesdiffered between trawled and untrawled sites in the Bering Sea.Mobile organisms referred to as bulldozers and sediment stirrers(Pearson, 2001) were more common in fished areas, whereas tube-dwelling macrofauna that stabilized the sediment were more abun-dant in closed zones. These differences result in different bioturba-tion rates that can influence the texture and carbon content ofbottom sediment.
5.2. Impacts of trawling on water turbidity and sediment fluxes
On the Ebro continental shelf, turbidity can increase due tonatural processes such as river sediment discharge and resuspen-sion by surface waves, internal waves and currents, among otherprocesses (Puig et al., 2001; Palanques et al., 2002). In addition,continuous trawling on the Ebro mud belt during periods ofintensive fishing also appears to incorporate large amounts of SSinto the water column (Fig. 7). The mass of sediment entrained bya gear component is directly related to the hydrodynamic drag ofthe component and the type of sediment over which it is towed.The greater the drag and the finer the sediment, the greater theamount of sediment remobilized. Once entrained, the sediment isdispersed in a cloud, creating a suspension with a vertical profilethat depends on the turbulence and the particle settling velocities
Along shelfAcross shelf
-600
-400
-200
0
CLOSE S.
Cumulative Sediment Transport 2 mab (kg m-2)
July
OffshoreNESW
Landward
August Septem. October Novem. Decem. January February
Fig. 11. Cumulative suspended sediment transport during the close season andduring the following high-activity period between September 2003 and February2004. Grey bands correspond to natural events of increasing current speed(418 cm s�1) at the mooring site.
A. Palanques et al. / Continental Shelf Research 72 (2014) 83–98 93

(O’Neill and Summerbell, 2011). The accumulative effect of severaltens of trawlers working day after day ultimately increases naturalturbidity levels. Studies of sediment resuspension experimentallyinduced by trawling on muddy prodeltas showed that while muchof the resuspended sediment gradually settled within a few hours,�10% to 30% of the initial resuspended load remained in suspen-sion for several days (Palanques et al., 2001; Durrieu de Madronet al., 2005).
To analyse the impact of trawling on water turbidity, it isnecessary to discriminate between turbidity increases induced bynatural processes and those induced by trawling. The impact ofnatural and man-induced processes overlaps but one is dominantover the other depending on the intensity of each one in time andspace. In this study, the turbidity record from the mooring site didnot show near-bottom turbidity peaks directly associated withriver discharge increases or with wave resuspension during storms(Figs. 2 and 9). Following the estimates of critical wave shearstresses for the sediment of the Ebro mud belt (Palanques et al.,2002), no storm event had surface waves strong enough toresuspend the cohesive bottom sediment at the mooring sitedepths during the deployment period. However, some turbiditypeaks were associated with near-bottom current speed increasesreaching between 18 and 26 cm s�1 (Fig. 9), although only themid-October event generated a significant turbidity peak at themooring site (421.3 mg l�1 at 2 mab, 19.2 mg l�1 at 5 mab,18.8 mg l�1 at 10 mab and 20.3 mg l�1 at 15 mab). The otherevents only generated some short turbidity peaks reaching 4 to12 mg l�1 and affecting mainly the sensors at 2 and 5 mab. Theseevents took place in late January, early April, late May, mid-September, mid-November and mid-December (Figs. 8 and 9).All these events are considered to be mainly controlled by naturalprocesses. Counting only the cumulative SS transport associatedwith these high energy events, the along-shelf cumulative com-ponent was 166.4 kg m�2 towards the SW and the across-shelfcomponent was 82.3 kg m�2 offshore. More than 90% of thistransport was during the mid-October event.
During the close season, there were fair weather conditions,currents at 2 mab reached maximum speeds of 14.2 cm s�1 andthere were no significant SSC peaks at any of the recorded depths(Figs. 8 and 9). Maximum SSC values were 3.6 mg l�1 at 2 mab,3.2 mg l�1 at 5 mab, 2.3 mg l�1 at 10 mab and about 2 mg l�1 at15 mab. At 25 and 30 mab maximum SSC values during the closeseason were lower than 1 mg l�1. All these values give a referenceof the background SSC levels in the area at different depthswithout trawling and without natural high-energy events. Theyalso indicate that currents of up to 14.2 cm s�1 at 2 mab were notable to generate any significant turbidity peaks above these back-ground levels at the mooring site.
Selecting time intervals from the high-activity period, duringwhich near-bottom currents were similar to those in the closeseason (without capacity to resuspend sediment from the mooringsite), we observed several SSC peaks (between 4.0 and 18.5 mg l�1)exceeding the close season reference values, which occurred mainlyduring working days (Fig. 12). In addition, turbidity tended todecrease to background values during weekends of the high-activity period under calm conditions and also during holidayssuch as Christmas, New Year and Epiphany (Fig. 13). The mostsignificant SSC peaks occurred in calm conditions during the high-activity period, when the currents were directed to the N-NE, sothey could not be caused by advection of sediment resuspended orsupplied from shallower areas. All this suggests that these turbiditypeaks correspond to sediment resuspended by trawling activitiesand advected to the mooring site.
Suspended sediment transport during calm condition periodswas higher with trawling than without trawling. During the calmperiods with intense trawling, several instantaneous SS flux peaks
(between 0.3 and 1.9 g m�2 s�1) occurred and the mean instanta-neous flux was more than twice that of the close season (Fig. 9,Table 1). Similarly, the along-shelf cumulative SS transport and theresulting SS flux during calm periods were much higher (32–40times and 5–9 times, respectively) with trawling than withouttrawling (Table 1).
Current and sediment flux data indicate that, once in suspen-sion, sediment resuspended by trawling under low-energy condi-tions was mainly transported along the shelf, either to thesouthwest or to the northeast, and could contribute to theadvective off-shelf sediment fluxes when interacting with localcirculation (Font et al., 1990; Salat et al., 2002), when reaching thesouthwest and the northeast limits of the Ebro shelf (located 90south and 50 km north of the mooring site), and also whendiffusive processes become active.
During the high-activity period, the SSC peaks in calm condi-tions reached 5 mab in September, 10 mab in early October(Fig. 12) and 15 mab in November, December and January(Fig. 13). This trend of the SSC peaks reaching higher levels abovethe bottom towards the end of the high-activity period can beassociated at least partially with the accumulative incorporationinto the BNL of sediment resuspended by trawling.
Similarly, vertical SSC profiles recorded during the cruisesunder low-energy conditions showed clear differences betweenthe close season and the high-activity period (Fig. 7). Both datafrom vertical profiles and time series show significant increases inSSC reaching 15 mab during the high-activity period. On the basisof this assumption, SSC from the CTD vertical profiles wasintegrated over the 15 mab water column to calculate the15 mab SS inventory at each hydrographic station during eachcruise (Fig. 14).
In spring, during the low-activity period, SSC increased slightlyand gradually with depth (except at the shallower station) to
Table 1Ranges, mean values and values of current (Curr.) speed 2 mab, suspendedsediment concentration and sediment transport parameters during the closeseason and during the calm periods of the periods September to mid-Decemberand mid-December to late February. Inst. Sed. Flux, instantaneous sediment flux;Along-s. cum. sed. t., along-shelf cumulative sediment transport; Across-s. cum.sed. t., across-shelf cumulative sediment transport; Res. sed. flux, resultantsediment flux; Res. sed. flux dir, resultant sediment flux direction; SSC, suspendedsediment concentration.
Closeseason
Sep. to mid-Dec.(Only calmperiods)
Mid-Dec. to lateFeb. (Only calmperiods)
SCC range(mg l�1)
0.51–3.99 0.62–421.3 1.01–14.63
Mean SSC(mg l�1)
1.42 2.59 2.77
Curr. speed range(cm s�1)
0.1–14.18 0.1–17.3 0.1–16.7
Curr. speed mean(cm s�1)
4.07 5.78 5.12
Inst. sed. fluxrange(g m�2 s�1)
0.01–0.38 0.01–1.93 0.01–0.92
Inst. sed. fluxmean(g m�2 s�1)
0.06 0.15 0.14
Along-s. cum.sed. t. (kg m�2)
8.31 �272.96 332.29
Across-s. cum.sed. t. (kg m�2)
33.88 2.28 39.18
Res. sed. flux(mg m�2 s�1)
6.61 31.90 57.12
Res. sed. flux dirº. 116 �139 33.27
A. Palanques et al. / Continental Shelf Research 72 (2014) 83–9894

Fr19
-SSa
20-S
Su21
-SM
o22
-STu
23-S
We
24-S
Th25
-SFr
26-S
Sa27
-SSu
28-S
Mo
29-S
Tu30
-SW
e1-
OTh
2-O
Fr3-
OSa
4-O
Su5-
OM
o6-
OTu
7-O
We
8-O
Th9-
OFr
10-O
Sa11
-OSu
12-O
Mo
13-O
Tu14
-OW
e15
-OTh
16-O
0
2
4
048
1216
0123
0
2
4
6
8
0
2
4
0
2
4
6
8
Current speed 2 mab (cm s-1)
Wave height (m)
SSC 2 mab (mg l-1)
SSC 5 mab (mg l-1)
SSC 10 mab (mg l-1)
SSC 15 mab (mg l-1)
Fig. 12. Significant wave height, suspended sediment concentration at 15, 10, 5 and 2 mab and current speed 2 mab during a period of low-energy conditions atthe beginning of the high-activity season. Grey bands represent the weekends. Note turbidity peaks on working days and not at weekends. Discontinuous line representthe maximum current speed 2 mab reached during the close season, during which no significant resuspension peaks occurred.
Mo
22-D
Tu23
-DW
e24
-DTh
25-D
Fr26
-DSa
27-D
Su28
-DM
o29
-DTu
30-D
We
31-D
Th1-
JFr
2-J
Sa3-
JSu
4-J
Mo
5-J
Tu6-
JW
e7-
J
Th8-
JFr
9-J
Sa10
-JSu
11-J
Mo
12-J
Tu13
-JW
e14
-JTh
15-J
0
2
4
6
048
121620
0123
0
2
4
6
8
0
2
4
60
2
4
6
SSC 5 mab (mg l-1)
SSC 10 mab (mg l-1)
SSC 2 mab (mg l-1)
Current speed 2 mab (cm s-1)
Christmas + weekend NewYear
weekendweekend Epip
Wave height (m)
SSC 15 mab (mg l-1)
Fig. 13. Significant wave height, suspended sediment concentration at 15, 10, 5 and 2 mab and current speed 2 mab during a period of low-energy conditions in the high-activity period. Grey bands represent Christmas holidays (New Year and Epiphany: Epip) and weekends. Note turbidity peaks on working days and not during weekends andholidays. Discontinuous line represent the maximum current speed reached 2 mab during the close season, when no significant resuspension peaks occurred.
A. Palanques et al. / Continental Shelf Research 72 (2014) 83–98 95
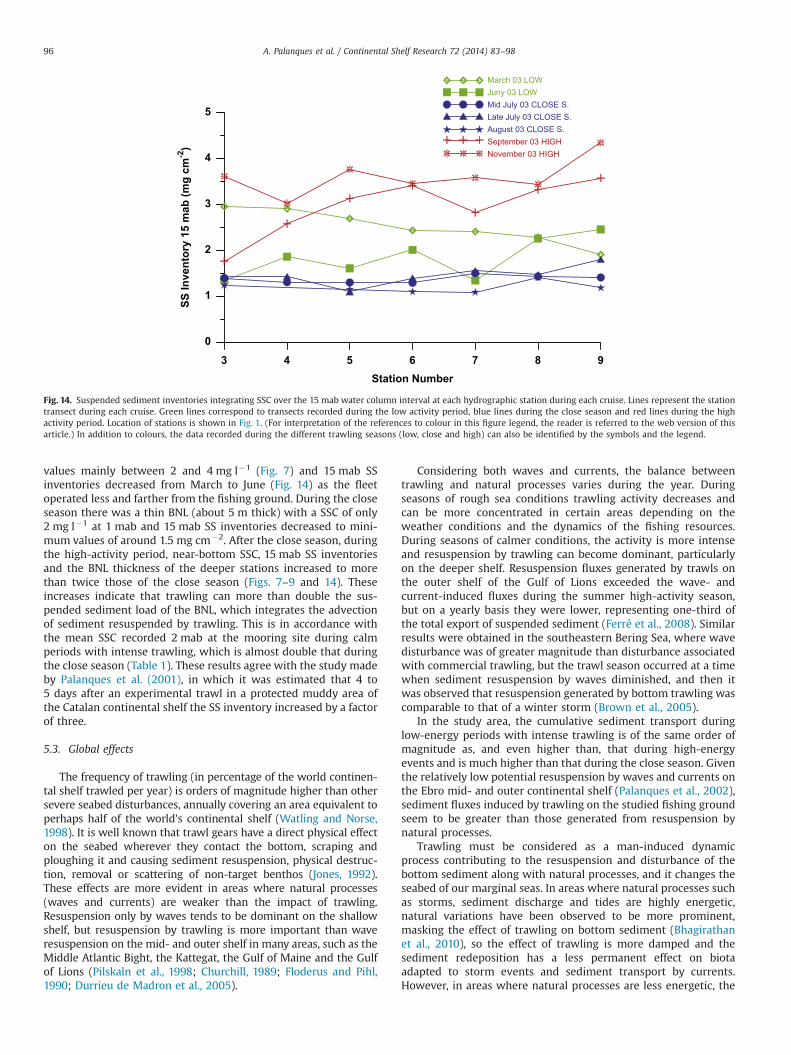
values mainly between 2 and 4 mg l�1 (Fig. 7) and 15 mab SSinventories decreased from March to June (Fig. 14) as the fleetoperated less and farther from the fishing ground. During the closeseason there was a thin BNL (about 5 m thick) with a SSC of only2 mg l�1 at 1 mab and 15 mab SS inventories decreased to mini-mum values of around 1.5 mg cm�2. After the close season, duringthe high-activity period, near-bottom SSC, 15 mab SS inventoriesand the BNL thickness of the deeper stations increased to morethan twice those of the close season (Figs. 7–9 and 14). Theseincreases indicate that trawling can more than double the sus-pended sediment load of the BNL, which integrates the advectionof sediment resuspended by trawling. This is in accordance withthe mean SSC recorded 2 mab at the mooring site during calmperiods with intense trawling, which is almost double that duringthe close season (Table 1). These results agree with the study madeby Palanques et al. (2001), in which it was estimated that 4 to5 days after an experimental trawl in a protected muddy area ofthe Catalan continental shelf the SS inventory increased by a factorof three.
5.3. Global effects
The frequency of trawling (in percentage of the world continen-tal shelf trawled per year) is orders of magnitude higher than othersevere seabed disturbances, annually covering an area equivalent toperhaps half of the world's continental shelf (Watling and Norse,1998). It is well known that trawl gears have a direct physical effecton the seabed wherever they contact the bottom, scraping andploughing it and causing sediment resuspension, physical destruc-tion, removal or scattering of non-target benthos (Jones, 1992).These effects are more evident in areas where natural processes(waves and currents) are weaker than the impact of trawling.Resuspension only by waves tends to be dominant on the shallowshelf, but resuspension by trawling is more important than waveresuspension on the mid- and outer shelf in many areas, such as theMiddle Atlantic Bight, the Kattegat, the Gulf of Maine and the Gulfof Lions (Pilskaln et al., 1998; Churchill, 1989; Floderus and Pihl,1990; Durrieu de Madron et al., 2005).
Considering both waves and currents, the balance betweentrawling and natural processes varies during the year. Duringseasons of rough sea conditions trawling activity decreases andcan be more concentrated in certain areas depending on theweather conditions and the dynamics of the fishing resources.During seasons of calmer conditions, the activity is more intenseand resuspension by trawling can become dominant, particularlyon the deeper shelf. Resuspension fluxes generated by trawls onthe outer shelf of the Gulf of Lions exceeded the wave- andcurrent-induced fluxes during the summer high-activity season,but on a yearly basis they were lower, representing one-third ofthe total export of suspended sediment (Ferré et al., 2008). Similarresults were obtained in the southeastern Bering Sea, where wavedisturbance was of greater magnitude than disturbance associatedwith commercial trawling, but the trawl season occurred at a timewhen sediment resuspension by waves diminished, and then itwas observed that resuspension generated by bottom trawling wascomparable to that of a winter storm (Brown et al., 2005).
In the study area, the cumulative sediment transport duringlow-energy periods with intense trawling is of the same order ofmagnitude as, and even higher than, that during high-energyevents and is much higher than that during the close season. Giventhe relatively low potential resuspension by waves and currents onthe Ebro mid- and outer continental shelf (Palanques et al., 2002),sediment fluxes induced by trawling on the studied fishing groundseem to be greater than those generated from resuspension bynatural processes.
Trawling must be considered as a man-induced dynamicprocess contributing to the resuspension and disturbance of thebottom sediment along with natural processes, and it changes theseabed of our marginal seas. In areas where natural processes suchas storms, sediment discharge and tides are highly energetic,natural variations have been observed to be more prominent,masking the effect of trawling on bottom sediment (Bhagirathanet al., 2010), so the effect of trawling is more damped and thesediment redeposition has a less permanent effect on biotaadapted to storm events and sediment transport by currents.However, in areas where natural processes are less energetic, the
3 4 5 6 7 8 9Station Number
0
1
2
3
4
5
SS In
vent
ory
15 m
ab (m
g cm
-2)
Fig. 14. Suspended sediment inventories integrating SSC over the 15 mab water column interval at each hydrographic station during each cruise. Lines represent the stationtransect during each cruise. Green lines correspond to transects recorded during the low activity period, blue lines during the close season and red lines during the highactivity period. Location of stations is shown in Fig. 1. (For interpretation of the references to colour in this figure legend, the reader is referred to the web version of thisarticle.) In addition to colours, the data recorded during the different trawling seasons (low, close and high) can also be identified by the symbols and the legend.
A. Palanques et al. / Continental Shelf Research 72 (2014) 83–9896

effect of trawling on sediment can be dominant, inducing morepermanent changes (Palanques et al., 2001; Durrieu de Madronet al., 2005; Ferré et al., 2008), and the effects of sedimentresuspension by trawling on the benthos could last for longerperiods. These impacts do not exclusively affect the continentalshelves but also the continental slopes, where natural processesthat remobilize sediments are less energetic than on continentalshelves and effects of trawling can ultimately alter the sedimentdynamics and seafloor morphology more drastically than inshallower environments (Palanques et al., 2006; Martín et al.,2007, 2008 and Puig et al., 2012).
This study is a contribution to knowledge of the impact oftrawling on continental shelves during the Anthropocene, in thesense suggested by Syvitski and Kettner (2011), when sedimentfluxes have also been altered by soil and river management (dams,deforestation, soil erosion, and so on), coastal management anderosion, and man-induced climate and ecosystem changes, includ-ing bottom trawling. It is therefore one of the many processes thatare inducing global changes in the marine environment.
6. Conclusions
The continuous scraping and ploughing of the seabed inducedby trawling has affected the morphology, the sediment texture andthe sediment OC content of the Ebro continental shelf. In thestudied fishing ground, the sea bed morphology is stronglyaffected by the action of trawling and part of the finer fraction ofthe prodeltaic mud resuspended by trawling is winnowed. As aconsequence, the silt content of the sediment increases, producingan upward coarsening trend recorded by an increase in the siltcontent of more than 10% from 20 cm depth to the surface of thesediment column. During the close season there is a slighttemporary increase in the fine fraction content in the uppermostsediment as this fraction is not affected by trawling disturbance.
Decades of trawling have also induced an increase in the OCcontent in the bottom sediment, generating a stronger upward-increasing gradient of OC content in the upper 20 cm of the sedimentcolumn of the fishing ground. The reason for this increase could bethe uplift of OC accumulated in deeper sediment layers due totrawling reworking and/or the activity of the changing benthiccommunities.
The fine fraction resuspended and winnowed by trawling isadvected by near-bottom currents, generating turbidity peaks onthe mid- and outer shelf that can be identified when they occurspecifically on working days under low-energy conditions, i.e. withcurrents under 14 cm s�1 in the case of the Ebro shelf fishingground.
Trawling introduces additional resuspended sediment thatmore than doubles the suspended sediment load of the BNL onthe Ebro mid-continental shelf. Resuspension fluxes caused bytrawls are dominant during high-activity periods under calm seaconditions, when the resulting sediment transport is five to ninetimes higher than without trawling and the along-shelf cumula-tive transport is dominant, reaching levels 32–40 times greaterthan during the close season. Therefore, decades of trawling arechanging the modern sediment record in continental shelf environ-ments and are inducing the transport and export of additionalsedimentary supplies off-shelf. Trawling forms part of the manyprocesses that are inducing global changes in the marine environment.
Acknowledgements
Data used in this work was collected in the framework of theEU Research Project RESPONSE (Q5RS-2002-00787) and the
Research Project COSTEM (CTM2009-07806) funded by the Min-isterio de Ciencia e Innovación. We thank all participants, UTMtechnicians and crews of R/V Garcia del Cid for their help anddedication during the cruises. A.P., P.P. J.G. and J.M. belong to CRGon Littoral and Oceanic Processes, supported by Grant 2009 SGR899 of the Generalitat de Catalunya. J. Martín is funded through aJAE-DOC contract within the program “Junta para la Ampliación deEstudios”, granted by the Consejo Superior de InvestigacionesCientíficas (Spanish National Research Council) and co-financedby the European Social Fund.
References
Arntz, W.E., Weber, W., 1970. Cyprina islandica L.(Mollusca, Bivalvia) als Nahrungvon Dorsch und Kliesche in der Kieler Bucht. Ber. Dtsch. Wiss. Komm. fürMeeresforsch. 21S, 193–209.
BEON, 1990. Effects of beamtrawl fishery on the bottom fauna of the North Sea.Netherlands Institute for Sea Research, Den Burg, Texel, BEON Rapp. 8. pp. 1–57.
Bhagirathan, U., Meenakumari, B., Jayalakshmy, K.V., Panda, S.K., Madhu, V.R.,Vaghela, D.T., 2010. Impact of bottom trawling on sediment characteristics – astudy along inshore waters off Veraval coast, India. Environ. Monit. Assess. 160,355–369.
Brown, E.J., Finney, B., Dommisse, M., Hills, S., 2005. Effects of commercial ottertrawling on the physical environment of the southeastern Bering Sea. Cont.Shelf Res. 25, 1281–1301.
Cacchione, D.A., Drake, D.E., Losada, M.A., Medina, R., 1990. Bottom-boundary layermeasurements on the continental shelf off the Ebro River. Spain. Mar. Geol. 95,179–192.
Caddy, J.F., Iles, T.D., 1972. Underwater observations on herring spawning groundson Georges Bank. Res. Bull. Int. Comm. Northwest Atl. Fish. 10, 131–139.
Comisión Nacional de Energía, 2006. Cronología del sector petrolero español. ⟨http://www.cne.es/cne/doc/publicaciones/IAP_CRONO_DP06.pdf⟩. Dirección de petróleo.51pp.
Churchill, J., 1989. The effect of commercial trawling on sediment resuspension andtransport over the Middle Atlantic Bight continental shelf. Cont. Shelf Res. 9,841–864.
De Groot, S.J., Lindeboom, H.J., 1994. Environmental impact of bottom gears onbenthic fauna in relation to natural resources management and protection ofthe North Sea. Netherland Institute for Sea Research (NIOZ). Report 199-11,Netherlands Institute for Fisheries Research (RIVO-DLO) Report CO26/94.
de Juan, S., Thrush, S., Demestre, M., 2007. Functional changes as indicators oftrawling disturbance on a benthic community located in a fishing ground (NWMediterranean Sea). Mar. Ecol. Prog. Ser. 334, 117–129.
de Juan, S., Demestre, M., Thrush, S., 2009. Defining ecological indicators of trawlingdisturbance when everywhere that can be fished is fished: a Mediterraneancase study. Mar. Policy 33, 472–478.
de Juan, S., Demestre, M., 2012. A trawl disturbance indicator to quantify large scalefishing impact on benthic ecosystems. Ecol. Indic. 18, 183–190.
Dellapenna, T.M., Allison, M.A., Gill, G.A., Lehman, R.D., Warnken, K.W., 2006. Theimpact of shrimp trawling and associated sediment resuspension in muddominated shallow estuaries. Estuarine Coastal Shelf Sci. 69 (3–4), 519–530.
Demestre, M., Recasens, L., Sanchez, P., de Juan, S., 2007. Effects of a two closuremonths on two trawl fishing grounds in the NW Mediterranean. Rapp. Comm.Int. Mer Médit. 38, CIESM, Istambul.
Demestre, M., de Juan, S., Sartor, P., Ligas, A., 2008. Seasonal closures as a measureof trawling effort control in two Mediterranean trawling grounds: effects onepibenthic communities. Mar. Pollut. Bull. 56, 1765–1773.
Díaz, J.I., Nelson, C.H., Barber Jr., J., Giró, S., 1990. Late pleistocene and holocenesedimentary facies on the Ebro continental shelf. Mar. Geol. 95, 333–352.
Dounas, C., Davies, I., Triantafyllou, G., Koulouri, P., Petihakis, G., Arvanitidis, C.,Sourlatzis, G., Eleftheriou, A., 2007. Large-scale impacts of bottom trawling onshelf primary productivity. Cont. Shelf Res. 27, 2198–2210.
Durrieu de Madron, X., Ferré, B., Le Corre, G., Grenz, C., Conan, P., Pujo-Pay, M.,Buscail, R., Bodiot, O., 2005. Trawling-induced resuspension and dispersal ofmuddy sediments and dissolved elements in the Gulf of Lion (NW Mediterra-nean). Cont. Shelf Res. 25, 2387–2409.
Engel, J., Kvitek, R., 1998. Effects of otter trawling on a Benthic Community inMonterey Bay National Marine Sanctuary. Conserv. Biol. 6, 1204–1214.
Ferré, B., Durrieu de Madron, X., Estournel, C., Ulses, C., Le Corre, G., 2008. Impact ofnatural (waves and currents) and anthropogenic (trawl) resuspension on theexport of particulate matter to the open ocean: application to the Gulf of Lion(NW Mediterranean). Cont. Shelf Res. 28, 2071–2091.
Floderus, S., Pihl, L., 1990. Resuspension in the Kattegat: impact of variation in windclimate and fishery. Estuarine, Coastal Shelf Sci. 31, 487–498.
Font, J., 1983. Corrientes permanentes en el borde de la plataforma continentalfrente al delta del Ebro. In: Castellví, J. (Ed.), Estudio oceanográfico de laplataforma continental. Gráficas Bumper, Barcelona, pp. 149–161.
Font, J., Salat, J., Julià, A., 1990. Marine circulation along the Ebro continentalmargin. Mar. Geol. 95, 165–177.
Fonteyne, R., 2000. Physical impact of beam trawls on seabed sediments. In: Kaiser,M.J., de Groot, S.J. (Eds.), The Effects of Trawling on Non-Target Species and
A. Palanques et al. / Continental Shelf Research 72 (2014) 83–98 97

Habitats: Biological, Conservation and Socio-Economic Issues. BlackwellScience, Oxford, UK, pp. 15–36.
Giró, S., Maldonado, A., 1985. Análisis granulométrico por métodos automáticos:Tubo de sedimentación y Sedigraph. Acta Geol. Hisp. 20, 95–102.
Gracia, V., Collado, F., Garcia, M., Monso, J.L., 1989. Análisis y propuesta desoluciones para estabilizar el delta del Ebro: Clima de oleaje II, In: DireccióGeneral Ports i Costes (Ed.), Technical Report LT-2/5, Generalitat de Catalunya,Barcelona, Spain.
Guillén, J., Palanques, A., 1992. Sediment dynamics and hydrodynamics in the lowercourse of a river highly regulated by dams: the Ebro River. Sedimentology 39,567–579.
Guillén, J., Palanques, A., Puig, P., Durrieu De Madron, X., Nyffeler, F., 2000. Fieldcalibration of optical sensors for measuring suspended sediment concentrationin the western Mediterranean. Sci. Mar. 64, 427–435.
Ivanovic, A., Neilson, R.D., O’Neill, F.G., 2011. Modeling the physical impact of trawlcomponents on the seabed and comparison with sea trials. Ocean Eng. 38,925–933.
Jiménez, J.A., 1996. Evolución costera en el Delta del Ebro. Un proceso a diferentesescalas de tiempo y espacio. Universitat Politécnica de Catalunya, Barcelona,Spain. (Ph.D. thesis).
Jiménez, J., Guillén, J., Gracia, V., Palanques, A., García, M., Sánchez-Arcilla, A., Puig,P., Puigdefabregas, J., Rodríguez, G., 1999. Water and sediment fluxes on theEbro delta shoreface: on the role of low frequency currents. Mar. Geol. 157,219–239.
Jones, J.B., 1992. Environmental impact of trawling on the seabed: a review. N. Z. J.Mar. Freshwater Res. 26, 59–67.
Karageorgis, A.P., Perissoratis, C., Anagnostou, Ch., 2005a. Characteristics of surfacesediments. In: Papathanassiou, E., Zenetos, A. (Eds.), State of the HellenicMarine Environment. HCMR, Athens, pp. 34–42.
Karageorgis, A.P., Kaberi, H., Price, N.B., Muir, G.K.P., Pates, J.M., Lykousisa, V., 2005b.Chemical composition of short sediment cores from Thermaikos Gulf (EasternMediterranean): sediment accumulation rates, trawling and winnowing effects.Cont. Shelf Res. 25, 2456–2475.
Krost, P., Bernhard, M., Werner, F., Hukriede, W., 1990. Otter trawl tracks in Kiel Bay(Western Baltic) mapped by side scan sonar. Meeresforsch 32, 344–353.
Lleonart J., Maynou, F., 2003. Fish stock assessment in the Mediterranean: state ofthe art. In: Ulltang, Ø., Blom, G. (Eds.), Fish Stock Assessment and Predictions:Integrating Relevant Knowledge. Sci. Mar. 67, sup. 1, 37–49. Issn:0214-8358.
Martín, J., Palanques, A., Puig, P., 2007. Horizontal transfer of suspended particulatematter in the Palamós submarine canyon. J. Mar. Res. 65 (2), 193–218.
Martín, J., Puig, P., Palanques, A., Masqué, P., García-Orellana, J., 2008. Effect ofcommercial trawling on the deep sedimentation in a Mediterranean submarinecanyon. Mar. Geol. 252, 150–155.
Maldonado, A., 1972. El Delta del Ebro. Estudio Sedimentológico y Estratigráfico.Bol. Estratigr. 1, 486.
O’Neill, F.G., Summerbell, K., 2011. The mobilisation of sediment by demersal ottertrawls. Mar. Pollut. Bull. 62, 1088–1097.
Palanques, A., Drake, D., 1990. Distribution and dispersal of suspended particulatematter on the Ebro continental shelf, Northwestern Mediterranean Sea. Mar.Geol. 95, 193–206.
Palanques, A., Plana, F., Maldonado, A., 1990. Recent influence of man on the EbroMargin Sedimentation System, Northwestern Mediterranean. Mar. Geol. 95,247–263.
Palanques, A., Guillén, J., Puig, P., 2001. Impact of bottom trawling on waterturbidity and muddy sediment of an unfished continental shelf. Limnol.Oceanogr. 46 (5), 1100–1110.
Palanques, A., Puig, P., Guillén, J., Jiménez, J., Gracia, V., Sánchez-Arcilla, A., Madsen, O.,2002. Near-bottom suspended sediment fluxes on the microtidal low-energy Ebrocontinental shelf (NW Mediterranean). Cont. Shelf Res. 22, 285–303.
Palanques, A., Martín, J., Puig, P., Guillén, J., Company, J.B., Sardà, F., 2006. Evidenceof sediment gravity flows induced by trawling in the Palamós (Fonera)submarine canyon (northwestern Mediterranean). Deep-Sea Res. I 53, 201–214.
Pearson, T.H., 2001. Functional group ecology in soft-sediment marine benthos: therole of bioturbation. Oceanogr. Mar. Biol.: Annu. Rev. 39, 233–267.
Pilskaln, C.H., Churchill, J.H., Mayer, L.M., 1998. Resuspension of sediment bybottom trawling in the Gulf of Maine and potential geochemical consequences.Conserv. Biol. 6, 1223–1229.
Pusceddu, A., Fiordelmondo, C., Polymenakou, P., Polychronaki, T., Tselepides, A.,Danovaro, R., 2005. Effects of bottom trawling on the quantity and biochemicalcomposition of organic matter in coastal marine sediments (Thermaikos Gulf,northwestern Aegean Sea). Cont. Shelf Res. 25, 2491–2505.
Puig, P., Palanques, A., Guillén, J., 2001. Near-bottom suspended sediment varia-bility caused by storms and near-inertial internal waves on the Ebro midcontinental shelf (NW Mediterranean). Mar. Geol. 178 (1–4), 81–93.
Puig, P., Canals, M., Company, J.B., Martin, J., Amblas, D., Lastras, G., Palanques, A.,Calafat, A., 2012. Ploughing the deep sea floor. Nature 489, 286–289.
Rijnsdorp, A.D., Groot, P., van Beek, F.A., 1991. The Micro Distribution of Beam TrawlEffort in the Southern North Sea. ICES Demersal fish committee/SessionP. Document 1991/G49, pp. 1–20.
Salat, J., Garcia, M.A., Cruzado, A., Palanques, A., Arin, L., Gomis, D., Guillen, J., deLeon, A., Puigdefabregas, J., Sospedra, J., Velasquez, Z.R., 2002. Seasonal changesof water mass structure and shelf slope exchanges at the Ebro shelf (NWMediterranean). Cont. Shelf Res. 22, 327–348.
Syvitski, J.P.M., Kettner, A., 2011. Sediment flux and the Anthropocene. Philos. Trans.R. Soc. London Ser. A 369, 957–975.
Tuck, I.D., Hall, S.J., Roberston, M.R., Armstrong, E., Basford, D.J., 1998. Effects ofphysical trawling disturbance in a previously unfished sheltered Scottish sealoch. Mar. Ecol. Prog. Ser. 162, 227–242.
Watling, L., Norse, E.A., 1998. Disturbance of the seabed by mobile fishing gear: acomparison to forest clearcutting. Conserv. Biol. 6, 1180–1197.
A. Palanques et al. / Continental Shelf Research 72 (2014) 83–9898