effects of changes in the capacity for photosynthetic electron transfer and photophosphorylation on...
TRANSCRIPT

404 Biochimica etBiophysicaActa, 724 (1983) 404-410 Elsevier
BBA41366
EFFECTS OF CHANGES IN THE CAPACITY FOR P H O T O S Y N T H E T I C ELECTRON TRANSFER AND P H O T O P H O S P H O R Y L A T I O N ON THE KINETICS OF FLUORESCENCE INDUCTION IN ISOLATED CHLOROPLASTS
PETER HORTON
Department of Biochemistry and ARC Research Group on Photosynthesis, The University, Sheffield $10 2TN (U.K.)
(Received May 10th, 1983)
Key words: Photosynthesis, Electron transfer," Photophosphorylation; Fluorescence induction; (Pea, Spinach chloroplast)
Chlorophyll fluorescence, 9-aminoacridine fluorescence and 0 2 evolution have been measured in a chloro- plast system reconstituted to simulate the induction kinetics observed in leaves. Transients in redox state and energy state, both of which control the yield of fluorescence, were seen to depend upon (a) light intensity, (b) electron-transfer rate as controlled by ferredoxin level, (c) the initial levels of ADP and phosphate and (d) the initial level of NADP. These factors were shown to interact to produce a range of fluorescence patterns. It is suggested that in vivo fluorescence transients in part are due to reduction and phoshorylation of the finite NADP and ADP pools that exist in the chloroplast prior to illumination.
Introduction
Upon illumination of leaves, the yield of fluo- rescence from chlorophyll decreases from a maxi- mum value reached within approx. 1 s. This de- crease, or quenching, takes about 60 s in vivo and is characterised by the presence of interruption in the fall by a transient rise before falling to a steady-state level [1-3]. This sequence of events has been referred to in terms of the P, S, M and T states where P is the initial peak, M the transitory peak, S the minimum level between P and M, and T the final steady-state level. In addition, under particular conditions (e.g., high CO2) the T level oscillates with a period of approx. 1 min, these oscillations being linked to metabolic oscillations in the reductive pentose phosphate pathway [3-6].
Abbreviations: Q, the primary electron acceptor of Photosys- tern II which, when oxidised, is accompanied by fluorescence quenching; ApH, transthylakoid H + gradient; qQ, quenching due to oxidation of Q; qe, quenching due to zlpH.
In this paper, only the mechanism of the PSMT transition will be dealt with.
The PSMT transient in bean leaves has been analysed by Bradbury and Baker [2] and is associ- ated with redox state changes in Q. Investigation of intact chloroplasts did not reveal an S-to-M rise but the P-to-T fall was associated with quenching due to Q oxidation (qQ) and ApH formation (q~) [7,8]. Analysis of these events in vivo is difficult and an in vitro system capable of showing in vivo kinetics is needed. Recently, fluorescence induc- tion in a reconstituted chloroplast system consist- ing of thylakoids supplemented with ADP, NADP and ferredoxin was described [8]. This system was considered to be a simulation of the dark-adapted in vivo condition when only a small finite pool of acceptor would exist prior to commencement of reductive carbon assimilation. This system showed kinetics very similar to those seen in leaves and it was therefore suggested that in vivo the PSM kinetics largely reflect photosynthetic reduction of the endogenous pool of NADP present prior to illumination. In this paper this notion has been

405
extended to the general concept that the initial kinetics will reflect the relative pool sizes of NADP and ADP as well as the rate of electron transport.
Materials and Methods
Pea or spinach chloroplasts were isolated and assayed exactly as previously described [8]. Intact chloroplasts were osmotically ruptured im- mediately prior to assay in a reaction medium containing, unless stated otherwise, sorbitol (0.33 M), EDTA (1 mM), MgCI 2 (10 raM), KC1 (10 mM), Hepes (50 mM), NaHCO 3 (5 mM), KH2PO 4 (0.2 mM), catalase (200 U/ml) , ferredoxin (75 #g/ml) , dithiothreitol (1 mM), ascorbate (4 mM), ADP (0.2 mM), NADP (0.1 raM) adjusted to pH 7.9. Simultaneous assays of 02 evolution, chloro- phyll fluorescence and 9-aminoacridine fluores- cence were made being using a Hansatech 02 electrode modified to allow optical measurements [8]. Chloroplasts were dark adapted for 3 min prior to illumination.
0
Results
Fig. 1 shows the influence of light intensity on the fluorescence kinetics of spinach chloroplasts (A) together with the response of A pH (B) and the rate of 02 evolution (C). At all intensities the same general features are present in that a PSM tran- sient is observed. However, the extent and timing are intensity dependent. Thus, the time of occur- rence of the M peak ( / m ) and the ratio P / M are dependent on intensity (Fig. 2). Except at very low light (d) the rate (tl/2) of P-to-S quenching is only slightly dependent on intensity because the rate of formation of ApH and attainment of the maxi- mum rate of 02 evolution (and thus oxidation of Q), which cause qo and qQ quenching, respectively, are largely intensity independent (Fig. 1B and C). The extent of P-to-S quenching is also clearly correlated with the maximum rate of oxygen evolution. The S-to-M rise, which correlates with the decrease in rate of 02 evolution as NADP is exhausted, will be determined by the rate
A B C
I
Aminoacridine fluorescence
Chlorophyll fluorescence
2 5 0 3 Time(min)
4 5
Rate of 0 evolution
4 5
Fig. 1. Kinetics of chlorophyll fluorescence (A), 9-aminoacridine fluorescence (B) and rate of oxygen evolution (C) at different light intensities. Spinach chloroplasts at 50 # g / m l chlorophyll was incubated under standard conditions at 385 (a), 216 (b), 110 (c) and 20 (d) W . m - 2 of red light in the apparatus described in Ref. 8. 0 is the time that both the constant low-intensity modulated measuring beam and variable actinic light were simultaneously switched on. Rates of oxygen evolution were 129, 108, 72 and 45 #mol O2 /mg chlorophyll per h in a, b, c and d, respectively.
406
1.3 120
1.2 100
1.1 0 • 80
P/M 1.0 60 tM(S)
o.g 4 0
0.8 • 20
0,~0 • ~, I I I I I l ~ 0 100 200 3 0 0 400
In tens i ty (Win -2 )
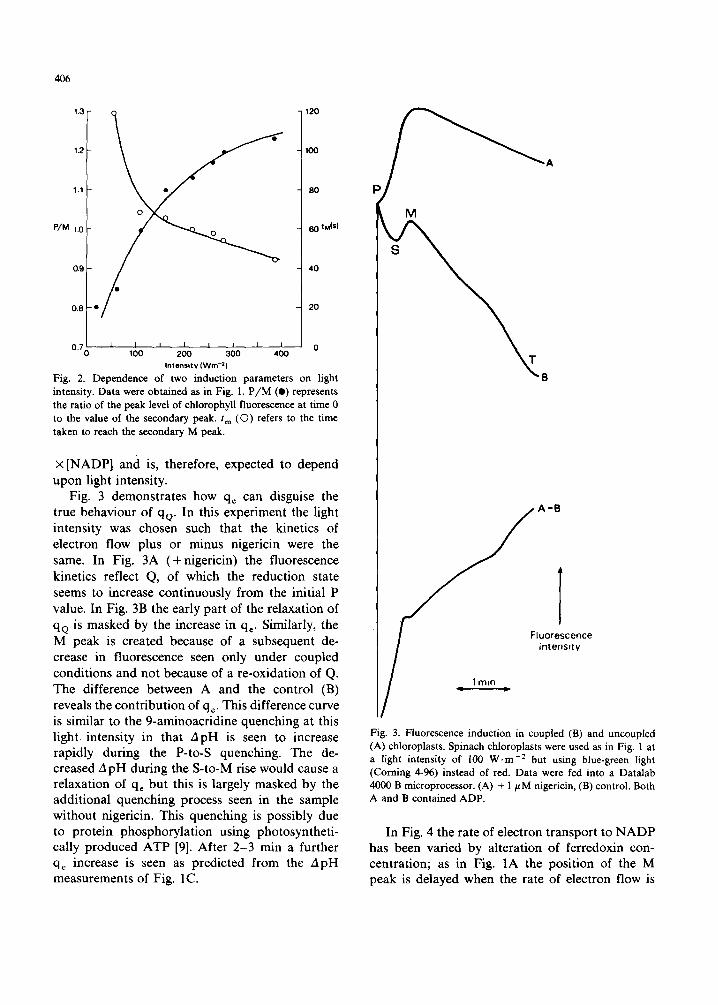
Fig. 2. Dependence of two induction parameters on light intensity. Data were obtained as in Fig. 1, P/M (e) represents the ratio of the peak level of chlorophyll fluorescence at time 0 to the value of the secondary peak. t m (O) refers to the time taken to reach the secondary M peak.
X [NADP] and is, therefore, expected to depend upon light intensity.
Fig. 3 demonstrates how qe can disguise the true behaviour of qQ. In this experiment the light intensity was chosen such that the kinetics of electron flow plus or minus nigericin were the same. In Fig. 3A (+nigericin) the fluorescence kinetics reflect Q, of which the reduction state seems to increase continuously from the initial P value. In Fig. 3B the early part of the relaxation of qQ is masked by the increase in qe. Similarly, the M peak is created because of a subsequent de- crease in fluorescence seen only under coupled conditions and not because of a re-oxidation of Q. The difference between A and the control (B) reveals the contribution of qe. This difference curve is similar to the 9-aminoacridine quenching at this light intensity in that ApH is seen to increase rapidly during the P-to-S quenching. The de- creased zi pH during the S-to-M rise would cause a relaxation of qe but this is largely masked by the additional quenching process seen in the sample without nigericin. This quenching is possibly due to protein phosphorylation using photosyntheti- cally produced ATP [9]. After 2-3 min a further q , increase is seen as predicted from the ApH measurements of Fig. 1C.
A
B
A i
Fig. 3. Fluorescence induction in coupled (B) and uncoupled (A) chloroplasts. Spinach chloroplasts were used as in Fig. 1 at a light intensity of 100 W.m -2 but using blue-green light (Coming 4-96) instead of red. Data were fed into a Datalab 4000 B microprocessor. (A) + 1 #M nigericin, (B) control. Both A and B contained ADP.
In Fig. 4 the rate of electron transport to NADP has been varied by alteration of ferredoxin con- centration; as in Fig. 1A the position of the M peak is delayed when the rate of electron flow is
' " ~ 2 5
,ii t
Fluorescence intensity
1 rn in
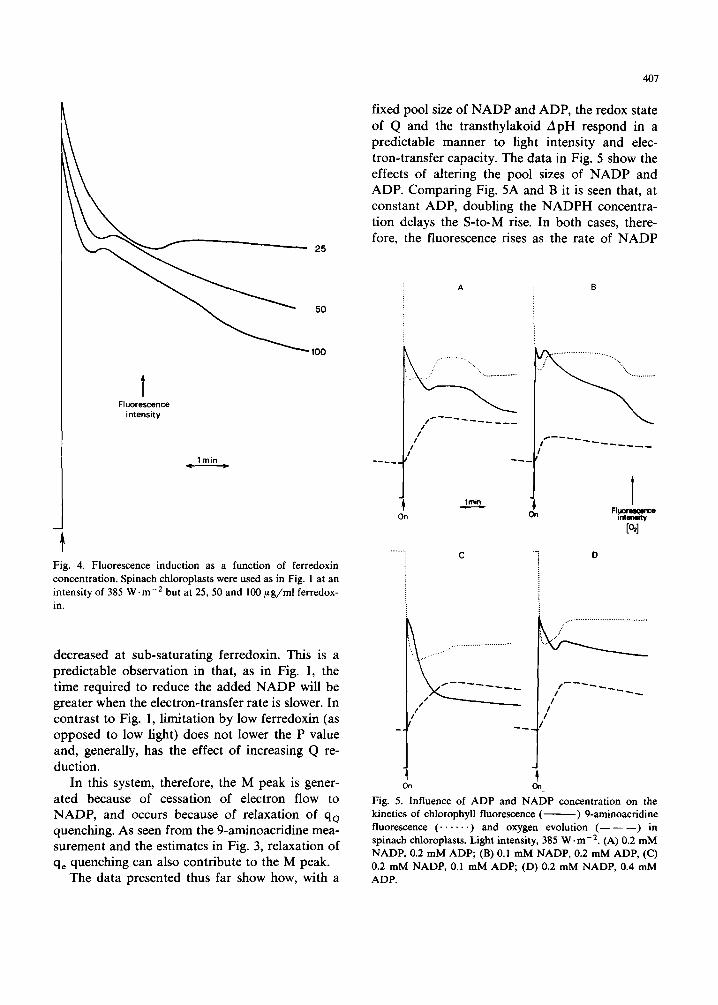
Fig. 4. Fluorescence induction as a function of ferredoxin concentration. Spinach chloroplasts were used as in Fig. 1 at an intensity of 385 W . m -2 but at 25, 50 and 100/~g/ml ferredox- in.
decreased at sub-saturating ferredoxin. This is a predictable observation in that, as in Fig. 1, the time required to reduce the added NADP will be greater when the electron-transfer rate is slower. In contrast to Fig. 1, limitation by low ferredoxin (as opposed to low light) does not lower the P value and, generally, has the effect of increasing Q re- duction.
In this system, therefore, the M peak is gener- ated because of cessation of electron flow to NADP, and occurs because of relaxation of qo quenching. As seen from the 9-aminoacridine mea- surement and the estimates in Fig. 3, relaxation of qe quenching can also contribute to the M peak.
The data presented thus far show how, with a
407
fixed pool size of NADP and ADP, the redox state of Q and the transthylakoid A pH respond in a predictable manner to light intensity and elec- tron-transfer capacity. The data in Fig. 5 show the effects of altering the pool sizes of NADP and ADP. Comparing Fig. 5A and B it is seen that, at constant ADP, doubling the NADPH concentra- tion delays the S-to-M rise. In both cases, there- fore, the fluorescence rises as the rate of NADP
A B
/ I
/ /
1rain
O n On
/ ¢/
T F luofogc~
intetBity
P,]
/
/ / I
/
O n • On
Fig. 5. Influence of ADP and N A D P concentration on the kinetics of chlorophyll fluorescence ( ) 9-aminoacridine fluorescence ( . . . . . . ) and oxygen evolution ( - - - - - - ) in spinach chloroplasts. Light intensity, 385 W. m-2. (A) 0.2 mM NADP, 0.2 mM ADP; (B) 0.1 mM NADP, 0.2 mM ADP, (C) 0.2 mM NADP, 0.1 mM ADP; (D) 0.2 mM NADP, 0.4 mM ADP.

408
reduction subsides and as the A pH relaxes due to a fall in the rate of H ÷ uptake. However, it is clear that the shape of the quenching curve is changed also; thus the M-to-T fall in Fig. 5B (as in Figs. 1, 3 and 4) has two 'phases' to it, the first being a resumption of the P-to-S quenching which was briefly interrupted by the sharp S-to-M rise. In Fig. 5A the P-to-S quenching was largely complete before the S-to-M rise and here the M-to-T fall reflects the A pH increase which is responsible for the second phase in Fig. 5B. In Fig. 5B the S-to-M rise is in fact mainly due to relaxation of qQ, since q~ is not very large at the point of NADP deple- tion (due to the incomplete phosphorylation of ADP). Thus, it is the compound ratio of N A D P / N A D P H : A D P / A T P at the onset of illumination which will determine the induction kinetics. This relationship is further examined in Fig. 5C and D; when NADP > ADP as in Fig. 5C, P-to-S quench- ing is increased due to the increase in A pH to high values corresponding to a high A T P / A D P ratio. In fact 'photosynthetic control' is seen as a decline in the rate of NADP reduction after approx. 15 s and a clear phase of A pH increase is often seen just prior to the ApH-induced inhibition of NADP reduction. In this case the highly quenched state tends to obscure the more gradual qQ change as electron flow slows down. Fig. 6 plots the P / M ratio as a function of NADP and ADP concentra- tions. Clearly, as [NADP] is increased the P / M ratio increases while, as [ADP] increases the P / M
A
24
22
20
18 •
~M
16
14
[NADP]mM
P/M 14
B
o • o
Fig. 6. Dependence of the ratio P / M on initial concentrations of NADP (A) and ADP (B). Conditions as Fig. 6. The ratio P / M is as defined in Fig. 2. (A) The ADP concentration was 0.1 mM, (B) the NADP concentration was 0.2 mM (O) or 0.1 mM (O).
t(min)
I I I I I
0.1 0.2 0.3 0.4 0.5 ~AOP] mM
Fig. 7. Influence of the initial level of [ADP] on the time for the re-establishment of a high A pH. t refers to the estimated inflection point on the 9-aminoacridine fluorescence curve fol- lowing the plateau region observed after NADP depletion (e.g., Fig. 6A).
ratio decreases. Consequently, at low NADP and high ADP, the M peak can be as high as or often higher than the P peak.
Since these changes are related to the rate of increase in A T P / A D P ratio, it follows that the level of inorganic phosphate will be important, since it is the phosphorylation potential (ATP/ ADP. Pi) that reflects ApH (rather than A T P / ADP). It has indeed been found that in low phos- phate, a condition roughly similar to that seen with low ADP is produced. Thus, the shape of the fluorescence induction curve will depende in a rather complex manner upon the A T P / A D P . Pi and N A D P / N A D P H ratios prior to illumination because of their interrelated effects o n qQ and qe-
It has previously been shown that the decrease in qe and ApH that occurs as NADP is depleted is only transitory and, within a few minutes, ApH is again increased [8]. This is again seen clearly in Fig. 5B. The length of time required is a function of the amount of added ADP (Fig. 7). This increase in ApH occurs in the absence of net 0 2 evolution, and the delay in its occurrence may reflect the time required for electron transport (either cyclic or pseudocyclic) to phosphorylate the ADP remaining after depletion of NADP. It is noticeable that at t there is a decrease in the slow

rate of 0 2 uptake. This could implicate photosyn- thetic control over 02 uptake which would imply that the true rate (rather than net 02 change) of pseudocyclic flow is high enough to be limited by ApH.
Discussion
In this paper it is shown how quenching of chlorophyll fluorescence, by a combination of qe and %, can generate fluorescence transients of the kind observable during the first 20 s after il- luminating leaves. The transients observed in the in vitro system are dependent on the initial levels of NADP, ADP and phosphate, as well as on the light intensity and ferredoxin concentration. In general, these factors influence the fluorescence in two ways. Firstly, the fluctuations in A pH (and %) will depend on electron transfer-driven H + uptake and H + release through phosphorylation of ADP. The former will be influenced by light inten- sity and ferredoxin level in terms of rate, but by the initial level of NADP in terms of amount. The latter will depend upon the initial level of ADP and Pi. Thus, at S, H + pumping is maximal as is H + utilization by ATP synthesis. At M, H + pump- ing is decreased as non-cyclic electron flow ceases, whereas ATP synthesis can continue at a rate determined only by the ApH and the availability of ADP and P~. Hence ApH will decrease during the S-to-M rise. Subsequently, the slower rate of H + pumping can again give rise to a higher ApH as ADP becomes depleted and H + utilization de- clines as the phosphorylation potential imposes a limitation upon the rate of ATP synthesis. Sec- ondly, the redox state of Q will depend on the balance between light input and its reoxidation by electron transport. Again consideration of both capacity (e.g., the NADP pool size) and rate (e.g., ferredoxin level) is important. The position of the M peak will always depend on the time taken to reduce the NADP pool, but the actual shape of the induction curve, under conditions when rate is limited by light input or by electron-transport capability will be quite different. For instance, a higher P value is seen when the system is electron transfer limited rather than light limited. A crucial consideration, then, is always the balance between light input and electron-transfer capacity. Redox
409
and energy states are of course not unrelated since, whilst the energy state is a consequence of the redox activity, the rate of electron transfer is sub- ject to control by ApH. For instance, when NADP > ADP, photosynthetic control restricts the rate of NADP reduction such that qQ may be low but q~ high, whereas when ADP > NADP the converse may occur.
The reconstituted system is, of course, different from an in vivo situation, and as such it would be inappropriate to use the data presented here as proof that the in vivo PSMT transient has the same basis. Thus, in leaves the much larger M-to-T phase seen in vivo is associated with Q oxidation as the rate of photosynthetic carbon assimilation increases to a maximum value [2-5]. Nevertheless, in leaves it is likely that at the onset of illumina- tion there exists an endogenous pool of NADP and ADP, which would be consumed during the first few seconds of illumination. Initial 'bursts' of oxygen evolution accompany the PSMT transient in protoplasts (Quick, P. and Horton, P., unpub- lished data) and leaves (Prinsley, R.T. and Heath, R.L., unpublished data). In the leaf, pool sizes (as opposed to concentration) will be much smaller than in the reconstituted system and the events would be expected to be more rapid; in general, the PSM phase in vivo is over within 10-20 s [2]. In addition, the dynamic pool sizes have to be considered, because even during the induction phase there will be some turnover of ATP and NADPH due to reduction of phosphoglycerate to glyceraldehyde phosphate. An additional factor that would result in a more exaggerated P-to-S quenching phase in vivo would be the regulatory properties of ferredoxin-NADP reductase [11]. Thus, a P value approaching F m is often seen in vivo, even under low light [2], perhaps because initially the reductase is inactive. As A pH develops and stromal alkalinization occurs, the reductase is activated and Q will become re-oxidised. In the reconstituted system described, an optimum pH is used such that the reductase will be active im- mediately. In fact, direct measurement of NADPH production has indicated no lag upon illumination (Horton, P., unpublished data).
The above hypothesis, however, suggests a feasible analytical aproach to in vivo study; thus, whilst at present techniques do not allow biochem-

410
ical assay of metaboli te transients on a time scale of seconds, assay of the chloroplast N A D P / N A D P H and A T P / A D P . Pi and key cycle inter- mediates prior to il lumination is possible, and would allow exploration of the relationship be- tween these and the kinetics of induction. More- over, it would predict that pre-treatments which alter redox state (e.g., anaerobiosis or inhibition of respiration) or the phosphoryla t ion potential (e.g., sequestering of Pi) would alter the in vivo PSM transient in characteristic ways.
Acknowledgements
This work was supported by a grant f rom the U.K. Agricultural Research Council. I wish to thank Mrs, S. Anderson and Miss P. Lee for technical assistance and Professor D.A. Walker, Dr. D. Crowther, Dr. M. Sivak, Dr. R.L. Heath and Mr. P. Quick for discussion.
References
1 Van der Veen, R. (1951) Physiol. Plant. 4, 486-494 2 Bradbury, M. and Baker, N.R. (1981) Biochim. Biophys.
Acta 653, 542-551 3 Walker, D.A. (1981) Planta 153, 273-278 4 Walker, D.A., Horton, P., Sivak, M. and Quick, W.P. (1983)
Photobiochem. Photobiophys. 5, 35-39 5 Sivak, M.N. and Walker, D.A. (1983) Proc. R. Soc. B 217,
393-404 6 Walker, D.A., Sivak, M.N., Prinsley, R.T. and Cheesbrough,
J. (1983) Plant Physiol., in the press 7 Krause, G.H., Vernott, C. and Briantais, J.-M. (1982) Bio-
chim. Biophys. Acta 679, 116-124 8 Horton, P. (1983) Proc. R. Soc. B 217, 405-416 9 Horton, P. and Foyer, C. (1983) Biochem, J. 210, 517-521
10 Carver, K.A., Hope, A.B. and Walker, D.A. (1983) Bio- chem. J. 210, 273-276
11 Carrillo, N., Lucero, H.A. and Vallejos, R.H. (1981) J. Biol. Chem. 256, 1058-1059