effects of climate change on heating and cooling degree ... · beijing 100081, pr china ... moss et...
TRANSCRIPT

CLIMATE RESEARCHClim Res
Vol. 67: 135–149, 2016doi: 10.3354/cr01360
Published February 24
1. INTRODUCTION
Warming of the climate system is unequivocal,globally ~0.85°C (0.65 to 1.06°C) over the period of1880 to 2012 (IPCC 2013). Continued emissions ofgreenhouse gases (GHGs) will cause further warm-ing, with a projected temperature increase of 0.3 to4.8°C by the end of the century (2081−2100) relativeto the present day (1986−2005) (IPCC 2013). Signifi-cant warming in the last decades has also occurred in
China, as in other parts of the world, at a larger ratethan the global mean (e.g. Zhai & Pan 2003,CCSNARCC 2011).
Changes in temperature strongly affect energyconsumption for heating and cooling in the house-hold sector, which accounts for nearly 20% of thetotal energy consumption in China (SSB 2013).Warmer climate conditions are expected to lead to adecrease in energy demand in winter and an in -crease in summer. The simplest way to estimate the
© The authors 2016. Open Access under Creative Commons byAttribution Licence. Use, distribution and reproduction are un -restricted. Authors and original publication must be credited.
Publisher: Inter-Research · www.int-res.com
*Corresponding author: [email protected]
Effects of climate change on heating and coolingdegree days and potential energy demand in the
household sector of China
Ying Shi1, Xuejie Gao2,*, Ying Xu1, Filippo Giorgi3, Deliang Chen4
1National Climate Center, China Meteorological Administration, Zhongguancun Nandajie 46, Haidian District, Beijing 100081, PR China
2Climate Change Research Center, Institute of Atmospheric Sciences, Chinese Academy of Sciences, Huayanli 40, Chaoyang District, Beijing 100029, PR China
3The Abdus Salam International Centre for Theoretical Physics, PO Box 586, Trieste 34100, Italy4Department of Earth Sciences, University of Gothenburg, PO Box 460, 40530 Gothenburg, Sweden
ABSTRACT: Future changes of heating and cooling degree days (HDD and CDD) in the 21st cen-tury over mainland China are projected with a regional climate model to investigate the potentialeffects of climate change on energy demand in the household sector. Validation of the model showsa good performance in reproducing the spatial distribution, magnitude and interannual variabilityof the present day HDD and CDD. Significant decreases in HDD and increases in CDD are pro-jected under the warming. These are further weighted by population projections for a first-orderassessment of future changes in energy demand. A larger decrease in population-weightedregional mean HDD compared to the increase in CDD is projected, indicating a decrease of about15% in potential energy demand for different periods and scenarios in the future. In addition, thesimulations show a marked spatial heterogeneity in the change in energy demand. Specifically, wefind increases in both heating and cooling demand in parts of northern China due to the increasedpopulation there, an increase in cooling demand in the south and decreases in heating demand inthe northernmost and western regions. Furthermore, a seasonal shift occurs, with increasingdemand in summer and a decrease in winter. Finally, when the future reference temperatures forhousehold heating and cooling change from standards currently used in China to values closer tothose in Europe and the USA, potentially large increases in energy demand (~80%) are expected,illustrating the importance of policy decisions concerning household heating and cooling.
KEY WORDS: Climate change · Regional climate model · Heating and cooling degree days ·China
OPENPEN ACCESSCCESS

Clim Res 67: 135–149, 2016
relationship between household energy consumptionand temperature is through the concept of degreeday, and specifically heating and cooling degreedays (HDD and CDD, respectively, e.g. Quayle &Diaz 1980). This concept has been widely used toestimate energy demand in climate change studies atboth global and regional scales (e.g. Kadioglu & Sen1999, Christenson et al. 2006, Isaac & van Vuuren2009, Wang et al. 2010, Rehman et al. 2011). Analysisof HDD and CDD has also been conducted for China,mostly for individual cities or small areas (Chen et al.2007, Li et al. 2010, Tan et al. 2012). Limited studieshave been carried out covering the whole country, inparticular for investigating future changes in energyconsumption under global warming conditions (Renet al. 2009, You et al. 2014).
Regional climate models (RCMs) can be especiallyuseful tools to study the response of HDD and CDD toglobal warming over China because they can simu-late the regional climate detail associated with localcomplex topographical features and the uniqueweather and climate systems of the region (e.g. theEast Asian monsoon) (e.g. Gao et al. 2001, 2012, Zhou& Yu 2006, Ju et al. 2007, Li & Zhou 2010, Yu et al.2010). Therefore, in this study, we present an analy-sis of the future changes in HDD and CDD overChina based on climate projections conducted with ahigh-resolution RCM under 2 representative concen-tration pathways (RCPs) (the high-level RCP8.5 andmid-level RCP4.5; Moss et al. 2010). We analyze the21st century future periods 2046 to 2065 (mid-cen-tury) and 2080 to 2099 (end-of-century) with respectto the ‘present day’ period 1986 to 2005, and in par-ticular, we focus on the mid-21st century underRCP4.5 and end of the century under RCP8.5 to pres-ent low and high ends of the range of future changesin our simulations.
As a further step in the study, the climate data areweighted by population density data at 0.5° by 0.5°degree resolution. This enables us to assess not onlythe total future energy demand in the household sec-tor according to the climatological indicators (HDDand CDD) but also its modulation by the present andprojected population distribution. Such analysis canindeed provide important indications of significantspatial and seasonal shifts in energy demand withinChina, which is important information for the devel-opment of future energy management strategies andpolicies in the country. We stress that our study rep-resents the first attempt in the literature to investi-gate changes in heating/cooling energy demandover China based on high-resolution climate andpopulation data.
2. DATA AND METHODS
2.1. Data
The first step in our analysis is an assessment of themodel performance when reproducing observedCDD and HDD over China under present-day condi-tions. The observational dataset employed for thispurpose is CN05.1 developed by Wu & Gao (2013),which is an augmentation of CN05 (Xu et al. 2009)including a greater number of station observations.The interpolation from station to grid data essentiallyfollows the same approach used in generating theClimatic Research Unit dataset (CRU; New et al.2002), whereby a gridded climatology is first calcu-lated by thin-plate smoothing splines, and then agridded anomaly derived via an angular weightingmethod is added to obtain the final data. CRU, CN05and CN05.1 employ about 200, 750 and 2400 stationsover China, respectively. Comparison of CN05 andCN05.1 with CRU shows basic similarities, with dif-ferences mostly in the areas where new and denserstation data were introduced (e.g. western China andthe Tibetan Plateau). Different spatial resolutions of0.25°, 0.5° and 1° are available in CN05.1, and here,we use the 0.5° resolution to match the resolution ofthe RCM employed in the study. CN05 and the up -dated CN05.1 are becoming increasingly popular inmodel validation analyses over China (e.g. Gao et al.2011, Wu et al. 2012, Guo & Wang 2013, Sui et al.2014).
The model simulations are conducted with theAbdus Salam International Centre for TheoreticalPhysics (ICTP) Regional Climate Model v.4, RegCM4(Giorgi et al. 2012), driven by the global modelBCC_CSM1.1 (Beijing Climate Center Climate Sys-tem Model v.1.1; Wu et al. 2010, Xin et al. 2013). TheRegCM4 domain covers continental China and sur-rounding areas with a grid spacing of 50 km, and thesimulation covers the period 1951−2005 for the pres-ent day (with observed GHG concentrations) and2006−2099 for the future under the mid-level RCP4.5and high-level RCP8.5 scenarios, respectively (Mosset al. 2010). A comparison of the RegCM4 and driv-ing GCM simulations can be found in Gao et al.(2013), which shows remarkable improvements byRegCM4 in reproducing the present day climate overthe region compared to the driving GCM. Specifi-cally, the GCM simulation exhibits a general coldbias in the range of 1.0 to 2.5°C in eastern China andup to 10.0°C cold or warm biases in the complextopography areas of western China. Conversely, inthe RegCM4 simulations, the temperature bias in
136

Shi et al.: Degree days and energy demand in China
eastern China decreases to values mostly within±1.0°C, and only a cold bias of ~2.5°C is found overthe Tibetan Plateau. The model data are bilinearlyinterpolated into a regular 0.5° by 0.5° latitude-longi-tude grid to match the observation grid.
2.2. Degree days
A degree day is defined as the difference betweenmean daily temperature and a given reference tem-perature. For metrics designed to reflect the energydemand to heat/cool a building, the reference tem-perature is considered to be a human comfort tem-perature. While a reference temperature values of18°C for heating and 22°C for cooling are widelyused (e.g. Roltsch et al. 1999, Isaac & van Vuuren2009, Spinoni et al. 2015), these references varyacross countries depending on the level of economicdevelopment, general characteristics of the build-ings, climatic conditions, etc. In China, the currentpolicy for the starting/ending dates of room heating(DSH and DEH), which can be dated back to the1950s, states that only rooms in northern China areheated to a reference temperature of 18°C, and theDSH and DEH are decided by the local governmentsin the cites and counties at the provincial level. Thus,tens of DSH and DEH may exist in the country.
The heating policy can be summarized as follows:(1) only areas with >90 d of temperature <5°C can beheated (to the reference value of 18°C); (2) the heat-ing starts/ends when the temperature is lower/greater than 5°C for a continuous 5 d period in anannual cycle from 1 September to 31 August. Here,we use the above standards to define the areas andperiods of heating for all provinces and municipali-ties and assume that these will remain unchanged inthe future. (Note that the calculation of HDD followsthe annual cycle from 1 September to 31 Augustinstead of the calendar year.) Conversely, coolingdays occur when the out-door air temperature ex -ceeds 26°C, following the Code for Design of HeatingVentilation and Air Conditioning (GB50019-2003)(MCPRC 2003). In this case, we assume that coolinglowers the room temperature to the reference valueof 26°C.
Thus, HDD and CDD in a given year are defined asfollows:
(1)
where n is the number days in the year (365 or 366),Ti is daily mean temperature for day i, Tb1 and Tb2 arethe reference temperatures for heating (18°C) andcooling (26°C), respectively, and rd is equal to 1 if Ti
is lower than Tb1 (reference temperature for heating)or higher than Tb2 (reference temperature for cool-ing) and is equal to 0 otherwise.
Note that the HDD (CDD) calculated followingthese policies are substantially lower (higher) thanfor policies adopted in Europe (Spinoni et al. 2015)and the USA (Roltsch et al. 1999) (typically with a ref-erence temperature of 18°C for heating and 22°C forcooling and right after the temperature passes thisthreshold) and will likely change in the future follow-ing further economic development in China. Forexample, currently people in southern China oftendo not heat their rooms, although temperature maydrop to 0°C in winter, mainly because the govern-ment, following the policy described above, does notprovide subsidies for heating (MCPRC 2003, Chen etal. 2007). Thus, to test the importance of the refer-ence temperature, we also present a sensitivity ana -lysis of the HDD and CDD calculation using a refer-ence temperature of 18°C for heating and 22°C forcooling (hereafter referred to as HDD18 and CDD22,respectively).
2.3. Weighting by population
Energy demand in the household sector is relatedto both climate and population density. Thus, in orderto assess the impact of warming on energy demand,the geographically varying values of HDD and CDDare weighted by the corresponding population in thesame half-degree grid box. The population weightedHDD and CDD, referred to as HDDP and CDDP,should thus describe more realistically the regionaldistribution of energy demand (e.g. Quayle & Diaz1980, Guttman 1983, Labriet et al. 2015). For presentday and future population distribution, we use thedataset developed by the International Institute forApplied System Analysis (IIASA) (Riahi & Naki -cenovic 2007; GGI Scenario Database v.2.0, availableat www.iiasa.ac.at/Research/GGI/DB/). This datasetprovides population density on a 0.5° × 0.5° (longi-tude-latitude) grid rather than at the country orregional level (e.g. Lutz et al. 2008, Chen & Liu 2009,UNFPA 2010).
The distribution of present-day mean populationover China from the IIASA dataset is presented inFig. 1a. The population is unevenly distributed due tothe complex natural features and economic condi-
( ) (if DEH DSH 90)
( )
11
21
HDD rd T T
CDD rd T T
b ii
n
i bi
n
∑
∑
= − − >
= −
⎧
⎨⎪⎪
⎩⎪⎪
=
=
137

Clim Res 67: 135–149, 2016
tions of the country, with higher density in the plainsof southern and eastern China and lower density inthe mountainous west, except the Sichuan Basin inthe southwest.
Three scenarios of population growth are providedin the dataset: A2 for high, B2 for medium and B1 forlow growth. We consider A2 for our high-end RCP8.5scenario and B1 for the low-end RCP4.5. Futurechanges of total population in China are reported inFig. 1b, showing continuous growth for A2 andgrowth followed by a decline in the B1. Populationtotals for China at the end of the 21st century in theA2 and B1 scenarios are 1.689 and 0.716 billion,respectively, slightly higher than the high-variant(1.554 billion) and low-variant (0.612 billion) of thelatest United Nation population estimation (United
Nations 2015). The spatial distribution of the popula-tion changes in the mid 21st century under B1 andthe end of the century under A2 are presented inFig. 1c,d, respectively. The changes show similar pat-terns characterized by the shift of population towardsthe more developed regions of North China, theYangtze River valley, Sichuan Basin and southerncoastal areas.
The HDDP and CDDP in each of the 0.5° grid boxare normalized by the total population of China andthen added up to obtain a total for its 31 provinces.We assume that, on average, each person needs thesame amount of energy based on the HDD or CDDregardless of the individual economic conditions andlife styles, an assumption that, admittedly, in somecases could be unrealistic.
138
Fig. 1. Population density in China. (a) ‘Present day’ (1986−2005); (b) mean population in China for the period 2006−2100; (c)population change for the B1 mid 21st century (2046−2065); (d) population change for the A2 end of 21st century (2080−2099).Units are thousands per 0.5° × 0.5° grid in (a), (c) and (d). Data are from the International Institute for Applied Systems Analysis
(Riahi & Nakicenovic 2007)

Shi et al.: Degree days and energy demand in China
3. RESULTS
3.1. Validation of the climate model
Fig. 2 shows the HDD and CDD over China for theperiod 1986 to 2005 in the observations and simula-tions, along with the difference between the modelsimulation and observations (or model bias). RegCM4generally reproduces the observed spatial distributionand magnitudes of both HDD and CDD over the re-gion, with spatial correlation coefficients betweensimulated and observed data of 0.96 and 0.92, respec-tively (both statistically significant at the 95% confi-dence level). However, some significant biases are alsoevident. The model underestimates HDD by >500°Dover parts of the Northeast and Northwest China(Fig. 2e) because of a warm model bias over high-lati-tude areas in the cold season (Zhang et al. 2008).HDD is somewhat overestimated over the TibetanPlateau due to a cold bias there (Gao et al. 2013), butwe note that the regions of maximum model error include only very sparse population (Fig. 1a).
Concerning CDD, the simulation captures the ob-served pattern of 0 values in the Tibetan Plateau andsurrounding areas as well as the large values in east-ern China and the basins of the Northwest (Fig. 2b,d).Over the most populated eastern China regions, themodel shows a positive CDD bias (overestimation ofup to 100°D) in the northern portions, extending fromNorth China to the Huanghuai area. Conversely, theCDD is underestimated over southern China (Fig. 2f).In general, the model shows a poorer performance insimulating the high-end warm events compared tothe cold events, as reported by the previous studies ofZhang & Shi (2012) and Ji & Kang (2015).
Annual cycles of the regional mean HDD and CDDfrom observations and simulation over China are pre-sented in Fig. 2g. Because China is mainly located inthe mid and high latitudes, much larger HDD valuesare found than CDD. The HDD values are >500°Dduring November to February, with a maximum inJanuary, and drop to a few tens of °D in the summermonths. The mean CDD over China is much smaller,with values around 10°D in June to August both inthe observations and model simulation. The modelcaptures the observed seasonal patterns and monthlyvalues reasonably well, with overestimations of HDDin most months mainly due to the bias over the Ti-betan Plateau and its surrounding areas (Fig. 2e).
Fig. 3 compares observed and simulated present-day interannual variability of HDD and CDD, asmeasured by the interannual standard deviation.Both for HDD and CDD, the model reproduces well
the observed patterns of interannual variability, withpattern correlations of 0.92 and 0.90, respectively.Also, the simulated magnitudes are in line with ob -ser va tions, with HDD maxima over northeast Chinaand the Tibetan Plateau and CDD maxima over east-ern and northwestern China. The most significantdifferences between the model simulation and obser-vations include negative (positive) biases over thenorthern regions (Tibetan Plateau) for HDD and pos-itive (negative) biases in northern China (southernChina) for CDD, respectively.
We also calculated the trend in HDD and CDD dur-ing the present-day 1986−2005 period. When aver-aged over the whole China territory, the observationsshow a trend of −106°D for HDD and 7°D for CDD,while the model simulates a mean trend of −52°D and1°D, respectively. Therefore, the model captures thesign of the trends but underestimates the magnitude.The pattern correlations between the observed andsimulated trends are 0.51 (statistically significant atthe 95% confidence level) for HDD and 0.27 (not sta-tistically significant) for CDD.
In summary, the validation analysis presented inthis section shows that the model reproduces reason-ably well the observed spatial pattern, annual cycles,and interannual variability of both HDD and CDD,although biases over some regions are present. Themodel also reproduces the spatial pattern of thetrends in HDD but shows a poorer performance forthe CDD trend.
3.2. Future changes of temperature
The spatial distribution of projected temperaturechanges in winter (December-January-February, DJF)and summer (June-July-August, JJA) for the RCP4.5mid-21st century and RCP8.5 end of century are pre-sented in Fig. 4. Annual changes of HDD and CDDare mostly affected by the temperature changes inDJF and JJA, respectively, and, as mentioned, the 2time slices in Fig. 4 provide the lower and upper endsof the responses analyzed here. The temporal evolu-tion of the regional mean temperature changes in the21st century is also provided in the figure.
As shown in Fig. 4, substantial warming is found inboth seasons and future periods. The warming ismostly in the range of 1.0 to 2.0°C in the mid-21stcentury under RCP4.5, except for a larger value of 2.0to 2.5°C over the southern and eastern regions of theTibetan Plateau in DJF (Fig. 4a,b). Regional meanchanges of temperature in DJF and JJA averagedover China for the RCP4.5 mid-21st century are 1.5
139

Clim Res 67: 135–149, 2016140
Fig. 2. Mean observed (a) heating degree days (HDD) and(b) cooling degree days (CDD), mean simulated (c) HDD and(d) CDD, bias (model minus observed) of (e) HDD and (f)CDD, and (g) annual cycle of the China-mean HDD andCDD in the present day (1986−2005). Gray in (a−f): no heat-ing or cooling. Most of the colored areas in (e) and (f) and thehistograms highlighted with a blue (red) star for HDD (CDD)
in (g) are statistically significant at 95% confidence level

Shi et al.: Degree days and energy demand in China
and 1.4°C, respectively. The warming is much morepronounced in the RCP8.5 end of century scenario,ranging from 2.5 to 6°C (Fig. 4c,d). The largest warm-ing (>5°C) is found in northeast China and the south-ern part of the Tibetan Plateau in DJF, along with the
Hetao area in northern China in JJA. Greater warm-ing is found in DJF than JJA, with China mean valuesof 4.2 and 3.8°C, respectively. In general, larger tem-perature increases in the high-latitude and high-ele-vation areas (Tibetan Plateau and the mountains) are
141
Fig. 3. Interannual variability as measured by the interannual standard deviation for the present day period (1986−2005).Observed (a) HDD and (b) CDD; simulated (c) HDD and (d) CDD; and simulated minus observed (e) HDD and (f) CDD.
Gray in (a–f): no heating or cooling

Clim Res 67: 135–149, 2016
found in the annual mean changes (figures notshown; see Gao et al. 2013 for more detail).
The greater warming in DJF can also be observedwhen comparing Fig. 4e,f. The temperature increaseunder RCP8.5 is almost linear throughout the 21stcentury, with linear trends for DJF and JJA of 0.47
and 0.44°C decade−1, respectively. A temperaturestabilization is found under the RCP4.5 scenario inthe second half of the century, with overall centurytrends of 0.23 (DJF) and 0.16°C decade−1 (JJA),respectively. All the changes in Fig. 4 are statisticallysignificant at the 95% confidence level.
142
Fig. 4. Temperature changes over China compared to 1986−2005 (°C). (a) DJF and (b) JJA for RCP4.5 mid-century(2046−2065); (c) DJF and (d) JJA for RCP8.5, end of century (2080−2099); (e) DJF and (f) JJA for the China average duringthe 21st century. Parentheses: trends of changes (unit: °C 10 yr–1). The changes are all significant at 95% confidence level

Shi et al.: Degree days and energy demand in China
3.3. Future changes of HDD and CDD
The spatial distributions of the projected changes inHDD and CDD for the RCP4.5 mid-21st century andRCP8.5 end of century are presented in Fig. 5. A pre-dominant decrease of HDD is projected in the future,larger in the high-latitude and high-elevation areaswith cold climate conditions, consistent with the maxi-mum warming there. The decrease of HDD for theRCP8.5 late 21st century is clearly much larger thanthe mid-century RCP4.5, e.g. in the range of 500 to750 (mid-century RCP4.5) and 1000 to 1500°D (end ofcentury RCP8.5) over most of the Northeast. Thelargest decreases in HDD, with maxima of up to −1000and −2000°D, are found over the Tibetan Plateau.
An increase of CDD throughout the 21st century isfound over most of China except over the cold or coolregions of the Tibetan Plateau and some other moun-tainous regions (Tianshan Mountain in the northwestand Changbai Mountain in the northeast) (Fig. 5c,d).
In eastern China, CDD increases mostly in the rangeof 100−250 and 250−500°D for the 2 time slices arefound in the area extending from northern China tothe southern extent of the Yangtze River Basin andin Hua’nan. Larger increases are mainly found in thebasins of western China, most notably in the heavilypopulated Sichuan Basin.
The temporal evolution of mean HDD and CDDchanges over China under the RCP4.5 and RCP8.5scenarios are presented by the solid lines in Fig. 6. Ingeneral, the changes in HDD and CDD show smalldifferences between RCP4.5 and RCP8.5 before the2040s, in agreement with the low scenario depend-ence of climate change in the early 21st century(IPCC 2013). The changes are more pronouncedunder the RCP8.5 compared to RCP4.5 in latter halfof the century, and the decrease in HDD is muchlarger than that of CDD. In the latter part of the cen-tury, the decrease and increase in HDD and CDD,respectively, stabilize at ~450°D and 30°D in the
143
Fig. 5. Change of (a,b) HDD and (c,d) CDD compared to 1986−2005. (a) HDD and (c) CDD for RCP4.5 mid-century (2046−2065);(b) HDD and (d) CDD for RCP8.5 end of century. Gray: no heating or cooling. In all colored areas, the changes are significant at
95% confidence level, except when they are <5°D in (c)

Clim Res 67: 135–149, 2016
RCP4.5 scenario, while the changes are almost linearin RCP8.5, reaching values of up to −1100°D and100°D, respectively, following the design of the sce-narios (Moss et al. 2010). The linear trends of theHDD decrease are much larger (by a factor of ~10)compared to the trends of CDD increase under bothscenarios.
3.4. Changes of population weighted HDDand CDD
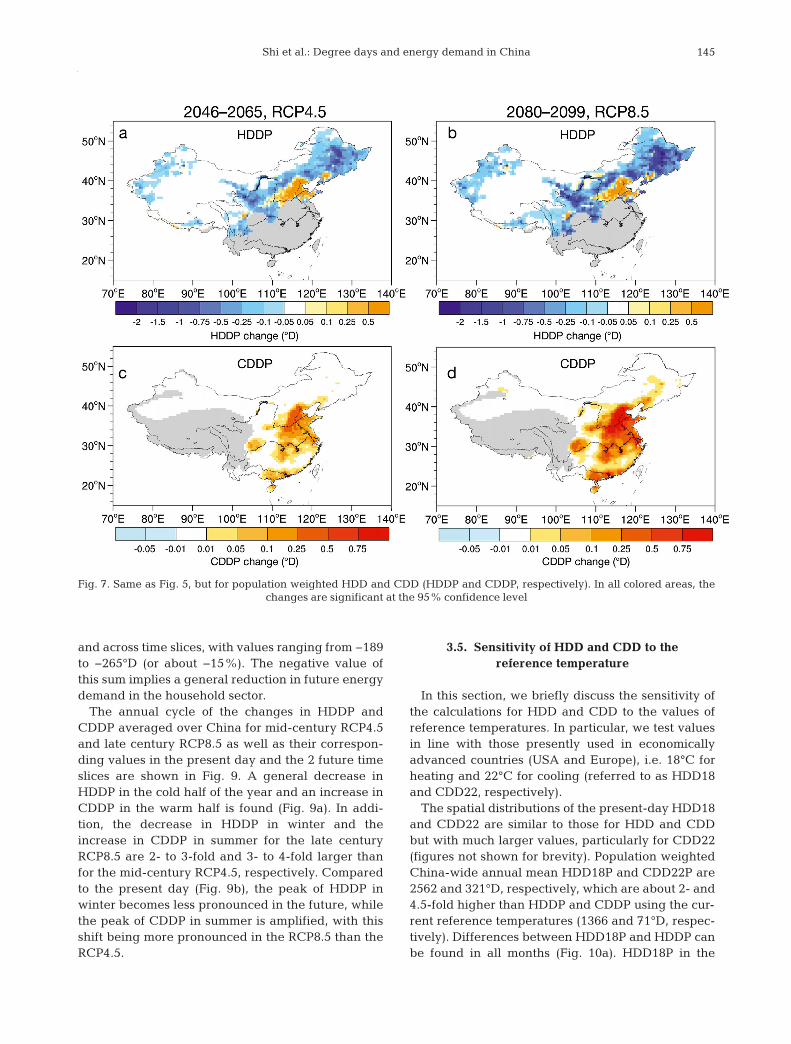
We now turn our attention to the effect ofpopulation weighting on the CDD and HDD projec-tions. Spatial distribution of the HDDP and CDDPchanges for the mid-century RCP4.5 and late centuryRCP8.5 are presented in Fig. 7. Large differences canbe found when comparing Fig. 7 to Fig. 5. In general,the changes of HDDP and CDDP are more pro-nounced in the regions with higher populationdensity (Fig. 1). For HDDP, the most noticeable differ-ence compared to HDD is the increase in northernChina despite the warming there. This increase isdue to the large future population increase projectedover the region (Fig. 1c,d), which overwhelms the ef-fect of climate change. Northern China is also the re-gion with largest CDDP increase in both mid-centuryRCP4.5 and late century RCP8.5. While the changesfor HDD over the Tibetan Plateau and CDD over thenorthwest are large, much lower changes in HDDPand CDDP can be found over these regions character-ized by very low population density.
When averaged over the differentprovinces, in both scenarios, largedecreases in HDDP and smallerincreases in CDDP dominate overnorthern and western China (Fig. 8);however, increases in HDDP arefound in the northern provinces (cities)of Beijing, Tianjin, Hebei, Shandongand Henan in eastern China, due tothe population increases there. Theincreases in CDDP over these pro -vinces are even more pronouncedthan in southern China due to thecompounded effect of summer warm-ing and population increase, indicatinga strong increase of energy demandover these regions.
Regional mean HDDP and CDDPchanges over China in the 21st cen-tury are given by the dashed lines inFig. 6. The trends in general follow the
un-weighted HDD and CDD (solid lines) ones, butthe population weighting dramatically affects the rel-ative magnitude of the HDDP and CDDP changes. Infact, while before the weighting the decrease in HDDis much larger than the increase in CDD, after thepopulation weighting the 2 trends are more similar inmagnitude. For example, in the RCP8.5 scenario, thedecrease in HDD and increase in CDD change from1000 and 100°D, respectively, in the un-weightedcase to around 500 and 300°D after the weighting.This is because the areas undergoing the increase inCDD, mostly warm areas in the plains, are ex pectedto undergo much more pronounced populationgrowth than those exhibiting a decrease in HDD(cold and mountainous areas).
Changes in HDDP and CDDP for the mid- and late21st century over the whole of China, expressed indegree days and percent of present day values, areprovided in Table 1. The changes in HDDP are 3-foldhigher than the changes in CDDP in the mid-centuryunder the 2 scenarios and in the late century underRCP4.5, but only 2-fold higher in the late centuryRCP8.5. By the end of the century, HDDP decreasesby about 23 and 39%, while CDDP in creases by factors greater than 1.3 and 3.7 under RCP4.5 andRCP8.5, respectively. Therefore, mitigation from thehigher emission scenario RCP8.5 to the lower RCP4.5shows more effect on CDDP (thus the cooling energydemand) than HDDP, mostly as a result of thechanges in population densities. It is interesting tonote that the sum of HDDP and CDDP shows onlyrelatively small differences between the 2 scenarios
144
Fig. 6. Changes of HDD and CDD averaged over China in the 21st century(2006−2099). The solid lines are before and dashed lines are after the popula-tion weighting. The trends of the changes are presented in parentheses
(unit:°D decade−1; all significant at 95% confidence level)
Shi et al.: Degree days and energy demand in China
and across time slices, with values ranging from −189to −265°D (or about −15%). The negative value ofthis sum implies a general reduction in future energydemand in the household sector.
The annual cycle of the changes in HDDP andCDDP averaged over China for mid-century RCP4.5and late century RCP8.5 as well as their correspon-ding values in the present day and the 2 future timeslices are shown in Fig. 9. A general decrease inHDDP in the cold half of the year and an increase inCDDP in the warm half is found (Fig. 9a). In addi-tion, the decrease in HDDP in winter and theincrease in CDDP in summer for the late centuryRCP8.5 are 2- to 3-fold and 3- to 4-fold larger thanfor the mid- century RCP4.5, respectively. Comparedto the present day (Fig. 9b), the peak of HDDP inwinter be comes less pronounced in the future, whilethe peak of CDDP in summer is amplified, with thisshift being more pronounced in the RCP8.5 than theRCP4.5.
3.5. Sensitivity of HDD and CDD to thereference temperature
In this section, we briefly discuss the sensitivity ofthe calculations for HDD and CDD to the values ofreference temperatures. In particular, we test valuesin line with those presently used in economicallyadvanced countries (USA and Europe), i.e. 18°C forheating and 22°C for cooling (referred to as HDD18and CDD22, respectively).
The spatial distributions of the present-day HDD18and CDD22 are similar to those for HDD and CDDbut with much larger values, particularly for CDD22(figures not shown for brevity). Population weightedChina-wide annual mean HDD18P and CDD22P are2562 and 321°D, respectively, which are about 2- and4.5-fold higher than HDDP and CDDP using the cur-rent reference temperatures (1366 and 71°D, respec-tively). Differences be tween HDD18P and HDDP canbe found in all months (Fig. 10a). HDD18P in the
145
Fig. 7. Same as Fig. 5, but for population weighted HDD and CDD (HDDP and CDDP, respectively). In all colored areas, the changes are significant at the 95% confidence level

Clim Res 67: 135–149, 2016
winter months (from November toMarch) is ~2-fold greater than HDDP,and the differences between HDD18Pand HDDP can be even larger in theseasonal transition months. CDD22Pin JJA is 4- to 8-fold higher thanCDDP and is also larger in the transi-tion months.
The annual cycle of the changesin HDD18P/ CDD22P averaged overChina in the future compared to thepresent-day HDDP/CDDP, i.e. assum-ing that in the future the heating andcooling policies in China will be simi-lar to those currently used in Europeand the USA, is shown in Fig. 10b.Compared to the changes of HDDPand CDDP (Fig. 9a), the most impor-tant effect of the future implementa-tion of the different heating and cool-ing reference temperatures is that thechange in heating demand becomespositive in all months. A much greaterincrease in cooling demand is also evi-dent when comparing future CDD22Pwith present CDDP for both scenarios.As a result, the sum of the HDD18Pand CDD22P changes (compared topresent-day HDDP and CDDP) is positive and in fact rather large andwith relatively small variations across scenarios and time slices: 1077 to1121°D (or ~80%) (Table 1). This illus-trative ex ample thus shows how futurechanges in heating and cooling poli-cies can have dominant effects on theoverall energy demand in China.
4. CONCLUSIONS AND DISCUSSION
In this paper, future changes in HDD/HDDP and CDD/CDDP in the 21st centuryover mainland China under different GHGforcing scenarios are investigated using theregional climate model RegCM4 driven bythe BCC_CSM1.1 global climate model. Theclimate indicators are further weighted bypresent day and projected population densi-ties in order to provide a first-order assess-ment of potential energy demand. Our mainconclusions and considerations can be sum-marized as follows:
146
Mid-21st End of 21st century (°D/%) century (°D/%) RCP4.5 RCP8.5 RCP4.5 RCP8.5
HDDP −261/−19 −370/−27 −311/−23 −535/−39CDDP 72/101 128/179 95/133 270/379HDDP+CDDP −189/−13 −242/–17 −216/−15 −265/−19HDD18P 749/55 590/43 672/49 312/23CDD22P 422/594 524/738 449/632 745/1049HDD18P+CDD22P 1171/81 1114/76 1121/78 1077/75
Table 1. Changes in the annual mean HDDP, HDD18P and CDDP,CDD22P in the mid (2046−2065) and end (2080− 2099) of the 21st cen-tury under RCP4.5 and RCP8.5 relative to the present day (1986−2005)
HDDP and CDDP over China
Fig. 8. Changes in HDDP and CDDP in different provinces (scale at left ofpanel) and the whole country (marked with CN) for (a) RCP4.5 mid-century(2046 −2065) and (b) RCP8.5 end of century (2080−2099). Asterisks indicate
significance at the 95% confidence level

Shi et al.: Degree days and energy demand in China
(1) The model can reproduce well the present-daymean climatology, seasonal cycle, and interannualvariability of HDD and CDD over China, along withthe trend of HDD during the present day period. Alower performance is found for the present-day trendofCDDover theregion.Moregenerally,abettermodelperformance is found for HDD compared to CDD.
(2) A substantial decrease in HDD and increase inCDD is found in the future in response to the GHG- induced warming, with more pronounced changesunder the RCP8.5 than the RCP4.5 scenario, in partic-ular during the second half of the 21st century. Whenaveraged over the whole of China, the de crease inHDD is larger than the increase in CDD; however,there is a distinct regional variability in these trends.For example, over eastern China, the change in HDDshows a latitudinal distribution with a larger decreasein the north. The increase in CDD is more pronouncedin the eastern plain areas and the southern coasts.
(3) Population weighting substantially affects thechanges in HDD and CDD, even reversing its sign
over some regions of northern China, where bothHDDP and CDDP increase. This illustrates the impor-tance of adding a metric of exposure (in this casepopulation density) to estimates of climate changeimpacts on energy demand.
(4) Assuming the same energy demand for changesin HDDP and CDDP, the future total energy con-sumption in China in the household sector shows adecrease of about 15%. However, while most of thecold part of the country benefits from a lower energyuse for heating, the southern part experiences anincrease in energy demand for cooling. This will leadto the need for additional transport of coal, oil, andelectricity, etc., from the north to the south. Energyconsumption will also show changes in seasonal dis-tribution, with greater demand in the summer andlower in the winter.
(5) For our calculations of HDDP and CDDP, weused the standards that are currently used in China,with heating restricted to northern China and start-ing only when the temperature drops to 5°C, and
147
Fig. 10. Annual cycle of (a) China-mean HDDP, HDD18P and CDDP, CDD22P (see text) for the present day period (1986−2005)and (b) future changes of HDD18P and CDD22P compared to present day HDDP and CDDP, respectively, for the RCP4.5 mid-century (2046−2065) and RCP8.5 end of century (2080−2099) periods. The changes are all significant at the 95% confidence level
Fig. 9. Annual cycle of (a) China-mean changes of HDDP and CDDP in the mid (2046−2065) and end (2080−2099) of the 21stcentury and (b) HDDP and CDDP for the present day (1986−2005), RCP4.5 mid-21st century and RCP8.5 end of 21st century.
The changes are all significant at the 95% confidence level

Clim Res 67: 135–149, 2016
cooling starting when temperatures exceed 26°C.With economic growth, these reference temperatureswill most likely move closer to the values currentlyused in economically advanced countries, 18°C and22°C for heating and cooling, respectively. Sen -sitivity of the HDD18P and CDD22P calculations tothe use of these values shows that potentially largeincreases in energy demand (~80%) are expected inthe future in China under this scenario of change inreference temperature, illustrating the dominant rolethat changes in policy can have regarding energydemand.
Our results have important implications for energymanagement policies in the country. Clearly, theissue of future energy demand due to changes inHDD and CDD is complex and multifaceted, with astrong dependence on the spatial variability of cli-mate change and population dynamics. Due to thelimited scope of this paper, we only focused on asmall number of RCM simulations available with 1model. More studies are thus needed to better ad -dress the uncertainties in the climate scenario projec-tions through ensembles of RCM simulations. Inaddition, we adopted simple assumptions for therelation between degree days, population andenergy demand. However, there is the need to meas-ure the direct relation between degree days andenergy consumption (Isaac & van Vuuren 2009) andto better account for future changes in economic con-ditions and population amount and distribution(Isaac & van Vuuren 2009). Future work will thus goin the direction of providing more comprehensiveassessments of energy demand within a multi-modelframework (e.g. CORDEX; Giorgi et al. 2009) incor-porating more detailed socio-economic components.
Acknowledgements. This research was jointly supported byR&D Special Fund for Public Welfare Industry (meteorology)(GYHY201306019) and National Natural Science Founda-tion of China (41375104).
LITERATURE CITED
CCSNARCC (Committee for China’s Second NationalAssessment Report on Climate Change) (2011) The Sec-ond National Assessment Report on Climate Change.Science Press, Beijing
Chen W, Liu JJ (2009) Future population trends in China: 2005-2050. Monash University, Centre of Policy Studiesand the Impact Project, Melbourne
Chen L, Fang XQ, Li S (2007) Impacts of climate warming onheating energy consumption and southern boundaries ofsevere cold and cold regions in China. Chin Sci Bull 52: 2854−2858
Christenson M, Manz H, Gyalistras D (2006) Climate warm-
ing impact on degree-days and building energy demandin Switzerland. Energy Convers Manag 47: 671−686
Gao XJ, Zhao ZC, Ding YH, Huang RH, Giorgi F (2001) Cli-mate change due to greenhouse effects in China as sim-ulated by a regional climate model. Adv Atmos Sci 18: 1224−1230
Gao XJ, Shi Y, Giorgi F (2011) A high resolution simulationof climate change over China. Sci China Earth Sci 54: 462−472
Gao XJ, Shi Y, Zhang DF, Wu J, Giorgi F, Ji ZM, Wang YG(2012) Uncertainties of monsoon precipitation projectionover China: results from two high resolution RCM simu-lations. Clim Res 52: 213−226
Gao XJ, Wang ML, Giorgi F (2013) Climate change overChina in the 21st century as simulated by BCC_CSM1.1-RegCM4.0. Atmos Ocean Sci Lett 6: 381−386
Giorgi F, Jones C, Asrar G (2009) Addressing climate infor-mation needs at the regional level: the CORDEX frame-work. WMO Bull 58: 175−183
Giorgi F, Coppola E, Solmon F, Mariotti L, Sylla BM, Bi XQ(2012) RegCM4: model description and illustrative basicperformance over selected CORDEX domains. Clim Res52: 7−29
Guo DL, Wang HJ (2013) Simulation of permafrost and sea-sonally frozen ground conditions on the Tibetan Plateau,1981−2010. J Geophys Res Atmos 118: 5216−5230
Guttman NB (1983) Variability of population-weighted sea-sonal heating degree days. J Clim Appl Meteorol 22: 495−501
IPCC (2013) Climate Change 2013: the physical science basis.In: Stocker TF, Qin DH, Plattner GK, Tignor M and others(eds) Contribution of Working Group I to the 5th Assess-ment Report of the Intergovernmental Panel on ClimateChange. Cambridge University Press, Cambridge
Isaac M, van Vuuren DP (2009) Modelling global residentialsector energy demand for heating and air conditioning inthe context of climate change. Energy Policy 37: 507−521
Ji ZM, Kang SC (2015) Evaluation of extreme climate eventsusing a regional climate model for China. Int J Climatol35: 888−902
Ju LX, Wang HJ, Jiang DB (2007) Simulation of the Last Gla-cial Maximum climate over East Asia with a regional cli-mate model nested in a general circulation model.Palaeogeogr Palaeoclimatol Palaeoecol 248: 376−390
Kadioglu M, Sen Z (1999) Degree-day formulations andapplication in Turkey. J Appl Meteorol 38: 837−846
Labriet M, Joshi SR, Vielle M, Holden PB and others (2015)Worldwide impacts of climate change on energy forheating and cooling. Mitig Adapt Strategies GlobChange 20: 1111−1136
Li T, Zhou GQ (2010) Preliminary results of a regional air-sea coupled model over East Asia. Chin Sci Bull 55: 2295−2305
Li XC, Bai ML, Yang J, Yu FM, Di RQ, Ma YF (2010) Impactsof climate warming on energy consumed in heatingperiod in Hohhot. Adv Clim Chang Res 6: 29−34 (in Chinese)
Lutz W, Sanderson W, Scherbov S (2008) The coming accel-eration of global population ageing. Nature 451: 716−719
MCPRC (Ministry of Construction of the People’s Republicof China) (2003) Code for design of heating ventilationand air conditioning (GB50019-2003), 1893−1951.MCPRC, Beijing
Moss RH, Edmonds JA, Hibbard KA, Manning MR and oth-ers (2010) The next generation of scenarios for climate
148
Shi et al.: Degree days and energy demand in China 149
change research and assessment. Nature 463: 747−756New M, Lister D, Hulme M, Makin I (2002) A high-resolu-
tion data set of surface climate over global land areas.Clim Res 21: 1−25
Quayle RG, Diaz HF (1980) Heating degree day dataapplied to residential heating energy consumption. JAppl Meteorol 19: 241−246
Rehman S, Al-Hadhrami LM, Khan S (2011) Annual andseasonal trends of cooling, heating, and industrialdegree-days in coastal regions of Saudi Arabia. TheorAppl Climatol 104: 479−488
Ren YY, Ren GY, Qian HS (2009) Change scenarios ofChina’s provincial climate-sensitive components ofenergy consumption. Geogr Res 28: 36−44
Riahi K, Nakicenovic N (eds) (2007) Greenhouse gases —integrated assessment. Technol Forecasting Soc ChangSpec Issue 74: 873−1108
Roltsch WJ, Zalom FG, Strawn AJ, Strand JF, Pitcairn MJ(1999) Evaluation of several degree-day estimationmethods in California climates. Int J Biometeorol 42: 169−176
Spinoni J, Vogt J, Barbosa P (2015) European degree-dayclimatologies and trends for the period 1951−2011. Int JClimatol 35: 25−36
SSB (State Statistical Bureau) (2013) China Energy Statisti-cal Yearbook 2013. China Statistics Press, Beijing
Sui Y, Lang XM, Jiang DB (2014) Time of emergence of cli-mate signals over China under the RCP4.5 scenario. ClimChange 125: 265−276
Tan BG, Tian Z, Liu KX, Li MC, Guo J, Xiong MM (2012)Annual variation characteristics of degree-days and thetrend analysis in Tianjin. Renew Energy Resour 30: 102−105
UNFPA (United Nations Fund for Population Activities)(2010) State of world population. UNFPA, New York, NY
United Nations (2015) World population prospects: the 2015revision, key findings and advance tables. UN Depart-ment of Economic and Social Affairs, Population Divi-sion, Working Paper No. ESA/P/WP.241, New York, NY
Wang XM, Chen D, Ren ZG (2010) Assessment of climatechange impact on residential building heating and cool-ing energy requirement in Australia. Build Environ 45: 1663−1682
Wu J, Gao XJ (2013) A gridded daily observation datasetover China region and comparison with the other data-sets. Chin J Geophys 56: 1102−1111
Wu TW, Yu RC, Zhang F, Wang ZZ and others (2010) TheBeijing Climate Center atmospheric general circulationmodel: description and its performance for the present-day climate. Clim Dyn 34: 123−147
Wu J, Gao XJ, Giorgi F, Chen ZH, Yu DF (2012) Climateeffects of the Three Gorges Reservoir as simulated by ahigh resolution double nested regional climate model.Quat Int 282: 27−36
Xin XG, Wu TW, Li JL, Wang ZZ, Li WP, Wu FH (2013) Howwell does BCC_CSM1.1 reproduce the 20th century cli-mate change over China? Atmos Oceanic Sci Lett 6: 21−26
Xu Y, Gao XJ, Shen Y, Xu CH, Shi Y, Giorgi F (2009) A dailytemperature dataset over China and its application invalidating a RCM simulation. Adv Atmos Sci 26: 763−772
You QL, Fraedrich K, Sielmann F, Min JZ and others (2014)Present and projected degree days in China from obser-vation, reanalysis and simulations. Clim Dyn 43: 1449−1462
Yu ET, Wang HJ, Sun JQ (2010) A quick report on a dynam-ical downscaling simulation over china using the nestedmodel. Atmos Ocean Sci Lett 3: 325−329
Zhai PM, Pan X (2003) Trends in temperature extremes dur-ing 1951−1999 in China. Geophys Res Lett 30: 1913−1916
Zhang DF, Shi Y (2012) Numerical simulation of climatechanges over North China by the model RegCM3. Chin JGeophys 55: 474−487
Zhang DF, Gao XJ, Ouyang LC (2008) Simulation of presentclimate over China by a regional climate model. J TropMeteorol 14: 19−23
Zhou TJ, Yu RC (2006) Twentieth century surface air tem-perature over China and the globe simulated by coupledclimate models. J Clim 19:5843−5858
Editorial responsibility: Oliver Frauenfeld, College Station, Texas, USA
Submitted: June 10, 2015; Accepted: November 29, 2015Proofs received from author(s): January 26, 2016
➤
➤
➤
➤
➤
➤
➤
➤
➤
➤
➤
➤
➤
➤
➤