effects of control power and inceptor sensitivity on lunar ... · effects of control power and...
TRANSCRIPT
American Institute of Aeronautics and Astronautics
1
Effects of Control Power and Inceptor Sensitivity on
Lunar Lander Handling Qualities
Eric Mueller,* Karl D. Bilimoria,
† and Chad Frost
‡
NASA Ames Research Center, Moffett Field, CA, 94035
A piloted simulation studied the handling qualities for a precision lunar landing task
from final approach to touchdown. A core model of NASA’s Altair Lunar Lander was used
to explore the design space around the nominal vehicle configuration; details of the control
and propulsion systems not available for that vehicle were derived from Apollo Lunar
Module data. The experiment was conducted on a large motion base simulator. Eleven
Space Shuttle and Apollo pilot astronauts and one test pilot served as evaluation pilots,
providing Cooper-Harper ratings, Task Load Index ratings, Bedford workload ratings and
qualitative comments. Following attitude guidance cues, the pilots evaluated control powers
ranging from 1.1 to 4.3 deg/s2, maximum rate commands from 3 to 20 deg/s, which is
equivalent to a range of inceptor sensitivities, and two magnitudes of disturbance moment
arising from propellant slosh. The handling qualities were satisfactory for the highest
control powers and low inceptor sensitivities, with reduced sensitivity both improving
handling qualities and reducing propellant use for a given control power. Pilots used low
attitude rates regardless of the maximum rate available or control power. Propellant slosh
degraded handling qualities approximately one Cooper-Harper Rating.
Introduction
andling qualities are those characteristics of a flight vehicle that govern the ease and precision with which a
pilot is able to perform a flying task.1 They are a manifestation of the interaction between various factors that
influence pilot perception of how well a vehicle can be used to accomplish a desired mission. These factors include
the stability and control characteristics of the bare vehicle, the control systems that enhance these characteristics, the
inceptors (e.g., control column, stick or throttle lever) used by the pilot to transmit control commands, the visual
cues from cockpit windows, displays and instrumentation that provide flight information to the pilot, and other cues
(e.g., aural, tactile) that assist the pilot in the execution of the flying task. The effects of these factors on handling
qualities have been studied in aircraft for decades,2-4
and reference standards for the handling qualities of both fixed-
wing aircraft5 and rotary-wing aircraft
6 have been developed and are now in common use. Broadly speaking, these
standards define a subset of the dynamics and control design space that provides good handling qualities for a given
vehicle type and flying task. A new generation of spacecraft now under development by NASA to replace the Space
Shuttle and return astronauts to the Moon will have a manual control capability for several mission tasks, and the
ease and precision with which pilots can execute these tasks will have an important effect on performance, mission
risk and training costs. At this time, no reference standards exist for handling qualities of piloted spacecraft.
NASA’s Apollo Program in the 1960’s extensively studied manual control during lunar landing, with principal
goals of establishing simulation requirements for both research and training, selecting response types for attitude
control, and designing the control system for compatibility with other manual control factors. A wide variety of
lunar landing simulators were constructed, including ground-based fixed and moving designs, a gantry design (the
Lunar Landing Research Facility), and two free-flight simulation vehicles, the Lunar Landing Research Vehicle
(LLRV) and Training Vehicle (LLTV).7,8
The studies conducted on those simulators showed that the most important
pilot cues for the final approach and landing task on the moon were visual, motion and auditory, in that order.7,9
It
*Aerospace Engineer, Flight Trajectory Dynamics and Controls Branch, M/S 210-10, Senior Member, AIAA,
[email protected]. †Research Scientist, Flight Trajectory Dynamics and Controls Branch, M/S 210-10, Associate Fellow, AIAA,
[email protected] ‡Deputy, Autonomous Systems and Robotics, Intelligent Systems Division, M/S 269-1, Associate Fellow, AIAA,
H
AIAA SPACE 2009 Conference & Exposition14 - 17 September 2009, Pasadena, California
AIAA 2009-6407
This material is declared a work of the U.S. Government and is not subject to copyright protection in the United States.

American Institute of Aeronautics and Astronautics
2
was found that only the free-flight vehicles, LLRV and LLTV, could couple adequate visual and motion cues with a
realistic trajectory for this task,6,9
and that the most difficult aspect of the new lunar landing task was the larger
attitude required under lunar gravity to get a translational acceleration equal to what is achieved on Earth.9 However,
it was recognized that the full spectrum of simulators will be required to fully understand the lunar landing problem
and the complex interaction between automated systems and the pilot.8,10
The control response types, which
determined vehicle state commands as a function of pilot inputs, that were evaluated in these early simulations were
attitude command, attitude-rate command (RC) and acceleration command, with RC being judged to have the best
handling qualities for final approach and lunar landing.11-13
The parameters most important for handling qualities for
an RC system are, in decreasing order, the angular acceleration available from the Reaction Control System (RCS),
referred to here as control power (CP), the sensitivity of the rotation command inceptor, which is related to the
largest rate that may be commanded at full inceptor deflection, and the size of the attitude-rate deadband.7,13-15
To briefly summarize the large body of work that relates these factors to handling qualities as measured on the
Cooper Scale,16
the absolute minimum allowable control power was 5 deg/s2,15
with an optimum around 10 to 14
deg/s2.11,15
Control power has an important effect on the range of satisfactory inceptor sensitivities: near the
optimum of 12.5 deg/s2 the sensitivity was satisfactory between about 8 and 45 deg/s, while for larger control
powers the upper end of that sensitivity rose to 55 deg/s or more.7,11,13
A rate deadband under 0.5 deg/s was
measured to be satisfactory for these control powers and sensitivities, with degraded handling qualities becoming
significant above 2 deg/s.13
The use of proportional RCS thrusters instead of on-off thrusters was studied and, all
else being equal, the latter was shown to significantly improve the evaluated handling qualities.11
Further study
showed that improved handling qualities might be obtained by reducing inceptor sensitivity for the same control
power, and that pilots rarely provided inputs that resulted in vehicle angular rates above 5 deg/s even when the
maximum available rate was 20 deg/s or more.14
Reduced sensitivity also had the effect of reducing RCS propellant
consumption.15
These parameter selections were all based on subjective ratings by pilots using the Cooper
Scale;7,11,13-15
evaluations of the effects of inceptor sensitivity and control power on landing point accuracy are
notably absent.14
Also absent was any evaluation of the potential impact of propellant slosh on handling qualities,
an effect that made the landing task more difficult during Apollo 11 and required the addition of propellant tank
baffles with their attendant mass penalties on future missions.17
The simulation reported in this paper extends the Apollo handling qualities work to inform the design of a next
generation NASA vehicle, specifically the Altair Lunar Lander. The goal of the paper is not to measure the handling
qualities of that vehicle; such an effort would be impossible at this time because the designs of so many aspects of
Altair that influence handling qualities are incomplete (e.g. attitude control system and pilot displays). Instead, the
information contained in this report should be used to select preliminary values of important design variables, and
should also provide information for trade studies on how to efficiently meet handling qualities requirements. The
specific contributions of this paper lie in the evaluation of much lower control powers—up to a factor of five
lower—than were considered during the Apollo era, which should result in a lower mass RCS, and an examination
of the degree to which inceptor sensitivity can mitigate the known degradation of handling qualities that comes from
low control powers. Contributions also include an extension of these parameter studies to a precision landing,
guidance-following task that may be required during future lunar outpost missions—requirements that were not
present for the LM—and a preliminary investigation of the effects of propellant slosh.
Finally, and not least of all, this study builds experience with the use of a high motion fidelity ground-based
simulator capable of providing the pilot with the most important cues identified by the Apollo studies, visual, motion
and auditory, in a much safer environment than the LLTV testbed, which was prone to catastrophic crashes in
moderate wind conditions. This study continues the work of a recent simulation experiment in the same facility that
demonstrated guidance cues are necessary for the manual execution of a precision landing using an Apollo Lunar
Module (LM) design.18
In this experiment the vehicle design is updated with the mass properties, geometry and
propulsion system (both RCS and descent engine) specifications to match that of an early Altair design (Design and
Analysis Cycle 2); the displays, inceptors, visual cues and guidance algorithms were all designed independently
from the Altair Project. The RCS jet thrust was varied to achieve several different control powers, which, along with
the inceptor sensitivity (equivalently the max-rate command), provided the experimental variables for the
evaluation.
The paper begins with a discussion of the experiment design, which includes details on the flying task, test
matrix and procedure. A description of the vehicle design follows, where the lunar lander dynamics and control
model is detailed. The ground-based motion simulator is described next, along with the cockpit instrumentation and
piloting procedures. Results are then presented and, where applicable, given in the context of those obtained by
Apollo studies. The paper concludes with a summary of key findings and some recommendations for further
research.
American Institute of Aeronautics and Astronautics
3
Experiment Design
A piloted simulation in December 2008 assessed the handling qualities for a precision lunar landing task from
terminal descent to touchdown. The primary experiment variables were the Reaction Control System (RCS) jet
thrust and rate command at maximum deflection of the rotational hand controller, which are essentially the vehicle’s
achievable angular acceleration (or control power) and the inceptor sensitivity, respectively. The variables will be
referred to as “control power” and “max-rate command” below. These variables had the most significant impact on
handling qualities during the Apollo design process and so are good candidates for a preliminary handling qualities
evaluation.14
While the control power must be selected early in the design process and is difficult to change because
of mass implications, the max-rate command is controlled in software and can be changed easily to help mitigate the
deficiencies known to result from low thrust levels. The magnitude of the rate deadband was found to have a crucial
impact on handling qualities during the Apollo-era studies, but that variable was not included in this study since the
attitude control system used did not make use of rate deadbands when zero rate was commanded. The magnitude of
the propellant slosh disturbance moment as a function of vehicle angular acceleration was a tertiary experiment
variable; it was evaluated here for the first time for a lunar landing task. The following sections describe various
aspects of the experiment design.
Flying Task
The Altair vehicle will carry four astronauts rather than the LM’s two, and it will have stricter safety, precision
and performance targets, but will be tasked with essentially the same mission: bringing people and cargo from lunar
orbit to the surface and returning only the people to orbit in an ascent stage that is separable from the lower portion
of the lander. This experiment evaluated handling qualities for a precision landing task, from final approach through
terminal descent to touchdown, following a trajectory similar to the nominal Apollo trajectory. Coarse trajectory
changes were made by firing opposing RCS jets to change the attitude of the lander and correspondingly tilt the
descent engine’s thrust vector. In a near-level attitude, fine trajectory changes could be made by firing several RCS
jets in the same direction. Feedback guidance laws were developed for flying the precision landing task, and the
corresponding guidance cues were displayed to the pilot via cockpit instrumentation. Details of the dynamics and
control model are presented in the next section.
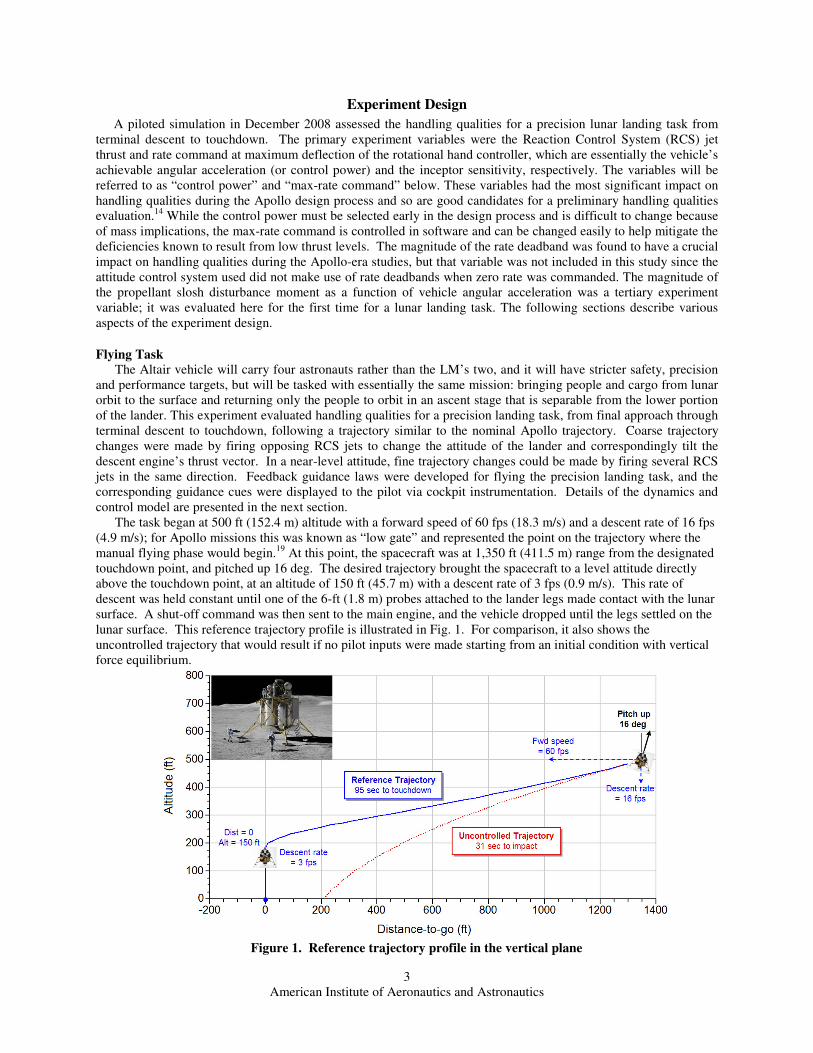
The task began at 500 ft (152.4 m) altitude with a forward speed of 60 fps (18.3 m/s) and a descent rate of 16 fps
(4.9 m/s); for Apollo missions this was known as “low gate” and represented the point on the trajectory where the
manual flying phase would begin.19
At this point, the spacecraft was at 1,350 ft (411.5 m) range from the designated
touchdown point, and pitched up 16 deg. The desired trajectory brought the spacecraft to a level attitude directly
above the touchdown point, at an altitude of 150 ft (45.7 m) with a descent rate of 3 fps (0.9 m/s). This rate of
descent was held constant until one of the 6-ft (1.8 m) probes attached to the lander legs made contact with the lunar
surface. A shut-off command was then sent to the main engine, and the vehicle dropped until the legs settled on the
lunar surface. This reference trajectory profile is illustrated in Fig. 1. For comparison, it also shows the
uncontrolled trajectory that would result if no pilot inputs were made starting from an initial condition with vertical
force equilibrium.
Figure 1. Reference trajectory profile in the vertical plane
American Institute of Aeronautics and Astronautics
4
The dynamics of the trajectory described above are confined to the vertical plane, with pitch attitude as the
primary means of longitudinal trajectory control. In order to excite lateral dynamics, the initial condition included a
lateral offset of 250 ft (76.2 m) from the touchdown point so that the initial velocity vector did not point directly at
the landing site. This lateral offset required the pilot to use roll attitude as a means of lateral trajectory control.
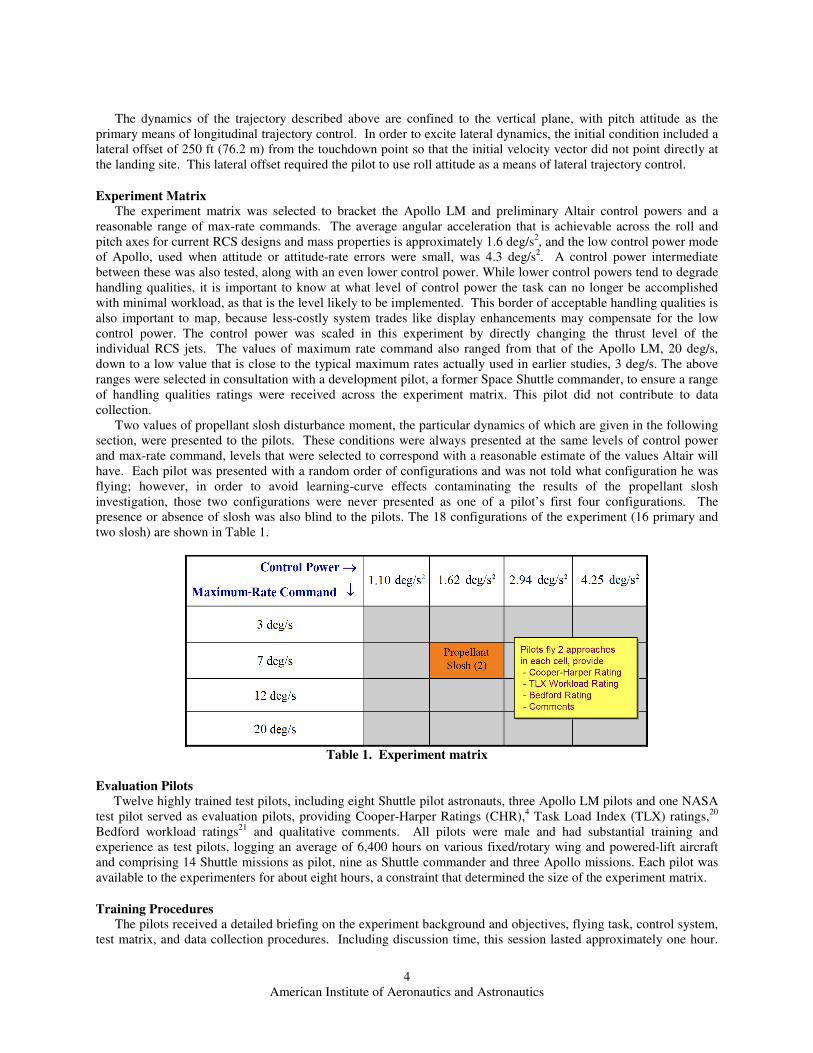
Experiment Matrix
The experiment matrix was selected to bracket the Apollo LM and preliminary Altair control powers and a
reasonable range of max-rate commands. The average angular acceleration that is achievable across the roll and
pitch axes for current RCS designs and mass properties is approximately 1.6 deg/s2, and the low control power mode
of Apollo, used when attitude or attitude-rate errors were small, was 4.3 deg/s2. A control power intermediate
between these was also tested, along with an even lower control power. While lower control powers tend to degrade
handling qualities, it is important to know at what level of control power the task can no longer be accomplished
with minimal workload, as that is the level likely to be implemented. This border of acceptable handling qualities is
also important to map, because less-costly system trades like display enhancements may compensate for the low
control power. The control power was scaled in this experiment by directly changing the thrust level of the
individual RCS jets. The values of maximum rate command also ranged from that of the Apollo LM, 20 deg/s,
down to a low value that is close to the typical maximum rates actually used in earlier studies, 3 deg/s. The above
ranges were selected in consultation with a development pilot, a former Space Shuttle commander, to ensure a range
of handling qualities ratings were received across the experiment matrix. This pilot did not contribute to data
collection.
Two values of propellant slosh disturbance moment, the particular dynamics of which are given in the following
section, were presented to the pilots. These conditions were always presented at the same levels of control power
and max-rate command, levels that were selected to correspond with a reasonable estimate of the values Altair will
have. Each pilot was presented with a random order of configurations and was not told what configuration he was
flying; however, in order to avoid learning-curve effects contaminating the results of the propellant slosh
investigation, those two configurations were never presented as one of a pilot’s first four configurations. The
presence or absence of slosh was also blind to the pilots. The 18 configurations of the experiment (16 primary and
two slosh) are shown in Table 1.
Table 1. Experiment matrix
Evaluation Pilots
Twelve highly trained test pilots, including eight Shuttle pilot astronauts, three Apollo LM pilots and one NASA
test pilot served as evaluation pilots, providing Cooper-Harper Ratings (CHR),4 Task Load Index (TLX) ratings,
20
Bedford workload ratings21
and qualitative comments. All pilots were male and had substantial training and
experience as test pilots, logging an average of 6,400 hours on various fixed/rotary wing and powered-lift aircraft
and comprising 14 Shuttle missions as pilot, nine as Shuttle commander and three Apollo missions. Each pilot was
available to the experimenters for about eight hours, a constraint that determined the size of the experiment matrix.
Training Procedures
The pilots received a detailed briefing on the experiment background and objectives, flying task, control system,
test matrix, and data collection procedures. Including discussion time, this session lasted approximately one hour.
American Institute of Aeronautics and Astronautics
5
This was followed by a one-hour training and familiarization session in the simulator cockpit in which the pilot
practiced the flying task for various control powers, max-rate commands and slosh magnitudes. Training continued
until the pilot felt comfortable that the steep portion of the learning curve was behind him.
Data Collection Procedures
Pilots flew all eighteen configurations of the experiment matrix in random order subject to the exception for
slosh configurations discussed in the previous section. For each test configuration (e.g., control power of 4.25
deg/s2 and 20 deg/s max-rate command), the pilot flew a minimum of two consecutive data collection runs, with the
option for as many additional runs as desired, and then provided experiment data for that test configuration as
described below.
In handling qualities experiments, pilots are generally asked to make a composite assessment of the overall
performance across all data collection runs for a test configuration. It is important to note that this assessment takes
into account not just the quantitative evaluation of the end-point (e.g., touchdown) performance but also a qualitative
evaluation of the manner in which the vehicle gets to the end point. This overall assessment of desired, adequate, or
inadequate performance is utilized for walking through the decision tree in the Cooper-Harper chart.1 Pilots use the
Cooper-Harper scale to assign handling qualities ratings from 1 (best) to 10 (worst) based on their assessment of
task performance and effort. It is an ordinal scale, which means, for example, that the difference between ratings of
1 and 2 is not the same as the difference between ratings of 3 and 4. Ratings of 1, 2, and 3 on the Cooper-Harper
scale correspond to Level 1 handling qualities, which are a general requirement for normal operations of flight
vehicles. Ratings of 4, 5, and 6 correspond to Level 2 which may be acceptable for some off-nominal conditions,
and ratings of 7, 8, and 9 correspond to Level 3 which is acceptable only for transition to a safe mode after a major
failure/disturbance. Desired performance is necessary (but not sufficient) for Level 1 ratings, and adequate
performance is necessary (but not sufficient) for Level 2 ratings. It is again noted that Apollo-era studies7,9,11-15
on
Lunar Module handling qualities utilized the Cooper rating scale16
which was a precursor of the Cooper-Harper
rating scale used in this work.
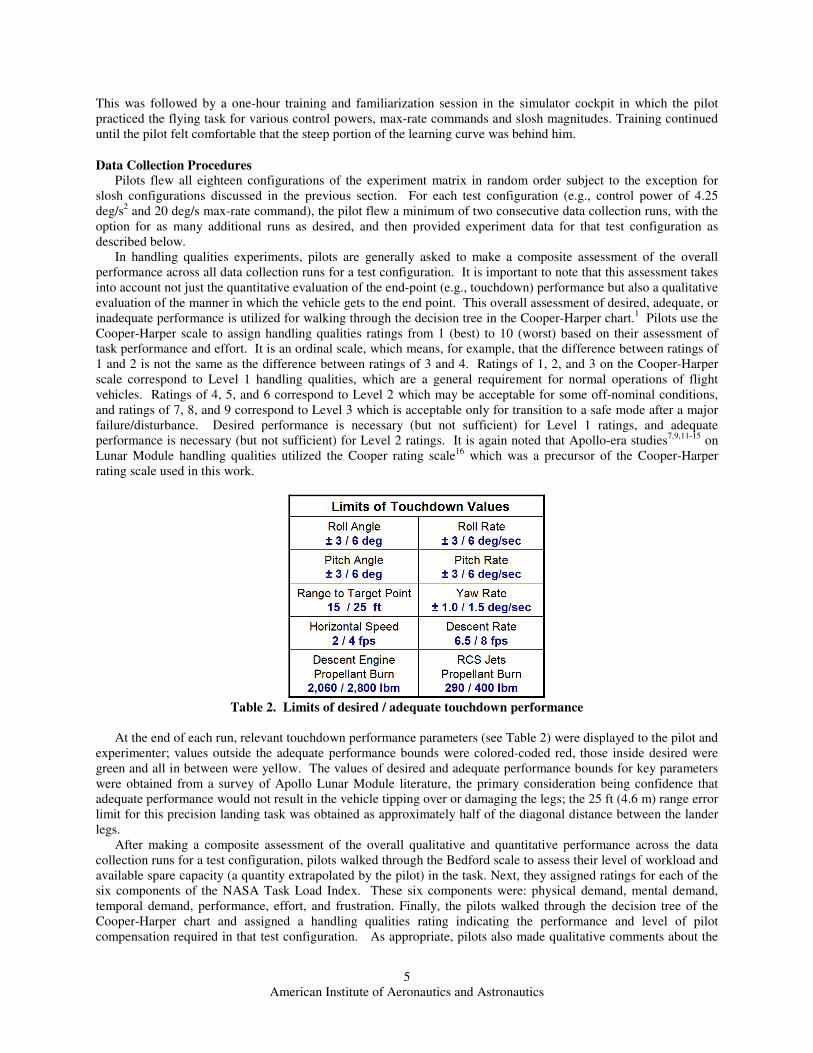
Table 2. Limits of desired / adequate touchdown performance
At the end of each run, relevant touchdown performance parameters (see Table 2) were displayed to the pilot and
experimenter; values outside the adequate performance bounds were colored-coded red, those inside desired were
green and all in between were yellow. The values of desired and adequate performance bounds for key parameters
were obtained from a survey of Apollo Lunar Module literature, the primary consideration being confidence that
adequate performance would not result in the vehicle tipping over or damaging the legs; the 25 ft (4.6 m) range error
limit for this precision landing task was obtained as approximately half of the diagonal distance between the lander
legs.
After making a composite assessment of the overall qualitative and quantitative performance across the data
collection runs for a test configuration, pilots walked through the Bedford scale to assess their level of workload and
available spare capacity (a quantity extrapolated by the pilot) in the task. Next, they assigned ratings for each of the
six components of the NASA Task Load Index. These six components were: physical demand, mental demand,
temporal demand, performance, effort, and frustration. Finally, the pilots walked through the decision tree of the
Cooper-Harper chart and assigned a handling qualities rating indicating the performance and level of pilot
compensation required in that test configuration. As appropriate, pilots also made qualitative comments about the
American Institute of Aeronautics and Astronautics
6
test configuration they had just evaluated. All pilot comments were recorded on electronic media; the experimenter
noted key points.
A debrief session was held after all test configurations had been evaluated. The pilots were asked to fill out a
one-page questionnaire designed to elicit high-level comments on cockpit displays, out-the-window displays,
guidance cues, control response, and experiment design, along with a questionnaire that assessed the relative
importance of the six TLX categories and would later be used to create a single weighted average TLX workload
rating. The pilot’s participation in the study concluded with a discussion of key insights and suggestions for future
work.
Lunar Lander Dynamics and Control Model
NASA’s Altair vehicle22
was in the early design stages when model development was finalized in November
2008, so the model is based only on available propulsion system characteristics, mass properties and geometry of the
new vehicle. Some of the remaining aspects of the model, including control system design and switching curve
logic, approach trajectory, and touchdown performance requirements, were based on Apollo LM data from several
sources,14,23,24
and the remaining aspects, including displays, inceptors, and RCS prioritization logic were designed
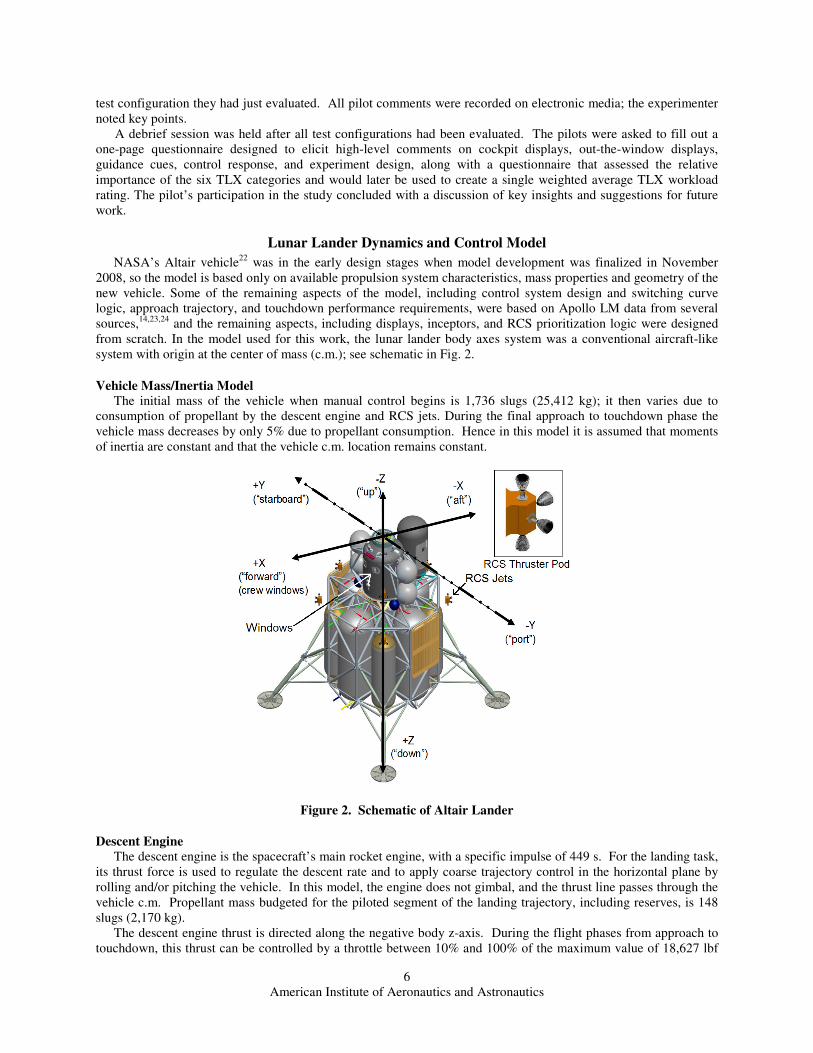
from scratch. In the model used for this work, the lunar lander body axes system was a conventional aircraft-like
system with origin at the center of mass (c.m.); see schematic in Fig. 2.
Vehicle Mass/Inertia Model
The initial mass of the vehicle when manual control begins is 1,736 slugs (25,412 kg); it then varies due to
consumption of propellant by the descent engine and RCS jets. During the final approach to touchdown phase the
vehicle mass decreases by only 5% due to propellant consumption. Hence in this model it is assumed that moments
of inertia are constant and that the vehicle c.m. location remains constant.
Figure 2. Schematic of Altair Lander
Descent Engine
The descent engine is the spacecraft’s main rocket engine, with a specific impulse of 449 s. For the landing task,
its thrust force is used to regulate the descent rate and to apply coarse trajectory control in the horizontal plane by
rolling and/or pitching the vehicle. In this model, the engine does not gimbal, and the thrust line passes through the
vehicle c.m. Propellant mass budgeted for the piloted segment of the landing trajectory, including reserves, is 148
slugs (2,170 kg).
The descent engine thrust is directed along the negative body z-axis. During the flight phases from approach to
touchdown, this thrust can be controlled by a throttle between 10% and 100% of the maximum value of 18,627 lbf
American Institute of Aeronautics and Astronautics
7
(83,060 N). The thrust command, cmdT , consists of two parts: o
cmdT and cmdT∆ . o
cmdT is automatically computed as
the force whose vertical component balances the vehicle’s lunar weight, lunargm , while compensating for vehicle
roll (φ) and pitch (θ) angles:
θφcoscos
lunaro
cmd
gmT = (1)
The secondary part of the thrust command, cmdT∆ , is an increment derived from pilot input. There are two modes
for pilot input: a throttle-increment mode and a rate-of-descent (ROD) mode. In the throttle-increment mode, each
inceptor discrete input (“click”) by the pilot increments the thrust by ±1% of the upper throttle limit value of 18,627
lbf. In ROD mode, each inceptor “click” increments the commanded descent rate by ±1 fps (0.3 m/s); the descent
rate is regulated within a deadband of ±0.1 fps (0.03 m/s) by a proportional feedback controller with a time constant
τ = 1.5 s.
−=∆
τθφ
hhmT cmdROD
cmd
&&
coscos (2)
Engine response to thrust commands is modeled as a first-order system, with a time constant of 0.11 s. Hence
the actual thrust produced by the descent engine, TDE, lags the commanded thrust cmd
o
cmdcmd TTT ∆+= .
Reaction Control System Jets
There are four RCS pods on Altair’s descent module, each of which has four RCS jets with thrust axes oriented
along the vehicle positive and negative z-body axis, and at 45 degrees from the x and y axes in the x-y body plane.
The c.m. of the vehicle at touchdown lies within the plane of the RCS pods, so no translation-into-rotation or
rotation-into-translation coupling occurs because of offset thrust vectors (the non-zero value of Ixz term does cause
a small amount of coupling between the x- and z-rotational axes). The RCS jets cannot be throttled, and have fast
response dynamics on the order of 10 milliseconds. In this model, which is based on a generic on-off thruster and
not an Altair design, the response to a command input experiences a pure delay of 10 ms followed by a first order
thrust response that reaches full thrust within an additional 13 ms. The RCS jet must then fire for a minimum of 40
ms, after which the thrust decays as a first-order response with time constant 110 ms. Propellant mass budgeted for
the piloted segment of the landing trajectory, including reserves, is 13.8 slugs (202 kg). RCS jets are used for three-
axis attitude control; for the precision landing task, RCS jets can also be used for direct translation control in the
horizontal plane when the vehicle is in a near-level attitude.
The firing logic design allowed any combination of simultaneous attitude and translation commands, whether
from the pilot or the automated attitude control system. The price paid for this capability is a reduction in control
power along all axes when commands are received about more than one axis. The control powers tested in this
experiment and shown in Table 1 represent the angular acceleration achievable when only a single-axis maneuver is
being made. The layout and thrust directions of the RCS jets naturally separate the axes into two groups that do not
compete with each other for individual jets. The ±z jets fire only for pitch and roll commands, so simultaneous rate
commands for both those axes will result in half the expected angular acceleration in each axis. Similarly, the jets
that lie in the x-y plane fire to meet yaw commands along with x and y translation commands, and the particular
combination of commands received determines the factor by with the control power is reduced. In no situations,
however, is a command deferred in favor of maintaining full authority about a particular axis, as was the case in the
Apollo LM. Note that the z-axis jets are never fired for z translation because the descent engine controls that thrust
axis, leaving pitch and roll commands to compete only with each other.
The RCS logic implemented in this experiment used an Apollo feature that reduced from four to two the number
of jets used to create a moment when the attitude-rate error dropped below a threshold. Under these conditions
simultaneous roll and pitch commands would not reduce the angular acceleration from that requested by the control
logic. The implementation of this feature within the attitude-hold logic will be described in a subsequent section.
American Institute of Aeronautics and Astronautics
8
Direct translation control
Pilot inputs are made with a three-axis translation hand controller (THC); this control inceptor is used for fine
control of the trajectory along the x and y body axes when the vehicle is in a near-level attitude. The control
response type is acceleration command; this means that the appropriate RCS jets fire continuously to produce a
constant acceleration for as long as the pilot holds the inceptor out of detent.
Attitude control
By tilting the descent engine thrust vector, roll/pitch attitude control provides indirect translation control for
coarse trajectory changes. Pilot inputs are made with a three-axis rotation hand controller (RHC). This control
inceptor is used for attitude stabilization and control along all three body axes; however, mode control is determined
simultaneously for the roll and pitch axes (they are always in the same mode) and independently for the yaw axis.
The attitude control response type is derived from Apollo and is described as a direct rate/pseudo-auto mode,
implemented as described below and, in more detail, in Ref. 14.
Direct Rate Command mode
This mode is in effect when the rate command in a particular axis is changing very quickly (in “response to
urgent commands,”14
which for Apollo was a change in rate command of 6 deg/s in one second) and the attitude rate
error is outside a 0.3 deg/s deadband. Error signals are generated as the difference between the actual and desired
angular rates:
−
−
−
=
cmd
cmd
cmd
err
err
err
rr
pp
r
q
p
(3)
where p, q, r, are the roll, pitch, and yaw rates respectively along the vehicle body axes. The commanded rates are
computed from the inceptor deflection and the inceptor shaping function described in the following section. When
the attitude-rate error is larger than 0.3 deg/s, the RCS firing logic is commanded to create a moment in the
appropriate axis.
Pseudo-auto mode
A simple attitude-hold mode was implemented for all missions before Apollo 10: when the inceptor was in
detent and the attitude-rate error was under 2 deg/s the control system drove attitude and attitude rate errors to zero
using switching curve logic.18
In all missions beginning with Apollo 10 a hybrid mode was implemented to reduce
attitude drift about uncommanded axes, provide more precise rate control and improve handling qualities. This
mode was in effect when both the commanded rate from the inceptor was changing slowly (e.g. less than 6 deg/s in
one second for Apollo) and the rate error was within the 0.3 deg/s rate deadband. While this mode is active the
control logic integrates the commanded attitude rate (from the pilot’s RHC) to obtain a commanded attitude. Then,
both the attitude error and the attitude-rate error are used to look up moment commands based on phase plane
switching curves.24
Error signals are given by:
=
r
q
p
r
q
p
err
err
err
;
−
−
−
−
−
=
cmd
cmd
cmd
err
err
err
ψψ
θθ
φφ
θφφ
θφφ
θ
ψ
θ
φ
coscossin0
cossincos0
sin01
(4)
where φ, θ, and ψ are the current values of the vehicle Euler angles, and cmdφ , cmdθ and cmdψ are equal to the sum of
the Euler angle values captured when pseudo-auto mode was last entered (for the particular axis) plus the integral of
the commanded rates. That is,
American Institute of Aeronautics and Astronautics
9
∫+=t
tcmd
PR
cmdPR
dtpt/
0
)( /
0φφ
∫+=t
tcmd
PR
cmdPR
dtqt/
0
)( /
0θθ (5)
∫+=t
tcmd
Y
cmdY
dtrt0
)( 0ψψ
where )(/
0
PRtφ and )( /
0
PRtθ are the Euler roll and pitch angles captured when those axes last entered pseudo-auto
mode, )( 0
Ytψ is the yaw angle captured when that axis last entered pseudo-auto mode, and cmdp , cmdq and
cmdr are
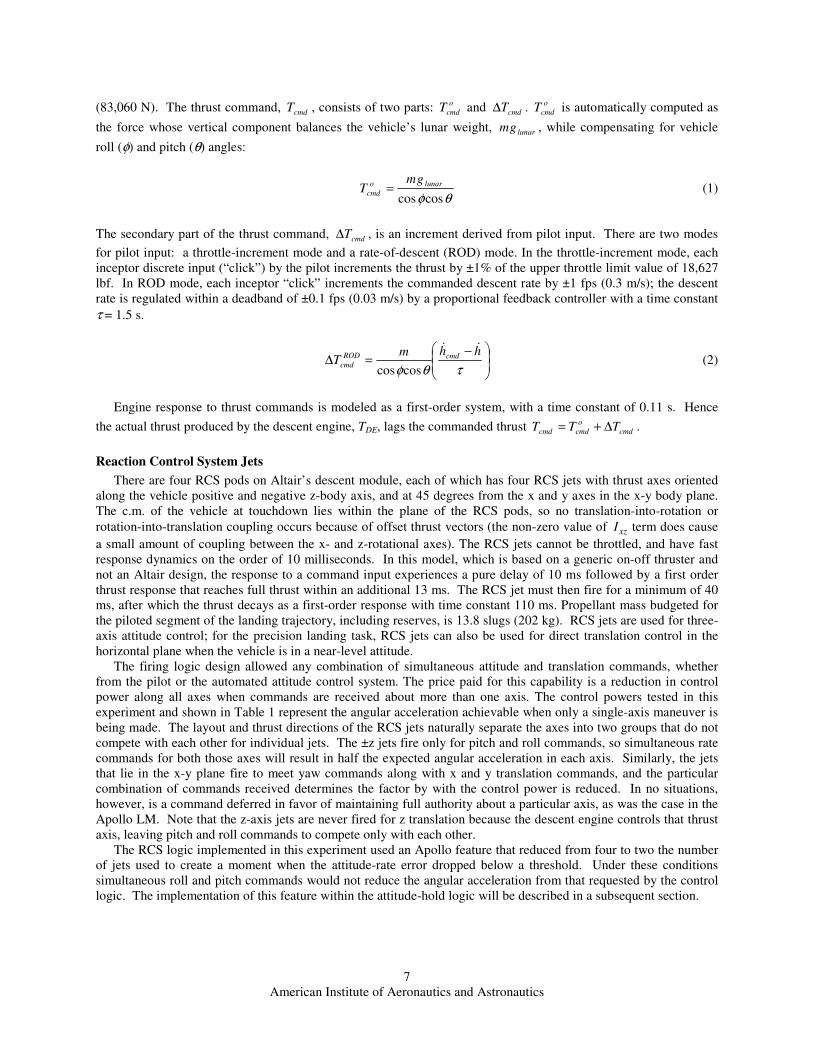
the time-dependent attitude-rate commands from the RHC. Control moment commands are generated about the
appropriate axes in accordance with the phase-plane relationship between error signals, as illustrated in Fig. 3 for the
pitch axis. In that figure, Pα is the nominal angular acceleration achieved with two RCS jets (half that shown in the
experiment matrix, Table 1), DBθ = 0.3 deg is the deadband for pitch attitude error,
flatθ = 0.8 deg is the magnitude
of the flat boundary that enlarges the deadband region, HIq =1.4 deg/s is the rate error at which the control system
transitions from two-jet to four-jet control, and k = 0.01 denotes the trade-off between RCS jet propellant
consumption and error settling time. The phase-plane relationships for the roll and yaw axes are identical except for
a small difference in the angular acceleration, α.
Figure 3. Switching curves for pseudo-auto mode
Guidance Laws
The Apollo lunar missions did not have a requirement for precision landing; it was sufficient to land within
several hundred feet of the designated landing site. Therefore, the Apollo LM did not require, nor did it have, any
active guidance cues displayed to the pilot for manual landing. The guidance laws used in this experiment were
adopted without modification from an earlier lunar lander simulation so only a brief description is given here, and
the detailed derivation may be found in Ref 18. These laws were designed to guide the pilot along a reference
trajectory (see Fig. 1) from final approach through terminal descent to lunar touchdown.
The guidance laws use the range to the touchdown point as the independent variable. First, the reference
trajectory altitude at a given range from the landing site is calculated. The vertical speed guidance is calculated next
according to this reference altitude, which enables computation of the required horizontal velocity components as a

American Institute of Aeronautics and Astronautics
10
function of range. Finally, the guidance roll and pitch angles are calculated to provide the required horizontal
acceleration components.
Guidance cues are presented to the pilot as errors from the desired vehicle states. These errors are computed as
the differences between the guidance and actual values of the roll/pitch angle and the differences between guidance
and actual velocity components along the vehicle body axes. Details on the display of these guidance cues are
presented in the next section.
Propellant Slosh Model
While a large body of work exists on the design of control systems to mitigate the effects of propellant slosh in
unmanned space vehicles and in piloted aircraft, no design studies have yet investigated the effects of slosh on the
handling qualities of a lunar lander vehicle despite the known degradation that occurred during Apollo 11. The
preliminary investigation carried out as a secondary objective of this experiment was relatively rudimentary because
existing models proved to be too computationally intensive for realtime use,25
dependent upon experimental
determination of relevant model parameters26
or simply not relevant to the vehicle’s tank geometry.27
The modeling
approach was to employ a proven architecture for slosh27
and model the propellant as a second-order transfer
function in which the parameters were derived from pendulum dynamics under lunar gravity. The natural frequency
of the pendulum, calculated from a moment arm of 1.97 ft between the vehicle c.m. and the propellant slug, under
lunar gravity (5.32 ft/s2) is
nω =1.64 rad/s. The damping ratio of 0.02 was selected to match the disturbance period
(two to three seconds) reported by the astronauts on Apollo 11. This resulted in a transfer function from the angular
acceleration of the body in a particular axis, bodyq& , to the disturbance moment in that same axis,
edisturbancM :
70.2064.0
67.1
)(
)(2 ++
−=ss
Ksq
sM
body
edisturbanc
& (6)
The higher value of the gain parameter, K = 1500, was selected to match the two to three degrees by which the
Apollo 11 vehicle was disturbed outside of its attitude deadband by the sloshing propellant, and the low value was
simply half of the high, K = 750. In all other configurations the gain value was set to zero.
Inceptor Shaping
The attitude rates commanded by the RHC were calculated by shaping the raw displacement of the inceptor
using a linear-quadratic function, the same shaping function used in Apollo. This function is simply a weighted
average of a linear function and a quadratic function:
−+−
−+−=
2
2
*
)1()1(
)()(
DBLQDB
DBLQDB
cmdcmdc
c
δδ
δδδδωω if DBδδ > ; else 0=cmdω (7)
where LQc is the linear-quadratic shaping parameter, DBδ is the RHC detent deadband, and *
cmdω denotes the
angular rate commanded at full throw of the RHC ( 1=δ ). The parameter values used in this experiment were
LQc =10, which is close to parabolic shaping, the RHC deadband was 10% of full throw, and *
cmdω varied depending
on the configuration being tested.
Simulation Environment
The experiment was conducted in the Vertical Motion Simulator (VMS) at NASA Ames Research Center. The
VMS is a large motion-base simulator28
that has been used for numerous handling qualities evaluations.29
Prior
simulations have found that the most important pilot cues for the final approach and landing task on the Moon were
first visual, followed by motion, then auditory.7,9
Six degree-of-freedom simulator motion was used for the
experiment because the reference trajectory was dynamic, featuring significant translational accelerations (~3
ft/sec2) and roll/pitch angular motion (~15 deg).
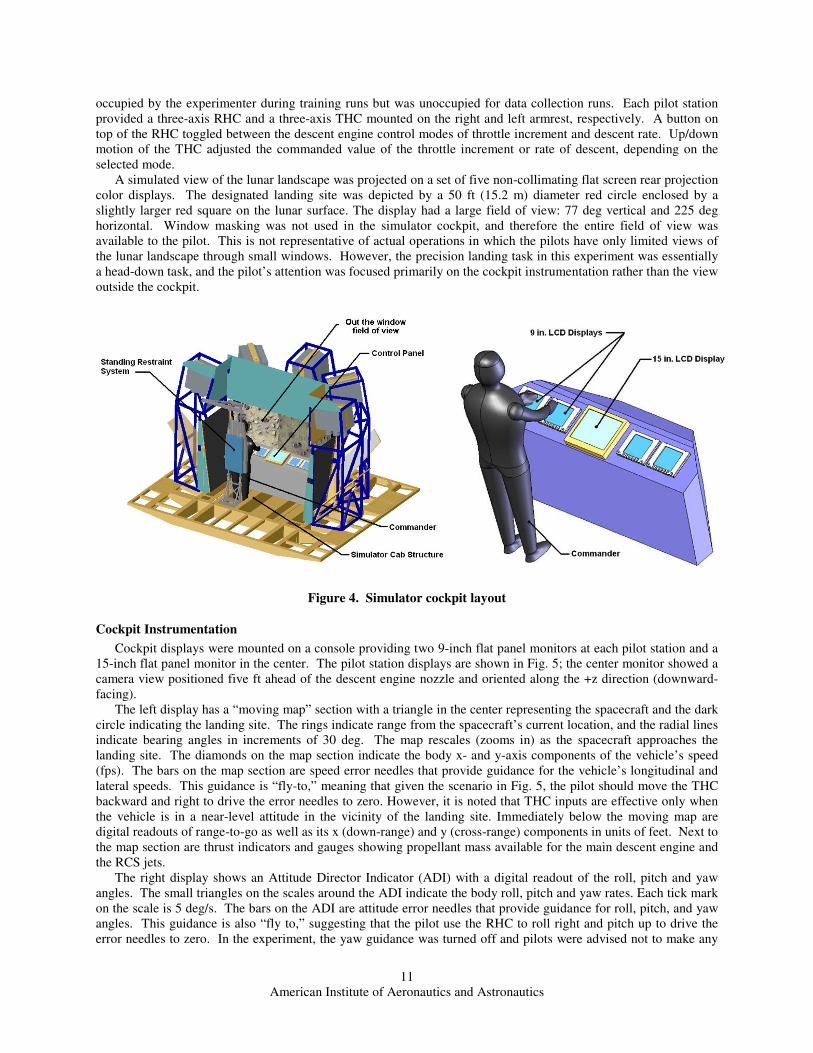
The Apollo LM pilot stations had a standing configuration to improve downward visibility and reduce vehicle
mass by eliminating seats. One of the VMS interchangeable cabs was structurally modified to provide a similar
cockpit configuration, as illustrated in Fig. 4. The evaluation pilot occupied the left station; the right station was
American Institute of Aeronautics and Astronautics
11
occupied by the experimenter during training runs but was unoccupied for data collection runs. Each pilot station
provided a three-axis RHC and a three-axis THC mounted on the right and left armrest, respectively. A button on
top of the RHC toggled between the descent engine control modes of throttle increment and descent rate. Up/down
motion of the THC adjusted the commanded value of the throttle increment or rate of descent, depending on the
selected mode.
A simulated view of the lunar landscape was projected on a set of five non-collimating flat screen rear projection
color displays. The designated landing site was depicted by a 50 ft (15.2 m) diameter red circle enclosed by a
slightly larger red square on the lunar surface. The display had a large field of view: 77 deg vertical and 225 deg
horizontal. Window masking was not used in the simulator cockpit, and therefore the entire field of view was
available to the pilot. This is not representative of actual operations in which the pilots have only limited views of
the lunar landscape through small windows. However, the precision landing task in this experiment was essentially
a head-down task, and the pilot’s attention was focused primarily on the cockpit instrumentation rather than the view
outside the cockpit.
Figure 4. Simulator cockpit layout
Cockpit Instrumentation
Cockpit displays were mounted on a console providing two 9-inch flat panel monitors at each pilot station and a
15-inch flat panel monitor in the center. The pilot station displays are shown in Fig. 5; the center monitor showed a
camera view positioned five ft ahead of the descent engine nozzle and oriented along the +z direction (downward-
facing).
The left display has a “moving map” section with a triangle in the center representing the spacecraft and the dark
circle indicating the landing site. The rings indicate range from the spacecraft’s current location, and the radial lines
indicate bearing angles in increments of 30 deg. The map rescales (zooms in) as the spacecraft approaches the
landing site. The diamonds on the map section indicate the body x- and y-axis components of the vehicle’s speed
(fps). The bars on the map section are speed error needles that provide guidance for the vehicle’s longitudinal and
lateral speeds. This guidance is “fly-to,” meaning that given the scenario in Fig. 5, the pilot should move the THC
backward and right to drive the error needles to zero. However, it is noted that THC inputs are effective only when
the vehicle is in a near-level attitude in the vicinity of the landing site. Immediately below the moving map are
digital readouts of range-to-go as well as its x (down-range) and y (cross-range) components in units of feet. Next to
the map section are thrust indicators and gauges showing propellant mass available for the main descent engine and
the RCS jets.
The right display shows an Attitude Director Indicator (ADI) with a digital readout of the roll, pitch and yaw
angles. The small triangles on the scales around the ADI indicate the body roll, pitch and yaw rates. Each tick mark
on the scale is 5 deg/s. The bars on the ADI are attitude error needles that provide guidance for roll, pitch, and yaw
angles. This guidance is also “fly to,” suggesting that the pilot use the RHC to roll right and pitch up to drive the
error needles to zero. In the experiment, the yaw guidance was turned off and pilots were advised not to make any

American Institute of Aeronautics and Astronautics
12
yaw-axis RHC inputs because it added significant workload while adding little value to the flying task. However,
the yaw attitude-hold function was always active to null any yaw disturbances. On the lower right of the ADI is an
annunciator for the throttle mode (throttle increment or descent rate) and the current commanded value for the
selected mode. To the right of the ADI are three moving tape displays for horizontal speed (fps), altitude (ft) and
altitude rate (fps).
Figure 5. Pilot station displays
Piloting Technique
The following procedures were reviewed with each pilot during the initial briefing. The pilots practiced these
procedures during the training and familiarization simulator session prior to data collection.
Vertical Speed Control
This is accomplished by manual or automatic control of descent engine throttle setting. The simulation task
began in throttle increment mode with a cmdT∆ setting of 3%. This had the effect of reducing the descent rate from
an initial value of 16 fps at 500 ft altitude to 3 fps at approximately 150 ft altitude in the vicinity of the landing site.
Pilots were advised to switch to rate-of-descent mode (by pressing a button on top of the RHC) at this point, and if
necessary adjust the descent rate to 3 fps with up/down inputs from the THC.
Horizontal Speed Control
This is accomplished by rolling and/or pitching the vehicle to tilt the descent engine thrust vector. Pilots were
advised to follow guidance commands by first using the RHC to null the roll/pitch angle error needles on the ADI
until the vehicle reached a near-level attitude in the vicinity of the landing site, and then using the THC to null the
longitudinal/lateral speed error needles on the map display until touchdown. However, it was possible to fly the
vehicle all the way to touchdown using only the RHC by following the guidance error needles on the ADI.
Results
Data collection was conducted with twelve pilots between December 8 and December 19, 2008, and again
between January 26 and January 30, 2009. The subjective handling qualities ratings given by the pilots included
Cooper-Harper ratings, NASA TLX ratings and Bedford Workload Scale ratings. Objective data were captured
during the simulation on the touchdown range dispersions, RCS propellant usage and the distribution of commanded
versus actual attitude rates. These data were all collected with propellant slosh on and off.
Handling Qualities Ratings
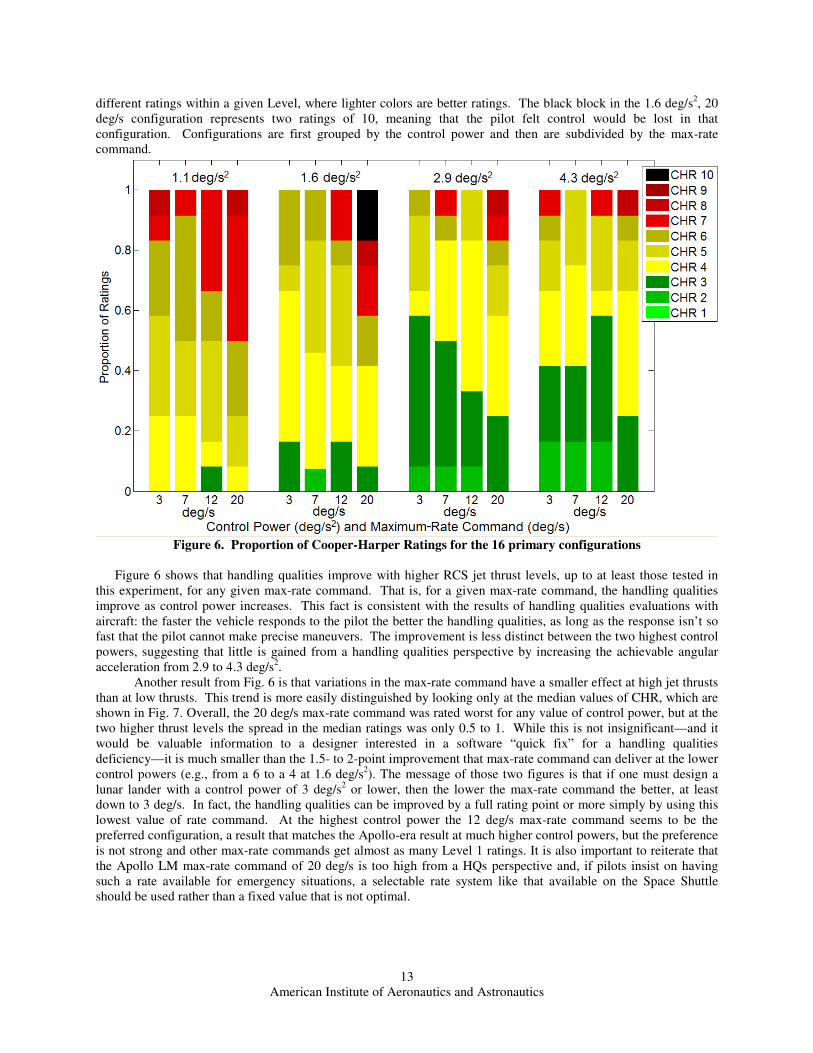
The Cooper-Harper workload ratings (CHR) provided by the twelve pilots for each of the 16 combinations of the
primary experiment variables are shown in stacked bar chart form in Fig. 6. The colors in that figure—green,
yellow and red—represent Cooper-Harper Levels 1, 2 and 3, respectively; the shades of those colors represent
American Institute of Aeronautics and Astronautics
13
different ratings within a given Level, where lighter colors are better ratings. The black block in the 1.6 deg/s2, 20
deg/s configuration represents two ratings of 10, meaning that the pilot felt control would be lost in that
configuration. Configurations are first grouped by the control power and then are subdivided by the max-rate
command.
Figure 6. Proportion of Cooper-Harper Ratings for the 16 primary configurations
Figure 6 shows that handling qualities improve with higher RCS jet thrust levels, up to at least those tested in
this experiment, for any given max-rate command. That is, for a given max-rate command, the handling qualities
improve as control power increases. This fact is consistent with the results of handling qualities evaluations with
aircraft: the faster the vehicle responds to the pilot the better the handling qualities, as long as the response isn’t so
fast that the pilot cannot make precise maneuvers. The improvement is less distinct between the two highest control
powers, suggesting that little is gained from a handling qualities perspective by increasing the achievable angular
acceleration from 2.9 to 4.3 deg/s2.
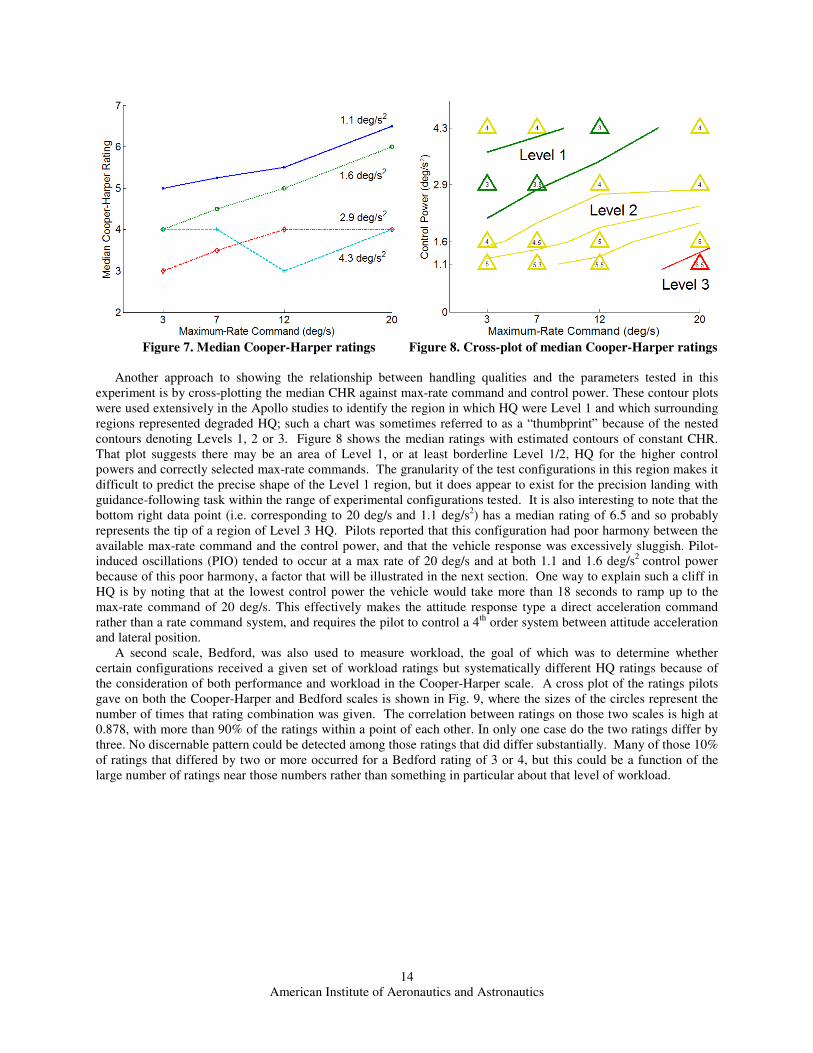
Another result from Fig. 6 is that variations in the max-rate command have a smaller effect at high jet thrusts
than at low thrusts. This trend is more easily distinguished by looking only at the median values of CHR, which are
shown in Fig. 7. Overall, the 20 deg/s max-rate command was rated worst for any value of control power, but at the
two higher thrust levels the spread in the median ratings was only 0.5 to 1. While this is not insignificant—and it
would be valuable information to a designer interested in a software “quick fix” for a handling qualities
deficiency—it is much smaller than the 1.5- to 2-point improvement that max-rate command can deliver at the lower
control powers (e.g., from a 6 to a 4 at 1.6 deg/s2). The message of those two figures is that if one must design a
lunar lander with a control power of 3 deg/s2 or lower, then the lower the max-rate command the better, at least
down to 3 deg/s. In fact, the handling qualities can be improved by a full rating point or more simply by using this
lowest value of rate command. At the highest control power the 12 deg/s max-rate command seems to be the
preferred configuration, a result that matches the Apollo-era result at much higher control powers, but the preference
is not strong and other max-rate commands get almost as many Level 1 ratings. It is also important to reiterate that
the Apollo LM max-rate command of 20 deg/s is too high from a HQs perspective and, if pilots insist on having
such a rate available for emergency situations, a selectable rate system like that available on the Space Shuttle
should be used rather than a fixed value that is not optimal.
American Institute of Aeronautics and Astronautics
14
Figure 7. Median Cooper-Harper ratings Figure 8. Cross-plot of median Cooper-Harper ratings
Another approach to showing the relationship between handling qualities and the parameters tested in this
experiment is by cross-plotting the median CHR against max-rate command and control power. These contour plots
were used extensively in the Apollo studies to identify the region in which HQ were Level 1 and which surrounding
regions represented degraded HQ; such a chart was sometimes referred to as a “thumbprint” because of the nested
contours denoting Levels 1, 2 or 3. Figure 8 shows the median ratings with estimated contours of constant CHR.
That plot suggests there may be an area of Level 1, or at least borderline Level 1/2, HQ for the higher control
powers and correctly selected max-rate commands. The granularity of the test configurations in this region makes it
difficult to predict the precise shape of the Level 1 region, but it does appear to exist for the precision landing with
guidance-following task within the range of experimental configurations tested. It is also interesting to note that the
bottom right data point (i.e. corresponding to 20 deg/s and 1.1 deg/s2) has a median rating of 6.5 and so probably
represents the tip of a region of Level 3 HQ. Pilots reported that this configuration had poor harmony between the
available max-rate command and the control power, and that the vehicle response was excessively sluggish. Pilot-
induced oscillations (PIO) tended to occur at a max rate of 20 deg/s and at both 1.1 and 1.6 deg/s2
control power
because of this poor harmony, a factor that will be illustrated in the next section. One way to explain such a cliff in
HQ is by noting that at the lowest control power the vehicle would take more than 18 seconds to ramp up to the
max-rate command of 20 deg/s. This effectively makes the attitude response type a direct acceleration command
rather than a rate command system, and requires the pilot to control a 4th
order system between attitude acceleration
and lateral position.
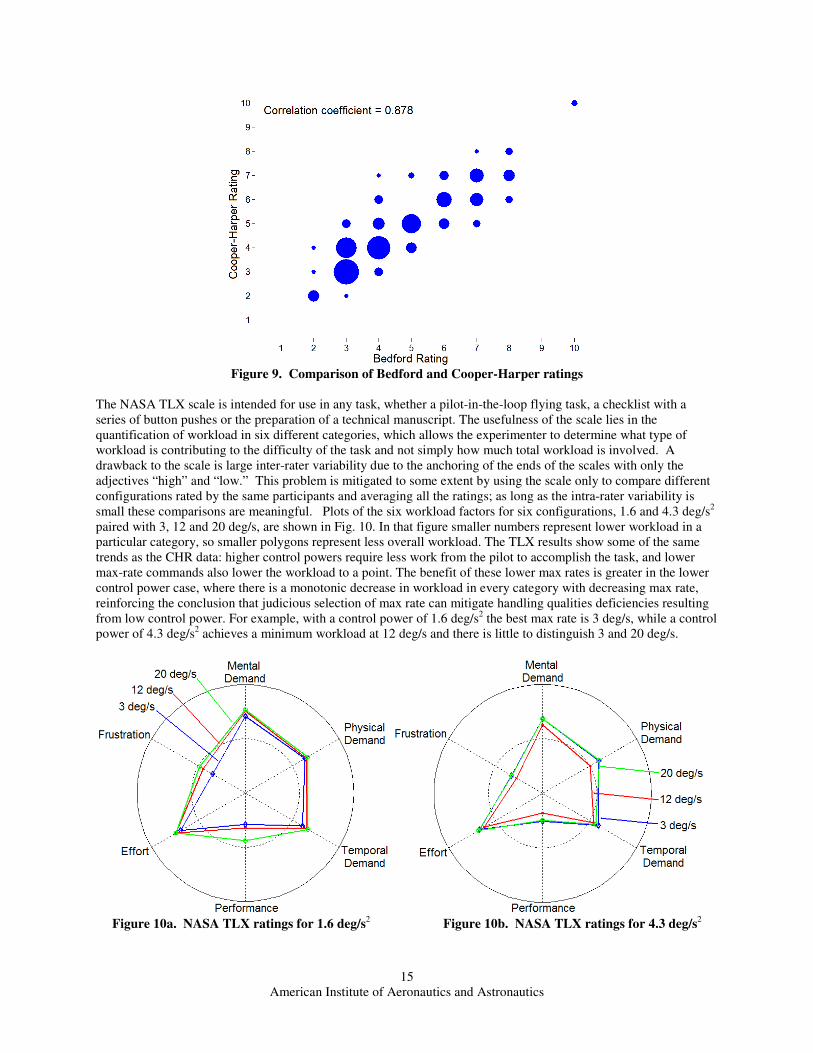
A second scale, Bedford, was also used to measure workload, the goal of which was to determine whether
certain configurations received a given set of workload ratings but systematically different HQ ratings because of
the consideration of both performance and workload in the Cooper-Harper scale. A cross plot of the ratings pilots
gave on both the Cooper-Harper and Bedford scales is shown in Fig. 9, where the sizes of the circles represent the
number of times that rating combination was given. The correlation between ratings on those two scales is high at
0.878, with more than 90% of the ratings within a point of each other. In only one case do the two ratings differ by
three. No discernable pattern could be detected among those ratings that did differ substantially. Many of those 10%
of ratings that differed by two or more occurred for a Bedford rating of 3 or 4, but this could be a function of the
large number of ratings near those numbers rather than something in particular about that level of workload.
American Institute of Aeronautics and Astronautics
15
Figure 9. Comparison of Bedford and Cooper-Harper ratings
The NASA TLX scale is intended for use in any task, whether a pilot-in-the-loop flying task, a checklist with a
series of button pushes or the preparation of a technical manuscript. The usefulness of the scale lies in the
quantification of workload in six different categories, which allows the experimenter to determine what type of
workload is contributing to the difficulty of the task and not simply how much total workload is involved. A
drawback to the scale is large inter-rater variability due to the anchoring of the ends of the scales with only the
adjectives “high” and “low.” This problem is mitigated to some extent by using the scale only to compare different
configurations rated by the same participants and averaging all the ratings; as long as the intra-rater variability is
small these comparisons are meaningful. Plots of the six workload factors for six configurations, 1.6 and 4.3 deg/s2
paired with 3, 12 and 20 deg/s, are shown in Fig. 10. In that figure smaller numbers represent lower workload in a
particular category, so smaller polygons represent less overall workload. The TLX results show some of the same
trends as the CHR data: higher control powers require less work from the pilot to accomplish the task, and lower
max-rate commands also lower the workload to a point. The benefit of these lower max rates is greater in the lower
control power case, where there is a monotonic decrease in workload in every category with decreasing max rate,
reinforcing the conclusion that judicious selection of max rate can mitigate handling qualities deficiencies resulting
from low control power. For example, with a control power of 1.6 deg/s2 the best max rate is 3 deg/s, while a control
power of 4.3 deg/s2 achieves a minimum workload at 12 deg/s and there is little to distinguish 3 and 20 deg/s.
Figure 10a. NASA TLX ratings for 1.6 deg/s
2 Figure 10b. NASA TLX ratings for 4.3 deg/s
2
American Institute of Aeronautics and Astronautics
16
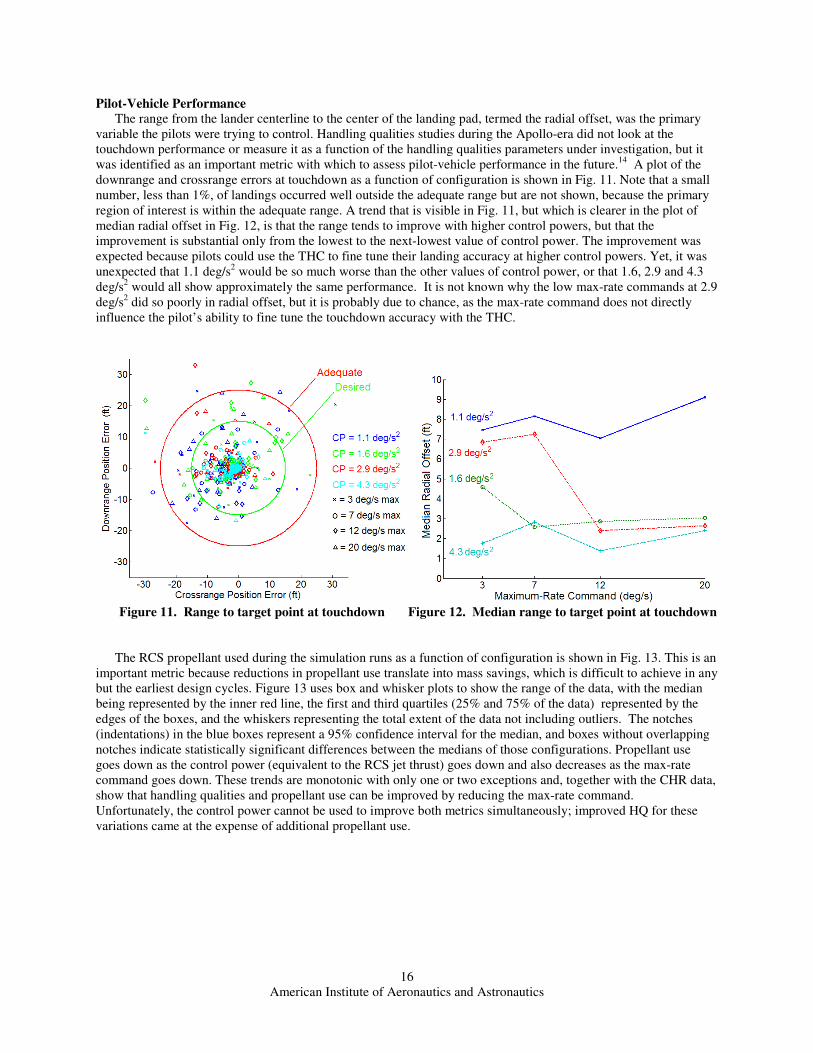
Pilot-Vehicle Performance
The range from the lander centerline to the center of the landing pad, termed the radial offset, was the primary
variable the pilots were trying to control. Handling qualities studies during the Apollo-era did not look at the
touchdown performance or measure it as a function of the handling qualities parameters under investigation, but it
was identified as an important metric with which to assess pilot-vehicle performance in the future.14
A plot of the
downrange and crossrange errors at touchdown as a function of configuration is shown in Fig. 11. Note that a small
number, less than 1%, of landings occurred well outside the adequate range but are not shown, because the primary
region of interest is within the adequate range. A trend that is visible in Fig. 11, but which is clearer in the plot of
median radial offset in Fig. 12, is that the range tends to improve with higher control powers, but that the
improvement is substantial only from the lowest to the next-lowest value of control power. The improvement was
expected because pilots could use the THC to fine tune their landing accuracy at higher control powers. Yet, it was
unexpected that 1.1 deg/s2 would be so much worse than the other values of control power, or that 1.6, 2.9 and 4.3
deg/s2 would all show approximately the same performance. It is not known why the low max-rate commands at 2.9
deg/s2 did so poorly in radial offset, but it is probably due to chance, as the max-rate command does not directly
influence the pilot’s ability to fine tune the touchdown accuracy with the THC.
Figure 11. Range to target point at touchdown Figure 12. Median range to target point at touchdown
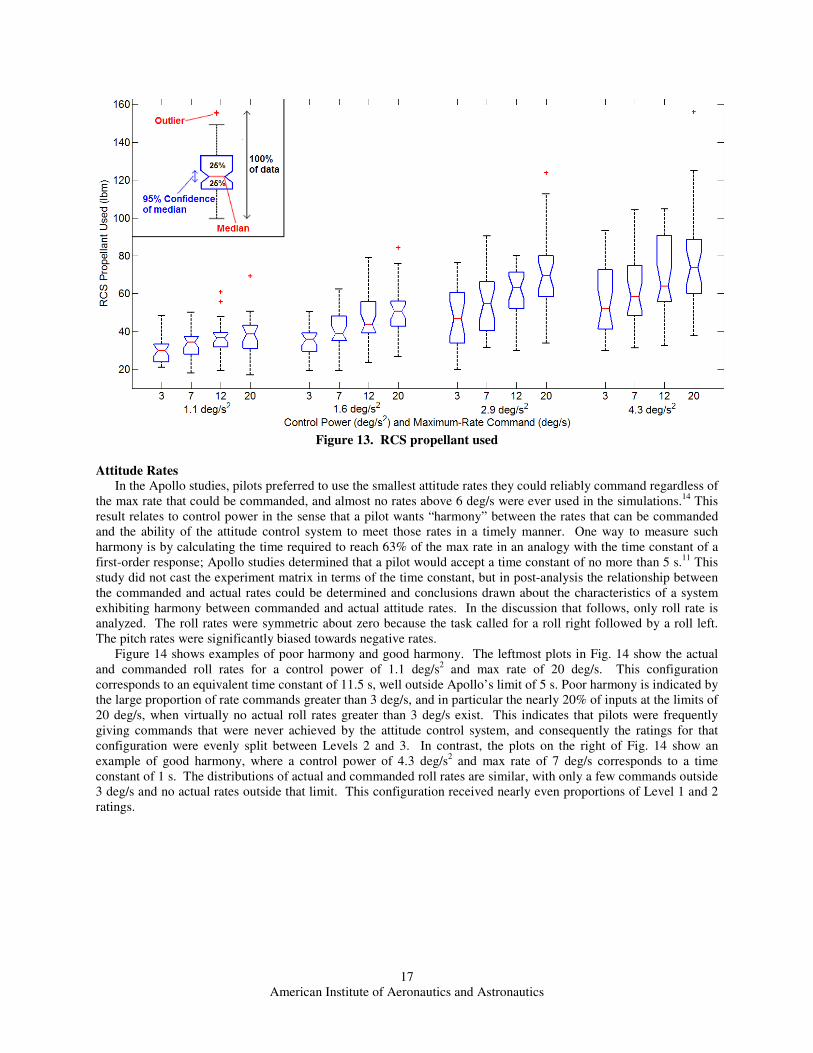
The RCS propellant used during the simulation runs as a function of configuration is shown in Fig. 13. This is an
important metric because reductions in propellant use translate into mass savings, which is difficult to achieve in any
but the earliest design cycles. Figure 13 uses box and whisker plots to show the range of the data, with the median
being represented by the inner red line, the first and third quartiles (25% and 75% of the data) represented by the
edges of the boxes, and the whiskers representing the total extent of the data not including outliers. The notches
(indentations) in the blue boxes represent a 95% confidence interval for the median, and boxes without overlapping
notches indicate statistically significant differences between the medians of those configurations. Propellant use
goes down as the control power (equivalent to the RCS jet thrust) goes down and also decreases as the max-rate
command goes down. These trends are monotonic with only one or two exceptions and, together with the CHR data,
show that handling qualities and propellant use can be improved by reducing the max-rate command.
Unfortunately, the control power cannot be used to improve both metrics simultaneously; improved HQ for these
variations came at the expense of additional propellant use.
American Institute of Aeronautics and Astronautics
17
Figure 13. RCS propellant used
Attitude Rates
In the Apollo studies, pilots preferred to use the smallest attitude rates they could reliably command regardless of
the max rate that could be commanded, and almost no rates above 6 deg/s were ever used in the simulations.14
This
result relates to control power in the sense that a pilot wants “harmony” between the rates that can be commanded
and the ability of the attitude control system to meet those rates in a timely manner. One way to measure such
harmony is by calculating the time required to reach 63% of the max rate in an analogy with the time constant of a
first-order response; Apollo studies determined that a pilot would accept a time constant of no more than 5 s.11
This
study did not cast the experiment matrix in terms of the time constant, but in post-analysis the relationship between
the commanded and actual rates could be determined and conclusions drawn about the characteristics of a system
exhibiting harmony between commanded and actual attitude rates. In the discussion that follows, only roll rate is
analyzed. The roll rates were symmetric about zero because the task called for a roll right followed by a roll left.
The pitch rates were significantly biased towards negative rates.
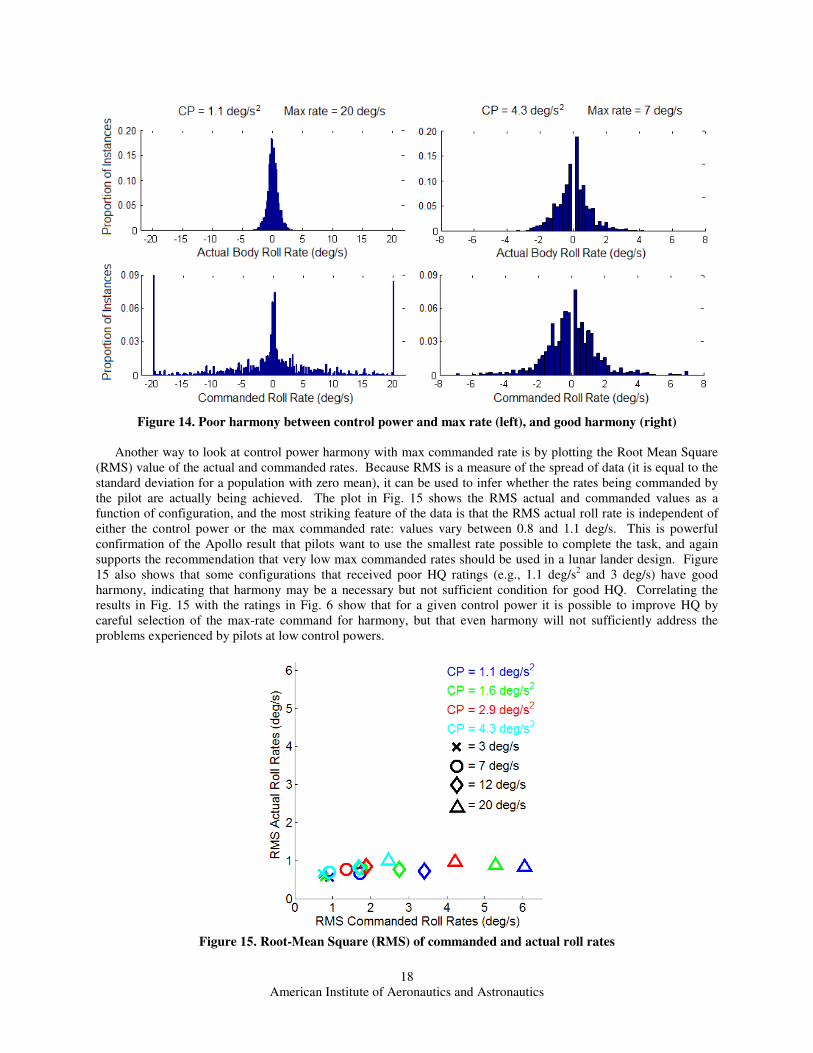
Figure 14 shows examples of poor harmony and good harmony. The leftmost plots in Fig. 14 show the actual
and commanded roll rates for a control power of 1.1 deg/s2 and max rate of 20 deg/s. This configuration
corresponds to an equivalent time constant of 11.5 s, well outside Apollo’s limit of 5 s. Poor harmony is indicated by
the large proportion of rate commands greater than 3 deg/s, and in particular the nearly 20% of inputs at the limits of
20 deg/s, when virtually no actual roll rates greater than 3 deg/s exist. This indicates that pilots were frequently
giving commands that were never achieved by the attitude control system, and consequently the ratings for that
configuration were evenly split between Levels 2 and 3. In contrast, the plots on the right of Fig. 14 show an
example of good harmony, where a control power of 4.3 deg/s2 and max rate of 7 deg/s corresponds to a time
constant of 1 s. The distributions of actual and commanded roll rates are similar, with only a few commands outside
3 deg/s and no actual rates outside that limit. This configuration received nearly even proportions of Level 1 and 2
ratings.
American Institute of Aeronautics and Astronautics
18
Figure 14. Poor harmony between control power and max rate (left), and good harmony (right)
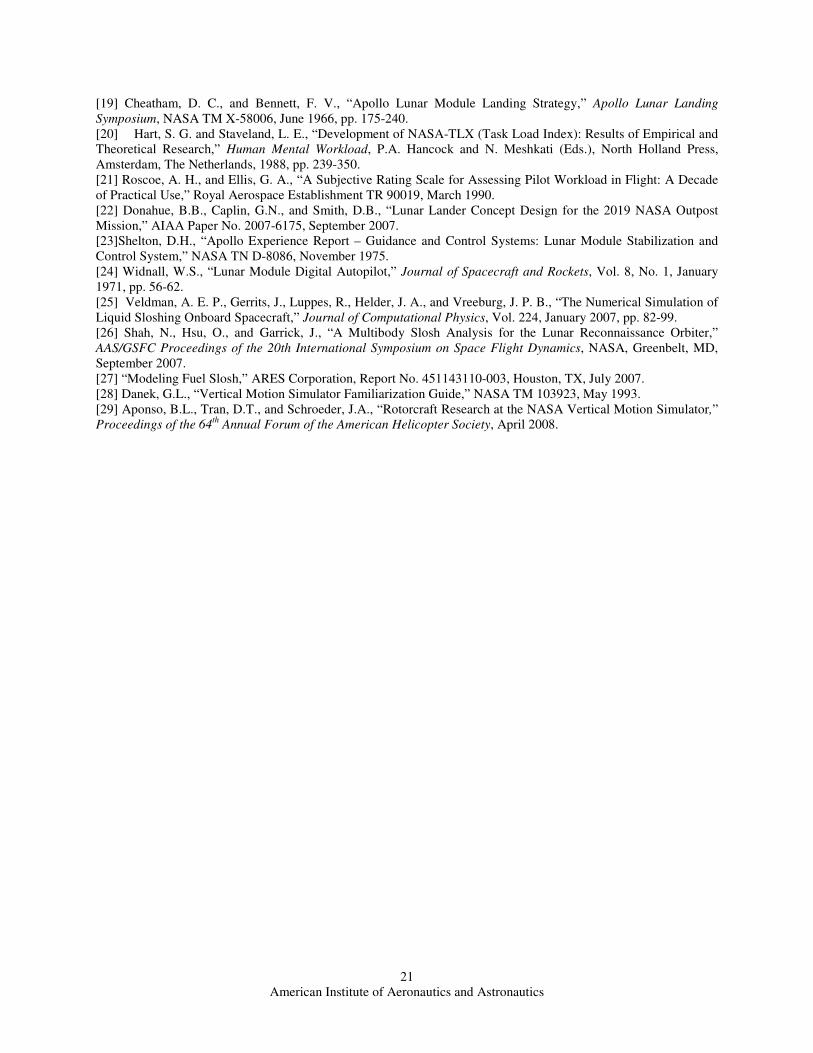
Another way to look at control power harmony with max commanded rate is by plotting the Root Mean Square
(RMS) value of the actual and commanded rates. Because RMS is a measure of the spread of data (it is equal to the
standard deviation for a population with zero mean), it can be used to infer whether the rates being commanded by
the pilot are actually being achieved. The plot in Fig. 15 shows the RMS actual and commanded values as a
function of configuration, and the most striking feature of the data is that the RMS actual roll rate is independent of
either the control power or the max commanded rate: values vary between 0.8 and 1.1 deg/s. This is powerful
confirmation of the Apollo result that pilots want to use the smallest rate possible to complete the task, and again
supports the recommendation that very low max commanded rates should be used in a lunar lander design. Figure
15 also shows that some configurations that received poor HQ ratings (e.g., 1.1 deg/s2 and 3 deg/s) have good
harmony, indicating that harmony may be a necessary but not sufficient condition for good HQ. Correlating the
results in Fig. 15 with the ratings in Fig. 6 show that for a given control power it is possible to improve HQ by
careful selection of the max-rate command for harmony, but that even harmony will not sufficiently address the
problems experienced by pilots at low control powers.
Figure 15. Root-Mean Square (RMS) of commanded and actual roll rates

American Institute of Aeronautics and Astronautics
19
Propellant Slosh
A secondary goal of this study was to conduct a preliminary investigation of the impact of propellant slosh on
handling qualities for a single configuration (1.6 deg/s2 and 7 deg/s). Cooper-Harper rating data in Fig. 16 appears to
confirm the hypothesis that disturbance moments degrade handling qualities; however, the trend is not a strong
function of the disturbance magnitude. The median rating is the same when there is no slosh or a small amount of
slosh, and the number of Level 1 and Level 3 ratings goes up with small disturbances. With the larger gain in the
slosh transfer function the median CHR does worsen by one point and there are no Level 1 ratings, but the number
of Level 3 ratings does not increase. It should be repeated that the propellant slosh model was not high fidelity, and
these results should not imply that propellant slosh will not be a problem for a lunar lander in this configuration (1.6
deg/s2 and 7 deg/s). However, it does appear that the low angular accelerations achieved at this control power are
not sufficient to excite the modeled propellant slosh frequencies. Informal testing at higher control powers seemed
to indicate that slosh would be a bigger problem with more powerful RCS thrusters, so further testing with a detailed
slosh model and lander characteristics closer to a final design will be warranted.
Figure 16. Proportion of Cooper-Harper ratings with propellant slosh for 1.6 deg/s
2 and 7 deg/s
Conclusions
Twelve NASA astronauts and test pilots participated in a simulation evaluation of the handling qualities of a
lunar lander during the final phase of a precision approach and landing using attitude error guidance. The parameters
under study were the control power, defined as the angular acceleration that could be achieved by the vehicle, and
the angular rate commanded at maximum inceptor deflection, which is equivalent to inceptor sensitivity. A
secondary objective was to measure the handling qualities degradation from propellant slosh. Altogether, 18
configurations were tested, with control powers ranging from 1.1 to 4.3 deg/s2, max-rate commands ranging from 3
to 20 deg/s—equivalent to a range of inceptor sensitivities—and two levels of propellant slosh.
Handling qualities improve with increasing control power and decreasing max-rate command, but the interplay
of these two factors is not necessarily linear or monotonic. Control powers around 2.9 deg/s2 or higher appear to
have similar handling qualities, up to the limit of the tested control power of 4.3 deg/s2, and control power appears to
be the dominant factor in comparison with max-rate command. At these higher control powers the handling
qualities are borderline Level 1/2, and at the lower control powers between 1.1 and 1.6 deg/s2 the handling qualities
range from Level 2 to borderline Level 2/3. Control power alone was not sufficient to achieve Level 1 for the
guidance-following precision landing task, but it did improve range performance at touchdown and achieve better
correspondence between the attitude rates the pilots commanded and the attitude rates that were actually achieved.
The max-rate command had an important effect on handling qualities at all but the highest control power, and in
those cases reducing the max-rate command was shown to both improve handling qualities and reduce propellant
usage. For the highest control power, 4.3 deg/s2, the max rate had little impact on handling qualities as long as it was
less than 20 deg/s. For all lower control powers the best handling qualities were achieved at 3 deg/s for max
inceptor displacement, in some cases even achieving Level 1; this seemingly low value is actually consistent with
the rates achieved at the highest control powers and max-rate commands, suggesting that higher max rates are not

American Institute of Aeronautics and Astronautics
20
only unnecessary but also detrimental to pilot performance and/or workload. Low max rates contribute to good
control harmony for the ranges of control power tested, but they did not have any effect on range at touchdown
performance. The combined max rate and control power results have been used to estimate the boundaries of a
region with Level 1 handling qualities for a precision landing task following attitude guidance.
The propellant slosh results confirm that handling qualities degrade as the magnitude of the disturbance moment
increases, but the net degradation was not large. Median Cooper-Harper ratings were the same for no coupling and a
low coupling case, and worsened by one point in high coupling. It is believed that the low value of control power
under which slosh was tested contributed to the lack of a strong degradation in handling qualities, and that a vehicle
with higher control power would experience poorer handling qualities than measured in this experiment.
Acknowledgements
The SimLabs staff at NASA Ames set up the details of the experiment on the VMS and their efforts are greatly
appreciated. In particular, the authors would like to acknowledge the substantial contributions of simulation
engineers Mike Weinstein, Mike Leonard and Scott Reardon, who developed and tested all software for the lunar
lander dynamics and control model, and assisted in day-to-day execution of the experiment. Bo Bobko served as
project pilot and contributed to model development and testing, and both he and Kathleen Starmer recruited the
outstanding pool of evaluation pilots. Boris Rabin created the out-the-window visuals. Thanks are also due to Kevin
Duda, Michael Johnson and Steve Pashcall from the ALHAT Project, Dougal MacLise and Ron Sostaric of the
Altair Project and Howard Law for providing Altair mass properties, dimensions and propulsion system data.
References
[1] Cooper, G.E. and Harper, R.P., “The Use of Pilot Rating in the Evaluation of Aircraft Handling Qualities,”
NASA TN D-5153, April 1969.
[2] Soule, H.A., “Preliminary Investigation of the Flying Qualities of Airplanes,” NACA Report 700, 1940.
[3] Gilruth, R.R., “Requirements for Satisfactory Flying Qualities of Airplanes,” NACA TR 755, 1943.
[4] Cooper, G.E. and Harper, R.P., “Handling Qualities and Pilot Evaluation," Journal of Guidance, Control, and
Dynamics, Vol. 9, No. 5, Sep-Oct 1986, pp. 515-529.
[5] “Military Standard, Flying Qualities of Piloted Airplanes,” MIL-STD-1797, March 1987.
[6] Aeronautical Design Standard, Performance Specification: Handling Qualities Requirements for Military
Rotorcraft,” ADS-33, May 1996.
[7] Matranga, G. L., Mallick, D. L., and Kleuver, E. E., “An Assessment of Ground and Flight Simulators for the
Examination of Manned Lunar Landing,” AIAA Paper 67-238, February 1967.
[8] Nassiff, S. H., and Armstrong, N. A., “Apollo Flightcrew Training in Lunar Landing Simulators,” AIAA Paper
68-254, March 1968.
[9] Jarvis, C. R., “Operational Experience with the Electronic Flight Control Systems of a Lunar-Landing Research
Vehicle,” NASA TN D-3689, October 1966.
[10] Ottinger, C. W., “Go For Lunar Landing Conference Report,”
http://ser.sese.asu.edu/GO/GoReportVersion1.13.pdf, September 2008.
[11] Cheatham, D. C., and Hackler, C. T., “Handling Qualities for Pilot Control of Apollo Lunar-Landing
Spacecraft,” NASA TMX 57138, November 1964.
[12] Cheatham, D. C., and Moore, T. E., “Study of the Attitude Control Handling Qualities of the LEM During the
Final Approach to Lunar Landing,” NASA TMX-65228, May 1963.
[13] Hewes, D. E., “Interim Report on Flight Evaluations of Lunar Landing Vehicle Attitude Control Systems,”
AIAA Paper 67-239, February 1967.
[14] Stengel, R. F., “Manual Attitude Control of the Lunar Module,” Journal of Spacecraft, Vol. 7, No. 8, August
1970, pp. 941-948.
[15] Jarvis, C. R., “Flight-Test Evaluation of an On-Off Rate Command Attitude Control System of a Manned
Lunar-Landing Research Vehicle,” NASA TN D-3903, April 1967.
[16] Cooper, G. E., “Understanding and Interpreting Pilot Opinion,” Aeronautical Engineering Review, Vol. 16,
No. 3, March 1957, pp. 47-51, 56.
[17] Jones, E. M., “The First Lunar Landing,” Apollo Lunar Surface Journal [online database],
http://history.nasa.gov/alsj/a11/a11.html [retrieved 4 August 2009]
[18] Bilimoria, K. D., “Effects of Control Power and Guidance Cues on Lunar Lander Handling Qualities,” AIAA
Paper 2008-7799, September 2008.
American Institute of Aeronautics and Astronautics
21
[19] Cheatham, D. C., and Bennett, F. V., “Apollo Lunar Module Landing Strategy,” Apollo Lunar Landing
Symposium, NASA TM X-58006, June 1966, pp. 175-240.
[20] Hart, S. G. and Staveland, L. E., “Development of NASA-TLX (Task Load Index): Results of Empirical and
Theoretical Research,” Human Mental Workload, P.A. Hancock and N. Meshkati (Eds.), North Holland Press,
Amsterdam, The Netherlands, 1988, pp. 239-350.
[21] Roscoe, A. H., and Ellis, G. A., “A Subjective Rating Scale for Assessing Pilot Workload in Flight: A Decade
of Practical Use,” Royal Aerospace Establishment TR 90019, March 1990.
[22] Donahue, B.B., Caplin, G.N., and Smith, D.B., “Lunar Lander Concept Design for the 2019 NASA Outpost
Mission,” AIAA Paper No. 2007-6175, September 2007.
[23]Shelton, D.H., “Apollo Experience Report – Guidance and Control Systems: Lunar Module Stabilization and
Control System,” NASA TN D-8086, November 1975.
[24] Widnall, W.S., “Lunar Module Digital Autopilot,” Journal of Spacecraft and Rockets, Vol. 8, No. 1, January
1971, pp. 56-62.
[25] Veldman, A. E. P., Gerrits, J., Luppes, R., Helder, J. A., and Vreeburg, J. P. B., “The Numerical Simulation of
Liquid Sloshing Onboard Spacecraft,” Journal of Computational Physics, Vol. 224, January 2007, pp. 82-99.
[26] Shah, N., Hsu, O., and Garrick, J., “A Multibody Slosh Analysis for the Lunar Reconnaissance Orbiter,”
AAS/GSFC Proceedings of the 20th International Symposium on Space Flight Dynamics, NASA, Greenbelt, MD,
September 2007.
[27] “Modeling Fuel Slosh,” ARES Corporation, Report No. 451143110-003, Houston, TX, July 2007.
[28] Danek, G.L., “Vertical Motion Simulator Familiarization Guide,” NASA TM 103923, May 1993.
[29] Aponso, B.L., Tran, D.T., and Schroeder, J.A., “Rotorcraft Research at the NASA Vertical Motion Simulator,”
Proceedings of the 64th
Annual Forum of the American Helicopter Society, April 2008.