effects of copper on aquatic species: a review of the literature · 2011. 6. 25. · seattle, wa...
TRANSCRIPT

Technical Report No. 09-04
Effects of Copper on Aquatic Species: A review of the literature by Phyllis Weber Scannell Scannell Technical Services
Limnephilidae, North American Benthological Society
June 2009 Alaska Department of Fish and Game Division of Habitat

The Alaska Department of Fish and Game (ADF&G) administers all programs and activities free from discrimination based on race, color, national origin, age, sex, religion, marital status, pregnancy, parenthood, or disability. The department administers all programs and activities in compliance with Title VI of the Civil Rights Act of 1964, Section 504 of the Rehabilitation Act of 1973, Title II of the Americans with Disabilities Act of 1990, the Age Discrimination Act of 1975, and Title IX of the Education Amendments of 1972.
If you believe you have been discriminated against in any program, activity, or facility please write:
●ADF&G ADA Coordinator, P.O. Box 115526, Juneau, AK 99811-5526
●U.S. Fish and Wildlife Service, 4401 N. Fairfax Drive, MS 2042, Arlington, VA 22203
●Office of Equal Opportunity, U.S. Department of Interior, 1849 C Street NW MS 5230, Washington DC 20240
The department’s coordinator ADA Coordinator can be reached via phone at the following numbers:
●(VOICE) 907-465-6077
●(Statewide Telecommunication Device for the Deaf) 1-800-478-3648
●(Juneau TDD) 907-465-3646
●(FAX) 907-465-6078
For information on alternative formats and questions on this publication, please contact the following:
●ADF&G, Division of Habitat, 1300 College Road, Fairbanks, AK 99701 (907)459-7289.

EFFECTS OF COPPER ON AQUATIC SPECIES: A REVIEW OF THE LITERATURE
By
Phyllis Weber Scannell
Kerry M. Howard Director
Division of Habitat Alaska Department of Fish and Game


Table of Contents
Table of Contents................................................................................................................. i List of Tables ..................................................................................................................... iii List of Figures .................................................................................................................... iv Acknowledgements............................................................................................................. v Executive Summary ........................................................................................................... vi Introduction......................................................................................................................... 1
Water Quality Criteria: Fresh Water Aquatic Life ......................................................... 1 Characteristics and Bioavailability of Cu ....................................................................... 2
Methods for Measuring Copper.................................................................................. 4 Summary of Cu Effects................................................................................................... 4
Acute Toxicity to Fish ................................................................................................. 4 Acute Toxicity to Aquatic Invertebrates...................................................................... 4 Chronic Toxicity to Fish ............................................................................................. 5 Chronic Effects to Aquatic Invertebrates.................................................................... 9 Effects to Aquatic Algae and Plants.......................................................................... 10 Bioaccumulation ....................................................................................................... 10
Annotated Bibliography.................................................................................................... 11 Copper Speciation and Bioavailability ......................................................................... 11
De Schamphelaere et al. 2004 .................................................................................. 11 Ferreira et al. 2008................................................................................................... 13 Hyne et al. 2005 ........................................................................................................ 14 Martin and Goldblat 2007 ....................................................................................... 16 McGreer et al. 2003 .................................................................................................. 17 MacRae et al. 2003 ................................................................................................... 18 Sciera et al. 2004 ...................................................................................................... 20
Support of Standards..................................................................................................... 22 Brix et al. 2001.......................................................................................................... 22 Brooks et al. 2006 .................................................................................................... 24 Carlson et al. 1986.................................................................................................... 25 DiToro et al. 2001..................................................................................................... 26
Acute and Chronic Effects ............................................................................................ 28 Baldigo and Baudanza 2001 .................................................................................... 28 Beaumont et al. 1995. ............................................................................................... 29 Buhl and Hamilton 1990 .......................................................................................... 30 Hansen et al. 2002a. ................................................................................................. 32 Hansen et al. 2002b ................................................................................................. 34 Hecht et al. 2007 ...................................................................................................... 35 Kazlauskiene 2002 ................................................................................................... 37 Taylor et al. 2004 ..................................................................................................... 39
Cellular Level Effects ................................................................................................... 41 Bettini et al. 2006 ..................................................................................................... 41 Geist et al. 2007. ...................................................................................................... 42 Taylor et al. 2000 ..................................................................................................... 43
Effects on Fish Behavior............................................................................................... 45 Atchison et al. 1987.................................................................................................. 45
Baldwin et al. 2003 ................................................................................................... 47 Carreau and Pyle 2005 ............................................................................................ 48 Giattina et al. 1982 .................................................................................................. 49 Hansen et al. 1999a ................................................................................................. 50 Hansen et al. 1999b ................................................................................................. 52 Hansen et al. 1999c.................................................................................................. 53 Linbo et al. 2006 ...................................................................................................... 55 Sandahl et al. 2004 .................................................................................................. 56 Sandahl et al. 2006 .................................................................................................. 57 Sandahl et al. 2007 .................................................................................................. 58 Scherer and McNicol 1998 ...................................................................................... 59 Sloman et al. 2003..................................................................................................... 60
Aquatic Invertebrates .................................................................................................... 61 Freshwater mussels ....................................................................................................... 61
Cope et al. 2008 ....................................................................................................... 62 March et al. 2007 ..................................................................................................... 63 Wang et al. 2007a .................................................................................................... 65 Wang et al. 2007b .................................................................................................... 67 Wang et. al. 2007c ................................................................................................... 69
Aquatic Arthropods....................................................................................................... 70 Beltman et al. 1999 .................................................................................................. 70 Bossuyt et al. 2005 .................................................................................................. 71 Clements et al. 1988................................................................................................. 74 Clements et al. 1992................................................................................................. 75 De Schamphelaere et al. 2007 ................................................................................. 76
Effects to Plants and Algae ........................................................................................... 77 Franklin et al. 2000.................................................................................................. 77 Franklin et al. 2002.................................................................................................. 78
Briefly Reviewed .......................................................................................................... 80 Atli and Canli 2003 .................................................................................................. 80 Averyt et al. 2004 ..................................................................................................... 80 Eisler 1998 ............................................................................................................... 81 Hansen et al. 1996 ................................................................................................... 81 Sloman et al. 2005.................................................................................................... 82
Literature Cited ................................................................................................................. 83 Index ................................................................................................................................. 89
Appendix 1. Glossary of Terms ................................................................................... 90 Appendix II. Acute toxicity values for fish reported in criterion. ............................... 92 Appendix III. Chronic toxicity values for fish reported in published literature .......... 97 Appendix IV. Acute toxicity values for aquatic invertebrates reported .................... 100 Appendix V. Chronic toxicity values for aquatic invertebrates................................. 107
ii
List of Tables
1. Acute and chronic water quality criteria for Cu at different concentrations.................. 2 2. Solubility of different Cu compounds. Data from Weast and Astle 1980. ................... 3 3. Summary of acute toxicity values reported in published literature ............................... 5 4. Summary of chronic effects of Cu to fish reported in literature .................................... 9 5. Summary of chronic effects of Cu to freshwater mussels. .......................................... 10 6. Toxicity of Cu to Daphnia magna (48-hr EC50) in laboratory water ......................... 12 7. Calculated speciation of Cu in synthetic soft water at varying pH.............................. 14 8. Calculated speciation of Cu in synthetic soft water at added DOC............................. 15 9. Conditional stability constants for different ligands and concentration of free Cu2+ .. 19 10. Acute sensitivities of select freshwater organisms to Cu........................................... 23 11. Acute toxicity of Cu to Arctic grayling, coho salmon and rainbow trout.................. 31 12. Percent reduction in growth and growth inhibition concentration values ................. 32 13. Summary of acute and chronic toxicity of Cu ........................................................... 45 14. Effects of Cu on Fish Avoidance ............................................................................... 46 15. Effects of Cu on Fish Respiration (elevated ventilation and coughing rates)............ 46 16. Freshwater unionid mussel species and associated species mean acute values......... 64 17. 24-h and 48-h EC50 concentrations for two species of freshwater mussel ............... 66 18. Summary of test results of freshwater mussel glochidia, new juveniles ................... 68 19. The mean EC50 of field-collected cladoceran species. Hardness = 250 mg l .-1 ....... 72 20. Effect of initial cell density on toxicity of Cu to Chlorella sp................................... 79
iii

List of Figures
1. Relationship between increased concentration of DOM and decreased toxicity......... 12
iv

Acknowledgements
This work was supported by the Alaska Department of Fish and Game, Division of Habitat. I thank Division of Habitat, Dr. Alvin G. Ott, Mr. Robert McLean and Mr. Bill Morris for their support in this project. They provided useful input and guidance. Two reviewers, Mr. Joe Klein and Mr. Michael Daigneault, provided thoughtful comments that improved this document. Dr. Bert Shepherd, US Environmental Protection Agency, Seattle, WA generously shared draft copies of his literature review of copper effects on fish behavior. I thank Dr. Shepherd for sharing his extensive knowledge on copper effects. Ms. Celia Rozen, librarian for Alaska Department of Fish and Game, arranged for me to have access to the extensive electronic library of journal articles and procured articles for me. I thank Ms. Rozen for her time and support. I thank Ms. Patty Smith, ADFG Habitat Division for her help with all administrative matters. This work was supported by the Pebble Limited Partnership (PLP) via a Reimbursable Services Agreement provided by the Alaska Department of Natural Resources to Habitat Division.
v
Executive Summary
A review of published scientific literature was done to address concerns from state agencies and environmental groups that the current Alaska Water Quality (AWQ) acute and chronic Cu criteria may not adequately protect aquatic life. Seventy-five published reports on Cu toxicity were reviewed; forty-seven reports were given an extensive review and annotation. Results of this review are summarized below.
The AWQ acute and chronic criteria for Cu are based on measurements of dissolved Cu and are adjusted for hardness. The acute limit in moderately hard water (from 61 to 120 ppm total hardness) would be from 8.8 to 16.6 μg Cu l-1 and the hardness adjusted chronic limit would be from 6.1 to 10.9 μg Cu l-1.
The lowest detection limits for Cu in water for most analytical methods are from 0.5 to 1 μg Cu l-1.
Free Cu2+ ions are the primary copper species responsible for toxicity, although Cu(OH)2 and Cu(OH)+ species may be somewhat toxic. Cu+ species are generally less soluble or insoluble.
The toxicity of Cu to aquatic biota is reduced by complexation with common, naturally occurring inorganic and organic ligands including humic, fulvic and hydrophilic acids and other forms of dissolved organic carbon. The addition of 5 mg l-1 dissolved organic carbon (DOC) can reduce available Cu2+ ions from 71% to 3% (of the total Cu species).
Water hardness also reduces Cu toxicity; Cu has been found to be approximately 20 times more toxic to fish in soft water (20 mg l-1) than in hard water (120 mg l-1 as CaCO3). Hardness is usually interactive with alkalinity and pH, and all three factors influence Cu bioavailability.
Acute Toxicity
Seventy-eight different results for acute toxicity to fish (primarily fish of the family Salmonidae, but including fathead minnows) were found in the reviewed literature. Fifty-nine of these acute toxicity values were associated with hardness of the test water. Of these 59 values, 3 were lower than the AWQ acute criterion for Cu.
Review of literature on Cu toxicity to aquatic invertebrates resulted in 204 values for acute toxicity, ranging from a LOEC of 4.8 μg Cu L-1 for the fatmucket Lampsilis siliquoidea to values >100 μg Cu L-1 for different species of freshwater mussels, zooplankton and aquatic insects.
Seven Cu acute toxicity values were found for aquatic insects; 1 value was below the hardness-adjusted acute criterion.
vi

For freshwater mussels, 140 values were reported in the literature; 57 of these values were below the hardness-adjusted acute criterion. Although approximately 40% of the acute toxicity values for freshwater mussels were below the acute criterion, the authors of these reports state that the reconstituted lab water used for the tests does not adequately represent the balance of ions and organic acids found in most natural systems. The results of these tests identify freshwater mussels as likely more sensitive than other aquatic species; however, the level of sensitivity found in these studies may be substantially lower than would occur in natural systems.
For zooplankton, 58 values were found in the literature; 22 of these values were below the hardness adjusted acute criterion.
Chronic Effects: Fish
Chronic effects of Cu to fish may include decreased growth, changes in fish behavior, including olfactory responses, and changes in swimming ability or swimming speed. Shephard (2008) conducted a literature review on Cu effects on behavior of freshwater and marine fish. He synthesized information from 52 published reports containing 105 different LOEC values for laboratory studies of Cu effects on freshwater fish. Ninety seven percent of the LOEC values (102 of the 105 LOEC’s) were higher than the US EPA or AWQ hardness adjusted chronic criterion for Cu. Shephard reported that avoidance was the only behavioral endpoint with LOEC’s lower than the chronic criterion.
Effects on fish growth reported in the literature occurred at concentrations higher than the AWQ chronic criterion. Effects on agonistic behaviors (competitive ability, social hierarchy) in fish occurred at concentrations higher than the AWQ chronic criterion.
Studies of effects of Cu on the olfactory epithelial structure and olfactory response to odorant stimulus showed reductions in olfactory responses at concentrations below the AWQ chronic criterion. Sandahl et al. found that exposure to the lowest Cu concentration tested, 2 μg Cu l-1, significantly reduced olfactory responses. Fish exposed to 20 μg Cu l-1 showed no response to the odorant stimulus and Sandahl et al. concluded that exposure to 20 μg Cu l-1 essentially abolished olfactory responses.
Short-term exposures to dissolved Cu at low concentrations (up to 20 μg l-1) reduced the ability of salmon to detect odors by inhibiting the electrical properties of olfactory receptor neurons. (The effects concentration of 20 μg l-1 is higher than the AWQ chronic criterion for all waters except extremely hard water of about 240 ppm total hardness or greater). Avoidance of Cu was demonstrated in shallow gradients with Cu at concentrations of about 4.4 μg l-1 and attraction at high concentrations of 334 to 386 2.7 μg Cu l-1. Critical swimming performance was impaired in rainbow trout exposed to 10 μg Cu l-1. Effects on swimming performance were greatest in test water with low pH and low hardness. The AWQ chronic criterion for soft water is 0.3 to 6.1 μg Cu l-1.
vii

viii
Chronic Effects: Aquatic Invertebrates
Cu concentrations in the range of 15 to 32 μg L-1 reduced both the numbers of taxa and numbers of individuals in a natural system. These values are above the AWQ chronic criterion for hardness up to 180 ppm.
Cu concentrations of approximately15 μg L-1 in a natural system resulted in significant changes in invertebrate community structure, with a decline in Ephemeroptera, Plecoptera, Trichoptera and Coleoptera over unaffected sites. These values are above the AWQ chronic criterion for hardness up to 180 ppm.
Growth of freshwater mussels was reduced in water with 7.5 to 12 μg Cu l-1. The AWQ chronic criterion at the hardness of the test water is about 15.4 μg Cu l-1.
Effects to Aquatic Algae and Plants
The 72-h EC50 for Chlorella sp was higher than the AWQ hardness adjusted chronic criterion.
Adequacy of AWQ Acute and Chronic Criteria for Cu
Most of the acute and chronic toxicity values reported in the literature were above the Alaska Water Quality criteria for Cu. In many studies, effects were found at concentrations substantially higher than the AWQ criteria. Exceptions were acute effects to zooplankton and freshwater mussels. Species in these groups are likely more sensitive to Cu toxicity. However, effects concentrations reported in the literature, especially for freshwater mussels, may be artificially low because tests were done in reconstituted laboratory water without the natural balance of ions and ligands. Chronic effects (olfactory suppression) to freshwater fish were reported at concentrations lower than the AWQ chronic criterion; however, these tests were conducted with possibly stressed fish in laboratory water with low DOC.
In most natural water systems, the AWQ acute and chronic criteria should provide adequate protection to most aquatic species. Resource managers could increase the likelihood of protecting all species by testing receiving water for concentrations of major ions and dissolved organic carbon. Waterways with freshwater mussels or zooplankton may require site-specific criteria, especially if DOC concentrations are low.

Introduction
This paper provides a brief discussion of the US Environmental Protection Agency (USEPA) and the State of Alaska Water Quality (AWQ) acute and chronic copper (Cu) criteria for aquatic life. A review of published scientific literature was done to address concerns from state and federal agencies and the public that the current AWQ acute and chronic Cu criteria may not adequately protect aquatic life. This report includes an annotated bibliography of published literature and a discussion of Cu speciation and bioavailability, and effects of Cu to fish, aquatic invertebrates, aquatic plants and algae.
The annotated bibliography provides a discussion of published research papers on Cu bioavailability and toxicity to aquatic species. The bibliography focuses on more current research (usually 1995 and later) but includes some earlier papers that have been cited by a number of authors, agencies and environmental groups. Many of the research papers address a range of topics, such as effects to behavior and acute toxicities. As much as possible, the papers are divided by topic in an attempt to increase the usefulness of this review.
Following the bibliography are appendices containing all acute and chronic toxicity data found in the literature review. Appendix I contains a list of terms used in this paper with definitions.
Water Quality Criteria: Fresh Water Aquatic Life
Until 1993, water quality criteria (WQC) in the United States were based on total acid-recoverable Cu concentrations. Except for water hardness corrections, chemical speciation effects on toxicity were not considered. As a result, bioavailable Cu concentrations in some surface waters may have been significantly overestimated.
In 1993, in recognition of Cu speciation and bioavailability, the USEPA changed the WQC to allow measures of dissolved Cu. Cu measured as dissolved is a more realistic estimate of bioavailability; however, dissolved Cu still has some inherent bias. If metals are strongly complexed with dissolved organic material, measurements as dissolved Cu may overestimate bioavailable metal concentrations. In contrast, if metals are weakly sorbed to inorganic or organic particles, measurements of dissolved Cu concentrations may underestimate bioavailable metal concentrations.
The water quality criterion of Cu for protection of aquatic life in fresh waters is based on the USEPA Water Quality Criteria Documents for the Protection of Aquatic Life in Ambient Water (USEPA 1996). The Cu criterion is dependent on hardness, or concentration of CaCO3 in the water. Table 1 gives the one-hour average (acute) limit and the four-day average (chronic) limit for hardness from 25 to 400 mg l-1. The AWQ criteria for Cu are the same as the USEPA.

2
Table 1. Acute and chronic water quality criteria for Cu at different concentrations of total hardness.
Hardness mg l-1 as CaCO3
One-hr average limit ug l-1
as total recoverable
One-hr average limit ug l-1
as dissolved
4-d average limit ug l-1
as total recoverable
4-d average limit ug l-1
as dissolved
25 3.8 3.6 2.9 2.7 50 7.3 7.0 5.2 5.0
100 14.0 13.4 9.3 9.0 200 26.9 25.8 16.9 16.2 250 33.2 31.9 20.4 19.6 300 39.4 37.8 23.9 22.9 350 45.6 43.8 27.3 26.2 400 51.7 49.6 30.6 29.3
A water criterion consists of two concentrations: the criterion continuous concentration (CCC, often referred to as chronic) and the criterion maximum concentration (CMC, often referred to as acute). The criterion as stated in the procedures described in “Guidelines for Deriving Numerical National Water Quality Criteria for the Protection of Aquatic Organisms and Their Uses” (Stephan 1985) is as follows:
Except possibly where a locally important species is very sensitive, freshwater aquatic organisms should not be affected unacceptably if the 4-d average concentration of the material of interest does not exceed the CCC more than once every 3 years, on the average, and the 1-h average concentration does not exceed the CMC more than once every 3 years, on the average.
Species within the genus Daphnia have been identified in the national criteria document for Cu (USEPA 1984) as the most sensitive based on acute toxicity data and as among the most sensitive based on chronic toxicity data.
Characteristics and Bioavailability of Cu
Free Cu2+ ions have long been recognized as the primary Cu species responsible for toxicity, although Cu(OH)2 and Cu(OH)+ species may be somewhat toxic. Cu+ species are generally less soluble or insoluble (Table 2).

3
Table 2. Solubility of different Cu compounds. Data from Weast and Astle 1980. CuCl2 Copper chloride (II) 70.6 CuCl Copper chloride (I) 0.0062 Cu2Cr2O4 Copper chromate Insoluble CuH Copper hydroxide (I) Insoluble Cu(OH)2 Copper hydroxide Insoluble Cu2SO4 Copper sulfate(I) Decomposes CuSO4 Copper sulfate (II) 14.3 The toxicity of Cu to aquatic biota is reduced by complexation with common, naturally occurring inorganic and organic ligands (DeSchamphelaere et al. 2004, MacRae et al. 1999, and DiToro et al. 2001). These Cu-ligand interactions may decrease the bioavailable fraction of Cu and decrease its toxicity below that predicted from total Cu concentrations. Dissolved organic matter (DOM) decreases metal uptake and toxicity in aquatic organisms by decreasing the chemical activity of the free ionic Cu2+. Aquatic DOM often is categorized into different fractions, such as humic acid, fulvic acid and hydrophilic acid. These fractions have different binding strengths, different affinities for Cu and different capacities to form stable complexes (De Schamphelaere et al. 2004). Therefore, similar Cu concentrations in water from different sources and containing both different amounts and different types of DOM, may have substantially different toxicities.
Hyne et al. (2005) showed that 71% of Cu in synthetic soft water was available as Cu2+; however, the addition of 5 mg l-1 dissolved organic carbon (DOC) reduced the proportion of Cu2+ to 3% (of the total Cu species) and increased the Cu-Fulvic Acid complexes from <1% to 96%. Hyne et al. further demonstrated that toxicity of Cu to Ceriodaphnia dubia decreased linearly with the addition of DOC. The 48-h EC50 (defined in Appendix I) was 1.6 μg l-1 in water containing 1 mg l-1 DOC. When 5 mg l-1 DOC was added, the toxicity of Cu to C. dubia was reduced and the 48-h EC50 was 60 μg l-1. Cu toxicity to C. dubia was lowest in water with the highest concentration of DOC: When 8 mg l-1
DOC was added, the 48-h EC50 was 100 μg l-1.
Water hardness is the only physiochemical variable used for regulating divalent metal exposures, such as Cu2+, in receiving waters. Taylor et al. (2000) found that Cu was approximately 20 times more toxic to 1- to 2-g rainbow trout in soft water (20 mg l-1) than in hard water (120 mg l-1 as CaCO3). In most natural systems, hardness is interactive with alkalinity and pH. Calcium and magnesium inhibit metal uptake and, hence, toxicity. Alkalinity directly affects metal speciation in solution through the formation of Cu-carbonate complexes. Water pH is an important factor affecting the toxicity of metals to freshwater biota, possibly because of an increase in the predominance of free metal Cu with lower pH (Hyne et al. 2005). Changes in pH may affect binding by ligands, with weaker Cu-ligand complexes formed in water with lower pH (DiToro et al. 2001). Because hardness is interactive with alkalinity and pH, it remains a reliable factor in setting water quality criteria.

4
Methods for Measuring Copper
Dissolved Cu samples are filtered in the field through a 0.45 µm membrane filter and preserved with nitric acid. Filtering should be done in a clean, usually disposable, filter immediately after collection. Water samples are analyzed in a laboratory by a variety of methods, including Inductively Coupled Plasma by Optical Emission Spectrometry (ICP-OES): ICP 1502 or Atomic Absorption Spectrometry. Detection limits usually range from 0.5 to 1 μg l-1. Total Cu is measured from an unfiltered water sample, using the same laboratory methods and same detection limits.
Researchers are attempting to develop methods to measure biologically available Cu. One such method, still in development, is the diffusion gradient in thin films (DGT).
Summary of Cu Effects
Acute Toxicity to Fish
Copper is a common element in the environment and as a micro-nutrient, it is essential for the growth and metabolism of all living organisms (Eisler 1998). Cu can be toxic to many different species of organisms at concentrations above the micronutrient level. Seventy-eight different results for acute toxicity to fish (primarily fish of the family Salmonidae, but including fathead minnows) were found in the literature (Appendix II). Fifty-nine of the acute toxicity values reported in the literature were associated with hardenss levels in test water. Three of the hardness-based acute toxicity values were below the AWQ Acute criterion for Cu (Table 3). Buhl and Hamilton (1990) reported a 24-h LC50 value of 5.93 μg l-1 and a 96-h LC50 of 2.7 μg l-1 for swim-up Arctic grayling fry of 0.2 g. Buhl and Hamilton also reported a 96-h LC50 of 2.58 μg l-1 for swim-up Arctic grayling fry of 0.34 g. The Arctic grayling were tested in laboratory water with added hardenss of 41 mg l-1.
Acute toxicity values reported in published studies that did not contain information on hardness of the test water were compared with the AWQ Acute criterion for Cu at 50 mg l-1. Of the 19 acute toxicity values without reported hardness values, no values were below the AWQ Acute criterion for Cu at 50 mg l-1:
Acute Toxicity to Aquatic Invertebrates
Aquatic invertebrates, in general, are more sensitive to Cu toxicity than most fish. The degree of sensitivity to Cu depends on both the species and life stage. Bossuyt et al. (2005) reported that D. magna is among the least-sensitive cladoceran species and C dubia one of the most sensitive species. Brix (2001) reported even lower acute toxicity values for C. reticulata. Review of literature on Cu toxicity to aquatic invertebrates resulted in 205 values for acute toxicity, ranging from a LOEC of 4.8 μg Cu l-1 for the fatmucket Lampsilis siliquoidea to values >100 μg Cu l-1 for different species of freshwater mussels, zooplankton and aquatic insects (Table 3, Appendix V).
Seven Cu acute toxicity values were found for aquatic insects; 1 value was below the AWQ hardness-adjusted acute criterion. For freshwater mussels, 140 values were reported in the literature; 57 of these values were below the AWQ hardness-adjusted

5
acute criterion. For zooplankton, 58 values were found in the literature; 22 of these values were below the AWQ hardness adjusted acute criterion.
Table 3. Summary of acute toxicity values reported in published literature for different aquatic species. Refer to Appendices II and IV for species values and citations.
Organism Number of Acute Toxicity Values Reported
No. of acute values lower than AWQ hardness-adjusted acute criterion
Maximum Toxicity Value, μg Cu l-1
Minimum Toxicity Value, μg Cu l-1
Fish 78 3 1100 2.58 Freshwater mussels
140 57 >100 4.8
Zooplankton 58 22 1290 5.3 Aquatic Insects 7 1 10,242 5 Both zooplankton and freshwater mussels are more sensitive to acutely toxic effects from Cu than aquatic insects or fish. Examination of reported acute toxicity values for these two groups found no correlation with acute toxicity values and either species or, for freshwater mussels, with life stage. Zooplankton tend to inhabit primarily lentic environments, therefore, consideration of their sensitivity to Cu should be given for Cu inputs to lake and wetland systems. Freshwater mussels are found in both lotic and lentic habitats; adequate protection of freshwater mussel populations may require a site-specific criterion for Cu.
Chronic Toxicity to Fish
Chronic effects of Cu to fish may include decreased growth (Hansen et al. 2002b), changes in fish behavior, including olfactory responses, agonistic responses, avoidance, and attraction, and changes in swimming ability or swimming speed (Beaumont et al. 1995).
Behavioral effects of exposure to elevated Cu include coughing (Atchison et al. 1987), inhibition of olfactory responses (Baldwin et al. 2003), changes in swimming performance (endurance and speed) and avoidance (Giattina et al. 1982). Fish frequently acclimate to increased Cu concentrations (Giattina et al. 1982, Hansen et al. 1999a), depending on species, life stage (Carreau and Pyle 2005) and duration of exposure (Hansen et al. 1999a).
Shephard (2008) conducted a literature review on Cu effects on behavior of freshwater and marine fish. He synthesized information from 52 published reports containing 105 different LOEC (Lowest Observed Effects Concentration, Appendix I) values for laboratory studies of Cu effects on freshwater fish. Ninety seven percent of the LOEC values (102 of the 105 LOEC’s) were higher than the USEPA or AWQ hardness adjusted chronic criterion for Cu. Shephard reported that avoidance was the only behavioral endpoint with LOEC’s lower than the chronic criterion.

6
Fish Growth
Hansen (2002b) found that rainbow trout exposed to 10.8 μg Cu l-1 for 56 days grew 10% less than control fish; rainbow trout exposed to 21.6 μg Cu l-1 grew 20% less than control fish. This IC10 (Inhibition Concentration affecting 10% of the population, refer to Appendix I) concentration, resulting in a 10% growth reduction is slightly higher than the AWQ criterion of 9 μg l-1 at a hardness value of 100 mg l-l (the hardness of the test water for this study).
Avoidance
Baldigo and Baudanza (2001) demonstrated that YOY brown trout avoid concentrations of dissolved Cu greater than 55 μg l-1. Giattinia (1982) reported rainbow trout avoided Cu at concentrations of about 4.4 μg l-1 when exposed under shallow concentration gradients and that the trout detected Cu concentrations as low as 1.4 to 2.7 μg l-1; although these effects were not significant. Giattinia also found that when rainbow trout were attracted to the highest test concentrations (334 to 386 μg Cu l-1); attraction responses were the same in shallow and steep gradients.
Scherer and McNicol (1998) tested lake whitefish avoidance to Cu in two environments: with shade (or cover) and without cover. When whitefish were exposed to low Cu concentrations, but no shade, they demonstrated strong avoidance at all concentrations down to at the lowest concentration of 1 μg Cu l-1. However, when shade was provided, whitefish showed a strong preference for shade that suppressed their avoidance of Cu at all concentrations up to 40 μg l-1. Cu concentrations of 72 μg l-1 resulted in strong avoidance of Cu, with or without shade.
Atchison et al. (1987) reviewed a number of studies on attraction or avoidance responses to a gradient of Cu. According to their review, most of the tests gave the fish a choice between clean water and contaminated water; few tests incorporated a mixing zone with a gradient of Cu concentrations. A few tests incorporated concentration gradients; results from these tests suggest that when the gradient is shallow (i.e. a gradual change from fresh water to high Cu concentrations), goldfish (Carassius auratus) were attracted to Cu concentrations of 11 to 17 μg l-1 but when the concentration gradient was steep (an abrupt change from fresh water to elevated Cu), the fish avoided water with 5 μg l-1. Black and Birge (1980, cited in Atchison et al. 1987) reported that rainbow trout avoided 74 μg l-1 of Cu (the lowest concentration tested) in a steep gradient test but were attracted to concentrations of 4600 to 7600 μg l-1. A number of studies have shown fish avoidance of low Cu concentrations, but attraction to high Cu concentrations (Shephard 2008).
Hansen et al. (1999a) found that Chinook salmon significantly avoided Cu concentrations of 0.8 μg l-1 and concentrations from 2.8 to 22.5 μg l-1; however avoidance was not observed by Chinook salmon in water containing 1.6 μg l-1.
Hansen et al. (1999a) also tested rainbow trout and found active avoidance at low concentrations from 1.6 to 88 μg l-1. As with Chinook salmon, rainbow trout did not demonstrate avoidance behavior in higher concentrations of 180 or 360 μg l-1.
7
Atchison et al. (1987) described the laboratory and field studies conducted by Saunders and Sprague et al. (1967) and Sprague (1965) on avoidance of Cu by Atlantic salmon (Salmo salar). Sprague (1964) demonstrated avoidance in Atlantic salmon parr exposed to concentrations of 2.3 μg copper l-1and 53 μg zinc l-1 in the laboratory. Sprague et al. (1965) and Saunders & Sprague (1967) reported that adult Atlantic salmon migrating upstream avoided areas contaminated with a mixture of zinc and copper. The threshold for avoidance was approximately 17-21 μg Cu l-1 and 210 to 258 μg Zn l-1. The researchers believed that concentrations of 38 μg Cu l-1 and 480 μg Zn l-1 could completely block spawning runs. The authors attributed differences in avoidance concentrations between laboratory and field studies to differences in ages of the fish and increased motivation to travel upstream. The ionic composition of the river water also may have contributed to higher effects concentrations.
Agonistic Effects
Sloman et al. (2003) demonstrated that elevated Cu concentrations up to 15 μg l-1 did not result in increases in agonistic behaviors (competitive ability, social hierarchy) among juvenile rainbow trout.
Olfactory Cues A number of researchers have demonstrated the importance of olfactory cues for salmon returning to their natal stream (Atchison et al. 1987). Atchison et al. (1987) reported that the addition of 44 μg Cu l-1 resulted in avoidance by migrating Atlantic salmon. Copper exposure can damage cellular surface proteins, membrane structure, or internal organelles. High concentrations (in the order of 50 μg Cu l-1) may result in permanent damage to olfactory cells in Chinook salmon (Hansen et al. 1996b).
Baldwin et al. (2003) tested olfactory response to three different natural odorants (L-serine and taurocholic acid) and an odorant mixture (L-arginine, L-aspartic acid, L-leucine, and L-serine). They reported that short-term Cu exposures at approximately 13 μg l-1 reduced the responsiveness of the sensory epithelium to all three odorants. Baldwin et al. (2003) also tested the potential role of hardness in Cu’s sublethal toxicity by adding CaCl2 to increase the hardness to 120 mg l-1 and 240 mg l-1. They reported that increases in water hardness did not seem to influence the toxicity of Cu to coho salmon sensory neurons for fish exposed to 10 μg l-1 nominal solution (actually 13 μg l-1).
Hansen et al. (1999b) investigated effects of Cu on the olfactory epithelial structure and olfactory response to L-serine stimulus in rainbow trout and Chinook salmon. Olfactory responses from rainbow trout exposed to 25, 50 and 100 μg Cu l-1 were reduced to between 50 and 65% of control and remained depressed throughout the 60-min Cu-exposure period. Rainbow trout exposed to concentrations lower than 25 μg l-1 did not exhibit olfactory responses. Compared to control fish, responses in Chinook salmon exposed to 25 μg Cu l-1 were reduced by approximately 50%; fish exposed to 50 μg l-1 showed 55 to 70% reduction in responses to L-serine. Both of these test groups began to show substantial recovery when removed to clean water.
Sandahl et al. (2007) reported an altered response to an alarm stimulant in coho salmon olfactory epithelium after the fish were exposed to 2 μg Cu l-1. Studies of Sandahl et al.

8
were done in water with low DOC, which is related to higher Cu bioavailability than would occur in natural water.
Studies of the effects of Cu on fish olfactory responses that include examinations of cellular effects to olfactory cells are likely more reliable than studies that focus entirely on response to an odorant stimulus. There is a potential that some of the observed olfactory-related behavioral effects on avoidance are demonstrations of olfactory fatigue, and are not toxic effects of Cu (Shephard pers. comm.). According to Shephard, olfactory fatigue occurs when, after smelling one specific odor for a large amount of time, the smell is no longer noticeable. It is likely that a number of studies, particularly earlier papers, failed to account for olfactory fatigue. Later research, for example the work of Bettini et al. (2006) and Geist et al. (2007), examined cellular changes in the olfactory system. These approaches likely give a more accurate estimate of olfactory effects of Cu than measures of fish response to an olfactory cue. Sandahl (2006) found that short-term exposures to dissolved Cu at low concentrations (up to 20 μg l-1) reduced the ability of salmon to detect odors by inhibiting the electrical properties of olfactory receptor neurons.
Swimming Ability
Critical swimming performance, or the maximum velocity that a fish can maintain for a given period of time, was impaired in rainbow trout exposed to 10 μg Cu l-1 (Waiwood and Beamish 1978, cited in Atchison et al. 1987). Effects on swimming performance were greatest at low pH and in soft water.
Sandahl et al. (2007) exposed coho salmon to different Cu concentrations, then measured responses to a “predator” stimulant. They reported significant reductions in swimming speed for coho salmon exposed to 20 μg Cu l-1.
Organ or Cellular Damage
Chronic Cu toxicity (Table 4) may result in damage to specific organs; including olfactory receptor neurons (Bettini et al. 2006, Hansen et al. 1996b). The mechano-sensory cells of the lateral line also may be damaged by Cu exposure, although recovery usually occurs within a few days, provided Cu concentrations are low. Linbo et al. (2006) conducted experiments with zebra fish and showed damage to mechano-sensory cells following exposures of 20 μg Cu l-1 and regeneration within 2 days in clean water. Exposures to high concentrations (more than 50 μg Cu l-1) resulted in permanent damage to mechano-sensory cells.

9
Table 4. Summary of chronic effects of Cu to fish reported in literature. See Appendix III for data.
Observed Effect Endpoint Effects Conc. μg l-1
No. of observations
No. of Values < AWQ chronic
criterion Avoidance LOEC 1.6 to 72 16 4 Cellular damage LOEC 20 to 25 2 0 Feeding NOEC 173 1 0 Growth IC10 to IC50 10.8 to 54 3 0 Social interactions
LOEC 30 3 0
Swimming LOEC 5 1 0
Chronic Effects to Aquatic Invertebrates
Cu contamination may result in reductions in both the numbers of aquatic insect taxa and numbers of individuals (Clements et al. 1988). After 96 h in low dose streams (15 to 32 μg l-1), the number of taxa was reduced by 24 to 36% and the number of individuals was reduced by 35 to 52% compared to controls.
Beltman et al. (1999) reported that Cu concentrations of approximately15 μg l-1 in a natural system resulted in significant changes in invertebrate community structure, with a decline in Ephemeroptera, Plecoptera, Trichoptera and Coleoptera over unaffected sites. Cu in both water and aufwuch were significantly correlated with Cu concentrations in invertebrates; concentrations in aufwuchs were most strongly related to concentrations in grazing insects, such as Trichoptera species.
Clements et al. (1992) reported that benthic community composition was highly sensitive to Cu. Reference stations, where Cu concentrations were usually below detection, usually were dominated by several species of mayflies (Baetis brunneicolor, Isonychia bicolor, Stenonema modestum, Tricorythodes sp. and Caenis sp.) and Tanytarsini chironomids. Stream locations most effected by Cu (where concentrations ranged from 52 to 104.8 μg Cu l-1) were dominated by Orthocladini chironomids (up to 82% of total insects collected) and net-spinning caddisflies (Hydropsyche bifida and Cheumatopsyche sp.). Numbers of Ephemeroptera were substantially reduced in the metal-affected sites, where they comprised less than 5% of the total number of individuals.
Tests of Cu effects on growth of freshwater mussels (Table 5) found an IC25 for growth from 7.5 to 12 μg Cu l-1 (Wang et al. 2007c). (Refer to Appendix V for the chronic toxicity values).

10
Table 5. Summary of chronic effects of Cu to freshwater mussels. Endpoint Effect Effects Conc.
μg l-1No. of
observations No. of Values
< AWQ chronic criterion
IC10 Growth 5.7 to 8 3 3 IC10 Survival 3.1 to 4.9 3 3 IC25 Growth 7.5 to 12 3 3 IC25 Survival 5.5 to 6.3 3 3
Effects to Aquatic Algae and Plants
Copper has frequently been used to control overgrowths of algae, especially in reservoirs and is one of the most toxic metals to unicellular algae (Franklin et al. 2002). Numerous studies have shown Cu to be more toxic than Cd, Pb, Cr, Ni, or Tl. Cu has been shown to inhibit growth and interfere with photosynthesis, respiration, enzyme activity, pigment synthesis and cell division (Eisler 1998, Franklin et al. 2002).
The pH of the water has a strong influence on Cu toxicity to algae; the effects of pH are twofold. Higher H+ concentration at lower pH may decrease the toxicity of Cu by competing with the Cu ions and preventing them from binding to the cell surface. Lower pH also increases the prevalence of Cu2+, and decreases the proportion of other, less toxic, forms of Cu (Sciera et al. 2004, Hyne et al. 2005).
Franklin et al. (2000) determined the 72-h EC50 of 35 μg l-1 for a tropical algae, Chlorella sp. cultured in water with pH 5.7. Algal cells cultured in water with pH 6.5 resulted in a lower 72-h EC50 of 1.5 μg l-1. The hardness of the test water ranged from 2 to 4 mg l-1; the hardness adjusted AWQ Criteria for Cu is 0.4 to 0.7 for acute and 0.3 to 0.6 for chronic; lower than the lowest 72-hr EC50 reported in this study.
Bioaccumulation
McGreer et al. (2003) reported that, except for algae and certain fish species, all aquatic species experienced a generalized increase in Cu concentrations as exposure levels increased. The whole organism concentration was related to exposure (Hansen et al. 2002a). McGreer et al. found no evidence that Cu biomagnified in aquatic systems, although it does appear to be transferred through aquatic food chains.
11
Annotated Bibliography
Copper Speciation and Bioavailability
De Schamphelaere KAC, Vasconcelos FM, Tack FMG, Allen HE, and Janssen CR. 2004. Effect of dissolved organic matter source on acute copper toxicity to Daphnia magna. Environ. Toxicol. Chem. 23(5): 1248-1255. Keywords: Cu speciation, DOM, acute toxicity, D. magna.
De Schamphelaere et al. considered the recent studies on effects of DOM on metal toxicity to aquatic organisms and the biotic ligand model of Di Toro et al. (2001; reviewed in this report). They faulted many of the studies that used a commercially available, soil-derived humic acid because it did not imitate humic acids found in aquatic systems. They observed that the humic acid fraction usually is less than 30% of the DOM in natural freshwater and that other ligands provide Cu binding sites.
De Schamphelaere et al. collected DOM from six different locations and determined differences in acute Cu toxicity to the cladoceran Daphnia magna in solutions of each DOM source. Using each of the six collected DOMs, 48-h toxicity tests with D. magna were conducted in Cu-spiked test media with three different DOC concentrations. Test waters were adjusted to pH 7 with 2 mM Ca and 0.5 mM Mg (the estimated hardness was approximately 90 mg l-1, estimated from total Ca2+ and Mg2+, see Glossary, Appendix I).
De Schamphelaere et al. found that 48-hr EC50s ranged from 51 to 638 μg Cu l-1, lower EC50 values (i.e. greater Cu toxicity) were observed in tests with lower concentrations of DOM. Increases in DOM concentrations decreased Cu toxicity, especially in DOM concentrations between 2 and 10 mg l-1 added DOM (Figure 1). They conducted additional tests in natural waters; however, wide ranges in hardness and variations in pH may have confounded these results.
The source of DOM also influenced Cu toxicity, and this influence is more apparent at higher concentrations of added DOM (Figure 1). DOM from Newport, Bihain and Ossenkolk were more effective in reducing Cu toxicity than DOM from Ankeveen (Table 6). De Schamphelaere et al. speculated that the Cu binding capacity was weaker in DOM from Ankeveen than in DOM from the other sites. They did not test the DOM to determine the proportions of predominant ligands (humic acid, fulvic acid, hydrophilic acid, bicarbonates, etc.).

12
Table 6. Toxicity of Cu to Daphnia magna (48-hr EC50) in laboratory water (pH adjusted to near 7) and varying amounts of DOM from 6 different sources.
DOM Source DOM concentration mg l-1
48-hr EC50 μg l-1
Big Moose Creek 3.04 81.8 4.53 128 8.96 <295 Newport 1.95 129 5.11 261 11.7 638 Suwannee 1.97 86.6 5.35 192 10.8 332 Bihain 1.95 53.8 8.54 311 15.4 542 Ossenkolk 2.08 50.6 9.22 275 16.9 607 Ankeveen 2.58 60.6 13.7 212 17.8 372
0
100
200
300
400
500
600
700
0 5 10 15 20
DOM concentration
48-h
r E
C50
Figure 1. Relationship between increased concentration of DOM and decreased toxicity of Cu to Daphnia magna.
Significance of Results
De Schamphelaere et al. determined the 48-h EC50 for D. magna exposed to Cu concentrations with added DOM from 6 different sources. Increases in DOM concentrations reduced Cu toxicity and the source of DOM appeared to be important, possibly because of differences in Cu-binding potential. The influence of added DOM was most significant in DOM concentrations from 2 to 10 mg l-1.

13
Ferreira D, Tousset N, Ridame C and Tusseau-Vullemin MH. 2008. More than inorganic copper is bioavailable to aquatic mosses at environmentally relevant concentrations. Environ. Toxicol. Chem. 27(10): 2108-2116.
Keywords: bioavailability, Cu complexes, influence of DOM
Ferreira et al. investigated how Cu accumulation in aquatic mosses changes in response to variations in Cu speciation and whether labile Cu concentration is a good predictor of its bioavailability. The researchers exposed the aquatic moss, Fontinalis antipyretica to low, usually non-toxic, concentrations of Cu in the range of 1 to 5 μg l-1. Copper speciation was varied by adding different types of dissolved organic matter (DOM); bioavailable Cu was measured by diffusion gradient in thin films (DGT). After 48-h exposure, mosses were removed from the test solutions, dried, and the total Cu content (both adsorbed and contained internally) was measured. The test solutions were sampled to determine the total dissolved Cu concentrations and differences in Cu concentrations with different amounts of added humic acid and EDTA (ethylenediaminetertra-acetic acid). EDTA forms inert complexes with Cu.
Ferreira et al. found that the initial labile Cu fraction was reduced by the addition of organic ligands; however, the reduction varied from 3.4 to 88.5% of the total dissolved Cu, depending on the stability of specific ligands. Humic acid decreased the labile fraction of Cu in solution more than natural DOM of equivalent organic carbon concentrations. Reductions in the concentrations of bioavailable Cu were more pronounced at the beginning of exposure: bioavailability was consistently higher when estimated at 48-h than at the beginning of the exposure period. The change in bioavailability is likely because of formation of weak Cu complexes and the kinetic behavior of many Cu complexes.
Significance of Research
Ferreira et al. demonstrated that the presence of DOM alters the bioavailability of Cu, even at low concentrations. Bioavailability depends on the quality of the DOM and the stability of the Cu complexes; concentrations of available Cu initially decreased, then increased over the 48-h test period as weak complexes released Cu. The study demonstrates the importance of DOM in reducing Cu availability to aquatic species.
14
Hyne RV, Pablo F, Julli M, and Markich SJ. 2005. Influence of water chemistry on the acute toxicity of copper and zinc to the cladoceran Ceriodaphnia dubia. Environ. Toxicol. Chem. 24 (7): 1667-1675.
Keywords: Acute toxicity, Ceriodaphnia dubia, Cu speciation, pH, DOC
Hyne et al. determined the influence of key water chemistry factors (pH, alkalinity, DOC and hardness) on the aqueous speciation of Cu and Zn and their relationship to the acute toxicity of these metals to the cladoceran, Ceriodaphnia dubia. A series of toxicity tests were conducted, each test varying one water chemistry factor while the others were held constant. At least five metal concentrations and a control were used in static tests with observations made at 24 and 48 h. The end point was defined as immobilization, or the cessation of all visible signs of movement or activity, including second antennae and abdominal legs when view under 10x magnification. The 48-h EC50 was calculated for each set of tests; however the authors did not give the Cu concentrations of the exposures.
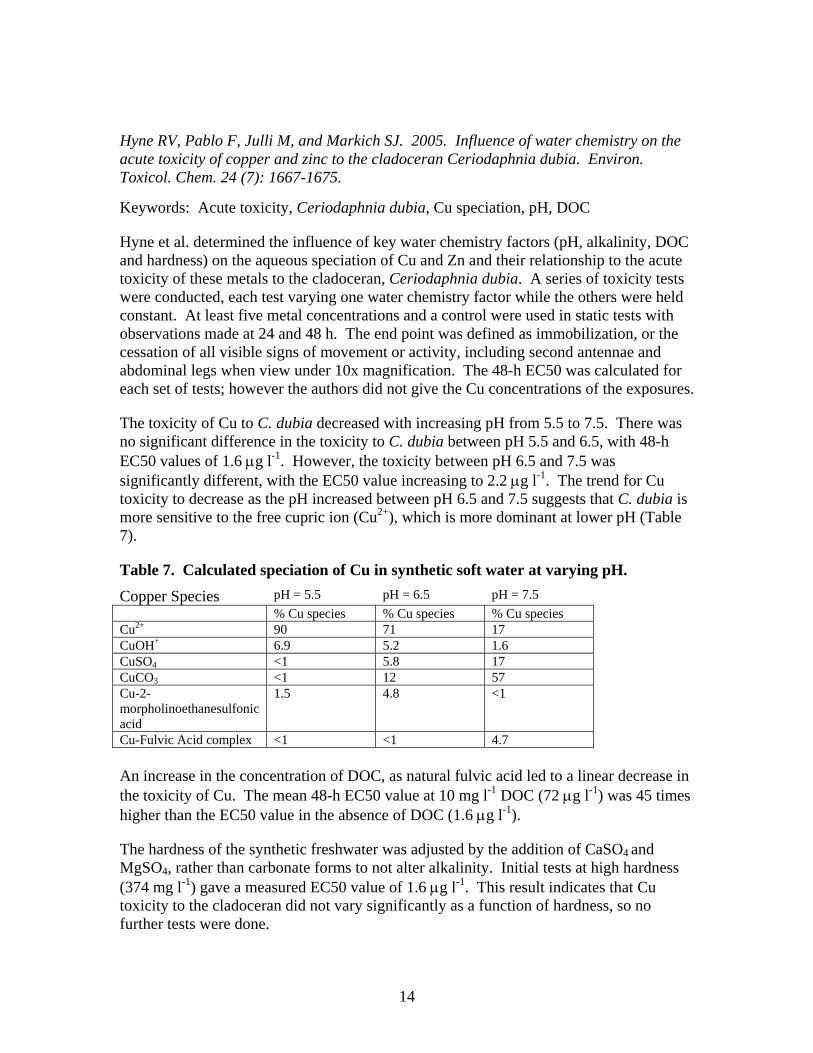
The toxicity of Cu to C. dubia decreased with increasing pH from 5.5 to 7.5. There was no significant difference in the toxicity to C. dubia between pH 5.5 and 6.5, with 48-h EC50 values of 1.6 μg l-1. However, the toxicity between pH 6.5 and 7.5 was significantly different, with the EC50 value increasing to 2.2 μg l-1. The trend for Cu toxicity to decrease as the pH increased between pH 6.5 and 7.5 suggests that C. dubia is more sensitive to the free cupric ion (Cu2+), which is more dominant at lower pH (Table 7).
Table 7. Calculated speciation of Cu in synthetic soft water at varying pH. Copper Species pH = 5.5 pH = 6.5 pH = 7.5 % Cu species % Cu species % Cu species Cu2+ 90 71 17 CuOH+ 6.9 5.2 1.6 CuSO4 <1 5.8 17 CuCO3 <1 12 57 Cu-2-morpholinoethanesulfonic acid
1.5 4.8 <1
Cu-Fulvic Acid complex <1 <1 4.7 An increase in the concentration of DOC, as natural fulvic acid led to a linear decrease in the toxicity of Cu. The mean 48-h EC50 value at 10 mg l-1 DOC (72 μg l-1) was 45 times higher than the EC50 value in the absence of DOC (1.6 μg l-1).
The hardness of the synthetic freshwater was adjusted by the addition of CaSO4 and MgSO4, rather than carbonate forms to not alter alkalinity. Initial tests at high hardness (374 mg l-1) gave a measured EC50 value of 1.6 μg l-1. This result indicates that Cu toxicity to the cladoceran did not vary significantly as a function of hardness, so no further tests were done.

15
Hyne et al. added sodium bicarbonate to modify alkalinity while maintaining hardness at control concentrations. They tested three concentrations: 30, 60 and 125 mg l-1. Increased alkalinity decreased the toxicity of Cu to C. dubia from 2.8 μg l-1 at 30 mg l-1 to 6.5 μg l-1 at 60 mg l-1and 16 μg l-1 at 125 mg l-1. All alkalinity treatments resulted in significantly different EC50 values.
Toxicity of Cu decreased linearly with additions of DOC, from a 48-h EC50 of 1.6 μg l-1 at 1 mg l-1 DOC, EC50 = 60 μg l-1 at 5 mg l-1 DOC and EC50 = 100 μg l-1 at 8 mg l-1
DOC. Cu complexation with DOC was the main factor affecting toxicity (Table 8).
Table 8. Calculated speciation of Cu in synthetic soft water at added DOC. Copper Species 0 mg l-1 DOC
added 1 mg l-1 DOC added
5 mg l-1 DOC added
10 mg l-1 DOC added
% Cu species % Cu species % Cu species % Cu species Cu2+ 71 12 3 1.5 CuOH+ 5.8 1.0 <1 <1 CuSO4 5.2 <1 <1 <1 CuCO3 12 2.1 <1 <1 Cu-2-morpholinoethanesulfonic acid
4.8 <1 <1 <1
Cu-Fulvic Acid complex <1 83 96 98
Significance of Research
Hyne et al. demonstrate the importance of various water quality factors in determining toxicity of Cu to C. dubia. Their results for effects of water hardness in moderating Cu toxicity are inconclusive. Tests on Cu speciation at different pH or different DOC concentrations relate strongly to the availability and toxicity of Cu.
16
Martin AJ and Goldblatt R. 2007. Speciation, behavior and bioavailability of copper downstream of a mine-impacted lake. Environ. Toxicol. Chem.. 26(12): 2594-2603.
Keywords: Cu speciation, bioavailability, DOC
Martin and Goldblatt examined the speciation, behavior and bioavailability of Cu in a stream system rich in DOC downstream of a lake. The lake receives input from a mine that operated from 1983 to 1999 using a combination of open pit and underground mining methods. The site has been in an active state of closure since 1998.
Despite the absence of mining-related discharges to the East lake system since January 2000, elevated concentrations of filterable Cu persist in the lake. Average Cu concentrations for 2005 were about 35 μg l-1. To assess the speciation and bioavailability of Cu, Martin and Goldblatt collected water samples at 9 locations: upstream of East Lake, up gradient of mine-related influences, at the East lake outlet, and at 6 stations downstream of the lake discharge. The authors included additional control sites in an adjacent river. Water samples were analyzed for total Cu, <0.45 μm Cu, <0.1 μm Cu, and labile Cu as defined by the DGT analytical method. Water also was analyzed for DOC, pH, conductivity, hardness and dissolved oxygen.
For the assessment of Cu bioavailability and toxicity, water samples were collected upstream of East Lake and spiked with from 0 to 800 μg dissolved Cu l-1. Ceriodaphnia dubia were exposed to the Cu concentrations for 7 days.
Martin and Goldblatt found that most of the Cu present in the East Lake drainage was filterable (versus colloidal or other non-filterable forms). In 2002, the <0.45 μm fraction accounted for 94% of the total Cu. The dominance of filterable species was attributed to low stream turbidity and the likely dominance of soluble Cu-organic complexes. The strongly stained surface waters within the drainage system host abundant DOC, likely the dominant ligand for Cu.
The DGT results suggested that most of the Cu was unavailable to aquatic biota. This finding was supported by the toxicity results: negligible mortality (< 10%) of C. dubia was observed at filterable Cu concentrations < 80 μg l-1. Although concentrations of DOC had a profound effect on Cu availability, the concentration of DOC was not an exact proxy for Cu bioavailability. Other water quality factors, including pH, temperature, salinity and variations in metal-ligand competition influence Cu speciation.
Significance of Research
Concentrations of DOC may have a profound effect on Cu speciation and toxicity. The study of Martin and Goldblatt emphasizes the importance of site-specific variables in determining assimilative capacity of Cu. In regions of particularly sensitive species, a range of water quality variables should be measured to predict the bioavailability of Cu. In addition, water samples should include measures of filterable, non-filterable and labile Cu species.

17
McGreer JC, Brix KV, Skeaff JM, DeForest DK and Brigham SI. 2003. Inverse relationship between bioconcentration factor and exposure concentration for metals: implications for hazard assessment of metals in the aquatic environment. Environ. Toxicol. Chem. 22 (5): 1017–1037.
Keywords: Bioconcentration, biomagnification
McGreer et al. provide a detailed examination of the bioaccumulation of seven metals, including Cu, and hexachlorobenzene in a wide range of aquatic species. The goal of their extensive literature review was to relate the Bioconcentration Factor (BCF) and Bioaccumulation Factor (BAF) to actual bioaccumulation with different levels of exposure. BCF and BAF are frequently used to estimate chronic toxicity and to predict bioaccumulation. The following discussion of their report is limited to the information on Cu.
Bioaccumulation occurs when an organism absorbs a toxic substance at a rate greater than that at which the substance is lost, or depurated. Bioconcentration is the accumulation of a chemical in tissues of a fish or other organism to levels greater than that in the surrounding medium (environment).
McGreer et al. reported that a range of studies illustrate that, except for algae and certain fish species, all aquatic species experienced a generalized increase in Cu concentration as exposure levels increased; the whole organism concentration was related to exposure. Therefore, with some exceptions, most aquatic species showed bioaccumulation of Cu. The accumulation trend for Cu in algae was not significant.
Studies examined by McGreer et al. on bioconcentration of Cu showed that freshwater fish such as rainbow trout actively regulate Cu via sequestering into the liver and elimination via the bile, a process that involves Cu-specific transport mechanisms. Detoxification of Cu through binding to metallothionein-like proteins has been shown to be an important mechanism in Cu elimination. The authors found no evidence that Cu biomagnifies in aquatic systems, although it does appear to be transferred through food chains.
Significance of Research
McGreer et al. reported that although Cu does accumulate in aquatic organisms at concentrations that are related to exposure levels, it is not biomagnified. Cu accumulation in aquatic organisms at different trophic levels varies with the nutritional requirements for Cu, the duration of exposure and chemical speciation.

18
MacRae RK, Smith DE, Swoboda-Colberg N, Meyer JS and Bergman HL. 1999. Copper binding affinity of rainbow trout (Oncorhynchus mykiss) and brook trout (Salvelinus fontinalis) gills: implications for assessing bioavailable metal. Environ. Toxicol. Chem. 18(6): 1180-1189.
Keywords: gill-Cu binding, Cu speciation, ligands
MacRae et al. considered the effects of competing ligands on Cu toxicity. In addition to DOC, the authors considered the effects of fish and invertebrates as organic ligands. The microenvironment at the fish gill surface is modified by the excretion of H+ and NH3. Therefore, gill ligands can alter the equilibrium and shift some Cu from weaker or pH-sensitive complexes onto the gill.
In their study, MacRae et al. first determined the conditional stability constant of Cu for the gills of rainbow and brook trout. The study assumed that metal bioavailability at the gill is dominated by ion-exchange processes. Therefore, when an external aqueous ligand (a competing ligand) such as an organic acid is present in sufficient concentrations to complex most of the total Cu and forms complexes that are more stable than gill ligands, both ion exchange at the gills and gill-Cu accumulations are reduced.
Fish were exposed to toxic Cu concentrations in the presence of different organic acid ligands with different Cu binding strengths. Cu was added as CuCl2 to a concentration of 10 μg l-1, a concentration pre-determined to reduce survival by 25% after 5 days exposure. At the end of 5 days, the number of surviving fish was determined and samples of gill tissue were taken to determine Cu concentrations.
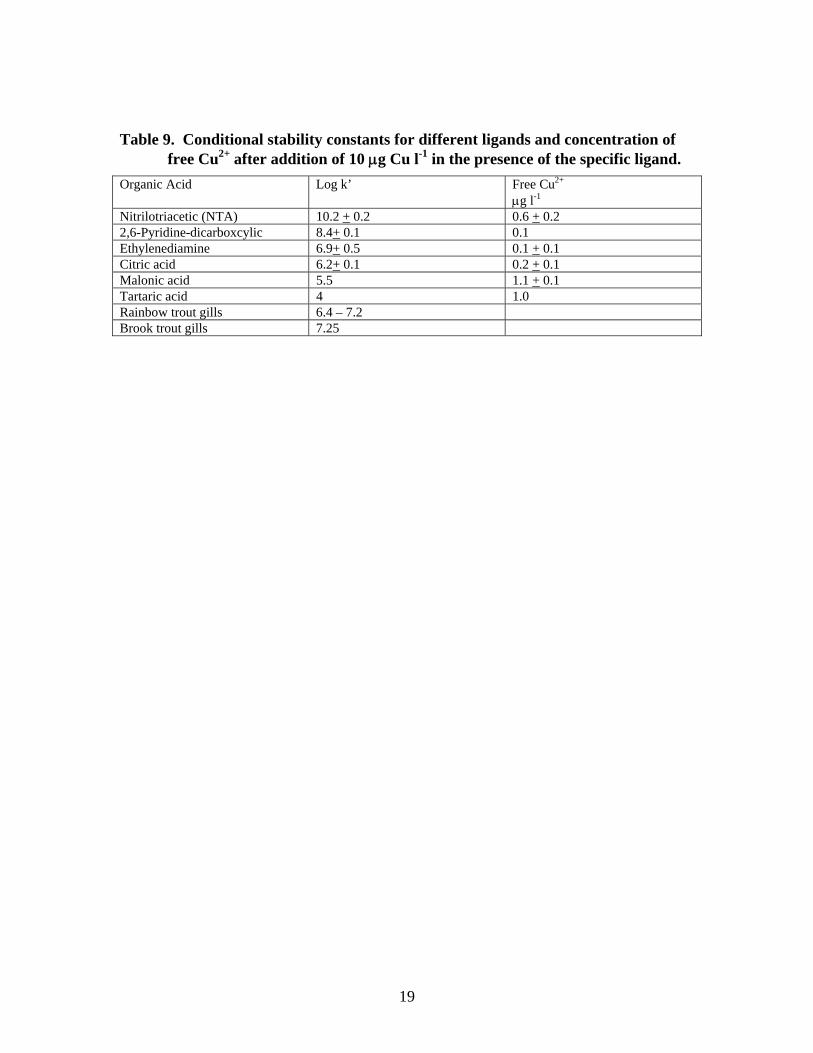
MacRae et al. also determined the Cu stability constants of different, competing organic ligands (Table 9). The upper limit of the gill conditional stability constant is similar to that of citric acid; therefore, citric acid was the organic acid with the lowest Cu conditional stability constant that could compete effectively with the fish gill for Cu.
Significance of Research
MacRae et al. demonstrate the importance of different organic ligands in binding Cu and reducing its bioavailability. The effectiveness of the ligands in binding Cu was influenced by other water quality variables, including pH, hardness and salinity. A bioavailable water concentration of 5.1 μg l-1 would result in 1.4 μg Cu/g gill tissue after 24 hr.
19
Table 9. Conditional stability constants for different ligands and concentration of free Cu2+ after addition of 10 μg Cu l-1 in the presence of the specific ligand.
Organic Acid Log k’ Free Cu2+ μg l-1
Nitrilotriacetic (NTA) 10.2 + 0.2 0.6 + 0.2 2,6-Pyridine-dicarboxcylic 8.4+ 0.1 0.1 Ethylenediamine 6.9+ 0.5 0.1 + 0.1 Citric acid 6.2+ 0.1 0.2 + 0.1 Malonic acid 5.5 1.1 + 0.1 Tartaric acid 4 1.0 Rainbow trout gills 6.4 – 7.2 Brook trout gills 7.25

20
Sciera KL, Isely J, Tomasso JR Jr. and Klaine SJ. 2004. Influence of multiple water-quality characteristics on copper toxicity to fathead minnows (Pimephales promelas). Environ. Toxicol. Chem.23: 2900-2905.
Keywords: DOC, pH, alkalinity, hardness
Sciera et al. examined the interactions among water quality characteristics of DOC concentration, DOC source, and hardness on Cu toxicity to fathead minnows. In their paper, they discuss past research that focused on effects of a single water-quality factor on Cu toxicity. For example, many studies of effects of increased water hardness on reducing Cu toxicity were confounded by increases in alkalinity, which covaried with hardness. In these studies, differences in Cu toxicity at various hardness levels may have been caused by a difference in carbonate complexation rather than by competition with hardness ions.
Aqueous pH also influences Cu toxicity, although the degree of influence is dependent on the Cu species. Total Cu LC50 values increased substantially with increasing pH, however ionic Cu LC50 values showed little change. Sciera et al. suggest that at low pH values, hydrogen ions competed with ionic Cu for gill-binding sites. A separate study found that hydrogen ions never protected against Cu toxicity. Sciera et al. speculate that this apparent contradiction in results may have occurred because of differences in alkalinities between the two studies.
Sciera et al. determined the acute toxicity of Cu to larval fathead minnows using 96-h static-renewal toxicity tests. They tested three pH levels: 6, 7 and 8; three levels of hardness: 10, 20 and 40 mg l-1; and three levels of DOC: 0, 5 and 10 mg l-1. Two different sources of DOC were used for tests of pH 6 and 8. Test Cu concentrations were 1.5, 3.125, 6.25, 12.5, 25, 50, 100, 200, 400, 800, 1600 and 3200 μg l-1.
Sciera et al. found that LC50 values varied by more than a factor of 100 across all treatments. The source of DOC had no significant effect on Cu toxicity. Increased water hardness, while maintaining constant alkalinity, resulted in reduced Cu toxicity. Hardness had less of a protective effect at pH 8, possibly because of differences in Cu speciation or differences in the sensitivities of the fish.
As the concentration of DOC increased, Cu toxicity decreased. For pH values near 6, the strongest protective effects of DOC were at concentrations greater than 5 mg l-1. At pH 8, protective effects were strongest at DOC concentrations between 0.5 and 5 mg l-1. This is likely because of the higher Cu-DOC complexing capacity at higher pH, especially in soft waters with fewer divalent cations (Ca2+, Mg2+) available to compete with Cu for binding sites. Significant differences were observed between Cu toxicities at pH 8 and source of DOC. The authors speculated that the two different DOC sources might have varied in the number of binding sites.
21
An increase in pH resulted in an increase in the LC50 value for total or dissolved Cu; however, pH and alkalinity covaried. Therefore, it is not possible to distinguish whether the controlling factor was pH or alkalinity.
Sciera et al. compared their results to the Biotic Ligand Model (DiToro 2001); they found that this model under-predicted Cu toxicity, probably because it was based on tests conducted at higher hardness than their tests.
Significance of Research
Hardness provides a protective effect independent of alkalinity; however, effects of pH and alkalinity were not distinguishable. DOC, pH and hardness influenced toxicity of Cu to fathead minnows. At pH 8, toxicity also was influenced by DOC source. Hardness was low in all of their test waters where it ranged from 10 to 40 mg l-1, within the range of “soft” water.
22
Support of Standards
Brix KV, DeForrest DK and Adams WJ. 2001. Assessing acute and chronic copper risks to freshwater aquatic life using species sensitivity distributions for different taxonomic groups. Environ. Toxicol. Chem.. 20: 1846-1856.
Keywords: Acute toxicity, chronic toxicity, ecological risk
Brix et al. expanded on previously developed methods for estimating and interpreting ecological risk. Their method centers around consideration of the species at risk and the functional groups they comprise. The estimated risks of the taxonomic or functional groups were compared to site-specific food webs to assess potential risks to an aquatic community.
Brix et al. conducted an extensive review of the scientific literature on Cu toxicity and included the USEPA acute toxicity database for Cu. All LC50 values from the literature were normalized to a hardness of 50 mg l-1. They based their analysis on the species mean acute value (SMAV), defined as the geometric mean of individual LC50 values for a given species. Their goal was to use data for individual species because the sensitivities of organisms within a genus can be high.
Brix et al. expanded the Cu acute toxicity database from 53 to 87 species. The data for fish showed no identifiable trends in relative sensitivity with respect to feeding guild or phylogenetic relationship. There was a general trend that temperate cold-water species appear to be more sensitive than temperate warm-water species and that temperate warm-water species are more sensitive than tropical species.
Of the invertebrates, cladocerans were more sensitive than insects. The Cu SMAV’s for three Chironomidae species was 99 (Chironomus tentans), 124 (C. riparius) and 417 μg L-1 (C. decorus). The midges in the tests were of different ages and the varying results may be at least partially related to life stage.
Brix et al. provide an in-depth discussion of the effects of toxicity on a food web. In their example, Cu contamination to a lentic system may have a large effect on the food web. Although Cu may not pose a direct threat to piscivorous or planktivorous fish, a reduction in food supply will affect these populations. In contrast, a lotic system with insectivorous fish will likely not be affected at similar Cu concentrations because insects are not as sensitive as zooplankton. Brix et al. include a table of acute sensitivities of freshwater organisms to Cu (Table 10).

23
Table 10. Acute sensitivities of select freshwater organisms to Cu. Values are given as the species mean adjusted value = the geometric mean normalized to a hardness of 50 mg l-1.
Effects Concentration
μg l-1Species Common name
Sample size to calculate SMAV
10,242 Acroneuria lycorias stonefly n=1 386.3 Alona affinis cladoceran n=1 5.2 Ceriodaphnia reticulata cladoceran n=1 833.6 Chironomus decorus midge n=1 247.1 Chironomus riparius midge n=1 197.2 Chironomus tentans midge n=1 1290 Crangonyx pseudogracilis amphipod n=1 24.8 Daphnia ambigua cladoceran n=1 18.1 Daphnia magna cladoceran n=12 26.4 Daphnia parvula cladoceran n=1 8.8 Daphnia pulex cladoceran n=2 9.3 Daphnia pulicaria cladoceran n=8 69 Echinogammarus berilloni amphipod n=1 22.1 Gamarus pseudolimnaeus amphipod n=1 31 Gammarus pulex amphipod n=7 66.6 Oncorhynchus clarki cutthroat trout n=9 87 Oncorhynchus kisutch coho salmon n=3 38.9 Oncorhynchus mykiss rainbow trout n=39 233.8 Oncorhynchus nerka sockeye salmon n=5 42.3 Oncorhynchus tsawytscha chinook salmon n=10 110.4 Salvelinus fontinalis brook trout n=1 95.9 Simocephalus serralatus cladoceran n=3 Brix et al. provide an example for using Cu species sensitivity distributions to estimate potential risks to specific components of a food web. In their analysis, the percentage of species acutely or chronically at risk is equal to the probability of a given expected environmental concentration (EEC) multiplied by the percentage of species acutely or chronically affected at that EEC. In their example, a Cu EEC distribution with a mean of 5 μg Cu l-1 and a standard deviation of 3 μg Cu l-1, they would predict negligible risk from direct exposure to Cu for insects. Risks to warm-water fish, crustaceans, excluding cladocerans, and other invertebrates is low to negligible >85% of the time. The estimated risk to cladocerans is much higher.
Significance of Research
Brix et al. provide an analytical approach for assessing risks from Cu to a freshwater aquatic system. They emphasize the necessity of a large database of toxicity data for a wide variety of species. Their ecosystem approach would provide a more valid analysis of Cu concentrations needed to protect a particular ecosystem, especially if early fish life
24
stages are included in the database. The ecosystem approach of Brix et al. is limited by the lack of information on aquatic species and different life stages.
Brooks ML, Boese CJ and Meyer JS. 2006. Complexation and time-dependent accumulation of copper by larval fathead minnows (Pimephales promelas): Implications for modeling toxicity. Aquat. Toxicol. 78: 42–49.
Keywords: Biotic Ligand Model, Whole body accumulation, life stage
Brooks et al. tested the appropriate application of the Biotic Ligand Model developed by DiToro et al. (2001) to larval fish. The DiToro model predicts Cu toxicity to all aquatic species from direct analyses of Cu complexation by the gills of adult fathead minnows (FHM), then allows the median lethal accumulation to vary among species and life stages to account for differences in sensitivity to Cu. Brooks et al. reasoned that binding affinities and binding-site densities of larval life stages of fish could vary from those of the adult fish gill because gills are only beginning to develop in larval fish and epithelial respiratory surfaces might differ greatly in metal binding and toxic action.
Brooks et al. tested the required exposure time for whole-body, steady-state Cu accumulation (as CuCl2) by larval FHM and compared those results with similar results for adult FHM. Brooks et al. reported that Cu bioaccumulation increased rapidly, approaching an asymptote in exposures longer than 12h in larval FHM; binding site densities for larval and adult FHM were similar.
Significance of Research
The research of Brooks et al. supports a single acute water quality standard for different ages of fish. Although the authors documented different rates of Cu accumulation between larval and adult fish, other factors including differences in accumulation / depuration rates, the sensitivity of adult and larval respiratory tissues and different responses to Ca2+ and Mg2+ cations influence acute toxicity. The authors concluded that median lethal concentrations of aqueous Cu were similar in adult and larval FHM.

25
Carlson AR, Nelson H, Hammermeister D. 1986. Development and validation of site-specific water quality criteria for copper. Environ. Toxicol. Chem.. 5: 997-1012.
Keywords: Cu availability, site specific criteria
Carlson et al. compared the biological availability and toxicity of Cu to Ceriodaphnia dubia, Scapholeberis sp. (Cladocera sp.), and Pimephales promelas to calculate water effects ratios for different water sources. (Water effects ratio was defined as the site water LC50 divided by the reference LC50 value).
The physical and chemical characteristics of water in a natural system may alter the biological availability and toxicity of Cu. The authors followed the site-specific guidelines provided by the USEPA to test sensitive or indicator species. The ratio of the site water toxicity value to the reference water toxicity value, or water effect ratio, is used to set a site-specific criterion. Carlson et al. also conducted ecological surveys of periphyton, zooplankton, benthic macroinvertebrate and fish communities at the test sites. Based on specific water chemistry characteristics of the receiving water, the authors set site-specific criteria for Cu that was shown to be protective of aquatic communities. The river in question received a number of different effluents, including sewage treatment plant discharges that altered the availability of Cu to aquatic species.
The researchers used the upstream, unpolluted stream water to develop a water effects ratio and set a site-specific CMC of 8.7 and CCC of 6.2 μg Cu l-1. They also developed Cu criteria specific to each of 4 downstream stations where water contained Cu and other industrial and domestic wastes. The station-specific CMCs ranged from 32 to 57 μg Cu l-
1 and CCCs ranged from 22 to 39 μg Cu l-1. The higher values reflect different water quality conditions that altered the availability of Cu. The authors were not able to determine if the station-specific criteria were protective because the calculated amounts were not exceeded at sites with healthy aquatic communities. Downstream sites where the station-specific criteria were exceeded showed evidence of impaired communities.
Significance of Research
Carlson et al. describe the steps needed to calculate a water effects ratio and derive site-specific criteria for Cu based on water quality characteristics. The toxicity of Cu was shown to be reduced by the presence of complexing ligands and other factors affecting the biological availability of Cu.

26
DiToro DM, Allen HE, Bergman HL, Meyer JS and Paquin PR. 2001. Biotic Ligand Model of the acute toxicity of metals: 1. Technical basis. Environ. Toxicol. Chem. 20 (10): 2383–2396.
Keywords: Biotic Ligand Model, DOC, pH, Ca++
DiToro et al. developed the Biotic Ligand Model (BLM) to predict acute metal toxicity to aquatic organisms; the model is based on the idea that mortality occurs when the metal–biotic ligand complex reaches a critical concentration. A ligand is either an atom, ion, or molecule that bonds to a central metal, usually involving formal donation of one or more of its electrons. The biotic ligand interacts with the metal cations in solution. For fish, the biotic ligand is most likely the sodium or calcium channel proteins in the gill surface that regulate the ionic composition of the blood. The amount of metal that binds to a biotic ligand (or in the case of fish, to the gill surface) is determined by concentrations of other ligands, such as DOM, and the competition for the biotic ligand between the toxic metal ion and the other metal cations in solution, for example, calcium and magnesium.
DiToro et al.’s model relates toxicity to the concentration of the divalent metal cation and accounts for the presence of competitive binding at the biotic ligand, the protective effects of other metal cations, and the direct influence of pH. The model has been applied to fathead minnows exposed to Cu and silver and its importance is in explicitly considering the bioavailability of a given metal, with regard to pH, dissolved organic carbon, and other factors.
DiToro et al. report that the LC50 value for Cu increases with increasing DOC concentration. They assume that Cu forms a complex with DOC and is not bioavailable. As a result, as DOC increases, more Cu is needed to exert the same degree of toxicity. The AWQ criterion for Cu recognizes the role of DOC and suggests that a site-specific criterion might be more appropriate in waters with high DOC.
Increases in concentrations of Ca++ also increase the amount of Cu to reach an LC50 endpoint. DiToro et al. showed that when pH and DOC were held constant, increases in hardness over the range of 75 to 375 mg CaCO3 l–l resulted in higher LC50 values (or lower toxicity). The Ca:Mg ratio remained approximately 2:1 throughout the changes in total hardness. DiToro et al. report that the increase in LC50 with hardness is qualitatively consistent with the current water quality criterion for Cu, which increases as a function of hardness.
The LC50 for Cu is lower at lower pH values. DiToro et al. conducted experiments holding hardness and DOC constant. The total Cu LC50 increased from about 6.4 to 127 µg l–1 as pH increased from 6.5 to 8.8. pH affects Cu toxicity in several ways. The model developed by DiToro et al. predicts that toxicity will decrease with increasing pH as a result of the effect of pH on speciation and complexation of Cu. As pH increases, the fraction of Cu that exists as copper carbonate complexes increases, thereby reducing toxicity. Further, at higher pH levels, DOC complexes with Cu, which reduces bioavailability.
27
Significance of Research
The research of DiToro et al. demonstrates the importance of water chemistry, especially pH, DOC, and hardness, in mediating the toxicity of Cu.

28
Acute and Chronic Effects
Many of the papers reviewed address a combination of acute and chronic endpoints. Therefore, it was not possible to divide the studies into separate categories that addressed mortality and chronic effects of growth, reproduction, and tissue accumulation. Papers that addressed behavioral effects only are discussed in a separate section.
Baldigo BP and Baudanza TP. 2001. Copper avoidance and mortality of juvenile brown trout (Salmo trutta) in tests with copper-sulfate-treated water from West Branch Reservoir, Putnam County, New York. Water-Resources Investigations Report 99-4237. US Geological Survey, Troy, NY. 25 pp.
Keywords: brown trout, avoidance, acute toxicity
The West Branch Reservoir, NY is periodically treated with CuSO4 to control algal growth. During treatments, the concentrations of total and dissolved Cu have reached concentrations known to be chronically or acutely toxic to resident fish. Mortality levels up to 38% have been estimated for brown trout.
The objectives of the study by Baldigo and Baudanza were to determine avoidance and acute toxicity of Cu for young-of-the-year (YOY) brown trout. Brown trout were exposed to each of 7 different Cu concentrations and a control (0, 3, 15, 46, 62, 76, 92 and 152 μg l-1) to assess their potential avoidance response to each Cu concentration. Each Cu-avoidance test (one Cu dilution per test) consisted of exposing 10 fish to the Cu-treated water in one channel of the flume and to control water in the other flume, reversing the source water and re-exposing the same fish to the same Cu-treated and control waters in opposite channels, repeating the process two more times, using 10 new fish each time. Fish were provided a choice of channels with control or Cu-treated water 6 times for each Cu-avoidance test. Average water hardness was 15.8 mg l-1.
The results of Baldigo and Baudanza suggest that YOY brown trout are attracted to low (18 and 40 μg l-1) Cu concentrations and high (183 μg l-1) Cu concentrations and that they may avoid intermediate (70 and 80 μg l-1) concentrations. As Cu concentrations increased, the fish spent more time in the “decision” area, rather than moving into the clean water channel or the Cu-treated channel. The highest NOEC was about 40 μg l-1 and the lowest LOEC was about 70 μg l-1.
Mortality test results indicate that 100% of the YOY brown trout died in 85 μg l-1 during 96-h exposures. The 96-hr LC50 concentration was 61.5 μg l-1 and the NOEC for mortality was 45 μg l-1.
Significance of Research
Baldigo and Baudanza demonstrated that YOY brown trout avoid concentrations of dissolved Cu greater than 55 μg l-1; the increased time spend in the “decision” area (between the clean and Cu-treated flumes) suggests some suppression of avoidance

29
responses. The 96-hr LC50 concentration was 61.5 μg l-1 was considerably higher than the hardness adjusted AWQ acute criterion of 2.5 μg l-1.
Beaumont MW, Butler PJ and Taylor EW. 1995. Exposure of brown trout, Salmo trutta, to sub-lethal copper concentrations in soft acidic water and its effect upon sustained swimming performance. Aquat. Toxicol. 33: 45-63.
Keywords: brown trout, chronic toxicity, critical swimming speed, pH
Beaumont et al. reviewed a number of laboratory studies that addressed the sub-lethal toxicity of low pH to brown trout, Salmo trutta. They noted that low acidity in natural environments mobilizes many metals, including Cu, and that laboratory studies of low pH alone may underestimate possible effects. In addition, sub-lethal effects, such as swimming performance, reproduction or behavior may have profound significance on survival of a population at concentrations substantially lower than estimated by acute tests.
Beaumont et al. discuss an earlier study (Waiwood and Beamish 1978) in which rainbow trout fingerlings exposed to Cu showed a 35% reduction of critical swimming speed after 5 days in soft water at low pH. In this study, oxygen consumption while swimming was elevated by Cu exposure, but maximum oxygen uptake decreased. Thus, exposure to Cu resulted in impaired oxygen exchange across the gill membrane.
The purpose of the study by Beaumont et al. was to extend previous investigations to reflect the natural conditions of streams in their area (Wales) of low pH (around 5) and sub-lethal Cu concentrations. At pH 5, 99% of the Cu would be in the form of Cu2+, thus avoiding changes in toxicity because of speciation. Fish were tested at two temperatures, 5° and 15° C.
All fish exposed to 20 μg Cu l-1 and pH 5 at 5° C survived the 96-h exposure; however, exposures of fish at a higher temperature (15° C) resulted in 60% mortality in Cu concentrations as low as 1 μg l-1. In these tests, the hardness was low, with Ca concentrations of 2 mg l-1 (total hardness was not reported). A subsequent test, in which hardness was increased to 4 mg l-1 Ca2+ resulted in no mortality at 5 μg Cu l-1, pH of 5 and temperature of 15° C.
Beaumont et al. found that sustained swimming performance was greatly reduced at both 5° and 15° C following Cu and acid exposure. At 15° C, critical swimming speed was significantly reduced by 28% for fish exposed to 5 μg Cu l-1 and pH of 5. Fish exposed to 30 μg Cu l-1, pH of 5 and temperature of 5 ° C showed 85% reduction in swimming speed over control fish. However, these fish retained some capacity for anaerobic ‘burst’ swimming, suggesting that Cu/acid exposure reduced oxygen transport to working muscles. The uptake of oxygen did not appear to be reduced by Cu/acid exposure.

30
Significance of Research
Beaumont et al. demonstrated that exposure to Cu and low pH resulted in a significant reduction of swimming performance in brown trout and an increase in oxygen consumption. They speculate that although the uptake of oxygen did not appear to be impaired by Cu or low pH, the transport of oxygen to working muscles was reduced. Highest Cu concentrations of 30 μg l-1 at pH 5 and 5° C resulted in an 85% reduction in swimming speed. The hardness of the water was low, with total Ca2+ concentrations of 4 mg l-1. At this hardness, the AWQ chronic criterion for Cu would be less than 3 μg l-1.
Buhl KJ and Hamilton SJ. 1990. Comparative toxicity of inorganic contaminants released by placer mining to earlylife stages of salmonids. Ecotox. And Environ. Safety 20: 325-342.
Keywords: Arctic grayling, coho salmon, rainbow trout, acute toxicity
Buhl and Hamilton tested the acute toxicities of Cu, Zn, Pb, and As to Arctic grayling (Thymallus arcticus, alevins, swim-up fry and 8-wk old juveniles) from Alaska and Montana, coho salmon (Oncorhynshus kisutch, alevins, 12 wk and 18- to 22-wk juveniles) from Alaska and Washington and rainbow trout (O. mykiss, alevins and 7- to 10-wk juveniles) from Montana. Static acute toxicity tests were conducted in standardized reconstituted soft water, modified to total hardness of 41 mg l-1 and alkalinity of 30.9 mg l-1.
Each test consisted of exposing groups of 10 fish to a toxicant concentration. From 6 to 10 concentrations were tested, depending on the element tested. The authors did not report the actual concentrations used in the tests.
Arctic grayling from Alaska were found to be more sensistive to Cu toxicity than any of the other test fish (Table 11). For Alaska Arctic grayling, sensitivities to Cu, Pb, and Zn were significantly greater in juveniles than in fry. The authors speculate that there may be inherent differences in tolerance to inorganics between populations of Arctic grayling from Alaska and those from Montana. Although there were some differences in the size of fish from these two areas (Arctic grayling juveniles from Alaska were smaller), Buhl and Hamilton state that the size differences were not sufficient to account for differences in sensitivity.
Buhl and Hamilton tested toxicity of mixtures of As, Cu, Pb, and Zn to the different fish species and life stages. Concentrations of the elements mimicked the amounts found in streams below placer mines. Their tests found that Cu was the primary toxic component of the mixtures and that the presence of As, Pb, and Zn did not significantly reduce or elevate Cu toxicity to salmonids.
Buhl and Hamilton reported that Cu was the most toxic element tested. Acute sensitivity to Cu varied significantly between and within the species tested; among juveniles, Alaska
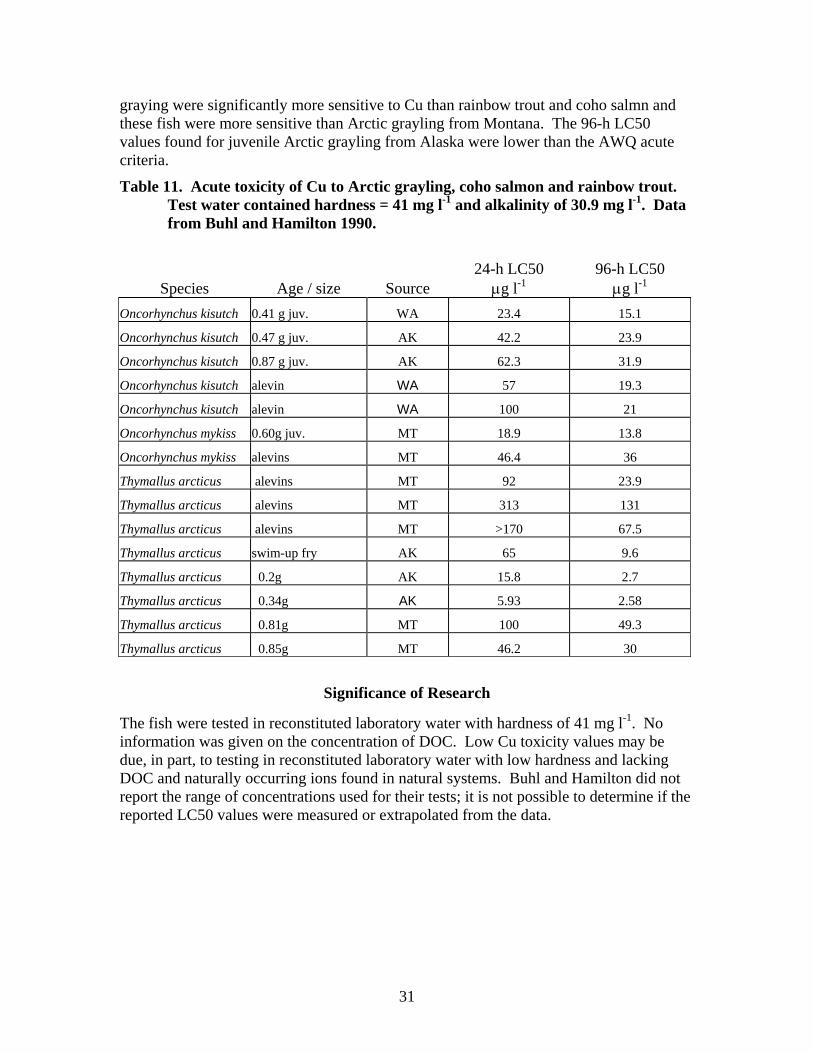
31
graying were significantly more sensitive to Cu than rainbow trout and coho salmn and these fish were more sensitive than Arctic grayling from Montana. The 96-h LC50 values found for juvenile Arctic grayling from Alaska were lower than the AWQ acute criteria.
Table 11. Acute toxicity of Cu to Arctic grayling, coho salmon and rainbow trout. Test water contained hardness = 41 mg l-1 and alkalinity of 30.9 mg l-1. Data from Buhl and Hamilton 1990.
Species Age / size Source 24-h LC50
μg l-196-h LC50
μg l-1
Oncorhynchus kisutch 0.41 g juv. WA 23.4 15.1
Oncorhynchus kisutch 0.47 g juv. AK 42.2 23.9
Oncorhynchus kisutch 0.87 g juv. AK 62.3 31.9
Oncorhynchus kisutch alevin WA 57 19.3
Oncorhynchus kisutch alevin WA 100 21
Oncorhynchus mykiss 0.60g juv. MT 18.9 13.8
Oncorhynchus mykiss alevins MT 46.4 36
Thymallus arcticus alevins MT 92 23.9
Thymallus arcticus alevins MT 313 131
Thymallus arcticus alevins MT >170 67.5
Thymallus arcticus swim-up fry AK 65 9.6
Thymallus arcticus 0.2g AK 15.8 2.7
Thymallus arcticus 0.34g AK 5.93 2.58
Thymallus arcticus 0.81g MT 100 49.3
Thymallus arcticus 0.85g MT 46.2 30
Significance of Research
The fish were tested in reconstituted laboratory water with hardness of 41 mg l-1. No information was given on the concentration of DOC. Low Cu toxicity values may be due, in part, to testing in reconstituted laboratory water with low hardness and lacking DOC and naturally occurring ions found in natural systems. Buhl and Hamilton did not report the range of concentrations used for their tests; it is not possible to determine if the reported LC50 values were measured or extrapolated from the data.

32
Hansen JA, Lipton J, Welsh PG, Morris J, Cacela D and Suedkamp MJ. 2002a. Relationship between exposure duration, tissue residues, growth, and mortality in rainbow trout (Oncorhynchus mykiss) juveniles sub-chronically exposed to copper. Aquat. Toxicol. 58: 175–188.
Keywords: rainbow trout, chronic toxicity, tissue concentration, growth
Hansen et al. conducted a 56-day sub-chronic test on effects of elevated Cu on rainbow trout fry. Water hardness was constant at 100 mg l-1, the test end points were growth, whole body Cu concentrations and mortality. The objective of their study was to address the lack of chronic tests, especially to early life stages, the limited understanding of effects of various water quality variables on chronic responses, and the limited understanding of Cu accumulation on adverse effects.
Rainbow trout fry were acclimated to test water quality conditions of 100 mg-l hardness, 7.9 pH and 8° C for 17 days before exposure to Cu concentrations (as CuCl2) of 0.19 (control), 9.5, 14.5, 22.2, 35.7, and 54.1 μg l-1. Hansen et al. reported significant mortality in fish exposed to 35.7 μg Cu l-1 (11.7%) and 54.1 μg Cu l-1 (47.8%). Growth of the fry was dose dependent, with fish exposed to higher Cu concentrations growing slower than fish exposed to control amounts. By day 20, fish exposed to 9.5, 14.5, 35.7 and 54.1 μg Cu l-1 had grown significantly less than controls. By day 56 (the end of the experiment) all fish but those exposed to the lowest concentration of 9.5 μg Cu l-1 showed significantly lower growth than controls.
Fish from all Cu treatments contained significantly higher tissue Cu concentrations than controls; Cu accumulation was related to both Cu treatment and exposure duration. The authors calculated inhibition concentration values (IC) (Table 12) based on reduction in growth as measured by weight.
Table 12. Percent reduction in growth and growth inhibition concentration values for rainbow trout exposed to Cu.
Concentration of Cu, μg l-1
Percent reduction in growth
Growth Inhibition Value
54.1 50 IC5021.6 20 IC2010.8 10 IC101.1 1 IC01
33
Significance of Research
The results of Hansen et al. indicate that at a water hardness of 100 mg l-l, pH 7.9 and low TOC concentrations, Cu concentrations as low as 9.5 μg l-1 can significantly reduce growth of rainbow trout fry. This IC10 concentration, resulting in a 10% growth reduction is slightly higher than the AWQ criterion of 9 μg l-1 at a hardness value of 100 mg l-l.

34
Hansen JA, Welsh PG, Lipton J and Cacela D. 2002b. Effects of copper exposure on growth and survival of juvenile bull trout. Trans. Amer. Fish. Soc. 131: 690-697.
Keywords: bull trout, growth, acute toxicity, tissue concentration
Hansen et al. examined the effects of long-term Cu exposure on bull trout (Salvelinus confluentus) growth and evaluated the relationships between bioaccumulation of Cu and fish growth. Fish were hatched from eggs, acclimated to the dilution water of 220 mg l-l total hardness and 7.9 pH for 30 days. After acclimation, fish were moved to the exposure tanks for 60 d. The target Cu concentrations (as CuCl2) were 179, 111, 76, 50, 25.6 and 0 μg Cu l-1.
Eight fish on days 20 and 40 and all remaining fish on day 60 were removed from each tank for measurement of total length and wet weight. After measurements were taken, fish were frozen and later analyzed for whole body tissue concentrations of Cu. No significant differences were found between mean wet weight or total length of control fish and all Cu-exposed bull trout at 20, 40 or 60 days. Fish collected from all Cu exposures contained significantly greater tissue Cu concentrations than control fish. Tissue Cu concentrations were both exposure and time dependent. At day 20, fish exposed to 111 μg Cu l-1 contained 2.4 times as much Cu as control fish; by day 60, the high-exposure fish contained more than 4 times the Cu concentration of control fish. The greatest whole-body Cu concentration was found in fish exposed to 179 μg Cu l-1 for 60 days; these fish contained about 6 times more Cu than control fish.
Significance of Research
Hansen et al. found increased tissue concentrations in fish exposed to the highest Cu concentrations: 179 μg Cu l-1 for 60 days. The differences in tissue concentrations of Cu were not correlated with changes in growth; no significant differences were found between mean wet weight or total length of control fish and all Cu-exposed bull trout at 20, 40 or 60 days.

35
Hecht SA, Baldwin DH, Mebane CA, Hawkes T, Gross SJ and Scholz NL. 2007. An overview of sensory effects on juvenile salmonids exposed to dissolved copper: Applying a benchmark concentration approach to evaluate sublethal neurobehavioral toxicity. US Dept. Commer. NOAA Tech. Memo. NMFS-NWFSC-83. Seattle, WA. 39p.
Keywords: olfactory effects, Benchmark Concentration
The report by Hecht et al. contains three components; the first is a review of sensory effects to juvenile salmonids from low-level exposures to dissolved Cu (dCu). Data on sensory effects come from both published literature and studies they have conducted. The second component of their paper describes the benchmark concentration method used to estimate toxicological effect thresholds for dCu in surface waters. The third component is a discussion of the influence of water chemistry on the bioavailability and toxicity of Cu to fish sensory systems.
In their summary of information on the effects of dCu to the sensory systems of juvenile salmonids, Hecht et al. present a table of values from published literature. Values presented in the table are somewhat biased because the studies are not discussed and, in many instances, Hecht et al. present only the lowest concentration showing effects. For example, their table contains an adverse effects concentration of 0.18 to 2.1 (EC10 to EC50) from the studies of Sandahl et al 2007. Sandahl et al. reported that 16.8 μg Cu l-1 significantly reduced swimming speed in juvenile coho salmon; however, exposure to concentrations of 10.2, 4.7, 1.9 and 0.3 μg Cu l-1 showed no reduction in swimming speed (or response to an alarm). Sandahl et al. then measured the effects of Cu exposure to the olfactory organs of juvenile fish exposed to an odorant that causes an alarm response. Sandahl et al. found that exposure to the lowest Cu concentration, 2 μg Cu l-1, significantly reduced olfactory responses and exposure to 20 μg Cu l-1 essentially abolished responses. Sandahl et al. presented a series of test results; the result listed by Hecht et al. is the lowest effects concentration reported by Sandahl et al for a specific test. In addition, Hecht et al. do not discuss conditions of the test water or possible additional stresses on the test organisms.
Sprague et al. reported two different effects concentrations for juvenile Atlantic salmon: 2.4 μg Cu l-1 for fish tested in reconstituted laboratory water (lacking the natural ions and DOC of natural waters) and 20 μg Cu l-1 for fish tested in a natural system. Although Hecht et al. report the findings of Sprague et al., they do not mention the water quality differences between laboratory and natural water that likely account for the different results.
Hecht et al. present a benchmark dose (concentration) analysis to define the concentrations of dCu that could be expected to affect juvenile salmonid olfaction. The benchmark concentration (BMC) is a method used by USEPA to determine no observable adverse effect level (NOAEL) values. The method statistically fits dose-response data to determine NOAEL values.

36
Using data sets from published literature, Hecht et al. estimated dCu BMCs of 3.6 to 10.7 μg l-1 for BMC20 to BMC50 and 2.3 to 3.0 μg Cu l-1 for BMC25. BMC20 would be expected to result in a 20% reduction in olfaction. The BMC values derived by Hecht et al. are concentrations above an assumed background concentration of 3 μg Cu l-1.
Hecht et al. limit their discussion of effects of water quality (hardness, pH, alkalinity and DOC) to concentrations found in soft-water systems of the Pacific Northwest. Hecht et al. assert that hardness and alkalinity have a minor or no influence on toxicity of dCu (as reported by other researchers), but DOC does increase protection.
Significance of Research
Hecht et al. provide a discussion of published literature on effects of dCu to juvenile salmonids, with an emphasis on studies conducted in waters with low alkalinity and low hardness, waters more typical of the Pacific Northwest. Their discussion contained in the Appendix provides information about some of the studies listed on their table of effects concentrations (discussed above).
Although not always stated in the document, the derived BMCs for dCu toxicity are concentrations above an assumed background of 3 μg Cu l-1. The value for BMC50 of 3.0 μg Cu l-1 reported by Hecht et al. translates to an instream concentration of 6.0 μg Cu l-1. This concentration is lower than the AWQ chronic criterion at hardness = 60 mg l-1.

37
Kazlauskiene N. 2002. Long-term effect of copper on sea trout (Salmo trutta trutta L.) in early ontogenesis. Ekologija 2: 65-68.
Keywords: sea trout, early life stage, acute toxicity
Kazlauskiene notes that fish in early ontogenesis are the most sensitive to Cu exposure and that the most sensitive stages are blastula, gastrula, early organogenesis, and hatching. He quotes the Swedish Environmental Protection Agency as documenting that fish in the genus Salmo are among the most sensitive to Cu. The goal of his study was to evaluate the long-term effects of Cu (as Cu2+) on sea trout in early ontogenesis.
Fish in the eyed stage (22 to 24 days after fertilization) were acclimated in test water of pH 7.6 and hardness approximately 250 mg l-1. Two hundred eggs or larvae were exposed to each Cu concentration in two replicates and a control. The effects of Cu were documented during three development periods: (1) from eyed-egg stage to yolk-sac reabsorption (58 d), from the beginning of hatching to yolk-sac reabsorption (44 d), and from one-day larva to yolk-sac reabsorption (38 d).
Cu solutions were prepared from CuSO4 to concentrations of 200 and 300 μg Cu l-1. The test concentrations reflect concentrations found in the more polluted areas of Lithuania. Kazlauskiene reported that fish exposed from eyed-egg stage to yolk-sac reabsorption (58 d) to 200 μg Cu l-1 showed no mortality at 4 days. At day 14, 8.5% died and at day 20, 26% of the eggs died. Fish exposed to 300 μg Cu l-1 showed 2% mortality by 4 days. By day 14, 11% died and by day 20, 35.5% of the eggs died.
Mortality rates were higher during the larval stages, although mortality may have occurred as a result of toxicity occurring throughout the developmental period. By the end of the test period (58 d), 70.3% of the test fish exposed to 200 μg Cu l-1 had died and 94.6% of fish exposed to 300 μg Cu l-1 had died.
Fish exposed from the beginning of the hatching period until yolk sac reabsorption had somewhat lower mortality than fish exposed from the earlier life stage. By the end of yolk-sac reabsorption (44 d), 47% of the test fish exposed to 200 μg Cu l-1 had died and 82.5% of fish exposed to 300 μg Cu l-1 had died.
Mortalities were even lower for fish exposed from one-day larvae to yolk-sac reabsportion. By the end of the test period (38 d), 23.3% of the test fish exposed to 200 μg Cu l-1 had died and 43.3% of fish exposed to 300 μg Cu l-1 had died. Two factors may have contributed to lower mortalities associated in the second and third tests. First, exposure durations were shorter and earlier life stages may be more sensitive to Cu.

38
Significance of Results
Survival of early life stages of fish exposed to Cu depends on both the developmental stage when exposure occurs and duration of the exposure. Exposing fish at defined life stages (e.g. eyed egg), then moving the fish to fresh water for the duration of development would have strengthened the study. Toxic effects occurring during early life stages may not manifest until later developmental stages. This study, however, underscores the importance of testing early life stages of fish when determining responses to toxicants.
39
Taylor LN, McFarland WJ, Pyle GG, Couture P and McDonald DG. 2004. Use of performance indicators in evaluating chronic metal exposure in wild yellow perch (Perca flavescens). Aquat. Toxicol. 67: 371-385.
Keywords: yellow perch, swimming performance, gill-binding, chronic toxicity
Taylor et al. conducted studies to evaluate effects of chronic Cu exposure on swimming performance and gill-binding characteristics of wild yellow perch, a species endemic to metal-contaminated lakes of the Sudbury region in northern Ontario. The authors speculated that the acclimation processes that permit yellow perch to live in metal-contaminated lakes would lead to improved swim performance and altered gill-Cu binding characteristics, compared to yellow perch inhabiting a reference lake.
Juvenile yellow perch and water samples were collected from metal-contaminated and reference lakes in the Sudbury region. Fish were subjected to sprint tests by gradually increasing water velocity in the test flumes. Fish were removed from the flumes when they exhibited fatigue. Gradually increasing water velocity, then determining the speed that was sustainable for at least 200 min was an estimate of critical velocity. A forced exercise test involved chasing fish for 8 min through continuous manual stimulation, or until the fish exhibited exhaustion.
Fish were challenged to a range of six nominal Cu concentrations (background, 50, 100, 200, 400, and 600 μg l-1) in a combined toxicity and gill-binding test. Test water for this experiment contained pH 6.8 and approximately 120 mg l-1 hardness.
Taylor et al. reported that fish from the metal contaminated lake had significantly lower condition factors, two to three times higher gill-Cu concentrations and three to four times higher liver-Cu concentrations than fish from reference lakes. Fish from the contaminated lake took twice as long to reach fatigue (a sign of greater endurance) than control fish; however, there was no significant difference in critical swimming speed between fish from control lakes and fish from contaminated lakes.
When exposed to acute Cu concentrations of 640 μg l-1, fish from the reference lakes reached 50% mortality in 110 minutes, whereas fish from the contaminated lakes took 186.2 minutes. Fish exposed to less than 300 μg l-1 total Cu showed no differences in gill-Cu binding between the two groups of fish. However, fish collected from contaminated lakes showed significantly less gill-Cu binding (at 8 μg g-1 gill tissue) than fish from reference lakes (23 μg g-1 gill tissue) when the fish were exposed to Cu concentrations of 300 μg l-1 and higher.
40
Significance of Research
Taylor et al. demonstrated that yellow perch acclimated to elevated Cu concentrations up to 21 μg l-1 had slightly greater swimming endurance and a longer time to death when exposed to an acutely lethal Cu concentration of 600 μg l-1 than fish from reference lakes. Taylor et al. demonstrate effects of Cu acclimation for fish inhabiting natural, metal-contaminated lakes. Their study suggests that toxicity tests conducted with laboratory-reared or hatchery-reared fish may not reflect toxic responses of fish acclimated to Cu.

41
Cellular Level Effects
Bettini S, Ciani F, and Franceschini V. 2006. Recovery of the olfactory receptor neurons in the African Tilapia mariae following exposure to low copper level. Aquat. Toxicol. 76: 321–328
Keywords: Olfactory neurons, Tilapia
Fish olfactory organs are directly exposed to the aquatic environment, rendering them particularly vulnerable to toxicants. Receptor cells damaged by toxicants or undergoing normal senescence are replaced by basal cells in the neuroepithelium of adults. The neurons originate from globose basal cells, migrate to the upper third of the epithelium during differentiations, and re-establish contacts with the lumen of the nasal cavity. Olfactory neurons are particularly sensitive to Cu (Bettini et al.) and trace amounts may cause cell death.
Bettini et al. discuss earlier studies in which electrophysiological and behavioral experiments demonstrated that olfactory discrimination ability decreases in relation to Cu concentration and time of exposure. The goal of the research by Bettini et al. was to investigate the effects of Cu (as CuSO4) at 20, 40 and 100 μg l-1 on the olfactory epithelium of African cichlid (Tilapia maria). A second objective was to examine the olfactory cell regeneration of fish exposed to 20 μg l-1, then transferred to clean water. Total hardness of the test water was 364 mg l-1 and pH was 7.1.
After exposure to test conditions, the fish were killed and thin sections of tissue were examined. Bettini et al. reported that olfactory epithelium of fish exposed to 100 μg l-1 was extensively damaged. Fish exposed to 40 μg l-1 showed less apparent damage, but a few degenerating cells. Fish exposed to 20 μg l-1 showed some degeneration in olfactory receptor neurons; damage was mainly in the primary olfactory neurons. Fish exposed to 20 μg l-1, then moved to clean water showed rapid regeneration within three days. Complete restoration of tissues was observed in samples taken 10 days after Cu exposure.
Significance of Research
Bettini et al. showed slight degeneration of olfactory cells after exposure to 20 μg Cu l-1, with extensive damage in fish exposed to 100 μg l-1. Complete cell regeneration occurred within 10 days after exposure to 20 μg l-1. At the reported hardness of the test water (364 mg l-1) the AWQ chronic criterion for Cu is 28.2 μg l-1.
42
Geist J, Werner I, Eder KJ and Luetenegger CM. 2007. Comparisons of tissue-specific transcription of stress response genes with whole animal endpoints of adverse effect in striped bass (Morone saxitilis) following treatment with copper and esfenvalerate. Aquatic Toxic. 85: 28-39.
Keywords: stress response, striped bass, acute toxicity, chronic toxicity
Geist et al. tested the acute and chronic effects of Cu and the pyrethroid insecticide esfenvalerate to juvenile striped bass (Morone saxitilis). Endpoints for chronic toxicity were growth, swimming behavior and transcription levels of stress response genes. Ninety-day-old striped bass were exposed to Cu concentrations (as CuCl2) of 0, 42, 160, 470, and 900 μg l-1 for 4 days. The hardness of the water was 200 mg l-1. The results of the acute tests showed a 96-h LC50 of 441 μg Cu l-1, an NOEC of 160 μg l-1, and an LOEC of 470 μg l-1.
Geist et al. reported significant changes in the transcription of stress response genes after 7-d Cu exposure. Changes were detected for four stress response genes in kidney tissue, for two genes each in spleen, muscle and gill tissue, and for one gene in liver tissue. Overall, the strongest changes in transcription levels were found for metallothionein, which increased by 2.5 (average of all tissues) following exposure to 42 μg Cu l-1 and increased 4.2 following exposure to 160 μg Cu l-1. The strongest effects on metallothionein transcription were observed in the spleen tissue, where transcription increased 3.7 and 9.5 times in the 42 μg Cu l-1 and μg Cu l-1 treatments.
Geist et al. reported 100% mortality to fish exposed to 470 and 900 μg Cu l-1 (equivalent to 440 and 810 μg dissolved Cu l-1). All fish survived in control water and water with 42 μg Cu l-1. Fish exposed to 160 μg Cu l-1 experienced 8% mortality. No significant effects of Cu exposure on growth or swimming behavior were observed, with a 7-d NOEC of 160 μg Cu l-1 and a 7-d LOEC of 440 μg Cu l-1.
Significance of the Research
The Cu concentrations used in this study are higher than the AWQ acute and chronic criteria of 27 μg l-1 (acute) and 17 μg l-1 (chronic) for hardness of 200 mg l-1. However, Geist et al. demonstrate the sensitivity of molecular endpoints in toxicity studies. These endpoints can discriminate between exposures to groups of chemicals with different mechanisms of action, detoxification pathways, and biochemical stress responses.

43
Taylor LN, McGreer JC, Wood CM, and McDonald DG. 2000. Physiological effects of chronic copper exposure to rainbow trout (Oncorhynchus mykiss) in hard and soft water: Evaluation of chronic indicators. Environ. Toxicol. Chem. 19: 2298-2308.
Keywords: chronic toxicity, growth, swimming, gill binding, rainbow trout
Taylor et al. conducted studies of exposure of chronic levels of Cu to rainbow trout. Their objective was to identify a large suite of indicators, including acute toxicity, acclimation, growth, sprint performance, whole-body electrolytes, tissue residues and gill Cu-binding characteristics, and to rank those effects by their importance as indicators of Cu toxicity.
Juvenile rainbow trout (1 to 2 g) were exposed to 20 and 60 μg Cu l-1 and a control of about 3 μg Cu l-1. The test water contained 120 mg l-1 hardness and pH of 8.0. Three percent of fish in the 60 μg Cu l-1 died during the 30 day exposure period. Most of the mortalities occurred within the first 5 days of exposure. Mortality of fish exposed to 20 μg Cu l-1 was less than 0.5%.
Only fish exposed to 60 μg Cu l-1 showed significant acclimation to Cu. These fish were approximately 1.7 times more resistant to Cu than were control fish, with a 96-h LC50 of 153.0 μg Cu l-1, compared to a 96-h LC50 of 91.0 μg Cu l-1 for control fish. Cu exposure did not affect growth, sprint performance and whole body electrolytes (Na+ and Cl-).
Gills of fish exposed to 60 μg Cu l-1 had significantly elevated Cu, starting at exposure day 2. Livers of fish exposed to 60 μg Cu l-1 contained significantly elevated Cu and Cu concentrations continued to increase from day 2 to the end of the experiment.
Juvenile fish acclimated to hard water were exposed for 3 hours to labeled 64Cu at concentrations from 30 to 1050 μg l-1. Fish exposed to concentrations up to 185 μg l-1
showed no detectable accumulation of Cu on the gills. Only fish exposed to 1050 μg l-1
showed significant accumulation.
Fish exposed to Cu for the first time accumulated less Cu on gill tissue than fish previously exposed to Cu, especially in tests with high concentrations of 185 μg l-1. Differences between previously exposed fish and naive fish were less pronounced when exposed to lower concentrations of 16 μg l-1.
Additional tests also were conducted in soft water (20 mg l-1 hardness as CaCO3) with Cu conentrations of 1 and 2 μg l-1. Mortality of juvenile rainbow trout was 10% after 15 days in both treatments and control. These fish showed no acclimation to Cu and Taylor et al. speculate that lack of acclimation was a result of additional stress from the soft water. As with fish tested in hard water, growth, swimming performance and concentrations of electrolytes were not affected by Cu concentrations.
44
Significance of Research
Taylor et al. found that endpoints of survival, growth, swimming performance and changes in whole body electrolytes were not sensitive end-points of chronic Cu toxicity. Rainbow trout exhibited an increase in tolerance to acutely toxic concentrations of Cu. The increase in tolerance was found to be proportional to the exposure concentration and is maximized after about 2 weeks exposure, resulting in an approximate twofold increase in the 96-h LC50 in hard water. The increase in the 96-h LC50 is less in soft water.
Cu concentrations in gill tissue appeared to be one of the most reliable indicators of chronic Cu exposure.
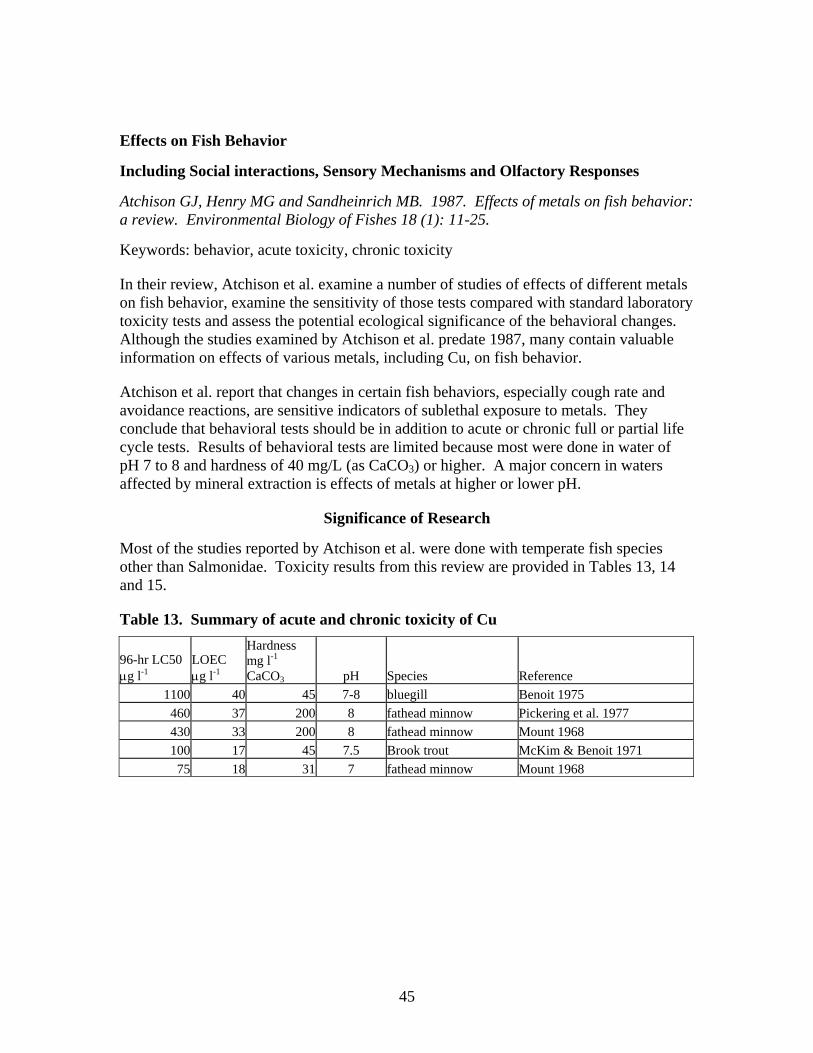
45
Effects on Fish Behavior
Including Social interactions, Sensory Mechanisms and Olfactory Responses
Atchison GJ, Henry MG and Sandheinrich MB. 1987. Effects of metals on fish behavior: a review. Environmental Biology of Fishes 18 (1): 11-25.
Keywords: behavior, acute toxicity, chronic toxicity
In their review, Atchison et al. examine a number of studies of effects of different metals on fish behavior, examine the sensitivity of those tests compared with standard laboratory toxicity tests and assess the potential ecological significance of the behavioral changes. Although the studies examined by Atchison et al. predate 1987, many contain valuable information on effects of various metals, including Cu, on fish behavior.
Atchison et al. report that changes in certain fish behaviors, especially cough rate and avoidance reactions, are sensitive indicators of sublethal exposure to metals. They conclude that behavioral tests should be in addition to acute or chronic full or partial life cycle tests. Results of behavioral tests are limited because most were done in water of pH 7 to 8 and hardness of 40 mg/L (as CaCO3) or higher. A major concern in waters affected by mineral extraction is effects of metals at higher or lower pH.
Significance of Research
Most of the studies reported by Atchison et al. were done with temperate fish species other than Salmonidae. Toxicity results from this review are provided in Tables 13, 14 and 15.
Table 13. Summary of acute and chronic toxicity of Cu
96-hr LC50 μg l-1
LOEC μg l-1
Hardness mg l-1 CaCO3 pH Species Reference
1100 40 45 7-8 bluegill Benoit 1975 460 37 200 8 fathead minnow Pickering et al. 1977 430 33 200 8 fathead minnow Mount 1968 100 17 45 7.5 Brook trout McKim & Benoit 1971 75 18 31 7 fathead minnow Mount 1968

46
Table 14. Effects of Cu on Fish Avoidance
LOEC μg l-1
Hardness mg l-1 CaCO3 pH Species Reference
6.4 28 7.3 rainbow trout Giattina et al. 1982 0.1 90 8 rainbow trout Folmer 1976 6.3 7.7 lake whitefish Hara 1981 2.3 18 Not given Atlantic salmon Sprague 1964 5 5 8.4 goldfish Westlake et al. 1974
Table 15. Effects of Cu on Fish Respiration (elevated ventilation and coughing rates)
Effect LOEC μg l-1
Hardness mg l-1 CaCO3 pH Species Reference
Coughing 9 45 7.6 Brook trout Drummond at al. 1973 Coughing 34 270 7.4 bluegill Henry and Atchison 1986 Ventilation 48 not given 7 Largemouth bass Morgan 1979

47
Baldwin DH, Sandahl JF, Labenia JS and Scholz NL. 2003. Sublethal effects of copper on coho salmon: impacts on non-overlapping receptor pathways in the peripheral olfactory nervous system. Environ. Toxicol. Chem. 22 (10): 2266–2274.
Keywords: olfactory response, coho salmon, hardness
Baldwin et al. used an established technique, field potential recordings, or electro-olfactograms (EOG) to monitor the effects of Cu on the active (or odor-evoked) properties of primary sensory neurons in the olfactory epithelium. They described the EOG as a large, negative voltage transient, measured with an electrode positioned near the surface of the sensory epithelium. The amplitude of the EOG corresponds to the electrical response of olfactory receptor neurons as they bind to odor molecules.
Tests were conducted on juvenile coho salmon maintained in solutions of 20 mg l-1 hardness and 7.1 pH. The control water contained 3.0 μg l-1, Cu solutions were added to provide the following increase over background: 1, 2, 5, 10 and 20 μg l-1. (Note: Baldwin et al. report Cu concentrations as the “nominal concentration”; actual test solutions are likely closer to 4, 5, 8, 13 and 23 μg l-1 ). They tested olfactory response to two different natural odorants (L-serine and taurocholic acid) and an odorant mixture (L-arginine, L-aspartic acid, L-leucine, and L-serine).
Baldwin et al. reported that short-term Cu exposures at a nominal concentration of 10 μg l-1 (approximately 13 μg l-1 actual concentration) reduced the responsiveness of the sensory epithelium to all three odorants. Baldwin et al. also tested the potential role of hardness in Cu’s sublethal toxicity by adding CaCl2 to increase the hardness to 120 mg l-1 and 240 mg l-1. They reported that increases in water hardness did not seem to influence the toxicity of Cu to coho salmon sensory neurons for fish exposed to 10 μg l-1 nominal solution (actually 13 μg l-1).
Significance of Research
Tests on the role of water hardness in mediating Cu toxicity should be viewed as preliminary. Hardness is measured as CaCO3 and is usually viewed as the concentration of Ca++, Mg++ and other divalent ions. Cl- ions may have a completely different role in Cu toxicity. Further, the sample size for the hardness tests was small, with n = 4 to 6 fish per hardness concentration. A final criticism of this study was that the control water was run through tubing that had previously contained Cu solutions; therefore, the exact concentration of the control is not known.
Baldwin et al. delivered the three odorants in pulses to limit “sensory fatigue”, which occurs when olfactory organs become accustomed to an odor and reactions to the odor slow or stop. The researchers did not conduct test to determine if the pulses were effective in limiting sensory fatigue.
48
The fish were tested for response to Cu ions in soft water, with approximately 20 mg l-1
total hardness. The AWQ chronic criterion for Cu at this hardness is 2.4 μg l-1, below the reported Cu concentration of their control water.
Carreau ND and Pyle GG. 2005. Effect of copper exposure during embryonic development on chemosensory function of juvenile fathead minnows (Pimephales promelas). Ecotoxicol. and Environ. Safety: 61 (1): 1-6.
Keywords: fathead minnow, embryonic development, chemosensory function
Fish of the super order Ostariophysi (minnows, catfish, etc.) have specialized epidermal club cells that release a chemical alarm when there is mechanical damage to the skin. Nearby fish of the same species will respond to this alarm by avoiding an area or demonstrating fright reactions. This alarm mechanism is important to surviving predation. Carreau and Pyle addressed the possibility that Cu exposure during embryonic development of fathead minnows may suppress the chemosensory functions.
Carreau and Pyle exposed fathead minnow embryos to either clean water or water containing 10 μg Cu l-1 (as CuSO4). Embryos were held in the control or Cu water until 5-7 d post fertilization (hatching), then half of the fish in the 10 μg Cu l-1 were transferred to clean water (a total of three exposure treatments). Fish were held in clean or 10 μg l-1
Cu for 84 to 96 d, then tested to determine their ability to detect and respond to alarm cues. Total hardness was 18 mg l-1.
Carreau and Pyle reported that only fish raised entirely in clean water responded to alarms cues. Neither fish exposed to Cu only as embryos nor those maintained in the Cu solution during embryonic development and post hatch avoided alarm cues. No fish from any experimental treatment demonstrated a significant response to alarm stimuli.
Significance of Research
Carreau and Pyle demonstrated the effects of early Cu exposure to fathead minnows. The results of their study are somewhat limited because they only tested fish in control and 10 μg l-1 Cu water. The hardness of the test solutions was low, 18 mg l-1, and the test water of 10 μg l-1 Cu was substantially higher than the AWQ chronic criterion for freshwater aquatic life (approximately 2.2 μg l-1 at the given hardness).

49
Giattina JD, Garton RR and Stevens DG. 1982. Avoidance of copper and nickel by rainbow trout as monitored by a computer-based data acquisition system. Trans. American Fisheries Society 111: 491-504.
Keywords: avoidance, rainbow trout
Giattina et al. tested the avoidance response of rainbow trout to Cu (as CuCl2) and nickel (as NiCl2) using both a steep and shallow gradient. The researchers also tested the effects of increasing Cu concentrations with time. With each gradient, the fish were given a choice between control and toxicant water; a sharp interface was maintained between control and toxicant water. The avoidance threshold was defined as the concentration that caused a 50% reduction in the amount of time a fish spent in an area relative to respective control times. Test solutions contained 28.4 mg l-1 hardness.
Giattini et al. found that the residence time and activity of rainbow trout in water containing Cu was inversely related to Cu concentrations. The calculated LOEC was 6.4 μg l-1.
Rainbow trout avoided Cu at concentrations of about 4.4 μg l-1 when exposed under shallow concentration-gradient conditions. Fish appeared to be able to detect Cu concentrations down to 1.4 to 2.7 μg l-1; reductions in the time spent in the Cu treated water started to appear at this concentration range. Changes in time spend in the Cu treated water were not significant at these lower concentrations.
Rainbow trout exposed to the highest Cu concentrations (334 to 386 2.7 μg l-1) spent more time in the Cu dosed water; the fish were attracted to Cu in both shallow and steep gradient tests.
When fish were tested with increasing Cu concentrations in either a shallow or steep gradient, the fish responded at the same concentrations as with a single Cu dose. Therefore, there was no apparent acclimation to Cu.
Significance of Research
Giattina et al. documented Cu avoidance by rainbow trout at 6.4 μg l-1 in a steep gradient and 4.4 μg l-1 in a shallow gradient. The AWQ criteria for Cu at the hardness of the test water are 4.3 μg l-1 (acute) and 3.2 μg l-1 (chronic). In contrast to findings of other researchers (e.g. Hansen et al. 1999a), Giattini et al. did not find acclimation of rainbow trout to Cu to be a factor. An additional criticism of the study is that fish were exposed for 100 seconds; avoidance was determined if fish spent 50 seconds outside of the treatment zone. This test duration is substantially shorter than used by other researchers and may be too short to determine acclimation or significant results.
50
Hansen JA, Marr JCA, Lipton J, Cacela D and Bergman HL. 1999a. Differences in neurobehavioral responses of Chinook salmon (Oncorhynchus tshawytscha) and rainbow trout (Oncorhynchus mykiss) exposed to copper and cobalt: behavioral avoidance. Environ. Toxicol. Chem. 18(9): 1972-1978.
Keywords: Chinook salmon, rainbow trout, avoidance
Hansen et al. state that behavioral avoidance is usually one of the most sensitive endpoints for fish exposed to metals. Frequently, avoidance is demonstrated at concentrations that are much lower than a water quality standard based on acute data. Numerous earlier studies documented avoidance of Cu by rainbow trout at low concentrations (for example, Giattina et al., reviewed in this report), effects of steep or shallow concentration gradients, and effects of acclimation to low Cu concentrations. Few early studies tested avoidance to metal mixtures, such as would be found in a mine-affected stream.
Hansen et al. investigated the avoidance response of juvenile Chinook salmon and juvenile rainbow trout to Cu, Co, and Cu+Co under water quality conditions and metals concentrations that simulated a natural mine-affected stream in Idaho. They also examined avoidance responses after the fish were acclimated to a nominal Cu concentration of 2 μg l-1 for 25 to 30 days.
The test solutions contained 25 mg l-1 hardness and alkalinity, pH 7.5 and temperature 10° C. Hansen et al. designed test troughs the delivered metal solution to the fish over a steep concentration gradient. The fish were covered to reduce external disturbance and a video camera was mounted on the trough to record behaviors. The fish were exposed to Cu concentrations ranging from 0 to 360 μg l-1.
Hansen et al. found that Chinook salmon significantly avoided 0.8 μg Cu l-1 and from 2.8 to 22.5 μg Cu l-1, but not 1.6 μg Cu l-1 and 180 or 360 μg Cu l-1. The maximum mean avoidance response was observed at 6 μg Cu l-1, with fish averaging approximately 10% of their time in the contaminated water.
Rainbow trout avoided Cu concentrations from 1.6 to 88 μg Cu l-1. As with Chinook salmon, rainbow trout did not demonstrate avoidance in concentrations of 180 or 360 μg Cu l-1. The strongest avoidance responses for rainbow trout were observed in concentrations between 5 and 50 μg Cu l-1, where the fish averaged less than 10% of their time in the contaminated water.
Both Chinook salmon and rainbow trout showed avoidance of mixtures of Cu and Co as they did to Cu, with a few exceptions: rainbow trout significantly avoided 88 μg Cu l-1
but did not significantly avoid the mixture of 92 μg Cu l-1 + 86 μg Co l-1.
51
Tests on the influence of 25-30 day acclimation to Cu produced different results in Chinook salmon and rainbow trout. Chinook salmon, once acclimated, did not avoid any of the Cu test concentrations (from 3.4 to 21 μg Cu l-1) and demonstrated no preference for clean water. Rainbow trout, however, significantly preferred clean water and avoided all Cu concentrations higher than the control acclimation exposure of 1.6 μg Cu l-1.
Significance of Research
Hansen et al. demonstrated strong avoidance of Cu by Chinook salmon and rainbow trout at low Cu concentrations, as low as 0.8 μg Cu l-1, although this concentration is fairly close to the method detection limit of 0.2 μg Cu l-1. The AWQ acute standard is 3.8 μg Cu l-1 and the chronic limit is 2.9 μg Cu l-1 at the hardness level of their test solutions.
Chinook salmon acclimated to Cu for 25 to 30 days failed to show an avoidance of Cu at the tested concentrations of 3.4 to 21 μg Cu l-1. Rainbow trout, in contrast, seemed unaffected by acclimation. This finding supports the necessity of considering sensitivities of individual species.

52
Hansen JA, Woodward DE, Little EE, DeLonay AJ and Bergman HL. 1999b. Behavioral avoidance: Possible mechanisms for explaining abundance and distribution of trout species in a metal-impacted river. Environ. Toxicol. Chem. 18: 313-317.
Keywords: rainbow trout, avoidance
Metals from past mining have contaminated the upper Clark Fork River in west-central Montana. Regions around Butte were mined in Butte and smelted in Anaconda from the 1880s through the early 1970s. Mining and smelting operations released an estimated 100 million metric tons of waste rock, tailing and slag containing high concentrations of Cu, Cd, Pb and Zn into the river. This river system once supported large populations of trout, char, whitefish and salmon.
Hansen et al. speculate that reductions in fish populations in the Clark Fork River may have resulted, in part, from avoidance to metals. The objectives of their study were to measure rainbow trout avoidance responses to metal concentrations typical of the upper Clark Fork River and to compare their results with previous studies of avoidance by brown trout. They examined four experimental conditions to determine the influence on rainbow trout avoidance behavior: metal mixture concentrations, acidity, acidity combined with increased metal concentrations, and acclimation to metal mixtures.
Hansen et al. reported that rainbow trout avoided metal mixtures containing 1.2 μg Cu l-1, 0.11 μg l-1 Cd, 0.32 μg l-1 Pb, and 5.0 μg l-1 Zn. The researchers also reported that rainbow trout showed avoidance with each decrease in pH: from 8 to 7, from 7 to 6, and from 6 to 5. Rainbow trout showed stronger avoidance responses in tests with pH 6 and 5 when metals were added than in water of the same pH without added metals.
Significance of Results
Hansen et al. did not conduct tests with individual metals; therefore, their results have only limited application to Cu toxicity. The study of Hansen et al. is included in this review because it is quoted by a number of different authors (e.g. Woody 2007).

53
Hansen JA, Rose JD, Jenkins RA, Gerow KG and Bergman HL. 1999c. Chinook salmon (Oncorhynchus tshawytscha) and rainbow trout (Oncorhynchus mykiss) exposed to copper: neurophysiological and histological effects on the olfactory system. Environ. Toxicol. Chem. 18: 1979-1991.
Keywords: rainbow trout, Chinook salmon, olfactory response
Hansen et al. investigated effects of Cu on the olfactory epithelial structure and the electro-physiological function of the olfactory system in Chinook salmon and rainbow trout. Their research was based on recognition that fish avoid low Cu concentrations, but high concentrations are not avoided (Hansen et al. 1999a, reviewed in this paper). Failure to avoid higher Cu concentrations suggests that some chemosensory system is damaged at higher metal exposure concentrations. The objectives of their research were to determine if structural damage and functional impairment of the olfactory system was a probable cause of the loss of behavioral avoidance at higher Cu concentrations.
Chinook salmon ranged from 170 to 275 mm fork length and rainbow trout from 197 to 280 mm fork length. Fish were acclimated in water of 25 mg l-1 hardness, pH 7.5, temperature 12° C and background Cu concentrations <0.7 μg l-1. A laser-scanning microscope was used to quantify the numbers of olfactory receptors on the surface of the rosette of both fish species following 1-hr and 4-hr exposures and a transmission electron microscope to augment the observations. Fish were exposed to Cu concentrations of 0, 25, 50, 100 and 200 μg l-1, rainbow trout also were exposed to 300 μg l-1.
In an additional experiment, Teflon-coated, stainless steel wire electrodes were placed on the olfactory bulb to measure electrophysiological responses. Stimulus water contained 10-3 M (moles) L-serine. Copper solutions of 0, 25, 50, 100, 200 and 300 μg l-1 were mixed from CuCl2. The solutions were delivered to the olfactory rosette. The amino acid L-serine was used as a test stimulus because it is a well-studied olfactory stimulus of known functional significance.
Fish response to L-serine stimulus was consistent throughout the pre-Cu exposure control period; however, the responses from rainbow trout exposed to 25, 50 and 100 μg Cu l-1 were reduced to between 50 and 65% of control and remained depressed throughout the 60-min Cu-exposure period. These fish began to recover during the 60-min period in control water. Fish exposed to higher Cu concentrations showed a rapid decline in response and longer recovery periods than at lower concentrations.
Responses in Chinook salmon exposed to 25 μg Cu l-1 were reduced by approximately 50%; fish exposed to 50 μg l-1 showed 55 to 70% reduction in responses to L-serine. Both of these test groups began to show substantial recovery when removed to clean water. Chinook salmon exposed to higher concentrations showed 55 to 70% reduction in responses to L-serine and did not recover when moved to clean water.

54
Tissues in control fish contained numerous small-dendrite receptors, whereas tissues from fish exposed to higher Cu concentrations had far fewer receptors. The control Chinook salmon averaged 335 small-dendrite receptors per 10,000 μm2 image area, but exposure to 50 μg Cu l-1 and greater significantly reduced the number of these receptors. Rainbow trout controls had a similar number of small-dendrite receptors when compared with those observed in Chinook salmon, but the number of small-dendrite receptors was reduced only following exposure to 200 μg Cu l-1 and higher.
Significance of Research
Both rainbow trout and Chinook salmon exhibited a loss of response to a stimulus and a loss of small-dendrite receptors following exposure to Cu. Depression in the response to stimulus with the amino acid, L-serine, was evident at 25 μg Cu l-1 and higher. Following Cu exposure, activity of the olfactory rosette recovered more quickly and to a greater degree in fish exposed to lower concentrations: in Chinook salmon exposed to 25 μg Cu l-1 and in rainbow trout exposed to 25 to 100 μg Cu l-1.
Rainbow trout experienced a significant reduction in the number of small-dendrite receptors following exposure to 200 μg Cu l-1 and higher. Chinook salmon experienced a significant reduction in the number of small-dendrite receptors following exposure to 50 μg Cu l-1 and higher.

55
Linbo TL, Stehr CM, Incargona JP and Scholz NL. 2006. Dissolved copper triggers cell death in the peripheral mechano-sensory system of larval fish. Environ. Toxicol. Chem. 25: 597-603.
Keywords: Cyprinidae, olfactory response
The acute and chronic toxicity of Cu to fish are well documented; especially the role of hardness and DOC. However the effects of short-term pulses (<12 h) of dissolved Cu at sublethal concentrations, such as would occur with non-point source inputs, are not as well studied, including pathways of Cu toxicity other than through the gill epithelium. Linbo et al. exposed zebra fish larvae (a fresh water fish in the minnow family, Cyprinidae) to concentrations of Cu (as CuCl2) ranging from 0 to 65 μg l-1 and examined the cytotoxic responses of individual lateral line receptor neurons. The sensory cells along the lateral line are important to a range of fish behaviors and provide cues on vibration and water displacement.
Dissolved Cu triggered a dose-dependent loss of neurons at concentrations of 20 μg l-1 or higher; cell death occurred within less than 1 hr after exposure. Fish removed to clean water showed regeneration within 2 days. Fish exposed continuously to 50 μg Cu l-1 did not recover.
Significance of Research
The study of Linbo et al. addresses effects of short-term, sublethal exposures of Cu to fish. The effects concentration of 20 Cu μg l-1 with water hardness of 150 mg l-1 is higher than the AWQ criterion freshwater chronic limit of 13 μg l-1 at hardness of 150 mg l-1.
56
Sandahl JF, Baldwin DH, Jenkins JJ, and Scholz NL. 2004. Odor-evoked field potentials as indicators of sublethal neurotoxicity in juvenile coho salmon (Oncorhynchus kisutch) exposed to copper, chlorpyrifos, or esfenvalerate. Can. J. Fish. Aquatic Science. 61: 404–413.
Keywords: coho salmon, olfactory response
Sandahl et al. examined the sublethal neurotoxicity of exposures of 5 to 20 μg Cu l-1 to coho salmon fry (average fork length 140 mm). Water hardness was maintained at 120 mg l-1. The olfactory responses of fish exposed to 10 and 20 μg Cu l-1 were significantly different from controls. Olfactory responses were reduced by 50% at 10 μg Cu l-1 and 90% at 20 μg Cu l-1. (Note that the AWQ chronic criterion for Cu is approximately 10.9 μg l-1).
The authors calculated benchmark concentrations: BMC20 or a 20% reduction in olfactory function at 4.4 μg l-1 and BMC50, or 50% reduction, at 11.1 μg l-1. It is important to note that these benchmark values are calculations based upon statistical analysis of their data; they did not test fish at these concentrations. The BMC20 is an extrapolation between the control and effects at the other concentrations.
Significance of Research
Sandahl et al. have documented reduced olfactory responses in juvenile coho salmon exposed to 10 μg Cu l-1 (50% reduction) and 20 μg Cu l-1 (90% reduction). The authors did not measure recovery times by moving fish to clean water. The extrapolated values presented by the authors should be viewed as statistical values only and may not represent actual responses by the juvenile fish. The authors also did not test for olfactory fatigue. The AWQ criteria for Cu at the hardness of the test water (120 mg l-1) is 16.6 μg l-1 (acute) and 10.9 μg l-1 (chronic).
57
Sandahl JF, Miyaska G, Koide N and Ueda H. 2006. Olfactory inhibition and recovery in chum salmon (Oncorhynchus keta) following copper exposure. Can. J. Fish. Aquatic Science 63(8): 1840-1847.
Keywords: chum salmon, olfactory neurons
Sandahl et al. addressed the reversible effects of Cu on fish olfactory systems and the time required for recovery, following relatively brief or low concentration exposures. The impetus for their study came from the use of Cu in northern Japan hatcheries to suppress fungal and parasitic infections in chum salmon. Their goal was to measure the initial effects of Cu at hatchery treatment concentrations on the electrical properties of olfactory receptor neurons in chum salmon fry, then to monitor olfactory recovery.
Exposure solutions contained 3, 8, 24, and 58 μg Cu l-1 (as CuCl2) in water with 75 mg l-1 total hardness and 6.7 pH. Fish were exposed to Cu solutions for 4 h. The authors reported that chum salmon exposed to 24 and 58 μg Cu l-1 showed significant decreases in the number of active olfactory receptor neurons. Chum salmon olfactory systems recovered within 1 day after transferring to clean water.
Significance of Research
The results of effects of Cu on olfactory receptor neurons are presented graphically; it is difficult to interpret the level of response at different concentrations. The emphasis of this study is on the recovery times, which was 1 d for all Cu concentrations. The results of this study should not be used to predict levels of olfactory inhibition with different concentrations of Cu.

58
Sandahl JF. Baldwin DH, Jenkins JJ and Scholz NL. 2007. A sensory system at the interface between urban stormwater runoff and salmon survival. Environ. Sci. Technol. 41: 2998-3004.
Keywords: coho salmon, olfactory response
Sandahl et al. conducted studies to determine if short term (3 h) exposures to dissolved Cu at concentrations typical of urban stormwater runoff (0 to 20 Cu μg l-1) interfere with olfactory responses and olfactory-based behaviors in juvenile coho salmon. The test water contained hardness of 120 mg l-1, pH of 6.6, dissolved oxygen 8.1 mg l-1 and temperature from 11 to 13°C. The researchers created an “alarm” solution from homogenized coho salmon skin. Measured Cu concentrations were 0.3, 1.9, 4.7, 10.2 and 16.8 μg l-1.
Fish were acclimated for 30 minutes to Cu concentrations and the pre-stimulus swimming speed was measured. The alarm solution was added (the stimulus) and the swimming speed was measured. Fish in the highest Cu solution, 16.8 μg l-1, had significantly reduced pre-stimulus swimming speed; however, the post-stimulus swimming speed was not significantly different from control fish. Fish exposed to lower concentrations of 10.2, 4.7, 1.9 and 0.3 μg Cu l-1 showed no reduction in swimming speed (or response to an alarm).
Following the swimming tests, Sandahl et al. measured the electrical response from the Cu-exposed coho salmon olfactory epithelium. Fish were anesthetized, then the olfactory chambers were exposed to three different odorant solutions. The odorant stimulus-response was measured from the electrical peak relative to the pre-stimulus baseline. (Note: the authors do not present a thorough description of this method.)
Sandahl et al. found that the odor-evoked field potential recordings from the olfactory epithelium of coho salmon increased with greater concentrations of odorant. However, exposure to 2 μg Cu l-1 for 3 h reduced the responses to all skin extract concentrations. Sandahl et al. exposed individual fish to Cu, monitored behavioral responses to the skin extract, and then recorded odor-evoked electrical stimulus from the olfactory epithelium. Their objective was to determine the relative effects of short-term Cu exposures (3 h exposure at 2 to 20 μg Cu l-1) on olfactory sensitivity and predator avoidance. Sandahl et al. found that exposure to the lowest Cu concentration, 2 μg Cu l-1, significantly reduced olfactory responses and exposure to 20 μg Cu l-1 essentially abolished responses.
Significance of Research
Sandahl et al. demonstrated a significant reduction in swimming speed and response to a predator stimulus for coho salmon exposed to 16.8 μg Cu l-1 in water with hardness of 120 mg l-1. The AWQ hardness-adjusted chronic criterion is 10.5 μg Cu l-1, considerably lower than the reported response concentration.

59
Sandahl et al. documented a reduction in the alarm response of the olfactory epithelium of coho salmon after exposure to approximately 2 μg Cu l-1 (1.9 + 0.4 μg Cu l-1) in laboratory water with low DOC. The fish were surgically altered before testing; this additional stress may have influenced the fish behavior. The LOEC of 2 μg Cu l-1
reported by Sandahl et al. is substantially lower than the AWQ hardness-adjusted chronic criterion of 10.5 μg Cu l-1.
Scherer E. and McNicol RE. 1998. Preference-avoidance responses of lake whitefish (Coregonus cluepeaformis) to competing gradients of light and copper, lead, and zinc. Water Res. 32(3): 924-929.
Keywords: lake whitefish, avoidance
Scherer and McNicol designed preference-avoidance tests that incorporated naturally occurring conditions of light and shade. Their goal was to determine the extent to which a “competing gradient” of light might affect responses to metals. Three metals were tested: Cu, Pb and Zn. This discussion focuses on the Cu tests.
Fourteen-month-old test fish were placed into a trough with different concentrations of Cu. The unshaded portion of the test trough contained Cu concentrations of 0, 1, 10, 20 and 40 μg l-1 and the shaded portion of the trough contained Cu concentrations of 0, 1, 10, 20, 36, 40 and 72 μg l-1. The Cu concentration was increased from 0 to the highest amount every 10 minutes, so each test fish was exposed to the entire range of concentrations. The test water had pH 7.5 to 7.8, hardness of 90 mg CaCO3 l-1, DOC of approximately 5 mg l-1.
Fish were first tested in light with no shade provided. The infusion of metal ions into one half of the tank elicited avoidance reactions, with avoidance evident at the lowest concentration of 1 μg Cu l-1. The addition of shade to part of the trough resulted in a significant preference for the shaded side. When metals were injected to the shaded portion of the trough, the previously observed avoidance to metals was suppressed. Avoidance of Cu did not occur, even at 40 μg l-1. Increasing the concentration to 72 μg l-
1 resulted in strong avoidance.
Significance of Research
Interpretation of research on fish avoidance of metals should consider factors of natural conditions. When whitefish were exposed to low Cu concentrations, but no shade, they demonstrated strong avoidance. However, when shade was provided, whitefish showed a strong preference for shade that suppressed their avoidance of Cu. The research of Scherer and McNicol would be more conclusive if they had conducted tests with the troughs entirely shaded, then introduced a metals gradient.

60
Sloman KA, Baker DW, Ho CG, McDonald DG, and Wood CM. 2003. The effects of trace metal exposure on agonistic encounters in juvenile rainbow trout, Oncorhynchus mykiss. Aquat. Toxicol. 63: 187-/196.
Keywords: rainbow trout, social behavior
Sloman et al. investigated effects of five different trace metals, Cu, cadmium, nickel, zinc and lead on the ability of juvenile rainbow trout to form social relationships. The test concentration of Cu (as CuSO4) was 15 μg l-1, hardness (as CaCO3), pH and DOC were held constant (hardness at /120 mg l-1, pH 8; DOC at /3 mg l-1). The researchers observed changes in the number of aggressive attacks during pair-wise encounters after fish were exposed to a specific metal. Aggressive attacks are important in establishing hierarchies, especially in stream-dwelling fish and where resources and habitat may be limited.
Sloman et al. reported that only cadmium had a significant effect on aggressive encounters at sublethal concentrations: in the first experiment, trout exposed to sublethal concentrations of cadmium for 24 h displayed significantly lower numbers of aggressive attacks during pair-wise agonistic encounters than fish paired in the Cu, nickel, zinc, lead and control water. In a second experiment, fish were exposed to the same concentration of metal for 24 h and returned to normal water for 24 h. When these metal pre-exposed fish were paired with non-exposed fish, only cadmium pre-exposure had a significant effect on social interaction. All of the cadmium pre-exposed fish became subordinate when paired with non-exposed fish, whereas the probability of a fish pre-exposed to Cu, nickel, zinc or lead becoming subordinate was not significantly different from chance. Therefore, the researchers found no changes in agonistic behaviors after exposure to 15 μg Cu l-1.
Significance of Research
Although Sloman et al. did not find changes in agonistic behavior after exposure to 15 μg Cu l-1, they did not test effects of higher concentrations. Therefore, the findings are limited to Cu concentrations at or below the test concentration. However, the test concentration of 15 μg Cu l-1 is only slightly lower than the AWQ acute criterion of 16.6 μg l-1 (for hardness = 120 mg l-1) and the chronic criterion of 10.9 μg l-1. Therefore, the results of their study show no increase in agonistic behaviors at a test concentration that is slightly below the AWQ acute and slightly above the AWQ chronic criteria.

61
Aquatic Invertebrates
Freshwater mussels
Toxicity studies have been conducted on freshwater mussels because approximately 70% of North American species are considered to be endangered, threatened, or of special concern. Contamination is considered one of the causal or contributing factors to the declines of freshwater mussel populations. Freshwater mussels occur in Alaska and, therefore, are an appropriate species to consider in toxicity evaluations.
Most freshwater mussels have a complex reproductive cycle involving a parasitic stage on fish. Sperm released by a male enters a female through the incurrent siphon, and fertilized eggs develop to larvae called glochidia that mature in specialized chambers of the female’s gills. Glochidia are released into the water and must attach to the gills or fins of a suitable host fish. After one to several weeks of the parasitic stage, glochidia transform to juvenile mussels, detach from the fish, and drop to the stream or lake bottom to begin the free-living juvenile stage.
62
Cope WG, Bringolf RB, Buchwalter DB, Newton TJ, Ingersoll CG, Wang N, Augspurger T, Dwyer FJ, Barnhart MC, Neves RJ AND Hammer E. 2008. Differential exposure, duration, and sensitivity of unionoidean bivalve life stages to environmental contaminants. J. N. Am. Benthol. Soc: 27(2): 451–462
Keywords: freshwater mussel, life stage
Cope et al. reviewed results of toxicity tests on different life stages of the freshwater mussels (Superfamily Unionoidea). They considered the relationships of laboratory data to actual contaminant exposure routes, life stages, and the type of habitats occupied by different life stages. They evaluated the pathways of exposure to environmental pollutants for all 4 mussel life stages: adult, glochidia (brooded and free), glochidia (encysted) and juvenile (up to 2 – 4 y old). Water quality, sediment quality, health of host fish, and diet (of life stages that feed) all have the potential to influence survival of each of these life stages and subsequent reproduction and recruitment.
For example, the toxicity of Cu (as CuSO4) (LC50 at a hardness of 185 mg/L CaCO3) to 2 species of adult mussels in 28-d flow-through tests ranged from 4.5 to 69 μg l-1 and were similar to acute tests with 9 species of glochidia (24-h LC50 = 39 μg l-1, range: 10–100 μg l-1) and 7 species of juveniles (96-h static-renewal tests, mean = 30 μg l-1, range: 6.8–60 μg l-1). The relative sensitivity of glochidia to contaminants varies with species and chemical but is similar to that of newly transformed juveniles. The 24-h median effective concentrations (EC50s) for glochidia (9 species) and 96-h EC50s for newly transformed juveniles (6 species) were similar for Cu (glochidia: 39 μg l-1, juveniles: 22 μg l-1).. These results demonstrate the predictive value of tests on glochidia for estimating the toxicity of chemicals to juveniles.
Cope et al. reported the Cu 24-h EC50 for glochidia from females held in the laboratory (21.9 μg l-1; 95% CI: 14.1–33.8) did not differ from the Cu 24-h EC50 for glochidia from freshly collected females (27.5 μg l-1; 95% CI: 19.5–38.8). They compared the results of Wang et al. (2007c, see review below) and determined that the range of EC50 was similar to the range of Cu 24-h EC50 values L. siliquoidea glochidia (33.0 μg l-1; 95% CI: 32.0–35.0). Thus, results of both toxicity tests suggest that sensitivity did not differ between the 2 groups of glochidia.
Significance of Research
Cope et al. reported similar sensitivities among different life stages and different species of freshwater mussels. Sensitivities did not vary between mussels raised in the laboratory and wild-caught, between glochidia and newly transformed juveniles, or with size of the juvenile. The authors concluded that the glochidia life stage is an appropriate test organism.
63
March FA, Dwyer FJ, Augspurger T, Ingersoll CG, Wang N and Megand CA. 2007. An evaluation of freshwater mussel toxicity data in the derivation of water quality guidance and standards for copper. Environ. Toxicol. Chem. 26(10): 2066-2074.
Keywords: freshwater mussel, hardness, water quality standards
March et al. reviewed journal articles, interim and final reports, and dissertations and theses that included Cu toxicity information for native North American Unionid species. Their goal was to develop the freshwater mussel Cu acute and chronic toxicity database. The database was edited to ensure that all data met the quality assurance guidelines of the American Society of Testing and Materials (ASTM). To determine the protection provided by the hardness-based 1996 USEPA chronic WQC, March et al. evaluated all freshwater mussel toxicity data that used longer-term exposures. Chronic values as the geometric mean of the no observed effect concentration and the lowest observed effect concentration were calculated using both lethal and sublethal (growth) endpoints.
The authors found a limited number of chronic tests in the literature; therefore, they used the acute to chronic ratio approach to develop chronic exposure values. The final database included toxicity data for 20 species from 14 genera from 101 observations.
Using the refined database, March et al. calculated species mean acute values (Table 16). All values for species mean acute values (SMAV) and genus mean acute values (GMAV) were normalized to 50 mg l-1 hardness.
When compared with USEPA data, March et al. reported that the GMAVs for freshwater mussels accounted for 10 of the lowest GMAVs. All freshwater mussel GMAVs were in the lower half of the GMAV data from USEPA. The lowest freshwater mussel GMAV was for Venustaconcha, with a GMAV = 3.04 μg l-1, which was equal to about 1/3 of the GMAV of the lowest non-mussel (Cladoceran, GMAV = 9.92 μg l-1. The three lowest freshwater mussel GMAVs also were lower than the CMC (acute level) of 7.3 μg l-1 at a hardness of 50 mg l-1.
Significance of Research
Data for native freshwater mussels are rarely included in the derivation of WQC or WQS. The 2007 USEPA update of the ambient WQC for Cu did include select freshwater mussels. The data presented by March et al. suggest that the acute and chronic Cu limits may not adequately protect freshwater mussel species and that a site-specific criterion may be warranted in areas where freshwater mussels are present.

64
Table 16. Freshwater unionid mussel species and associated species mean acute values (SMAV) and genus mean acute values (GMAV, when n>1) for Cu.
Scientific Name Common Name SMAV μg l-1
GMAV μg l-1
Actinonaias ligamentina mucket 15.8
Actinonaias pectorosa Pheantshell 34.9 23.4
Alasmidonta heterodon dwarf wedgemussel 26.1 26.1
Epioblasma capsaeformis oyster mussel 3.27 3.27
Lampsilis abrupta pink mucket 10.8
Lampsilis cardium Plain pocketbook 66.3
Lampsilis fasciola wavy-rayed lampmussel 9.14
Lampsilis rafinesqueana neosho muket 10.4
Lampsilis siliquoidea fatmucket 10.2 14.7
Lasmigona subviridis Green floater 41.6 41.6
Leptodea fragilis Fragile papershell 28.4
Leptodea leptodon scaleshell 6.69 13.8
Ligumia subrostrata Pond mussel 47.4 47.4
Medionidus conradicus Cumberland moccasin shell 15.6 15.6
Megalonaias nervosa Washboard 56.8 56.8
Potamilus ohiensis pink papershell 4.25 4.25
Pyganodon grandis Giant floater 44.4 44.4
Utterbackia imbecillis Paper pondshell 22.5 22.5
Venustaconcha ellipsiformis Ellipse 3.04 3.04
Villosa iris rainbow mussel 16.8 16.8

65
Wang N, Augspurger T, Barnhart MC, Bidwell JR, Cope WG, Dwyer FJ, Geis S, Greer IE, Ingersoll CG, Kane CM, May TW, Neves RJ, Newton TJ, Roberts AD and Whites DW. 2007a. Contaminant sensitivity of freshwater mussels: intra- and interlaboratory variability in acute toxicity tests with glochidia and juveniles of freshwater mussels (Unionidae). Environ. Toxicol. Chem. 26, No. 10, pp. 2029–2035
Keywords: freshwater mussel, acute toxicity, life stage
The objective of the study by Wang et al. was to develop standardized guidance for conducting toxicity tests with freshwater mussels. They tested two species: Actinonaias ligamentina and Lampsilis siliquoidea, at test concentrations of Cu (as CuSO4) of 0, 6.25, 12.5, 25, 50 and 100 μg l-1. Water hardness ranged from 160 to 180 mg l-1. Survival was determined at 24 h and 48 h. Toxicity tests were conducted in five different laboratories with multiple replicates in one lab. Inter-laboratory and intra-laboratory results were compared. The inter-laboratory confidence value for Cu EC50s for glochidia was 13% in the 24-h exposures and 24% in the 48-h exposures. The inter-laboratory confidence value for juveniles was 22% in the 48-h exposures and 42% in the 96-hr exposures. The overall low variability in test results supports the validity of their results.
By using the same source of dilution water, laboratory supplies and test organisms at all laboratories, Wang et al. were able to reduce inter-laboratory variability.
Significance of Research
By using the same source of dilution water, laboratory supplies and test organisms at all laboratories, Wang et al. were able to reduce inter-laboratory variability. The authors conducted standardized acute toxicity tests with glochidia and juvenile mussels following standard procedures developed by ASTM (2006). Test results were comparable within a single laboratory over a two year period and among five different laboratories. Wang et al. concluded that the procedures followed in their study could be used to consistently generate toxicity data with acceptable precision and accuracy.
Wang et al. reported eleven 24-h EC50 values, ranging from 29 to 66 μg Cu l-1, all of these values are higher than the hardness-adjusted AWQ hardness adjusted chronic criterion of 14 to 15 μg l-1 (at hardness from 160 to 180 mg l-1) and the AWQ hardness adjusted acute criterion of 21.4 to 24 μg Cu l-1.
The authors also report twenty-one 48-h EC50 values, ranging from 15 to 25 μg Cu l-1. Twenty of the twenty-one values are higher than the hardness-adjusted AWQ hardness adjusted chronic criterion of 14 to 15 μg l-1 (at hardness from 160 to 180 mg l-1) ; however, seven of the reported 48-h EC50 values are below the AWQ hardness adjusted acute criterion of 21.4 to 24 μg Cu l-1. The test results of Wang et al. are summarized on Table 17.

66
Table 17. 24-h and 48-h EC50 concentrations for two species of freshwater mussel: Actinonaias
ligamentina and Lampsilis siliquoidea glochidia and the 48-h and 96-h EC50 values for L. siliquoidea juveniles exposed to Cu concentrations from 0 to 100 μg l-1. Hardness of test water was maintained at 160 to 180 mg L–1 and pH at 8.2 to 8.7.
Effect Concentration, ug/l
Species Age Endpoint
59 A. ligamentina glochidia 24 h EC50 66 A. ligamentina glochidia 24 h EC50 53 A. ligamentina glochidia 24 h EC50 35 A. ligamentina glochidia 24 h EC50 23 A. ligamentina glochidia 48 h EC50 32 A. ligamentina glochidia 48 h EC50 31 A. ligamentina glochidia 48 h EC50 20 A. ligamentina glochidia 48 h EC50 36 L. siliquoidea glochidia 24 h EC50 42 L. siliquoidea glochidia 24 h EC50 29 L. siliquoidea glochidia 24 h EC50 31 L. siliquoidea glochidia 24 h EC50 38 L. siliquoidea glochidia 24 h EC50 41 L. siliquoidea glochidia 24 h EC50 33 L. siliquoidea glochidia 24 h EC50 23 L. siliquoidea glochidia 48 h EC50 28 L. siliquoidea glochidia 48 h EC50 15 L. siliquoidea glochidia 48 h EC50 20 L. siliquoidea glochidia 48 h EC50 31 L. siliquoidea glochidia 48 h EC50 23 L. siliquoidea glochidia 48 h EC50
Effect Concentration, ug/l
Species Age Endpoint
17 L. siliquoidea glochidia 48 h EC50 29 L. siliquoidea juvenile 48 h EC50 35 L. siliquoidea juvenile 48 h EC50 45 L. siliquoidea juvenile 48 h EC50 52 L. siliquoidea juvenile 48 h EC50 34 L. siliquoidea juvenile 48 h EC50 18 L. siliquoidea juvenile 96 h EC50 20 L. siliquoidea juvenile 96 h EC50 25 L. siliquoidea juvenile 96 h EC50 23 L. siliquoidea juvenile 96 h EC50 21 L. siliquoidea juvenile 96 h EC50

67
Wang N, Ingersoll CG, Hardesty DK, Ivey CD, Kunz JL, May TW, Dwyer FJ, Roberts AD, Augspurger T, Kane CM, Neves RJ, and Barnhart MC. 2007b. Acute toxicity of copper, ammonia, and chlorine to glochidia and juveniles of freshwater mussels (Unionidae). Environ. Toxicol. Chem. 26 (10): 2036–2047.
Keywords: freshwater mussel, Daphnia magna, Ceriodaphnia dubia, Hyalela azteca, rainbow trout, fathead minnow, acute toxicity, life stage
Wang et al. tested the acute toxicity of Cu (as CuSO4), ammonia and chlorine to larval (glochidia) and juvenile freshwater mussels. Tests on glochidia were 24-h and 48-h exposures and tests on juveniles were 96-h exposures. They tested 11 mussel species, plus Daphnia magna, Ceriodaphnia dubia, and Hyalella azteca for 48-h exposures and Oncorhynchus mykiss and Pimephales promelas for 96-h exposures. Hardness of the test solutions ranged from 169 to 187 mg l-1 and pH was 8.3 to 8.5. Data on the three crustacean species and two fish species are limited to mean EC50 values from multiple tests and are used for comparison to mussel data and to document the appropriateness of water quality criteria for mussels.
Note: Wang et al. report all toxicities resulting in death as acute toxicity, even though some of their tests were conducted over a 10-d period with effects recorded at 2, 4 and 10 days. The State of Alaska Aquatic Life Criteria for Fresh Waters (ADEC 2006) defines acute as
(1) "acute" means of, relating to, or resulting from a level of toxicity of a substance, a substance combination, or an effluent sufficient to produce observable lethal or sublethal effects in aquatic organisms exposed for short periods of time, typically 96 hours or less.
Wang et al. reported that glochidia were less sensitive to Cu and younger juveniles were slightly more sensitive to Cu than older juveniles (Appendix IV). However, certain species of glochidia, such as the ellipse mussel, were highly sensitive (EC50 = 8.6 μg l-1 at hardness approximately equal to 177 mg l-1. Comparisons with crustacean and fish species indicated that the USEPA 1996 acute WQC for Cu does not include mussel toxicity data and may not adequately protect early life stages of freshwater mussels from acute exposures.
Older juveniles avoided exposure to Cu in the acute 96-h tests with relatively high concentrations by temporarily closing their valves. The EC50 values for older juveniles at 4-d exposures ranged from 24 to 60 μg Cu l-1.

68
Significance of Research
Sensitivity to Cu varied with test duration, life stage, and species. Comparisons of Wang et al.’s results are summarized on Table 18, data from their report is contained in Appendix IV.
Wang et al. found a number of test conditions in which the EC50 was lower than the AWQ criteria, suggesting that the chronic and acute standards might not be sufficiently protective. For example, 13 of the 19 48-hr tests with glochidia demonstrated acute Cu toxicity at concentrations lower than the AWQ standard.
The Cu toxicity tests do not account for Cu bioavailability; Wang et al. discuss the need for additional studies to determine how dissolved organic carbon and other water quality factors influence both acute and chronic toxicity of Cu to freshwater mussels. The results of Wang et al. suggest that freshwater mussels may be particularly sensitive to Cu; however, their results should be interpreted as an indicator of sensitivity because effects in natural water with a variety of ions and ligands may be substantially different from effects in reconstituted laboratory water.
Table 18. Summary of test results of freshwater mussel glochidia, new juveniles and 2-month old juveniles exposed to Cu. Results are compared with AWQ hardness adjusted acute criteria, where EC50 values are less than the AWQ acute or chronic criterion, it is possible that the standard is not sufficiently protective.
Test Duration EC50 range μg Cu l-1
Number of tests
Tests with EC50 < AWQ acute Cu criterion
Tests with EC50 < AWQ chronic Cu criterion
Glochidia
6-hr 18 to >100 21 3 0 24-hr 10 to >100 19 4 3 48-hr 6.5 to 86 19 13 5
New Juveniles
2-day 10 to 73 13 2 1 4-day 4.8 to 15 9 9 0 10-day 6.8 to 43 13 10 9 2-m juveniles 2-day 20 to 100 5 2 0 4-day 24 to 60 4 1 0 10-day 8.6 to 32 5 3 3

69
Wang N, Ingersoll CG, Greer IE, Hardesty DK, Ivey CD, Kunz JL, Brumbaugh WG, Dwyer FJ, Roberts AD, Augspurger T, Kane CM, Neves RJ, and Barnhart MC. 2007c. Contaminant Sensitivity of Freshwater Mussels: Chronic toxicity of copper and ammonia to juvenile freshwater mussels (Unionidae). Environ. Toxicol. Chem. 26 (10): 2048–2056.
Keywords: freshwater mussel, chronic toxicity, growth
The emphasis of the research reported by Wang et al. (2007a) was on developing methods for conducting chronic toxicity tests with juvenile mussels under flow-through conditions. Using the methods they developed, they tested fatmucket (Lampsillis siliquoidea), oyster mussel (Epioblasma capsaeformis) and rainbow mussel (Villosa iris) for toxicity to Cu and ammonia. Tests were conducted in both static and flow-through systems, survival and growth were determined over a 28-d period. Hardness of the test water ranged from 160 to 180 mg l-1 and pH from 8.2 to 8.7; the test concentrations (amount added) of Cu (as CuSO4) were 0, 3.125, 6.25, 12.5, 25 and 50 μg l-1.
Wang et al. found that all chronic effect concentrations of Cu for survival and growth were below the USEPA and AWQ hardness-dependent chronic criteria for Cu. Their results (Appendix V) indicate that the early life-stages of freshwater mussels are chronically sensitive to Cu and that the chronic criterion may not be adequately protective.
Significance of Research
Wang et al. early life stages of freshwater mussels and documented their sensitivity to Cu. Their test results showed three IC10 and three IC25 values for growth and three IC10 and three IC25 values for survival. All of the 12 values were lower than the hardness-adjusted AWQ chronic criterion for Cu.
70
Aquatic Arthropods
Beltman DJ, Clements WH, Lipton J and Cacela D. 1999. Benthic invertebrate metals exposure, accumulation and community-level effects downstream from a hard-rock mine site. Environ. Toxicol. Chem.18:299-307.
Keywords: aufwuchs, Aquatic insects, population effects
Beltman et al. evaluated the relationships among metal concentrations in surface water, sediment and aufwuchs (periphyton and abiotic material embedded in the periphyton), and invertebrates and invertebrate community structure in a mine-affected stream. Their study took place in east-central Idaho at the site of an inactive Co and Cu mine.
The researchers found that density, percent composition of Ephemeroptera, Plecoptera, Trichoptera and Coleoptera were significantly reduced downstream from the mine, as compared with upstream populations. Conversely, the density of Chironomidae was similar in mine-affected and upstream sites. Concentrations of Cu and Co in surface water were significantly higher than at upstream sites. Cu concentrations at the most affected sites were about 15 μg l-1 and the site above the mine input contained about 3 μg Cu l-1. (The data for Cu concentrations in water, invertebrates, sediment and aufwuchs is presented graphically; actual values are not given in the report.)
Beltman et al. observed a significant change in community structure between mine-affected and control sites; however, they did not observe a change in invertebrate density. They conclude that total number of individuals is not a sensitive indicator of metals effects on invertebrate communities. The researchers found a significant correlation of metal concentration in aufwuchs and fine-grained sediments and concluded that aufwuchs may serve as a primary Cu exposure route for many invertebrates in their study area.
Significance of Research
Cu concentrations of approximately15 μg l-1 in a natural system resulted in significant changes in invertebrate community structure, with a decline in Ephemeroptera, Plecoptera, Trichoptera and Coleoptera over unaffected sites. Cu in both water and aufwuch were significantly correlated with Cu concentrations in invertebrates; concentrations in aufwuchs were most strongly related to concentrations in grazing insects, such as Trichoptera species. Water quality characteristics, including hardness, pH, concentration of DOC and alkalinity were not given.

71
Bossuyt BTA, Muyssen BTA and Janssen CR. 2005. Relevance of generic and site-specific species sensitivity distributions in the current risk assessment procedures for copper and zinc. Environ. Toxicol. Chem. 24: 470-478.
Keywords: Cladocera, acute toxicity
Bossuyt et al. collected Cladoceran species from 5 different sites, then conducted toxicity tests for Cu and Zn. For each species, 5 replicates of 5 organisms were exposed to at least 5 different metal concentrations and a control. Experiments were performed in standard International Organization for Standardization (ISO) medium with a pH of 7.8 and hardness of 250 mg l-1. After 48-h exposure, the number of immobilized organisms in each test container was counted and the 50% effective concentration with its 95% confidence limits was calculated. Reported 48-h EC50s are based on measured Cu concentrations. Cu was measured as dissolved.
Bossuyt et al. reported the acute Cu toxicity ranged from 5.3 μg l-1 for Scapholeberis mucronata to 70.6 μg l-1 for Disparolona rostrata. Differences between the most-sensitive and least-sensitive cladoceran species were a factor of 10 (Table 19).
Bossuyt et al. observed that in aquatic toxicity testing, the most frequently used standard invertebrate species are D. magna, D. pulex and C. dubia. There are substantial differences in sensitivity to Cu among these three species; D. magna is one of the least-sensitive cladoceran species and C dubia one of the most sensitive species. The results of Bossuyt et al. demonstrate that, although their test media may have been environmentally unrealistic, different cladocerans have a fairly wide range of sensitivities to Cu. It is important to note that the concentrations of DOC in their test waters were low and quite probably lower than in most natural waters.
Significance of Research
Bossuyt et al. tested a wide variety of naturally collected cladoceran species and tested their sensitivity to Cu. Test water contained relatively high hardness and low DOC, compared to many natural systems. 48-h EC50 values ranged from 5.3 μg l-1 for Scapholeberis mucronata to 70.6 μg l-1 for Disparolona rostrata. Bossuyt et al. present a total of 36 test results for Cu toxicity to cladoceran species. Of the thirty six results, 29 are higher than the AWQ hardness-adjusted acute criteria of 33.2 μg Cu l-1 and 24 are higher than the AWQ hardness-adjusted chronic criteria of 20.4 μg Cu l-1 (hardness = 250 mg l-1).
Cladocera may not be adequately protected by the current AWQ acute and chronic criteria in water of low DOC. The research of Bossuyt et al. also demonstrates the wide range of effects concentrations for cladocerans.

72
Table 19. The mean EC50 of field-collected cladoceran species. Hardness = 250 mg l-1.
48-h EC50 μg Cu l-1 Species
DOC mg l-1
13.3 Ceriodaphnia reticulata 37.7 17.7 Ceriodaphnia reticulata 27.5 9.89 Daphnia longispina 37.7 11.9 Daphnia longispina 27.5 70.6 Disparalona rostrata 27.5 51.6 Pleuroxus truncatus 27.5 5.3 Scapholeberis mucronata 37.7 16.6 Simocephalus exspinosus 37.7 20.4 Simocephalus exspinosus 27.5 28.2 Alona quadrangularis 9.8 20.2 Chydorus sphaericus 9.8 22.6 Daphnia galeata 9.8 30 Daphnia magna 9.8 18.4 Simocephalus vetulus 9.8 22.7 Aona sp. 8.2 12 Ceriodaphnia pulchella 10.4 10 D. lngispina 8.2 53.2 D. magna 8.2 40.6 D. magna 10.4 20.7 S. exspinosus 8.2 19.1 S. exspinosus 10.4 14.4 Acroperus harpae 2.3 38 C. sphaericus 2.3 14.1 C. sphaericus 1.6 11.3 Daphnia longispina 1.6 16.1 S. ventulus 2.3

73
Table 19, continued. 48-h EC50 μg Cu L-1 Species
DOC mg l-1
18.8 S. ventulus 1.6 11.9 Acantoleberis curvirostris 3.7 15.2 Acroperus elongatus 4 17.1 Acroperus elongatus 3.7 9.2 Bosmina longirostris 3.7 16.4 C. pulchella 3.7 33.4 Chydorus ovalis 3.7 43.3 Daphnia rostrata 3.7 11.2 Scapholeberis microcephala 4 20.3 Scapholeberis microcephala 3.7
74
Clements WH, Cherry DS and Cairns J Jr. 1988. Structural alterations in aquatic insect communities exposed to copper in laboratory streams. Environ. Toxicol. Chem. 7: 715-722.
Keywords: aquatic insects, community sensitivity
Clements et al. examined effects of three Cu (as CuSO4) treatments: none added, low dose (15-32 μg l-1) and high dose (135 – 178 μg l-1) on aquatic insect communities in laboratory streams. Hardness ranged from 64 to 77 mg l-1, pH from 7.3 to 8.4. The goal of this research was to examine the effects of Cu on abundance, number of taxa and species composition of aquatic insect communities established on artificial substrates. Experiments were replicated over 3 seasons. In the low dose streams, invertebrates were dosed with 32 μg l-1 in winter, 17 μg l-1 in spring and 15 μg l-1 in summer. In the high dose streams, invertebrates were dosed with 178 μg l-1 in winter, 168 μg l-1 in spring and 135 μg l-1 in summer.
Clements et al. reported that exposure of aquatic insect communities to Cu significantly reduced both the number of taxa and number of individuals in all three seasons. The greatest percent reduction in number of taxa and number of individuals occurred during summer. Species diversity was a less sensitive metric and did not differ significantly among treatments in winter experiments and significantly reduced in spring only in high dose treatments.
Baetis sp. (Ephemeroptera), the dominant mayfly, was reduced by 85 to 98% in low dose streams during each season and was completely eliminated in high dose streams in spring and summer. Other mayfly genera were less sensitive to Cu.
Of the stoneflies (Plecoptera), the researchers found that Allocapnia sp. and Acroneuria sp. were relatively insensitive to Cu. Perlesta sp., which were most common in spring, were reduced by 50% in low dose streams and completely eliminated in high dose streams.
After 96 h in low dose streams (15 to 32 μg l-1), the number of taxa per tray was reduced by 24 to 36% and the number of individuals was reduced by 35 to 52% compared to controls.
Significance of Research
Clements et al. demonstrated that simple community level measures, such as number of taxa and number of individuals, are highly sensitive to Cu exposure. The low dose (15 to 32 μg l-1) with hardness of 64 to 77 mg l-1 is higher than the AWQ acute limit of 9 to 11μg l-1 and the chronic limit of 6.4 to 7.5 μg l-1.

75
Clements WH, Cherry DS and Van Hassel JH. 1992. Assessment of the impact of heavy metals on benthic communities at the Clinch River (Virginia): Evaluation of an index of community sensitivity. Can. J. Fish. Aquat. Sci. 49: 1686-1664.
Keywords: Cu, Zn, aquatic insects, community sensitivity
The research of Clements et al. focuses on annual variation in aquatic invertebrate communities in response to Cu and Zn. They discuss the limitations of previous studies of heavy metal effects to benthic invertebrates and the possibility that results of some of these studies were confounded by natural variability, either because of changes from year to year or to changes along a longitudinal gradient.
Clements et al. sampled benthic invertebrate communities at 6 to 8 stations between 1986 and 1989 at the Clinch River, a southwest Virginia stream receiving Cu and Zn from the Clinch River coal-fired power plant (CRP). Invertebrates were collected in substrate-filled trays. Samples were collected one time each year during summer low flow. Water samples for temperature, pH, conductivity, dissolved oxygen, hardness, alkalinity, Cu and Zn were collected weekly.
Over the 4 years of sampling, Clements et al. noted a 75% reduction in effluent concentrations of Zn, because of improvements in the CRP. Effluent concentrations of Cu also were reduced by approximately 30%, but instream concentrations remained elevated, possibly because of reduced stream discharge.
Clements et al. reported that benthic community composition was highly sensitive to Cu and Zn and varied among sample locations and years. Reference stations each year usually were dominated by several species of mayflies (Baetis brunneicolor, Isonychia bicolor, Stenonema modestum, Tricorythodes sp. and Caenis sp.) and Tanytarsini chironomids. Concentrations of Cu and Zn at the reference sites usually were below detection.
Stream locations most effected by Cu and Zn were dominated by Orthocladini chironomids (up to 82% of total insects collected) and net-spinning caddisflies (Hydropsyche bifida and Cheumatopsyche sp.). Numbers of Ephemeroptera were substantially reduced in the metal-affected sites, where they comprised less than 5% of the total number of individuals. Concentrations of Cu and Zn at the metals affected sites usually were ranged from 52 to 104.8 μg Cu l-1 and from 16.8 to 81.2 μg Zn l-1.
Significance of Research
Clements et al. found that benthic invertebrate communities are highly sensitive to Cu and Zn, especially Ephemeroptera. Trichoptera and some Chironomidae (as an order) appear fairly tolerant; specific Chironimidae families, such as Tanytarsinidae, are sensitive to metals. Because they sampled at the same time each year, they eliminated factors of seasonal variability that could have masked any effects from metals.

76
Concentrations of Zn and Cu in the sites downstream of the coal fired plant effluent are higher than the AWQ acute criteria of 21.2 μg Cu l-1, adjusted for hardness of 155 mg l-1. Clements et al. describe an index of community sensitivity that accounts for the relative proportions of each invertebrate group; they state that this index has more significance when comparing metal-affected sites than other metrics, such as numbers of taxa or total numbers of individuals.
De Schamphelaere KAC, Forrex I, Kierckens K, Sorgeloos P. and Janssen CR. 2007. Chronic toxicity of dietary copper to Daphnia magna. Aquat. Toxicol. 81: 409-418.
Keywords: dietary source, Daphnia magna, algae
De Schamphelaere et al. cite the evidence that diet borne metal toxicity might have an important effect on aquatic communities. They exposed algae (Pseudokirchneriella subcapitata) to 500 μg l-1 for 3 days, then fed the algae to D. magna. D. magna were fed 60, 90 or 120 μg dry wt algae.
D. magna fed algae exposed to Cu did not exhibit higher mortality than D. magna fed control algae. However, D. magna fed algae exposed to Cu had a significantly higher Cu body burden (325 μg Cu per gram dry wt, compared to 12.1 μg Cu per gram dry wt in controls); a 50% reduction of total reproduction over controls; and a significant 38% reduction of growth over the 21-d period, when compared to controls. The release of the second brood was significantly delayed by 0.7 d over controls and release of the third brood by 1.5 d over controls. Brood sizes of all three broods of Cu exposed D. magna were 32, 35, and 55% smaller than controls (32, 35, and 55% for brood 1, brood 2, and brood 3, respectively).
Significance of Research
De Schamphelaere et al. demonstrated chronic effects of Cu to D. magna from ingesting algal cells that had been exposed to Cu. Their study is important in that it highlights chronic effects from pathways other than direct exposure. However, the Cu concentration of 500 μg Cu l-1 used to expose algal cells is not environmentally realistic.

77
Effects to Plants and Algae
Franklin NM, Stauber JL, Markich SJ and Lim RP. 2000. pH-dependent toxicity of copper and uranium to a tropical freshwater alga (Chlorella sp.). Aquat. Toxicol. 48: 275–289.
Keywords: pH, freshwater algae
Franklin et al. exposed cultures of Chlorella sp. to Cu concentrations ranging from 1.25 to 640 μg l-1 for 72 h. Two series of tests were done, one with pH at 5.7, and a second with pH at 6.5 to determine effects of water pH. The hardness of the test water was low at 2 to 4 mg l-1 to duplicate nearby streams. Concentrations of DOC were not given.
Franklin et al. reported that in waters without added Cu, the growth rate of Chlorella sp. was 1.4 doublings day-1 in pH 5.7 and 1.7 doublings day –1 in pH 6.5. Growth of the algae at each pH decreased with increasing Cu concentrations. At pH 5.7, concentrations of 1.4 μg Cu l-1 caused only minor growth rate inhibition. As Cu concentrations increased to ranges from 2.4 to 19 μg l-1, a gradual decrease in algal growth rate was observed. The 72-h EC50 in water with pH 5.7 was 35 μg l-1, and the 72-h EC50 in water with pH 6.5 was 1.5 μg l-1. Chlorella sp. was more sensitive to Cu at pH 6.5 than at pH 5.7.
Franklin et al. reported that concentrations of extracellular Cu were significantly higher in algal cells cultured in pH 6.5 than in pH 5.7, with approximately 2.5 times more Cu bound to the cell surface at the higher pH. Similarly, intracellular Cu was significantly higher in cells cultured at pH 6.5 than pH 5.7. Sensitivity of Chlorella sp. to Cu was correlated with both intracellular and extracellular Cu. Franklin et al. speculate that an increase in H+ with decreasing pH may decrease the toxicity of Cu by competitively excluding Cu2+ from binding to cell-surface ligands.
Significance of Results
Franklin et al. reported a 72-h EC50 of 35 μg l-1 for the tropical algae, Chlorella sp., cultured in water with pH 5.7. The 72-h EC50 was lower (1.5 μg l-1) for algae cultured in water with pH 6.5. The effect of pH on metal toxicity is twofold: the higher H+ concentration at lower pH may decrease the toxicity of Cu by competing with the Cu ions and preventing them from binding to the cell surface. Lower pH also increases the prevalence of Cu2+ , and decreases the proportion of other, less toxic, forms of Cu (Sciera et al. 2004, Hyne et al. 2005).
The AWQ acute criteria for hardness of 2 to 4 mg l-1 is 0.4 to 0.7 μg l-1 and the chronic criteria is 0.3 to 0.6 μg l-1.

78
Franklin NM, Stauber JL, Apte SC, and Lim RP. 2002. Effect of initial cell density on the bioavailability and toxicity of copper in microalgal bioassays. Environ. Toxicol. Chem. 21(4): 742–751.
Keywords:freshwater algae, ligands
Franklin et al. discuss previous algal bioassays in which the initial algal cell density is high. They present evidence that Cu toxicity decreases as the concentration of cells in suspension is increased. High cell density can lead to Cu binding, algal metabolism at high cell densities can cause pH increases from CO2 depletion, subsequently altering the form and availability of Cu. Dead cells and byproducts of cell metabolism may change Cu speciation through formation of biotic ligands or non-toxic Cu complexes.
The goal of the research by Franklin et al. was to determine toxicity of Cu to two freshwater chlorophytes, Selenastrum capricornutum and Chlorella sp. over a range of cell densities, from 102 to 105 cells ml-1.
Algal cells were exposed to solutions of CuSO4 at concentrations ranging from 1.25 to 15 μg Cu l-1 for bioassays at 102 cells ml-1, from 1.25 to 20 μg Cu l-1 for bioassays at 103 cells ml-1, and from 2.5 to 30 μg Cu l-1 for bioassays at 104 and 105 cells ml-1. For S. capricornutum tests, alkalinity was 9 mg CaCO3 l-1, hardness was 15 CaCO3 l-1 and pH was 7.5 +0.2. For Chlorella sp., test water had an alkalinity of 54 CaCO3 l-1, hardness of 90 CaCO3 l-1and pH 7.5 +0.2.
Franklin et al. found that Cu toxicity was cell density dependent; Cu was significantly more toxic in solutions of lower initial cell density than solutions with higher cell density (Table 20). Cu had an inhibitory effect on cell division rate of both algal species after a 72-h exposure. For the tropical alga Chlorella sp, as the initial cell density increased, the toxicity of Cu decreased. A significant decrease was observed in the 72-h EC50 value for Cu at initial cell densities of 104 and 105 cells ml-1 compared to those of 102 and 103 cells ml-1. At higher initial cell densities, the NOEC values (4.7 and 9.0 μg Cu l-1 for 104 and 105 cells ml-1) were higher than the 72-h EC50 values at lower initial cell densities (4.4 and 4.6 μg Cu l-1 for 102 and 103 cells ml-1, respectively).
Cu also caused a change in cell size of both species after 72-h exposure. In bioassays of Chlorella sp., at initial cell densities of 103 and 104 cells ml-1, more than 50% of the cells became enlarged at 10 μg Cu l-1, compared to control cells.

79
Table 20. Effect of initial cell density on toxicity of Cu to Chlorella sp and S. capricornutum after 72-h exposure.
Initial Cell density cells ml-1
Growth Rate (doublings per day)
NOEC μg Cu l-1
LOEC μg Cu l-1
Chlorella sp. 102 2.0 + 0.2 1.1 2.0 103 2.1+ 0.1 2.4 3.3 104 1.7+ 0.1 4.7 6.0 105 1.2+ 0.1 9.0 12 S. Capricornutum 102 1.7+ 0.2 1.9 3.8 103 1.6+ 0.1 3.4 4.8 104 1.3+ 0.2 1.8 3.2 105 1.2+ 0.1 4.6 6.6 Franklin et al. demonstrated that Cu toxicity decreased with increases in initial cell density from 102 to 105 cells ml-1. Measurement of extra- and intercellular Cu confirmed that less Cu was bound to the cells, resulting in less Cu uptake and lower toxicity at higher initial cell densities. Decreased Cu toxicity at higher cell densities was due primarily to greater Cu adsorption by algal cells, resulting in depletion of the equilibrium concentration of dissolved Cu in solution. The release of algal exudates into the medium may be partly responsible for reducing Cu bioavailability through complexation of Cu with glycolic acid, polysaccharides and carbohydrates. Experimental evidence indicates that Cu present as the free metal ion or as weak or labile complexes that are able to dissociate at the cell membrane is more bioavailable than Cu in strong or inert complexes. Increased pH in the test solutions containing high cell densities also accounted for decreased Cu toxicity as free Cu2+ becomes less prevalent.
Significance of Research
Franklin et al. demonstrated the toxicity of Cu to two algal species at low densities. The lower density used in their study is more representative of naturally occurring algal populations. Bioassays of Cu toxicity to algae may underestimate toxicity because most essays are conducted with high initial cell densities; the algal cells may form complexes with Cu, decreasing its bioavailability.

80
Briefly Reviewed
Atli G and Canli M. 2003. Natural Occurrence of Metallothionein-Like Proteins in the Liver of Oreochromis niloticus and Effects of Cadmium, Lead, Copper, Zinc, and Iron Exposures on Their Profiles. Bull. Environ. Cont. and Toxicol. 70:619–627
Atli and Canli present results of an interesting, well-documented study on physiological effects of exposure of Cu (as CuSO4) to Nile Tilapia Oreochromis niloticus. The Cu concentration of the test water was more than 70 times higher than the AWQ acute criterion and more than 100 times higher than the AWQ chronic criterion, therefore the study provides no useful information for the current review.
Averyt KB, Kim JP, and Hunter KA. 2004. Effect of pH on measurement of strong copper binding ligands in lakes. Limnol. Oceanogr, 49(1): 20–27.
Averyt et al. investigated the effect of pH on Cu2+ binding by natural organic ligands in two New Zealand lakes. The Cu binding potential of DOM increased with increases in pH of a lake-water. Averyt et al. also documented the role of phytoplankton in controlling the biological availability of Cu. The phytoplankton in the lake water readily formed organic ligands with Cu, reducing the amount of available Cu2+; thereby decreasing Cu toxicity. The effect was seasonal, however, and during periods of low phytoplankton abundance, the concentrations of Cu2+ in the water increased. The Cu-binding ligand concentration exceeded that of total dissolved Cu, at almost all times of the year and all depths. However, in Lake Manapouri, little evidence of Cu-binding ligand was observed during late summer in the mixed layer, which suggests a seasonal cycle in Cu-binding ligands that is perhaps driven by enhanced ultraviolet irradiation in summer or by seasonal changes in phytoplankton community structure. Their work supports the role of phytoplankton in actively controlling the biological availability of Cu.

81
Eisler R. 1998. Copper hazards to fish, wildlife, and invertebrates: a synoptic review. U.S. Geological Survey, Biological Resources Division, Biological Science Report USGS/BRD/BSR--1998-0002.
Eisler conducted an extensive review and discussion of the technical literature on Cu and Cu salts in the environment and their effects on fish, birds, mammals, terrestrial and aquatic invertebrates, and other natural resources. His review includes literature through 1996 and addresses issues of Cu sources and uses; chemical and biochemical properties; concentrations of Cu in field collections of abiotic materials and living organisms; effects of Cu deficiency; lethal and sublethal effects on terrestrial plants and invertebrates, aquatic organisms, birds, and mammals, including effects on survival, growth, reproduction, behavior, metabolism, carcinogenicity, mutagenicity, and teratogenicity. Eisler also provides tables of values for acute and chronic Cu toxicity for a variety of aquatic and terrestrial species with citations.
The review of Eisler provided a background for this paper; however, most of the papers included in the present review were published after Eisler’s review.
Hansen HJM, Olsen AG and Rosenkilde P. 1996. The effect of Cu on gill and esophagus lipid metabolism in the rainbow trout (Oncorhynchus mykiss). Comp. Biochem. Physiol. 113C: 23-29.
Hansen et al. exposed rainbow trout (age not given) to test solutions containing 0, 100, 300 and 800 μg Cu l-1 (form of Cu not given) for 4 or 12 days, then transferred the fish to either fresh or brackish water. After exposure and recovery for 24 h in clean water, the fish were killed and the gill and esophagus tissues examined.
Hansen et al. found that Cu induced an overall depletion of plasma Na+ in fish exposed for 4 d, then transferred to clean water. The plasma Na+ levels returned to normal after 12 days. (Note: it is not clear if these effects occurred at all test concentrations).
The results of the paper are difficult to interpret because the authors do not clearly relate effects with specific concentrations. In addition, the test concentrations are substantially higher than the AWQ acute and chronic criteria. An important finding is that plasma Na+ levels returned to normal after 12 days in clean water.

82
Sloman KA, Lepage O, Rogers JT, Wood CM. and Winberg S. 2005. Socially-mediated differences in brain monoamines in rainbow trout: effects of trace metal contaminants. Aquat. Toxicol. 71: 237–247
Sloman et al. presented results of their study on trace metal contaminants plus an in-depth discussion of effects of Cd and Pb on brain monoamines. They did not include Cu as one of the trace metals.

83
Literature Cited ADEC (Alaska Dept. of Environmental Conservation). 2006. 18 AAC 70. Water Quality
Standards. Amended as of December 28, 2006.
Anderson BS, Hunt JW, Piekarski WJ, Phillips BM, Englund MA, Tjeerdema RS, Goetzl JD. 1995. Influence of Salinity on Copper and Azide Toxicity to Larval Topsmelt Atherinops affinis (A yres) Arch. Environ. Contam. Toxicol. 29: 366-372.
Atchison GJ, Henry MG and Sandheinrich MB. 1987. Effects of metals on fish behavior: a review. Environmental Biology of Fishes 18 (1): 11-25.
Atli, G and Canli M. 2003. Natural Occurrence of Metallothionein-Like Proteins in the Liver of Fish Oreochromis niloticus and Effects of Cadmium, Lead, Copper, Zinc, and Iron Exposures on Their Profiles. Bull. Environ. Contam. Toxicol. (2003) 70:619–627
ASTM. 2006. Standard guide for conducting laboratory toxicity tests with freshwater mussels. E2455-06. In American Society of Testing and Materials, Annual Book of ASTM Standards, Vol. 11.06. Philadelphia, PA.
Averyt KB, Kim JP, and Hunter KA. 2004. Effect of pH on measurement of strong copper binding ligands in lakes. Limnol. Oceanogr., 49(1): 20–27
Baldwin DH, Sandahl JF, Labenia JS, and Scholz NL . 2003. Sublethal effects of copper on coho salmon: impacts on nonoverlapping receptor pathways in the peripheral olfactory nervous system. Environ. Toxicol. Chem. 22:2266–2274
Baldigo BP and Baudanza TP. 2001. Copper avoidance and mortality of juvenile brown Trout (Salmo trutta) in tests with copper-sulfate-treated water from West Branch Reservoir, Putnam County, New York. Water-Resources Investigations Report 99-4237. US Geological Survey, Troy, NY. 25 pp.
Beaumont MW, Butler PJ and Taylor EW. 1995. Exposure of brown trout, Salmo trutta, to sub-lethal copper concentrations in soft acidic water and its effect upon sustained swimming performance. Aquat. Toxicol. 33: 45-63.
Beltman DJ, Clements WH, Lipton J and Cacela D. 1999. Benthic invertebrate metals exposure, accumulation and community-level effects downstream from a hard-rock mine site. Environmental Toxicology and Chem. 18:299-307.
Berntssen MHG, Lundebye AK and Maage A. 1999. Effects of elevated dietary copper concentrations on growth, feed utilisation and nutritional status of Atlantic salmon_Salmo salar L./fry. Aquaculture 174: 167–181.
Bettini S, Ciani F, and Franceschini V. 2006. Recovery of the olfactory receptor neurons in the African Tilapia mariae following exposure to low copper level. Aquat. Toxicol. 76: 321–328
Black JA. and Birge WJ. 1980. An avoidance response bioassay for aquatic pollutants. Univ. Kentucky. Water Resources Res. Inst. Res. Rep. 123: l-34. (cited in Atchison et al. 1987)
Bossuyt BTA, Muyssen BTA and Janssen CR. 2005. Relevance of generic and site-specific species sensitivity distributions in the current risk assessment procedures for copper and zinc. Environ. Toxicol. Chem. 24: 470-478.

84
Brix KV, DeForrest DK and Adams WJ. 2001. Assessing acute and chronic copper risks to freshwater aquatic life using species sensitivity distributions for different taxonomic groups. Environ. Toxicol. Chem. 20: 1846-1856.
Brooks ML, Boese CJ and Meyer JS. 2006. Complexation and time-dependent accumulation of copper by larval fathead minnows (Pimephales promelas): Implications for modeling toxicity. Aquat. Toxicol. 78: 42–49
Buhl KJ and Hamilton SJ. 1990. Comparative toxicity of inorganic contaminants released by placer mining to earlylife stages of salmonids. Ecotox. And Environ. Safety 20: 325-342.
Carlson AR, Nelson H, Hammermeister D. 1986. Development and validation of site-specific water quality criteria for copper. Environ. Toxic and Chem. 5: 997-1012.
Carreau ND and Pyle GG. 2005. Effect of copper exposure during embryonic development on chemosensory function of juvenile fathead minnows (Pimephales promelas). Ecotoxicology and Environmental Safety, Volume 61 (1): P 1-6
Clements WH, Cherry DS and Cairns J Jr. 1988. Structural alterations in aquatic insect communities exposed to copper in laboratory streams. Environ. Toxic and Chem 7: 715-722.
Clements WH, Cherry DS and Van Hassel JH. 1992. Assessment of the impact of heavy metals on benthic communities at the Clinch River (Virginia): Evaluation of an index of community sensitivity. Can. J. Fish. Aquat. Sci. 49: 1686-1664.
Cope GW, Bringolf RB, Buchwalter DB, Newton TJ, Ingersoll CG, Wang N, Augspurger T, Dwyer FJ, Barnhart MC, Neves RJ AND Hammer E. 2008. Differential exposure, duration, and sensitivity of unionoidean bivalve life stages to environmental contaminants. J. N. Am. Benthol. Soc: 27(2):451–462
De Schamphelaere KAC, Vasconcelos FM, Tack FMG, Allen HE, and Janssen CR. 2004. Effect of dissolved organic matter source on acute copper toxicity to Daphnia magna. Environ. Toxicol. Chem. 23(5): 1248-1255
De Schamphelaere KAC, Forrex I, Kierckens K, Sorgeloos P. and Janssen CR. 2007. Chronic toxicity of dietary copper to Daphnia magna. Aquat. Toxicol. 81: 409-418.
DiToro DM, Allen HE, Bergman HL, Meyer JS and Paquin PR. 2001. Biotic ligand model of the acute toxicity of metals: 1. Technical basis. Environ. Toxicol. Chem. 20 (10): 2383–2396.
Drummond RA, Spoor WA and Olson GF. 1973. Some short-term indicators of sublethal effects of copper on brook trout. Salvelinus fontinalis. J. Fish. Res. Board Can. 30: 695-701. (cited in Atchison et al. 1987)
Eisler R. 1998. Copper hazards to fish, wildlife, and invertebrates: a synoptic review. U.S. Geological Survey, Biological Resources Division, Biological Science Report USGS/BRD/BSR--1998-0002.
Ferriera D, Tousset N, Ridame C and Tusseau-Vullemin MH. 2008. More than inorganic copper is bioavailable to aquatic mosses at environmentally relevant concentrations. Environ. Toxicol. Chem.27(10): 2108-2116.
Folmar LC. 1976. Overt avoidance reaction of rainbow trout fry to nine herbicides. Bull. Environ. Contam. Toxicol. 15: 509-514. (cited in Atchison et al. 1987)

85
Franklin NM, Stauber JL, Markich SJ and Lim RP. 2000. pH-dependent toxicity of copper and uranium to a tropical freshwater alga (Chlorella sp.). Aquat. Toxicol. 48: 275–289.
Franklin NM, Stauber JL, Apte SC, and Lim RP. 2002. Effect of initial cell density on the bioavailability and toxicity of copper in microalgal bioassays. Environ. Toxicol. Chem. 21(4): 742–751.
Geist J, Werner I, Eder KJ and Leutenegger CM. 2007. Comparisons of tissue-specific transcription of stress response genes with whole animal endpoints of adverse effect in striped bass (Morone saxatilis) following treatment with copper and esfenvalerate. Aquat. Toxicol. 85: 28–39
Giattina JD, Garton RR and Stevens DG. 1982. Avoidance of copper and nickel by rainbow trout as monitored by a computer-based data acquisition system. Trans. Amer. Fish. Society. 111: 491-504.
Hansen JA, Lipton J, Welsh PG, Morris J, Cacela D and Suedkamp MJ. 2002a. Relationship between exposure duration, tissue residues, growth, and mortality in rainbow trout (Oncorhynchus mykiss) juveniles sub-chronically exposed to copper. Aquat. Toxicol. 58: 175–188.
Hansen JA, Welsh PG, Lipton J and Cacela D. 2002b. Effects of copper exposure on growth and survival of juvenile bull trout. Trans. Amer. Fish. Soc. 131: 690-697.
Hansen JA, Marr JCA, Lipton J, Cacela D and Bergman HL. 1999a. Differences in neurobeharioral responses of Chinook salmon (Oncorhynchus tshawytscha) and rainbow trout (Oncorhynchus mykiss) exposed to copper and cobalt: behavioral avoidance. Environ. Toxicol. Chem. 18(9): 1972-1978.
Hansen JA, Woodward DE, Little EE, DeLonay AJ and Bergman HL. 1999b. Behavioral avoidance: Possible mechanisms for explaining abundance and distribution of trout species in a metal-impacted river. Environ. Toxicol. Chem. 18: 313-317.
Hansen JA, Rose JD, Jenkins RA, Gerow KG and Bergman HL. 1999b. Chinook salmon (Oncorhynchus tshawytscha) and rainbow trout (Oncorhynchus mykiss) exposed to copper: neurophysiological and histological effects on the olfactory system. Environ. Toxicol. Chem. 18: 1979-1991.
Hansen HJM, Olsen AG and Rosenkilde P. 1996. The effect of Cu on gill and esophagus lipid metabolism in the rainbow trout (Onchorhynchus mykiss). Comp. Biochem. Physiol. 113C: 23-29.
Hara TJ. 1981. Behavioural and electrophysiological studies of chemosensory reactions in fish. pp. 123-136. In: P.R. Laming (ed.) Brain Mechanisms of Behaviour in Lower Vertebrates, Cambridge University Press, New York. (cited in Atchison et al. 1987).
Hecht SA, Baldwin DH, Mebane CA, Hawkes T, Gross SJ and Scholz NL. 2007. An overview of sensory effects on juvenile salmonids exposed to dissolved copper: Applying a benchmark concentration approach to evaluate sublethal neurobehavioral toxicity. US Dept. Commer. NOAA Tech. Memo. NMFS-NWFSC-83. Seattle, WA. 39p.

86
Henry MG and Atchison GJ. 1986. Behavioral changes in social groups of bluegills exposed to copper. Transactions of the American Fisheries Society 115 (44) 590-595 (cited in Atchison et al. 1987).
Hyne RV, Pablo F, Julli M, and Markich SJ. 2005. Infulence of water chemistry on the acute toxicity of copper and zinc to the cladoceran Ceriodaphnia dubia. Environ. Toxicol. Chem. 24 (7): 1667-1675.
Kazlauskiene N. 2002. Long-term effect of copper on sea trout (Salmo trutta trutta L. in early ontogenesis. Ekologija 2: 65-68.
Linbo TL, Stehr CM, Incargona JP and Scholz NL. 2006. Dissolved copper triggers cell death in the peripheral mechanosensory system of larval fish. Environ. Toxic.and Chem. 25: 597-603.
MacRae RK, Smith DE, Swoboda-Colberg N, Meyer JS and Bergman HL. 1999. Copper binding affinity of rainbow trout (Oncorhynchus mykiss) and brook trout (Salvelinus fontinalis) gills: implications for assessing bioavailable metal. Environ. Tox. And Chem. 18(6): 1180-1189.
March FA, Dwyer FJ, Augspurger T, Ingersoll CG, Wang N and Megand CA. 2007. An evaluation of freshwater mussel toxicity data in the derivation of water quality guidance and standards for copper. Environ. Toxic. And Chem. 26(10): 2066-2074.
Martin AJ and Goldblatt R. 2007. Speciation, behavior and bioavailablity of copper downstream of a mine-impacted lake. Environ. Toxicol. Chem. 26(12): 2594-2603.
McGreer JC, Brix KV, Skeaff JM, DeForest DK and Brigham SI. 2003. Inverse relationship between bioconcentration factor and exposure concentration for metals: implications for hazard assessment of metals in the aquatic environment. Environ. Toxicol. Chem. Vol. 22 (5): 1017–1037.
Morgan WSG and Young RC. 1984. Fish locomotor behavior patterns as a monitoring tool. J. Water Pollut. Control Fed. 51:580-589. (cited in Atchison et al. 1987).
Sandahl JF, Baldwin DH, Jenkins JJ, and Scholz NL. 2004. Odor-evoked field potentials as indicators of sublethal neurotoxicity in juvenile coho salmon (Oncorhynchus kisutch) exposed to copper, chlorpyrifos, or esfenvalerate. Can. J. Fish. Aquat. Sci. 61: 404–413 (2004)
Sandahl JF, Baldwin DH, Jenkins JJ, and Scholz NL. 2007. A Sensory System at the Interface between Urban Stormwater Runoff and Salmon Survival. Environ. Sci. Technol. 41: 2998-3004
Sandahl JF, Miyaska G, Koide N and Ueda H. 2006. Olfactory inhibition and recovery in chum salmon (Oncorhynchus keta) following copper exposure. Can. J. Fish. And Aquat. Sci 63(8): 1840-1847.
Saunders RL and Sprague JB. 1967. Effects of copper-zinc mining pollution on a spawning migration of Atlantic salmon. Water Res. 1: 419-432. (cited in Atchison et al. 1987).
Scherer E. and McNicol RE. 1998. Preference-avoidance responses of lake whitefish (Coregonus cluepeaformis) to competing gradients of light and copper, lead, and zinc. Water Res. 32(3): 924-929.
87
Sciera KL, Isely J, Tomasso JR Jr. and Klaine SJ. 2004. Influence of multiple water-quality characteristics on copper toxicity to fathead minnows (Pimephales promelas). Environ. Toxicol. Chem. 23: 2900-2905.
Shephard B. 2008. Copper Effects on Fish Behavior: A Critical Review and Synopsis of Existing Studies. Soc. Environ. Toxicol. Chem., 5th World Congress. Sydney, Australia. August 3 – 7, 2008.
Shephard B. 2008. Pers. Comm. USEPA, Seattle, WA.
Sloman KA, Baker DW, Ho CG, McDonald DG, and Wood CM. 2003. The effects of trace metal exposure on agonistic encounters in juvenile rainbow trout, Oncorhynchus mykiss. Aquat. Toxicol. 63: 187-/196.
Sloman KA, Lepage O, Rogers JT, Wood CM. and Winberg S. 2005. Socially-mediated differences in brain monoamines in rainbow trout: effects of trace metal contaminants. Aquat. Toxicol. 71: 237–247
Sprague JB. 1964. Avoidance of copper-zinc solutions by young salmon in the laboratory. J. Water Pollut. Control Fed. 36: 990-1004. (cited in Atchison et al. 1987)
Stephan, CE. 1985. Guidelines for deriving numerical national water quality criteria for the protection of aquatic organisms and their uses. Washington, D.C.: U.S. Environmental Protection Agency, Office of Water Regulations and Standards, Criteria and Standards Division.
Taylor LN, McGreer JC, Wood CM, and McDonald DG. 2000. Physiological effects of chronic copper exposure to rainbow trout (Oncorhynchus mykiss) in hard and soft wter: Evaluation of chronic indicators. Environ. Toxicol. Chem. 19: 2298-2308.
Taylor LN, McFarland WJ, Pyle GG, Couture P and McDonald DG. 2004. Use of performance indicators in evaluating chronic metal exposure in wild yellow perch (Perca flavescens). Aquat. Toxicol. 67: 371-385.
Waiwood KG and Beamish FWM. 1978. Effects of copper, pH and hardness on the critical swimming speed of rainbow trout (Salmo gairdneri Richardson). Water Res. 12: 611-619. Cited in Beaumont et al.
Wang N, Augspurger T, Barnhart MC, Bidwell JR, Cope WG, Dwyer FJ, Geis S, Greer IE, Ingersoll CG, Kane CM, May TW, Neves RJ, Newton TJ, Roberts AD and Whites DW. 2007a. Contaminant sensitivity of freshwater mussels intra- and interlaboratory variability in acute toxicity tests with glochidia and juveniles of freshwater mussels (Unionidae). Environ. Toxicol. Chem. Vol. 26, No. 10, pp. 2029–2035
Wang N, Ingersoll CG, Hardesty DK, Ivey CD, Kunz JL, May TW, Dwyer FJ, Roberts AD, Augspurger T, Kane CM, Neves RJ, and Barnhart MC. 2007b. Acute toxicity of copper, ammonia, and chlorine to glochidia and juveniles of freshwater mussels (Unionidae). Environ. Toxicol. Chem. 26 (10): 2036–2047.
Wang N, Ingersoll CG, Greer IE, Hardesty DK, Ivey CD, Kunz JL, Brumbaugh WG, Dwyer FJ, Roberts AD, Augspurger T, Kane CM, Neves RJ, and Barnhart MC. 2007c. Contaminant Sensitivity of Freshwater Mussels: Chronic toxicity of copper and ammonia to juvenile freshwater mussels (Unionidae). Environ. Toxicol. Chem. Vol. 26 (10): 2048–2056.
88
Weast RC and Astle MJ (eds). 1980. CRC Handbook of Chemistry and Physics. CRC Press, Inc. Boca Raton, FL.
Westlake GF, Kleerekoper H and Matis J. 1974. The locomotor response of goldfish to a steep gradient of copper ions. Water Resour. Res. 10: 103-105. (cited in Atchison et al. 1987)
Woody, CA. 2007. Copper: Effects on Freshwater Food Chains and Salmon:A literature review. CA Woody, Fisheries Research and Consulting, Draft Document. 18 pp.
US Environmental Protection Agency. 1984. Ambient Water Quality Criteria for Copper. USEPA Office of Water, Regulations and Standards, Criteria and Standards Division. Washington DC 20460. EPA 440/5-84-031. January 1985
US Environmental Protection Agency. 2004. National Recommended Water Quality Criteria. USEPA Office of Water, Science and Technology. Washington DC 20460. EPA 4404T.

89
Index
acute toxicity, 11, 14, 23, 29, 31, 35, 38, 43, 46, 66, 68, 72
algae, 77 alkalinity, 21 aquatic insects, 75, 76 Aquatic insects, 71 Arctic grayling
acute toxicity, 31 aufwuchs, 71 availability, 26 avoidance, 29, 50, 51, 53, 60 behavior, 46 Benchmark Concentration, 36 bioaccumulation, 25 Bioconcentration, 18 biomagnification, 18 Biotic Ligand Model, 25, 27 brown trout, 29, 30 bull trout, 35 Ca++, 27 Ceriodaphnia dubia, 14, 68 chemosensory function, 49 Chinook salmon, 54
avoidance, 51 chronic toxicity, 23, 30, 33, 40, 43, 44,
46, 70 chum salmon, 58 Cladocera, 72 coho salmon, 48, 57, 59
acute toxicity, 31 community sensitivity, 75, 76 copper
bioavailability, 13, 16 complexes, 13 dietary source, 77 speciation, 14, 16, 19 tissue concentration, 33, 35
Copper speciation, 11
Cyprinidae, 56 D. magna, 11, 68, 77 DOC, 14, 16, 27, See DOM DOM, 11, 13 early life stage, 38 ecological risk, 23 embryonic development, 49 fathead minnow, 49, 68 freshwater algae, 78, 79 freshwater mussel, 63, 64, 66, 68, 70 gill-binding, 19, 40, 44 growth, 33, 35, 44, 70 hardness, 21, 48, 64 Hyalela azteca, 68 lake whitefish, 60 life stage, 25, 63, 66, 68 ligands, 19, 79 olfactory
neurons, 58 response, 59
olfactory effects, 36 olfactory neurons, 42 olfactory response, 48, 54, 56, 57 pH, 14, 21, 27, 30, 78 population effects, 71 rainbow trout, 33, 44, 50, 53, 54, 61, 68
acute toxicity, 31 avoidance, 51
sea trout, 38 site specific criteria, 26 social behavior, 61 stress response, 43 striped bass, 43 swimming, 44
critical speed, 30 performance, 40
Tilapia, 42 water quality standards, 64 yellow perch, 40

Appendix 1. Glossary of Terms
Acute criteria = are based on the average concentration of chemical pollutants during a one-hour period. One hour was chosen because it is a substantially shorter period than the length of most acute toxicity tests.
Acute exposure = exposure over a brief period of time (generally less than 24 h). Often it is considered to be a single exposure (or dose) but may consist of repeated exposures within a short time period.
Acute toxicity = an adverse or undesirable effect that is manifested within a relatively short time interval ranging from almost immediately to within several days following exposure.
Bioaccumulation= used to describe the increase in concentration of a substance in an organism over time. Bioaccumulative substances tend to be fat-soluble and not to be broken down by the organism.
Bioconcentration = The increase in concentration of a chemical in an organism resulting from tissue absorption levels exceeding the rate of metabolism and excretion.
Bioconcentration Factor (BCF) =Used to describe the accumulation of chemicals in organisms, primarily aquatic, that live in contaminated environments. According to EPA guidelines, "the BCF is defined as the ratio of chemical concentration in the organism to that in surrounding water. Bioconcentration occurs through uptake and retention of a substance from water only, through gill membranes or other external body surfaces. In the context of setting exposure criteria it is generally understood that the terms "BCF" and "steady-state BCF"' are synonymous. A steady-state condition occurs when the organism is exposed for a sufficient length of time that the ratio does not change substantially."
Biomagnification = refers to the progressive build up of persistent substances by successive trophic levels - meaning that it relates to the concentration ratio in a tissue of a predator organism as compared to that in its prey.
CCC = criterion continuous concentration, often referred to as chronic criterion. CCC is an estimate of the highest concentration of a material in surface water to which an aquatic community can be exposed indefinitely without resulting in an unacceptable effect.
Chronic criteria are based on the average concentration of chemical pollutants during a four-day period. A four day averaging period was chosen because it is substantially shorter than most chronic toxicity tests. Chronic criteria are typically stricter than the acute criteria and are therefore used to protect ambient waters.
Chronic exposure = exposures (either repeated or continuous) over a long (greater than 3 months) period of time. With animal testing this exposure often continues for the majority of the experimental animal’s life, and within occupational settings it is generally considered to be for a number of years.
Chronic toxicity= a permanent or lasting adverse effect that is manifested after exposure to a toxicant.
90

91
CMC = criterion maximum concentration, often referred to as acute criterion. The CMC is an estimate of the highest concentration of a material in surface water to which an aquatic community can be exposed briefly without resulting in an unacceptable effect. (USEPA 2004)
EC = effective concentration. The concentration of a substance that causes a defined magnitude of response in a given system: EC50 is the median concentration that causes 50 % of maximal response.
Hardness = the presence of the dissolved divalent cations Ca2+ and Mg2+. in natural waters. Soft water contains approximately 0-60ppm total hardness, moderate water contains from 61 to 120ppm, hard water contains from 121 to 180ppm, and very hard water contains over 180ppm total hardness. Hardness is expressed in terms of calcium carbonate, which can be calculated as shown in the equation : Hardness mg/l = 2.5 [conc. of Ca2+ (mg/l)] + 4.1 [conc. of Mg2+ (mg/l)]
LC = Lethal concentration. For example, 99-h LC50 is the concentration in solution at the start of the test that is estimated to kill 50% of the test species in 96 h
MATC = Maximum acceptable toxicant concentration. Lower value in each MATC pair indicates highest concentration tested producing no measurable effect on growth, survival, reproduction, and metabolism
Subacute exposure = resembles acute exposure except that the exposure duration is greater, from several days to one month.
Subchronic exposure = exposures repeated or spread over an intermediate time range. For animal testing, this time range is generally considered to be 1–3 months.

Appendix II. Acute toxicity values for fish reported in published literature with AWQ hardness-adjusted acute Cu criterion.
Effect Concentration,
ug Cu l-1 Endpoint Species Age / common name pH Hardness
mg l-1
AWQC hardness adjusted
ug Cu l-1 Citation 1100 96-h LC50 Lepomis macrochirus bluegill 7-8 45 6.6 Atchison et al. 1987 37 96-h LC50 Oncorhynchus clarki cutthroat trout 18 2.8 Eisler 1998
66.6 LC50 Oncorhynchus clarki cutthroat trout normalized to 50 7.3 Brix et al. 2001 332 96-h LC50 Oncorhynchus clarki cutthroat trout 204 27.4 Eisler 1998 26 96-h LC50 Oncorhynchus kisutch coho salmon alevins 25 3.8 Eisler 1998 46 96-h LC50 Oncorhynchus kisutch coho salmon adults 20 3.1 Eisler 1998 60 96-h LC50 Oncorhynchus kisutch coho salmon smolts 95 13.3 Eisler 1998 87 LC50 Oncorhynchus kisutch coho salmon normalized to 50 7.3 Brix et al. 2001
42.2 24-h LC50 Oncorhynchus kisutch coho salmon, 0.47 g juv. 41 6
Buhl and Hamilton 1990
62.3 24-h LC50 Oncorhynchus kisutch coho salmon, 0.87 g juv. 41 6
Buhl and Hamilton 1990 Buhl and Hamilton 1990 100 24-h LC50 Oncorhynchus kisutch coho salmon, alevin 41 6 Buhl and Hamilton 1990 57 24-h LC50 Oncorhynchus kisutch coho salmon, alevin 41 6
coho salmon, 0.41 g juv. 23.4 24-h LC50 Oncorhynchus kisutch 41 6
Buhl and Hamilton 1990
23.9 96-h LC50 Oncorhynchus kisutch coho salmon, 0.47 g juv. 41 6
Buhl and Hamilton 1990
31.9 96-h LC50 Oncorhynchus kisutch coho salmon, 0.87 g juv. 41 6
Buhl and Hamilton 1990 Buhl and Hamilton 1990 21.0 96-h LC50 Oncorhynchus kisutch coho salmon, alevin 41 6 Buhl and Hamilton 1990 19.3 96-h LC50 Oncorhynchus kisutch coho salmon, alevin 41 6
92

Effect Concentration,
ug Cu l-1 Endpoint Species Age / common name pH Hardness
mg l-1
AWQC hardness adjusted
ug Cu l-1 Citation
15.1 96-h LC50 Oncorhynchus kisutch coho salmon, 0.41 g juv. 41 6
Buhl and Hamilton 1990
220 to 280 168-h LC50 Oncorhynchus kisutch coho salmon fingerlings normalized to 50 7.3 Eisler 1998
60 to 74 96-h LC50 Oncorhynchus kisutch coho salmon 1-yr 95 13.3 Eisler 1998
18.9 24-h LC50 Oncorhynchus mykiss rainbow trout 0.60g juv. 41 6
Buhl and Hamilton 1990
13.8 96-h LC50 Oncorhynchus mykiss rainbow trout 0.60g juv.. 41 6
Buhl and Hamilton 1990
19 200-h LC10 Oncorhynchus mykiss rainbow trout alevins normalized to 50 7.3 Eisler 1998
46.4 24-h LC50 Oncorhynchus mykiss rainbow trout alevins 41 6 Buhl and Hamilton 1990
36 96-h LC50 Oncorhynchus mykiss rainbow trout alevins 41 6 Buhl and Hamilton 1990
38.9 LC50 Oncorhynchus mykiss rainbow trout normalized to 50 7.3 Brix et al. 2001 75 24-h LC50 Oncorhynchus mykiss rainbow trout juv. normalized to 50 7.3 Eisler 1998
130 to 140 24-h LC50 Oncorhynchus mykiss rainbow trout juv. 6.5 to
7.5 normalized to 50 7.3 Eisler 1998 20 to 30 96-h LC50 Oncorhynchus mykiss rainbow trout 31 4.6 Eisler 1998
70 to 514 96-h LC50 Oncorhynchus mykiss rainbow trout juv. 194 to 370 26.1 to 48 Eisler 1998 233.8 LC50 Oncorhynchus nerka sockeye salmon normalized to 50 7.3 Brix et al. 2001
19 200-h LC50 Oncorhynchus tsawytscha chinook salmon, swimup normalized to 50 7.3 Eisler 1998
93
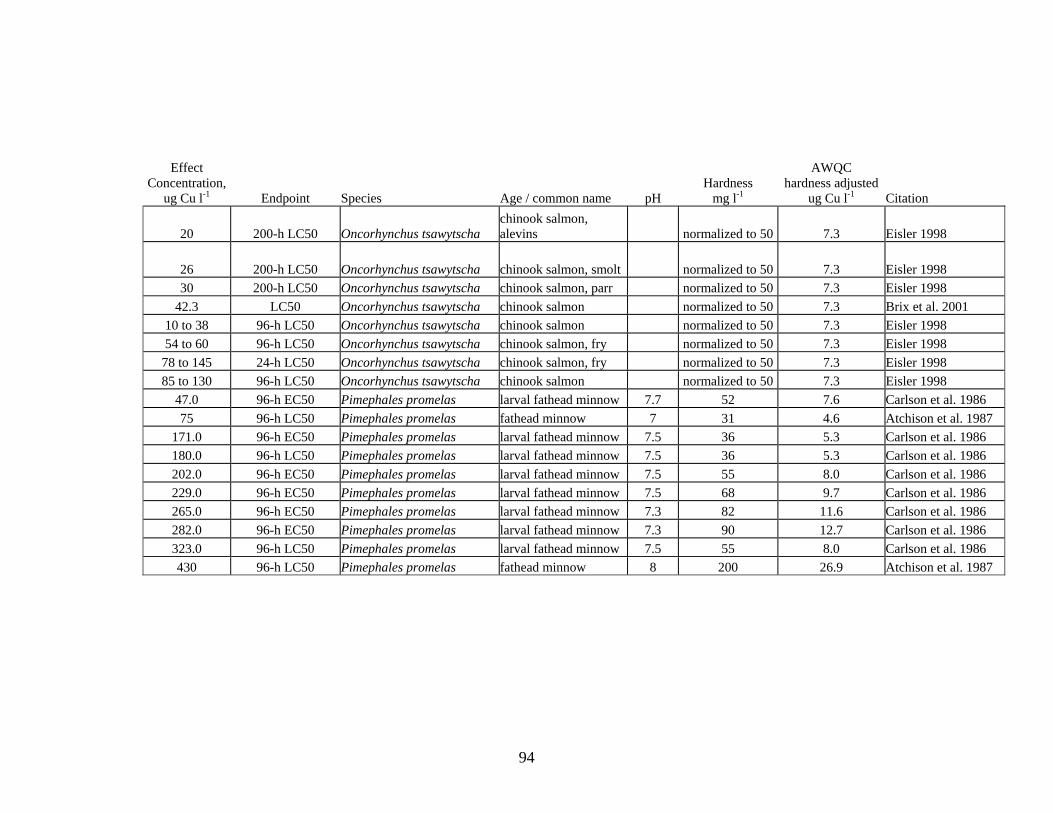
Effect Concentration,
ug Cu l-1 Endpoint Species Age / common name pH Hardness
mg l-1
AWQC hardness adjusted
ug Cu l-1 Citation
20 200-h LC50 Oncorhynchus tsawytscha chinook salmon, alevins normalized to 50 7.3 Eisler 1998
26 200-h LC50 Oncorhynchus tsawytscha chinook salmon, smolt normalized to 50 7.3 Eisler 1998 30 200-h LC50 Oncorhynchus tsawytscha chinook salmon, parr normalized to 50 7.3 Eisler 1998
42.3 LC50 Oncorhynchus tsawytscha chinook salmon normalized to 50 7.3 Brix et al. 2001 10 to 38 96-h LC50 Oncorhynchus tsawytscha chinook salmon normalized to 50 7.3 Eisler 1998 54 to 60 96-h LC50 Oncorhynchus tsawytscha chinook salmon, fry normalized to 50 7.3 Eisler 1998
78 to 145 24-h LC50 Oncorhynchus tsawytscha chinook salmon, fry normalized to 50 7.3 Eisler 1998 85 to 130 96-h LC50 Oncorhynchus tsawytscha chinook salmon normalized to 50 7.3 Eisler 1998
47.0 96-h EC50 Pimephales promelas larval fathead minnow 7.7 52 7.6 Carlson et al. 1986 75 96-h LC50 Pimephales promelas fathead minnow 7 31 4.6 Atchison et al. 1987
171.0 96-h EC50 Pimephales promelas larval fathead minnow 7.5 36 5.3 Carlson et al. 1986 180.0 96-h LC50 Pimephales promelas larval fathead minnow 7.5 36 5.3 Carlson et al. 1986 202.0 96-h EC50 Pimephales promelas larval fathead minnow 7.5 55 8.0 Carlson et al. 1986 229.0 96-h EC50 Pimephales promelas larval fathead minnow 7.5 68 9.7 Carlson et al. 1986 265.0 96-h EC50 Pimephales promelas larval fathead minnow 7.3 82 11.6 Carlson et al. 1986 282.0 96-h EC50 Pimephales promelas larval fathead minnow 7.3 90 12.7 Carlson et al. 1986 323.0 96-h LC50 Pimephales promelas larval fathead minnow 7.5 55 8.0 Carlson et al. 1986 430 96-h LC50 Pimephales promelas fathead minnow 8 200 26.9 Atchison et al. 1987
94

Effect Concentration,
ug Cu l-1 Endpoint Species Age / common name pH Hardness
mg l-1
AWQC hardness adjusted
ug Cu l-1 Citation 460 96-h LC50 Pimephales promelas fathead minnow 8 200 26.9 Atchison et al. 1987
511.0 96-h LC50 Pimephales promelas larval fathead minnow 7.5 68 9.7 Carlson et al. 1986 689.0 96-h LC50 Pimephales promelas larval fathead minnow 7.3 90 12.7 Carlson et al. 1986 >988 96-h LC50 Pimephales promelas larval fathead minnow 7.3 82 11.6 Carlson et al. 1986 55.0 96-h LC50 Pimephales promelas larval fathead minnow 7.7 52 7.6 Carlson et al. 1986
32 to 125 96-h LC50 Salmo salar Atlantic salmon 8 to 20 1.3 to 3.1 Eisler 1998 103 to 148 48-h LC50 Salmo trutta brown trout juv. normalized to 50 7.3 Eisler 1998 22 to 43.2 MATC Salmo trutta brown trout 45 6.6 Eisler 1998
100 96-h LC50 Salvelinus fontinalis Brook charr 7.5 45 6.6 Atchison et al. 1987 110.4 LC50 Salvelinus fontinalis brook trout normalized to 50 7.3 Brix et al. 2001
9.5 to 17.4 MATC Salvelinus fontinalis Brook charr 7.5 45 6.6 Eisler 1998 22.0 to 42.3 MATC Salvelinus namaycush lake trout 45 6.6 Eisler 1998
65 24-h LC50 Thymallus arcticus Arctic grayling fry 41 6 Buhl and Hamilton 1990
9.6 96-h LC50 Thymallus arcticus Arctic grayling fry 41 6 Buhl and Hamilton 1990
>170 24-h LC50 Thymallus arcticus Arctic grayling alevins 41 6 Buhl and Hamilton 1990
95

Effect Concentration,
ug Cu l-1 Endpoint Species Age / common name pH Hardness
mg l-1
AWQC hardness adjusted
ug Cu l-1 Citation
92 24-h LC50 Thymallus arcticus Arctic grayling alevins 41 6 Buhl and Hamilton 1990
313 24-h LC50 Thymallus arcticus Arctic grayling alevins 41 6 Buhl and Hamilton 1990
67.5 96-h LC50 Thymallus arcticus Arctic grayling alevins 41 6 Buhl and Hamilton 1990
23.9 96-h LC50 Thymallus arcticus Arctic grayling alevins 41 6 Buhl and Hamilton 1990
131 96-h LC50 Thymallus arcticus Arctic grayling alevins 41 6 Buhl and Hamilton 1990
15.8 24-h LC50 Thymallus arcticus Arctic grayling 0.2g 41 6 Buhl and Hamilton 1990
5.93 24-h LC50 Thymallus arcticus Arctic grayling 0.34g. 41 6 Buhl and Hamilton 1990
46.2 24-h LC50 Thymallus arcticus Arctic grayling 0.85g. 41 6 Buhl and Hamilton 1990
100 24-h LC50 Thymallus arcticus Arctic grayling 0.81g 41 6 Buhl and Hamilton 1990
2.70 96-h LC50 Thymallus arcticus Arctic grayling 0.2g. 41 6 Buhl and Hamilton 1990
2.58 96-h LC50 Thymallus arcticus Arctic grayling 0.34g 41 6 Buhl and Hamilton 1990
30.0 96-h LC50 Thymallus arcticus Arctic grayling 0.85g 41 6 Buhl and Hamilton 1990
49.3 96-h LC50 Thymallus arcticus Arctic grayling 0.81g 41 6 Buhl and Hamilton 1990
96
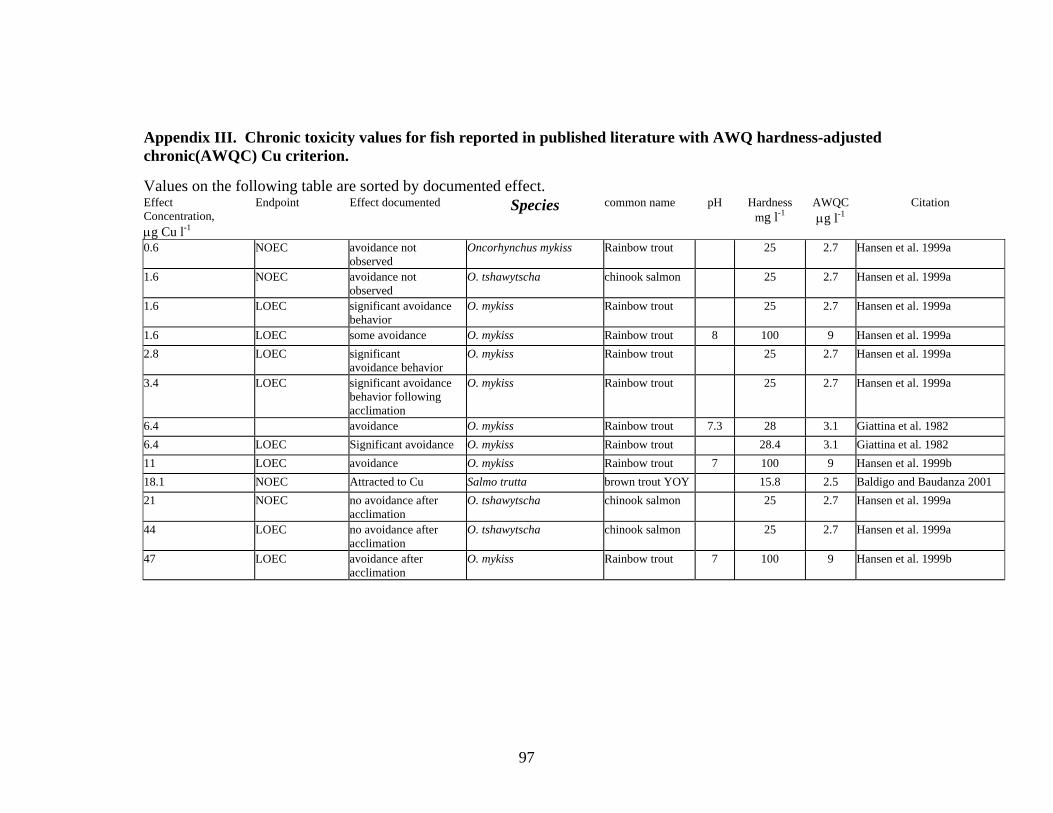
Appendix III. Chronic toxicity values for fish reported in published literature with AWQ hardness-adjusted chronic(AWQC) Cu criterion.
Values on the following table are sorted by documented effect. Effect Concentration, μg Cu l-1
Endpoint Effect documented Species common name pH Hardness mg l-1
AWQC μg l-1
Citation
0.6 NOEC avoidance not observed
Oncorhynchus mykiss Rainbow trout 25 2.7 Hansen et al. 1999a
1.6 NOEC avoidance not observed
O. tshawytscha chinook salmon 25 2.7 Hansen et al. 1999a
1.6 LOEC significant avoidance behavior
O. mykiss Rainbow trout 25 2.7 Hansen et al. 1999a
1.6 LOEC some avoidance O. mykiss Rainbow trout 8 100 9 Hansen et al. 1999a 2.8 LOEC significant
avoidance behavior O. mykiss Rainbow trout 25 2.7 Hansen et al. 1999a
3.4 LOEC significant avoidance behavior following acclimation
O. mykiss Rainbow trout 25 2.7 Hansen et al. 1999a
6.4 avoidance O. mykiss Rainbow trout 7.3 28 3.1 Giattina et al. 1982 6.4 LOEC Significant avoidance O. mykiss Rainbow trout 28.4 3.1 Giattina et al. 1982 11 LOEC avoidance O. mykiss Rainbow trout 7 100 9 Hansen et al. 1999b 18.1 NOEC Attracted to Cu Salmo trutta brown trout YOY 15.8 2.5 Baldigo and Baudanza 2001 21 NOEC no avoidance after
acclimation O. tshawytscha chinook salmon 25 2.7 Hansen et al. 1999a
44 LOEC no avoidance after acclimation
O. tshawytscha chinook salmon 25 2.7 Hansen et al. 1999a
47 LOEC avoidance after acclimation
O. mykiss Rainbow trout 7 100 9 Hansen et al. 1999b
97
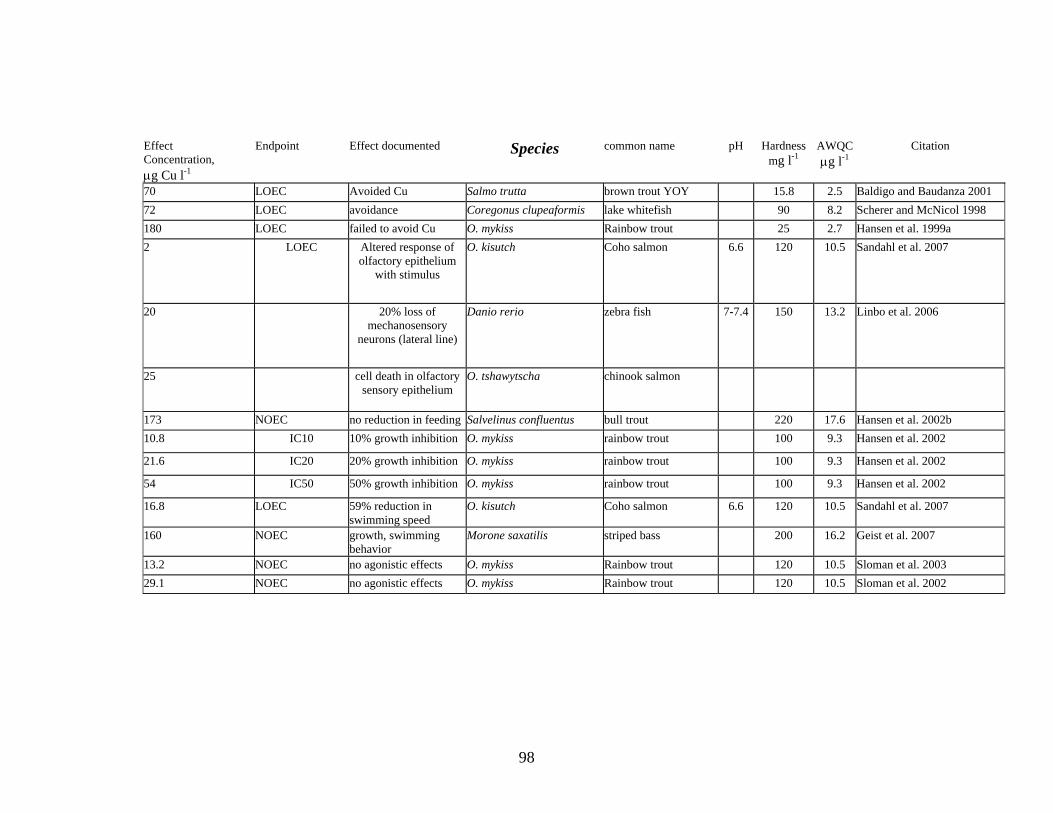
Effect Concentration, μg Cu l-1
Endpoint Effect documented Species common name pH Hardnessmg l-1
AWQC μg l-1
Citation
70 LOEC Avoided Cu Salmo trutta brown trout YOY 15.8 2.5 Baldigo and Baudanza 2001 72 LOEC avoidance Coregonus clupeaformis lake whitefish 90 8.2 Scherer and McNicol 1998 180 LOEC failed to avoid Cu O. mykiss Rainbow trout 25 2.7 Hansen et al. 1999a 2 LOEC Altered response of
olfactory epithelium with stimulus
O. kisutch Coho salmon 6.6 120 10.5 Sandahl et al. 2007
20 20% loss of mechanosensory
neurons (lateral line)
Danio rerio zebra fish 7-7.4 150 13.2 Linbo et al. 2006
25 cell death in olfactory sensory epithelium
O. tshawytscha chinook salmon
173 NOEC no reduction in feeding Salvelinus confluentus bull trout 220 17.6 Hansen et al. 2002b 10.8 IC10 10% growth inhibition O. mykiss rainbow trout 100 9.3 Hansen et al. 2002
21.6 IC20 20% growth inhibition O. mykiss rainbow trout 100 9.3 Hansen et al. 2002
54 IC50 50% growth inhibition O. mykiss rainbow trout 100 9.3 Hansen et al. 2002
16.8 LOEC 59% reduction in swimming speed
O. kisutch Coho salmon 6.6 120 10.5 Sandahl et al. 2007
160 NOEC growth, swimming behavior
Morone saxatilis striped bass 200 16.2 Geist et al. 2007
13.2 NOEC no agonistic effects O. mykiss Rainbow trout 120 10.5 Sloman et al. 2003 29.1 NOEC no agonistic effects O. mykiss Rainbow trout 120 10.5 Sloman et al. 2002
98

Effect Concentration, μg Cu l-1
Endpoint Effect documented Species common name pH Hardnessmg l-1
AWQC μg l-1
Citation
30 LOEC reduced aggression O. mykiss Rainbow trout 120 10.5 Sloman et al. 2003 5 LOEC 50% reduction in
critical swimming speed, temperature dependent (5 C)
Salmo trutta brown trout 9 1.1 Beaumont et al. 1995
34.9 NOEC MATC Esox lucius Northern pike 45 4.7 Eisler 1998 104.4 LOEC MATC Esox lucius Northern pike 45 4.7 Eisler 1998
99
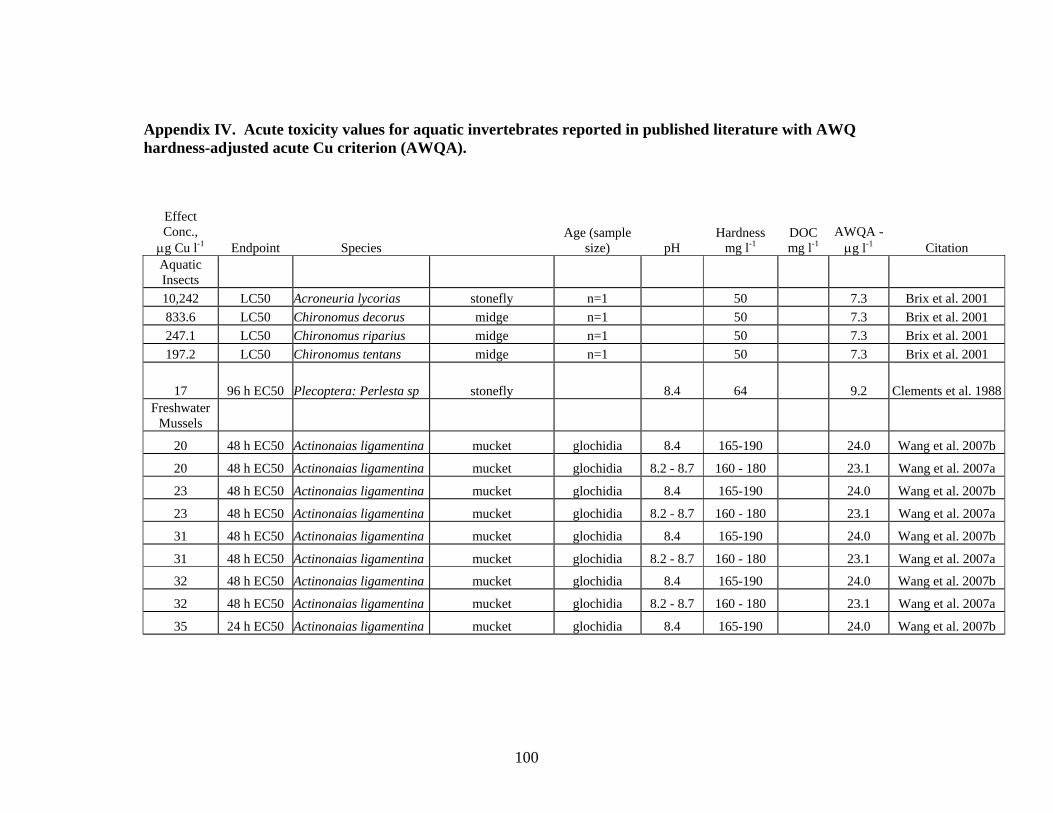
Appendix IV. Acute toxicity values for aquatic invertebrates reported in published literature with AWQ hardness-adjusted acute Cu criterion (AWQA).
Effect Conc., μg Cu l-1 Endpoint Species
Age (sample size) pH
Hardness mg l-1
DOC mg l-1
AWQA -μg l-1 Citation
Aquatic Insects 10,242 LC50 Acroneuria lycorias stonefly n=1 50 7.3 Brix et al. 2001 833.6 LC50 Chironomus decorus midge n=1 50 7.3 Brix et al. 2001 247.1 LC50 Chironomus riparius midge n=1 50 7.3 Brix et al. 2001 197.2 LC50 Chironomus tentans midge n=1 50 7.3 Brix et al. 2001
17 96 h EC50 Plecoptera: Perlesta sp stonefly 8.4 64 9.2 Clements et al. 1988 Freshwater
Mussels
20 48 h EC50 Actinonaias ligamentina mucket glochidia 8.4 165-190 24.0 Wang et al. 2007b
20 48 h EC50 Actinonaias ligamentina mucket glochidia 8.2 - 8.7 160 - 180 23.1 Wang et al. 2007a
23 48 h EC50 Actinonaias ligamentina mucket glochidia 8.4 165-190 24.0 Wang et al. 2007b
23 48 h EC50 Actinonaias ligamentina mucket glochidia 8.2 - 8.7 160 - 180 23.1 Wang et al. 2007a
31 48 h EC50 Actinonaias ligamentina mucket glochidia 8.4 165-190 24.0 Wang et al. 2007b
31 48 h EC50 Actinonaias ligamentina mucket glochidia 8.2 - 8.7 160 - 180 23.1 Wang et al. 2007a
32 48 h EC50 Actinonaias ligamentina mucket glochidia 8.4 165-190 24.0 Wang et al. 2007b
32 48 h EC50 Actinonaias ligamentina mucket glochidia 8.2 - 8.7 160 - 180 23.1 Wang et al. 2007a
35 24 h EC50 Actinonaias ligamentina mucket glochidia 8.4 165-190 24.0 Wang et al. 2007b
100
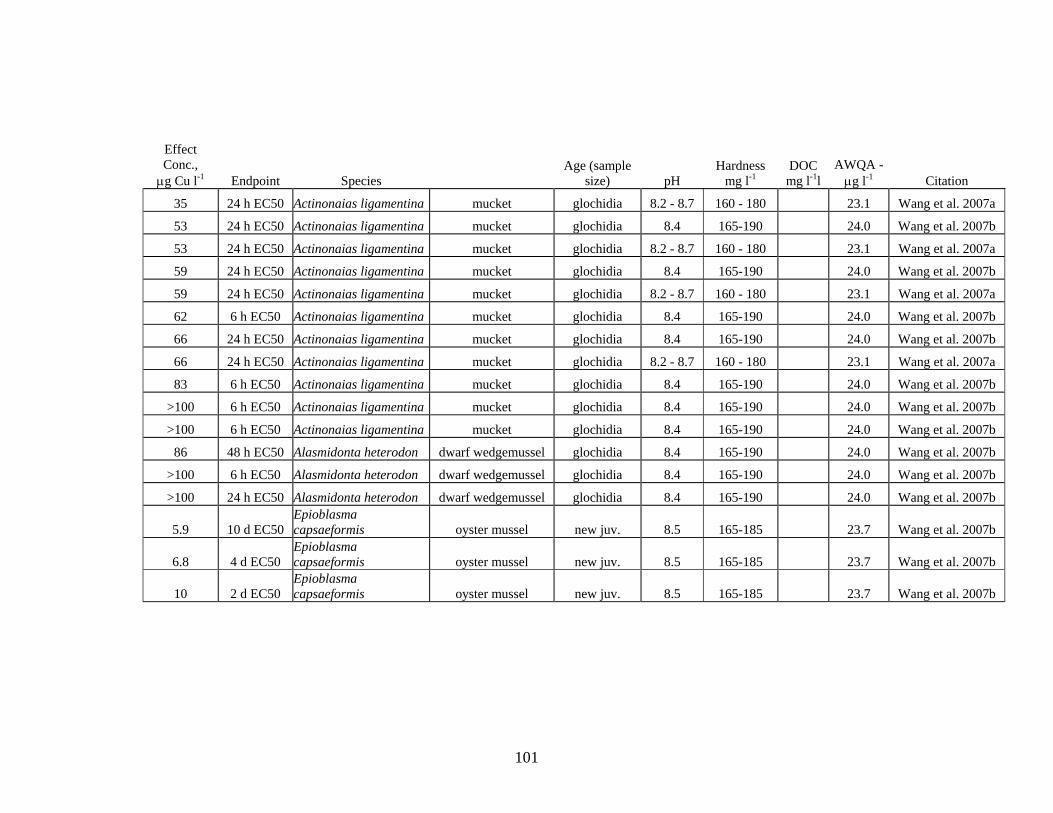
Effect Conc., μg Cu l-1 Endpoint Species
Age (sample size) pH
Hardness mg l-1
DOC mg l l-1
AWQA -μg l-1 Citation
35 24 h EC50 Actinonaias ligamentina mucket glochidia 8.2 - 8.7 160 - 180 23.1 Wang et al. 2007a
53 24 h EC50 Actinonaias ligamentina mucket glochidia 8.4 165-190 24.0 Wang et al. 2007b
53 24 h EC50 Actinonaias ligamentina mucket glochidia 8.2 - 8.7 160 - 180 23.1 Wang et al. 2007a
59 24 h EC50 Actinonaias ligamentina mucket glochidia 8.4 165-190 24.0 Wang et al. 2007b
59 24 h EC50 Actinonaias ligamentina mucket glochidia 8.2 - 8.7 160 - 180 23.1 Wang et al. 2007a
62 6 h EC50 Actinonaias ligamentina mucket glochidia 8.4 165-190 24.0 Wang et al. 2007b
66 24 h EC50 Actinonaias ligamentina mucket glochidia 8.4 165-190 24.0 Wang et al. 2007b
66 24 h EC50 Actinonaias ligamentina mucket glochidia 8.2 - 8.7 160 - 180 23.1 Wang et al. 2007a
83 6 h EC50 Actinonaias ligamentina mucket glochidia 8.4 165-190 24.0 Wang et al. 2007b
>100 6 h EC50 Actinonaias ligamentina mucket glochidia 8.4 165-190 24.0 Wang et al. 2007b
>100 6 h EC50 Actinonaias ligamentina mucket glochidia 8.4 165-190 24.0 Wang et al. 2007b
86 48 h EC50 Alasmidonta heterodon dwarf wedgemussel glochidia 8.4 165-190 24.0 Wang et al. 2007b
>100 6 h EC50 Alasmidonta heterodon dwarf wedgemussel glochidia 8.4 165-190 24.0 Wang et al. 2007b
>100 24 h EC50 Alasmidonta heterodon dwarf wedgemussel glochidia 8.4 165-190 24.0 Wang et al. 2007b
5.9 10 d EC50 Epioblasma capsaeformis oyster mussel new juv. 8.5 165-185 23.7 Wang et al. 2007b
6.8 4 d EC50 Epioblasma capsaeformis oyster mussel new juv. 8.5 165-185 23.7 Wang et al. 2007b
10 2 d EC50 Epioblasma capsaeformis oyster mussel new juv. 8.5 165-185 23.7 Wang et al. 2007b
101
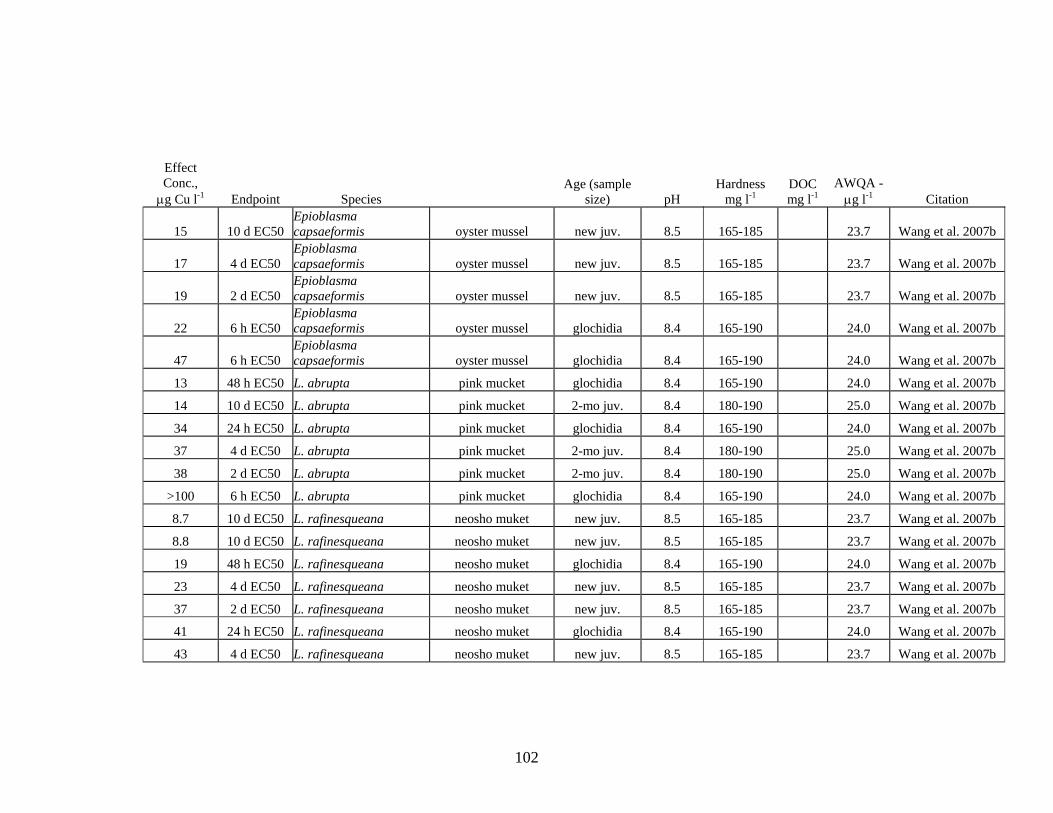
Effect Conc., μg Cu l-1 Endpoint Species
Age (sample size) pH
Hardness mg l-1
DOC mg l-1
AWQA -μg l-1 Citation
15 10 d EC50 Epioblasma capsaeformis oyster mussel new juv. 8.5 165-185 23.7 Wang et al. 2007b
17 4 d EC50 Epioblasma capsaeformis oyster mussel new juv. 8.5 165-185 23.7 Wang et al. 2007b
19 2 d EC50 Epioblasma capsaeformis oyster mussel new juv. 8.5 165-185 23.7 Wang et al. 2007b
22 6 h EC50 Epioblasma capsaeformis oyster mussel glochidia 8.4 165-190 24.0 Wang et al. 2007b
47 6 h EC50 Epioblasma capsaeformis oyster mussel glochidia 8.4 165-190 24.0 Wang et al. 2007b
13 48 h EC50 L. abrupta pink mucket glochidia 8.4 165-190 24.0 Wang et al. 2007b
14 10 d EC50 L. abrupta pink mucket 2-mo juv. 8.4 180-190 25.0 Wang et al. 2007b
34 24 h EC50 L. abrupta pink mucket glochidia 8.4 165-190 24.0 Wang et al. 2007b
37 4 d EC50 L. abrupta pink mucket 2-mo juv. 8.4 180-190 25.0 Wang et al. 2007b
38 2 d EC50 L. abrupta pink mucket 2-mo juv. 8.4 180-190 25.0 Wang et al. 2007b
>100 6 h EC50 L. abrupta pink mucket glochidia 8.4 165-190 24.0 Wang et al. 2007b
8.7 10 d EC50 L. rafinesqueana neosho muket new juv. 8.5 165-185 23.7 Wang et al. 2007b
8.8 10 d EC50 L. rafinesqueana neosho muket new juv. 8.5 165-185 23.7 Wang et al. 2007b
19 48 h EC50 L. rafinesqueana neosho muket glochidia 8.4 165-190 24.0 Wang et al. 2007b
23 4 d EC50 L. rafinesqueana neosho muket new juv. 8.5 165-185 23.7 Wang et al. 2007b
37 2 d EC50 L. rafinesqueana neosho muket new juv. 8.5 165-185 23.7 Wang et al. 2007b
41 24 h EC50 L. rafinesqueana neosho muket glochidia 8.4 165-190 24.0 Wang et al. 2007b
43 4 d EC50 L. rafinesqueana neosho muket new juv. 8.5 165-185 23.7 Wang et al. 2007b
102

Effect Conc., μg Cu l-1 Endpoint Species
Age (sample size) pH
Hardness mg l-1
DOC mg l l-1
AWQA -μg l-1 Citation
60 2 d EC50 L. rafinesqueana neosho muket new juv. 8.5 165-185 23.7 Wang et al. 2007b
>100 6 h EC50 L. rafinesqueana neosho muket glochidia 8.4 165-190 24.0 Wang et al. 2007b
4.8 10 d EC50 Lampsilis fasciola wavy-rayed lampmussel new juv. 8.5 165-185 23.7 Wang et al. 2007b
6.5 48 h EC50 Lampsilis fasciola wavy-rayed lampmussel glochidia 8.4 165-190 24.0 Wang et al. 2007b
6.7 10 d EC50 Lampsilis fasciola wavy-rayed lampmussel new juv. 8.5 165-185 23.7 Wang et al. 2007b
16 24 h EC50 Lampsilis fasciola wavy-rayed lampmussel glochidia 8.4 165-190 24.0 Wang et al. 2007b
18 24 h EC50 Lampsilis fasciola wavy-rayed lampmussel glochidia 8.4 165-190 24.0 Wang et al. 2007b
21 4 d EC50 Lampsilis fasciola wavy-rayed lampmussel new juv. 8.5 165-185 23.7 Wang et al. 2007b
25 4 d EC50 Lampsilis fasciola wavy-rayed lampmussel new juv. 8.5 165-185 23.7 Wang et al. 2007b
56 2 d EC50 Lampsilis fasciola wavy-rayed lampmussel new juv. 8.5 165-185 23.7 Wang et al. 2007b
58 6 h EC50 Lampsilis fasciola wavy-rayed lampmussel glochidia 8.4 165-190 24.0 Wang et al. 2007b
73 48 h EC50 Lampsilis fasciola wavy-rayed lampmussel glochidia 8.4 165-190 24.0 Wang et al. 2007b
103

Freshwater Zooplankton
Effect Conc., μg Cu l-1 Endpoint Species
Age (sample size) pH
Hardness mg l-1
DOC mg l-1
AWQA -μg l-1 Citation
386.3 LC50 Alona affinis cladoceran n=1 50 7.3 Brix et al. 2001 5.2 LC50 Ceriodaphnia reticulata cladoceran n=1 50 7.3 Brix et al. 2001
1290 LC50 Crangonyx pseudogracilis amphipod n=1 50 7.3 Brix et al. 2001
69 LC50 Echinogammarus berilloni amphipod n=1 50 7.3 Brix et al. 2001
22.1 LC50 Gamarus pseudolimnaeus amphipod n=1 50 7.3 Brix et al. 2001
31 LC50 Gammarus pulex amphipod n=7 50 7.3 Brix et al. 2001
11.9 48-h EC50 Acantoleberis curvirostris cladoceran 250 3.7 33.2 Bossuyt et al. 2005
15.2 48-h EC50 Acroperus elongatus cladoceran 250 4 33.2 Bossuyt et al. 2005 17.1 48-h EC50 Acroperus elongatus cladoceran 250 3.7 33.2 Bossuyt et al. 2005 14.4 48-h EC50 Acroperus harpae cladoceran 250 2.3 33.2 Bossuyt et al. 2005 28.2 48-h EC50 Alona quadrangularis cladoceran 250 9.8 33.2 Bossuyt et al. 2005 22.7 48-h EC50 Aona sp. cladoceran 250 8.2 33.2 Bossuyt et al. 2005 9.2 48-h EC50 Bosmina longirostris cladoceran 250 3.7 33.2 Bossuyt et al. 2005
19.0 48-h LC50 Ceriodaphnia dubia cladoceran 7.7 52 7.6 Carlson et al. 1986 20.0 48-h LC50 Ceriodaphnia dubia cladoceran 7.5 36 5.3 Carlson et al. 1986 64.0 48-h LC50 Ceriodaphnia dubia cladoceran 7.5 55 8.0 Carlson et al. 1986 90.0 48-h LC50 Ceriodaphnia dubia cladoceran 7.3 82 11.6 Carlson et al. 1986
104

Effect Conc.,
μg Cu l 1-1 Endpoint Species Age (sample
size) pHHardness
mg l-1DOC mg l-1
AWQA -μg l-1 Citation
91.0 48-h LC50 Ceriodaphnia dubia cladoceran 7.5 68 9.7 Carlson et al. 1986 142.0 48-h LC50 Ceriodaphnia dubia cladoceran 7.3 90 12.7 Carlson et al. 1986
12 48-h EC50 Ceriodaphnia pulchella cladoceran 250 10.4 33.2 Bossuyt et al. 2005 16.4 48-h EC50 Ceriodaphnia pulchella cladoceran 250 3.7 33.2 Bossuyt et al. 2005 14.1 48-h EC50 Ceriodaphnia sphaericus cladoceran 250 1.6 33.2 Bossuyt et al. 2005 38 48-h EC50 Ceriodaphnia sphaericus cladoceran 250 2.3 33.2 Bossuyt et al. 2005
13.3 48-h EC50 Ceroidaphnia reticulata cladoceran 250 37.7 33.2 Bossuyt et al. 2005 17.7 48-h EC50 Ceroidaphnia reticulata cladoceran 250 27.5 33.2 Bossuyt et al. 2005 33.4 48-h EC50 Chydorus ovalis cladoceran 250 3.7 33.2 Bossuyt et al. 2005 20.2 48-h EC50 Chydorus sphaericus cladoceran 250 9.8 33.2 Bossuyt et al. 2005 24.8 LC50 Daphnia ambigua cladoceran n=1 50 7.3 Brix et al. 2001 22.6 48-h EC50 Daphnia galeata cladoceran 250 9.8 33.2 Bossuyt et al. 2005 10 48-h EC50 Daphnia lngispina cladoceran 250 8.2 33.2 Bossuyt et al. 2005
9.89 48-h EC50 Daphnia longispina cladoceran 250 37.7 33.2 Bossuyt et al. 2005 11.3 48-h EC50 Daphnia longispina cladoceran 250 1.6 33.2 Bossuyt et al. 2005 11.9 48-h EC50 Daphnia longispina cladoceran 250 27.5 33.2 Bossuyt et al. 2005 18.1 LC50 Daphnia magna cladoceran n=12 50 7.3 Brix et al. 2001 30 48-h EC50 Daphnia magna cladoceran 250 9.8 33.2 Bossuyt et al. 2005
40.6 48-h EC50 Daphnia magna cladoceran 250 10.4 33.2 Bossuyt et al. 2005 53.2 48-h EC50 Daphnia magna cladoceran 250 8.2 33.2 Bossuyt et al. 2005 26.4 LC50 Daphnia parvula cladoceran n=1 50 7.3 Brix et al. 2001 8.8 LC50 Daphnia pulex cladoceran n=2 50 7.3 Brix et al. 2001 9.3 LC50 Daphnia pulicaria cladoceran n=8 50 7.3 Brix et al. 2001
43.3 48-h EC50 Daphnia rostrata cladoceran 250 3.7 33.2 Bossuyt et al. 2005
105
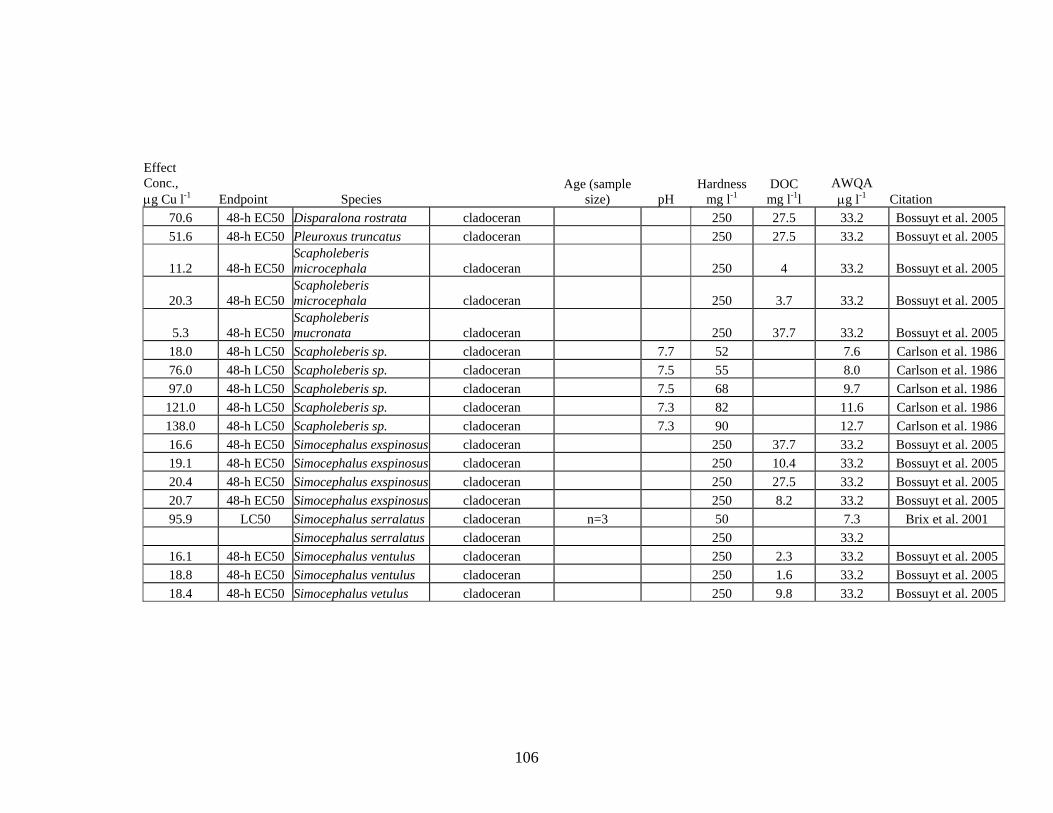
Effect Conc., μg Cu l-1 Endpoint Species
Age (sample size) pH
Hardnessmg l-1
DOC mg l l-1
AWQA μg l-1 Citation
70.6 48-h EC50 Disparalona rostrata cladoceran 250 27.5 33.2 Bossuyt et al. 2005 51.6 48-h EC50 Pleuroxus truncatus cladoceran 250 27.5 33.2 Bossuyt et al. 2005
11.2 48-h EC50 Scapholeberis microcephala cladoceran 250 4 33.2 Bossuyt et al. 2005
20.3 48-h EC50 Scapholeberis microcephala cladoceran 250 3.7 33.2 Bossuyt et al. 2005
5.3 48-h EC50 Scapholeberis mucronata cladoceran 250 37.7 33.2 Bossuyt et al. 2005
18.0 48-h LC50 Scapholeberis sp. cladoceran 7.7 52 7.6 Carlson et al. 1986 76.0 48-h LC50 Scapholeberis sp. cladoceran 7.5 55 8.0 Carlson et al. 1986 97.0 48-h LC50 Scapholeberis sp. cladoceran 7.5 68 9.7 Carlson et al. 1986
121.0 48-h LC50 Scapholeberis sp. cladoceran 7.3 82 11.6 Carlson et al. 1986 138.0 48-h LC50 Scapholeberis sp. cladoceran 7.3 90 12.7 Carlson et al. 1986 16.6 48-h EC50 Simocephalus exspinosus cladoceran 250 37.7 33.2 Bossuyt et al. 2005 19.1 48-h EC50 Simocephalus exspinosus cladoceran 250 10.4 33.2 Bossuyt et al. 2005 20.4 48-h EC50 Simocephalus exspinosus cladoceran 250 27.5 33.2 Bossuyt et al. 2005 20.7 48-h EC50 Simocephalus exspinosus cladoceran 250 8.2 33.2 Bossuyt et al. 2005 95.9 LC50 Simocephalus serralatus cladoceran n=3 50 7.3 Brix et al. 2001
Simocephalus serralatus cladoceran 250 33.2 16.1 48-h EC50 Simocephalus ventulus cladoceran 250 2.3 33.2 Bossuyt et al. 2005 18.8 48-h EC50 Simocephalus ventulus cladoceran 250 1.6 33.2 Bossuyt et al. 2005 18.4 48-h EC50 Simocephalus vetulus cladoceran 250 9.8 33.2 Bossuyt et al. 2005
106

Appendix V. Chronic toxicity values for aquatic invertebrates.
All data from Wang et al. 2007c. AWQ Chronic Criterion, adjusted for hardness from 160 to 180 mg l-1 = 14 to 15.4 μg Cu l-1. Inhibition concentrations at 10% and 25% (IC10 and IC25) of juvenile freshwater
mussels exposed for 28 days. Effect
Concentration, μg Cu l-1
Species common name Endpoint
4.9 Villosa iris rainbow mussel IC10 survival
5.7 Villosa iris rainbow mussel IC10 growth
6.3 Villosa iris rainbow mussel IC25 survival
7.5 Villosa iris rainbow mussel IC25 growth
<3.1 Lampsilis siliquoidea fatmucket IC10 survival
8 Lampsilis siliquoidea fatmucket IC10 growth
6.3 Lampsilis siliquoidea fatmucket IC25 survival
12 Lampsilis siliquoidea fatmucket IC25 growth
<3.1 Epioblasma capsaeformis oyster mussel IC10 survival
7.6 Epioblasma capsaeformis oyster mussel IC10 growth
5.5 Epioblasma capsaeformis oyster mussel IC25 survival
7.6 Epioblasma capsaeformis oyster mussel IC25 growth
107