effects of cougar predation and nutrition on mule deer .../67531/metadc734312/m2/1/high... ·...
TRANSCRIPT

DOE/BP-00006184-1
Effects of Cougar Predation and Nutrition on Mule Deer Population Declines in the
Intermountain Province of the Columbia Basin
July 2002
2001 - 2002Annual Report
This Document should be cited as follows:
Wielgus, Robert, Lisa Shipley, Myers Woodrow, Charlie Robbins, ''Effects of Cougar Predation and Nutrition on Mule Deer Population Declines in the Intermountain Province of the Columbia Basin'', Project No. 2001-03402, 54 electronic pages, (BPA Report DOE/BP-00006184-1)
Field37:
This report was funded by the Bonneville Power Administration (BPA), U.S. Department of Energy, as part of BPA's program to protect, mitigate, and enhance fish and wildlife affected by the development and operation of hydroelectric facilities on the Columbia River and its tributaries. The views in this report are the author's and do not necessarily represent the views of BPA.
Bonneville Power AdministrationP.O. Box 3621Portland, Oregon 97208

BPA & NWPPC 2001-2002 Annual Progress Report
Project 2001-034-00
Effects of Cougar Predation and Nutrition on Mule Deer Population Declines in the
IM Province of the Columbia Basin
Robert Wielgus1, Large Carnivore Conservation Lab, Department of Natural Resource Sciences, Washington State University, Pullman, WA 99164-6410.
Lisa Shipley2, Department of Natural Resource Sciences, Washington State University,
Pullman, WA 99164-6410. Woodrow Myers, Washington Department of Fish and Wildlife, 8702 N Division,
Spokane, WA, 99218. Charlie Robbins, Department of Natural Resource Sciences, Washington State
University, Pullman, WA 99164-6410.
1 Corresponding PI for Part #1 Predation Phone: (509) 335-2796 Fax: (509) 335-7862 Email: [email protected]
2 Corresponding PI for Part #2 Nutrition Phone: (509) 335-9182 Fax: (509) 335-7862 Email: [email protected]

2
2
TABLE OF CONTENTS
Executive Summary Pg 3
PART 1. Effects of Cougar Predation on Mule Deer Population Decline
Abstract Pg 5
Introduction Pg 6
Study Area & Methods Pg 9
Detailed Experimental Methods Pg 10
Annual Work Plan (Aug 2001-Aug 2002) Pg 18
Results (2001-2002) Pg 19
Discussion (2001-2002) Pg 21
Appendix 1 Pg 22
References Pg 23
Figure 1. Pg 28
Figure 2. Pg 29
Figure 3. Pg 30
Table 1. Pg 31
Figure 4. Pg 31
PART 2. Effects of Nutrition on Mule Deer Population Decline
Abstract Pg 32
Introduction Pg 33
Objectives & Methods Pg 37
Annual Work Plan (Aug 2001-Aug 2002) Pg 42
Results & Discussion (2001-2002) Pg 44
Discussion Pg 46
References Pg 47
PART 3. Statement of budget & expenditures Pg 51

3
3
EXECUTIVE SUMMARY
Construction of the Grand Coulee and Chief Joseph dams has resulted in inundation and
loss of 29,125 total habitat units for mule deer and irrigation agriculture in many parts of
the Intermountain Province (IM) of the Columbia Basin. Mule deer in the shrub-steppe
are ranked as high priority target species for mitigation and management and are
declining in most portions of the IM. Reasons for the decline are unknown but believed
to be related to habitat changes resulting from dams and irrigation agriculture. White-
tailed deer are not ranked as target species and are believed to be increasing throughout
the basin in response to habitat changes brought about by the dams and irrigation
agriculture.
Previous research by us in the Northeast IM and adjacent Canadian region suggest that
the increasing white-tailed deer populations are resulting in increased predation by
cougars (apparent competition or alternate prey hypothesis) on mule deer and/or
decreased nutrition of mule deer (food competition hypothesis) (Robinson et al, 2002).
Other factors such as density dependent intraspecific competition, disease, parasites, and
genetic hybridization do not appear to be as important in contributing to the concurrent
mule deer decline and white-tailed deer increase (Wielgus and Robinson 2001). The
apparent competition hypothesis predicts that as alternate prey (white-tailed deer)
densities increase, so do densities of predators, resulting in increased incidental predation
on sympatric native prey (mule deer). The food competition hypothesis predicts that as
competitor density increases, so does nutritional deprivation of native animals, resulting
in decreased reproductive success of mule deer.
We embarked on a 5-year research program to test these hypotheses, beginning in Aug
2001. This report presents progress for year 1 of the 5-year program. The project is
divided into two separate but cooperating units, the predation component (Part #1) and
the nutritional component, (Part #2).

4
4
Project planning, preparation, and set-up took place from Aug 2001 to Dec 2001.
Intensive fieldwork on the predation component (capturing cougars and deer) by 1 Ph.D.
student and 1 agency biologist began in Jan 2002. Extensive fieldwork on the predation
component (radio monitoring of cougars and deer) began in March-May 2002, after 2
M.S. students joined the field crew. Intensive and extensive fieldwork on the nutrition
component (capturing fawns and beginning feeding trials) began in Jan 2002 (free-
ranging deer) and in June 2002 (captive deer) after fawns were born.
We captured and radio-monitored 10 cougars, 30 adult mule deer, and 43 mule deer
fawns to-date in 2002 for cougar aggregative response (# cougars/unit area), cougar
functional response (# kills of deer species/cougar/unit time), cougar numerical response
(# offspring/adult cougar/unit time), mule deer total response (predation & mortality
rates), and deer nutrition and growth. An additional 20 cougars and 35 adult mule deer
will be captured and monitored in winter 2002/2003.

5
5
PART 1. EFFECTS OF COUGAR PREDATION ON MULE DEER POPULATION DECLINE.
ABSTRACT Construction of the Grand Coulee and Chief Joseph dams has resulted in inundation and loss of 29,125 total habitat units for mule deer and irrigation agriculture in many parts the Intermountain Province (IM) of the Columbia Basin. Mule deer in the Shrub-Steppe are ranked high priority target species for mitigation and management and are declining in most portions of the subbasins of the IM. Reasons for the decline are unknown but believed to be related to habitat changes resulting from dams and irrigation agriculture. White-tailed deer are not ranked as target species and are believed to be increasing throughout the basin because of habitat changes brought about by the dams and irrigation agriculture. Recent research (1997-2000) in the NE IM and adjacent Canadian portions of the Columbia Basin (conducted by this author and funded by the Columbia Basin Fish & Wildlife Compensation Program B.C.), suggest that the increasing white-tailed deer populations (because of dams and irrigation agriculture) are resulting in increased predation by cougars on mule deer (apparent competition or alternate prey hypothesis). The apparent competition hypothesis predicts that as alternate prey (white-tailed deer) densities increase, so do densities of predators, resulting in increased incidental predation on sympatric native prey (mule deer). Apparent competition can result in population declines and even extirpation of native prey in some cases. Such a phenomenon may account for declines of mule deer in the IM and throughout arid and semi-arid West where irrigation agriculture is practiced. We will test the apparent competition hypothesis by conducting a controlled, replicated “press” experiment in at least 2 treatment and 2 control areas of the IM subbasins by reducing densities of white-tailed deer and observing any changes in cougar predation on mule deer. Deer densities will be monitored by WADFW personnel using annual aerial surveys and/or other trend indices. Predation rates and population growth rates of deer will be determined using radio telemetry. Changes in cougar functional (kills/unit time), aggregative (cougars/unit area), numerical (offspring/cougar), and total (predation rate) responses on deer will also be monitored using radio telemetry. The experiment will be conducted and completed over a period of 5 years. Results will be used to determine the cause and try to halt the mule deer population declines. Results will also guide deer mitigation and management in the IM and throughout the North American West.
6
6
INTRODUCTION
Construction of the Grand Coulee and Chief Joseph dams has resulted in inundation and loss of 29,125 total habitat units for mule deer and irrigation agriculture in many parts of the Intermountain Province (IM) of the Columbia basin. Mule deer are ranked as a high priority target species for mitigation in Shrub-Steppe habitat types in the Upper Columbia Subbasin because of this loss and because blockage of anadromous fish has shifted tribal subsistence towards mule deer (Fish and Wildlife Program 1995, 2000). Mule deer are the top-ranked large mammal species and are currently declining throughout the Lake Roosevelt (Underwood 2000), Lake Rufus Woods (LeClaire 2000), San Poil River (Jones 2000), and Spokane River (Whalen 2000) Subbasins of the IM. Reasons for the declines in the IM are unknown but believed to be related to anthropogenic habitat disturbances such as irrigation agriculture accompanied by increased alternate prey (white-tailed deer) and subsequent increased predation. This follows the same pattern as observed for mule deer declines throughout the arid and semi-arid western US where habitat changes and predation (mostly by cougars) have been identified as the leading causes of declines (Bleich and Taylor 1998, Crete and Daigle 1999). At the same time, white-tailed deer appear to be stable and/or increasing throughout the subbasins and the arid and semi-arid western US (Crete and Daigle 1999), probably because of increased suitable habitat resulting from the inundation and associated irrigation. Irrigation agriculture has resulted in production of highly digestible forage, increased cover, and water (e.g., alfalpha, clover, and timothy hayfields; vegetable and cereal crops; fruit orchards; hybrid poplar plantations; cottonwood stands; irrigation canals; livestock watering ponds; etc) necessary for whitetails to thrive. White-tailed deer are typically not present in native shrub-steppe and dry Ponderosa pine forests but invade and increase in those arid and semi-arid western regions following irrigation agriculture (Anthony and Smith 1977, Swenson et al. 1983, Wood et al. 1989, Gerlach et al. 1994, McShea et al. 1997, Mackie et al. 1998). These habitat changes and deer species shifts appear to be occurring in the IM.
Concurrent decreases in mule deer and increases in sympatric white-tailed deer
populations appear inexplicable at first, since population growth is believed to be determined by the same environmental stochastic effects for both (Gaillard et al. 1998). Recent research by Robinson and Wielgus (2000) may shed light on the interrelationships between simultaneous increasing white-tailed deer populations and declining mule deer in the IM and elsewhere. The Columbia Basin Fish & Wildlife Compensation Program in British Columbia contracted Wielgus to determine if mule deer were declining and the possible cause of the decline if any. Working in the NE IM and adjacent Canadian portions of the Columbia Basin, Robinson et al. (2002) found that mule deer populations were decreasing at a finite rate of growth of R = 0.88 (declining at 12%/year) from 1997-2000. During the same time, sympatric white-tailed deer were increasing at R = 1.02. White-tailed deer were approximately 3 times as numerous or dense as mule deer in the study area, so intraspecific density dependent effects seemed an unlikely cause for the mule deer decline. Furthermore, both species were reduced far below carrying capacity

7
7
(K) during the severe winter of 1996/97, also suggesting that intraspecific density dependence was not causal.
Interspecific competition, like intraspecific competition, should manifest first and
most strongly in reproduction for these species (Gaillard et al. 1998). Scramble competition should effect reproduction and recruitment for both species equally, and mule deer are dominant in contest competition (Anthony and Smith 1977, Wood et al. 1989). Reproductive rates were very similar for both species, suggesting that interspecific density dependence or competition was not causal. Differences in survival of fawns and adult females were the primary reason for differences in growth rate, and predation by cougars comprised the majority of mortalities. Fawn recruitment to 1 year of age was 56 fawns/100 does for white-tailed deer and 38 fawns/100 does for mule deer. Adult female survival was 0.81 for white-tailed deer and 0.72 for mule deer. Predation accounted for 29% of white-tailed deer mortalities and 56% of mule deer mortalities. These results are consistent with and suggest that apparent competition (or alternate prey hypothesis) may be occurring in the NE IM area and perhaps throughout the IM.
The apparent competition hypothesis (Holt 1977, Holt and Lawton 1994, Holt et
al. 1994, Abrams et al. 1998) predicts that invasion by primary or alternate prey (e.g., white-tailed deer) should result in increased numbers of predators and subsequent increased predation on secondary prey (e.g., mule deer) if 1.) the intrinsic rate of growth of the primary prey is higher than that of the secondary prey and/or if 2.) the predator functional or aggregative responses are different for the 2 species. Both conditions should result in inversely density dependent predation on the secondary prey (Pech et al. 1995, Wehausen 1996, Sweitzer et al. 1997, Sinclair et al. 1998,) and both conditions hold in large mammal predator/prey systems such as moose, wolves, and caribou (Dale et al. 1994, Messier 1994).
“Press” experiments, whereby alternate prey densities are manipulated in a time
series, are the only rigorous means to test for apparent competition (Pech et al.1995, Schimdt and Whelan 1998). One-time “perturbation” experiments (density reduction in a single year) are subject to unknown, confounding, temporal effects. Similarly, a perturbation or press experiment in only 1 geographic location or treatment area is subject to unknown, confounding geographical effects. To our knowledge, a press experiment has never been conducted on North American large mammals. The only large mammal press experiment that I could find was conducted by Corbett (1995) on feral pigs, feral swamp buffalo, and dingos in Australia.
Although not yet experimentally verified using press experiments for large North
American mammals, the apparent competition hypothesis is consistent with moose invasion and caribou declines throughout North America (Bergerud and Elliot 1986, Seip 1992, Messier 1995). More recently, Katnik and Wielgus (2000) proposed apparent competition from white-tailed and cougars as the cause for near extirpation of endangered mountain caribou in NE WA and southern British Columbia. Somewhat surprisingly, no one has considered or proposed the apparent competition hypothesis as a possible explanation for widespread mule deer declines in North America despite apparent
8
8
increases in white-tailed deer and predators (Crete and Daigle 1999). We propose to test the apparent competition hypothesis in the IM Province of the Columbia Basin using controlled and replicated “press” experiments on white-tailed deer to determine if this is causing mule deer population declines in the region.
This proposed project contributes to all of the wildlife goals, objectives, and strategies listed in subbasin summaries for Lake Roosevelt, Lake Rufus Woods, San Poil River, and Spokane River. The main goal in all subbasin plans is to maintain and manage viable populations of native wildlife species to provide harvest opportunities to meet cultural, subsistence, and recreational needs. Failure to halt the current mule deer population declines will certainly fail to achieve this goal since mule deer are the primary harvestable native wildlife species in the IM. At current estimated rates of decline (estimated at 12%/year in the NE IM) mule deer populations will probably be unharvestable within a decade. Robinson and Wielgus (2000), using current mortality and fecundity rates based on radio telemetry and abundances based on aerial population surveys, determined that the estimated current 350 adult females in the south Salmo River region of adjacent B.C. have a 99% probability of declining to less than 30 animals within the next 15 years.
It is not known if the numbers are as dire throughout the entire IM but preliminary
trend data are bad enough to have justified a cooperative (WDFW, Colville Confederated Tribes, Inland Northwest Wildlife Council, and US Forest Service) 5-year, $500,000 mule deer study in the IM to determine rates and causes of decline in the Lake Roosevelt Subbasin (Underwood 2000). This proposal is an integral part of the Cooperative Mule Deer Study and was requested and suggested to us by the WDFW in order to bring in the Columbia Basin Fish and Wildlife Foundation as a partner in our attempt to halt the declines and maintain viable, harvestable populations of mule deer to meet agency and tribal goals.
This proposed project offers the novel approach of being the first rigorous test of
the apparent competition hypothesis in large mammals in North America. Prior to our being invited to submit this proposal by the agencies of the Cooperative Mule Deer Study, the effects of cougar predation were only going to be studied indirectly (examination of mule deer mortalities). Cougars themselves were not going to be radio collared and monitored. Effects of white-tailed deer and the apparent competition hypothesis were not going to be studied at all. Our approach, combined with tests of competing hypotheses (food limitation, reduced reproduction, low recruitment due to coyotes) conducted by the Cooperative Mule Deer Study, will allow an unambiguous test for causation of mule deer population declines in the Columbia basin. Our results could also be used to address causes of widespread mule deer population declines throughout western North America.
This proposed research is an important and integral component of the
Cooperative Mule Deer Study being conducted in the Lake Roosevelt Subbasin by the WDFW, Colville Confederated Tribes, Inland Northwest Wildlife Council, and USFS (Underwood 2000). The Cooperative Mule Deer Study will capture and radio collar mule

9
9
deer to determine habitat use, food habits, food limitation, and population dynamics in the same 2 experimental areas (Kettle Falls and Republic WA) as this study. These 2 areas will provide our experimental replicates, with 1 treatment and control in each area. Our project will examine the cougar and white-tailed deer components. The projects are simultaneous, synergistic, and complimentary, with fieldwork beginning in Jan 2002 and ending in May 2006 (project completion in Aug 2006).
The overall objective of this project and the associated Cooperative Mule Deer Study is to determine the cause(s) of mule deer population declines in the IM and to recover and maintain mule deer in the IM to viable, harvestable numbers. The specific objective of this project is to test the effects of irrigation agriculture and related apparent competition with white tailed deer as a potential cause of the mule deer population declines. The task to accomplish this objective is to conduct research over a 5-year period. The methods to conduct this research follow.
STUDY AREA & METHODS Overall Experimental Approach
The WADFW will capture, radio collar, and monitor approximately 50 adult mule
deer for habitat use, reproduction, and cause-specific mortality in at least 2 replicate study areas of the IM beginning in winter 2001/2002. Both replicate study areas have seen dramatic increases in white-tailed deer following implementation of irrigation agriculture and both have also seen significant decreases in mule deer (Woody Myers, WADFW, pers. comm.). The 2 replicate study areas will be centered on: 1) 4 major mule deer and white-tailed deer winter ranges near Republic WA and 2) 4 major mule deer and white-tailed deer winter ranges near Kettle Falls WA (Fig. 1). Both areas contain a mixture of croplands, shrub-steppe, and forest/shrub and include parts of the Colville National Forest (Fig. 1). The replicate study areas are separated by about 50 km (the cougar maximum home range dimension in NE WA: 30-50 km, Katnik and Wielgus 2000) and are bisected by the Kettle River Mountain Range (elev = approx 7,000 ft). Few, if any cougars are expected to cross from 1 study area to the other because of the distances and elevations involved. Each replicate study area is approximately 2,500 km2, and is based on distribution of the deer winter ranges.
Each 50 * 50 km or 2,500 km2 replicate study area will receive a treatment and
control (Fig. 2). Treatments will be “press” reductions of white-tailed deer densities in 2 of the 4 wintering areas, authorized and facilitated by the WADFW. Treatments will be randomly selected as either the north or south paired wintering areas. Controls will be the adjacent 2 normal, higher density white-tailed deer wintering areas. Treatments will be accomplished by WADFW by implementing a general open season or by other means as necessary (Woody Myers, WADFW, pers. comm.). The target is to reduce treatment white-tailed deer densities in either the north or south treatment areas to about half of that

10
10
in the controls– in order to obtain a large treatment effect. Open seasons will extend until the target is achieved. Treatments will be conducted in years 3 and 4 of the experiment.
The mule deer will be monitored by WADFW and other agents of the
Cooperative Mule Deer Study for mortality, reproduction, recruitment, and density using a combination of weekly aerial telemetry, daily ground telemetry, and seasonal and annual aerial surveys. Details for obtaining estimates of vital rates from telemetry data are given in Wielgus and Bunnell (1994a, 1995, 2000) and Robinson and Wielgus (2000). Details for estimating population growth from vital rates are given in Wielgus (2002), Wielgus et al. (2001), and Robinson et al. (2002). Densities of mule deer and white-tailed deer in treatment and control areas will be determined using seasonal and annual aerial surveys. Details on aerial survey techniques for deer in NE WA are given in Unsworth et al. (1994) and Robinson et al. (2002).
Tests of other competing hypotheses (mule deer habitat use, food habits, food
limitation, and associated low reproduction or low fawn survival due to coyotes) will be conducted by other Principal Investigators (PI’s) in Part 2 of the Cooperative Mule Deer Study. Their research will also be conducted in our 2 replicate study areas (Kettle Falls and Republic WA). Other PI’s include Woody Myers, Wildlife Biologist for WADFW, Spokane WA., and Dr. L. Shipley, Assistant Professor of Wildlife Ecology in the Department of Natural Resource Sciences, Washington State University. Details on their experimental approaches can be obtained in Part 2 of this report. Detail on methods for our test of the apparent competition hypothesis follows. DETAILED EXPERIMENTAL METHODS Experimental Layout Distribution of cougars relative to treatment and controls: We will capture, radio collar, and monitor all resident cougars in each 50 * 50 km (2,500 km2) study area (approximately 15-20 cougars in each replicate study area for a total of about 30-40 cougars) by saturation capturing (Logan et al. 1996, Spreadbury et al. 1996). Each replicate study area is initially expected to hold about 15-20 cougars based on average densities (Ross and Jalkotzy 1992, Spreadbury et al. 1996, Logan et al. 1996). For example: Katnik and Wielgus (2000) captured 21 cougars in a similar 50 * 50 km (2,500 km2) trapping area in NE WA. That is also about the limit that can be monitored effectively in this type of investigation and is consistent with 21 cats captured and collared in my other cougar study area in adjacent NE WA. Those 21 cougars (15 females and 6 males) were captured in the same 2,500 km2 capture area and covered an 8,372 km2 total area. Individual home ranges for cougars in that area averaged 969 km2 for males (about 31 * 31 km) and 731 km2 (about 27* 27 km) for females (Katnik and Wielgus 2000). In other areas (Utah, Idaho, British Columbia, Nevada) male and female cougar home ranges averaged 650 km2 and 371 km2 respectively (Hemker et al. 1984).

11
11
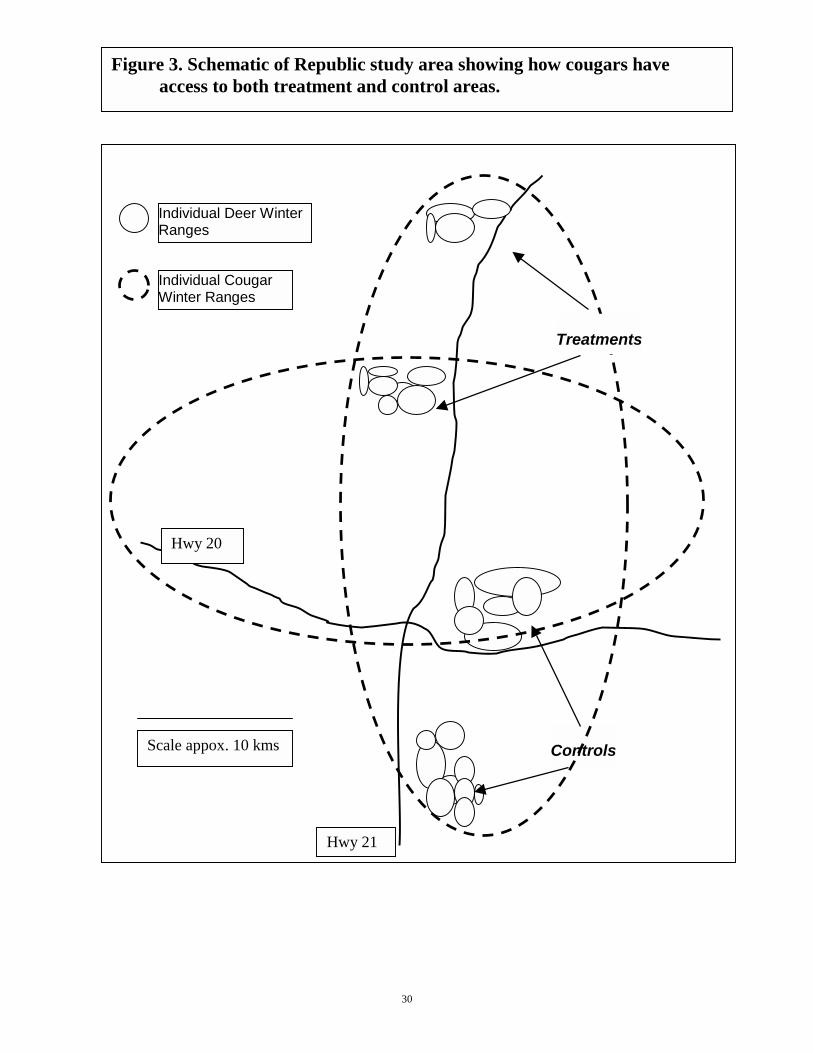
Recent research indicates that cougar density (aggregative response) is primarily determined by prey density, not territorial social behavior, and that cougars will shift their home ranges and habitat use to areas of higher prey density (Pierce et al. 2000). The large individual home ranges and movements to areas of high prey density will ensure that all cougars can sample and shift their habitat use from treatment to control areas at will (see Fig. 3). Distribution of deer relative to treatments and controls:
Mean seasonal (winter, summer) home range size for mule and white-tailed deer is about 2-3 km2 (Tierson et al. 1985, Wood et al. 1989, Kofield 1989). Deer migrate about 20 km between their traditional summer and winter ranges (Tierson et al. 1985, Woody Myers pers comm.). We will capture and radio monitor about 25 adults and 25 fawns in each treatment and control (N = 100). Both white-tailed deer and mule deer exhibit matrilineal clan behavior, family sharing of home ranges, and strong fidelity to the home range. Brown (1992) found that 100% of females and 92% of males used the same seasonal home ranges year after year. The only major opportunity for deer to move from our controls to treatments is via yearling emigration. Hamlin and Mackie (1989), however, found that 84% of yearling females remained in the natal home range as adults. Emigration by females out of the natal home range is rare and occurs mostly only at very high densities (Mackie et al. 1998). Densities in our study areas are nowhere near carrying capacity following the very severe winter and population declines of 1997/1998. Yearling males typically disperse out of the natal area but suffer very high mortality while doing so (Mackie et al. 1998). We do not expect to see significant emigration out of our control areas and immigration into our treatment areas because of these behaviors. Annual “press” reductions in Nov and Dec in treatment areas (after deer have moved to winter ranges) will keep densities down even in the unlikely event of significant immigration. Tests of Hypotheses Five tests or predictions for the apparent competition hypothesis will be conducted on the 1.) predator aggregative response (predators/unit area), 2.) predator functional response (kills/predator/unit time), 3.) predator numerical response (offspring/female predator), 4.) predation rate of mule deer) , and 5.) predator and prey growth rates. These 5 components are all important for understanding the effects of alternate prey (white-tailed deer) density on cougar-mule deer interactions. Cougar Aggregative Response: The apparent competition hypothesis predicts that reduced densities of primary prey (white-tailed deer) will result in a decreased aggregative response by cougars in the treatment areas and a corresponding increased aggregative response in adjacent control areas. Independent experimental units for this test will be both individual cougars (N= 15-20) in each replicate study area and the replicate study areas themselves (N=2).
This test will be accomplished by capturing and radio-monitoring all cougars
within the treatment and control areas (Ross and Jalkotzy 1992, Lindzey et al. 1994, Wielgus and Bunnell 1994a,b, Wielgus et al. 1994, Katnik and Wielgus 2000). Intensive

12
12
capturing and monitoring will be conducted on an annual basis for each of the treatment and control areas. Similar efforts at capturing (e.g., same effort in same location) and monitoring (same effort) will be conducted each year for each treatment and control to ensure that any differences in aggregative response are not an artifact of different capture and monitoring effort. Cougars will be captured using professional guides and their tracking hounds (Hornocker 1970, Ross and Jalkotsey 1992, Lindsey et al. 1994, Katnik and Wielgus 2000).
Individual cougars as experimental units: We will use the methods of Wielgus
and Bunnell (1995, 2000) and Wielgus et al. (2001, 2002), which tested for aggregative responses of individual grizzly bears, to test for differences and changes in individual cougar aggregative response. Wielgus and Bunnell (1995, 2000) and Wielgus et al. (2001, 2002) found that grizzly bears showed a pronounced aggregative response to treatments within 1 year of imposition of treatments. We expect a similar response here. Cougars will be independent experimental units because all cougars used in this test will have independent access to both treatment and control areas within their home ranges. Home ranges and habitat use will be determined using weekly aerial telemetry augmented by ground telemetry if possible. Home range location, size, and habitat use will be determined using program KERNELHR (Seaman et al. 1998). We will monitor any shifts in individual cougar home ranges and habitat use to determine if cougars spend more time in control areas after treatments are imposed. This proportional aggregative response for each cougar will be estimated by summing the number of radiolocations obtained for each cougar in the treatment and controls, calculating the proportion in each, and analyzing the arc-sine transformed proportions with block design factorial ANOVA (Wielgus and Bunnell 1995). Experimental units will be cougars, blocks will be replicate study areas, and factors will be: 1.) treatment and control areas and 2.) years (2 years pre-treatment and 2 years post-treatment). A significant area by year interaction will indicate that aggregative response is affected by the treatment, not just unknown area (geographic) and year (temporal) effects. See Fig. 4 for the conceptual ANOVA design.
A formal power analysis could not be conducted for this test because similar tests
on cougars have never been conducted and we have no estimate of their variance. However, based on work on other species, the sample size of N = 15-20 for each replicate study area (Ntotal = 30-40) should be more than sufficient to test for ecologically significant effect sizes in use of treatments and controls. Wielgus and Bunnell (1995, 2000) using the same method for aggregative response of grizzly bears in 2 replicate study areas detected statistically significant differences in use of treatments and controls at P < 0.01 with N = 18 and N = 13. This sample size (N = 15-20) is also the upper limit for effective monitoring of habitat use or aggregative response for large, wide-ranging carnivores (Wielgus and Bunnell 1995, 2000, Katnik and Wielgus 2000).
Differential habitat use could also be due in part to differences in cougar home
ranges because of territoriality. We will therefore test for individual cougar selection of treatment and control areas, not just differential use of these areas, using type 2 (within study area) and type 3 (within home range) use/availability analyses. This method will compare “used” radio telemetry frequency data vs. “available” frequency data in

13
13
treatments and controls using multivariate log-linear models (Wielgus and Bunnell 1995, 2000, Wielgus et al. 2001, 2002). As with ANOVA models, a significant usage (use vs. availability) by area (treatment area, control area) by year (pre-treatment, post-treatment) interaction indicates that habitat selection is contingent on treatments, not just unknown area (geographic) and year (temporal) effects. As with ANOVA, Wielgus and Bunnell (1995) detected statistically significant results (P < 0.05) using this test for grizzly bears in 2 replicate study areas at N = 18 and N = 13.
Replicate treatment and control areas as experimental units: We will also use
the supplementary methods of Wielgus and Bunnell (2000), which tested for aggregative responses of grizzly bear populations, to test for differences and changes in cougar population aggregative response. In this case, treatments and controls will be independent experimental units. We will sum proportional habitat use frequencies of cougars by year for both the treatments and controls and analyze these frequencies using log-linear models (Wielgus and Bunnell 2000). An area (treatment vs. control) by year (2 yrs pre-treatment vs. 2 yrs post treatment) interaction will indicate that cougar frequencies (aggregative response) are contingent on treatment effects not just unknown differences in either areas or years. Wielgus and Bunnell (2000) obtained statistically significant results (P = 0.03) using this test with N = 23 and N = 27 (Ntotal = 50) in 2 replicate study areas. Relationships between cougar population aggregative response and prey densities will also be examined using regression (I expect 16 predator and prey density values – 4 years in each of 4 treatments and controls). We will regress the annual cougar population aggregative response (total density or sum of individual proportional aggregative responses) against prey density, and test for a slope significantly different from zero. Sample sizes of N = 16 should be adequate to prevent model over fitting and sufficient power (Tabachnick and Fidel 1983).
In both cases (individual cougars and treatment and control areas as experimental
units), potential confounding factors such as removal of resident cougars via sport hunting will be strictly controlled and/or eliminated in the study areas by the WADFW and Colville Confederated Tribes. The effects of sport hunting of cougars on predation of mule deer, caribou, and white-tailed deer is currently being examined by this author in my adjacent NE WA study area (Katnik and Wielgus 2000).
Cougar Functional Response: The apparent competition hypothesis predicts that
reduced densities of primary prey (white-tailed deer) will result in a decreased functional response because of reduced numbers of prey. Changes in prey density are typically immediately reflected in functional response (Caughley and Sinclair 1994). This test will be accomplished by daily radiomonitoring and back-track, snow tracking of focal cougars during the winter period (Hornocker 1970, Ackerman 1986, Ross and Jalkotzey 1992, Nowak 1999). This is the only reliable method known to obtain functional response data for cougars. We will also attempt focal animal sampling during the summer period but this has not been successfully attempted by anyone in the past. The first focal animal will be chosen randomly for snow tracking, and subsequent animals will be chosen systematically based on relative order of capture. This will ensure that all animals are sampled in an unbiased manner. Individual animals will be back-tracked from a recent

14
14
radiolocation point to their previous known radiolocation point (typically 7 days prior) using snowmobiles and skis. All kills for the 7 day span should be discovered via evidence in the snow. Species, sex, and estimated biomass will be determined for each kill. Determination of the winter functional response alone will be adequate to test this hypothesis. Summer functional response cannot likely be obtained because of lack of snow. However, predation rate of mule deer will be obtained on both a seasonal (summer and winter) and annual basis (see predation rate below) rendering lack of summer functional response immaterial to this test. As with aggregative response, experimental units will be individual animals.
Previous research has indicated that cougars average about 1 deer kill every 7-14
days (Hornocker 1970, Ackerman 1986, Beier et al. 1995, Ross and Jalkotzey 1992, Nowak 1999) depending on sex and number of accompanying young. One treatment and 1 matched (same sex and age) control animal will be monitored consecutively until 2 kills are recorded (similar to Ross and Jalkotzey 1992, Nowak 1999). This sampling method will ensure that 1 time series (days between kills or kills/unit time) will be obtained for each focal cougar during each sampling bout. This sequence will then be repeated for subsequent pairs of focal animals until all accessible cougars are monitored.
Tests for differences in functional response (kills/day and/or biomass
consumed/day) between treatments and controls will use repeated measures block design factorial ANOVA with individual animals as experimental units, replicate study areas as blocks, and areas (treatments and controls) and years (2 yrs pre-treatment and 2 yrs post-treatment) as factors. A significant area by year interaction will indicate a significant treatment effect, whereas significant area effects and year effects only would indicate differences between areas and between years. Assuming N = 20 cougars and a minimum functional response of about 1 kill/2 weeks in each replicate study area, we expect about 10 functional response data points for each replicate study area/year during a 20 week winter. This yields 1 functional response per cougar over each 2 year period (pre and post treatment) and assures unbiased, independent data. That yields about N = 80 over the entire 4 year period – a sample size more than adequate to test for ecologically significant effect sizes (see aggregative response above). Other potential confounding factors including sex, age of cougar (experience), number and age of offspring, and Julian date (season) will be controlled for using ANCOVA. For examples of use of ANCOVA to control for confounding factors in large carnivore studies see Wielgus and Bunnell (2000).
Relationships between functional response and prey densities will also be
examined using ANCOVA. For this analysis experimental units will also be individual cougars. One functional response from each cougar (N = 20) for 2 areas (2 areas * 20 animals = 40) for 2 periods (pre and post treatment) = 80 functional responses will be regressed on prey density (16 density points). These data should be independent with respect to the hypothesis being tested (e.g., treatment effects) since cougars can wander at will (e.g., same as aggregative response). Block, year, and areas will be factors because different blocks (e.g., terrain) different areas (e.g., % cover) and different years (e.g.,

15
15
snow depth) could affect and confound the functional response – density will be the covariate.
Cougar Numerical Response: The apparent competition hypothesis predicts that reduced densities of primary prey (white-tailed deer) will result in a decreased numerical response for females in treatment areas because of decreased numbers of prey and functional response. Changes in numerical response followed imposition of treatments within 1-2 years in grizzly bears (Wielgus and Bunnell 1994, 2000, Wielgus et al. 2001, Swenson et al. 1997, 1999). We expect similar and even more rapid responses in cougars because of their shorter birth intervals (1.5 yrs vs. 2-3 yrs). This test will be accomplished by intensive radiomonitoring and snow tracking of females and offspring. Once females remain in and return to a possible birth site (den), the site will be investigated without hounds, or if needed, with younger, unaggressive, and extremely well restrained hounds (to ensure that dogs cannot harm cubs). Production of young will be determined by litter size. Survival of young to 15-18 months (normal age at separation; Ross and Jalotkzy 1992) will be determined by periodic observation of litter size (snow-tracking) and weekly radiotelemetry. Cause of death of offspring will determined by examining the carcass (if possible) and by backtracking from the death site. Even if cause of death cannot be determined these tests of hypotheses can still be conducted, however, the exact mechanism influencing reduced survival of young may have to be inferred rather than documented. Such inferences should not adversely affect the tests of hypotheses (Wielgus and Bunnell 1995, 2000, Wielgus et al. 2001, Swenson et al. 1997, 1999).
Recruitment rate will be the product of neonatal litter size and survival (Akcacaya
1998). Increased neonatal mean litter size can be an artefact of increased mortality of smaller litters (Wielgus unpubl data) so both litter size and survival must be examined together to arrive at recruitment rate. Litter sizes and recruitment rates will be compared between treatments and controls using black design factorial ANOVA – same as for aggregative and functional responses. A significant area by year interaction indicates differences due to treatments not just differences in areas or years. Survival rates will be estimated and compared using programs MICROMORT (Heisey and Fuller 1985) and SURVIVAL (Systat 1997). Possible confounding factors that may influence production, survival, and recruitment of young include age (experience) of mothers and the female numerical response (prey or biomass consumed/unit time). These will be controlled for using ANCOVA (similar to Wielgus and Bunnell 2000). Relationships between recruitment and prey densities will also be examined using ANCOVA – same as for aggregative and functional responses. Wielgus and Bunnell (1994, 2000) obtained statistically significant differences in numerical response (litter size) of grizzly bears after imposition of treatments at P < 0.05 at N = 5 and N = 10. Swenson et al. (1997) obtained statistically significant differences in survival of young after imposition of treatments at P = 0.0004 at Ntotal = 74. Based on the above, sample sizes to test for differences in production and survival of young should be adequate assuming a 50/50 sex ratio and 20 females (N pre-treatment = 20, N post-treatment = 20) and their offspring (20 * 2 offspring each * 2 birth intervals = 80 young).
16
16
Predation Rate of Deer: The apparent competition hypothesis predicts that reduced densities of primary prey (white-tailed deer) should result in reduced predation rate of mule deer. It also predicts that predation rate of mule deer should be density dependent on numbers of white-tailed deer and density independent or inversely density dependent on numbers of mule deer. These tests will be accomplished by intensive radio monitoring of mule deer mortality and by estimating deer numbers and density via aerial surveys in the treatment and control areas. Unlike the 3 previous predator responses, experimental units for these tests will be the 2 treatment areas and the 2 paired control areas. Predation and survival rates will be estimated and compared between treatments and controls using Programs MICROMORT (Heisey and Fuller 1985) and SURVIVAL (SYSTAT 1997).
The sub sample size to estimate predation rate for treatments and controls will be
about 50 adults – the recommended sample size needed for high precision estimates of mortality or survival for 1 year (40-50 animals, Pollock et al 1989). Other researchers successfully tested for yearly changes in mule deer mortality by monitoring 15-43 (McCorquodale (1999) and 20-48 animals (Bleich and Taylor 1998). We conducted a power analysis for the highly conservative binomial Z-test (using Zar 1984 pp399) and found that we need 39 animals to detect a 0.10 effect size difference in survival (from 0.90 to 0.80) for any 1 year at alpha = 0.10 and beta = 0.25. We need 49 animals to detect an effect size of 0.10 difference in survival (from 0.80 to 0.70) for any 1 year at alpha = 0.10 and beta = 0.30.
Using Heisey and Fuller’s (1985) method, we will obtain about 12,410 radio
days/year for each age class (50 animals * 68% annual survival rate * 365 days/yr) based on the estimated annual survival rate of 0.68/year for mule deer in the NE IM (Robinson and Wielgus 2000). That yields about 55,845 radio days (12,410 * 4.5 years) over the 4.5 yearlong study. Robinson and Wielgus (2000) detected effect size differences in survival of 0.32 (from 0.95 to 0.62) at P = 0.011 with sub sample sizes of 19 and 20 deer and 4603 and 7182 radio days) for 1997; and 0.32 (from 1.00 to 0.68) at P = 0.006 with sub sample sizes of 22 and 26 animals and 4741 and 7276 radio days for 1998. They detected a mean annual effect size difference of 0.18 in deer survival (from 0.86 to 0.68) at P = 0.007 with a sample size of 28 and 43 animals or 20,058 and 25,557 radio days for the span 1997-2000. These sub samples are similar to what we expect to obtain in this study and showed statistically significant effects because of the very large effect sizes occurring in the IM region. The proposed sample sizes in this study should be more than adequate to detect ecologically significant changes in survival even at effect sizes of 0.10. Relationships between predation rates and prey densities will also be examined using regression. We will plot the 16 annual predation rates (4 years * 2 treatment areas + 4 years * 2 control areas) against the 16 annual deer densities and conduct a regression analysis to determine if mule deer predation rates are density dependent on white-tailed deer densities and density independent or inversely density dependent on mule deer densities.

17
17
Mule Deer and Cougar Population Growth: Differences in population growth rates and population persistence between treatment and control animals will be analyzed using age/stage matrix models such as ULM Unified Life Models (Wielgus et al. 2001) or RAMAS GIS (Akcakaya 1998, Wielgus 2002).
Time Schedule: Planning and preparation (e.g., obtaining equipment, stakeholder permission, and advertising for & hiring fieldworkers) took place from Aug -Dec 2001. Mule deer and cougars were captured beginning winter 2002. Radio monitoring and snow tracking for aggregative, functional, numerical, and total response began in Jan 2002. During the first 2 years (2002-2003) no treatments will be imposed to allow us to obtain comparative background data on cougar and deer distribution, as well as pre-treatment aggregative, functional, numerical, and total responses. Treatments will be imposed during the 3rd and 4th years. We expect to collect data for a total of 4.5 years, ending on May 1, 2006. The remainder of the fifth year (May-Aug) is for final data analyses and reports. The project is expected to last for a total of 5 years (Aug 2001-Aug 2006).

18
18
ANNUAL WORK PLAN Aug 2001- Aug 2002
PART # 1 (Test of Predation Hypothesis). Determine if cougar predation is limiting mule deer. This goal will be accomplished after completion of the 5 year perturbation experiment. The objectives given below are for year 1 and pertain to obtaining background (control) data for 2 years, prior to imposition of treatments in selected areas in years 3 and 4. Objective 1.1. Determine cougar aggregative response (# cougars/unit area) for year
1. Task 1.1.1. Capture and radiocollar cougars in the treatment and control areas. Task 1.1.2. Radiomonitor cougars using aerial and ground telemetry to determine spatial distributions of cougars in treatment and control areas.
Objective 1.2. Attempt to determine summer cougar functional response (# kills/cougar/unit time) for year 1.
Task 1.2.1. Radiomonitor cougars using aerial and ground telemetry to obtain kill rate data for individual focal animals in treatment and control areas.
Objective 1.3. Determine cougar numerical response (# offspring/female cougar) for year 1.
Task 1.3.1. Radiomonitor female cougars using aerial and ground telemetry and conduct aerial and ground observations to obtain recruitment/reproductive success data for focal animals in treatment and control areas.
Objective 1.4. Determine cougar total response (predation rate) for year 1.
Task 1.4.1. Capture and radiocollar mule deer in the treatment and control areas. Task 1.4.2. Radiomonitor collared mule deer using aerial and ground telemetry to obtain mortality rate in the treatment and control areas. Task 1.4.3. Conduct ground investigations of mortality sites to determine cause of mortality in treatment and control areas.

19
19
RESULTS 2001-2002 PART # 1 (Test of Predation Hypothesis). Determine if cougar predation is limiting mule deer. This goal will be accomplished after completion of the 5-year press experiment. The objectives below are for years 1 and 2 and pertain to obtaining background (control) data for 2 years prior to imposition of treatments in years 3 and 4.
Objective 1.1 Determine cougar aggregative response (number of cougars per unit area).
Task 1.1.1. Saturate capture and radio collar cougars in the treatment and control areas. The methods used for cougar capture follow that first described by Hornocker (1970). Logging roads were searched for tracks when snow conditions permitted. Roads which were not accessible by four-wheel drive were searched with the aid of skidoos, and occasionally by foot. Trained hounds were released on fresh tracks in order to tree the cougars. Once treed, the animals were immobilised using a premixed combination of Ketamine hydrochloride and Xylaxine hydrochloride (CaptureAll 5). The drug was delivered using 1-3 ml aluminium darts fired from Pneudart rifle using a brown charge. Cougars which remained in the trees after being darted were lowered to the ground by a nylon rope fixed around their chest or leg. Occasionally plastic fencing was used to slow the fall of cats that fell during induction. Immobilised cougars were examined to gauge general health, sexed, and aged. Measurements were taken of the animal’s canine regression (for aging), neck girth and total length. Tissue samples, a small biopsy taken from the ear, were taken and frozen for later DNA analysis. Ear tags were placed in both ears of all anaesthetised animals. Cougars were divided into three general age classes (Adult, Sub-adult, and Kitten) by size, colouration, and tooth condition (Shaw, 1987). Adults and sub-adults were fitted with an ATS radio collar with mortality sensor (ATS Inc., Isanti, MN). Accomplishments Working alone, Hugh Robinson (Ph.D. student) captured 10 of an estimated 30 resident animals. They were radio-collared between December 2001 and March 2002 (see appendix 1).

20
20
Task 1.1.2 Radio monitor cougars using aerial and ground telemetry to determine spatial distributions of cougars in treatment and control areas. Aerial telemetry flights were conducted at least once and normally twice per week. All radio-collared cougars were located during these flights. Ground telemetry was conducted on focal animals daily. A minimum of three, and preferably four, converging bearings is needed to produce what is considered an accurate location. Tower locations (the location were the bearing was taken from) and bearings are then input into the program LAOS (Ecological Software Solutions, Sacramento CA). LAOS uses algorithms (Lenth, 1981) to produce the most likely location of the collared animal and an error polygon around that location. The accuracy of telemetry locations is verified by locating test collars, and by walking in on locations where study animals have sat for several days. Accomplishments Intensive aerial and ground telemetry began in March, after Hilary Cruikshank (M.S. student) joined the research crew. As of July 1, 2002, 110 aerial locations and 100 ground locations (total = 210) have been collected.
Objective 1.2 Determine cougar functional response (number of kills / cougar / per unit time).
Task1.2.1 Radio monitor cougars using aerial and ground telemetry to obtain summer kill rate data for individual focal animals in treatment and control areas. Accomplishments Focal animal telemetry (obtaining a location on a single animal every day) began in June, 2002 after Catherine Lambert (M.S. student) joined the research crew. To July 1, 2002 four (1 white-tailed deer, 3 mule deer) kill sites have been found. Snow tracking for winter functional response will begin during the winter of 2002-2003.
Objective 1.3 Determine cougar numerical response (number of offspring / female cougar / per unit time).
Task1.3.1 Radiomonitor female cougars using aerial and ground telemetry and conduct ground investigations to obtain recruitment/reproductive success data for animals in treatment and control areas. Accomplishments Aerial and ground telemetry began in March 2002, after Hilary Cruikshank joined the crew. Of seven females radio collared during the winter of 2001-2002, three were traveling with a total of 7 kittens. Two juveniles have since dispersed. The five females currently traveling alone are located a minimum of twice weekly in order to detect possible den sites.

21
21
Objective 1.4 Determine cougar total response (predation rate).
Task 1.4.1 Capture and radio collar mule deer in the treatment and control areas. Mule deer were captured on winter ranges using helicopter net gunning. Each animal was fitted with a radio transmitter equipped with mortality switch on a 7-hr delay (ATS Inc., Isanti, MN).
Accomplishments Mule deer captures began in winter 2002. To date thirty mule deer have been radio collared as part of the cooperative mule deer project. Five of these have died since being instrumented. Task 1.4.2 Radio monitor collared mule deer using aerial and ground telemetry to obtain mortality rate in treatment and control areas. Accomplishments Since initial marking, radio-marked mule deer have been monitored and located weekly or biweekly by fixed-winged aircraft depending upon weather conditions. Task1.4.3 Conduct ground investigations of mortality sites to determine cause of mortality in treatment and control areas. Accomplishments To date, five deaths of radio-marked mule deer have been investigated; the cause of two deaths was undetermined while three deaths resulted from predation by cougars.
DISCUSSION 2001/2002
The project is off and running. Planning and preparations took place from Aug 15-Dec 31, 2001. Intensive fieldwork began in Jan 2002 when Hugh Robinson (Ph.D. student) began full-time fieldwork. Extensive fieldwork began when he was assisted by 2 new students: Hilary Cruikshank (M.S. student) in March 2002 and Catherine Lambert (M.S. student) in May 2002. The full field crew is now in place and collecting data on aggregative, functional, numerical, and total responses. So far as we know, we are the first researchers to successfully obtain summer functional response data for cougars. With our full complement of field workers (3 students vs. 1 student), and an earlier start (Oct vs. Jan), we anticipate capturing and monitoring the remaining 20 estimated cougars in winter 2002/2003. We also anticipate capturing approximately 30 adult deer again in 2002/2003 for a total of about 60 adult deer – in excess of our required sample size of 50 adult animals.

22
22
Appendix 1 – Capture Summary.
Date Sex Estimated Age
Location Kittens Kitten Estimated
Age
Birth Month
Total Length
(cm)
Neck (cm)
Jan 3/02
F 2yrs Flagstaff Mtn
None N/A N/A
Jan 18/02
M 8yrs Bull Hill
N/A N/A N/A
Feb 1/02
M 2yrs Snag Cove
N/A N/A N/A 205 35
Feb 4/02
F 3yrs Box Canyon
None N/A N/A 32
Feb 6/02
M 1.5 yrs Crown Creek
N/A N/A N/A 220 37
Feb 19/02
F 4yrs Deep Creek
2 <3 Months November 192 32
Feb 22/02
F 3yrs Mineral Mtn 3 5 Months September 207 28
Feb 28/02
F 4yrs Bull Hill
2 18 Months August 179 30
Mar 5/02
F 2yrs Trout Creek
None N/A N/A 194 32.5
Mar 22/02
F 3yrs Jungle Hill
None N/A N/A 198 30

23
23
REFERENCES
Abrams, P.A., R.D. Holt, and J.D. Roth. 1998. Apparent competition or apparent mutualism? Shared predation when populations cycle. Ecology. 79(1): 201-212.
Ackerman B.B., F.G. Lindzey, and T.P. Hemker. 1984. Cougar food habits in southern Utah. Journal of Wildlife Management. 48: 147-155.
Akcakaya, H.R. 1998. RAMAS GIS: Linking Landscape Data with Population Viability Analysis. (version 3.0). Applied Biomathematics, Setauket, NY.
Anthony, R.G., and N.S. Smith. 1977. Ecological relationships between mule deer and white-tailed deer in southeastern Arizona. Ecological Monographs. 47:255-277.
Beier, P., D. Choate, and R. Barrett. 1995. Movement patterns of mountain lions during different behaviors. Journal of Wildlife Management. 76: 1056-1070.
Bergerud, A.T., and J.P. Elliot. 1986. Dynamics of caribou and wolves in northern British Columbia. Canadian Journal of Zoology. 64:1515-1529.
Bleich, V.C., and T.J. Taylor. 1998. Survivorship and cause-specific mortality in five populations of mule deer. Great Basin Naturalist. 58(3):265-272.
Brown, C.G. 1992. Movement and migration patterns of mule deer in southeastern Idaho. Journal of Wildlife Management 56:246-253.
Caughley, G.,.and A.R.E. Sinclair. 1994. Wildlife Ecology and Management. Blackwell Scientific Publications, Boston. 334pp.
Corbett, L. 1995. Does dingo predation or buffalo competition regulate feral pig populations in the Australian wet-dry tropics? An experimental study. Wildlife Research. 22:65-74.
Crete, M., and C. Daigle. 1999. Management of indigenous North American deer at the end of the 20th century in relation to large predators and primary production. Acta Veterinaria Hungarica. 47(1):1-16.
Dale, B.W., L.G. Adams, and R.T. Bowyer. 1994. Functional response of wolves preying on barren-ground caribou in a multiple-prey ecosystem. Journal of Animal Ecology. 63:644-652.
Fish and Wildlife Program. 1995. Section II, Wildlife. Prepared for the Northwest Power Planning Council.
Fish and Wildlife Program. 2000. Draft Fish and Wildlife Program Amendment. Prepared for the Northwest Power Planning Council.
Gaillard, J.M., M. Festa-Bianchet, and N.G. Yoccoz. 1998. Population dynamics of large herbivores: variable recruitment with constant adult survival. Trends in Ecology and Evolution. 13 (2):58-63.
Gerlach, D., S. Atwater, and J. Schnell (eds). 1994. Deer. The Wildlife Series. Stackpole Books, Mechanicsburg, PA. 384pp.
24
24
Hamlin, K.L. and R.J. Mackie. 1989. Mule deer in the Missouri River
Breaks, Montana: a study of population dynamics in a fluctuating environment. Final report, Federal Aid Project W-120-R. Montana Department of Fish, Wildlife, and Parks, Bozeman, Montana. 401pp
Heisey, D. M., and T. K. Fuller. 1985. Evaluation of survival and cause-specific mortality using telemetry data. Journal of Wildlife Management. 49:668-674.
Holt, R.D. 1977. Predation, apparent competition, and the structure of prey communities. Theoretical Population Biology. 12:197-229.
Holt, R.D., and J.H. Lawton. 1994. The ecological consequences of shared natural enemies. Annual Review of Ecology and Systematics. 25:495-520.
Holt, R.D., J. Grover, and D. Tilman. 1994. Simple rules for interspecific dominance in systems with exploitative and apparent competition. American Naturalist. 144(5):741-771.
Hornocker, M.G. 1970. An analysis of mountain lion predation upon mule deer and elk in the Idaho Primitive Area. Wildlife Monographs. 21.
Hemker, T., F. Lindzey, and B. Ackermann. 1984. Population characteristics and movement patterns of cougars in southern Utah. J. Wildl. Manage. 48:1275-1284.
Jones, C. 2000. Draft: San Poil River Subbasib Summary. Prepared for the Northwest Power Planning Council.
Katnik, D., and R.B. Wielgus. 2000. Effects of cougar and forest management on cougar predation of endangered mountain caribou. Progress Report for WADFW. Dept Natural Resource Sciences, Washington State University, Pullman, WA.
Kufeld, R.C., D.C. Bowden, and D.L. Schrupp. 1989. Distribution and movements of female mule deer in the Rocky Mountain foothills. Journal of Wildlife Management 53: 871-877.
LeClaire, R. 2000. Draft: Lake Rufus Woods Subbasin Summary. Prepared for Northwest Power Planning Council.
Lenth, R.V. 1981. On finding the source of a signal. Technometrics 23:149-154.
Lindzey, F.G., W.D. Van Sickle, B.B. Ackerman, D. Barnhurst, T.P. Hemker, and S.P. Laing. 1994. Cougar population dynamics in southern Utah. Journal of Wildlife Management. 58: 619-624.
Logan, K.A., L. Sweanor, T. Ruth, and G. Hornocker. 1996. Cougars of the San Andres Mountains, New Mexico. Final Report, Federal Aid in Wildlife Restoration Project W-128-R. New Mexico Department of Game and Fish.
Mackie, R.J., D.F. Pac, K.L. Mamlin, and G.L. Dusek. 1998. Ecology and management of mule deer and white-tailed deer in Montana. Montana Department of Fish, Wildlife & Parks. Helena, Mont. Federal Aid Project W-120-R. 180pp.

25
25
McCorquodale, S.M. 1999. Movements, survival, and mortality of black-
tailed deer in the Klickitat basin of Washington. Journal of Wildlife Management 63:861-871.
McShea, W.J., H.B. Underwood, and J.H. Rappole. (eds). 1997. The science of overabundance: deer ecology and population management. Smithsonian Institution Press, Washington, DC. 402pp.
Messier, F. 1994. Ungulate population models with predation: a case study with the North American moose. Ecology. 75(2):478-488.
Messier, F. 1995. Trophic interactions in two northern wolf-ungulate systems. Wildlife Research. 22:131-146.
Nowak, M.C. 1999. Predation rates and foraging ecology of adult female mountain lions in northeastern Oregon. M.Sc. Thesis. Washington State University, Pullman, WA.75pp.
Pech, R.P., A.R.E. Sinclair, and A.E. Newsome. 1995. Predation models for primary and secondary prey species. Wildlife Research. 22:55-64.
Pierce, B.M., V.C. Bleich, and R.T. Bowyer. 2000. Social organization of mountain lions: does a land-tenure system regulate population size? Ecology. 81:1533-1543.
Pollock, K.H., S.R. Winterstein, C.M. Bunck, P.D. Curtis. 1989. Survival analysis in telemetry studies: the staggered entry design. Journal of Wildlife Management 53:7-15.
Robinson, H., and R.B. Wielgus. 2000. A model for mule deer recovery in southern British Columbia. Progress Report for Columbia Basin Fish & Wildlife Compensation Program. Dept. Natural Resource Sciences, Washington State University, Pullman, WA.
Robinson, H.S., R.B. Wielgus, and J.C. Gwilliam. 2002. Cougar predation and population growth of sympatric mule deer and white-tailed deer. Canadian Journal of Zoology. 80 (3): 556-568.
Ross, P.I., and M.G. Jalkotzey. 1992. Characteristics of a hunted population of cougars in southwestern Alberta. Journal of Wildlife Management. 56: 417-426.
Schmidt, K.A., and C.J. Whelan. 1998. Predator-mediated interactions between and within guilds of nesting songbirds: experimental and observational evidence. American Naturalist. 152(3): 393-402.
Seaman, D.E., B. Griffith, and R.A. Powell. 1998. KERNELHR: a program for estimating animal home ranges. Wildlife Society Bulletin. 26: 95-100.
Seip, D.R. 1992. Factors limiting woodland caribou populations and their interrelationships with wolves and moose in southeastern British Columbia. Canadian Journal of Zoology. 70:1494-1503.
Shaw, H.G. 1987. Mountain Lion Field Guide. Third Edition. Arizona Game and Fish Department. Special Report 9. 47pp.
26
26
Sinclair, A.R.E., R.P. Pech, C.R. Dickman, D. Hik, P. Mahon, and A.E.
Newsome. 1998. Predicting effects of predation on conservation of endangered prey. Conservation Biology. 12: 564-575.
Spreadbury, B., K. Musil, J. Musil, C. Kaisner, J. Kovak. 1996. Cougar Population Characteristics in Southeastern British Columbia. J. Wildl. Manage. 60: 962-969.
Sweitzer, R.A., S.H. Jenkins, and J. Berger. 1997. Near-extinction of porcupines by mountain lions and consequences of ecosystem change in the Great Basin Desert. Conservation Biology. 11:1407-1417.
Swenson, J.E., S.J. Knappp, and H.J. Wentland. 1983. Winter distribution and habitat use by mule deer and white-tailed deer in southeastern Montana. Prairie Naturalist. 15:97-112.
Swenson, J. E., F. Sandegren, A. Soderberg, A. Bjarvall, R. Franzen, and P. Wabakken. 1997. Infanticide caused by hunting of male bears. Nature. 386:450-451.
Swenson, J. E., F. Sandgren, P. Segerstrom, and S. Brunberg. 1999. Factors associated with loss of brown bear cubs in Sweden. Ursus 1. In Press.
Systat, 1997. SYSTAT 7.0 New Statistics. SPSS Inc., Chicago, ILL. Tabachnick, B.G., and L.S. Fidell. 1983. Using multivariate Statistics.
Harper and Row Publishers, New York, New York. 509pp. Tierson, W.C., G.F. Mattfeld, R.W. Sage Jr., and D.F. Behrend. 1985.
Seasonal movements and home ranges of white-tailed deer in the Adirondacks. Journal of Wildlife Management 49:760-769.
Underwood, K. 2000. Draft: Lake Roosevelt Subbasin summary. Prepared for Northwest Power Planning Council.
Unsworth, J.W., F.L. Leban, D.J. Leptich, E. Garton, and P. Zager. 1994. Aerial survey: user’s manual with practical tips for designing and conducting aerial big game surveys, second edition. Idaho Department of Fish and Game, Boise, Idaho.
Unsworth, J.W., D.F. Pac, G.C. White, and R.M. Bartman. 1999. Mule deer survival in Colorado, Idaho, and Montana. Journal of Wildlife Management. 63:315-326.
Warren, R.J. 1997. The challenge of deer overabundance in the 21st century. Wildlife Society Bulletin. 25:213-214.
Wehausen, J.D. 1996. Effects of mountain lion predation on bighorn sheep in the Sierra Nevada and Granite Mountains of California. Wildlife Society Bulletin. 24(3): 471-479.
Whelan, J. 2000. Draft: Spokane River Subbasin Summary. Prepared for the Northwest Power Planning Council.
Wielgus, R.B. 2002. Minimum viable population and reserve sizes for naturally regulated grizzly bears in British Columbia. Biological Conservation. 106: 381-388.

27
27
Wielgus, R. B. and F. L. Bunnell. 1994a. Dynamics of a small, hunted
brown bear Ursus arctos population in southwestern Alberta, Canada. Biological Conservation. 67:161-166.
Wielgus, R. B., and F. L. Bunnell. 1994b. Sexual segregation and female grizzly bear avoidance of males. Journal of Wildlife Management. 58:405-413.
Wielgus, R. B., and F. L. Bunnell. 1995. Tests of hypotheses of sexual segregation in grizzly bears. Journal of Wildlife Management. 59:552-560.
Wielgus, R.B., and F.L. Bunnell. 2000. Possible negative effects of adult male mortality on female grizzly bear reproduction. Biological Conservation. 93:145-154
Wielgus, R.B., and H.S. Robinson. 2001. An examination of compensatory, additive, and depensatory mortality on mule deer population growth and regulation. Washington Dept. Fish and Wildlife, Olympia, WA. 21pp.
Wielgus, R. B., Bunnell, F. L., Wakkinen, W. L., and Zager, P. E. 1994. Population dynamics of Selkirk Mountain grizzly bears. Journal of Wildlife Management. 58:266-272.
Wielgus, R.B., F. Sarrazin, R. Ferriere, and J. Clobert. 2001. Estimating effects of adult male mortality on grizzly bear population growth and persistence using matrix models. Biological Conservation.98: 293-303.
Wielgus, R.B., P. Vernier, and T. Schivatcheva. 2002. Grizzly bear use of open, closed, and restricted forestry roads. Canadian Journal of Forest Research. (In Press).
Wood, A.K., R.J. Mackie, and K.L. Hamlin. 1989. Ecology of sympatric populations of mule deer and white-tailed deer in a prairie environment. Montana Department of Fish, Wildlife & Parks. 98pp.
Zar, J.H. Biostatistical Analysis. Second Edition. Prentice Hall, Englewood Cliffs, New Jersey. 718pp.

28
28
Figure 1. Study Area: showing four winter ranges in each of two replicate sites.
Kettle Falls
Republic
Spokane
Colville Reservation
Scale Approx. 50 kms

29
29
Figure 2. Study Area: showing treatment and control areas.
Treatment
Treatment
Control
Control
Scale Approx. 50 kms
30
Figure 3. Schematic of Republic study area showing how cougars have access to both treatment and control areas.
Controls
Individual Deer Winter Ranges
Individual Cougar Winter Ranges
Hwy 20
Treatments
Scale appox. 10 kms
Hwy 21
30

31
31
Table 1. Hypothesized aggregative response (mean % radiolocations) of cougars in deer treatment and control areas.
Year Block Area 2002 (pre-treatment)
2003 (pre-treatment)
2004 (treatment)
2005 (treatment)
Treatment 70 81 40 29 Republic Control 43 56 75 82 Treatment 34 22 20 10 Kettle Falls Control 68 52 71 66
Figure 4. Hypothesized aggregative response (mean % radiolocations) of cougars in deer
treatment and control areas of Republic Block.
0
20
40
60
80
100
RepublicTreatment
RepublicControl
RepublicTreatment
70 81 40 29
RepublicControl
43 56 75 82
2002 2003 2004 2005

32
32
PART 2. EFFECTS OF NUTRITION ON MULE DEER POPULATION DECLINE
ABSTRACT Mule deer (Odocoileus hemionus), a high priority ranked target species for mitigation and management, have been declining in most, if not all, subbasins within the Intermountain Province (IM) and adjacent Provinces/subbasins located in Northeast Washington. Reasons for the decline are unknown but believed to be related to both short and long term changes in habitat quality, recreational/subsistence harvest, and increased levels of predation. We are proposing a cooperative, five-year research investigation involving the Washington Department of Fish and Wildlife (WDFW), the lead agency, and Washington State University (WSU), a collaborating agency, to assess the role of habitat in maintaining mule deer numbers. Our approach concentrates on measuring the effects of differing quality in seasonal forage upon physical condition and reproductive performance of adult female mule deer. The approach is two-fold, incorporating both laboratory and field investigations. Laboratory studies will to be conducted at WSU under the direction of Dr. L. Shipley and Dr. C. Robbins using captive mule deer in feeding trial experiments. Lab experiments will address the effects of digestible energy intake and body fat composition on lactation, fawn growth, and estrus. Experimental data will be used to develop quantitative body condition and reproductive indices for mule deer that may be applied in the field to assess body condition on live, free-ranging mule deer. Field studies within IM will focus on measuring mule deer forage quality and preferences, assessing range conditions, and determining the relationships between lab derived physical condition indices, mule deer range condition, deer recruitment and survival, mortality factors, and influences of competing sympatric ungulates at the landscape level. Results will be used by wildlife managers to develop field techniques to assess the physical condition and reproductive performance of mule deer, identify both landscape and project scale management treatments/actions to enhance forage quality, increase mule deer reproductive potential and winter survival, and reverse habitat related declines in mule deer numbers within the IM and adjacent Provinces/subbasins. In addition, research data will be used to validate and/or modify existing Habitat Evaluation Procedures (HEP) mule deer models. Results should be applicable to mule deer mitigation and management throughout the North American West.

33
33
INTRODUCTION Survey and trend information shows that mule deer numbers are declining in the IM province and adjacent provinces and subbasins (Colville Confederate Tribes, WDFW unpublished file data). Reasons for the decline are unknown; however, habitat alteration or loss, poor nutrition, excessive harvests by recreational and subsistence hunters, competition with white-tailed deer and other sympatric ungulates, and predation have been hypothesized as probable direct or indirect causes for downward trends in mule deer numbers. These factors have been associated with declines in mule deer numbers across its range (Anderson et al.1972, Bartmann 1984, Hamlin et al. 1984, Whittaker and Lindzey 1999, Unsworth 1999). Construction and associated development of the Grand Coulee and Chief Joseph dams resulted in inundation and loss of 29,125 total habitat units for mule deer in the Intermountain Province (IM) of the Columbia basin. Mule deer have been ranked as a high priority target species for mitigation in Shrub-Steppe habitat types in the Upper Columbia Subbasin as a result of this loss; consequently, the blockage of anadromous fish due to dam construction has shifted tribal subsistence towards mule deer (Fish and Wildlife Program 1995). Mule deer are the top-ranked large mammal species and are currently declining throughout the Lake Roosevelt (Underwood 2000), Lake Rufus Woods (LeClaire 2000), San Poil River (Jones 2000), and Spokane River (Whalen 2000) Subbasins of the IM. A review of aerial survey results to assess age and sex ratios of mule deer herds in early and mid winter within IM show variable yet declining doe:fawn and adult:fawn ratios, suggesting declining productivity. Maintaining healthy recruitment of juveniles into adult age classes is the foundation for stable or increasing population levels. Low productivity in deer herds may be linked to poor habitat quality that is manifested as unsatisfactory body condition of does directly resulting from low nutrition. Nutrition is one of the key factors influencing productivity of deer populations (Verme 1967, McCullough 1979) because it affects the proportion of females that become pregnant and ovulation rates (Sadleir 1987, Folk and Klimstra 1991). These effects are well documented for free-ranging (Morton and Cheatum 1946, Julander et al. 1961, Kucera 1988) and captive deer (Verme 1965, 1967, Ozoga and Verme 1982). Research has consistently shown that deer on good quality ranges have higher rates of ovulation, conception, and pregancy than deer on poor ranges. Therefore, nutritionally-induced hormonal changes may contribute to declining productivity in mule deer populations. An understanding of the relationships between body condition and reproductive performance of wild ungulate populations is necessary for their management (Saltz et al. 1992). Therefore, a high priority in any deer herd where fawn production is suboptimal should be to evaluate the physical condition of females during breeding and pregnancy (Connolly 1981, Saltz et al. 1992, Taylor 1996). The quantity of nutritious forages is most likely to affect ungulates both in the summer and early fall; this a time when lactating females must provide for growing young as well as maintain fat reserves for estrus and conception in the late autumn. Likewise, the
34
34
effects of summer and early fall forage quality can occur in the winter, when low fat reserves can result in late winter mortality. Winter malnutrition can periodically reduce survival of animals of all ages. However, northern ungulates can compensate for mass lost over winter by increasing summer food intake. The magnitude of this response is inversely proportional to body mass at the end of winter (Ouvellet et al. 1997). The nutrition of summer and fall ranges influence the likelihood that lactating females will come into estrus and breed the following fall. Poor nutrition can adversely affect hypothalamic-pituitary function (Day et al. 1986, Armstrong and Britt 1987, Cupps 1991). The influence continues by affecting the weights of fawns/calves and thus their survival and future breeding success, because forage must support both lactation and replenishment of maternal reserves (Russel et al. 1998, Post and Klein 1999). The effects of summer and autumn body condition of lactating female ungulates has been studied most thoroughly in caribou (Rangifer tarandus). Maternal reserves are lowest 3 weeks after calving and highest in autumn, and the probability of pregnancy and parturition was strongly correlated with body fat and body mass in autumn (Cameron et al. 1993, Gerhart et al. 1996, Russel et al. 1998). Those female caribou that extended lactation were more commonly not pregnant or bred later, and low body fat reserves increased the probability of terminating pregnancy shortly after breeding (Russel et al. 1998). Only lactating caribou demonstrated early embryonic mortalities, and even relatively small changes in maternal body condition seemed to affect pregnancy rates, especially among lactating animals. Therefore, the probability of successful pregnancy largely determined at breeding is based on autumn condition (Cameron et al. 1993). Summer and autumn nutrition also affect the growth and survival of young. In caribou, calf growth during the first summer determines adult size, overwinter survival, age at first reproduction, and potential reproductive success (Gerhart et al. 1996). Body condition of lactating females in autumn correlate well with calving rates in other ungulates as well, including elk (Cervus elaphus) (Cook 2000), moose (Alces alces) (Testa and Adams 1998) and muskoxen (Ovibos moschatus) (White et al. 1997). Lactating muskoxen must gain weight and fat in late summer and early winter for annual ovulation and conception (White et al. 1989). Although studies directly linking autumn body condition in lactating female mule deer with reproduction are scarce, early field studies also suggested that successful reproduction, especially rate of ovulation, strongly affected by level of nutrition of does just prior to rut (Longhurst et al. 1952, Julander et al. 1961). Pederson and Harper (1978) found that the nutritional quality and quantity within summer ranges accounted for a 38% higher population growth among two mule deer ranges in Utah which had similar nutritional capacity of winter ranges, disease, parasite, and predation rates. Understanding body composition of individual animals is fundamental to establishing relationships between populations of wild ruminants and their habitats. Body composition measurements are necessary for predicting pregnancy rates, fawn survival and growth, and overwinter survival. Body fat is the component most often associated with animal condition and can be used to index animal response to nutritional and climatic stressors (Robbins et al. 1974, Torbit et al. 1985a). Body fat is responsible for most overwinter

35
35
body mass loss, but 1/3 of body protein can also be metabolized (Gerhart 1996). Although, measuring total body fat from homogenized carcasses of large mammals is the most accurate way to measure body condition, it is also expensive, tedious, time consuming, and can only be completed on dead animals (Torbit 1985b, 1988). Therefore, a variety of indices have been developed to estimate body condition. The best indices measure body condition rather than short-term nutrition, are adequately reliable and practical for routine applications by game managers in field condition, and are sufficiently sensitive and consistent for a wide range of body condition (Hobbs 1987, Cook 2000). Weight change has been historically used as an index and body weight has been shown to be a reasonable index of body condition related to reproductive performance (Cameron et al. 1993). However, these measures cannot account for different frame sizes and differential loss of protein and fat. Various fat indices have been developed to estimate body condition, including bone marrow fat (Cheatum 1949, Riney 1955, Ransom 1965, 1967), kidney fat (Riney 1955, Ransom 1965,67, Batcheler and Clark 1970, Van Vuren and Coblentz 1985, Torbit et al. 1988), and visual scoring methods (Ransom 1965, Kistner 1976). Torbit et al. (1988) found that transformed kidney fat index correlated best with total body fat in mule deer. However, tracking body fat composition in live animals requires other specialized techniques. Torbit et al. (1985b) found that in vivo by dilution of tritiated water into the total body water pool was highly correlated with total body fat in mule deer. This method, however requires at least 2 contacts with the animal—one for injection and one for collection of a urine or blood sample. Stephenson et al. (1998) developed a method for using ultrasonography for determining maximum rump fat thickness in moose, which correlated with total body fat. Testa and Adams (1998) were able to use this method to examine relationships between body condition and reproduction in moose, but may not be effective after rump fat disappears (Cook 2000) . This method has the advantage of allowing a skilled technician to also assess reproductive status simultaneously (Stephenson et al. 1995, Testa and Adams 1998). Bioelectric impedance has been used successfully to estimate fat levels of live black and grizzly bears (Hildebrand et al. 1998). Equipment for this analysis is relatively inexpensive and would be potentially useful for predicting body fat composition in mule deer, although Cook (2000) was unable to achieve consistent readings for elk. Body condition scoring, a visual method for assessing body condition in livestock, has the potential for subjectivity, but Cook (2000) showed high correlation with body fat composition over the entire range of body condition in elk. Although serum is often collected when managers handle elk and many serum metabolites have been examined for their relationship with body condition, few measures show consistent relationships (Cook 2000). Repeated capture, restraint and blood sampling is generally impractical for monitoring reproductive status in wildlife species, therefore noninvasive methods for tracking reproductive activity have become increasingly important (Monfort et al. 1993). Fecal and urinary steroids are now routinely used to assess reproductive status in captive and free-ranging wildlife. Monfort et al. (1993) used radio-immunoassays to detect fecal progesterone in moose. This technique has been applied to a wide range of animal

36
36
species, including elk (Cook 2000). Detailed information on reproductive status has been obtained by real-time B-mode ultrasonography in ungulates such as mule deer (Smith and Lindzey 1982) and moose (Stephenson et al. 1995, Testa and Adams 1998.) Ultrasonography requires neither surgical skills nor removal of animals. This technique is relatively easy to use so that a large number of mule deer could be examined (Smith and Lindzey 1982). When blood is being collected for other analyses, blood serum assay for pregnancy, specific protein B and progesterone can also be used (Haigh et al. 1993, Stephenson et al. 1995). Wildlife managers need a way to quickly and safely assess body composition and reproduction in field, and be able to interpret indices as to its affect on reproduction. The intent of this research investigation, in part, is to develop such a field methodology. Our proposed project would contribute to the wildlife goals, objectives, and strategies identified in the subbasin summaries for Lake Roosevelt, Lake Rufus Woods, San Poil River, and Spokane River. The primary goal stated in all subbasin plans is to maintain and manage viable populations of native wildlife species, with mule deer identified specifically, and to provide harvest opportunities to meet cultural, subsistence, and recreational needs. With mule deer numbers in decline throughout IM (CCT, WDFW unpublished file data), failure to reverse these population trends would certainly result in failure to achieve goals for mule deer as a the primary harvestable native wildlife species in the IM. Concern over mule deer declines in IM resulted in initiation of a cooperative (WDFW, Colville Confederated Tribes, Inland Northwest Wildlife Council, US Forest Service and others) 5-year mule deer study in February 20000 to determine rates and causes of decline in the Lake Roosevelt Subbasin (Underwood 2000). This proposal would provide additional data to assist in identifying causes of and, subsequently, reverse declines in mule deer numbers. The Columbia Basin Fish and Wildlife Foundation would become a partner in our attempt to halt the declines and maintain viable, harvestable populations of mule deer to meet agency and tribal goals. This project will become an integral part the WDFW lead Cooperative Mule Deer Project (CMDP) which was initiated in January 2000. The CMPD is composed of numerous cooperating groups and agencies including The Colville Confederate Tribes, Chelan County PUD, the Colville, Okanogan, and Wenatchee National Forests, Washington State Department of Natural Resources, the Inland Northwest Wildlife Council, the Northern Okanogan Sports Council, the Inland Empire Chapter of the Safari Club International, the University of Washington, Washington State University, and the University of Idaho.

37
37
OBJECTIVES & METHODS Objective 1: Determine the effects of digestible energy intake and body fat composition
on lactation, calf growth, and estrus in mule deer by December 2005.
Task 1: Develop experimental diets that mimic the range of nutrition available to free-ranging mule deer for use in feeding trials
Methods: Three pellet diets will be developed to simulate high, medium, and low digestible energy (DE) content of summer and fall mule deer range forage within the Columbia Plateau in Northeastern Washington. The high-quality diet will be designed so as not to limit performance by fawns and does based on predictions from the livestock literature (National Research Council 1984, 1985). The lowest-quality diet will mimic the lowest level of nutrition encountered by mule deer in the study area during summer and fall. The medium level will reflect the minimum required by a lactating mule deer. To design these diets, fecal samples collected from free-ranging mule deer in the study area during early summer, late summer, and fall in Year 1 will be analyzed to determine seasonal diet composition. Microhistological analyses of feces will be conducted at the Wildlife Habitat Lab at Washington State University. To determine the forage quality of dietary components, forage samples will be collected and analyzed, by season, for crude protein content (Kjeldahl analysis), fiber composition (Neutral Detergent Fiber analysis), and in vitro digestibility. Samples will be analyzed at the Wildlife Habitat Lab (Association of Agricultural Chemists 1984). Based on similar studies with elk in the Blue Mountains in Oregon, these diets will most likely span the range of 2.3 – 3 kcal/g digestible energy ( Cook 2000). Study pellet diets will be developed at the Feed Mill at WSU. During Year 2, actual in vivo digestibility will be determined by conducting a 5 day complete balance digestion trial for each diet using 5 captive female mule deer. Before the trial, animals will be gradually introduced to the diet over 2 weeks, and experience a 5 day pretrial in the digestion crates. During the trial, food offered and remaining will be weighed and corrected for dry matter. Feces and urine will be collected. Food, feces, and urine will be analyzed for energy (bomb calorimetery) and protein (Kjeldahl analysis) at the Wildlife Habitat Lab (Association of Agricultural Chemists 1984). Digestible energy digestibility will be calculated as in Robbins (1993).
Task 2: Conduct summer-fall feeding trials with lactating females and fawns Methods: We will acquire 50 fawns (at least 45 females and 5 males) during Year 1 of the project by directly capturing them on the study site and by collecting orphans routinely acquired by wildlife rehabilitators and agencies in the area. These fawns will be hand-reared and trained to experimental protocol. These animals will be bred during their second fall. In Year 3, we will select 30 doe/fawn pairs to participate in the feeding trials. Doe/fawn pairs will be randomly assigned a feeding treatment (10 each for high, medium, or low DE intake based on the diets created in Task 1). All pairs will be fed on the high DE diet from January through June. Starting in late June (or after all fawns are born), animals in the high-DE group will be fed at the original level. Animals in the

38
38
medium and low-DE treatments will be gradually reduced to their low DE intake diets, reaching a low in October. Treatments will continue through November. Each doe and fawn will be weighed weekly, and body condition assessed bi-monthly using the DEXA unit at WSU Veterinary Teaching Hospital, Bioelectric Impedance Analysis, ultrasound, various condition index scoring systems (Cook 2000), and serum metabolites. Daily intake will be monitored for all animals. Starting in mid-October, fecal samples will be collected weekly, and from November-December they will be collected daily, and analyzed for fecal progestagen, an indicator of estrus using radio-imunoassay (Monfort et al. 1993) at the Center for Reproductive Biology, Hormone Assay Core at WSU. Trials will continue through November, and will repeated in Year 4 of the study with 2-year-old females with fawns. Body condition, doe/fawn weights, lactation duration, and estrus rates and times will be compared among 3 nutritional treatments using analysis of variance and analysis of covariance. Body fat requirements for estrus to occur in lactating females will be calculated. In elk, a body fat content of 6% is required for lactating females to show estrus the following fall ( Cook 2000) We expect a similar result for mule deer does. All protocols will be first approved by WSU’s Institutional Animal Care and Use Committee. Task 3: Disseminate information gathered from experiments.
Methods: Findings will be synthesized and submitted to a peer-reviewed scientific journal in Year 4 and made available to all resource management agencies, tribes, universities, and private citizens through web based electronic mail. Presentations on findings will be made during years 3-5.
Objective 2: Develop quantitative body condition and reproductive indices for mule deer that may be applied in the field to assess body condition on live, free-ranging
animals by December 2005. Task 1: Examine the correlation between common condition indices that may be used on live mule deer with direct measurement of total body fat. Methods: During Year 4, the body fat composition of each animal on the 3 feeding treatments above will be assessed bi-monthly from June through November using 5 noninvasive (or mildly invasive) methods – Bioelectric Impedance Analysis, ultrasound, Dexa unit, serum metabolites, and condition scores. At the end of November, 5 animals in each treatment group representing the greatest range of body condition will be returned to the high quality diet for 7 days. They will then be euthanized, shaved, and ground in the whole body grinder at Colorado State University to determine total body fat. Fat content of the carcass will be determined using petroleum ether extract in a Soxhlet apparatus (Association of Agricultural Chemists 1984) at the Wildlife Habitat Lab at WSU. Body condition estimates from the 5 noninvasive measurements will be correlated with total body fat measurements. Cost, portability, and strength of correlation will be used to develop recommendations for Washington Department of Fish and

39
39
Wildlife for obtaining estimates of body fat composition in live, free-ranging mule deer. All protocols will be first approved by WSU’s Institutional Animal Care and Use Committee (IACUC). Task 2: Develop protocol for using ultrasound to determine pregnancy in mule deer. Methods: Monthly from November through February, we will examine all does exposed to reproductive males using ultrasound to develop methods for assessing pregnancy in mule deer (Smith and Lindzey 1982). We will collect feces and take blood samples to confirm pregnancy in these animals. Task 3: Develop techniques to be used by deer managers and biologists to assess physical condition of mule deer while in the field.
Objective 3: By 2005, assess the habitat quality and potential of seasonal ranges to meet the nutritional needs of lactating female mule deer, influence reproduction, and
provide general seasonal nutrition requirements of mule deer.
Task 1. Determine seasonal forage preferences. Methods: Collect fecal pellets seasonally throughout the study area and analyze to identify common forage species.
Task 2. Determine seasonal variations in protein and digestible energy levels of forage species. Methods: Forage samples collected seasonally and analyzed for crude protein (Kjeldahl analysis), fiber composition (Neutral Detergent Fiber analysis), and in vitro digestibility at the Wildlife Habitat Lab.
Task 3. Apply lab calibrated body condition indices (BCI) to data sets from free-ranging mule deer. Methods: BCI from captive deer will be compared with measurements from free-ranging deer captured for marking, deer collected from scientific purposed, and hunter harvested deer.
Task 4. Determine whether body condition of lactating females is sufficient to allow estrus and conception in subsequent rut.

40
40
Objective 4: Assess relationships between BCI, mule deer recruitment and survival, causes of mortality, habitat condition, and competition with sympatric ungulates at the
landscape level by 2005.
Task 1: Identify mule deer herd/subherd boundaries by radio-telemetry and vegetative features by ground sampling and geographic information system (GIS) analysis within each herd/subherd unit. Task 2: Determine survival rates, mortality factors, and estimate recruitment by radio-telemetry and age and sex composition surveys.
Methods: Estimate survival rates of radio-marked mule deer using staggered entry estimators. Conduct aerial relocation and composition surveys to measure fawn survival and yearling recruitment annually.
Task 3: Assess influences of sympatric ungulates Methods: Identify and map (GIS) ranges sympatric with other ungulates (white-tailed deer, elk, bighorn sheep, and domestic livestock). Measure BCI of mule deer sympatric and allopatric to other ungulates. Use control-treatment designs by reducing white-tailed deer numbers to measure potential competition effects upon mule deer physical condition and reproductive performance.
Task 4: Correlate BCI, survival rates, recruitment and mortality factors of radio-marked mule deer by herd/subherd units and vegetative communities with habitat quality indices and competition with sympatric ungulates.
Task 5: Develop treatments to improve habitat quality where BCI and other population parameters show deficiencies.
Task 6: Test and validate current HEP models developed for mule deer in IM and adjacent provinces and subbasins.
Task 7: Disseminate information. Methods: Findings will be synthesized and submitted to a peer-reviewed scientific journal in Year 5 and made available to all resource management agencies, tribes, universities, and private citizens through web based electronic mail.

41
41
Objective 5: Develop project and landscape level management/land treatments and recommendations, in 2005, that enhance mule deer ranges and increase mule deer
productivity and carrying capacity.
Task 1. Produce management prescriptions and disseminate information through publications, and presentations. Results and prescriptions will be made available to all resource management agencies, tribes, universities, and private citizens through web based electronic mail.

42
42
ANNUAL WORK PLAN Aug 2001-Aug 2002
Determine if nutrition is limiting mule deer populations. This goal will be accomplished after completing 5 years of laboratory and field studies. The objectives given below are for year 1. Objective 1. Determine the effects of digestible energy intake and body fat composition
on lactation, fawn growth, and estrus in mule deer. Task 1. Acquire field data on diet composition of mule deer throughout the study area and quality of forages within the summer range. Collect fecal pellets from within the home ranges of radio-collared mule deer and determine diet composition using microhistological analysis. Collect forage samples from within the home ranges of radio-collared mule deer and analyze them for fiber, energy, and protein content. Task 2. Capture 30-50 neonate mule deer fawns. Bottle raise, imprint, and train to experimental protocol. Prepare for breeding as yearlings in the fall.
Objective 2. Develop quantitative body condition and reproductive indices for mule deer that may be applied in the field to assess body condition on live, free-ranging
animals.
Task 3. Develop techniques to be used by deer managers and biologists to assess physical condition of mule deer in the field by
• Conducting an extensive literature review • Attending training on using current techniques of ultrasound and body
condition scoring. • Purchasing a sonogram suitable for using on deer in the field.
Objective 3. Assess the habitat quality and potential of seasonal ranges to meet the nutritional needs of lactating female mule deer, influence reproduction, and provide
general seasonal nutrition requirements of mule deer.
Task 1. Determine seasonal forage preferences by collecting fecal pellets seasonally throughout the study area and analyze to identify common forage species.
Task 2. Determine seasonal variations in protein and digestible energy levels of forage species by collecting forage samples collected seasonally and analyze for crude protein
43
43
(Kjeldahl analysis), fiber composition (Neutral Detergent Fiber analysis), and in vitro digestibility at the Wildlife Habitat Lab.
Task 3. Apply lab calibrated body condition indices to data sets from free-ranging mule deer
Objective 4. Assess relationships between BCI, mule deer recruitment and survival, causes of mortality, habitat condition, and competition with sympatric ungulates at the
landscape level. Task 1. Identify mule deer herd/subherd boundaries by monitoring radio-marked mule deer. Task 2. Determine survival rates, mortality factors, and estimate recruitment by radio-telemetry and age and sex composition surveys by monitoring radio-marked mule deer.

44
44
RESULTS Objective 1. Determine the effects of digestible energy intake and body fat composition
on lactation, fawn growth, and estrus in mule deer. Task 1. Acquire field data on diet composition of mule deer throughout the study area and quality of forages within the summer range. Collect fecal pellets from within the home ranges of radio-collared mule deer and determine diet composition using microhistological analysis. Collect forage samples from within the home ranges of radio-collared mule deer and analyze them for fiber, energy, and protein content. Accomplishments We collected vegetation samples representing common from or expected mule deer forage from 40 sites within the home ranges of radiocollared mule deer. These samples have been submitted to WSU’s Wildlife Habitat Lab to determine digestible energy and crude protein levels available to mule deer. Results are pending.
Approximately 60 fecal samples have been collected seasonally for microhistological analysis of diet composition from within the home ranges of radio-marked deer within the study area. In addition, approximately 80 fecal samples were collected directly from recaptured radiocollared mule deer in December 2001 and March 2002. These samples were submitted to the Wildlife Habitat Lab at Washington State University for microhistological evaluation, the results are pending. When lab analyses have been completed, these data will be used to formulate diets for nutritional treatments. Task 2. Capture 30-50 neonate mule deer fawns. Bottle raise, imprint, and train to experimental protocol. Prepare for breeding as yearlings in the fall. Accomplishments We captured a total of 73 mule deer fawns using helicopters and ground crews of which 43 fawns (4 males and 39 females) were transported to holding facilities at WSU to become the nucleus of the captive herd. Four additional fawns were acquired from rehabilitators as orphans. Fawns are currently being bottle-raised and trained for experimental protocol. We negotiated with College of Agriculture and Home Economics and WSU to build a new deer barn and pasture facility for this project, which includes automatic gated feeders that will allow animals to be group-housed, yet fed individual diets. This barn facility is under construction.
One Ph.D. student (Rachel Cook) and one M.S. student (Tamara Johnstone-Yellin) have been recruited for this project. Tamara assisted with capturing fawns and bottle-raising

45
45
and training fawns starting in June, 2002. Rachel will begin in Spring 2004 when the deer have matured and are ready for the nutritional experiments.
Objective 2. Develop quantitative body condition and reproductive indices for mule deer that may be applied in the field to assess body condition on live, free-ranging
animals. Task 3. Develop techniques to be used by deer managers and biologists to assess physical condition of mule deer in the field by
• Conducting an extensive literature review • Attending training on using current techniques of ultrasound and body
condition scoring. • Purchasing a sonogram suitable for using on deer in the field.
Accomplishments Eighty radiomarked wild mule deer were recaptured using netguns from helicopters in December 2001 and March 2002. Ultrasound was used to examine fat thickness and pregnancy, and a Body Condition Scoring Index was used to assess subcutaneous fat. Blood samples were taken to confirm pregnancy. Shipley attended workshop on measuring body condition of mule deer using body condition scoring and ultrasound in LaGrande Oregon. Graduate students Rachel Cook and Tamara Johnstone-Yellin have begun extensive literature searches.
Objective 3. Assess the habitat quality and potential of seasonal ranges to meet the nutritional needs of lactating female mule deer, influence reproduction, and provide
general seasonal nutrition requirements of mule deer. Task 1. Determine seasonal forage preferences by collecting fecal pellets seasonally throughout the study area and analyze to identify common forage species. Accomplishments Approximately 60 fecal samples have been collected seasonally for microhistological analysis of diet composition from within the home ranges of radio-marked deer within the study area. In addition, approximately 80 fecal samples were collected directly from recaptured radiocollared mule deer in December 2001 and March 2002. These samples were submitted to the Wildlife Habitat Lab at Washington State University for microhistological evaluation, the results are pending.

46
46
Task 2. Determine seasonal variations in protein and digestible energy levels of forage species by collecting forage samples collected seasonally and analyze for crude protein (Kjeldahl analysis), fiber composition (Neutral Detergent Fiber analysis), and in vitro digestibility at the Wildlife Habitat Lab. Accomplishments We collected vegetation samples representing common from or expected mule deer forage from 40 sites within the home ranges of radiocollared mule deer. These samples have been submitted to WSU’s Wildlife Habitat Lab to determine digestible energy and crude protein levels available to mule deer. Results are pending.
Task 3. Apply lab calibrated body condition indices to data sets from free-ranging mule deer Accomplishments Eighty radiomarked wild mule deer were recaptured using netguns from helicopters in December 2001 and March 2002. Ultrasound was used to examine fat thickness and pregnancy, and a Body Condition Scoring Index was used to assess subcutaneous fat. Blood samples were taken to confirm pregnancy.
DISCUSSION
This project is expected to span 5 years from January 2001, to December 2005. The first year of the project has been devoted to obtaining the research animals, building facilities, acquiring and training personnel, as well collecting preliminary field data on diet composition, habitat quality, and body condition of wild mule deer. We now have one of the largest experimental herds of mule deer in the country. Funding for this project began in August 2001, and fawns are not born until the next May, so most of our work has been focused on the last 3 months of the funding period. We have met our objectives for the first year, and in our second year fawns would be bred and digestion trials conducted to determine the digestibility of experimental diets developed from data collected in year 1. Field studies will continue with wild mule deer and their habitats. Mule deer will be recaptured in December and March, and fecal and plant sampling will continue throughout the year. Years 3 and 4, when mule deer are 2-year-olds, the feeding trials and body condition trials would take place. Field studies will be conducted concurrently with laboratory studies. The final year will be used to complete lab, field and statistical analysis, develop landscape management recommendations, and write and present findings.

47
47
REFERENCES
Anderson, A. E., Bowden, D. C., and Medin, D. E. 1990. Indexing the annual fat cycle in a mule deer population. J. Wildl. Manage. 54: 550-556. Armstrong, J. P., and J. H. Britt. 1987. Nutritionally induced anestrous in gilts: Metabolic and endocrine changes associated with cessation and resumption of estrous cycles. Journal of Animal Science 65:508-523. Association of Agricultural Chemists. 1984. Official methods of analysis. 14th ed. The Association of Official Agricultural Chemists, Inc. Arlington, Virg. Bartmann, R. M. 1984. Estimating mule deer winter mortality in Colorado. J. Wildl. Manage 48: 262-267. Batchelor, C. L., and C. M. H. Clark. 1970. Note on Kidney weights and the kidney fat index. New Zealand Journal of Science 13:663-668. Cameron, R.D., W. T. Smith, S. G. Fancy, K. L. Gerhart, and R. G. White. 1993. Calving success of female caribou in relation to body weight. Canadian Journal of Zoology 71:480-486. Cheatum, E. L. 1949. bone marrow as an index to malnutrition. New York State Conservationist 3:19-22. Connolly, G. E. 1981. Assessing populations. Pages 287-345 in O. C. Wallmo, ed. Mule and black-tailed deer of North America. University of Nebraska Press, Lincoln, Nebr. Cook, R. C. 2000. Studies of body condition and reproductive physiology in Rocky Mountain elk. M. S. Thesis, University of Idaho, Moscow, Id. Cupps, P. T. (ed.) 1991. Reproduction in domestic animals. 4th ed. San Francisco, Calif. Day, M. C., K. Imakawa, D. D. Zalesky, R. J. Kittok, and J. E. Kinder. 1986. Effects of restriction of dietary energy intake during the prepubertal period on secretion of leutenizing hormone and responsiveness of the pituitary to leutenizing hormone-releasing hormone in heifers. Journal of Animal Science 62:1641-1648. Folk, M. J., and W. D. Klimstra. 1991. Reproductive performance of female key deer. Journal of Wildlife Management 55:386-390. Gerhart, K. C., R. G. White, R. D. Cameron, and D. E. Russell. 1996. Body composition and nutrient reserves of arctic caribou. Canadian Journal of Zoology 74:136-146. Haigh, J. C., W. J. Dalton, C. A. Ruder and R. G. Sasser . 1993. Diagnosis of pregnancy in moose using a bovine assay for pregnancy-specific protein B. Theriogenology 40:905-911. Hamlin, K. L., Riley, S. J., Pyrah, D., Dood, A. R., and. Mackie, R. J. 1984. Relationships among mule deer fawn mortality, coyotes, and alternate prey species during summer. J. Wildl. Manage 48: 489-499.

48
48
Hilderbrand G. V., S. D. Farley, and C. T. Robbins. 1998. Predicting body condition of bears via two field methods. Journal of Wildlife Management 62: 406-409. Hobbs, N. T. 1987. Fecal indices to diet quality: A critique. Journal of Wildlife Management 51:317-320. Julander, O., W. L. Robinette, and D. A. Jones. 1961. Relation of summer range condition to mule deer herd productivity. Journal of Wildlife Management 25:54-60. Jones, C. 2000. San Poil River subbasin summary. NW Power Planning Council. CBFWF Rep. 26 pp. Kistner, T. P. 1976. Evaluating physical condition of deer. Oregon Department of Fish and Wildlife, Portland, Ore. Kucera, T. E. 1988. Ecology and population dynamics of mule deer in the eastern Sierra Nevada, California. Ph.D. Dissertation, University of California, Berkeley, Calif. Longhurst, W. M., A. S. Leopold, and R. F. Dasmann. 1952. A survey of California deer herds, their ranges, and management problems. California Department Fish and Game Bulletin No. 6. LeClaire, R. 2000. Lake Rufus Woods subbasin summary. NW Power Planning Council. CBFWF Rep. 28 pp. McCullough, D. R. 1979. The George Reserve deer herd: Population ecology of a K-selected species. University of Michigan Press, Ann Arbor, Michigan. Monfort, S. L., C. C. Schwartz, and S. K. Wasser. 1993. Monitoring reproduction in captive moose using urinary and fecal steroid metabolites. Journal of Wildlife Management 57:400-407. Morton, G. H., and E. L. Cheatum. 1946. Regional difference in breeding potential of white-tailed deer in New York. Journal of Wildlife Management 10:242-248. National Research Council. 1984. Nutrient requirements of sheep. Sixth ed. National Academy Press, Washington D. C. National Research Council. 1985. Nutrient requirements of cattle. Sixth ed. National Academy Press, Washington D. C. Ouvellet, J.-P., D. C. Heard, S. Boutin, and R. Mulders. 1997. A comparison of body condition and reproduction of caribou on two predator-free arctic islands. Canadian Journal of Zoology 75:11-15. Ozoga, J. J., and L. J. Verme. 1982. Physical and reproductive characteristics of a supplementally-fed white-tailed deer herd. Journal of Wildlife Management 46:281-301. Pederson, J. C., and K. T. Harper. 1978. Factors influencing productivity of two mule deer herds in Utah. Journal of Range Management 31:105-110. Post, E., and D. R. Klein. 1999. Caribou calf production and seasonal range quality during a pop decline. Journal of Wildlife Management 63:335-345.

49
49
Ransom, A. B. 1965. Kidney and marrow fat as indicators of white-tailed deer condition. Journal of Wildlife Management 29:397-398. Ransom, A. B. 1967. Reproductive biology of white-tailed deer in Manitoba. Journal of Wildlife Management 31:114-123. Riney, T. 1955. Evaluating condition of free-ranging red deer (Cervus elaphus), with special reference to New Zealand. New Zealand Journal of Science and Technology 36:429-463. Robbins, C. T., A. N. Moen, and J. T. Reid. 1974. Body composition of white-tailed deer. Journal of Animal Science 38:871-876. Robbins, C. T. 1993. Wildlife feeding and nutrition. Academic Press, Orlando, Fla. Russel, D. E., K. L. Gerhart, R. G. White, D. Van de Wetering. 1998. Detection of early pregnancy in caribou: evidence for embryonic mortality. Journal of Wildlife Management 62:1066-1075. Sadleir, R. M. F. S. 1987. Reproduction of female cervids. Pages 123-144 in C. M. Wemmer, ed. Biology and management of the Cervidae. Smithsonian Institution Press, Washington, D. C. Saltz, D., G. C. White, and R. M. Bartmann. 1992. Urinary cortisol, urea nitrogen excretion, and winter survival in mule deer fawns. Journal of Wildlife Management 56:640-644. Smith, R. B., and F. G. Lindzey. 1982. Use of ultrasound for detecting pregnancy in mule deer. Journal of Wildlife Management 46:1089-1092. Stephenson, T. R., J. W. Testa, G. P. Adams, R. G. Sasser, C. C. Schwartz, and K. J. Hundermark. 1995. Diagnosis of pregnancy and twinning in moose by ultrasonography and serum assay. Alces 31:167-172. Stephenson, T. R., K. J. Hundermark, C. C. Schwartz, and V. Van Ballenberghe. 1998. Prediction of body fat and body mass in moose using ultrasonography. Canadian Journal of Zoology 76:712-722. Taylor, T. J. 1996. Condition and reproductive performance of female mule deer in the central Sierra Nevada. California Fish and Game 82:122-132. Testa, J. W., and G. P. Adams. 1998. Body condition and adjustments to reproductive effort in female moose (Alces alces). Journal of Mammalogy 79:1345-1354. Torbit, S. C., L. H. Carpenter, R. M. Bartmann, A. W. Alldredge, G. C. White. 1988. Calibration of carcass fat indices in wintering mule deer. J. Wildl. Manage. 52:582-588. Torbit, S. C., L. H. Carpenter, D. M. Swift, and A. W. Alldredge. 1985a. Differential loss of fat and protein by mule deer during winter. Journal of Wildlife Management 49:80-85. Torbit, S. C., L. H. Carpenter, A. W. Alldredge, D. M. Swift. 1985b. Mule deer body composition--a comparison of methods. Journal of Wildlife Management 49:86-91. Underwood, K. 2000. Lake Roosevelt subbasin summary. NW Power Planning Council. CBFWF Rep. 56 pp.
50
50
Unsworth, J.W., Pac, D.F., White, G.C., and Bartmann, R.M. 1999. Mule deer survival in Colorado, Idaho, and Montana. J. Wildl. Manage. 63: 315-326. Van Vuren, D., and B. E. Coblentz. 1985. Kidney weight variation and kidney fat index: An evaluation. Journal of Wildlife Management 49:177-179. Verme, L. J. 1965. Reproduction studies of penned white-tailed deer. Journal of Wildlife Management 29:74-75. Verme, L. J. 1967. Influence of experimental diets on white-tailed deer reproduction. Transactions of the North American Wildlife and Natural Resources Conference 32:405-420. Whalen, J. 2000. Spokane River subbasin summary. NW Power Planning Council. CBFWF Rep. 28 pp. Whittaker, D.G. and Lindzey, F.G. 1999. Effect of coyote predation on early fawn survival in sympatric deer species. Wildlife Society Bulletin 27: 256-262. White, R. G., D. F. Holleman, and B. A. Tiplady. 1989. Seasonal body weight, body condition, and lactational trends in muskoxen. Canadian Journal of Zoology 67:1125-1133. White, R. G., J. E. Rowell, and W. E. Hauer. 1997. The role of nutrition, body condition, and lactation on calving success in muskox. Journal of Zoology 243:13-20.

51
51
BUDGET STATEMENTS AS OF 7/11/02 (see Budget Explanation & Justification
Section for full explanationof budget statements)
Budget Expenses Encumbrances Total
BPA-predation Allocation to date on file remaining
Salaries 35,504 21131 6636 7737Wages 8151 7299 4276 -3424Goods 23600 34094 7758 -18252Travel 2616 3600 621 -1605
Equipment > $1000 13500 13500Employee Benefits 17295 7998 1675 9297
Facilities & administration (overhead) 19917 17690 2227 Noncapital equipment 21208 12314 2220 6674
Subtotals 141791 104,125 25,413.00 15,516.00
Budget Expenses Encumbrances Total
BPA-nutrition Allocations to date on file remaining
Salaries 13,694 3000 21000 -10,306Wages 8500 6067 2433Goods 36700 4809 536 31355Travel 1000 1021 -21
Equipment > $1000 10000 10000Employee Benefits 4462 752 5040 -1330
Facilities & administration (overhead) 16733 4069 12664 Noncapital equipment 2000 2000
Subtotals 141791 19718 39,241 34,131
Budget Expenses Encumbrances TotalBPA-nutrition (subcontract to WDFW) Allocations to date on file remaining
Salaries 7,239 7239Wages Goods Travel 1808 1808
Equipment > $1000 2301 2301Employee Benefits 652 652
Facilities & administration (overhead) 3120 3120 Noncapital equipment
Subtotals 15,120 3120 12,000

52
52
BUDGET EXPLANATION AND JUSTIFICATION
The budget figures reported are based on WSU’s accounting system. Therefore, an explanation of items follows.
BPA Nutrition This budget was originally written for a project start date of June 2001, but funding was not received until mid-August 2001. Therefore, the fawn capture and rearing had to be delayed until June 2002 (fawns are only born in June). Therefore, most expenditures on the project began in June 2002 (over halfway through the project year). Therefore some expenses originally thought to occur in the first project year will be carried over into the second project year because of the late start.
1. Salaries – WSU has encumbered a full year of salary for a research associate (through 6/03), instead of just until the end of the project year 8/15/02. Therefore, salaries encumbered appears inflated relative to that budgeted. However, the bulk of the expenses encumbered for this salary will occur in the second project year.
2. Goods – We have not yet received a bill from the helicopter service used for capturing mule deer fawns (about $12,000). In addition, we have not received bills for laboratory analysis of feces and nutritional samples (an additional $12,000). We will be continuing to feed mule deer fawns for another month on this project year, which will cost an additional few thousand of dollars.
3. Equipment – We have not yet purchased the ultrasound machine. New advances are occurring regularly and we have been researching the best machine to purchase. We anticipate the purchase in the next month, or at least early in the second project year.
4. Non-capital equipment – We have not yet purchased the animal scale, but plan to in the next month before the first project year ends.
BPA Nutrition Subcontract to WDFW When this subcontract to Washington Department of Fish and Wildlife (Woody Myers, co-P.I.) was set up, WSU personnel failed to file the subcontract initialization form. Therefore, the subcontractor has been unable to spend on this budget. The paperwork has now been completed, and the subcontractor will be able to retroactively charge expenses incurred in collecting fecal and nutritional samples to this budget. At this time, the exact expenditures are unavailable, but they are within the budget specified.