effects of deicing salt on overstory vegetation in the...
TRANSCRIPT

TRANSPORTATION RESEARCH RECORD 1352 67
Effects of Deicing Salt on Overstory Vegetation in the Lake Tahoe Basin
ROBIN A. EPPARD, ]ACK w. NORBERG, RICHARD J. NELSON, AND
JOHN ALLISON
The impact of deicing chemicals used in winter maintenance is now being investigated throughout the country. The most common deicer, sodium chloride, has been identified as the cause of vegetation damage along roadway corridors. This study investigated the impact of sodium chloride on overstory vegetation in the Lake Tahoe Basin, an environmentally sensitive area. The percent of salt-affected vegetation within the study plot is described as a function of slope and soil group. In addition, the type and degree of vegetation damage caused by all types of factors is described. Forty-five percent of the vegetation analyzed from 9 control and 226 experimental plots showed one or more damage symptoms from biotic and abiotic sources. Fifteen percent of the vegetation analyzed showed damage from salt, and was second only to damage from insects (17 percent) . Mitigation recommendations specific for the Lake Tahoe Basin are discussed, such as erosion control, revegetation with salt-tolerant species, and innovative deicing practices.
The use of deicing salt (sodium chloride) to melt snow and ice on highways in the Lake Tahoe Basin has been common practice since the 1940s (personal communication, Nevada Department of Transportation (NDOT)]. Sodium chloride provides the most economical means of controlling snow and ice buildup in practice today. Historically, little attention was paid to the timing of salt application with respect to storm events, or to the rate at which it was applied to the roadway. The consequences of these deicing practices led to the wastage of deicing and abrasive material in addition to possible salt accumulation in roadside soils, vegetation, and watersheds.
Recent investigations have addressed the environmental impacts associated with the use of deicing salt. Deicing salt deposited outside the roadway corridor through mechanisms such as surface runoff (1,2), mechanical snow removal, or spray from vehicle passage has been shown to cause damage to vegetation or changes in soil structure (1,3-7). The distance from the edge of pavement (EOP) to the furthest salt-affected tree is defined as the zone of influence (ZI) of salt damage within the roadway environment. The degree of salt damage decreases significantly as the distance from EOP increases (J-4,6,8-10) and the ZI extends further downslope than upslope (1,11). Previous studies have defined the ZI as extending from the EOP to 20-50 ft (J), 40 ft (12), 50 ft (11), 148 ft (3) and 300-400 ft on a very steep downslope (J).
R. A. Eppard and J. W. Norberg, Resource Concepts, Inc. 340 N. Minnesota Street , Carson City, Nev . 89703. R. J. Nelson, Nevada Department of Transportation, P.O . Box 930, Reno, Nev. 89504. J. Allison, California Department of Transportation, 1120 N Street, Rm. 3110, Sacramento Calif. 95814.
Once deicing salt has entered the roadway environment, its effect on vegetation is dependent to a large degree on the type of soil encountered. The rate and depth of salt infiltration are functions of soil compactness, physicochemical processes, hydraulic gradients, moisture, and overlying topsoil (7). Soils in the Lake Tahoe Basin consist of porous alluvial and glacial deposits that are not predisposed to accumulations of sodium or chloride ions. Spring and summer runoff is typically sufficient to leach salt below topsoil layers (J ,6, 7,12 ,13), resulting in reduced amounts of deicing salt for uptake by plants during the summer months.
SCOPE OF STUDY
Described in this study is the impact of deicing salt (sodium chloride) on overstory vegetation in roadway corridors of the Lake Tahoe Basin. Specific parameters that are described include (a) Zone of influence of deicing salt, and (b) Type and degree of tree damage caused by all types of injury. In addition, sodium and chloride levels in selected soil and foliar samples were determined. Revegetation recommendations associated with erosion concerns caused by roadway deicing in addition to alternative deicing practices are presented as possible mitigation measures for current deicing concerns.
METHODS AND MATERIALS
Project Area Description
The Lake Tahoe Basin lies on the east side of the Sierra Nevada physiographic province, between elevations of 6,200 and 10,000 ft. Lake Tahoe constitutes 38 percent of the 500 square miles occupied by the basin (14) (Figure 1). Regional uplift, faulting, and erosion of the predominantly granitic rock have produced a rugged topography characterized by steep slopes and narrow canyons. Lakeshore areas not dominated by bedrock consist primarily of glacial moraine and outwash terrain (14) . Annual precipitation in the Lake Tahoe Basin ranges from more than 80 in. at higher elevations to 25 in. at lower elevations, and more than 80 percent of the annual precipitation occurs between October and April. Because of the freezing temperatures, much of the precipitation occurs as snow.
The soil profile from nonglacial slopes is immature, deriving from porous alluvial and glacial deposits (12 ,15) described as well to excessively drained with low water holding capacities

68
~ SOIL GROUP A
t-:-:-:j SOIL CROUP B
D SOIL GROUP c 11111 SOIL CROUP D
~ SOIL GROUP E
IE SOIL GROUP H
- STUDV PLOT LOCATION
TO 1111DEN
TRANSPORTATION RESEARCH RECORD 1352
Plot Description
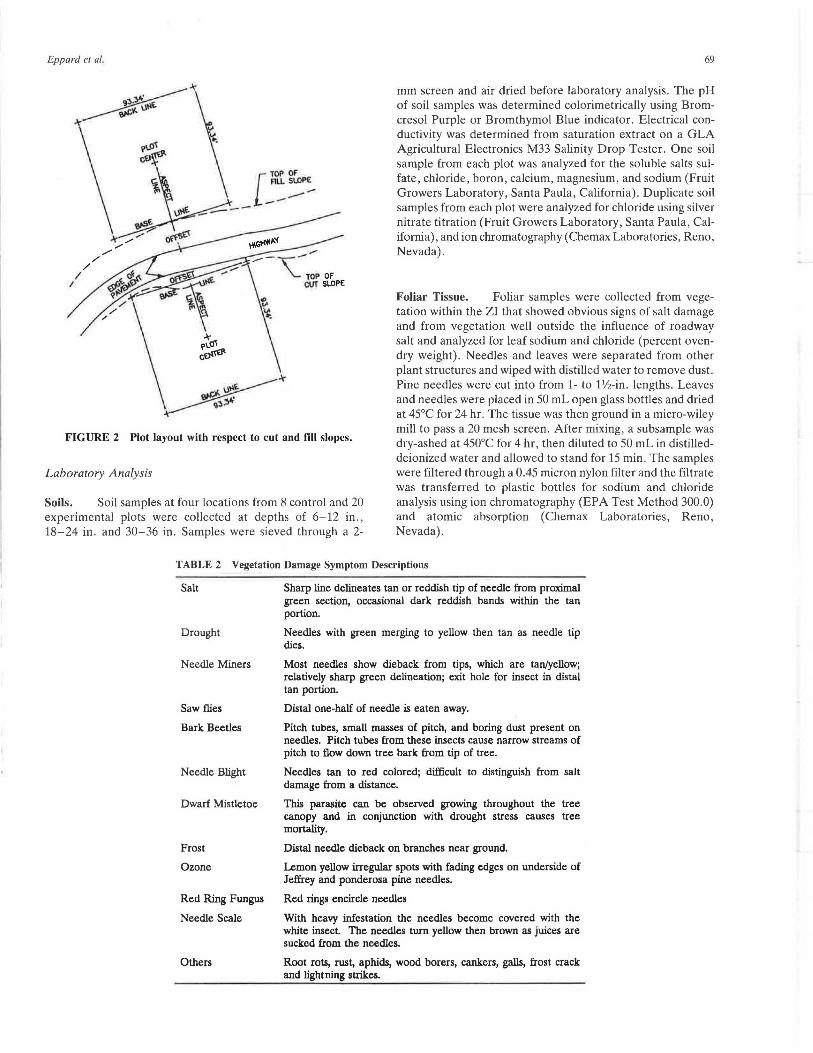
Nine control and 226 experimental plots were established along highways 431, 28, 50, 207 and 89 at 0.5 mile increments (Figure 1). Excluded from the study area were roadways lying within the city of South Lake Tahoe (not forested because of development) and the Camp Richardson Area (no-salt policy enforced 1975-1986). The standard forestry plot area of Ys acre was modified from circular to square (93.34 ft x 93.34 ft) to uniformly represent vegetation and soils perpendicular to the roadway corridor. Plots were offset from the edge of pavement to exclude cut-and-fill slope morphology (Figure 2). Two-thirds of the plots were located downslope and VJ upslope with respect to the roadway. Tree inventory for each plot included total number, species composition, distance to EOP, and slope.
Vegetation Assessment
Field Analysis
All trees from each study plot that were larger than 4-in. diam at breast height were assessed for damage caused by the following factors: undamaged, salt damaged, drought, mechanical, ozone, plants or fungi, insects, blight, or dead or unknown symptoms as described in Table 2. These biotic and abiotic infestations may directly cause tree mortality (17) or reduce plant vigor (18).
FIGURE 1 Lake Tahoe Basin, soil group distribution and study area.
Criteria used for damage assessment were based on standard forestry methods and conducted under the direct supervision of a registered professional forester. Salt damage assessment was based on those developed by Scharpf and Srago (11). The visual symptoms for salt, insect infestation, fungus attack, or drought are similar and are often collectively interpreted as salt damage. The identification of damage types, therefore, was aided with the use of binoculars and hand lenses.
(16). More than 60 different soil types found within the project area were categorized into six soil groups (16) (Table 1, Figure 1). Vegetation associated with these soils includes desert, montane, and alpine species such as pine and fir forests with understories of sagebrush and manzanita (12).
TABLE I Soil Groups in the Lake Tahoe Basin Study Area
Group A
Group B
Group C
Group D
Group E
Group H
Formed in recent alluvium deposited along stream channels and meadow bottoms; variable textured loams to gravelly sands; all subject to flooding and have a high water table.
Dominated by soils over 40 inches deep on alluvial fans and outwash; occur on nearly level to strongly sloping alluvial fans and terraces; deep, well drained loamy sands and sandy loams, some stony and cobbly.
Dominated by gravelly and stony soils over 40 inches deep to pans formed in glacial moraines and outwash; occur on nearly level to steep moraines or outwash formed in stony parent materials; gravelly and stony loamy sands or sandy loams over cemented substratum found below 40 inches deep.
Dominated by rocky soils less than 40 inches deep to weathered granitic bedrock; occur on gently rolling to very steep granitic uplands; shallow to moderately deep over weathered granite; loamy coarse sands and sands; excessive drainage.
Dominated by stony and cobbly soils over 10 inches deep, formed in volcanic bedrock; occur on gently sloping to steep volcanic uplands; well drained stony and cobbly loams; moderately deep to deep over bedrock.
Dominated by rock and stony land; occur on undulating to steep uplands; barren rock outcrop, talus slopes, volcanic rubble and stony colluvium.
Eppard el al.
[
TOP OF f1Ll- Sl.Of'E
- ----- .,-
69
mm screen and air dried before laboratory analysis. The pH of soil samples was determined colorimetrically using Bromcresol Purple or Bromthymol Blue indicator. Electrical conductivity was determined from saturation extract on a GLA Agricultural Electronics M33 Salinity Drop Tester. One soil sample from each plot was analyzed for the soluble salts sulfate, chloride, boron, calcium, magnesium, and sodium (Fruit Growers Laboratory, Santa Paula, California). Duplicate soil samples from each plot were analyzed for chloride using silver nitrate titration (Fruit Growers Laboratory, Santa Paula, California), and ion chromatography (Chemax Laboratories, Reno, Nevada) .
FIGURE 2 Plot layout with respect to cut and fill slopes.
Foliar Tissue. Foliar samples were collected from vegetation within the ZI that showed obvious signs of salt damage and from vegetation well outside the influence of roadway salt and analyzed for leaf sodium and chloride (percent ovendry weight) . Needles and leaves were separated from other plant structures and wiped with distilled water to remove dust. Pine needles were cut into from 1- to 11/2-in. lengths. Leaves and needles were placed in 50 mL open glass bottles and dried at 45°C for 24 hr. The tissue was then ground in a micro-wiley mill to pass a 20 mesh screen. After mixing, a subsample was dry-ashed at 450°C for 4 hr , then diluted to 50 mL in distilleddeionized water and allowed to stand for 15 min. The samples were filtered through a 0.45 micron nylon filter and the filtrate was transferred to plastic bottles for sodium and chloride analysis using ion chromatography (EPA Test Method 300.0) and atomic absorption (Chemax Laboratories, Reno, Nevada).
Laboratory Analysis
Soils. Soil samples at four locations from 8 control and 20 experimental plots were collected at depths of 6-12 in., 18-24 in. and 30-36 in. Samples were sieved through a 2-
TABLE 2 Vegetation Damage Symptom Descriptions
Salt Sharp line delineates tan or reddish tip of needle from proximal green section, occasional dark reddish bands within the tan portion.
Drought Needles with green merging to yellow then tan as needle tip dies.
Needle Miners
Saw flies
Bark Beetles
Needle Blight
Dwarf Mistletoe
Frost
Ozone
Red Ring Fungus
Needle Scale
Others
Most needles show dieback from tips, which are tan/yellow; relatively sharp green delineation; exit hole for insect in distal tan port.ion.
Distal one-half of needle is eaten away.
Pitch tubes, small masses of pitch, and boring dust present on needles. Pitch tubes from these insects cause narrow streams of pitch to flow down tree bark from tip of tree.
Needles tan to red colored; difficult to distinguish from salt damage from a distance.
This parasite can be observed growing throughout the tree canopy and in conjunction with drought stress causes tree mortality.
Distal needle dieback on branches near ground.
Lemon yellow irregular spots with fading edges on underside of Jeffrey and ponderosa pine needles.
Red rings encircle needles
With heavy infestation the needles become covered with the white insect. The needles turn yellow then brown as juices are sucked from the needles.
Root rots, rust, aphids, wood borers, cankers, galls, frost crack and lightning strikes.

70
Statistics
One-way analysis of variance procedures was used to test for significant differences between soil group or percent slope class and the ZI or percent salt-affected vegetation within the study plots. Students' t-test was used to test for significance differences between ZI distances between uphill and downhill slopes, and to test for differences between control and saltaffected soil and vegetation samples.
RESULTS
Vegetation Damage
The frequency of occurrence of each damage category for overstory vegetation within the study area demonstrated that 54.66 percent of the trees were unaffected by any of the identified damaged sources. Insect damage from bark beetles , borers, aphids, needle weevils, scale, sawflies, and needle miners affected 17.46 percent of the trees. Salt damage was identified for 15.05 percent of the trees, plants and fungi affected 6.42 percent, blight 3.89 percent, drought 3.45 percent, mechanical injury 1.68 percent and ozone 1.68 percent of the trees. Dead trees made up 7 .63 percent, and 2.83 percent of the trees had damage from unknown sources (Figure 3).
Zone of Influence
The mean ZI for all uphill slopes was significantly less than that for all downhill slopes combined (p = 0.95). The mean ZI described for plots associated with soil group C was significantly less than for those associated with soil group E (p = 0.90) (Table 3). Within the ZI , trees associated with soil groups B and C were significantly less affected by salt than were trees associated with soil group H (p = 0. 95) (Table
TRANSPORTA T!ON RESEARCH RECORD 1352
FIGURE 3 Relative frequency of damage type to vegetation. Each category treated independently.
3). Soil group, therefore, affected both the ZI and the percent of salt-affected trees within the ZI.
Slope Effects
Percent slope was grouped into 6 ranges for comparison: uphill +(26-53), +(1-25); level (O); downhill -(1-25), -(26-50) and -(51-82) . The mean ZI varied significantly only between flat and downhill very steep slopes (p = 0.95) (Table 4). Trees associated with downhill , very steep slopes were significantly more affected by salt than for any other slope class (p = 0.90) (Table 4).
Species Specificity
The percent occurrence of each type of vegetation damage was calculated for the different overstory species from control and experimental plots (Table 5). Control plots were located
TABLE 3 Zone of Influence and Vegetation Damage as a Function of Soil Group
Soil Group n•
A Hydric 5
B. Deep well drained alluvium 54
c. Deep gravelly stony glacials 37
D. Rocky granitic <40 inches deep 49
E. Stony cobbly volcanic > 10 inches deep 31
H. Rock outcrop, talus, stony colluvium 30 and volcanic rubble
an = Sample size 6SE = Standard error <Means followed by same letter not significantly different.
Zone of Influence (feet)
Mean± Grouping SE6 Mean•
34.0 ± 19.8 ab
25.1 ± 3.5 ab
21.5 ± 4.1 a
32.4 ± 3.3 ab
39.4 ± 4.4 b
36.6 ± 5.4 ab
Percent Salt-affected Vegetation
Mean± Grouping SE Mean
30.0 ± 17.0 ab
12.7 ± 2.6 b
11.6 ± 2.6 b
23.5 ± 3.3 ab
21.2 ± 3.6 ab
33.4 ::!:: 6.0 a

Eppard et al. 71
TABLE4 Zone of Influence and Vegetation Damage as a Function of Slope Class
Zone of Influence Percent Salt-affected (feet) Vegetation
Soil Group n• Mean± Grouping Mean± Grouping SEb Mean< SE Mean
Uphill, steep +(26-53) 20 27.9 ± 5.9 ab 24.5 ± 5.8 a
Uphill, gentle +(1-25) 55 21.0 ± 3.1 ab 8.8 ± 1.7 a
Flat (0) 8 16.9 ± 8.8 a 6.7 ± 3.2 a
Downhill, gentle -(1-25) 75 34.2 ± 3.2 ab 22.3 ± 2.6 a
Downhill, steep ·(26-50) 32 30.3 ± 3.8 ab 21.9 ± 3.8 a
Downhill, very steep -(51-82) 16 52.6 ± 6.9 b 50.5 ± 8.6 b
0 n = Sample siz.e bsE = Standard error <Means followed by same letter not significantly different.
TABLE 5 Frequency of Damage Factors for Overstory Species
Not Salt· Salt- Plants/ Dead/
Affected Affected Drought Mechanical Orone Fungi Insects Blight Unknown Species (n)a (%) (%) (%) (%) (%) (%) (%) (%) (%)
Lodgepole pine 276 71.7 19.9 0 .73 .73 9.78 19.9 2.9 4.7 Pinw contorta (30) (100.0) (0.0) (0.0) (0.0) (0.0) (0.0) (16.7) (0.0) (0.0)
Sugar pine 52 63.5 19.2 1.9 0 0 0 0 13.5 5.8 Pinw lambmiana (2.0) (100.0) (0.0) (0.0) (0.0) (0.0) (0.0) (0.0) (0.0) (0.0)
Jeffrey pine 2,603 69.0 16.1 5.0 0.04 0.7 7.7 9.4 4.8 3.0 Pinw jqfreyi (61) (100.0) (0.0) (0.0) (0.0) (0.0) (1.6) (8.2) (31.1) (1.6)
Ponderosa pine 199 80.4 11.6 5.0 0 0 1.0 9.1 3.0 .s Pinw ponderosa (0.0) (n.d.) (n.d.) (n.d.) (n.d.) (n.d.) (n.d.) (n.d.) (n.d.) (n.d.)
Red fir 81 87.7 4.9 0 2.5 0 0 50.6 1.2 22.2 Abiu magnijica (15) (100.0) (0.0) (0.0) (0.0) (0.0) (0.0) (46.7) (0.0) (0.0)
White fir 2,046 75.6 5.9 1.4 1.8 0 2.1 24.S 1.0 4.4 Abies concolor (148) (100.0) (0.0) (0.0) (0.0) (0.0) (0.7) (77.0) (10.8) (S.4)
Incense cedar 190 64.2 10.0 2.6 0 0 3.2 2.1 3.2 5.8 Ca/ocedrw decu"ens (16) (100.0) (0.0) (0.0) (0.0) (0.0) (0.0) (0.0) (3.3) (3.3)
0 Total number of trees counted - numbers in parenthesis are from control plots. n.d. no data
in areas outside the ZI. No salt damage was identified for trees within control plots; however, damage caused by plants or fungi, insects, and blight was common. More than 77 percent of the White fir and 47 percent of the Red fir from control plots showed insect damage. Damage from drought, mechanical means, or ozone was not noted for any species in control plots. Within the experimental plots, Lodgepole pine showed the highest frequency of salt damage (19.9 percent), damage from ozone (0.7 percent) and plants or fungi (9.8 percent). Sugar pine also had a relatively high frequency of salt damage (19.2 percent), in addition to the highest frequency of blight (13.5 percent). Jeffrey and Ponderosa pine showed the highest frequency of damage caused by drought (5.0 percent each), and Jeffrey pine exhibited the highest frequency of damage caused by ozone (0.7 percent). Red fir and White fir demonstrated a low frequency of salt damage, but exhibited the two highest frequencies of insect damage (50.6 percent and 24.5 percent, respectively). Incense cedar
showed a low frequency for most damage types, with 10 percent exhibiting salt damage symptoms.
Foliar Ion Levels
Sodium levels were significantly higher (p = 0.95) in saltaffected foliage when compared with controls for White fir and Jeffrey pine needles. Chloride levels in foliage of saltaffected trees were significantly higher than controls (p = 0.95) for White fir, Jeffrey pine, and Incense cedar (Table 6).
Electrical Conductivity (EC) and pH
Qualitative soil analysis for EC and pH indicated no significant variation from values typical for each soil group.

72 TRANSPORTATION RESEARCH RECORD 1352
TABLE 6 Foliar Sodium and Chloride Levels
SPECIES CONTROL SALT-AFFECTED
Mean Sodium Level Standard Number of Mean Sodium Level Standard Number of (%by weight) Error Samples (% by weight) Error Samples
White Fir" .0058 .0006 9 .0971 .0256 8
Jeffrey Pine• .0076 .0016 7 .1628 .0645 10
Lodgepole Pine .0067 .0003 3 .0550 .0255 3
Sugar Pine .0050 .0000 2 .2830 .2580 2
Incense Cedar .0055 .0005 2 .0765 .0545 2
Mean Chloride Level Standard Number of Mean Chloride Level Standard Number of (% by weight) Error Samples (% by weight) Error Samples
White Fir" .0601 .0078 9 .3981 .0810 8
Jeffrey Pine• .0224 .0056 7 .4334 .1188 10
Lodgepole Pine .0183 .0094 3 .0690 .0372 3
Sugar Pine .0050 .0000 2 .5305 .3795 2
Incense Cedar" .0260 .0156 2 .2755 .0134 2
astatistically significant difference (95% confidence level) between lhe salt-affected sample and the control.
DISCUSSION
Damage Ratings
The types and extent of damage to overstory vegetation in the Lake Tahoe Basin roadway corridor have been described in this study. Approximately 45 percent of the trees were affected by one or more factors such as insect infestation, fungus, ozone, or salt. The two main types of vegetation damage were attributed to insects (17.46 percent) and salt (15.05 percent).
Vegetation Assessment
Zone of Influence
The mean ZI described for the project area averaged 30.2 ft from EOP, and varied as a function of soil group and slope class. The difference in the width of the ZI between plots on soil group C and soil group E may be caused by the difference in soil texture and organic content. Characteristics of soil group C include a finer texture and greater organic content, which may allow for increased soil water holding capacity as compared to soil group E. The ZI varied significantly only between flat and downhill, very steep slopes. This indicates that slope may play a relatively minor role in affecting the susceptibility of vegetation to salt damage caused by the high percolation rates characteristic of soils from the project area.
Percent Salt-Affected Vegetation Within the Study Plots
Vegetation within the study plots was found to be more susceptible to salt damage when located on particular soil groups
or slope classes. Trees associated with deep gravelly stony glacial (B) or stony cobbly volcanic soils greater than 10 in. deep ( C) showed a lesser degree of salt damage than trees associated with rock outcrop, talus, stony, colluvium, or volcanic rubble (H). Soil group H characteristics are the least conductive to plant growth and may render vegetation more susceptible to exogenous impacts.
Trees on steep downhill slopes exhibited the greatest degree of salt damage, which may be caused in part by an increase in aerial deposition of salt spray onto foliage.
Species Specificity
All of the overstory species within the project area showed some degree of salt intolerance. Lodgepole pine and Sugar pine showed the highest frequencies of salt damage; Red fir and White fir showed the lowest frequencies of salt damage. The degree of salt damage differed between species: Lodgepole pine damage was rated as light; damage to Sugar pine and Jeffrey pine was rated as severe (II). On the basis of this rating, Jeffrey pine and Sugar pine may be considered somewhat salt intolerant in the project area. Ponderosa pine showed a moderate frequency of damage caused by salt, and together with Jeffrey pine showed the greatest degree of damage caused by drought.
Red and White fir appeared to be the most salt tolerant, with only 4.9 percent and 5.9 percent, respectively, of the trees exhibiting damage symptoms. Both of these species, however, showed heavy infestations from insects, which may have interfered with an accurate diagnosis of all of the contributing damage factors. Red fir is not a typical roadway corridor species, and is often found in locations that are not affected by salt.
Incense cedar showed moderate levels of damage caused by salt, drought, blight, and dead or unknown causes, and

Eppard et al.
low frequencies of damage from plants or fungi and insects. Incense cedar may be a rather tolerant species for most of the damage types found in the project area.
Individual overstory species clearly exhibit differing degrees of tolerance to the types of damage found within the project area. This tolerance is based not only on species specificity, but also on other, exogenous factors, such as historic precipitation, microclimate, and soils.
Soils
The Lake Tahoe Basin is characterized by well-drained sand, loamy sand, and sandy loam soils with very low exchange capacities, rapid to very rapid permeability rates and very low available water capacities. Because of these characteristics, the soils of the study area do not retain ions well. The electrical conductivity and pH data, collected during the months of June and July, indicate that much of the salt had leached beyond the root zone during the spring runoff, and agrees with reports by Kliejunas (1) OECD (6), Jones (7), and Hanes (19). Residual salt levels, although significantly higher than background, were still well below sodium or chloride levels that have been reported to be toxic to vegetation. Soil pH ranges, although significantly different between the different soil groups, are well within the typical pH range for each soil group. Cumulative salt effects, therefore, are likely to occur at a rate far slower than that for locations with clay-type soils or higher content or organic matter.
Mitigation
Erosion Control
Loss of vegetation along the roadway corridor has exacerbated preexisting erosion concerns in the Lake Tahoe Basin. Uncontrolled erosion leads to sediment production and deposition in drainage systems, steam environment zones, and ultimately Lake Tahoe. The rate and location of soil erosion and sediment production adjacent to roadways is influenced by precipitation intensity, form of precipitation, storm duration, runoff drainage patterns, slope steepness, slope length, ground cover canopy and type, soil material, slope aspect, and slope disturbance. A reduction of tree canopy and understory cover on slopes and subsequent loss of duff and litter will increase the potential of erosion during periods of surface runoff. Conversely, an increase in vegetative cover decreases the erosion potential. Clearly, loss of roadside vegetation increases the erosion potential in the Lake Tahoe Basin.
Site-specific revegetation programs to stabilize slopes and decrease the potential for erosion have been implemented by the NDOT and California Department of Transportation in the Lake Tahoe Basin. Salt-tolerant species are recommended to reduce vegetation mortality. Removal of dead trees is recommended to reduce fire hazard and curtail insect infestation and spread of disease. Damaged trees should not be removed as they provide useful cover, and may potentially recover.
Grasses and forbs along with specific shrub species adapted to site limitations are recommended for roadside revegetation in the project area. Annual replacement of foliage in grasses
73
and forbs reduces the impact of salt accumulation in leaves, and its low profile avoids mechanical damage from snow removal operations. Native shrubs did not exhibit the same potential as grasses and forbs because they retain foliage from year to year.
All evergreen tree species in the Lake Tahoe Basin have varying degrees of salt intolerance, and if used in revegetation plans would be susceptible to salt damage. In addition, the establishment and maintenance of a clear zone for driving safety would be best accomplished if grasses and forbs were used in place of trees adjacent to the roadway. Therefore, revegetation of roadside areas should not include native tree species.
Recommendations
The use of deicing salt (sodium chloride) has resulted in vegetation damage in the roadway corridor of the project area. This damage is the result of past practices of salt application and recent drought conditions. Recommendations include upgrading equipment and use of the automated weather and pavement condition site information system, in addition to investigating alternative chemicals for use as roadway deicers or implementing more frequent and longer-duration chain control programs (personal communication, NDOT). Currently, the NDOT and California Department of Transportation are implementing all of the previously listed recommendations. Equipment upgrading also includes extensive training of personnel on the use and care of deicing equipment. In addition, both departments of transportation are investigating possible alternative chemicals for use in deicing roadways. Environmental concerns on water quality, impact to vegetation and wildlife, in addition to deicing effectiveness, operational criteria, roadway impacts, and cost are being considered for alternative roadway deicers.
ACKNOWLEDGMENTS
The authors would like to thank the professional staff of Resource Concepts, Inc., Carson City, Nevada, for their contribution to the Final Report to the California and Nevada Departments of Transportation, on which this publication is based. Field reconnaissance : Stephen Cooke, Gerry Hester, Bruce Kenny, Mark McGraw, Glenn Smith (consultant, formerly with the U.S. Forest Service) and Joe Howard (consultant). Statistical analyses: Sheila Anderson. Foliar sample preparation and technical assistance: Diana Thran and Mark Manoukian. Soils analyses review: Leslie Burnside. Technical analysis and review: Don Henderson, John McLain, Nancy Naslas, Richard Eckert (consultant, formerly with the U.S. Department of Agriculture Agricultural Research Service), Wayne Johnson (University of Nevada, Reno), and Stanford Loeb (ecologist). Manuscript preparation: Jody Matranga and Keith Barham.
REFERENCES
1. J. Kliejunas, M. Marosy, and J. Pronos. Conifer Damage and Mortality Associated With Highway Deicing and Snow Removal

74
in the Lake Tahoe Area. U.S. Department of Agriculture Forest Service, Pacific Southwest Region, Report 89-11, 1989.
2. D. M. Murray and U. F. W. Ernst. An Economic Analysis of the Environmental Impact of Highway Deicing. U.S. Environmental Protection Agency, Municipal Environmental Research Laboratory, Cincinnati, Ohio, EPA-600/2-76-33, 1976.
3. H. P. Massoth. Salt Toxicity to Conifers in the Lake Tahoe Basin. M. S. thesis. University of Nevada, Reno, 1978.
4. J.P. Marshall. Evaluation of Vegetation Damage Along Nevada Highways in the Lake Tahoe Basin. U.S. Department of Agriculture Forest Service, Intermountain Region, Forest Pest Management Report 84-3. Boise, Idaho, 1984.
5. E. Sucoff. Effect of Deicing Salts on Wood Vegetation Along Minnesota Roads. University of Minnesota College of Forestry, Minnesota Agricultural Experiment Station, Technical Bulletin 303, 1975.
6. Curtailing Usage of Deicing Agents in Winter Maintenance. Organization for Economic Cooperation and Development Report, New York, 1989, pp. 125.
7. P.H. Jones, B. A. Jeffrey, P. K. Wather and H. Hutchon. Environmental Impact of Road Salting-State of the Art. Research and Development Branch, Ontario Ministry of Transportation and Communication, Canada, 1986.
8. G. Hofstra and R. Hall. Injury on Roadside ·Trees: Leaf Injury on Pine and White Cedar in Relation to Foliar Levels of Sodium and Chloride. Canadian Journal of Botany Vol. 49, 1971, pp. 613-622.
9. G. P. Lumis, G. Hofstra and R. Hall. Sensitivity of Roadside Trees and Shrubs to Aerial Drift of Deicing Salts. HortScience Vol. 8, 1973, pp. 475-477.
10. E. Sucoff, R. Feller and D. Kanten. Deicing Salt (Sodium Chloride) Damage to Pinus resinosa Ait. Canadian Journal of Forestry Research, Vol. 5, 1975, pp. 546-556.
11. R. F. Scharpf and M. Srago. How To Diagnose Road-Salt Injury in California Conifers. U.S. Department of Agriculture Forest Service, Pacific Southwest Forest and Range Experiment Station, Berkeley, Calif., 1975.
TRANSPORTATION RESEARCH RECORD 1352
12. G. R. Winters, J. Gidley, and H. Hunt. Environmental Evaluation of Calcium-Magnesium Acetate (CMA). California Department of Transportation, Sacramento, Calif., FHW A/CA/TL-84/03, 1985.
13. A. T. Leiser, R. Palaniyandi, J. L. Paul and R. Raabe. Highway Operation and Plant Damage. Department of Environmental Horticulture, University of California, Davis, and California Department of Transportation, Report FHWACA/TL-80/30, 1980.
14. R. G. Bailey. Geomorphic Analysis of the Lake Tahoe Basin. Geology and Geomorphology of the Lake Tahoe Region. Tahoe Regional Planning Agency and U.S. Department of Agriculture Forest Service Planning Guide Report, 1971, p. 37-58.
15. C. R. Goldman, S. Hackley, P. Anderson and R. Axler. The Effects of Deicing Agents on the Autotrophic and Heterotrophic Communities of Lake Tahoe. Ecological Research Associates for California Department of Transportation, Report 19703-604193, 1981.
16. G. M. Kennedy, and J. H. Rogers. Soils of the Tahoe Basin. Report and General Soil Map. U.S. Department of Agriculture, Soil Conservation Service, 1971.
17. R. F. Scharpf, and R. V. Bega. Elytroderma Disease in Young, Planted Jeffrey Pine, South Lake Tahoe, California. Pacific Southwest Forestry and Range Experiment Station, U.S. Department of Agriculture Forest Service, Research Note PSW-399, Berkeley, Calif. 1988.
18. R. F. Scharpf, R. S. Smith and D. Volger. Management of Western Dwarf Mistletoe in Ponderosa and Jeffrey Pines in Forest Recreation Areas. General Technical Report PSW-103, Pacific Southwest Forest and Range Experiment Station, U.S. Department of Agriculture Forest Service, Berkeley, Calif. 1988.
19. R. E. Hanes, L. W. Zelazny and R. E. Blaser. Salt Tolerance of Trees and Shrubs to Deicing Salts. Highway Research Record Vol. 335, 1970, pp. 16-19.
Publication of this paper sponsored by Committee on Winter Maintenance.