effects of different centrifugation conditions on clinical
TRANSCRIPT

Effects of different centrifugation conditions onclinical chemistry and Immunology test resultsMinder et al.
Minder et al. BMC Clinical Pathology 2011, 11:6http://www.biomedcentral.com/1472-6890/11/6 (10 May 2011)

RESEARCH ARTICLE Open Access
Effects of different centrifugation conditions onclinical chemistry and Immunology test resultsElisabeth I Minder1*, Adrian Schibli2, Dagmar Mahrer1, Predrag Nesic1 and Kathrin Plüer1
Abstract
Background: The effect of centrifugation time of heparinized blood samples on clinical chemistry andimmunology results has rarely been studied. WHO guideline proposed a 15 min centrifugation time without citingany scientific publications. The centrifugation time has a considerable impact on the turn-around-time.
Methods: We investigated 74 parameters in samples from 44 patients on a Roche Cobas 6000 system, to seewhether there was a statistical significant difference in the test results among specimens centrifuged at 2180 g for15 min, at 2180 g for 10 min or at 1870 g for 7 min, respectively. Two tubes with different plasma separators (bothGreiner Bio-One) were used for each centrifugation condition. Statistical comparisons were made by Deming fit.
Results: Tubes with different separators showed identical results in all parameters. Likewise, excellent correlationswere found among tubes to which different centrifugation conditions were applied. Fifty percent of the slopes laybetween 0.99 and 1.01. Only 3.6 percent of the statistical tests results fell outside the significance level of p < 0.05,which was less than the expected 5%. This suggests that the outliers are the result of random variation and thelarge number of statistical tests performed. Further, we found that our data are sufficient not to miss a biased test(beta error) with a probability of 0.10 to 0.05 in most parameters.
Conclusion: A centrifugation time of either 7 or 10 min provided identical test results compared to the time of 15min as proposed by WHO under the conditions used in our study.
1. BackgroundMost clinical chemistry analyses in blood samplesrequire centrifugation prior to the analyses in order toseparate blood cells and other solid components such asfibrin from serum or plasma. Although this pre-analyti-cal procedure is performed innumerable times every dayin all medical laboratories worldwide, the influence ofcentrifugation on laboratory results has only rarely andonly recently been investigated [1-3]. Indeed, the infor-mation contained in the publications and guidelinesfrom scientific societies rely either on expert opinions orrecommendations from the manufacturers rather thanon published scientific investigations [4-6].The separation efficacy of the centrifugation process
depends on four variables, the centrifugation time, therelative centrifugation force (RCF), the length of bloodcollection tubes and the temperature. The length of
tubes defines the volume of plasma or serum that isrequired for the analyses and is usually given. The RCFis limited by the resistance of the tubes and the bloodcomponents to the gravity and the technical limits ofthe centrifuge and its rotor. Variations in temperatureare limited by stability of analytes. Thus, only the centri-fugation time can be easily varied to achieve the desiredquality of the specimen for the subsequent analyses.The above cited guidelines proposed a centrifugation
time of at least 10 min for serum and of 15 min forplasma with a RCF between 2000 and 3000 g [6]. Hospi-tal laboratories serving emergency departments, inten-sive care units and busy outpatient clinics strive forminimizing their turn-around-times (TAT)[2]. The cen-trifugation step consumes a large portion of the pre-analytical time in the laboratory and therefore a consid-erable amount of the total TAT. A reduction in thistime-consuming step is therefore in the focus. Indeed,centrifugation times as short as 30 sec have been usedunder certain circumstances, but no formal evaluationsof such procedures have been published [7,8].
* Correspondence: [email protected] Triemli, Central laboratory Birmensdorferstrasse 497 CH-8063Zürich SwitzerlandFull list of author information is available at the end of the article
Minder et al. BMC Clinical Pathology 2011, 11:6http://www.biomedcentral.com/1472-6890/11/6
© 2011 Minder et al; licensee BioMed Central Ltd. This is an Open Access article distributed under the terms of the Creative CommonsAttribution License (http://creativecommons.org/licenses/by/2.0), which permits unrestricted use, distribution, and reproduction inany medium, provided the original work is properly cited.

Another step to reduce TAT is the use of heparinizedplasma instead of serum. Serum samples from fullyanticoagulated patients may continue to coagulate forseveral hours after blood draw, which may affect theanalytical process. Small particles of fibrin clots mayblock pipetting needles of the analyzers or interfere withchemiluminescence assays. Although collection tubeswith special additives to reduce coagulation time to afew minutes, have been developed [3], yet we found thatthe coagulation process in specimens of fully anticoagu-lated patients is not completed after 15 min (E. Minder,unpublished observations). An alternative is to use tubescontaining lithium heparinate which prevents coagula-tion and allows centrifugation immediately after thearrival of the tubes in the laboratory. Heparinizedplasma instead of serum can be used for most clinicalchemistry and many immunological analyses today,depending on the analytical platform and the reagentsused.Gels, also called separators, interpose between the cel-
lular and fluid phase of the blood specimen during cen-trifugation and act as a barrier thereafter preventing thediffusion of analytes between the two phases. The gelbarrier is formed only after adequate centrifugation timeand force. An incomplete gel formation may interferewith certain analyses [9]. Separator gels from differentmanufacturers may have different compositions andtherefore behave differently under identical centrifuga-tion conditions, which could results in differences intest results.In this report, we investigated the effect of distinct
centrifugation conditions on a broad range of routineclinical chemistry and immunology analyses. These con-ditions included the centrifugation time pro-posed bythe WHO-guidelines and two shorter ones of 10 and 7min, respectively. We also examined the possible effectof two different gel separators on the same set of labora-tory parameters.
2. Methods2.1 PatientsConsecutive patients admitted to our medical wardsbetween September and October 2009 were asked toprovide six additional tubes for the study during regularblood draws. Exclusion criterion was a known or sus-pected anemia.
2.2 Blood sampling and centrifugationPhlebotomy was performed using a butterfly needle(Greiner Bio-One reference number 450085). Betweenthe regular drawing and the study samples, a 5 ml Z noadditive Vacuette® (Greiner Bio-One reference number456202) was filled and discarded. Then, three evacuatedtubes with gel separator (5 ml Lithium Heparin Sep 13
× 100 mm Vacuette® Premium, Greiner Bio-One refer-ence number 456083, available in Europe, called ‘tube11’ hereafter) and three evacuated tubes with gel separa-tor (5 ml Lithium Heparin Sep 13 × 100 mm Vacuette®,Greiner Bio-One reference number 456087 RP, availablein USA, called ‘tube 22’ hereafter) were filled withvenous blood. After gently inverting the tubes eighttimes, they were sent immediately to the laboratory by apneumatic tube system and centrifuged within one hourafter blood draw on a Rotixa 50 RS Hettich centrifugeequipped with a swing-out bucket rotor. The three cen-trifugation conditions were as follows: acceleration timeof 32 sec (included in the overall centrifugation time),deceleration time of 32 sec (after centrifugation) andtemperature at +15°C in all three conditions; condition1: centrifugation time 15 min at 2180 g or 32,700 gmin,condition 2: 10 min at 2180 g or 21,800 gmin and con-dition 3: 7 min at 1870 g or 13,090 gmin, respectively.The sequence of the tubes during blood draw was
registered. To avoid any influence from this sequence, apre-specified randomization protocol was used to allo-cate the tubes to the different centrifugation conditions.A collection of samples from at least 40 patients wouldattain sufficient statistical power and thus specimensfrom 47 patients were collected. Analyses were per-formed only if all six tubes collected per patient were ofsufficient quality, i.e. without visible hemolysis or lipide-mia. Tubes from 44 patients met the criteria and weretherefore investigated. For statistical reasons, a patientwas included only once.
2.3 Analyses of samplesCertified medical technicians with several years of work-ing experience performed all laboratory procedures.Immediately after centrifugation, the samples were ana-lyzed on a COBAS 6000 analyzer (Roche Diagnostics,Rotkreuz, Switzerland) equipped with the core unit cu150 (Part number 727-0189), the modules c 501 (partnumber 727-2983) and e 601 (part number 727-2984).The instrument was equipped with standard reagents,calibrators and quality control material manufactured byRoche Diagnostics (Rotkreuz, Switzerland). Seventy-fourdifferent tests as listed in table 1 were performed oneach tube, giving rise to a total of 444 results perpatient. The analyses were performed within 3 hoursafter the sample collection with an exception of theimmunological parameters for infectious diseases, whichwere examined within 48 hours. All tubes were storedat 4°C before analyses.This study was initiated by the investigators; the costs
of the study were covered by two companies (seeacknowledgments). The study was approved by the insti-tutional review board (Kantonale Ethikkommission Zür-ich), and the participating patients gave their written
Minder et al. BMC Clinical Pathology 2011, 11:6http://www.biomedcentral.com/1472-6890/11/6
Page 2 of 15

Table 1 All test analyzed, their control values and further data used for estimation of the beta error.
Test Abbreviation QCtargetvalue
unit n mean SD CV Maximalerror(CLIA)
lowestmeasuredvalue
highestmeasuredvalue
RangeRatio
estimated beta-error smaller
than
FederalRegister
Qualab Clinicalestimate
Albumin Alb 47 g/L 16 47.44 0.81 1.71 3.65 25 48 1.92 <10% ± 10% ± 15%
Alb 30.9 g/L 18 31.71 0.71 2.28
AlcalinePhosphatase
AP 71.9 U/L 18 70.56 1.04 1.47 67.80 36 416 11.56 <5% ± 30% ± 21%
AP 210 U/L 13 207.53 3.39 1.63
Alaninaminotransferase
ALTL 45.5 U/L 17 45.65 0.49 1.07 36.10 7 354 50.57 <5% ± 20% ± 21%
ALTL 126 U/L 19 126.47 1.58 1.25
Amikacin Amik 7.83 umol/L 9 8.822 1.057 11.98 0.28 0 2.8 UD! <10% 10%
Amik 23.1 umol/L 9 23.828 1.341 5.63
Amik 46.3 umol/L 11 48.225 2.994 6.2
Pancreatic Amylase Amy-P 40 U/L 18 39.83 0.71 1.78 19.88 2 157 78.50 <5% ± 25%
Amy-P 107 U/L 19 107.11 1.05 0.98
Amylase Amyl 79.5 U/L 16 79.31 0.79 1 29.25 13 182 14.00 <5% ± 30% ± 30%
Amyl 198 U/L 12 195.56 1.42 0.73
Aspartateaminotransferase
ASTL 47.3 U/L 17 46.59 1.18 2.53 25.40 10 244 24.40 <5% ± 20% ± 21%
ASTL 152 U/L 19 15.063 3.18 2.11
Bili-D 28.1 umol/L 19 28.326 1.125 3.97 22.20 1.1 220.9 200.82 20%
Total Bilirubin Bili-T 16.5 umol/L 17 16.888 0.376 2.23 6.84 2.8 213.9 76.39 <5% ± 6.84 umol/L or ± 20%
± 20%
Bili-T 76.3 umol/L 19 75.421 5.257 6.97
Calcium Ca 2.13 mmol/L 18 2.1233 0.0406 1.91 0.25 1.87 2.71 1.45 <10% ± 0.25 umol/L ± 12%
Ca 3.41 mmol/L 21 3.3681 0.0515 1.53
Carbamazepine Carb 13.6 umol/L 9 11.6 1.773 15.28 0.13 0 1 UD <5% ± 25%
Carb 37.9 umol/L 10 330.46 3.45 10.31
Carb 60.9 umol/L 11 54.955 4.377 7.96
Cholinesterase CHE 5400 U/L 16 5232.13 98.07 1.87 1216.80 2877 9291 3.23 <5% 20%
CHE 1340 U/L 18 1313.78 26.47 2.01
Cholesterol Chol 2.65 mmol/L 17 2.718 0.039 1.43 0.51 2.3 7.8 3.39 <10% ± 10% ± 10%
Cholesterol Chol 5.27 mmol/L 18 5.117 0.051 1
Creatinin Kinase CK 152 U/L 18 148.78 1.7 1.14 69.60 12 452 37.67 <5% ± 30% ± 30%
CK 499 U/L 18 494.56 6.29 1.27
CK, iso-enzyme MB CKMB 5.13 ng/mL 9 5.43 0.063 1.16 1.45 0.9 21.2 23.56 ? ± 3 SD
Minder
etal.BM
CClinicalPathology
2011,11:6http://w
ww.biom
edcentral.com/1472-6890/11/6
Page3of
15

Table 1 All test analyzed, their control values and further data used for estimation of the beta error. (Continued)
CKMB 56.7 ng/mL 7 55.62 0.903 1.62
Bicarbonate CO2 18.1 mmol/L 17 18.575 0.331 1.78 2.08 10.3 31.3 3.04 <10% 10%
CO2 31.6 mmol/L 17 31.292 0.63 2.01
Cortisol Cort 300 nmol/L 16 312.6 10.22 3.27 190.83 110.6 1416 12.80 <5% ± 25% ± 20%
Cort 723 nmol/L 13 733.3 12.22 1.67
Creatinine Crea 89.1 umol/L 18 91.06 3.28 3.6 37.13 40 455 11.38 <5% ± 26.5 umol/L or ± 15%
Crea 346 umol/L 18 345.61 6.98 2.02
C-reactive Protein CRP 9.7 mg/L 15 9.653 0.223 2.31 16.26 0.3 216.5 721.67 <5% ± 21%
CRP 53.2 mg/L 16 52.706 2.088 3.96
Chloride Cl 84.8 mmol/L 28 83.709 2.623 3.13 5.15 87.9 118.1 1.34 >30% ± 5% ± 9%
Cl 118 mmol/L 28 114.967 2.066 1.8
Digoxin Digo 1.382/1.48
nmol/L 10 0.048 1.4 0.41 0.192 3.09 16.09 <5% ± 25% ± 24% (<1 nmol/L: ± 0.24%)
Digo 3.699 nmol/L 7 3.66 0.084 2.30
Aethyl-ethanol ETOH 11.3 mmol/L 15 11.253 0.767 6.82 0.16 -0.4 1.7 -4.25 <5% ± 25%
ETOH 33.2 mmol/L 14 33.35 2.69 8.07
Ferritin Ferri 12.5 ug/L 10 13.95 0.333 2.39 216.84 8.7 1726 198.39 <5% ± 25%
Ferri 416 ug/L 10 412.4 13.21 3.2
Ferri 1330 ug/L 12 1283 61.71 4.81
Folic acid Fol 6.765/7.08
nmol/L 11 0.639 9.35 5.48 9.44 45.4 4.81 <5% ± 20%
Fol 16.91 nmol/L 11 17.381 0.604 3.48
Fol 34.731 nmol/L 12 35.185 2.26 6.42
Free Tri-iodothyronine
FT3 6.1/6.33 pmol/L 17 0.157 2.52 0.84 1.63 6.78 4.16 <5% 20%
FT3 25.6/26.0
pmol/L 15 0.6588 2.658
Free Thyroxine FT4 14.3 pmol/L 16 15.82 0.54 3.41 3.84 11.27 27.13 2.41 <5% ± 3 SD ± 20%
FT4 51.6 pmol/L 16 55.69 2.42 4.35
Gentamycine Gent 3.68 umol/L 9 3.189 0.586 18.38 1.33 0 10.6 UD <5% ± 25%
Gent 9.38 umol/L 10 9.02 0.944 10.47
Gent 15.8 umol/L 11 15.891 0.879 5.53
-glutamyltranspeptidase
GGT 46.4 U/L 17 45.65 0.61 1.34 195.30 9 1851 205.67 <5% ± 21%
GGT 206 U/L 18 205.89 2.85 1.38
Minder
etal.BM
CClinicalPathology
2011,11:6http://w
ww.biom
edcentral.com/1472-6890/11/6
Page4of
15

Table 1 All test analyzed, their control values and further data used for estimation of the beta error. (Continued)
Glucose Gluc 5.09 mmol/L 19 5.07 0.092 1.81 0.86 4.6 12.6 2.74 <10% ± 0.333mmol/L or ±
10%
± 10%
Gluc 13.2 mmol/L 18 13.232 0.273 2.06
Anti-Hepatitis A IgG HAV 18.5/18.7/20.5
IU/L 13 0.505 2.57 6.30 3 60 20.00 <5% 20%
HAV 32.1/33.5/37.1
IU/L 15 0.778 2.39
Human chorionicgonadotropin,
Subunit
HCG-beta 9.52 mIU/mL 17 9.278 0.21 2.26 2.90 0.1 23.1 231.00 <5% ± 3 SD ± 25%
HCG-beta 38.1 mIU/mL 16 36.654 1.018 2.78
High-densitylipoprotein
HDL 1.2 mmol/L 17 1.15 0.0278 2.42 0.41 0.12 2.63 21.92 <5% ± 30%
HDL 0.74 mmol/L 18 0.6461 0.0154 2.38
Iron Iron 20 umol/L 18 20.131 0.304 1.51 2.89 1.9 27 14.21 <5% ± 20% ± 20%
Iron 29.5 umol/L 19 29.684 0.332 1.12
Potassium K 3.41 mmol/L 27 3.3661 0.08 2.38 0.50 2.3 5.11 2.22 <10% ± 0.5 mmol/L ± 9%
K 6.26 mmol/L 28 6.1757 0.0916 1.48
LactateDehydrogenase
LDH 318 U/L 16 321.38 3.74 1.16 143.10 232 1199 5.17 <5% ± 20% ± 21%
LDH 497 U/L 17 501.82 4.52 0.9
Low-densitylipoprotein
LDL 2.87 mmol/L 16 2.7144 0.0669 2.46 1.03 0.89 5.97 6.71 <5% 30%
LDL 5.17 mmol/L 18 4.7817 0.0932 1.95
Lipase Lipe 55.4 U/L 18 54.28 0.67 1.23 97.68 6 808 134.67 <5% ± 24%
Lipe 89.9 U/L 18 88.33 1.88 2.13
Magnesium Mg 0.892 mmol/L 17 0.868 0.0268 3.09 0.26 0.51 1.56 3.06 <5% ± 25% ± 20%
Mg 1.68 mmol/L 17 1.7065 0.0611 3.58
Myoglobin Myo 85.2 ng/mL 11 80.107 2.025 2.53 28.68 21 170.2 8.10 <5% ± 30%
Myo 1080 ng/mL 11 1003.3 43.704 4.36
Sodium Na 121 mmol/L 27 119.79 2.92 2.44 12.69 129 153 1.19 ± 4 mmol/L ± 9%
Na 145 mmol/L 28 142.69 2.26 1.58
Pheno-barbital Phno 39.9 umol/L 10 39.9 1.91 4.79 0.80 0 8 UD <5% ± 20%
Phno 105 umol/L 11 97.55 2.46 2.52
Phno 215 umol/L 10 198.2 5.2 2.62
Phosphate Phos 1.29 mmol/L 17 1.3047 0.0194 1.49 0.20 0.62 2.06 3.32 <5% ± 15%
Minder
etal.BM
CClinicalPathology
2011,11:6http://w
ww.biom
edcentral.com/1472-6890/11/6
Page5of
15

Table 1 All test analyzed, their control values and further data used for estimation of the beta error. (Continued)
Phos 2.01 mmol/L 18 2.0472 0.0321 1.57
N-terminal Brainnatriuretic peptide
Pro-BNP 131 pg/mL 12 134 5.85 4.37 1837.05 5 24489 4897.80 <5% ± 15%
Pro-BNP 4360 pg/mL 11 4944 135.5 2.74
Parathyroid-hormone
PTH 5.7982 pmol/L 7 5.47 0.165 3.01 5.13 2.12 40.61 19.16 <5% ± 24%
PTH 20.246 pmol/L 5 19.94 0.278 1.4
PTH 86.39 pmol/L 6 87.06 1.23 1.42
Anti-Rubella IgG RubG 3.57/3.96
IU/mL 13 0.186 4.99 50.02 0.17 500 2941.18 (1)
RubG 69.3 IU/mL 12 70.85 4.68 6.61
Anti-Rubella IgM RubM 0.23 COI 13 0.224 0.008 3.57 UD (1)
RubM 2 COI 13 1.816 0.128 7.05
Salicylate Sali 0.29 mmol/L 9 0.2667 0.0324 12.15 -0.02 -0.22 0.05 -0.23 <5% 20%
Sali 1.14 mmol/L 10 1.1335 0.0362 3.19
Sali 3.12 mmol/L 11 3.3218 0.0795 2.39
Triiodo-thyronine T3 2.46 nmol/L 16 2.34 0.179 7.66 0.30 0.541 2.47 4.57 <5% ± 3 SD 20%
T3 5.59 nmol/L 16 5.48 0.383 7
Theophyllin Theo 30.1 umol/L 9 30.44 1.88 6.18 1.38 0 11 UD <5% ± 25%
Theo 82.7 umol/L 10 83.1 2.51 3.02
Theo 171 umol/L 11 166.64 5.26 3.16
Troponin T TN-T 0.071 ug/L 13 0.073 0.003 4.11 0.31 0.01 2.54 254.00 <5% ± 24%
TN-T 2.24 ug/L 11 2.213 0.037 1.67
High-sensitivity TNT TNT-hs 0.0302 ug/L 11 0.032 0.001 3.13 0.26 0.003 2.19 730.00 <5% ± 24%
TNT-hs 2.45 ug/L 11 2.488 0.054 2.17
Tobramycin Tobr 1.79 ug/mL 9 1.8 0.071 3.94 0.03 0 0.2 UD <5% ± 25%
Tobr 4.01 ug/mL 10 3.94 0.07 1.78
Tobr 8.17 ug/mL 11 7.9 0.261 3.30
Anti-Toxo-plasmaIgG
ToxoG 0.84 IU/mL 13 0.899 0.051 5.67 77.25 0.13 617.9 4753.08 <5% 20%
ToxoG 48.1 IU/mL 13 50.549 2.93 5.80
Anti-Toxo-plasmaIgM
ToxoM 0.18 COI 13 0.14 0.015 10.71 -1 -1 1.00
ToxoM 1.78 COI 13 1.86 0.057 3.06
Total Protein TP 64.6 g/L 14 65.786 1.122 1.71 7.00 50 90 1.80 <10% ± 10% ± 15%
TP 102 g/L 15 105.23 1.05 1.00
TP 66.8 g/L 17 66.88 0.86 1.29
Minder
etal.BM
CClinicalPathology
2011,11:6http://w
ww.biom
edcentral.com/1472-6890/11/6
Page6of
15

Table 1 All test analyzed, their control values and further data used for estimation of the beta error. (Continued)
TP 50.1 g/L 19 50.11 0.74 1.48
Triglycerides Trigl 1.22 mmol/L 17 1.2371 0.0126 1.02 0.74 0.67 5.21 7.78 <5% ± 25% ± 20%
Trigl 2.37 mmol/L 18 2.3711 0.0345 1.46
Transferrin Trfe 33 umol/L 13 33.154 0.689 2.08 6.30 16 47 2.94 <5% 20%
Trfe 48.9 umol/L 15 48.23 0.68 1.41
Trfe 25.1 umol/L 17 25.41 0.51 2.01
Thyroid-stimulatinghormone
TSH 1.65 uIU/mL 16 1.57 0.019 1.21 0.62 0.05 6.14 122.80 <5% ± 3 SD ± 20%
TSH 9.09 uIU/mL 15 8.57 0.114 1.33
Uric Acid UA 275 umol/L 17 276.12 2.71 0.98 75.00 93 907 9.75 <5% ± 17% ± 15%
UA 579 umol/L 18 575.11 10.53 1.83
Urea Ureal 6.84 mmol/L 17 6.9 0.094 1.36 4.15 2 39.5 19.75 <5% ± 20%
Ureal 24.4 mmol/L 18 23.967 0.387 1.61
Valproate Valp 238 umol/L 9 233.44 29.75 12.74 3.88 0 31 UD <5% ± 25%
Valp 519 umol/L 10 549 47.71 8.69
Valp 811 umol/L 11 857.45 69.14 8.06
Vanco-mycin Vanc 4.22 umol/L 10 4.59 0.468 10.2 0.18 0 1.8 UD <5% 20%
Vanc 13.5 umol/L 10 15.52 0.914 5.89
Vanc 19.6 umol/L 12 22.083 0.997 4.51
Vitamin B12 VitB12 177.858/194.8
pmol/L 11 9.546 5.24 123.35 109.5 1124 10.26 <5% ± 20%
VitB12 392.616/408.9
pmol/L 11 11.8 2.99
VitB12 856.08 pmol/L 12 859.636 20.04 2.33
Vitamin D VitD 55 nmol/L 6 48.36 6.93 14.33 14.71 17.78 129.3 7.27 <5% ± 20%
VitD 83.75 nmol/L 4 72.95 6.92 9.49
VitD 115.5 nmol/L 6 106.5 10.31 9.68
(1) Target value ± 2 dilutions or immune or nonimmune or positive or negative, UD = undetermined
All analyses were listed including their abbreviations used in the further tables. Their standard deviations (SD) and coefficient of variations (CV) of the controls (QC) are given. The target values of the QC material ofdifferent analytes, as well as the measurement units, the number of QC repetitions (n), the mean, SD and CV of the QC materials are displayed. The beta error was estimated [12] using the range ratio and theallowable biases as defined by the federal registry, the Qualab or the clinical estimate. The values used for the evaluations are displayed in bold.
Minder
etal.BM
CClinicalPathology
2011,11:6http://w
ww.biom
edcentral.com/1472-6890/11/6
Page7of
15

informed consent. Their samples were immediatelyanonymized after blood draw, but were decoded uponrequest of the patients.
2.4 StatisticsAnalyse-it for Excel (Version 2.11, 2008) was used forthe statistical analyses; the statistic procedure appliedbeing the Deming fit. In contrast to linear regressionanalysis, the Deming procedure allows for a randomerror in both test and reference measurements [10]. Per-formed with weighed function, it accounts also for anon-constant random error over the measurement range[11,12]. A two sided p value of < 0.05 was considered assignificant. Coefficients of variation (CV) and standarddeviations (SD) were calculated by the Cobas 6000 soft-ware from the quality control samples as mentioned intable 1. These quality controls were run once a day.2.4.1 Determination of the alpha errorThe triplicates of each parameter of tubes 11 (compris-ing all different centrifugation conditions) per patientwere compared with those of tube 22, to detect varia-tions caused by the different gel separators. Second, testresults from all centrifugation conditions within onetube were compared among each other. As singletonswere compared, SD or CV had to be defined using thevalues of the quality control samples displayed in table1. If the SD’s were approximately constant over themeasured range, the mean of SD’s of those quality con-trol samples were entered. In case CV was more con-stant than SD, a weighed Deming fit was applied usingthe means of CV’s of those quality control samples.2.4.2 Determination of the beta errorThe null hypothesis of the Deming fit tests the identityof a test method to a reference method. The p valuedefines the probability (alpha error) that the two meth-ods deliver identical results. However, it does not deter-mine the probability to detect a deviation of the testmethod from the reference method when in fact the testmethod produces aberrant or biased results. The prob-ability to miss an existent bias (beta error) depends onthe measurement range, the allowable bias, the analyticalmeasurement error and the distribution of the data [12].First, we estimated the beta error based on the tablesfive and six of publication [12], using the measurementrange of our data. As allowable bias the values were pri-marily taken from Federal registry [13], secondarily fromthe Swiss regulation of Qualab [14], and thirdly by anestimate of clinical requirement by one of the investiga-tors (EIM) The data used are highlighted on table 1.Second, we calculated the deviation or bias of the testmethod to the reference method for the limits of refer-ence values. The calculated bias was compared to anallowable bias of 5%, 10% 20%, 30% or 40% and theprobability was determined that the calculated bias
exceeds the allowable bias thus indicating a significantdeviation of the test method from the reference method.
3. ResultsAs an illustrative example of the applied Demingmethod, the scatter plot, the residual plot and the corre-spondent numeric output of alanin-amino-transferase(ALAT) measurements are shown in Figure 1. Themeans of the triplicates of tube 11 are compared withthose of tube 22. Figure 1A shows that the identity andthe weighted Deming regression line lie closely to eachother. Figure 1B illustrates that the deviation of thestandardized residuals strongly increase in lower values,indicating that a weighted rather than unweighted pro-cedure should be applied. On the lower part of Figure 1,the numerical results of the constant and proportionalbias and their p values are displayed. The constant biascorresponding to the intercept in regression analysisshould be 0.00 ideally, the proportional bias correspond-ing to the slope 1.00. The p value of 0.57 for the con-stant bias and that of 0.87 for the proportional biasindicate that neither the slope nor the intercept differssignificantly from their ideal values.A compilation of the constant and proportional bias
over all statistical tests including all parameters and allcentrifugation conditions is displayed in additional file 1,table S1 and an excerpt of them is illustrated in table 2.The leftmost column shows the parameter analyzed. Foreach parameter, seven statistical comparisons as dis-played in the adjacent columns were made, resulting in357 Deming tests (51 parameters × 7 comparisons). Onetube 22, condition 2 was excluded because several analy-tical parameters showed aberrations that exceeded 3standardized residuals, and we concluded that this tubedid not contain a sample of appropriate quality.Twenty-three analytical parameters could not be evalu-ated, as either, they were not quantitative tests or mostpatient samples did not contain measurable amountsand therefore a reliable quantitative comparison couldnot be performed. They are listed as footnotes in addi-tional file 1, table S1.Table 2 and additional file 1, table S1 list the statisticalevaluations on all investigated parameters including theconstant bias, the proportional bias and their 95% confi-dence intervals. The 95% confidence intervals includedthe ideal values (i.e. 0.00 in constant bias or 1.00 in pro-portional bias) for 688 of the 714 results (357 each con-stant and proportional bias), and not included in thisinterval were 26 results (18 constant, 8 proportionalbiases). These data correspond to 3.6% of the 714results, 5.0% of constant and 2.2% of proportional biases,respectively. These percentages do not surpass theexpected 5%, as the confidence intervals include only95% and not 100% of random variations. Moreover,
Minder et al. BMC Clinical Pathology 2011, 11:6http://www.biomedcentral.com/1472-6890/11/6
Page 8 of 15

Test Method Comparison - Weighted Deming fit ALAT tubes 11 - 7, 10, 15 v ALAT tubes 22 - 7, 10, 15
Performed by plüer Date 18 November 2009
n 44(used mean of X replicates vs mean of Y replicates)
Range 7.333 to 348.000
Replicates Assigned CVRepeatability
CVIterative
CVIterative
Mean CVALAT tubes 11 - 7 3 - 3.6% 3.5% 2.0%ALAT tubes 22 - 7 3 - 3.7% 3.9% 2.2%
Allowable bias 5%
Variance ratio 0.83
Sy|x (vertical) 0.033
Bias 95% CI SE pConstant 0.17 -0.43 to 0.78 0.300 0.5701
Proportional 1.00 0.98 to 1.02 0.011 0.8650H0: Constant bias = 0. H1: Constant bias H0: Proportional bias = 1. H1: Proportional bias
Decision Level Bias 95% CI SE Bias goal p41 0.2 -0.1 to 0.6 0.19 2.1 <0.0001
H0: |Bias| 1: |Bias| < Bias goal.
Scatter Plot with Deming Fit
0
50
100
150
200
250
300
350
400
0 100 200 300 400
Mean of ALAT tubes 11
Mea
n of
ALA
T tu
bes
22
Identity
Allow able bias (5%)
Weighted Deming f it(0.17 + 1.00x)
95% CI bands
Residual Plot
-4
-3
-2
-1
0
1
2
3
4
0 50 100 150 200 250 300 350
Estimated "True" Value
Sta
nd
ard
ize
d R
es
idu
al
Figure 1 Deming fit. This figure shows a typical report of the Deming fit by Analyse-it for Excel: Graph A represents the scatter plot, theregression line and indicates the identity line and the limits of a 5% bias. Graph B plots the standardized residuals. The statistical information asdiscussed in the text is given as a table.
Minder et al. BMC Clinical Pathology 2011, 11:6http://www.biomedcentral.com/1472-6890/11/6
Page 9 of 15

aberrations from the ideal values were minor in thesecases, supporting the concept of pure randomness.To further analyze the results, the distribution of the
proportional biases that should randomly vary aroundthe value 1.00 was studied (Figure 2). This analysisshowed that 50 percent of all proportional bias (slopes)were located between 0.990 and 1.010, and 99% ofthem were located between 0.924 and 1.086. Theextreme values were 0.90 and 1.15. The parameterswith proportional biases outside the 99% distributionand below 0.924 were the following: sodium, bicarbo-nate, CKMB, and those above 1.086 were bicarbonateand CKMB. Apparently, the Deming fit did not appro-priately estimate the slope in some of these outlierssuch as CKMB. From the scatter plot, we assume thatrelatively large variations in low normal values
Table 2 An illustrative excerpt of all Deming fits containing the data of some clinical chemistry and immunologyanalytes.
Analysis 11:22 11 - 15:10 11 - 15:7 11 - 10:7 22 - 15:10 22 - 15:7 22 - 10:7
BiasConst.
Prop. BiasConst.
Prop. BiasConst.
Prop. BiasConst.
Prop. BiasConst.
Prop. BiasConst.
Prop. BiasConst.
Prop.
95% CI 95% CI 95% CI 95% CI 95% CI 95% CI 95% CI 95% CI 95% CI 95% CI 95% CI 95% CI 95% CI 95% CI
Alb -1.81 1.06 -1.86 1.06 -1.05 1.03 0.76 0.98 -0.16 1.01 0.25 0.99 0.40 0.99
Alb -4.33 to0.71
0.99 to1.13
-4.52 to0.79
0.98 to1.13
-2.55 to0.45
0.99 to1.07
-1.90 to3.41
0.90 to1.05
-2.54 to2.23
0.94 to1.07
-1.85 to2.34
0.94 to1.05
-1.83 to2.63
0.93 to1.04
Bili-T -0.08 1.01 -0.15 1.03 0.10 1.00 0.24 0.96 -0.04 1.01 -0.11 1.03 -0.06 1.02
Bili-T -0.18 to0.01
0.99 to1.02
-0.44 to0.15
1.00 to1.06
-0.18 to0.38
0.96 to1.03
0.04 to0.44
0.94 to0.99
-0.39 to0.31
0.97 to1.05
-0.52 to0.29
0.99 to1.07
-0.45 to0.32
0.98 to1.07
Ca -0.05 1.03 -0.17 1.08 -0.18 1.08 -0.01 1.00 -0.09 1.04 -0.05 1.02 0.02 0.99
Ca -0.15 to0.04
0.99 to1.07
-0.35 to0.02
0.99 to1.16
-0.33 to-0.02
1.01 to1.15
-0.13 to0.11
0.95 to1.05
-0.24 to0.05
0.98 to1.10
-0.20 to0.09
0.96 to1.09
-0.12 to0.16
0.93 to1.05
CK 0.15 1.00 -0.40 1.01 -1.63 1.02 -1.20 1.01 -0.98 1.03 -0.66 1.02 0.31 0.99
CK -0.19 to0.49
0.99 to1.01
-1.43 to0.62
1.00 to1.03
-2.54 to-0.71
1.00 to1.03
-2.89 to0.50
0.98 to1.03
-2.80 to0.85
1.00 to1.06
-1.48 to0.17
1.00 to1.03
-2.11 to2.74
0.95 to1.03
CKMB 0.23 0.94 -0.62 1.15 -0.15 1.01 0.42 0.87 -0.11 1.03 -0.10 1.01 0.01 0.98
CKMB -0.11 to0.58
0.85 to1.02
-2.29 to1.05
0.74 to1.56
-0.40 to0.09
0.96 to1.06
-1.06 to1.89
0.50 to1.24
-0.55 to0.33
0.91 to1.14
-0.64 to0.44
0.87 to1.15
-0.26 to0.29
0.92 to1.05
FT3 0.08 0.98 -0.18 1.05 -0.20 1.06 -0.01 1.00 -0.08 1.05 -0.24 1.07 -0.06 1.02
FT3 -0.10 to0.26
0.93 to1.03
-0.36 to-0.00
1.00 to1.11
-0.42 to0.03
0.99 to1.12
-0.27 to0.24
0.93 to1.08
-0.52 to0.17
0.96 to1.14
-0.67 to0.20
0.95 to1.18
-0.28 to0.17
0.96 to1.08
FT4 -0.22 1.02 -0.69 1.05 -0.76 1.05 -0.05 1.00 -0.56 1.04 0.73 1.04 -0.17 1.01
FT4 -0.63 to0.19
0.99 to1.04
-1.88 to0.51
0.97 to1.12
-2.40 to0.89
0.95 to1.15
-1.60 to1.49
0.90 to1.09
-1.45 to0.34
0.98 to1.09
-2.01 to0.54
0.97 to1.12
-1.07 to0.74
0.95 to1.06
GGT 0.47 1.00 -0.23 1.01 0.22 1.00 0.44 0.99 -0.15 1.01 -0.95 1.02 -0.78 1.01
GGT 0.12 to0.83
0.98 to1.01
-1.26 to0.80
0.99 to1.03
-0.22 to0.65
0.99 to1.02
-0.35 to1.22
0.97 to1.01
-1.00 to0.70
1.00 to1.03
-2.37 to0.47
1.00 to1.05
-2.53 to0.96
0.98 to1.04
HCGbeta 0.00 1.01 -0.01 1.01 0.00 0.98 0.00 0.97 0.00 1.01 0.00 1.02 0.00 1.01
HCGbeta -0.01 to-0.00
0.98 to1.03
-0.01 to0.00
0.97 to1.05
-0.01 to0.00
0.94 to1.02
0.00 to0.01
0.92 to1.02
-0.01 to0.00
0.97 to1.04
-0.01 to0.00
0.98 to1.05
0.00 to0.00
0.97 to1.05
In the second column from the left (headed 11:22), the triplicates of tubes ‘11’ are compared with the triplicates of tube 22. The constant bias (i.e. intercept) andits 95% confidence intervals (CI) as well as the proportional bias (i.e. slope) and its confidence interval are listed. The confidence intervals for the constant biasshould include 0.00, and that of proportional bias 1.00, in order to prove the identity of the methods. The columns to the right contain identical data forcomparison, 15 versus 10 min centrifugation, 15 versus 7 and 10 versus 7 min. Further to the right, the same comparisons were made for the ‘22’-tubes. The fulllist of comparisons is given as table S1 in additional files.
Histogram
0
20
40
60
80
100
120
140
160
180
200
0.85 0.875 0.9 0.925 0.95 0.975 1 1.025 1.05 1.075 1.1 1.125 1.15 1.175
proportional bias
Freq
uenc
y
Normal Fit(Mean=1.003, SD=0.028)
Figure 2 Distribution of proportional bias: Histogram showingthe distribution of the proportional biases (Slopes). The slopesscatter around the ideal value of 1.00. For comparison, a normaldistribution is depicted.
Minder et al. BMC Clinical Pathology 2011, 11:6http://www.biomedcentral.com/1472-6890/11/6
Page 10 of 15

influenced this estimate. In others, like bicarbonate orsodium, the analytical imprecision combined with asmall measurement range resulted in aberration fromthe 95% confidence interval.As the values of the constant biases (intercepts)
depend on the measurement range of the analyte, nosimilar analysis could be performed. Instead, we ana-lyzed whether deviations accumulate in a certain centri-fugation condition. The 95% confidence interval of theconstant bias did not include the ideal 0.00 value 18times, namely in comparison between tube 11 and tube22: twice; in tube 11 - between centrifugation condition1 and 2: once; between condition 1 and 3: 3 times;between condition 2 and 3: 3 times; in tube 22 -between centrifugation condition 1 and 2: 4 times;between condition 1 and 3: twice and between condition2 and 3: 3 times. Thus, the aberrant values did not clus-ter under any centrifugation condition.In six instances, both constant and proportional bias
confidence intervals did not include the ideal value.These tests were therefore considered as potentially sig-nificantly aberrant. These conditions were listed in table3. In all but one case, condition 3 was involved as testmethod, whereby either condition 1 or 2 were reference.As in all instances, the confidence intervals of the pro-portional bias and constant bias did not include theideal values only marginally, we concluded that theseoutliers were generated only by chance. In order toenable the readers to make his or her own adjudgmenton the significance of these deviations, the scatter plotsof all six conditions including the slopes, their confi-dence intervals, the identity lines and the upper andlower limits of reference where appropriate, are dis-played in Figure 3.The procedure that has been discussed so far, calcu-
lates the probability of identity between the test methodand the reference method (alpha error). For the purposeof this study however, the probability of a deviation
between the two methods i.e. the beta error, is at leastas relevant as the alpha error. The use of patient sam-ples with a sufficiently large measurement range therebyenforced the statistical power.The first estimate of the beta error according to the
description in paragraph 2.4.2 is listed per parameter intable 1. All parameters except for chloride were belowthe allowable limits of the bias, the problem in chloridebeing the physiologically narrow range of sample values.Second, it was tested whether a specified bias could bedetected at the limits of the reference values. As illu-strated in Figure 1, a bias, named allowable bias on thefigure, was pre-specified and the probability calculatedthat such a bias could be detected. In this example, theupper limit of reference is 41 U/L. Five percent of 41are 2.1 indicated on the figure as bias goal. The bias cal-culated from the data corresponds to 0.2, which is muchsmaller than 2.1. The null hypothesis that the bias isequal or larger than the bias goal can be falsified withhigh probability, which excludes a deviation with highprobability.An illustrative sample of the 539 reference limits
tested is given in table 4 and the full information islisted in additional file 2, table S2. 88.9% or 479 of thosetests would detect a 5% bias. Interestingly, chloride waswithin this group. If the allowable bias was set to 10%,20%, 30% and 40%, such biases would be excluded atfurther 48, 8, 3, and 1 reference limits, respectively.These figures correspond to a cumulative frequency of97.8%, 99.2%, 99.8% and 100% of all levels tested. Thecortisol test required the highest allowable biases of alltests for falsifying the null hypothesis, namely, once40%, three times 30%, twice 20% and once 10%. Thisindicates that the number of specimens tested wereinsufficient for cortisol to exclude a bias with sufficientcertainty.We conclude that the conditions used including the
number of measurements, the analytical range and theanalytical imprecision were sufficient to detect a betaerror with sufficient probability.
4. DiscussionOur study shows that the three centrifugation condi-tions tested deliver identical results. Moreover, the sta-tistical power was sufficient to exclude any majordeviation with a high probability. As mentioned before,very few studies on the influence of different centrifuga-tion conditions on laboratory test results have so farbeen published [1-3]. In addition, a number of unpub-lished investigations were made available to us by themanufacturers of tubes or reagents. Our study resultsdo not contradict any of those studies, but rather, theyextent both the number of parameters and the testranges. The number of samples and the spectrum of
Table 3 Tests with confidence intervals of bothproportional and constant bias exceeding the confidenceinterval and indicating a possible lack of identitybetween test and reference method.
Parameter Condition Constant bias Proportionalbias
Bilirubindirect
T 22; C 1 : C 2 0.12 (0.06 to 0.18) 0.99 (0.98 to 0.99)
Bilirubin total T 11; C 2 : C 3 0.24 (0.04 to 0.44) 0.96 (0.94 to 0.99)
Calcium T 11; C 1 : C 3 -0.18 (-0.33 to -0.02) 1.08 (1.01 to 1.15)
Folic acid T 22; C 2 : C 3 0.98 (0.24 to 1.72) 0.95 (0.91 to 0.99)
Iron T 22; C 1 : C 3 -0.22 (-0.43 to -0.02) 1.02 (1.01 to 1.03)
Transferrin T 22; C 2 : C 3 -0.84 (-1.67 to -0.02) 1.04 (1.01 to 1.06)
T: tube; C: centrifugation condition as listed under section 2: Patients,materials and methods.
Minder et al. BMC Clinical Pathology 2011, 11:6http://www.biomedcentral.com/1472-6890/11/6
Page 11 of 15
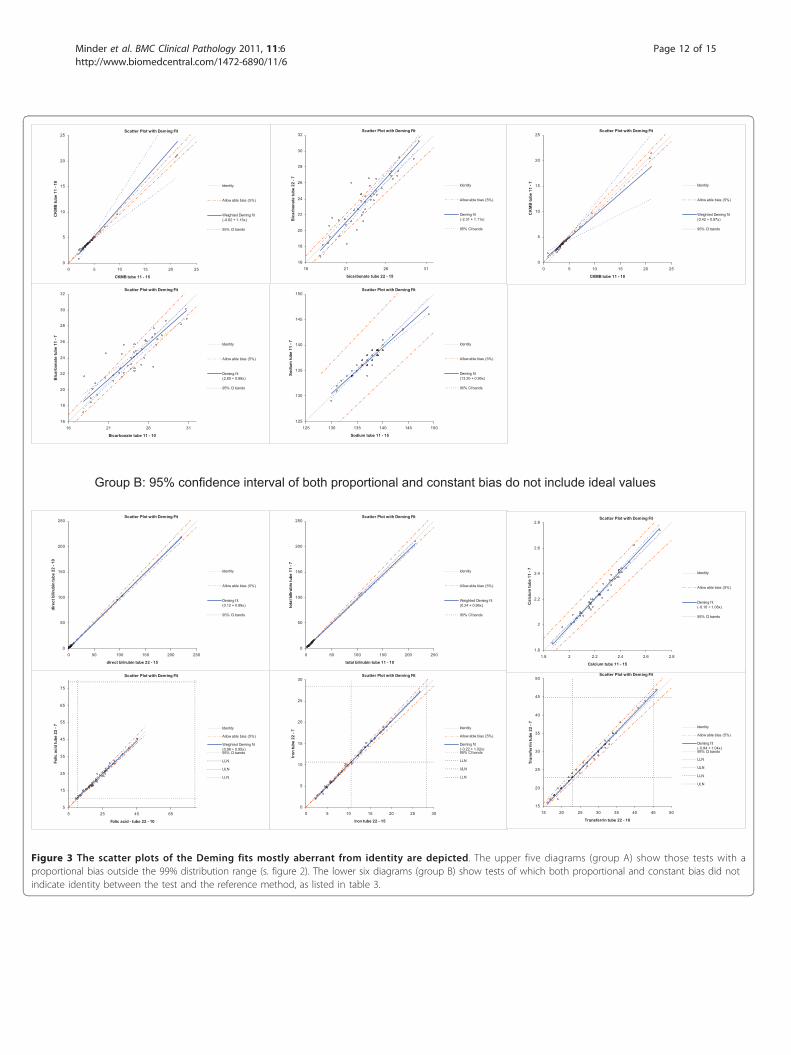
Group B: 95% confidence interval of both proportional and constant bias do not include ideal values
Scatter Plot with Deming Fit
16
18
20
22
24
26
28
30
32
16 21 26 31
bicarbonate tube 22 - 15
Bic
arbo
nate
tube
22
- 7
Identity
Allow able bias (5%)
Deming f it(-2.31 + 1.11x)
95% CI bands
Scatter Plot with Deming Fit
0
5
10
15
20
25
0 5 10 15 20 25
CKMB tube 11 - 15
CK
MB
tube
11
- 10
Identity
Allow able bias (5%)
Weighted Deming f it(-0.62 + 1.15x)
95% CI bands
Scatter Plot with Deming Fit
16
18
20
22
24
26
28
30
32
16 21 26 31
Bicarbonate tube 11 - 10
Bic
arbo
nate
tube
11
- 7
Identity
Allow able bias (5%)
Deming f it(2.80 + 0.88x)
95% CI bands
Scatter Plot with Deming Fit
125
130
135
140
145
150
125 130 135 140 145 150
Sodium tube 11 - 15
Sodi
um tu
be 1
1 - 7 Identity
Allow able bias (5%)
Deming f it(13.20 + 0.90x)
95% CI bands
Scatter Plot with Deming Fit
0
5
10
15
20
25
0 5 10 15 20 25
CKMB tube 11 - 10
CK
MB
tube
11
- 7 Identity
Allow able bias (5%)
Weighted Deming f it(0.42 + 0.87x)
95% CI bands
Scatter Plot with Deming Fit
5
15
25
35
45
55
65
75
5 25 45 65
Folic acid - tube 22 - 10
Folic
aci
d tu
be 2
2 - 7 Identity
Allow able bias (5%)
Weighted Deming f it(0.98 + 0.95x)95% CI bands
LLN
ULN
LLN
Scatter Plot with Deming Fit
0
5
10
15
20
25
30
0 5 10 15 20 25 30
Iron tube 22 - 15
Iron
tube
22
- 7
Identity
Allow able bias (5%)
Deming f it(-0.22 + 1.02x)95% CI bands
LLN
ULN
LLN
Scatter Plot with Deming Fit
15
20
25
30
35
40
45
50
15 20 25 30 35 40 45 50
Transferrin tube 22 - 10
Tran
sfer
rin tu
be 2
2 - 7 Identity
Allow able bias (5%)
Deming f it(-0.84 + 1.04x)95% CI bands
LLN
ULN
LLN
ULN
Scatter Plot with Deming Fit
0
50
100
150
200
250
0 50 100 150 200 250
direct bilirubin tube 22 - 15
dire
ct b
iliru
bin
tube
22
- 10
Identity
Allow able bias (5%)
Deming f it(0.12 + 0.99x)
95% CI bands
Scatter Plot with Deming Fit
0
50
100
150
200
250
0 50 100 150 200 250
total bilirubin tube 11 - 10
tota
l bili
rubi
n tu
be 1
1 - 7
Identity
Allow able bias (5%)
Weighted Deming f it(0.24 + 0.96x)
95% CI bands
Scatter Plot with Deming Fit
1.8
2
2.2
2.4
2.6
2.8
1.8 2 2.2 2.4 2.6 2.8
Calcium tube 11 - 15
Cal
cium
tube
11
- 7 Identity
Allow able bias (5%)
Deming f it(-0.18 + 1.08x)
95% CI bands
Figure 3 The scatter plots of the Deming fits mostly aberrant from identity are depicted. The upper five diagrams (group A) show those tests with aproportional bias outside the 99% distribution range (s. figure 2). The lower six diagrams (group B) show tests of which both proportional and constant bias did notindicate identity between the test and the reference method, as listed in table 3.
Minder et al. BMC Clinical Pathology 2011, 11:6http://www.biomedcentral.com/1472-6890/11/6
Page 12 of 15

tests were relatively small in all preceding studies and,as the samples mostly from healthy persons were ana-lyzed, the measurement ranges were relatively narrow,which altogether resulted in a relatively large beta-error.However, no beta error was ever calculated in the pre-vious studies despite its significance.
In this study, a total of 14690 data pairs of quantitativeclinical chemistry and immunology tests, acquired bycomparing six different conditions and three different cen-trifugation regimens, were analyzed in 357 Deming proce-dures. Most of the comparisons showed excellentreproducibility indicating that the different centrifugation
Table 4 Excerpt of a list of the probabilities to detect a 5% bias with 95% certainty at the limits of the referenceranges limited to the comparison of tubes 11 to tubes 22.
11:22 11:22
Analyse Ref. limits Bias 95% Cl SE Bias Goal p Analyse Ref. limits Bias 95% Cl SE Bias Goal p
Alb 35 0.3 0.0 to 0.5 0.12 1.8 <0.0001 HDL 0.9 0.0 0.0 to 0.0 0.00 0.0 <0.0001
Alb 58 1.6 -0.1 to 3.3 0.85 2.9 0.0683 Iron 10.6 0.1 0.0 to 0.2 0.05 0.5 <0.0001
AP 117 0.5 -0.3 to 1.2 0.39 5.9 <0.0001 Iron 28.3 0.4 0.1 to 0.8 0.17 1.4 <0.0001
ALTL 41 0.2 -0.1 to 0.6 0.19 2.1 <0.0001 K 3.5 0.0 0.0 to 0.1 0.01 0.2 <0.0001
Amy-P 53 0.0 -0.4 to 0.5 0.23 2.7 <0.0001 K 4.5 0.0 0.0 to 0.1 0.03 0.2 <0.0001
Amyl 100 1.0 0.3 to 1.7 0.35 5.0 <0.0001 LDH 288 10.1 0.9 to 19.3 4.56 14.4 0.1746
ASTL 37 0.2 -0.2 to 0.6 0.19 1.9 <0.0001 LDL 3.9 0.1 0.0 to 0.2 0.04 0.2 0.0019
Bili-D 2 0.0 0.0 to 0.1 0.03 0.1 0.0039 Lipe 60 0.5 0.0 to 1.1 0.28 3.0 <0.0001
Bili-T 20 0.0 -0.2 to 0.3 0.13 1.0 <0.0001 Mg 0.75 0.0 0.0 to 0.0 0.00 0.0 0.0138
Ca 2.02 0.0 0.0 to 0.0 0.01 0.1 <0.0001 Mg 1.25 0.0 0.0 to 0.0 0.01 0.1 <0.0001
Ca 2.6 0.0 0.0 to 0.0 0.01 0.1 <0.0001 Myo 28 0.2 -0.2 to 0.5 0.16 1.4 <0.0001
CHE 3000 -7.7 -61.1 to 45.7 26.47 150.0 <0.0001 Myo 72 -0.3 -0.9 to 0.3 0.31 3.6 <0.0001
CHE 11000 132.0 8.9 to 255.0 60.99 550.0 <0.0001 Na 135 0.1 -0.2 to 0.3 0.13 6.8 <0.0001
Chol 3.1 0.0 -0.1 to 0.0 0.03 0.2 <0.0001 Na 145 -0.5 -1.2 to 0.2 0.34 7.3 <0.0001
Chol 6.5 0.1 0.0 to 0.2 0.07 0.3 0.0011 Phos 0.87 0.0 0.0 to 0.0 0.01 0.0 <0.0001
CK 195 0.8 -0.9 to 2.5 0.82 9.8 <0.0001 Phos 1.45 0.0 0.0 to 0.0 0.01 0.1 <0.0001
CKMB 4.94 -0.1 -0.2 to 0.0 0.04 0.2 <0.0001 Pro-BNP 125 0.3 -0.9 to 1.6 0.63 6.3 <0.0001
CO2 22 -0.1 -0.4 to 0.1 0.11 1.1 <0.0001 PTH 1.59 0.0 -0.1 to 0.1 0.04 0.1 0.0435
CO2 29 -0.4 -0.7 to -0.0 0.17 1.5 <0.0001 PTH 9.33 -0.1 -0.3 to -0.0 0.05 0.5 <0.0001
Cort 82 0.9 -5.3 to 7.1 3.07 4.1 0.1509 RubG 10 0.0 -0.4 to 0.4 0.19 0.5 0.0111
Cort 958 0.3 -10.4 to 10.9 5.27 47.9 <0.0001 T3 1.3 0.0 0.0 to 0.0 0.01 0.1 <0.0001
Crea 59 0.1 -0.4 to 0.7 0.29 3.0 <0.0001 T3 3.1 0.0 -0.1 to 0.1 0.05 0.2 0.0054
Crea 104 0.0 -0.5 to 0.4 0.23 5.2 <0.0001 TN-T 0.01 0.0 0.0 to 0.0 0.00 0.0 <0.0001
CRP 10 0.1 -0.1 to 0.2 0.08 0.5 <0.0001 TNT-hs 0.014 0.0 0.0 to -0.0 0.00 0.0 <0.0001
Cl 97 0.1 -0.3 to 0.5 0.18 4.9 <0.0001 ToxoG 1 0.0 0.0 to 0.0 0.00 0.1 <0.0001
Cl 110 0.0 -0.4 to 0.4 0.20 5.5 <0.0001 TP 66 0.4 0.0 to 0.8 0.19 3.3 <0.0001
Ferri 30 -0.1 -0.4 to 0.2 0.15 1.5 <0.0001 TP 87 0.8 -0.4 to 2.0 0.59 4.4 <0.0001
Ferri 400 2.7 -0.9 to 6.2 1.77 20.0 <0.0001 Trigl 2.3 0.0 0.0 to 0.0 0.01 0.1 <0.0001
Fol 10.4 -0.1 -0.6 to 0.4 0.24 0.5 0.0484 Trfe 23 0.1 -0.1 to 0.3 0.09 1.2 <0.0001
Fol 78.9 1.6 -0.9 to 4.1 1.25 3.9 0.0343 Trfe 45 1.0 -0.2 to 2.3 0.62 2.3 0.0273
FT3 3.1 0.0 0.0 to 0.1 0.02 0.2 <0.0001 TSH 0.34 0.0 0.0 to 0.0 0.01 0.0 0.0873
FT3 6.8 -0.1 -0.2 to 0.1 0.07 0.3 0.0003 TSH 5.6 0.0 -0.1 to 0.1 0.05 0.3 <0.0001
FT4 12 0.0 -0.1 to 0.1 0.06 0.6 <0.0001 UA 420 0.9 -0.4 to 2.2 0.63 21.0 <0.0001
FT4 22 0.2 -0.1 to 0.4 0.11 1.1 <0.0001 Ureal 3 0.0 0.0 to 0.0 0.01 0.2 <0.0001
GGT 49 0.2 -0.1 to 0.6 0.18 2.5 <0.0001 Ureal 8 0.0 0.0 to 0.0 0.01 0.4 <0.0001
Gluc 3.9 0.0 -0.1 to 0.1 0.06 0.2 0.0029 VitB12 133 1.8 -2.5 to 6.1 2.15 6.7 0.0144
Gluc 5.8 0.0 0.0 to 0.1 0.04 0.3 <0.0001 VitB12 675 0.8 -7.7 to 9.3 4.20 33.8 <0.0001
HAV 20 0.0 -0.1 to 0.1 0.04 1.0 <0.0001 VitD 75 0.6 -1.0 to 2.3 0.80 3.8 0.0002
HCGbeta 2 0.0 0.0 to 0.1 0.02 0.1 0.0002
Those conditions not sensitive enough to detect a 5% bias were retested for a 10, 20, 30 or 40% bias (data not shown). The column heading Ref. limits meanslimits of reference ranges. At these concentrations of the analyte, the probability was tested to detect a 5% bias. Bias: The calculated deviation of the Demingregression line and its 95% confidence intervals (CI) and the standard error are given. Bias goal corresponds to a 5% deviation of the Deming regression linefrom identity at the tested analyte concentration. The full information on all comparisons is given in supplemental Table S2.
Minder et al. BMC Clinical Pathology 2011, 11:6http://www.biomedcentral.com/1472-6890/11/6
Page 13 of 15

conditions used did not affect the outcome of laboratorytesting. The percentage of statistical tests outside the 95%confidence limits was below the number expected for ran-dom variations. Corrections of the p-values for multipletesting could be performed, such as the Bonferroni correc-tions. However, such procedure would increase the beta-error that, in our opinion, is at least as informative as thealpha-error for the purpose of our study. We preferred toanalyze those outlier data to see whether they show anyevidence of significant bias, and found evidence of randomaberration rather than any statistical significant bias. Theonly way to ascertain our conclusion on the randomnessof outliers would be a repetitious examination under iden-tical conditions to exclude or confirm those aberrantvalues. We believe that we have provided sufficient data toconvince the readers on randomness of these outliers andthat the three centrifugation conditions as well as the twodifferent gel separators of Greiner Bio-One provided iden-tical results on a Cobas 6000 system of Roche Diagnostics.The beta errors calculated by two separate methods
confirmed a sufficient power of our analyses to detectsignificant deviations. The first of the two methodsrelied on regulatory limits either from USA or fromSwitzerland supplemented with our clinical estimates.The second one tests the biases at the limits of refer-ence values to see whether they exceed a pre-specifiedbias. The reference limits were chosen for this purpose,as they discriminate between “normal” and “pathologi-cal” values, and deviations at these limits would result in“falsely normal” or “falsely pathological” results.In addition to the quantitative tests, data from 23 qua-
litative tests or quantitative tests with little or no mea-surable concentrations did not provide any discrepantresults. However, these tests were not statisticallyevaluated.
5. ConclusionsOur study provided substantial evidences that the cen-trifugation condition from the WHO guideline, theconditions of 10 min centrifugation time at 2180 gand of 7 min at 1870 g were equally effective to theperformance of the subsequent laboratory analyses.Each of these conditions can be applied to a broadrange of clinical chemistry and immunology tests, pro-vided that specified tubes and analytical conditionswere used (see section 2). Laboratories that have beenhitherto accommodating the WHO recommendationsare now having the possibility of reducing their centri-fugation time to less than half of the original amountand in turn, to reduce their overall TAT significantly.Those laboratories that so far are reluctant to switchfrom serum to heparinized plasma because of the pro-longed centrifugation time, can now have a secondthought.
Additional material
Additional file 1: (Table S1): Deming fit results from all analyticalparameters and centrifugation conditions. The results are displayed asoutlined in the legend to table 2.
Additional file 2: (Table S2): Probabilities to detect a 5% bias with95% certainty at the limits of the reference ranges for allparameters and all centrifugation conditions (beta error). The resultsare displayed as outlined in the legend to table 4.
AcknowledgementsThis work was supported by Greiner Bio-One and Roche Diagnostics. Wethank Ms Tanja Feusi for the skilful technical assistance, the patients and thenursing staff of internal medical wards for their collaboration and Prof. X.Schneider-Yin for the linguistic corrections of the manuscript.
Author details1Stadtspital Triemli, Central laboratory Birmensdorferstrasse 497 CH-8063Zürich Switzerland. 2Stadtspital Triemli, Department for Internal MedicineBirmensdorferstrasse 497 CH-8063 Zürich Switzerland.
Authors’ contributionsEIM designed the study and wrote the manuscript, AS organized andsupervised the blood drawings on the wards, DM and PN participated in thedesign of the study, organized and supervised the sample centrifugationand analyses of the samples, KP collected the data and performed thestatistical analyses. All authors read and approved the final manuscript.
Competing interestsThe authors declare that they have no competing interests.
Received: 13 January 2011 Accepted: 10 May 2011Published: 10 May 2011
References1. Foster K, Datta P, Orswell M, Tasaico K, Alpert A, Bluestein B: Evaluation of
a centrifuge with rapid turnaround time for the preparation of plasmasamples for measurement of common STAT markers on the ACS: 180system 1. Clin Lab 2000, 46:157-160.
2. Lippi G, Salvagno GL, Montagnana M, Guidi GC: Preparation of a QualitySample: Effect of Centrifugation Time on Stat Clinical Chemistry Testing.Labmed 2007, 38:172-176.
3. Mensel B, Wenzel U, Roser M, Ludemann J, Nauck M: Considerablyreduced centrifugation time without increased hemolysis: evaluation ofthe new BD Vacutainer SSTTMII Advance. Clin Chem 2007, 53:794-795.
4. Calam RR, Bessman JD, Ernst DJ, Smith S, Szamosi DI, Warunek DJ,Wiseman JD: Procedures for the handling and processing of bloodspecimens; approved guideline. Wayne USA: CLSI; 2004, HA18-A3. CLSIGuidelines;24(38).
5. Kiechle FL, Betson F, Blackeney J, Calam RR, Catalasan IM, Raj P, Sadek W,Smith SR, Tang YW, Tomazic-Allen S: Procedures for the handling andprocessing of blood specimens; approved guideline. Wayne USA: CLSI;2010, HA18-A4-A3. CLSI Guidelines;30(10).
6. WHO: Use of anticoagulants in diagnostic laboratory investigations.WHO/DIL/LAB/99.1/Rev2. 2002.
7. Mengozzi G, Rossato D, Bertello C, Garrone C, Milan A, Pagni R, Veglio F,Mulatero P: Rapid cortisol assay during adrenal vein sampling in patientswith primary aldosteronism. Clin Chem 2007, 53:1968-1971.
8. Johnson LR, Doherty G, Lairmore T, Moley JF, Brunt LM, Koenig J, Scott MG:Evaluation of the performance and clinical impact of a rapidintraoperative parathyroid hormone assay in conjunction withpreoperative imaging and concise parathyroidectomy. Clin Chem 2001,47:919-925.
9. Bowen RA, Chan Y, Cohen J, Rehak NN, Hortin GL, Csako G, Remaley AT:Effect of blood collection tubes on total triiodothyronine and otherlaboratory assays. Clin Chem 2005, 51:424-433.
10. 2011 [http://en.wikipedia.org/wiki/Deming_regression], (accessed 14.Feb.2011).
Minder et al. BMC Clinical Pathology 2011, 11:6http://www.biomedcentral.com/1472-6890/11/6
Page 14 of 15

11. Linnet K: Performance of Deming regression analysis in case ofmisspecified analytical error ratio in method comparison studies. ClinChem 1998, 44:1024-1031.
12. Hartmann C, Smeyers-Verbeke S, Penninckx W, Massart DL: Detection ofbias in a method comparison by regression analysis. Anal Chim Acta1997, 338:19-40.
13. Health care financing Administration, Public Health Service: Medicare,Medicaid and CLIA Programs; Regulations Implementing the ClinicalLaboratory Improvement Amendmets of 1988 (CLIA). Federal Registry1992, 57:7002-7186.
14. Externe obligatorische Qualitätskontrolle. 2010 [http://www.qualab.ch/CQE_2010_03_d.pdf], accessed 10.Aug.2010.
Pre-publication historyThe pre-publication history for this paper can be accessed here:http://www.biomedcentral.com/1472-6890/11/6/prepub
doi:10.1186/1472-6890-11-6Cite this article as: Minder et al.: Effects of different centrifugationconditions on clinical chemistry and Immunology test results. BMCClinical Pathology 2011 11:6.
Submit your next manuscript to BioMed Centraland take full advantage of:
• Convenient online submission
• Thorough peer review
• No space constraints or color figure charges
• Immediate publication on acceptance
• Inclusion in PubMed, CAS, Scopus and Google Scholar
• Research which is freely available for redistribution
Submit your manuscript at www.biomedcentral.com/submit
Minder et al. BMC Clinical Pathology 2011, 11:6http://www.biomedcentral.com/1472-6890/11/6
Page 15 of 15