effects of different exercise intensity and volume on
TRANSCRIPT

i
Effects of different exercise intensity
and volume on markers of
mitochondrial biogenesis in human
skeletal muscle
by
Cesare Granata
MSc Chem
College of Sport and Exercise Science
Institute of Sport, Exercise and Active Living
Victoria University - Melbourne, Australia
Principal Supervisor: Prof. David J. Bishop
Associate Supervisors: Dr. Kathrin Renner & Asst. Prof. Jonathan P. Little
***
Submitted in fulfilment of the requirements of the degree of
Doctor of Philosophy
April 2015

ii

iii
Abstract
Mitochondria are key components of skeletal muscles as they provide the energy required
for almost all cellular activities, and play an important role in ageing and cell pathology.
Different forms of exercise training have been associated with mitochondrial adaptations,
such as increased mitochondrial content and function, and enhanced mitochondrial
biogenesis, as well as improved endurance performance. However, the role of training
intensity and training volume, in determining these changes remains elusive. Therefore, the
aim of this thesis was to investigate the role of training intensity and volume on changes in
mitochondrial content and function (as measured by mitochondrial respiration in
permeabilised muscle fibres), in the skeletal muscle of healthy humans, and to study the
molecular mechanisms underlying these changes. It was demonstrated that training
intensity is a key factor regulating changes in mitochondrial respiration, but not
mitochondrial content, and that an apparent dissociation exists between changes in these
two parameters. Training consisting of repeated 30-s “all-out” sprints lead to improved
mitochondrial (mt)-specific respiration (indicative of improved mitochondrial quality).
Conversely, training volume was shown to be a key factor regulating mitochondrial content,
with the associated increase in mitochondrial respiration being likely driven by the increase
in mitochondrial content (i.e., unchanged mt-specific respiration). A training volume
reduction resulted in a rapid decrease in most mitochondrial parameters, underlining the
importance of maintaining the training stimulus to preserve training-induced mitochondrial
adaptations. The protein content of PGC-1α, p53 and PHF20 was shown to be regulated in
a training intensity-dependent manner, and was more strongly associated with changes in
mitochondrial respiration rather than content, whereas changes in the protein content of
TFAM were primarily associated with changes in mitochondrial content. Moreover, it was
demonstrated that exercise intensity induced an increase in nuclear PGC-1α protein content
and nuclear p53 phosphorylation, two events that may represent the initial phase of different
pathways of the exercise-induced adaptive response. Collectively, this research provides
novel information regarding mitochondrial adaptations to different training stimuli, and
could have important implications for the design of exercise programs in conditions of
compromised mitochondrial function.

iv

v
Student Declaration
I, Cesare Granata, declare that the PhD thesis entitled “Effects of different exercise
intensity and volume on markers of mitochondrial biogenesis in human skeletal muscle”,
is no more than 100,000 words in length including quotes and exclusive of tables, figures,
appendices, bibliography, references and footnotes. This thesis contains no material that
has been submitted previously, in whole or in part, for the award of any other academic
degree or diploma. Except where otherwise indicated, this thesis is my own work”.
Signature: Date: 30/04/2015

vi

vii
Acknowledgements
What an amazing journey it has been!
First I would like to thank Dave for offering me the chance, for constantly providing
directions, for guiding me through this journey with his “always-there – hands-off”
presence, and for the time spent revising revised drafts of already revised previous drafts.
I really appreciate all you have done during this time...thanks!
Thanks to Jon, for opening me the door to his lab when I was just a name from the other
side of the globe, for his great knowledge, for his 2-line emails somehow answering 7
different questions, and for his infamous parties. It was brilliant!
And many thanks to Kathrin for teaching me the art of mitochondrial respiration, and for
having the patience to answer question after question, and guiding me step-by-step most
of all at the beginning.
And what about the Rocketship! Man your help at the beginning (and what a long
beginning it was) has been incredible. That first study of ours was just about
overtraining...but not for them though, for us! Thanks for your time, thanks for all your
help in both labs, and thanks for setting priorities straight in my head that night in the
biochem lab, it went downhill from there.
Thanks to Elise, Andrew and Martinello, and your always-positive attitude; I would have
never finished those two studies and all those westerns had your help not been amazing.
Thanks to JJ for having the patience to teach me so many things in this last year, to Cian
for his help with, well...so many things, to grandpa and Cody for making Kelowna very
special, and to all the people that helped along the way. To Raul, Andrew, Wei and Rosie
for keeping me sane one way or another with food or rides.
Mao, thanks for having been there every single day at the beginning, despite being in
Europe, and making me realise an ironman begins with a simple stroke, and then another
one. Cazzimma pura! Thanks to Alicia for just being there, always, every time, and for
reminding me to...just-keep-swimming, just-keep-swimming! Gilbert, you have been like
a father, always believing in me, and constantly reminding me I should do the same!

viii
Chris, thanks for your help at the beginning, those email were like food. And Franz, you
came all the way down to spend time with me, and even lent yourself to testing, great way
to spend your annual leave! All of you guys have brought me to the line, and way beyond.
Grazie un casino!
Also, thanks to Nic for just deciding it was worth listening to me, and to Peter for just
reminding me to stop, step back, and be fair to myself.
Mamma, papà, grazie per tutto quello che avete fatto negli anni, e per quello che avete
fatto in questi ultimi tempi del PhD in particolare, e per avermi sempre dimostrato che si
può sempre andare oltre. Siete lontani, ma vi sento un sacco vicini.
And thanks to Pa, for helping me with everything, and for having the patience to spend
her free time with me at VU, running biopsy trials, labelling everything, and even
separating nuclei in the lab. You have been very patient, supportive, relaxing (well, for
as much as I can get relaxed), but most of all so very delicate. Thanks a lot for having
walked alongside for all this time.
I loved it!

ix
List of Publications, Conferences and
Awards
Publications
Granata C, Oliveira RSF, Little JP, Renner K and Bishop DJ (2015). Training
intensity modulates changes in mitochondrial respiration, and PGC-1α and p53
protein content, but not markers of mitochondrial content The FASEB Journal
(under review).
Granata C, Oliveira RSF, Little JP, Renner K and Bishop DJ (2015). Training-
induced mitochondrial adaptations to intensive training are rapidly reversed
following a reduction in training volume in human skeletal muscle. FASEB
Journal (ready for submission).
Granata C, Oliveira RSF, Little JP, Renner K and Bishop DJ (2015). Modulation of
the exercise-induced adaptive response mediated by PGC-1 and p53, in enriched
subcellular fractions of human skeletal muscle. Journal of Physiology (final stages
of preparation).
Bishop DJ, Granata C, & Eynon N 2014. Can we optimise the exercise training
prescription to maximise improvements in mitochondria function and content?
Biochimica Et Biophysica Acta-General Subjects, 1840, 1266-1275.

x
First Author Conference Abstracts
Granata C, Oliveira RSF, Little JP, Renner K, Bishop DJ. Exercise-induced modulation
of PGC-1α and p53 in enriched subcellular fractions of human skeletal muscle. 16th
International Biochemistry of Exercise Congress (IBEC). September 7th – 9th, 2015. São
Paulo, Brazil.
Granata C, Oliveira RSF, Little JP, Renner K, Bishop DJ. Training intensity-dependent
regulation of mitochondrial respiration in human skeletal muscle: an effect modulated by
the transcription factors PGC-1α, p53 and PHF20. Australian Physiological Society
Meeting (AuPS). November 30th – December 3rd, 2014. Brisbane, Australia.
Granata C, Oliveira RSF, Renner K, Little JP, Bishop DJ. Effects of three different
training intensities on mitochondrial respiration and endurance performance in humans.
Canadian Society for Exercise Physiology (CSEP). October 9th – 16th, 2013. Toronto,
Canada.
Granata C, Brentnall EL, Oliveira RSF, Stepto NK, Renner K, Bishop DJ. Mitochondrial
adaptations to different training stimuli: the remarkable plasticity of skeletal muscle
oxidative capacity. FEBS workshop & MiP summer school. July 3rd – 7th, 2012,
Cambridge, UK.
Granata C, Oliveira RSF, Stepto NK, Renner K, Bishop DJ. Effects of three weeks of
intensified training and two weeks of taper on mitochondrial respiration in humans. 17th
Annual Congress of the ECSS. July 4th – 7th, 2012. Bruges, Belgium.

xi
Co-authored Conference Abstracts
Bishop DJ, Granata C, Oliveira RSF, Little JP, Renner K. (2015). Mitochondrial
function and content are increased by different types of training in human skeletal muscle.
20th Annual Congress of the ECSS. June 24th – 27th, 2015. Malmö, Sweden.
Oliveira RSF, McGinley C, Granata C, Pilegaard H, Bishop DJ. Effects of high-intensity
interval exercise, under either induced metabolic acidosis or alkalosis, on the regulation
of genes associated with the acid-base regulation in human skeletal muscle. Australian
Physiological Society Meeting (AuPS). November 30th – December 3rd, 2014. Brisbane,
Australia.
Bishop DJ, Granata C, Brentnall EL, Renner K, Oliveira RSF. Mitochondrial
adaptations to intense exercise training and detraining. XXXVII International Union of
Physiological Societies (IUPS). July 21st – 26th, 2013. Birmingham, UK.
Delfour-Peyrethon R, Thomas C, Hanon C, Granata C, Bishop DJ. Mitochondrial
respiration changing after repeated-cycling-sprints performed under classic acidosis and
induced-alkalosis (Poster). 18th Annual Congress of the ECSS. June 26th – 29th, 2013.
Barcelona, Spain.
Bishop DJ, Granata C, Eynon N. Can we optimize exercise training to improve
mitochondrial respiration? AussieMit. December 10th – 12th, 2012. Melbourne, Australia.
Bishop DJ, Ferri A, Granata C, Oliveira RSF, Hedges C, Miserocchi G, Lima-Silva AE.
The effects of normobaric hypoxia on mitochondrial respiration in humans. 17th Annual
Congress of the ECSS. July 4th – 7th, 2012. Bruges, Belgium.

xii
Awards
2010 International Postgraduate Research Scholarship (VUIPRS)
Awarded by: Victoria University, Melbourne, Australia
Amount: Au$ 22,500
Purpose: Living allowance

xiii
Table of Contents
Abstract ............................................................................................................................ iii
Student Declaration .......................................................................................................... v
Acknowledgements ........................................................................................................ vii
List of Publications, Conferences and Awards ................................................................ ix
Table of Contents .......................................................................................................... xiii
List of Figures ............................................................................................................... xvii
List of Tables ................................................................................................................. xxi
List of abbreviations .................................................................................................... xxiii
Chapter 1 Review of Literature ..................................................................................... 1
1.1 Skeletal muscle and mitochondria .................................................................... 3
1.2 Mitochondrial biogenesis ................................................................................. 6
1.3 Techniques for the assessment of mitochondrial biogenesis ............................ 9
1.3.1 Mitochondrial protein synthesis ................................................................. 9
1.3.2 Mitochondrial content .............................................................................. 10
1.3.2.1 Histological methods .......................................................................... 10
1.3.2.1.1 Transmission electron microscopy ............................................... 10
1.3.2.1.2 Fluorescent microscopy ................................................................ 10
1.3.2.2 Biochemical methods ......................................................................... 11
1.3.2.2.1 Protein content of mitochondrial proteins .................................... 11
1.3.2.2.2 Mitochondrial enzyme activity ...................................................... 11
1.3.2.2.3 Cardiolipin content ....................................................................... 12
1.3.2.2.4 Mitochondria DNA content ........................................................... 12
1.3.2.2.5 Summary ....................................................................................... 13
1.3.3 Mitochondrial function ............................................................................. 13

xiv
1.3.3.1 Invasive measurements ....................................................................... 14
1.3.3.1.1 Mitochondrial respiration ............................................................. 14
1.3.3.1.2 Mitochondrial ATP production rate ............................................. 16
1.3.3.2 Non-invasive measurements ............................................................... 16
1.3.3.2.1 Phosphorus magnetic resonance spectroscopy ............................ 17
1.3.3.2.2 Near-infrared spectroscopy .......................................................... 17
1.3.4 Protein and gene expression of transcription factors, coactivators, and key
regulatory proteins .................................................................................................. 17
1.4 Cellular mechanisms of exercise-induced mitochondrial biogenesis ............. 18
1.4.1 Cell signalling ........................................................................................... 20
1.4.1.1 Calcium and the role of CAMKII ....................................................... 20
1.4.1.2 ATP turnover and the energy sensor AMPK ...................................... 22
1.4.1.3 Redox state, NAD+ and the metabolic sensor SIRT1 ......................... 24
1.4.1.4 Oxidative stress, ROS, and the role of the MAPKs............................ 26
1.4.2 Coactivators and regulators of mitochondrial biogenesis......................... 27
1.4.2.1 PGC-1α, the master regulator of mitochondrial biogenesis ............... 27
1.4.2.2 p53, “guardian of the genome” and metabolic regulator .................... 31
1.4.2.3 TFAM, a mitochondrial transcription factor ...................................... 36
1.4.3 Summary ................................................................................................... 37
1.5 Exercise training and mitochondrial adaptations............................................ 37
1.5.1 Exercise- and training-induced changes in mitochondrial content ........... 40
1.5.1.1 Effects of training volume .................................................................. 45
1.5.1.2 Effects of training intensity ................................................................ 46
1.5.1.3 Summary ............................................................................................. 48
1.5.2 Exercise- and training-induced changes in mitochondrial respiration ..... 49

xv
1.5.3 Exercise- and training-induced changes in the gene and protein expression
of regulators of mitochondrial biogenesis .............................................................. 52
1.5.3.1 PGC-1α ............................................................................................... 53
1.5.3.1.1 Exercise-induced changes in PGC-1α gene and protein expression
58
1.5.3.1.2 Training-induced changes in PGC-1α protein content ................ 62
1.5.3.2 p53 ...................................................................................................... 67
1.5.3.3 TFAM ................................................................................................. 69
1.5.4 Summary ................................................................................................... 69
1.6 Future research: a holistic approach to training-induced mitochondrial
adaptations .................................................................................................................. 70
Chapter 2 Effects of training intensity on markers of mitochondrial biogenesis ........ 73
2.1 Introduction .................................................................................................... 75
2.2 Methods .......................................................................................................... 77
2.3 Results ............................................................................................................ 87
2.4 Discussion ....................................................................................................... 98
Chapter 3 Effects of training volume on markers of mitochondrial biogenesis........ 107
3.1 Introduction .................................................................................................. 109
3.2 Methods ........................................................................................................ 111
3.3 Results .......................................................................................................... 121
3.4 Discussion ..................................................................................................... 129
Chapter 4 Effect of exercise intensity on PGC-1 and p53 in subcellular fractions of
human skeletal muscle .................................................................................................. 139
4.1 Introduction .................................................................................................. 141
4.2 Methods ........................................................................................................ 143
4.3 Results .......................................................................................................... 151
4.4 Discussion ..................................................................................................... 157

xvi
Chapter 5 Conclusions and future directions ............................................................ 165
5.1 Summary of key findings ............................................................................. 165
5.2 The role of exercise intensity: findings and future directions ...................... 167
5.3 The role of training volume: findings and future directions ......................... 170
5.4 Significance and practical applications ........................................................ 172
References .................................................................................................................... 173
Appendices ................................................................................................................... 209

xvii
List of Figures
Figure 1.1. Structure of a mitochondrion ......................................................................... 4
Figure 1.2. The electron transport system (ETS) and oxidative phosphorylation
(OXPHOS) ....................................................................................................................... 5
Figure 1.3. Electron micrographs showing (A) subsarcolemmal (SS), and (B)
intermyofibrillar (IMF) mitochondria .............................................................................. 6
Figure 1.4. Schematic of transcriptional activity leading to exercise-induced
mitochondrial biogenesis ................................................................................................ 20
Figure 1.5. Exercise-induced signalling of PGC-1α transcriptional activity.................. 29
Figure 1.6. Regulation of mitochondrial biogenesis by p53........................................... 32
Figure 1.7. Mitochondrial respiration and citrate synthase (CS) activity in humans of
differing training status ................................................................................................... 39
Figure 1.8. The relationship between training volume and training-induced changes in
citrate synthase (CS) activity in the vastus lateralis muscle of healthy human participants
........................................................................................................................................ 47
Figure 1.9. The relationship between training intensity and training-induced changes in
citrate synthase (CS) activity in the vastus lateralis muscle of healthy human participants
........................................................................................................................................ 48
Figure 1.10. Timing of PGC-1α mRNA upregulation from the termination of a single
exercise bout in the vastus lateralis muscle of healthy human participants ................... 59
Figure 1.11. . Skeletal muscle PGC-1α mRNA changes following 7 sessions of HIIT
(cycling). ......................................................................................................................... 60
Figure 1.12. Time course of changes in PGC-1α protein content .................................. 67

xviii
Figure 2.1. Training intensity expressed as percent of the peak power (WPeak) for the sub-
lactate threshold continuous training (STCT), high-intensity interval training (HIIT), and
sprint interval training (SIT) group. ............................................................................... 81
Figure 2.2. Representative immunoblots of transcription factors, downstream targets of p53 and
subunits of the five complexes of the electron transport system (ETS), measured in whole muscle
lysates prepared from skeletal muscle biopsy samples (vastus lateralis). ................................ 86
Figure 2.3. Mitochondrial respiration changes compared to baseline. A: percent change
of mass-specific mitochondrial respiration (pmol O2 s-1 mg-1), and B: percent change of
mitochondrial-specific respiration .................................................................................. 91
Figure 2.4. Fold change compared to baseline of the protein content of peroxisome
proliferator-activated receptor γ coactivator-1α (PGC-1α), (A), p53 (B), plant
homeodomain finger-containing protein 20 (PHF20) (C), and mitochondrial transcription
factor A (TFAM) D) in whole muscle lysates prepared from skeletal muscle biopsy
samples (vastus lateralis). ............................................................................................... 93
Figure 2.5. Fold change compared to baseline of the protein content of subunits from the
five complexes of the electron transport system (ETS), complex I to V (CI to CV), in
whole muscle lysates prepared from skeletal muscle biopsy samples (vastus lateralis). 94
Figure 2.6. Fold change compared to baseline of the protein content of: Mitofusin 2 (A),
dynamin related protein 1 (DRP1) (B), synthesis of cytochrome c oxidase (COX) 2
(SCO2) (C) and apoptosis inducing factor (AIF) (D) in whole muscle lysates prepared
from skeletal muscle biopsy samples (vastus lateralis). ................................................. 95
Figure 2.7. Correlation between 20-km cycling time trial (20k-TT) time and maximal
ADP-stimulated mass-specific mitochondrial respiration (CI+IIP), (A) before and (B)
after training. .................................................................................................................. 97
Figure 3.1. Representative immunoblots of subunits from the five complexes of the
electron transport system (ETS), transcription factors, and downstream targets of p53
measured in whole-muscle lysates ............................................................................... 118
Figure 3.2. Total training volume per week for the entire study. ................................. 122

xix
Figure 3.3. Citrate synthase activity expressed per kg of protein................................. 123
Figure 3.4. Fold change compared to baseline of the protein content of subunits from the
five complexes of the electron transport system .......................................................... 124
Figure 3.5. Mitochondrial respiration measurements at different coupling control states.
A: mass-specific mitochondrial respiration, and B: mitochondrial-specific respiration
...................................................................................................................................... 126
Figure 3.6. Fold change compared to baseline of the protein content of (A) PGC-1α, (B)
PHF20, (C) NRF1, (D) p53, and (E) TFAM in whole-muscle lysates prepared from
skeletal muscle biopsy samples (vastus lateralis). ........................................................ 128
Figure 3.7. Fold change compared to baseline of the protein content of (A) AIF, (B)
SCO2, (C) mitofusin 2 and (D) DRP1 in whole-muscle lysates prepared from skeletal
muscle biopsy samples (vastus lateralis). ..................................................................... 129
Figure 4.1. Representative immunoblots corresponding to total and phosphorylated
protein expression measured in the nuclear and cytosolic fractions, before (Pre), and
immediately (+0 h) and 3 h (+3 h) following the STCT and SIT exercise trials. ........ 149
Figure 4.2. Subcellular fraction enrichment, and p53 antibody specificity. ................. 152
Figure 4.3. Nuclear (A) and cytosolic (B) PGC-1α protein content before (Pre), and
immediately (+0 h) and 3 h (+3 h) following the STCT and SIT exercise trials. ........ 153
Figure 4.4. PGC-1α (A), and p53 (B) mRNA content before (Pre), and immediately (+0
h) and 3 h (+3 h) following the STCT and SIT exercise trials ..................................... 154
Figure 4.5. Nuclear (A) and cytosolic (B) p-ACCSer79 protein content before (Pre), and
immediately (+0 h) and 3 h (+3 h) following the STCT and SIT exercise trials. ........ 154
Figure 4.6. Protein content of nuclear (A) and cytosolic (B) p53, of nuclear (C) and cytosolic (D)
PHF20, and of nuclear (E) and cytosolic (F) p-p53Ser15 before (Pre), and immediately (+0 h) and
3 h (+3 h) following the STCT and SIT exercise trials. ...................................................... 156

xx

xxi
List of Tables
Table 1.1. Changes in citrate synthase (CS) activity from human skeletal muscle biopsies
(vastus lateralis) from healthy participants, following a cycle training intervention ..... 41
Table 1.2. Training-induced changes in mitochondrial function in humans. ................. 50
Table 1.3. Changes in PGC-1α mRNA and protein content following a single bout of
cycling (unless otherwise specified) in the vastus lateralis muscle of healthy humans.
........................................................................................................................................ 53
Table 1.4. Changes in PGC-1α protein content measured in whole-muscle homogenates
from the vastus lateralis muscle of healthy human participants following cycle exercise
training ............................................................................................................................ 63
Table 2.1. Baseline characteristics of the participants ................................................... 78
Table 2.2. Participants’ endurance performance and physiological measurements before
and after 4 weeks of training .......................................................................................... 88
Table 2.3. Respiratory flux control ratios ....................................................................... 92
Table 3.1. Participants’ physiological and endurance performance measurements before
and after each training phase ........................................................................................ 111
Table 3.2. Respiratory flux control ratios measurements before and after each training
phase ............................................................................................................................. 127
Table 4.1. Baseline characteristics of the participants. ................................................ 143
Table 4.2. Primers used for real-time RT-PCR analyses of mRNA expression. .......... 150
Table 4.3. Energy expenditure, performance parameters, and blood lactate concentration,
during the STCT and SIT exercise trials. ..................................................................... 151

xxii
Table 4.4. Fold change compared to Pre, following the STCT and SIT exercise trials, for
the mRNA content of AIF, DRP1, and MFN2 ............................................................. 157

xxiii
List of abbreviations
31P-MRS phosphorus magnetic resonance spectroscopy
ACC acetyl-CoA carboxylase
ADP adenosine diphosphate
AIF apoptosis inducing factor
AMP adenosine monophosphate
AMPK 5' AMP-activated protein kinase
ATF2 activating transcription factor 2
ATP adenosine triphosphate
BIOPS biopsy preserving solution;
BM body mass
Calcineurin Ca2+/Calmodulin-dependent phosphatase
CaM Calmodulin
CaMKs Ca2+/Calmodulin-dependent kinases
CBS cystathionine β-synthase
cDNA complementary DNA
CHO carbohydrate
CI+IIE maximal electron transport system capacity through CI+II
CI+IIP maximal oxidative phosphorylation state through CI+CII
CIIE maximal electron transport system capacity through CII
CIL leak respiration state through Complex I
CIP maximal oxidative phosphorylation state through CI
CIVE maximal noncoupled respiration through CIV
CIVRES reserve capacity of CIV
Complex I NADH-Q reductase or CI
Complex II succinate-coenzyme Q reductase or CII
Complex III cytochrome reductase or CIII
Complex IV cytochrome c oxidase
Complex V ATP synthase or CV
COX cytochrome c oxidase
CREB cAMP response element-binding protein
CS citrate synthase

xxiv
CT continuous training
D2O heavy water
DRP1 dynamin-related protein-1
E maximal ETS capacity
ERK extracellular-regulated kinase
ERRα estrogen-related receptor α
ETS electron transport system
FADH2 flavin adenine dinucleotide
FCCP carbonyl cyanide 4-(trifluoromethoxy) phenylhydrazone;
FCR respiratory flux control ratio
FOXO3 forkhead box O 3
FSR fractional protein synthesis rate
GAPDH glyceraldehyde 3-phosphate dehydrogenase
GC-MS gas chromatography-mass spectrometry
GCN5 general control non-repressed protein 5
GLUT4 glucose transporter type 4
GXT graded exercise test
HDACs histone deacetylases
HIIT high-intensity interval training
IMF intermyofibrillar mitochondria
IMM inner membrane
IMS intermembrane space
INT intensified training volume
inv-RCR inverse respiratory control ratio
JNK c-Jun N-terminal kinase
HSP70 mitochondrial heat-shock protein 70
KO knockout
L leak respiration
LC-MS liquid chromatography-mass spectrometry
LCR leak control ratio
LKB1 liver kinase B1
MAPR mitochondrial ATP production rate
MDM2 murine double minute 2
MEF2 myocyte enhancer factor-2

xxv
MiR05 respiration medium;
miRNA micro RNA
mRNA messenger RNA
mtDNA mitochondrial DNA
MPS mitochondrial protein synthesis
mRNA messenger RNA
MyoD myogenic determining factor
NADH nicotinamide adenine dinucleotide
NF-κβ nuclear factor kappa-light-chain-enhancer of activate B cells
NIRS near-infrared spectroscopy
NRF nuclear respiratory factor
NT normal training volume
OMM outer membrane
OSPC oligomycin sensitivity-conferring protein
OXPHOS oxidative phosphorylation
P maximal oxidative phosphorylation
PCR phosphorylation control ratio
PGC-1α PPARγ coactivator 1-alpha
PHF20 plant homeodomain finger-containing protein 20
PKA protein kinase A
PKC Ca2+-dependent kinases C
PMSF phenylmethanesulfonyl fluoride
PPAR peroxisome proliferator-activated receptor
PRC PGC-1 related coactivator rRNA ribosomal RNAs
RT reduced training volume
ROS reactive oxygen species
ROX residual oxygen consumption
SCO2 synthesis of COX 2
SCR substrate control ratio
SD standard deviation
SDS sodium dodecyl sulfate
SEM standard error of the mean
SIRT1 silent mating type information regulation 2 homolog 1
SIT sprint interval training

xxvi
SOD2 superoxide dismutase 2
SS subsarcolemmal mitochondria
STCT sub-lactate threshold continuous training
SUIT substrate-uncoupler-inhibitor titration protocol
TBP TATA-binding protein
TCA tricarboxylic acid cycle
TEM transmission electron microscopy
TFAM mitochondrial transcription factor A
TIM translocases of the inner membrane
TMPD N,N,N',N'-tetramethyl-p-phenylenediamine
TOM translocase of the outer membrane
tRNA transfer RNAs
TT cycling time trial
V̇O2Peak peak oxygen uptake
WLT power at the lactate threshold
WPeak peak power output
WT wild-type
β2M β-2 microglobulin
β-HAD β-hydroxy acyl-CoA dehydrogenase

1
Chapter 1
Review of Literature
The reference for the published version of part of this literature review is as follows:
Bishop DJ, Granata C, & Eynon N (2014). Can we optimise the exercise training
prescription to maximise improvements in mitochondria function and content?
Biochimica Et Biophysica Acta-General Subjects, 1840, 1266-1275.

Review of Literature
2

Review of Literature
3
1.1 Skeletal muscle and mitochondria
Skeletal muscle constitutes the largest tissue mass in the human body (40-50% body
weight) and is responsible for movement, bioenergetic homeostasis, and energy balance
via a wide variety of physiological processes. A key component of skeletal muscles is the
mitochondrion, which represents the major source of energy in the human body and
provides the energy required for almost all cellular activities. Mitochondria are central to
life and death. For example, mitochondria play a key role in cell signalling [115] and
apoptosis [3], whereas mitochondrial dysfunction is at the base of aging and cell
pathology [60]. Mitochondrial defects have been shown to be central to a series of
metabolic disorders such as type 2 diabetes [197], insulin resistance [164], obesity [33,
339], cardiovascular diseases [346], and a wide variety of neurodegenerative diseases
such as Huntington’s, Alzheimer’s, and Parkinson’s disease [168].
From a structural standpoint, mitochondria range generally from 0.5 to 1.0 μm in diameter
[111], form an integrated reticulum that is continually remodelled by fusion and fission
processes [228], and are divided in four main compartments: the outer membrane
(OMM), the intermembrane space (IMS), the inner membrane (IMM) and the matrix
(Figure 1.1). The OMM consists of a phospholipid bilayer housing protein structures
called porins that make it permeable to small molecules (<10,000 Da), including
adenosine diphosphate (ADP) and adenosine triphosphate (ATP). Conversely, the IMM
is made of a protein-rich, highly-folded complex structure that is only permeable to
oxygen, water, and carbon dioxide. The wrinkled shape of the IMM generates several
infolds and pockets (cristae) that increase its surface area and maximise its ability to house
the four complexes of the electron transport system (ETS) and ATP synthase required for
the generation of ATP. The compartment inside the IMM is defined as the matrix and
hosts mitochondrial (mt) DNA, ribosomes, and the enzymes of the tricarboxylic acid
(TCA) cycle. The TCA cycle, which includes the enzyme citrate synthase (CS), is the
final common pathway for the oxidation of fuel molecules such as carbohydrates, lipids
and amino acids.

Review of Literature
4
Figure 1.1. Structure of a mitochondrion. (Image courtesy of www.imgarcade.com)
During the TCA cycle, a small amount of ATP is generated alongside the reducing
equivalents nicotinamide adenine dinucleotide (NADH) and flavin adenine dinucleotide
(FADH2). These high-energy electron carriers can transfer electrons to coenzyme Q in a
reaction catalysed by complex I (NADH-Q reductase or CI) in the case of NADH, or by
complex II (succinate-coenzyme Q reductase or CII) in the case of FADH2. From
coenzyme Q the electron pair is transferred to cytochrome c in a reaction catalysed by the
enzyme complex III (cytochrome reductase or CIII), and then onto its final acceptor,
molecular oxygen (O2), in a process catalysed by complex IV (cytochrome c oxidase
(COX) or CIV). During electron transfer, protons are pumped from the matrix to the IMS,
with the resulting electrochemical gradient representing the proton-motive force that
allows generation of ATP by phosphorylation of ADP in a reaction catalysed by complex
V (ATP synthase or CV)1 [269]. The combination of these processes taking place along
the IMM is described as oxidative phosphorylation (OXPHOS) (Figure 1.2).
1 The four complexes of the ETS and ATP synthase, are often grouped together and referred to as the “five
complexes of the ETS”. For simplicity, this theses will refer to them as the “five complexes of the ETS”.

Review of Literature
5
Figure 1.2. The electron transport system (ETS) and oxidative phosphorylation (OXPHOS). cyt
c: cytochrome c; FADH2: flavin adenine dinucleotide; IMM: inner mitochondrial membrane;
IMS: intermembrane space; NADH: nicotinamide adenine dinucleotide; Q: coenzyme Q; Δψm:
mitochondrial membrane potential. (Image courtesy of www.imgarcade.com)
In skeletal muscles, mitochondria are classified according to their location. Those situated
under the sarcolemma are called subsarcolemmal (SS) mitochondria, whilst those
interspersed throughout the myofibrils are named intermyofibrillar (IMF) mitochondria
(Figure 1.3), with the latter representing approximately 75% of the entire mitochondrial
population [59]. The two different mitochondrial sub-fractions differ in biochemical
properties and function, with the IMF sub-fraction displaying a 2.5-fold higher maximal
respiration rate [59] and an approximately 3-fold higher ATP production rate [59]
compared to the SS sub-fraction. Other differences have been demonstrated in reactive
oxygen species (ROS) production rates and apoptotic signalling [2], as well as rates of
protein import into the mitochondria [303]. This biochemical and functional diversity is
reflected in different responses to common signalling events, such that SS mitochondria
adapt earlier and to a greater extent than their IMF counterparts in response to a training
stimulus [119].
Skeletal muscle is a plastic tissue undergoing continuous remodelling, with the ever
changing content and function of skeletal muscle mitochondria constantly adapting to the
cellular needs. Several factors such as age, [63], disease [109, 168, 197], and exercise

Review of Literature
6
[360], to name a few, have all been shown to influence mitochondrial quality and quantity.
In particular, exercise is a powerful stimulus that has been shown to lead to up to a 50%
increase in both mitochondrial content and function [313, 343]. Therefore, the scope of
this manuscript is to review the available research examining the importance of, and the
mechanisms underlying, exercise-induced mitochondrial adaptations.
Figure 1.3. Electron micrographs showing (A) subsarcolemmal (SS), and (B) intermyofibrillar
(IMF) mitochondria. (Adapted from [265])
1.2 Mitochondrial biogenesis
Mitochondrial biogenesis is a process by which an increase in the mitochondrial reticulum
takes place within the cell. From its etymology (from the Greek word “genesis”, meaning:
“origin, creation”) it would appear to indicate the generation of new mitochondria.
However, an important consideration, is that new mitochondria are not made ex novo (i.e.,
from scratch) or de novo (i.e., from scratch again), but are rather the result of
incorporation of new proteins to pre-existing sub-compartments and protein complexes
leading to growth and division by fission [260]. These events take place in conjunction
with continuous remodelling by dynamic fusion and fission processes, and the subsequent

Review of Literature
7
alteration of the mitochondrial network morphology that is thought to be determined by
the mitochondrial structure-function relationship [228]. However simple the definition
may be, scientists refer to “mitochondrial biogenesis” in many different ways, and with
different meanings, creating debate within the scientific community as to what this
definition really describes [196, 290]. This lack of consensus leads to further controversy
about which technique can best assess mitochondrial biogenesis [189, 196, 290].
Following the etymological meaning, the assessment of newly-formed mitochondria as
an indicator of mitochondrial biogenesis can be obtained by measuring the rate of
mitochondrial protein synthesis (MPS) using stable isotopic tracers [196]. Although MPS
is likely the best-suited technique to determine if mitochondria biogenesis has taken
place, it seems to lack the ability, if used in isolation, to provide information regarding
mitochondria remodelling, net mitochondrial content (the net outcome of mitochondrial
synthesis and degradation), and mitochondrial function and quality [189, 290]. It is not
surprising that for many the definition “mitochondrial biogenesis” extends beyond its
etymological meaning, and is intended to embrace part, or all of the above information
[189, 290]. In this respect, many scientists more broadly refer to mitochondrial biogenesis
as an increase of mitochondrial content per unit of tissue. For many years mitochondrial
content has been measured as the best assessment of mitochondrial biogenesis, either
through histological techniques or via biological methods assessing the activity or content
of valid biomarkers of mitochondrial content [145, 189].
The outcome of mitochondrial biogenesis is also reflected in a change in mitochondrial
function, which can be adaptive or maladaptive. Therefore, assessment of newly-formed
mitochondria via MPS, and evidence of variations in mitochondrial content, should be
paired with analysis of mitochondrial function to establish if these changes are associated
with a gain or loss of function [340]. For example, the importance of measuring
mitochondrial function is evident from the findings of a cross-sectional study in healthy
individuals showing that differences in skeletal muscle respiratory capacity and aerobic
fitness could not be solely explained by only taking into account mitochondrial
quantitative differences [128]. The same group reported that skeletal muscle oxidative
capacity measured by mitochondrial respiration was the best predictor of time trial
performance in highly-trained cyclists [129], further strengthening the argument of
Review of Literature
8
assessing mitochondrial function alongside the more classic estimation of mitochondrial
content. In addition, exercise has been shown to regulate mitochondrial turnover by
modulation of mitochondrial morphology [266] and autophagy [173, 320], an essential
process for the support of skeletal muscle plasticity in response to exercise training [268].
When mitochondrial turnover increases and changes in protein synthesis and degradation
are matched, mitochondrial content does not change; however, the replacement of
damaged proteins with newly synthesised ones may still result in enhanced mitochondrial
function [173]. This underlines an apparent dissociation between mitochondrial function
and mitochondrial content, providing a strong argument as to why mitochondrial function
should be measured alongside mitochondrial content.
As described in detail later, mitochondrial biogenesis is governed by transcriptional
regulation requiring the concerted integration of two genomes (nuclear and
mitochondrial), and a series of processes such as signalling, transcription, translation,
post-translational events, and protein import, amongst others [116]. Measurements of
these processes allow researchers to better understand the events underlying
mitochondrial biogenesis. Therefore, it is common to measure gene and protein
expression, the activity and location of signalling proteins, transcription factors,
regulators or coactivators, and/or the content of mitochondrial proteins as markers of
mitochondrial biogenesis. Whilst this certainly expands the knowledge about the
mechanisms regulating the transcriptional activity leading to mitochondrial biogenesis, it
has been shown that assessing biogenesis with only these measurements may lead to
erroneous conclusions [196] and should be supplemented with other measurements.
Following on from the above considerations, it appears evident that a range of analyses
should be used to assess if mitochondrial biogenesis has taken place and to examine its
consequences for changes in mitochondrial content and function. Therefore, a
comprehensive examination of mitochondrial biogenesis should not be limited to the
assessment of the rate of mitochondrial protein synthesis, but should also include a
thorough examination of changes in both mitochondrial content and function [189, 290].
Furthermore, to expand the knowledge of the mechanisms leading to exercise-induced
mitochondrial biogenesis, measurement of changes of key proteins and transcription
factors involved in the transcriptional machinery should also be considered.

Review of Literature
9
1.3 Techniques for the assessment of mitochondrial biogenesis
As seen in the above paragraph, there exist several approaches for the assessment of
mitochondrial biogenesis. Following is a brief review of the most commonly used
techniques for the measurement of mitochondrial biogenesis, along with their main
advantages and limitations.
1.3.1 Mitochondrial protein synthesis
Measurement of the MPS rate, which allows the assessment of the fractional protein
synthesis rate (FSR) for the determination of newly-synthesized protein, is obtained by a
primed and continuous intravenous infusion of a stable, isotopically labelled amino acid
such as [13C]leucine or [13C], or [2H]phenylalanine amongst others, or deuterium oxide
(D2O). This is followed by subsequent analysis of the tissue of interest with gas or liquid
chromatography-mass spectrometry (GC-MS or LC-MS) [294]. The use of isotopically-
labelled amino acids is extensively used to investigate the MPS response that follows a
single exercise bout, but the conclusions that can be made when used to asses changes
following a training intervention lasting days or week are somewhat limited by the brief
duration of the tracer administration [270]. A modification of this method consists in the
daily oral administration of D2O [80], which can be sustained for weeks or months, and
allows free-living conditions for the duration of the intervention. The main advantage of
measuring MPS is that it represents a true measurement of the generation of newly-
formed mitochondria. However, there are several limitations. These include the cost
associated with the tracers and the equipment, the inability to detect net changes in
mitochondrial content (defined by the rates of protein synthesis and breakdown), and the
absence of information about changes in mitochondrial function. Moreover, the timing of
the measurement is often a challenging factor given that different proteins follow different
temporal patterns, whilst the processes of mitochondrial dynamics (fusion and fission),
mitophagy, and protein breakdown, are not detectable by this technique.

Review of Literature
10
1.3.2 Mitochondrial content
The most common methods to determine mitochondrial content are histological and they
include transmission electron microscopy (TEM) and florescent microscopy [189].
However, due to the cost and time constraints, a range of more accessible and practical
biochemical measurements has been proposed as valid biomarker of mitochondrial
content. These include measurements of enzymatic activity, and/or the content of
mtDNA, key mitochondrial proteins, and lipids.
1.3.2.1 Histological methods
1.3.2.1.1 Transmission electron microscopy
The gold-standard method to assess mitochondrial content consists of two-dimensional
imaging using TEM [145], even though it is well accepted that mitochondria form a three-
dimensional network [211]. This rather laborious technique involves four main stages:
fixation, dehydration and embedding, sectioning, and staining [189]. Once the images are
generated, the morphometric analysis that follows consists of assessing the amount of
mitochondria by using “point counting grids” or “dashed lines” [189]. Both these methods
require overlaying the grid (or dashed lines) on the image, and determining the volume
density of the organelles by counting the number of times that a mitochondria intersects
a grid intersection (or the beginning and end of a dashed line). The major drawback of
this technique is that it requires a highly-skilled scientist and is very time consuming. For
this reason, it is not available in many laboratories.
1.3.2.1.2 Fluorescent microscopy
This technique measures the area occupied by mitochondria and involves the use of dye
markers that can enter the mitochondria and, due to their fluorescence, can be analysed under
a fluorescent microscope [189]. The major limitation of this technique is that the analysis of
the results is somewhat subjective, given that the determination of the colour intensity
associated to the different organelles in the cell depends on the judgment of the operator.

Review of Literature
11
1.3.2.2 Biochemical methods
Following, are several validated biomarkers that have been used to assess mitochondrial
content [145].
1.3.2.2.1 Protein content of mitochondrial proteins
The protein content of selected subunits of the five complexes of the ETS has been shown
to present a “substantial” (CII and CV), or a “moderate” (CIII and CIV) concordance2
with mitochondrial surface area [145], and is routinely used as a biomarker of
mitochondrial content. The method used to determine the protein content of these
subunits is the immunoblotting technique (Western Blot), which can be used to determine
the content of almost any protein. A small sample of muscle (10-15 mg) is homogenised
in a lysis buffer, and the muscle homogenate is then separated by electrophoresis and
transferred to a membrane. After blocking, the membrane is probed with a specific
antibody recognising the protein of interest and then imaged to obtain a blot that can be
quantified (for a more detailed description of this technique the reader is referred to
sections 2.2 and 3.2). This technique is very simple and cost effective, and can be used to
determine changes in mitochondrial content, for example, following a training
intervention. Its major downside is the limited sensitivity and reproducibility, but,
regardless of these drawbacks, it is one of the widest used techniques in the modern
laboratory. The content of the five complexes of the ETS can also be determined with the
use of the Blue Native PAGE technique [275]. The advantage of this technique is that
multi-enzyme complexes can be analysed in their native state.
1.3.2.2.2 Mitochondrial enzyme activity
The enzymatic activity of key enzymes involved in the TCA cycle and the oxidative
phosphorylation process are often used as biomarkers of mitochondrial content. The
2 Lin’s concordance coefficient (RC) defines how well the relationship between two variables is represented
by a line through the origin at an angle of 45 degrees (slope = 1). The values in the Lin’s scale vary between
0 and 1. RC values between 0.21–0.40 show a “fair” concordance, RC values between 0.41–0.60 show a
“moderate” concordance, RC values between 0.61–0.80 a “substantial” concordance, and RC values between
0.81–1.00 show an “almost perfect” concordance. (Lin LI, 1989)

Review of Literature
12
activity of CS, one of the key enzyme of the TCA cycle, has been shown to present a
“substantial to almost perfect” concordance with mitochondrial content [145], and it is
the most widely used biomarker of mitochondrial content. In addition, the activity of the
ETS complexes I to IV has also been shown to present a “substantial” concordance with
mitochondrial content [145]. CS activity is determined by homogenising a small amount
of sample (3-5 mg) that is then reacted with a series of substrates. This leads to the
formation of a coloured chemical, the rate of formation of which is proportional and linear
to the rate of CS activity. Changes in absorbance are followed by use of a
spectrophotometer (for a more detailed description of this technique the reader is referred
to sections 2.2 and 3.2). Determination of the enzymatic activity of the complexes of the
ETS follows a similar methodology [344]. The main advantage of these enzymatic assays
is that they require a very small amount of sample, and are quick, easy and relatively
inexpensive assays.
1.3.2.2.3 Cardiolipin content
Cardiolipin constitutes about 20% of the lipid composition of the IMM and has been
shown to be the best biomarker of mitochondrial content, as it presents an “almost
perfect” concordance with mitochondrial content [145]. Cardiolipin content is measured
with a sensitive and simple method, using an image analyser after separation from other
phospholipids by one-dimensional thin-layer chromatography (TLC), and requires only a
small amount (3-5 mg) of freeze-dried muscle tissue [256]. The main advantages of this
method are the high concordance with mitochondrial content, the small amount of sample
required, and that it is a sensitive, reproducible and simple technique.
1.3.2.2.4 Mitochondria DNA content
Mitochondria have their own DNA, and, even though each mitochondrion has between 2
and 10 DNA copies, mtDNA is proportional to the number of mitochondria; therefore
mtDNA content has been extensively used as a biomarker of mitochondrial content [189].
mtDNA determination can be achieved by real-time polymerase chain reaction (PCR) or
Southern Blots. The PCR method requires a small amount (~10 mg) of muscle tissue for

Review of Literature
13
DNA extraction, and involves the use of a primer selected from the circular mtDNA, and
one selected from genomic (nuclear) DNA to correct for cell number; a thermocycler is
then used to amplify the segment of DNA and obtain a threshold count that is proportional
to the amount of initial DNA. The Southern blot method is very similar to the one
described for immunoblotting as it requires electrophoresis of the DNA fragments on an
agarose gel followed by transfer to a nitrocellulose (or nylon) membrane. The membrane
is then baked (nitrocellulose) or exposed to ultraviolet radiation (nylon) to permanently
attach the mtDNA to the membrane, and is then exposed to an hybridization probe with
both a mtDNA probe and a genomic DNA probe labelled with radioactive 32P (or a non-
radioactive biotinylated probe). After washing, the membrane is then visualized on X-ray
film or a phosphoimager for quantitation [189]. Although it has been extensively used up
until now, mtDNA content has recently been shown to be unrelated to mitochondrial
content; these findings have therefore cast doubts on its validity as a biomarker of
mitochondrial content [145].
1.3.2.2.5 Summary
In conclusion, the findings of Larsen et al. (2012) demonstrated that the best biomarkers
of mitochondrial content are cardiolipin, followed by CS and CI activity. It was also
concluded that regardless of its wide-spread use, mtDNA is not a valid biomarker of
mitochondrial content.
1.3.3 Mitochondrial function
Mitochondrial function is defined as the ability of mitochondria to maintain cellular
energetic homeostasis and is commonly expressed as maximal ATP production rate,
oxygen consumption, or oxidative capacity [135]. It can also be normalised to a measure
of mitochondrial content [135], as a mean to express mitochondrial quality. There is a
lack of consensus on the terminology, with terms such as mitochondrial “function”,
“respiratory function”, “oxidative capacity”, “oxidative potential”, and several others all
used interchangeably. No researcher to date has called for a homogenisation of this
terminology across different laboratories. Therefore, for the scope of this literature

Review of Literature
14
review, “mitochondrial function” will be used. In skeletal muscle, mitochondrial function
can be measured both invasively and non-invasively, with both methods presenting
advantages and disadvantages.
1.3.3.1 Invasive measurements
There are two main approaches to directly assess mitochondrial function from skeletal
muscle, by measuring oxygen consumption (mitochondrial respiration) or by measuring
the rate of mitochondrial ATP production (MAPR)
1.3.3.1.1 Mitochondrial respiration
The assessment of mitochondrial respiration requires the measurement of the rate of
oxygen consumption by mitochondria, using an O2-sensitive electrode [85]. Following a
series of titrations with a range of substrates, uncouplers and inhibitors, this method
provides a series of valuable biological information (for a more detailed description of
this technique the reader is referred to sections 2.2 and 3.2). In addition to the rate of
maximal oxygen consumption, this technique allows determination of the oxygen
consumption associated with substrate combinations providing electrons through
different complexes, or other qualitative information such as noncoupled and uncoupled
respiration, and the degree of respiratory control, amongst others. Therefore, this
technique offers a useful tool to study specific complexes of the ETS, and provides
valuable information to better understand the potential mechanisms of altered
mitochondrial function in states of use and disuse. An obvious limitation however, is that
the experiment is often carried out in non-physiological conditions [261]. The
measurement of mitochondrial respiration can be performed in cell-free systems (isolated
mitochondria or muscle homogenates) or with permeabilised muscle fibres, and requires
the extraction of a small amount of skeletal muscle fibres using the percutaneous needle
biopsy technique [312].

Review of Literature
15
Cell-free systems
The assessment of mitochondrial respiration was initially carried out in isolated
mitochondria. The isolation procedure requires the disruption of the cell structure by the
force of a rotating homogeniser and subsequent centrifugation. Following a series of
centrifugation steps, a pellet containing the isolated mitochondria is resuspended and
placed in the chamber for measurement of oxygen consumption [312]. There are several
disadvantages to using isolated mitochondria. One is that a large sample (~100 mg) is
required, due to the low mitochondrial density of skeletal muscle. More importantly,
during the isolation procedure mitochondria are removed from their cellular environment
and their morphology, which is intimately linked to their function [229], is disrupted
[230]. As a consequence, the isolation procedure can induce fragmented organelle
morphology, increased ROS production, and differentially-altered mitochondrial
respiration depending upon the respiratory conditions [230]. Moreover, it is possible that
the isolation procedure may disproportionately harvest high-functioning, sturdy
mitochondria, compared to more fragile, fragmented, and dysfunctional ones, therefore
substantially altering assessment of mitochondrial function. For all these reasons,
measurements obtained using isolated mitochondria are starting to be questioned.
Mitochondrial respiration can also be measured in crude muscle homogenates. This
approach requires a considerably smaller amount of sample (~20 mg of skeletal muscle),
however, it does not provide qualitative information about mitochondrial function due to
the presence of other cellular compartments. The lack of control over the chemical
composition of the crude homogenate is also a cause of potential artefacts [312].
Permeabilised muscle fibres
Mitochondrial respiration can be assessed in situ in permeabilised muscle fibres. Briefly,
a small amount of muscle fibres (5-10 mg) is mechanically separated with the use of
pointed forceps, followed by selective permeabilisation of the cellular membrane with
saponin. This method leaves the mitochondria intact and allows for in situ measurements
of mitochondrial respiration [225] (for a more detailed description of this technique the
reader is referred to sections 2.2 and 3.2). The two main advantages of this technique are
the small amount of skeletal muscle required (an assay can be performed with as little as

Review of Literature
16
~2 mg of tissue), and that mitochondria structure and function are less affected during
preparation, allowing for the preservation of mitochondrial morphology and the
functional interaction with other intracellular components [230]. For these reasons
mitochondrial respiration in permeabilised muscle fibres is considered by many as the
gold-standard measurement of mitochondrial function [85, 230, 261].
1.3.3.1.2 Mitochondrial ATP production rate
MAPR is a technique enabling the measurement of the rate of ATP production in isolated
mitochondria using chemiluminescence [342]. This technique allows the determination
of ATP production with different substrates or combinations of substrates [342]. Due to
the high sensitivity of chemiluminescence, the sample required to run an assay (30-50
mg) is lower than that needed for measurement of oxygen consumption during
mitochondrial respiration in isolated mitochondria, but still considerably greater
compared to that needed for measurements in permeabilised muscle fibres. The main
difference with the mitochondrial respiration technique however, is that MAPR directly
measures the amount of ATP production and not oxygen consumption. Therefore, a
limitation of MAPR is that the information obtained from this technique is limited to ATP
production, as it does not provide the extra qualitative information (noncoupled and
uncoupled respiration, respiratory control, etc.) that can be obtained from measuring
oxygen consumption [312]. Finally, given that MAPR is measured in isolated
mitochondria, it has the same intrinsic disadvantages of the mitochondrial isolation
procedure (i.e., mitochondria structure and function disruption due to removal from their
cellular environment [230].
1.3.3.2 Non-invasive measurements
Non-invasive measurements are also available to assess mitochondrial function. An
obvious advantage of these techniques is the lack of invasive procedure with no
discomfort for the patient/participant, and the fact that they take place in vivo, within a
living organism with an intact biological system [261]. The main disadvantage is that they
provide only a limited amount of information regarding the molecular mechanisms of

Review of Literature
17
mitochondrial biochemistry [312]. The two main non-invasive techniques are:
phosphorus magnetic resonance spectroscopy (31P-MRS) and near-infrared spectroscopy
(NIRS) [312].
1.3.3.2.1 Phosphorus magnetic resonance spectroscopy
31P-MRS is used to measure the concentration of cytosolic phosphate metabolites, and
the assessment of kinetic changes in phosphocreatine content during exercise and exercise
recovery has been used to determine maximal oxidative power [312]. In spite of several
studies validating 31P-MRS as a measurement of mitochondrial function, the limited
availability of magnetic resonance scanners, and the very high costs associated with it,
have reduced the popularity of this technique [261].
1.3.3.2.2 Near-infrared spectroscopy
NIRS is a widely-used, non-invasive technique that takes advantage of the oxygen-
dependent absorption of near-infrared light by the haemoglobin/myoglobin shuttle to
monitor tissue oxygenation [134]. NIRS is extensively used to monitor brain function
following neural activity [191], and to measure skeletal muscle oxygenation during
contractile activity and ischemia [285]. Furthermore, it has been shown that NIRS
assessment of in-vivo mitochondrial respiratory capacity correlates well with
measurements of maximal ADP-stimulated mitochondrial respiration in permeabilised
fibre [261]. Therefore, NIRS provides a cost-effective, non-invasive means of assessing
in vivo mitochondrial respiratory capacity.
1.3.4 Protein and gene expression of transcription factors, coactivators, and
key regulatory proteins
Measurement of gene expression, and/or the protein content of some of the key
transcription factors and regulatory proteins modulating transcriptional activity, provides
a valuable tool to better understand the mechanisms associated with mitochondrial

Review of Literature
18
biogenesis. The most common technique used to assess changes in gene expression is
real-time PCR, whilst immunoblotting is routinely used to determine changes in protein
content (for a more detailed description of this technique the reader is referred to sections
2.2, 3.2 and 4.2). Peroxisome proliferator-activated receptor coactivator-1 (PGC-1α)
[352], the nuclear respiratory factors 1 (NRF1) and 2 (NRF2) [274], mitochondrial
transcription factor A (TFAM) [272], and p53 [266], are amongst some of the most
extensively-studied markers of mitochondrial biogenesis [266]. Movement of these
transcription factors across subcellular compartments (e.g., nucleus, cytosol,
mitochondrion), and a wide array of post-translational events (e.g., phosphorylation,
acetylation, deacetylation, and many others), can be assessed by a range of techniques
(e.g., immunoblotting, mass spectrometry and others). These translocation and post-
translational events have been shown to play a key role in the transcriptional process [75],
therefore providing another tool to enhance the knowledge of the intricate processes of
mitochondrial biogenesis [189]. For a detailed description of the role and function of these
regulatory proteins the reader is referred to the next section.
1.4 Cellular mechanisms of exercise-induced mitochondrial
biogenesis
Mitochondria have their own genetic system comprised of a circular DNA (mtDNA) and
a basic transcriptional and translational apparatus. In humans, mitochondria possess 1000
to 10,000 copies of a circular genome consisting of 16,569 base-pairs, containing 37
genes encoding for two ribosomal RNAs (rRNA), 22 transfer RNAs (tRNA), and 13
polypeptides that assembles as essential subunits of the complexes of the ETS, and are
involved in the oxidative phosphorylation process [76, 121]. As a result, the vast majority
of the ~1,000 proteins that are necessary for the complete operation of the oxidative
phosphorylation system within the mitochondria are encoded by the nuclear genome
[317]. Therefore, mitochondrial biogenesis requires the coordinated expression of both
the nuclear and mitochondrial genome [75]. Nuclear proteins are then imported inside the
mitochondria compartments via the mitochondria import machinery [317], where they

Review of Literature
19
combine with those encoded by mtDNA. The import machinery consists of specialised
import components containing transition pores, such as the translocase of the outer
membrane (TOM), allowing proteins to cross the OMM, the translocases of the inner
membrane (TIM), allowing protein transport within or across the IMM, the matrix heat
shock protein 70 (mtHsp70), allowing access of precursor proteins into the mitochondrial
matrix, and the mitochondrial export complex, which is responsible for the insertion of
proteins into the inner membrane from the matrix [317].
At the molecular level, exercise-induced mitochondrial biogenesis is the results of, in
chronological order: signalling, transcription, translation, and a host of post-translational
events culminating with protein incorporation into the mitochondria [116]. The sequence
of events leading to mitochondrial biogenesis, and the expansion of the mitochondrial
reticulum, begins at the onset of contractile activity with a series of perturbations acting
as signals for the activation of signalling proteins such as kinases, deacetylases,
phosphatases and others [116]. The most important signalling events generated during an
exercise bout are: an increase in cytosolic and mitochondrial calcium [50], greater ADP
and adenosine monophosphate (AMP) concentration with a subsequent increase in the
AMP:ATP ratio [39], changes in the cellular reduction/oxidation (redox) balance of
[NAD+]/[NADH] [75], and changes in the production of ROS [238] (Figure 1.4). These
cellular signals lead to the activation of a series of kinases such as Ca2+/Calmodulin-
dependent kinases II (CaMKII), 5' AMP-activated protein kinase (AMPK), and p38
mitogen-activated protein kinases (p38 MAPK). These in turn initiate DNA transcription
by activating a series of sensor enzymes (transcription factors, coactivators and
regulators) by chemical events such as phosphorylation, or by induction of
conformational or sub-cellular localization changes amongst others [116]. The
transcriptional process is initiated following an increase in the messenger RNA (mRNA)
of these sensor enzymes and that of downstream proteins, and is dependent on the type,
intensity, frequency and duration of contractile activity, as well as the half-life of the
proteins of interest [75]. All of these cellular signals contribute with different pathways
to mitochondria biogenesis [75], and are activated with different time courses that range
from ~3 up to 24 h and beyond the termination of the exercise stimulus [224, 354].
Following the formation of mRNA, the process of translation leads to the generation of
proteins, which can then be imported inside the mitochondria. After a host of post-

Review of Literature
20
translational modifications such as folding or assembly into complexes, proteins become
biologically active and can carry out their function [115]. For the 13 proteins encoded by
mtDNA the process is similar, and it is under the regulation of a series of transcription
factors, with TFAM playing the most prominent role [115].
Figure 1.4. Schematic of transcriptional activity leading to exercise-induced mitochondrial
biogenesis. NADH: Nicotinamide adenine dinucleotide; ROS: reactive oxygen species; Ca2+:
calcium; SIRT1: silent mating type information regulation 2 homolog 1; AMPK: 5' adenosine
monophosphate-activated protein kinase; p38 MAPK: p38 mitogen-activated protein kinase;
ERK1/2: extracellular-regulated kinase 1 and 2; JNK: c-jun N-terminal kinase; CaMKII:
Ca2+/calmodulin-dependent protein kinase II; PGC-1α: peroxisome proliferator-activated
receptor coactivator-1; CREB: cAMP response element binding protein; HDAC: Histone
deacetylases; FOXO: forkhead box O subfamily; ATF2: activating transcription factor 2;
MEF2A: myocyte enhancer factor-2A; NF-κB: nuclear factor kappa-light-chain-enhancer of
activate B cells. (Adapted from [75]).
1.4.1 Cell signalling
1.4.1.1 Calcium and the role of CAMKII
Neural activation of skeletal muscle generates an action potential that results in Ca2+
release from the T tubules of the sarcoplasmic reticulum. As well as supporting contractile

Review of Literature
21
activity, Ca2+ acts as an important primary messenger activating a cascade of events
within different signalling pathways that have been linked with mitochondrial biogenesis
[212]. Once Ca2+ is released, Calmodulin (CaM), a calcium-binding messenger protein,
acts as a signal transducer and activates its downstream targets through conformational,
activity, or location changes. Amongst these targets are a family of CaMKs, a
Ca2+/Calmodulin-dependent phosphatase (Calcineurin), and the Ca2+-dependent kinases
C (PKC) [22]. There is increasing evidence that CaMKs are involved in the regulation of
mitochondrial biogenesis, with CAMKII playing a prominent role in transcriptional
activity and the regulation of muscle plasticity [51]. Upon elevation of intracellular Ca2+,
Ca2+ binds to CaM; the Ca2+/CaM complex binds in turn to the CaM-binding domain of
CAMKII initiating an auto-phosphorylation process that increases CAMKII activity. The
activity of CAMKII remains elevated even after calcium concentration returns to basal
levels. This paradigm is described as Ca2+/CaM-independent activity and is responsible
for prolonged activation that persists after muscle contraction is terminated [295]. Studies
in cultured cells [212] and in vivo [44] have shown that changes in intracellular Ca2+
concentration can modulate transcriptional activity. This modulation leads to changes in
the content of mitochondrial enzymes, such as CS and cytochrome c [79], and
transcription factors such as NRF-1, NRF-2, TFAM [212], and cAMP response element-
binding protein (CREB) [29]. The transcriptional coactivator PGC-1α is also upregulated
in a calcium-dependent manner following exercise. It was shown that an increase in
cellular calcium leads to activation of CAMKII which, by phosphorylation of p38 MAPK,
increases the activity and expression of PGC-1α [350] and induces mitochondrial
biogenesis. A further post-translational mechanism by which CAMK can modulate
mitochondrial biogenesis is by favouring the dissociation between myocyte enhancer
factor-2 (MEF2) and histone deacetylases (HDACs) [165]. HDACs are a family of
deacetylases that repress MEF2 activity by a physical association to it in the nucleus
[183]. Following phosphorylation by CAMK, HDACs leave the nucleus so that MEF2 is
able to carry out its transcriptional activity [188]. For more comprehensive information
on the structure and transcriptional activation mechanism of calcium, the reader is
referred to two excellent reviews [51, 295].

Review of Literature
22
1.4.1.2 ATP turnover and the energy sensor AMPK
The change in cellular energy levels during contractile activity is one of the major factors
disrupting cellular homeostasis. During metabolic stress, energy demand increases and so
does ATP breakdown. When ATP utilisation is greater than ATP production, deamination
of adenosine nucleotides, followed by reamination, causes an increase in cellular AMP
levels leading to a greater AMP:ATP ratio. The signalling protein AMPK, often referred
to as the “master sensor” of cellular energy balance, senses these changes and regulates
metabolic processes, energy levels and mitochondrial biogenesis.
AMPK exists as a heterotrimer consisting of α, β, and γ subunits. The AMPK α subunit
(of which there are two forms, α1 and α2) contains the catalytic domain whose
phosphorylation is necessary for enzymatic activity [107]. Activation of AMPK plays an
important role in the regulation of metabolism and mitochondrial biogenesis [245]. When
the AMP:ATP ratio is high, AMPK is activated in an AMP-dependent manner by
allosteric binding of the AMP molecule to the Cystathionine β-synthase (CBS) domain
[279]. However, AMPK can also be activated in an AMP-independent manner, via
phosphorylation at the 172 tyrosine residue (Thr172) [107] by the tumour suppressor liver
kinase B1 (LKB1) [349], and/or the calcium dependent CAMKKβ [108]. Although the
primary role of AMPK is to control energy balance at the cellular level, recent findings
have shown that AMPK is also regulated by hormones, growth factors, and cytokines,
revealing its role in the maintenance of whole-body energy balance [103]. Finally, it has
been shown that ROS can also activate AMPKα1 in an AMP-independent manner in
rodent skeletal muscle [315], and that AMPK location and its translocation between
different cellular compartments plays a key role in its activity [347]. These mechanisms
represent an intricate and complex series of signals that, following contractile activity,
contribute in a coordinated and timely manner to the activation of AMPK.
During a bout of exercise AMPK activity mediates increases in fatty acid transport to the
mitochondria via phosphorylation of acetyl-CoA carboxylase (ACC) [203]. AMPK
activation also supports increases in glucose uptake and fatty acid oxidation in rat muscle
[192], as well as the upregulation of genes involved in mitochondrial respiration [345]. A
series of metabolic targets, such as CS, glucose transporter type 4 (GLUT4), β-hydroxy
acyl-CoA dehydrogenase (β-HAD), COX sub-unit I and IV and superoxide dismutase 2

Review of Literature
23
(SOD2), are upregulated by activation of AMPK following contractile activity [137].
Following exercise, AMPK exerts its control on mitochondrial biogenesis by modulation
of gene expression and transcriptional regulation that leads to a more oxidative
phenotype. AMPK activates PGC-1α via direct phosphorylation at Thr177 and Ser538 in
vitro and in cells, via a process that was thought to control all of the AMPK-mediated
transcriptional activity of PGC-1α [130]. Activation of AMPK was shown to be
proportional to exercise intensity [47, 331], and to the level of glycogen depletion [348],
therefore suggesting that high-intensity training may be a potent stimulus to increase
transcriptional activity and mitochondrial biogenesis. Further studies have also shown the
existence of indirect mechanisms of AMPK control on PGC-1α activity. It was reported
that AMPK enhances silent mating type information regulation 2 homolog 1 (SIRT1)
activity by increasing cellular NAD+ levels [40]. SIRT1 is a type III deacetylase that
following activation modulates the activity of PGC-1α and its downstream targets by
deacetylation [40]. Similarly, AMPK can indirectly control PGC-1α expression by
HDAC phosphorylation at Ser259 and Ser498 and the subsequent nuclear export of HDACs
[66]. Following chronic upregulation of AMPK activity in rats, NRF-1 DNA-binding
activity, muscle mitochondrial density, and cytochrome c content have all been reported
to be elevated [24]. These findings led the authors to suggest that AMPK plays an
important role in training-induced adaptations by promoting mitochondrial biogenesis
and respiratory protein expression, via an effect mediated by activation of NRF-1.
Regardless of these claims, there is no evidence to date showing direct interaction
between AMPK and NRF-1. Hence, it is unclear whether the observed phenotypic
adaptations are a consequence of direct AMPK activation of NRF-1 or whether these
effects are mediated by the coactivator PGC-1α.
Following contractile activity, AMPK also phosphorylates the tumour suppressor p53 at
Ser15 [136], a post-translational modification associated with increased p53 activity and
stability [71, 289]. Studies have also shown increased AMPK and p53 phosphorylation
following a bout of exercise in both mice [265] and humans [18]. In a follow up study in
humans, the increased p53 response following a bout of exercise with low carbohydrate
availability, resulted in increased phosphorylation of ACC immediately post-exercise,
suggesting that AMPK may be the dominant upstream signalling kinase regulating
exercise-induced p53 activity [19].

Review of Literature
24
AMPK can also modulate muscle metabolism via transcriptional control of the CREB
family of transcription factors. It is known that the CREB family can control muscle
metabolism and transcription via regulation of several genes including PGC-1α [7].
CREB transcriptional activity is activated by direct phosphorylation at Ser133 by Protein
Kinase A (PKA) [86]. However, it has recently been shown that AMPK can also directly
phosphorylate CREB at the same residue [306]. The importance of AMPK in the CREB
transcriptional machinery is further underlined by the fact that mice deficient in the
AMPK-activator LKB1 showed decreased voluntary running and reduced muscle
mitochondrial marker enzyme expression including PGC-1α [307]. AMPK control over
metabolism can also take place through direct phosphorylation of forkhead box O 3
(FOXO3) [94], a member of the FOXO family of transcription factors that are important
regulators of metabolism [95]. Furthermore AMPK activation increases fatty acid
oxidation in mouse skeletal muscle by activation of peroxisome proliferator-activated
receptors α (PPARα) and PGC-1 [148], a transcriptional activation that is thought to be
upregulated by AMPK-dependent PGC-1α activation [39].
As demonstrated here AMPK regulates the transcriptional activity following both a single
bout of exercise and exercise training via an intricate network of signalling pathways
aimed at the modulation of diverse phenotypic adaptations. For extensive reviews on
AMPK, the reader is referred to two excellent reviews [39, 185].
1.4.1.3 Redox state, NAD+ and the metabolic sensor SIRT1
NAD+ is a molecule playing a crucial role in energy metabolism. This electron carrier
provides the link between ATP synthesis during oxidative phosphorylation and glycolysis
as well as the TCA, as previously described. NAD+ concentration and the NAD+:NADH
ratio are representative of the cellular redox state and reflect the cellular energy status. It
has been shown that NAD+ levels increase in skeletal muscle due to oxidative stress
following exercise [40] or calorie restriction [43]. The sirtuin family of enzymes, which
includes 7 paralogs (SIRT1–SIRT7), is regulated by the redox state [278], and SIRT1
activity is enhanced in conditions of increased NAD+ levels [38].

Review of Literature
25
SIRT1, a NAD+-dependent deacetylase, is mainly located in the nucleus [195], where it
carries out its activity on its nuclear targets. However, it can translocate to the cytosol to
exert its action on cytosolic targets [305]. SIRT1 exerts its activity by deacetylation [321]
and has been described as a “master metabolic sensor” given its ability to sense changes
in the redox state. SIRT1 dependence on NAD+ fluctuations links its activity to the
cellular metabolic status, exerting control over energy provision. This takes place mainly
via modulation of transcriptional activity and favours a shift towards a more
mitochondrially-derived energy production, and an increased antioxidant protection [38].
In the context of this review, the main targets of SIRT1 are the nuclear regulators PGC-
1α and p53. Activation of PGC-1α takes place through deacetylation at one of the 13
Lysine residues by SIRT1 [248]. PGC-1α and SIRT1 are both nuclear proteins, but only
during situations of energy stress is PGC-1α activated by SIRT1; this suggests the need
for a further signal. The low AMP:ATP ratio that follows energy stress, is the signal
required to induce phosphorylation of PGC-1α by AMPK, with PGC-1α phosphorylation
also being a requirement for subsequent deacetylation and activation by SIRT1 [40].
SIRT1 also regulates p53 by deacetylation at Lys382 in humans [321], repressing its
transcriptional activity [321], and reducing the rate of p53-dependent apoptosis [169].
The effects of exercise on SIRT1 content are somewhat controversial. It has been reported
that 2 weeks of high-intensity interval training (HIIT) increase SIRT1 protein content and
mitochondrial capacity, with the authors suggesting the SIRT1/PGC-1α axis as a possible
mediator of mitochondrial biogenesis [161]. In contrast, another research group observed
that HIIT increases SIRT1 activity and PGC-1α content, despite a decrease in SIRT1
content [96], and that SIRT1 overexpression in muscle reduces mitochondrial biogenesis
[97]. In a later study, the same group showed that nuclear SIRT1 activity and not nuclear
SIRT1 protein content is correlated with oxidative capacity, and that increased nuclear
SIRT1 activity accompanies increases in mitochondrial biogenesis following exercise
training [98]. These findings seem to confirm the SIRT1–PGC-1α axis as a possible
regulator of mitochondrial biogenesis in skeletal muscle; however, the mechanisms of
action still remain elusive. For a more comprehensive review on SIRT1 the reader is
referred to an excellent review [38].

Review of Literature
26
1.4.1.4 Oxidative stress, ROS, and the role of the MAPKs
Superoxide, oxygen peroxide and nitric oxide are extremely reactive molecules, known
collectively as ROS. Although generated at several locations within muscle fibres, ROS
are mainly produced in the mitochondria by complex I and III during oxidative
phosphorylation [16]. In order to minimize their effects, skeletal muscles possess anti-
oxidant enzymes which act as a defence system enabling removal or inactivation of ROS.
When the balance between ROS production and removal shifts towards the former,
oxidative stress occurs.
Although it was originally thought that ROS were cytotoxic molecules, it is now well
accepted that they play a significant role as signalling events and control the modulation
of muscular phenotypic adaptations to exercise and disuse [238]. The duration and
magnitude of ROS production seems to influence the transcriptional outcome. A
moderate increase in ROS production over a short time period leads to an adaptive
response promoting antioxidant defence capacity [247]. In contrast, intense ROS
production for longer periods can result in proteolysis, oxidative damage to mtDNA, and
cell death [133]. The MAPK family, provides the link between oxidative stress and
transcriptional activity by phosphorylating serine/threonine residues of several
transcription factors and coactivators [163]. The three main MAPKs subfamilies in
skeletal muscle are p38 MAPK, extracellular-regulated kinase 1 and 2 (ERK1/2) and c-
Jun N-terminal kinase (JNK) [46].
Of the three MAPKs, p38 plays a prominent role, as it mediates the effects of cytokine
stimulation by activating PGC-1α via direct phosphorylation [241]. This in turn increases
mitochondrial biogenesis due to PGC-1α-mediated upregulation of NRF-1 and NRF-2,
two transcription factors regulating the expression of nuclear-encoded mitochondrial
proteins. Activation of the p38γ isoform, but not p38α or p38β, is necessary for exercise-
induced mitochondrial biogenesis through the p38-PGC-1α axis [235]. Furthermore, it
has been shown that p38 can stimulate PGC-1α-regulated mitochondrial biogenesis by
stimulation of activating transcription factor 2 (ATF2) [6], and MEF2 [359], two
upstream transcription factors of PGC-1α. ROS also provides MAPK-mediated signalling
to activate nuclear factor kappa-light-chain-enhancer of activate B cells (NF-κB), a
transcription factor involved in the expression of PGC-1α, NRF1 and other transcription

Review of Literature
27
factors [238]. p38 was also shown to mediate resveratrol-induced activation of p53 [287],
and exercise-induced activation of p53 following a single bout of exercise [265], by
phosphorylation at Ser15. Moreover, it has been demonstrated that activation of p38 for
endurance-trained athletes requires a larger stimulus compared to untrained individuals,
showing that the level of exercise-induced p38 activation is training status-dependent
[357]. Finally, different authors have also reported that ROS production influences
mitochondrial morphology [234, 358], although more research is warranted in this area.
Taken together, these findings underline the important role of the ROS and the p38
MAPK pathway in promoting mitochondrial biogenesis.
1.4.2 Coactivators and regulators of mitochondrial biogenesis
1.4.2.1 PGC-1α, the master regulator of mitochondrial biogenesis
The PGC-1 family consists of PGC-1α, PGC-1β and PGC-1-related coactivator (PRC)
[273], all of which share similar structures and function. PGC-1α is the most widely
studied of the three and is expressed in many tissues, with the highest abundance found
in oxidative tissues such as skeletal muscle [273]. PGC-1α has been reported to regulate
cellular processes such as metabolic control [140, 156, 273], transcriptional activity [84,
141], mitochondrial turnover [320], and mitochondrial function amongst others [242,
352]. It therefore plays a pivotal role in the adaptive response to exercise and the
modulation of mitochondrial biogenesis [213, 242]. As previously described,
mitochondrial biogenesis requires the concerted activation of the mitochondrial and
nuclear genomes. PGC-1α has emerged as a master coordinator of this interplay through
the coactivation of nuclear transcription factors encoding mitochondrial proteins [116,
156]. A fine example of this coordination is via the regulation of the PGC-1α:NRF-
1:TFAM axis. In this regard, it has been reported that PGC-1α promotes mitochondrial
gene transcription via regulation of NRF-1 and NRF-2 [13, 352], as well as TFAM [151,
352]. Whilst NRF-1 and NRF-2 are nuclear transcription factors mediating the expression
of various nuclear-encoded subunits of the ETS, TFAM, a nuclear-encoded transcription
factor, exerts its transcriptional role inside the mitochondria where it regulates the

Review of Literature
28
transcription of the 13 essential subunits of the ETS that are mtDNA-encoded [274].
Furthermore, it has been reported that the NRFs, but mainly NRF-1, directly activate
TFAM, providing a possible link between nuclear and mitochondrial gene expression
[325]. These findings demonstrate that the coordinated regulation of nuclear- and
mitochondrial-encoded transcription factors through the PGC-1α:NRF-1:TFAM axis
may be under the control of PGC-1α, and that this axis is essential for the control of
mitochondrial biogenesis [84, 352]. PGC-1α can also coactivate members of the PPAR
family, such as PPARγ [243], and PPARδ [336] - two transcription factors involved in
mitochondrial biogenesis, lipid oxidation and fibre type regulation [148, 322, 336]. It has
also been reported that PGC-1α exerts control on the expression and activity of the
transcription factor estrogen-related receptor α (ERRα) [277], and that inhibition of ERRα
compromises the ability of PGC-1α to induce the expression of mitochondrial proteins
and to increase mtDNA [276]. The above findings clearly highlight the role of PGC-1α
as a master regulator of mitochondrial biogenesis.
As described in previous sections, and illustrated in Figure 1.5, the main signals to induce
PGC-1α expression are: 1) cellular calcium increases mediated by CAMKII and p38
MAPK phosphorylation [350]; 2) increases in AMP:ATP ratio resulting in
phosphorylation by AMPK [130]; 3) increases in cellular NAD+ resulting in concerted
deacetylation by SIRT1 [248], and phosphorylation by AMPK [40]; 4) increases in
oxidative stress mediated by p38 MAPK phosphorylation [241], and ATF2 [6] and MEF2
[359] activation, and 5) increases in ROS production mediated by indirect activation of
AMPK [123]. It is important to notice that PGC-1α can also control its own expression,
as transcription factors coactivated by PGC-1α such as MEF2 and myogenic determining
factor (MyoD), can in turn regulate PGC-1α through an autoregulatory loop [8, 102].
Finally, substrate availability following exercise may influence PGC-1α expression, as
maintaining low muscular glycogen content during recovery keeps PGC-1α mRNA levels
elevated [232].
Studies on PGC-1α overexpression and ablation in cells and transgenic mice, provide
further confirmation that PGC-1α plays a prominent role in mitochondrial biogenesis.
Briefly, overexpression of PGC-1α stimulates mitochondrial respiration and biogenesis
in muscle cells, via upregulation of the gene expression of the NRFs, as well as induction

Review of Literature
29
of TFAM activity [352]. These findings were supported by studies in vivo demonstrating
that PGC-1α overexpression in transgenic mice improved endurance performance and
peak oxygen uptake, alongside an increase in mitochondrial function and content, as
indicated by enhanced mitochondrial gene expression, mitochondrial DNA, and
mitochondrial enzyme activity [37]. PGC-1α overexpression has also been associated
with an increase in slow-twitch muscle fibres (type I), and a shift towards a more
oxidative muscle phenotype [157]. Conversely, studies on PGC-1α ablation showed
reduced muscle performance and exercise capacity [101, 151]. This is mediated by
increased muscle damage and a shift towards a more glycolytic muscle phenotype [101],
reduction in mitochondrial respiration and content, and ATP production [5, 151].
Figure 1.5. Exercise-induced signalling of PGC-1α transcriptional activity. ac: acetylation;
AMPK: 5' adenosine monophosphate-activated protein kinase; Ca2+: calcium; CaMK:
Ca2+/calmodulin-dependent protein kinase; CREB: cAMP response element binding protein;
MEF2: myocyte enhancer factor-2; mtDNA: mitochondrial DNA; p: phosphorylation; p38: p38
mitogen-activated protein kinase; PGC-1α: peroxisome proliferator-activated receptor
coactivator-1; ROS: reactive oxygen species; Sirt1: silent mating type information regulation 2
homolog 1; TF: transcription factor; Tfam: mitochondrial transcription factor A. (From [213]).
While the above evidence highlights its importance, studies have also reported that PGC-
1α is likely not the only mediator of mitochondrial biogenesis. Following exercise
training, PGC-1α knockout (KO) mice showed similar increases in mitochondrial proteins

Review of Literature
30
compared to their wild-type (WT) littermates, with the authors suggesting that PGC-1α
is not mandatory for exercise-induced muscular adaptations [150, 253]. In support of this
notion, it was reported that the decrease in mitochondrial function present in PGC-1α KO
mice can be reversed by endurance training [5]. Moreover, studies in murine cells
demonstrated the existence of additional pathways regulating mitochondrial transcription
that function in parallel with those regulated by PGC-1α [318].
Exercise is one of the most prominent activators of mitochondrial biogenesis.
Consequently, PGC-1α activity is strongly modulated by physical activity. The effects of
both a single bout of exercise and exercise training on PGC-1α protein and gene
expression in human skeletal muscle will be discussed in detail in section 1.5.3.1.
Post-translational modifications of the PGC-1α protein (e.g., acetylation/deacetylation,
phosphorylation, sumoylation, methylation) also influence PGC-1α activity and
mitochondrial biogenesis by altering protein stability, subcellular localization, and
protein activation amongst others. For example, phosphorylation of PGC-1α by p38
MAKP increases PGC-1α stability by increasing protein half-life [241], or increases
PGC-1α activity and mitochondrial biogenesis by freeing PGC-1α from a repressor
molecule named p160 myb binding protein [142]. As described earlier, SIRT1 activates
PGC-1α by deacetylation [248], while general control non-repressed protein 5 (GCN5)
negatively regulates PGC-1α transcriptional and biological function through direct
acetylation and nuclear localization of PGC-1α [152]. Subcellular location has also been
shown to play a key role in the modulation of PGC-1α activity [351]. Research in rodent
[351], and human [159, 160] skeletal muscle demonstrated that at rest PGC-1α resides
mainly in the cytosol. However, it was shown in rodents that following a single bout of
exercise, nuclear PGC-1α increases, in parallel with increased activation of other
transcription factors (e.g., NRF-1 and NRF-2) involved in mitochondrial gene
transcription [351]. The authors suggested that accumulation of PGC-1α in the nucleus
may constitute the initial phase of the exercise-induced adaptive response, whilst the
subsequent increase in PGC-1α protein may sustain the increase in mitochondrial
biogenesis. Ensuing research in human skeletal muscle also reported an increase in
nuclear PGC-1α protein abundance following a bout of continuous [160] or sprint interval
[159] training. This was accompanied by increased expression of mitochondrial genes

Review of Literature
31
involved in the adaptive response to exercise. Changes in whole-muscle PGC-1α protein
content however, did not take place until 24 h following exercise cessation [159].
Moreover, research in both mouse [11, 293] and human [293] skeletal muscle,
demonstrated that PGC-1α also resides in the mitochondria, where it can form a complex
in association with TFAM [11]. Subsequent research showed that following a single bout
of exercise in mice, both nuclear and mitochondrial PGC-1α abundance are significantly
increased [262]. The authors suggested that following an exercise stimulus, PGC-1α may
relocate to both the nucleus and the mitochondrion to coactivate nuclear and mtDNA
transcription factors respectively. In doing so, PGC-1α regulates the nuclear-
mitochondrial DNA cross-talk and promotes mitochondrial biogenesis. These findings
suggest that post-translational events leading to PGC-1α sub-cellular translocation, and
its subsequent coordination of the nuclear and mitochondrial transcriptional activity, play
a key role in exercise-induced mitochondrial biogenesis.
1.4.2.2 p53, “guardian of the genome” and metabolic regulator
p53 is widely known as the “guardian of the genome” for the wide variety of functions
that it influences, ranging from cell cycle arrest to senescence, from apoptosis to DNA-
damage repair, from angiogenesis to tumour suppression and many others [52, 153, 282].
However, p53 has recently come to the fore as a metabolic regulator and a mediator of
mitochondrial biogenesis (Figure 1.6). The mechanisms by which p53 regulates
mitochondrial biogenesis are still largely unknown; however, evidence is emerging
regarding its transcriptional control of mitochondrial and respiratory genes.

Review of Literature
32
Figure 1.6. Regulation of mitochondrial biogenesis by p53. AIF: apoptosis inducing factor;
AMPKβ1/2: 5' adenosine monophosphate-activated protein kinase subunit β 1 & 2; Drp1:
dynamin-related protein-1; ETC: electron transport chain; Mfn2: mitofusin 2; mtDNA:
mitochondrial DNA; POLγ: polymerase γ; ROS: reactive oxygen species; SCO2: synthesis of
cytochrome c oxidase 2; Tfam: mitochondrial transcription factor A; TSC2: tuberous sclerosis
complex 2. (From [266]).

Review of Literature
33
Findings from p53 KO mice studies indicate that absence of p53 leads to reduced
endurance performance [217, 265], mitochondrial respiration [181], and mitochondrial
content [265], as well as increased fatigability and ROS production [265]. One of the key
studies in this area has demonstrated that in mouse liver mitochondria p53 is able to
influence the balance between glycolytic and oxidative pathways, via modulation of its
downstream transcriptional target synthesis of cytochrome c oxidase 2 (SCO2) [181].
SCO2 has been shown to assist the assembly of the mitochondrially-encoded subunit II
into the COX complex, the site of oxygen utilization during mitochondrial respiration.
This study also showed that ablation of p53 decreased oxygen consumption and aerobic
respiration, promoting a switch to glycolytic pathways whilst reducing endurance
performance [181]. In a similar manner, p53 can also modulate mitochondrial function
via positive transcriptional regulation of the apoptosis inducing factor (AIF) gene [298].
AIF is not only involved in the regulation of mitochondrial structure [284], but can also
regulate the ETS by assisting the assembly and stabilisation of complex I and III [284,
319]. It has been demonstrated that lack of AIF in human and mouse cells severely
compromised CI activity and promoted a switch to glycolytic pathways [319]. p53
regulation of mitochondrial function also extends to its ability to promote and stabilise
the assembly of mature ATP synthase (CV), by interacting within the mitochondrial
matrix with oligomycin sensitivity-conferring protein (OSPC) [23], a subunit of CV
[254].
p53 mediates mitochondrial biogenesis and exerts control on mitochondrial function in
different ways, one of which is via the modulation of mitochondrial morphology.
Mitochondrial fusion and fission are dynamic processes necessary for the maintenance of
mitochondrial structure and quality. It has been reported that p53 can transcriptionally
upregulate the fission protein dynamin-related protein-1 (DRP1), which conveys the p53
apoptotic signal and initiates fission [154]. Furthermore, p53 can also modulate
mitochondrial fusion as it was shown that p53 binds directly to the promoter of mitofusin
2, and that mitofusin 2 mRNA and protein content are upregulated in a p53-dependent
manner [335]. Mitofusin 2 has also been reported to be sensitive to exercise, as its mRNA
is increased following an exercise bout [42]. Mitofusin 2 protein content did not change
following seven sessions of HIIT [224]; however, an increase was reported following 12
weeks of continuous training in humans [143], suggesting that greater training workloads

Review of Literature
34
may be required. Mitofusin 2 has also been shown to play an important role in oxidative
phosphorylation, given that its loss-of-function is associated with a decreased content of
the subunits of complex I, II, III and V, whereas mitofusin 2 overexpression is associated
with an increased content of the subunits of complex I, IV and V [231]. From the above
evidence, it seems that through transcriptional activation p53 extends its modulation to
all of the ETS complexes, therefore playing an important role in the regulation of
oxidative capacity. Similar to PGC-1α [320], p53 has also been shown to be an important
regulator of autophagy [174], as well as mitochondrial morphology [266]. Autophagy,
and fusion and fission processes, have been reported to contribute to the replacement of
damaged proteins with de novo synthesised ones, and enhance mitochondrial function
independent of changes in mitochondrial content [135, 173]. These findings suggest that
modulation of mitochondrial turnover, is yet another mechanism by which p53 can
regulate mitochondrial function.
Further insights into the role of p53 as a regulator of mitochondrial function stem from
research showing that within the mitochondria, p53 mediates promotion and maintenance
of mtDNA integrity, by specifically binding to mtDNA polymerase γ, whilst enhancing
its DNA replication function [1]. p53 has also been reported to directly bind to mtDNA
[112, 144, 267], or to interact with TFAM [217, 356, 267], therefore exerting control on
the mitochondrial transcriptional machinery and mtDNA copy number. p53 can also
interact with and influence PGC-1α. It was reported that the PGC-1α promoter region
houses a p53 binding site [124], and that p53 KO mice have lower PGC-1α protein content
in parallel with a host of mitochondrial deficiencies [181, 217, 265] as previously
reported. However, there seems to be some controversy with respect to the effects of p53
on PGC-1α. Whilst a study showed that p53 upregulates PGC-1α expression by binding
to its promoter region [10], it has also been demonstrated that p53 binds and represses
PGC-1α, although in the setting of telomere dysfunction [263]. From the above findings,
it seems evident that more research is needed to elucidate the interplay between the two
regulators and to unveil the role of p53 in mitochondrial biogenesis.
p53 is activated by similar signalling events that leads to the activation of PGC-1α,
providing further evidence that p53 is likely involved in the control of mitochondrial
biogenesis. In this regard, p53 is activated by AMPK [136], as well as ERK2, and p38

Review of Literature
35
MAPK [287]. This activation induces phosphorylation of p53 at Ser15, a post-translational
modification that further increases p53 activity by protein stabilisation [289].
Furthermore, it was previously described how SIRT1 deacetylates p53 and inactivates its
transcriptional activity [169, 321]. Plant homeodomain finger protein 20 (PHF20), a
nuclear transcription factor upstream of p53, has also been shown to upregulate p53
activity at the mRNA level by directly binding to its promoter region [218]. The same
research showed a reduction in p53 protein content following PHF20 knockdown,
providing further confirmation of PHF20 transcriptional regulation of p53. A second
study also demonstrated that PHF20 stabilises and activates p53 protein within the
nucleus by associating with p53 and disrupting murine double minute 2 (MDM2)-
mediated degradation [65]. Finally, upon Akt phosphorylation of PHF20 at Ser291, PHF20
translocates from the nucleus to the cytoplasm, with consequent abrogation of the PHF20
transactivation of p53 [218]. Despite the above evidence of PHF20 control on p53, no
study to date has investigated the effects of a single exercise bout, or of exercise training
on the gene and protein expression of PHF20. Future research is therefore required to
provide these answers.
Post-translational modifications leading to p53 stabilisation, as well as the cellular
translocation of both p53 and its transcriptional partners, seem to play a pivotal role in
p53 activity. It is known that p53 is predominantly a nuclear transcription factor [328],
but studies have demonstrated its presence inside the mitochondria, where it carries out
its activity and promotes mtDNA integrity and replication [1, 112, 356]. Moreover,
research in mouse skeletal muscle demonstrated that a single bout of exercise induces
translocation of p53 inside the mitochondria where, by interaction with TFAM and
mtDNA, it increases mtDNA transcription [267]. These findings are in agreement with
those from a previous study showing that p53 determines maximal aerobic capacity and
regulates mtDNA content in mouse skeletal muscle via interaction with TFAM [217].
This study has also shown that p53 KO mice exhibit significantly lower adaptations to
training compared to wild-type mice, further enhancing the importance of p53 as a
possible regulator of training-induced adaptations. Studies have reported that a single
bout of exercise induced p53 phosphorylation in conjunction with activation of p38 and
AMPK in both mouse [267], and human [18] skeletal muscle, suggesting a possible
pathway for p53-induced mitochondrial biogenesis. However, research in mouse skeletal

Review of Literature
36
muscle showed that p53 mRNA does not change within 3 h following a single bout of
exercise [267], a fact that may be due to the ability of p53 to auto regulate itself [201].
Although the available research is limited, the effects of both a single bout of exercise
and exercise training on p53 protein and gene expression in human skeletal muscle will
be discussed in detail in section 1.5.3.2. In conclusion, while p53 has been extensively
studied in the area of cancer and apoptosis, there clearly is a gap in the literature on how
p53 responds to endurance exercise, and how it modulates mitochondrial biogenesis.
1.4.2.3 TFAM, a mitochondrial transcription factor
TFAM is a nuclear-encoded transcription factor that controls the expression of mtDNA
and regulates the transcription of the 13 mtDNA-encoded subunits of the ETS [274]. The
role of TFAM has been touched upon in previous sections, therefore it will only be
discussed briefly. Studies have demonstrated that TFAM is under the regulation of both
PGC-1α [151, 352], and NRF-1 [325], and that the PGC-1α:NRF-1:TFAM axis plays an
essential role in the regulation of mitochondrial biogenesis [84, 352]. Studies in rat
skeletal muscle indicate that following muscle contraction TFAM mRNA is increased,
together with an increase in the rate of mitochondrial protein import, and TFAM protein
content [87]. This translates into increased binding to the mtDNA promoter region, and
the subsequent upregulation of mtDNA transcription and replication [115]. In addition,
research in rodents indicates that following exercise TFAM can form a complex inside
the mitochondria with both PGC-1α [262], and p53 [267] and positively drive mtDNA
transcriptional activity. Given that some studies in humans failed to show increased
TFAM protein or gene expression following exercise [96, 210, 224], it was suggested that
TFAM activity rather than content may contribute to mitochondrial biogenesis during
exercise [224]. The effect of a single bout of exercise and exercise training on TFAM
protein and gene expression in human skeletal muscle will be discussed in detail in section
1.5.3.2.

Review of Literature
37
1.4.3 Summary
A summary of the proposed mechanisms of action of some of the key signalling proteins
and transcription factors involved in the regulation of exercise-induced mitochondrial
biogenesis, has been presented in the previous sections. These sections have provided
evidence that exercise is a powerful stimulus to induce mitochondrial adaptations.
Therefore, it is also important to understand how specific training interventions may
influence mitochondrial adaptations. An overview of the current knowledge on how
exercise intensity and exercise volume (two key determinants of the training stimulus
[12]) affect changes in markers of mitochondrial biogenesis, will be presented in the next
sections
1.5 Exercise training and mitochondrial adaptations
Exercise training can be defined as a series of exercise bouts over a period of time, and
the resulting adaptations are largely the cumulative effect of those obtained following a
single exercise session [224]. Repeated disturbances to cellular homeostasis lead to a
series of adaptive responses that aim to minimise disruptions when exercise is next
performed. It is important to note however, that long-term adaptations are not always the
result of the simple addition of those induced by a single exercise bout [55].
Changes in mitochondrial content [128, 239, 257, 360] and mitochondrial function [68,
128, 194, 311, 360] are two important training-induced adaptations, and for this reason
will represent the main focus of this literature review. It is well established that maximal
mitochondrial oxidative power exceeds oxygen delivery in humans, and is in excess of
that required during exercise when half or more of the body muscle mass is engaged
during exercise (e.g., cycling or running) [28, 312]. Regardless of this overcapacity, both
mitochondrial content [36, 224, 296], and function [68, 127, 343] have been reported to
increase following exercise training. Moreover, these adaptations can take place very
rapidly, as changes in mitochondrial content have been reported as early as 24 h after a

Review of Literature
38
single bout of exercise [159], whereas changes in mitochondrial function have been
shown after only five training sessions [300].
Changes in mitochondrial content and function are not necessarily similar in magnitude
[300, 343]. As can be seen in Figure 1.7, an in-depth analysis of the available literature
in human skeletal muscle indicates that higher physical activity levels are associated with
relatively larger values of mitochondrial function (as measured by mitochondrial
respiration) than mitochondrial content (as assessed by CS activity) [26]. This apparent
dissociation between mitochondrial function and mitochondrial content has previously
been demonstrated in mouse skeletal muscle [252]. It should be noted that two separate
studies have reported that the ratio between mitochondrial respiration and mitochondrial
content was not related to training status [311, 342]. These two studies however,
measured mitochondrial function in isolated mitochondria, a technique that has been
reported to disrupt both mitochondrial structure and function [230]. This raises the
possibility that mitochondrial damage during the isolation procedure may have altered
the outcome. Nonetheless, while further research is required, it appears important that
training studies should measure and report changes in both mitochondrial function and
mitochondrial content [128].
The origin of this dissociation between training-induced changes in mitochondrial content
and function is not readily apparent, and may have many explanations. For example,
while one of the primary roles of mitochondrial transcription factors is the regulation of
transcriptional activity leading to mitochondrial biogenesis, both PGC-1 [140] and p53
[181] have been shown to act as metabolic regulators, favouring a switch from glycolytic
to oxidative energy provision. This indicates that it may be possible to improve
mitochondrial function, independent of changes in mitochondrial content. Mitochondrial
turnover may also contribute to the dissociation between mitochondrial content and
function. Studies in humans have in fact demonstrated that initiation of autophagy [198],
and increased fusion [42] and fission [224] processes, constitutes an important
physiological response to exercise. Hence, an increase in mitochondrial function may be
the result of more efficient mitochondria following autophagic upregulation, or improved
mitochondrial morphology, that may not necessarily result in a net increase in
mitochondrial content [173]. It has been suggested that if changes in mitochondrial

Review of Literature
39
protein synthesis and degradation are matched, mitochondrial content would not change,
nevertheless, replacement of old proteins with newly synthesised one, may still result in
an increase in mitochondrial function [173]. Metabolic regulation and modulation of
mitochondrial turnover are therefore two potential mechanisms that may contribute to the
dissociation between mitochondrial content and respiration. Future research is warranted
to confirm this apparent dissociation in human skeletal muscle, and to elucidate the
possible mechanisms that could explain it.
Figure 1.7. Mitochondrial respiration and citrate synthase (CS) activity in humans of differing
training status. SED: sedentary, ACT: active, TRA: trained, MT: moderately-trained, WT: well-
trained, and HT: highly-trained. (From [26]).
While it is well accepted that exercise training represent a powerful stimulus to improve
endurance performance, and to increase mitochondrial content and function, it is not yet
known which training intervention results in the greatest adaptations. The stimulus
provided by exercise training is the combination of training intensity, frequency, duration,
volume, and the overall length of the intervention. Manipulation of any of these variables
is likely to influence the outcome. Training intensity and training volume have been

Review of Literature
40
previously identified as two of the most important parameters [12]. Considering that
training duration is typically inversely related to training intensity, and the paucity of
studies examining the role of frequency, duration and the overall length of an intervention,
this thesis will focus primarily on the role of training intensity and volume and how they
affect exercise- and training-induced changes mitochondrial adaptations.
1.5.1 Exercise- and training-induced changes in mitochondrial content
As described in section 1.3.2, there are several ways to assess changes in mitochondrial
content. However, as most studies have utilised the activity of CS as a valid biomarker of
mitochondrial content [145], stronger conclusions can be made when pooling these
studies together. Therefore, this literature review will focus on studies that measured
exercise- and training-induced changes in this biomarker (Table 1.1). Most studies report
an increase in CS activity following exercise training in humans (Table 1.1). However, a
number of studies have also shown that CS activity does not change significantly
following a period of exercise training [55, 88, 90-93, 147, 155, 158, 170, 244]. The
reasons for these discrepancies are not readily apparent, and may relate to the training
status of the participants, the training protocols used, or the methodological differences
in the CS activity assay employed. For example, the timing of muscle biopsy (see below),
the method by which the reaction is monitored (spectrophotometer or fluorimeter), the
different reagents, the reaction temperature, and the sample preparation employed (wet
vs. freeze-dried muscle tissue) may all influence the assay results [323].
There are limited and contrasting findings regarding the effects of a single bout of
exercise on the activity of CS. While a 12% increase in CS activity was reported
immediately after the termination of an ~70-min bout of continuous cycling at 75%
V̇O2Peak [309], another study reported unchanged CS activity immediately, and 2 h, after
the termination of a HIIT bout consisting of three cycling intervals to fatigue at 130% of
V̇O2Peak [314]. CS activity did not change also following 90 min of continuous cycling at
60% of V̇O2Peak in male participants [249]. Similarly, there was no change in CS activity
4 h after the termination of a HIIT bout consisting of ten 4-min cycling intervals at 90%
of V̇O2Peak [224]. Moreover, while one study observed increased CS activity 24 h after

Review of Literature
41
the termination of an exercise bout consisting of four “all-out” 30-s cycling sprints (SIT)
[159], two different studies employing either HIIT (ten 4-min cycling intervals at 90% of
V̇O2Peak) [224], or continuous cycling (60 min at 80% of V̇O2Peak) [74], reported that CS
activity was not changed 24 h after the termination of the bout. These latter studies
observed the first significant increase in CS activity only after three training sessions [74,
224]. Although the majority of research seem to agree that changes in CS activity do not
take place “within minutes” of the termination of exercise, further research is clearly
required to determine the effects of a single bout of exercise on the activity of CS. An
interesting corollary to the above findings however, is that the timing of post-exercise
(and post-training) muscle sampling needs to be carefully controlled as this may influence
the results.
Table 1.1. Changes in citrate synthase (CS) activity from human skeletal muscle biopsies (vastus
lateralis) from healthy participants, following a cycle training intervention. Studies with diseased
populations (e.g., chronic heart failure, diabetics, and obese patients), studies investigating a
single bout of exercise, and studies not providing precise and detailed information about the
training prescription, were excluded. Training volume arbitrary units were calculated by
multiplying the training intensity (as a percentage of V̇O2Peak) by the duration of exercise training
(in minutes) and by the total number of training sessions.
Study Participants Training ΔCS
(%) n - sex V̇O2Peak TYPE INTENSITY
(%V̇O2Peak)
VOLUME
(a.u.)
Svedenhag 1983
[302]
8 - M 43 CT 75 96000 62*
Jacobs 1987
[126]
11 - M/F n/r SIT 220 9900 12*
Gorostiaga 1991
[88]
6 - M/F 37 CT 50 36000 25*
6 - M/F 36 HIIT 100 36000 2
Green 1991
[93]
8 - M 53 CT 59 77880 23
Green 1992
[92]
9 - M 55 CT 67 48240 2
Wibom 1992
[343]
9 - M 44 CT 70 60480 40*
Chesley 1996
[48]
8 - M 45 CT 65 46800 20*

Review of Literature
42
Study Participants Training ΔCS
(%) n - sex V̇O2Peak TYPE INTENSITY
(%V̇O2Peak)
VOLUME
(a.u.)
Spina 1996
[296]
12 - M/F 39 CT 65 66300 32*
Tiidus 1996
[308]
7 - M 48 CT+HIIT 75-100 66000 25*
6 - F 37 CT+HIIT 75-100 66000 50*
Linossier 1997
[158]
8 - M 52 SIT 280 25200 7
Liljedhal 1998
[155]
16 - M/F n/r SIT 250 4500 6
MacDougall 1998
[171]
8 - M 52 SIT 195 16953 36*
Putman 1998
[244]
7 - M 45 CT 60 50400 5
Green 1999
[89]
7 - M 46 CT 68 24480 12
68 48960 26*
Starritt 1999
[300]
7 - M/F 43 CT+HIIT 75-95 39375 22*
Dubouchaud 2000
[70]
9 - M 45 CT+HIIT 75 243000 75*
McKenzie 2000
[187]
6 - F 38 CT+HIIT 60-100 108216 27*
6 - M 46 CT+HIIT 60-100 108216 34*
Parra 2000
[220]
5 - M n/r SIT 208 10920 38*
5 - M n/r SIT 208 10920 28*
Tonkonogi 2000
[313]
8 - M/F 39 CT+HIIT 75-95 98402 48*
Carter 2001
[41]
8 - M 42 CT 60 126000 40*
8 - F 32 CT 60 126000 43*
Masuda 2001
[179]
7 - M 45 CT 69 115920 28*
Barnett 2004
[17]
8 - M 48 SIT 218 11772 42*
Howarth 2004
[120]
8 - M 43 CT 80 168000 32*

Review of Literature
43
Study Participants Training ΔCS
(%) n - sex V̇O2Peak TYPE INTENSITY
(%V̇O2Peak)
VOLUME
(a.u.)
LeBlanc 2004
[147]
8 - M 48 CT 75 180000 40*
75 22500 15
Burgomaster 2005
[36]
8 - M 45 SIT 212 3392 38*
Messonnier 2005
[193]
8 - M/F 43 CT 75 216000 54*
Burgomaster 2006
[34]
8 - M 49 SIT 212 3392 11*
Ostergard 2006
[216]
19 - M/F 41 CT 70 94500 25*
Bakkman 2007
[14]
8 - M 45 CT 65 31200 21*
Talanian 2007
[304]
8 - F 36 HIIT 90 25200 20*
Burgomaster 2008
[35]
10 - M 41 CT 65 97500 35*
10 - M 41 SIT 213 9585 28*
Harmer 2008
[104]
7 - M/F n/r SIT 204 17736 42*
Perry 2008
[223]
8 - M/F 45 HIIT 90 64800 26*
Green 2009
[91]
9 - M 48 CT 62 37200 14
Gurd 2010
[96]
9 - M/F 45 HIIT 90 64800 28*
Little 2010
[161]
7 - M 46 HIIT 100 6000 16*
Perry 2010
[224]
9 - M 46 HIIT 90 25200 24*
Stannard 2010
[299]
7 - M/F 46 CT 65 81250 18*
7 - M/F 46 CT 65 81250 19*
Yfanti 2010
[355]
10 - M 50 CT+HIIT 55-100 230760 54*
Gurd 2011
[98]
7 - M/F n/r HIIT 90 25200 9*

Review of Literature
44
Study Participants Training ΔCS
(%) n - sex V̇O2Peak TYPE INTENSITY
(%V̇O2Peak)
VOLUME
(a.u.)
Irving 2011
[125]
8 - M/F 26 CT+HIIT 70-85 33300 20*
Murias 2011
[204]
7 - M 49 CT 70 56700 50*
7 - M 49 CT 70 113400 67*
Jeppesen 2012
[132]
8 - M 38 CT+HIIT 62.5 121875 50*
Rud 2012
[255]
12 - M/F 57 CT 57 111720 30*
Egan 2013
[74]
8 - M 37 CT 80 67200 32*
Ma 2013
[170]
8 - M 41 SIT 170 7262 8
Cochran 2014
[55]
9 - M/F 47 CT 110 9900 7
V̇O2Peak: peak oxygen uptake (mL min-1 kg-1); ΔCS: change in citrate synthase (CS) activity M:
male; CT: continuous training; F: female; n/r: not reported; SIT: sprint interval training; HIIT:
high-intensity interval training. * Significantly different from pre-training values (P < 0.05).
Results from Table 1.1 indicate that exercise training is usually associated with an
increase in CS activity. Cross-sectional studies provide further support for the above
statement by showing greater CS activity values for endurance-trained compared to active
individuals, whose values are in turn greater than those of sedentary individuals [128,
246, 257, 360, 249, 199]. Previous research observed that skeletal muscle of previously
well-trained individuals requires a greater stimulus to activate the signalling pathways
leading to mitochondrial biogenesis [357], consistent with the notion that training
adaptations are reduced as training status increases [146, 162, 357]. This would suggest
that exercise-induced changes in CS activity may be influenced by a participant’s training
status. Consistent with this hypothesis, it has been reported that following ten days of
continuous cycling at an intensity of 60-90% of maximal heart rate, sedentary participants
increased their CS activity by 59% whereas that of trained athletes remained unchanged
[199]. Moreover, results from a study in which ten well-trained endurance athletes cycled

Review of Literature
45
outdoor for a total of 3211 km over 21 days (an average of ~170 km/day), showed that
CS activity did not increase significantly [292].
Although training-induced changes in CS activity appear to be associated with training
status, there does not seem to be a relationship between changes in CS activity and
baseline V̇O2Peak values. Using the data set in Table 1.1, no significant correlation was
found between V̇O2Peak and ΔCS (r = -0.08). This correlation was then re-calculated with
the effects of training volume “partialed out” (i.e., controlled for). This can be achieved
by running a partial correlation that allows for the determination of the coefficient of
correlation ry1.2, where the two independent variables are baseline V̇O2Peak (variable 1)
and training volume (variable 2) and the dependent variable is ΔCS (variable Y) [222].
This analysis revealed no correlation between baseline V̇O2Peak and ΔCS, even when the
effects of training volume were removed (ry1.2 = -0.06).
Training volume and intensity are two of the most important parameters influencing
training-induced changes in mitochondrial content [12], as evidenced by the number of
available reports (Table 1.1). The following two sections will examine the available
literature and try to define the role of training volume and training intensity in promoting
changes in mitochondrial content. Finally, there are other factors that may influence both
baseline levels and training-induced changes in CS activity, such as age [30, 58, 63, 204,
246], sex [41, 58, 187, 308], or health status [32, 104, 109, 125, 176, 197, 323], but they
will not be reviewed in this thesis.
1.5.1.1 Effects of training volume
To date there is limited research that has investigated the effects of different training
volumes on changes in CS activity within the one study. However, analysis of the results
from 47 studies (including 57 different training groups) with human participants suggests
that greater training volumes are associated with a greater increase in CS activity (Figure
1.8). This is in agreement with the observation of a similar relationship when the results
of training-induced changes in CS activity in oxidative rat skeletal muscle are pooled
[26]. These results indicate that training volume may be a key determinant of training-
induced changes in mitochondrial content (as assessed by CS activity). However, caution

Review of Literature
46
is required when pooling the results from different studies, due to small methodological
differences between laboratories. Furthermore, data from both humans (Figure 1.8) and
rats [26] do not indicate the presence of a plateau, seemingly suggesting the greater the
training volume, the greater the increase in CS activity. In contrast with this findings, a
study investigating the time course of training-induced changes in CS activity following
fourteen sessions of continuous training with humans, showed that CS activity was
significantly increased after the third session and did not increase further in the following
session, which suggests a possible plateau [74]. Similarly, another study demonstrated no
further increase in CS activity in the second half of a 12-week training program in a pool
of young participants [204]. Further research directly comparing how different training
volumes affects training-induced changes in CS activity in humans is required. In this
regard, it would be valuable for future training studies to consider measurements of CS
activity in single fibres, and to also consider assessment of changes in mitochondrial
content by TEM, the gold-standard technique for this evaluation [189].
1.5.1.2 Effects of training intensity
In contrast to training volume, training intensity does not seem to be a key determinant
of training-induced changes in CS activity (Figure 1.9). A similar analysis of findings
from studies in rat oxidative skeletal muscle fibres, also indicates that training intensity
is not a key factor for changes in CS activity [26]. Conversely, the same review reported
that in rat type II glycolytic skeletal muscle fibres training intensity may be a determining
factor influencing changes in CS activity. Caution needs to be used when interpreting
these results as higher training intensities were also associated with greater training
volumes [26]. Another possible explanation for these results is that type II fibres are only
recruited at higher training intensities [327].

Review of Literature
47
Figure 1.8. The relationship between training volume and training-induced changes in citrate
synthase (CS) activity in the vastus lateralis muscle of healthy human participants. All the studies
presented in Table 1.3 have been included in this figure. Therefore, studies with diseased
populations (e.g., chronic heart failure, diabetics, and obese patients), studies investigating a
single bout of exercise, and studies not providing precise and detailed information about the
training prescription, were excluded. Training volume arbitrary units were calculated by
multiplying the training intensity (as a percentage of V̇O2Peak) by the duration of exercise training
(in minutes) and by the total number of training sessions. Training intensity for studies employing
sprint interval training (SIT) is often not provided; for these studies, a value of training intensity
was used based on that attained by participants in the training study presented in Chapter 2,
completing the same number of repetitions. These ranged from ~220% to ~205% of V̇O2Peak for
four to ten 30-s “all-out’ bouts, respectively.
To date, only two studies have investigated the effects of exercise training in human
skeletal muscle, by directly comparing different training intensities. While an 8-week
training study showed that CS activity was increased following continuous training at
50% V̇O2Peak, but not HIIT at 100% V̇O2Peak [88], a second report revealed similar changes
in CS activity following six weeks of either continuous training at 65% V̇O2Peak, or sprint
interval training (SIT) at maximal training intensity (>200% V̇O2Peak) [35]. Considering
these discrepancies, and that most of the above conclusions were drawn by comparing
different studies presenting a series of methodological differences, further research

Review of Literature
48
directly comparing different training intensities is needed to clarify the role of training
intensity on training-induced changes in CS activity.
Figure 1.9. The relationship between training intensity and training-induced changes in citrate
synthase (CS) activity in the vastus lateralis muscle of healthy human participants. Only studies
involving cycling and using a single training intensity were included. Results were obtained from:
[14, 17, 34-36, 41, 48, 55, 74, 88, 89, 91-93, 96, 98, 104, 120, 126, 147, 155, 158, 160, 170, 171,
179, 193, 204, 216, 220, 223, 224, 244, 255, 296, 299, 302, 304, 343]. Studies with diseased
populations (e.g., chronic heart failure, diabetics, and obese patients), studies investigating a
single bout of exercise, and studies not providing precise and detailed information about the
training prescription, were excluded. Training intensity was expressed as percent of V̇O2Peak.
Training intensity for studies employing sprint interval training (SIT) is often not provided; for
these studies, a value of training intensity was used based on that attained by participants in the
training study presented in Chapter 2, completing the same number of repetitions. These ranged
from ~220% to ~205% of V̇O2Peak for four to ten 30-s “all-out’ bouts, respectively.
1.5.1.3 Summary
Analysis of the current literature seems to suggest that training volume may be an
important determinant of training-induced changes in CS activity, whereas training
intensity does not seem to influence these changes. While these conclusions are
interesting and offer a good perspective on the effects of these two parameters on changes

Review of Literature
49
in CS activity, caution must be used when comparing results from different studies, due
to the many methodological differences. For this reason, future research directly
measuring the effects of these two parameters on training-induced changes in CS activity
is required.
1.5.2 Exercise- and training-induced changes in mitochondrial respiration
Cross-sectional studies show that greater training status is associated with an increase in
mitochondrial function [68, 128, 194, 311, 360], suggesting that exercise training may
induce an increase in this parameter. This seems to be confirmed by analysis of the results
from the studies presented in Table 1.2, which indicate that exercise training is typically
associated with an increase in mitochondrial function. As described in section 1.3.3, there
are several way to assess mitochondrial function, and measurement of mitochondrial
respiration in permeabilised muscle fibres has been suggested as the gold standard
technique for this assessment [85, 230, 261]. However, given the paucity of available
research employing this technique, this review will also consider reports that employed
different techniques.
Only two studies have investigated the effect of a single bout of exercise on changes in
mitochondrial respiration in permeabilised muscle fibres [310, 314]. Both of these studies
employed exercise to exhaustion, and revealed that immediately post-exercise
mitochondrial respiration through complex I increased by 23% (P < 0.05) following HIIT
at 130% of V̇O2Peak [314], but remained unchanged following continuous cycling at 75%
of V̇O2Peak [310]. From these results, several conclusions can be made. One is that, given
the rapid changes in mitochondrial respiration following exercise, the timing of the biopsy
in future training studies must be carefully controlled. Moreover, these results indicate
that maximal mitochondrial oxidative power is intact or improved after exhaustive
exercise. Even more important for the scope of this review, is that these findings seem to
suggest that training intensity may be an important determinant of exercise-induced
changes in mitochondrial respiration. More research, directly comparing different
training intensities and volumes, is required to better understand how these variables
affect exercise-induced changes in mitochondrial respiration.

Review of Literature
50
Table 1.2. Training-induced changes in mitochondrial function in humans.
Study Particip. Training protocol Method Substrates MF %
change n - sex
(V̇O2Peak)
Wibom 1992
[343]
9 - M
(44)
6w
(4d/w)
CT: 36min @ 70% V̇O2Peak MAPR PPCKM
PCM
PM
SR
70*
92*
50*
66*
Starritt 1999
[300]
7 - M/F
(44)
10d
(1 x d)
CT+HIIT: [60min @ 75% V̇O2Peak]
or [6×5min @ 95% V̇O2Peak]
MAPR PPCKM
PCM
136*
161*
Tonkonogi
2000, [313]
8 - M/F
(39)
6w
(4d/w)
CT+HIIT: [30min @ 70% V̇O2Peak]
+ [5×2min @ 100% V̇O2Peak]
IM PM 40*
Walsh 2001
[332]
8 - M/F
(38)
6w
(4d/w)
CT+HIIT: [30min @ 70% V̇O2Peak]
+ [5×2min @ 100% V̇O2Peak]
SF PM 38*
Daussin 2008
[67]
11 - M/F
(29)
8w
(3d/w)
HIIT: 28min [60s @ 90% WPeak
+ 4min @ 56% WPeak]
SF GM 36*
CT: 28min @ 61% WPeak 13
Jacobs 2013
[127]
16 - M
(43)
2w
(3d/w)
HIIT: 10x [60s @ 100% WPeak
+ 75s @ 30W]
SF MOC
PGM
PGMS
22*
12*
12*
Vincent 2015
[324]
8 - M
(46)
2w
(4d/w)
HIIT: 12x [1 min @ ~120% WPeak
+ 90 s rest]
SF PGM
PGMS
18
21*
Particip: participants; V̇O2Peak: peak oxygen uptake (mL min-1 kg-1); MF: mitochondrial function;
M: male; w: week; d: day; CT: continuous training; MAPR: maximal ATP production rate;
PPCKM: pyruvate + palmitoyl-L-carnitine + α-ketoglutarate + malate; PCM: palmitoyl-L-
carnitine + malate; PM: pyruvate + malate; SR: succinate + rotenone; F: female; HIIT: high-
intensity interval training; IM: isolated mitochondria; SF: saponin-skinned permeabilised fibres;
WPeak: peak power; GM: glutamate + malate; MOC: malate + L-octanoyl-carnitine; PGM:
pyruvate + glutamate + malate; PGMS: pyruvate + glutamate + malate + succinate. *Significantly
different from pre-training values (P < 0.05).
Due to the paucity of available studies, it is difficult to establish the role of training
intensity and volume as determinants of training-induced changes in mitochondrial

Review of Literature
51
function. Moreover, the seven studies presented in Table 1.2 assessed mitochondrial
function using different techniques, such as MAPR [300, 343] or mitochondrial
respiration [67, 127, 313, 332, 324], and a series of different substrates. Of these studies,
only four measured mitochondrial respiration in saponin-skinned permeabilised fibres
[67, 127, 332, 324]. To complicate matters further, three studies employed a mix of
training intensities [300, 313, 332], whereas only one directly compared two training
intensities [67]. Nonetheless, some conclusions can be made. Results from Daussin et al.
(2008) show that HIIT (training intensity = 90% of V̇O2Peak) resulted in a significant
increase in mitochondrial respiration through complex I (36%; P < 0.05), whereas
continuous (CT) cycling (training intensity = 61% of V̇O2Peak) did not (13%; P > 0.05),
despite the groups being matched for total work (i.e., volume of training). While only one
study, these results are consistent with the hypothesis that higher training intensities are
required to enhance mitochondrial respiration. Findings from ensuing research, showing
an increase in mitochondrial respiration through complex I and II combined following
HIIT at training intensities ≥ 100% of V̇O2Peak, support this hypothesis [127, 324].
In their research, Daussin et al. (2008) concluded that workload and oxygen uptake
fluctuations, rather than training volume or intensity, were the key determinants of these
improvements. However, a different study showed that continuous cycling at 70% of
V̇O2Peak increased MAPR measured with pyruvate and malate to a similar extent (50%; P
< 0.05) [343]. This suggests that other factors, such as training intensity, may play a more
important role. The hypothesis that training intensity is an important determinant of
training-induced changes in mitochondrial respiration is also consistent with findings
from studies in rat skeletal muscle showing a trend for greater increases in mitochondrial
respiration with higher training intensities [26]. Regardless of the above findings
however, more research directly comparing different training intensities within a single
study is needed to better define the role of training intensity in the regulation of training-
induced improvements in mitochondrial respiration.
For the same reasons explained above, the role of training volume is also difficult to
establish. However, one study directly comparing two training groups showed that one
group increased mitochondrial respiration by 36% (P < 0.05), whereas a second group
that was matched for total work did not (13%; P > 0.05) [67]. These findings seem to

Review of Literature
52
indicate that training volume may not be a key determinant of training-induced changes
in mitochondrial respiration. Comparisons of studies employing MAPR seem to confirm
this conclusion. Starritt et al. (1999) reported an increase in MAPR, using pyruvate,
palmitoyl-L-carnitine, α-ketoglutarate, and malate (PPCKM), that was almost double that
reported by Wibom et al. (1992) with the same substrates (136% vs. 70% respectively;
both P < 0.05), despite almost half the training volume (~37,000 vs. ~60,000 training
units, respectively). Changes in MAPR measured with palmitoyl-L-carnitine and malate
(PCM) were also almost double in the former study compared to the latter (161% vs. 92%
respectively; both P < 0.05). The major difference in the training protocols of the above
studies was that about half of the training in Starritt et al. (1999) was carried out using a
higher training intensity (95% of V̇O2Peak) than that used in Wibom et al. (1992) (70% of
V̇O2Peak). This seems to strengthen the hypothesis that training intensity and not training
volume is a key determinant of training-induced changes in mitochondrial function. In
conclusion, more research is required to clearly define the role of training volume as a
determinant of changes in mitochondrial function, for example by directly comparing the
effect of different training volumes on changes in mitochondrial respiration.
1.5.3 Exercise- and training-induced changes in the gene and protein
expression of regulators of mitochondrial biogenesis
Understanding the control of gene and protein expression that allows for changes in
mitochondrial components, is fundamental for understanding the factor regulating
exercise-induced mitochondrial biogenesis. As described in section 1.4.2, PGC-1α, p53
and TFAM are some of the most important regulators of the transcriptional machinery
regulating this process. A single bout of exercise, as well as exercise training, have been
shown to modulate both the mRNA and protein content of the coactivator PGC-1α, and
the transcription factors p53 and TFAM [116, 266]. Therefore, a better understanding of
the molecular mechanisms regulating these processes could have important implications
for the design of exercise training programs.

Review of Literature
53
1.5.3.1 PGC-1α
PGC-1α is a widely studied coactivator regulating mitochondrial biogenesis [116].
Considering the extensive literature available on PGC-1α, the next two sections will
separately examine the effect of either a single bout of exercise or exercise training on its
mRNA and protein content. A summary of the results of studies investigating the effects
of a single bout of exercise on PGC-1α mRNA and protein content in the vastus lateralis
muscle of healthy humans is presented in Table 1.3.
Table 1.3. Changes in PGC-1α mRNA and protein content following a single bout of cycling
(unless otherwise specified) in the vastus lateralis muscle of healthy humans.
Study
Participants
n - sex
age - V̇O2Peak
Training bout PGC-1α
mRNA
PGC-1α p.c. Comments
Pilegaard
2003
[233]
7 - M
22y - n/r
3 h 2-legged knee
extensor @ 100% of 1-
leg 2-min max
TR-leg
NC @ 0 h
↑10 fold @ 2 h
↑ 4 fold @ 6 h
NC @ 24 h
n/r TR > UT @ 2 h.
UT-leg
NC @ 0 h
↑ 7 fold @ 2 h
↑ 6 fold @ 6 h
NC @ 24 h
n/r
Watt
2004
[337]
7 - M
24y - 54
3 h @ 60% V̇O2Peak ↑10 fold @ 3 h ↑48% @ 3 h
(P = 0.09)
McGee
2004, [184]
7 - M
27y - 47 1 h @ 74% V̇O2Peak
n/m NC in WM or
Nuc @ 0 h
Norrbom
2004
[209]
9 - M
22y - n/r
45 min 1-leg knee
extensor (10-60 W)
NC @ 0 or ½ h
↑2.4 fold @ 2 h
↑2.7 fold @ 6 h
n/r Same increase in type
I & II fibres @ 2h.
Pilegaard
2005
[232]
9 - M
27y - 58
HC:
75 min @ 75% V̇O2Peak
NC @ 2 h
↑5.5 fold @ 5 h
NC @ 8 h
NC @ 24 h
n/r LC availability post-
exercise extends
PGC-1α mRNA
upregulation time.
LC:
75 min @ 75% V̇O2Peak
NC @ 2 h
↑5.5 fold @ 5 h
↑4.8 fold @ 8 h
NC @ 24 h
n/r

Review of Literature
54
Study
Participants
n - sex
age - V̇O2Peak
Training bout PGC-1α
mRNA
PGC-1α p.c. Comments
Russell
2005
[259]
7 - M
23y - 51
2 h @ 50% WPeak
(w/ or w/out glucose)
↑4.8 fold @ 0 h
↑12 fold @ 1 h
↑3-6 fold @ 4 h
n/r No effect of high FFA
on PGC-1α activation
post-exercise.
Cartoni
2005
[42]
1 - M
36y - 58
10-km cycling time
trial
↑NC @ 0 h
↑3.1 fold @ 2 h
↑ NC @ 24 h
n/r
Vissing
2005
[326]
14 - M
25y - n/r
3 h 1-legged knee
extensor @ 50% max
work capacity
↑2.5 fold @ 1 h
↑8.5 fold @ 3 h
↑6 fold @ 8 h
NC @ 20 h
n/r
Mahoney
2005, [172]
14 - M
22y - n/r
75 min GXT to
exhaustion
↑2.9 fold @ 3 h
NC @ 48 h
n/r
Cluberton
2005
[53]
6 - M
28y - 46
HC:
60 min @ 74% V̇O2Peak
NC @ 0 h
↑3 fold @ 3 h
n/r CHO ingested pre
and post exercise;
No effect of CHO on
PGC-1α mRNA
activation.
LC:
60 min @ 74% V̇O2Peak
NC @ 0 h
↑3.8 fold @ 3 h
n/r
Coffey
2006
[57]
ET: 6 - M
29y - 65
60 min @ 70% V̇O2Peak ↑8.5 fold @ 3 h NC @ 3 h No effect of previous
training history on
PGC-1α. ST: 7 - M
31y - 37
↑10 fold @ 3 h NC @ 3 h
Sriwijitkamol
2007
[297]
8 - M/F
45y -21
40 min @ 50% V̇O2Peak NC @ 0 h
↑5 fold @ 2.5 h
n/r ND between low vs.
high-intensity
cycling. 40 min @ 70% V̇O2Peak NC @ 0 h
↑14 fold @ 2.5 h
Mathai
2008
[180]
7 - M
23y - 48
TTE @ 65% V̇O2Peak
(~2h)
↑3 fold @ 0 h
↑6.2 fold @ 2 h
NC @ 24 h
NC @ 52 h
↑23% @ 0 h
↑23% @ 2 h
↑16% @ 24 h
NC @ 52 h
De Filippis
2008
[69]
6 - M/F
33y - 35
4x [8 min @ ~70% + 2
min @ ~90% HRMax + 2
min rec]
↑1.5 fold @ ½ h
↑8 fold @ 5 h
↑20% @ ½ h
↑50% @ 5 h

Review of Literature
55
Study
Participants
n - sex
age - V̇O2Peak
Training bout PGC-1α
mRNA
PGC-1α p.c. Comments
Wang
2009
[334]
9 - M
26y - 41
CT:
90 min @ 67% V̇O2Peak
↑10 fold @ 3 h n/r No difference in
PGC-1α mRNA
increase @ 3 h in CT
vs. HIIT HIIT:
90 min as: [12 s @
120% + 18 s @ 20%
V̇O2Peak]
↑13 fold @ 3 h n/r
Gibala
2009, [83]
6 - M
23y - 47
4x [30 s “all-out” + 4
min rec]
↑2 fold @ 3 h NC @ 3 h
Egan
2010
[73]
8 - M
24y - 40
400 kcal @
40% V̇O2Peak (MFW)
↑3.8 fold @ 3 h n/r Intensity-dependent
regulation of
PGC-1α. 400 kcal @
80% V̇O2Peak (MFW)
↑10 fold @ 3 h n/r
Nordsborg
2010
[207]
UT: 8 - M
24y - 44
4x [4 min @ 85%
V̇O2Peak + 3 min rec]
NC @ 0 h
↑2.5 fold @ 1 h
↑4.3 fold @ 3 h
↑2.9 fold @ 5 h
n/r Same relative (TREL)
& absolute (TABS)
training intensity
compared to UT;
UT & TABS MFW;
Average 1-5h UT &
TABS > TREL;
PGC-1α mRNA
response depends on
relative ex intensity.
TREL: 10 - M
28y - 55
↑1.8 fold @ 0 h
↑2.4 fold @ 1 h
↑5.5 fold @ 3 h
↑3 fold @ 5 h
n/r
TABS: 10 - M
28y - 55
4x [4 min @ 70%
V̇O2Peak + 3 min rec]
NC @ 0 h
NC @ 1 h
↑2.7 fold @ 3 h
NC @ 5 h
n/r
Perry
2010
[224]
9 - M
23y - 46
10x [4 min @ ~90%
V̇O2Peak + 2 min rec]
1st session:
↑10 fold @ 4 h
3rd session:
↑9 fold @ 4 h
5th session:
↑8 fold @ 4 h
7th session:
↑5 fold @ 4 h
NC @ 4 h
↑23% @ 24 h
NC @ 24 h following
all sessions;
PGC-1α mRNA
increased/decreased
in a “stair-case” type
response (reduced
activation from 1st to
7th bout);

Review of Literature
56
Study
Participants
n - sex
age - V̇O2Peak
Training bout PGC-1α
mRNA
PGC-1α p.c. Comments
Cochran
2010
[54]
10 - M
21y - 51
HIIT:
2x [5 x 4 min @ ~95%
HRMax +2 min rec]
separated by 3h w/ LC
1st session:
NC @ 0 h;
↑8 fold @ 3 h
2nd session:
NC @ 0 h
1st session:
NC @ 0 h;
NC @ 3 h
2nd session:
NC @ 0 h
3 h post end of 1st
session is equiv. to
rest of 2nd session;
No effect of different
CHO
supplementation;
No change in PGC-
1α p.c. throughout.
HIIT:
2x [5 x 4 min @ ~95%
HRMax +2 min rec]
separated by 3h w/ HC
1st session:
NC @ 0 h;
↑8 fold @ 3 h
2nd session:
NC @ 0 h
1st session:
NC @ 0 h;
NC @ 3 h
2nd session:
NC @ 0 h
Little
2010
[160]
8 - M
29y - 55
CT:
90 min @ 65% V̇O2Peak
n/m WM: NC,
Cyt : NC,
Nuc: ↑54%,
@ 0h
Resting PGC-1α p.c.:
Cyt 4x > Nuc.
Little
2011
[159]
8 - M
24y - 45
SIT:
4x [30 s “all-out” + 4
min rec]
NC @ 0 h
↑7.5 fold @ 3 h
NC @ 24 h
WM:
NC @ 0 & 3 h
↑57% @ 24 h
Nuc:
NC @ 0 h
↑66% @ 3 h
NC @ 24 h
Resting PGC-1α p.c.:
Cyt >> Nuc.
Norrbom
2011
[208]
12 - M
24y - 51
45 min 1-leg knee
xtensor (max to
completion)
NC @ 0 & 2 h n/r
Serpiello
2012
[283]
10 - M/F
22y - 54
Pre-training:
3 sets of: 5x [4 s “all-
out” + 20 s rec], w/ 4.5
min rec between sets
NC @ 0 & 1 h
↑3.1 fold @ 4 h
n/r Training: [4w (3d/w),
same as single bout;
ND in PGC-1α
mRNA upregulation
@ 0, 1, 4 h between
pre & post-training.
Post-training:
3 sets of: 5x [4 s “all-
out” + 20 s rec], w/ 4.5
min rec between sets
NC @ 0 & 1 h
↑2.7 fold @ 4 h
n/r
Stepto
2012
[301]
9 - M
23y - 44 Pre-training:
60 min @ 72% V̇O2Peak ↑11 fold @ 3 h ↑50% @ 0 h
↑40% @ 3 h
Training: [6x CT +
4x HIIT] in 14d;
PGC-1α mRNA @ 3h
pre > post-training;
PGC-1α p.c. @ 0 &
3h pre > post-
training.
Post-training:
60 min @ 72% V̇O2Peak
↑4.3 fold @ 3 h
NC @ 0 h
NC @ 3 h

Review of Literature
57
Study
Participants
n - sex
age - V̇O2Peak
Training bout PGC-1α
mRNA
PGC-1α p.c. Comments
Bartlett
2012
[18]
10 - M
20y – 52
HIIT (MFW):
6x [3 min @ 90% + 3
min @ 50% V̇O2Peak]
↑4.3 fold @ 3 h NC @ 3 h Exercise was RUN;
No difference
between HIIT or CT.
CT (MFW):
50 min @ 70% V̇O2Peak
↑4.5 fold @ 3 h NC @ 3 h
Bartlett
2013
[19]
8 - M
25y - 55
HC (MFW):
6x [3 min @ 90% + 3
min @ 50% V̇O2Peak]
↑3.7 fold @ 3 h n/r Exercise was RUN;
No effect of HC &
LC availability pre-
exercise. LC: (MFW):
6x [3 min @ 90% + 3
min @ 50% V̇O2Peak]
↑2.1 fold @ 3 h n/r
Edgett
2013
[72]
8 - M
22y - 53
11x [1 min @ 73%
WPeak + 1 min rec]
↑4.3 fold @ 3 h n/r 3 groups were MFW;
100% > 73% & 133%;
PGC-1α increased in
intensity-dependent
manner but only
below WPeak.
8x [1 min @ 100%
WPeak + 1 min rec]
↑7.9 fold @ 3 h n/r
6x [1 min @ 133%
WPeak + 1 min rec]
↑4.2 fold @ 3 h n/r
Popov
2013
[237]
UT: 6 - M
n/r - 42
10x [3 min @ 60% AT
+2 min @ 91% AT]
↑9 fold @ 3 h
↑8.5 fold @ 5 h
n/r No effect of previous
training history on
PGC-1α mRNA
upregulation post-
exercise.
ET: 6 - M
n/r - 57
↑8 fold @ 3 h
↑7.5 fold @ 5 h
n/r
Psilander
2013
[240]
10 - M
28y - 65
LG:
1 h @ 64% V̇O2Peak
↑8.1 fold @ 3 h n/r PGC-1α mRNA LG >
NG @ 3 h.
NG:
1 h @ 64% V̇O2Peak
↑2.5 fold @ 3 h n/r
Cochran
2014
[55]
8 - M
22y - 48
SIT (MFW):
4x [30 s “all-out” + 4
min rec]
↑4 fold @ 3 h n/r No effect of different
training modality on
PGC-1α mRNA.
CT (MFW):
~4 min “all-out”
↑4 fold @ 3 h n/r

Review of Literature
58
Study
Participants
n - sex
age - V̇O2Peak
Training bout PGC-1α
mRNA
PGC-1α p.c. Comments
Popov
2014
[236]
12 - M
21 - 46
HIIT: (MFW):
10x [2 min @ 70%
WPeak + 3 min @ 46%
WPeak]
NC @ 1 h
↑9 fold @ 3 h
↑8 fold @ 5 h
n/r PGC-1α mRNA HIIT
> CT @ 3 & 5 h;
Exercise intensity-
dependent regulation
of PGC-1α mRNA. CT (MFW):
50 min @ 54% WPeak
NC @ 1 h
↑5.6 fold @ 3 h
↑5 fold @ 5 h
n/r
V̇O2Peak: peak oxygen uptake (mL min-1 kg-1); PGC-1α: peroxisome proliferator-activated receptor
γ coactivator 1α; p.c.: protein content; M: male; TR: trained; NC: no change; @ 0 h: immediately
after cessation of exercise; @ 3 (x) h: after 3 (x) h after cessation of exercise; n/r: not reported;
UT: untrained; WM: whole-muscle fraction; Nuc: nuclear fraction; HC: high CHO availability;
LC: low CHO availability; CHO: carbohydrate; WPeak: peak power; FFA: free fatty acids; GXT:
graded exercise test; ET: endurance trained; ST: strength trained; F: female; TTE: time to
exhaustion; HRMax: maximal heart rate; rec: recovery; CT: continuous training; HIIT: high-
intensity interval training; MFW: matched for total work; Cyt: cytosolic fraction; SIT: sprint
interval training; all-out: maximal intensity exercise; ND: no difference; AT: anaerobic threshold;
LG: low glycogen availability; NG: normal glycogen availability.
1.5.3.1.1 Exercise-induced changes in PGC-1α gene and protein expression
PGC-1α mRNA
In human skeletal muscle, one bout of exercise induces a dramatic increase in PGC-1α
mRNA that peaks 2 to 5 h post-exercise (Figure 1.10). While some studies have reported
an increase in PGC-1α mRNA immediately post-exercise [180, 207, 259], the majority
of research suggests this increase is not significant until ~1 h following exercise cessation,
and is maintained until ~8 h post-exercise (Figure 1.10). To date, no study has observed
an increase in PGC-1α mRNA content beyond 8 h from exercise cessation (Figure 1.10).
An important consideration is that the timing of PGC-1α mRNA upregulation normally
presented in the literature (and also in Figure 1.10) is based on the time passed from the
termination of exercise. However, especially for longer exercise durations, the time
required for the increase in PGC-1α mRNA would likely be reduced, considering the
signalling response to exercise has been shown to begin at the onset of exercise [251].
This should be considered when directly comparing exercise bouts of different durations.

Review of Literature
59
Figure 1.10. Timing of PGC-1α mRNA upregulation from the termination of a single exercise
bout in the vastus lateralis muscle of healthy human participants. Results were obtained from:
[18, 19, 42, 53-55, 57, 69, 72, 73, 83, 159, 172, 180, 207-209, 224, 232, 233, 236, 237, 240, 259,
283, 297, 301, 326, 334, 337]. All values are mean ± SEM.
Several studies have reported that following an exercise bout, PGC-1α mRNA is
temporarily increased and returns to baseline values within 24 h [159, 180, 224, 232, 233].
Further knowledge on the mechanisms regulating exercise-induced increases in PGC-1α
mRNA was gained when a training study (seven sessions) observed that the increase in
PGC-1α mRNA 4 h post-exercise was progressively reduced with every subsequent
exercise bout performed at the same relative exercise intensity [224]. This “saw-tooth”
pattern, created by the continuous upregulation (4 h) and return to baseline values (24 h)
following each training bout, continued until the seventh bout with smaller increases after
each bout (Figure 1.11). This suggests that the increase in mitochondrial proteins that
follows a training intervention may be the result of transient bursts in the mRNA of PGC-

Review of Literature
60
1α (and other transcription factors) [224], and that the transcriptional stimulus is reduced
as the training intervention progresses.
Figure 1.11. . Skeletal muscle PGC-1α mRNA changes following 7 sessions of HIIT (cycling).
*Significantly different from Pre, § all 24 h time points, # 1st-4 h, b all 4 h time points. All values
are mean ± SEM (From [224]).
The effect of training intensity on changes in PGC-1α mRNA is not completely
understood. Findings from a study showing a greater increase in PGC-1α mRNA after a
cycling bout at 80% of V̇O2Peak, compared with an isocaloric cycling bout at 40% of
V̇O2Peak, indicate that the magnitude of the increase in PGC-1α mRNA is regulated in a
training intensity-dependent manner [73]. These findings were confirmed by another
study showing a greater increase in PGC-1α mRNA following a bout of HIIT at 70% of
WPeak, compared with an isocaloric bout of continuous cycling at 54% of WPeak [236].
Further insight into the training intensity-dependent regulation of PGC-1α mRNA was
provided by a study investigating work-matched HIIT bouts at three different training
intensities (73%, 100% and 133% of V̇O2Peak). This study showed a greater increase in
PGC-1α mRNA after a bout of HIIT at 100% of V̇O2Peak, compared with that obtained

Review of Literature
61
after a bout of HIIT at either 73% or 133% of V̇O2Peak. The authors hypothesised that the
exercise-induced increase in PGC-1α mRNA is regulated in a training intensity-
dependent manner only at submaximal training intensities, as the apparent intensity effect
did not extend to supramaximal intensities [72]. Findings from a study reporting no
difference in the PGC-1α mRNA increase following two separate exercise bouts in which
participants performed either four 30-s “all-out” bouts, or a maximal continuous work-
matched effort lasting ~4 minutes performed at a significantly lower overall training
intensity [55], are consistent with this hypothesis. These authors also suggested that the
regulation of PGC-1α mRNA does not depend on the training modality (continuous vs.
intermittent exercise), as previously demonstrated in a study showing a similar increase
in PGC-1α mRNA following a single bout of work-matched continuous vs. HIIT,
performed at the same average training intensity [18].
Further insight into the importance of relative training intensity can be gained from
studies comparing changes in PGC-1α mRNA pre- and post-training, and in participants
of different training status. A study investigating the effects of a single bout of 2-legged
knee extension has shown a significantly greater exercise-induced increase in PGC-1α
mRNA in the untrained vs. trained leg, when the relative exercise intensity was the same
[233]. Similarly, results from a study investigating the effects of a single bout of HIIT,
showed a greater exercise-induced increase in the PGC-1α mRNA in untrained compared
with endurance-trained participants, when the relative exercise intensity was the same
[207]. The authors from the latter study concluded that the relative intensity of brief
intermittent exercise is of major importance for the exercise-induced increase in PGC-1α
mRNA. Conversely, another study reported no difference in the exercise-induced increase
in PGC-1α mRNA of untrained vs. endurance-trained participants, following a single bout
of HIIT at the same relative exercise intensity [237]. Similarly, no influence of previous
training history was also reported by a study comparing endurance trained vs. strength
trained participants, showing similar exercise-induced increases in PGC-1α mRNA
following a single bout of continuous cycling at the same relative intensity [57]. More
research is needed to better understand the effect of training status and previous training
history on the PGC-1α response to exercise.

Review of Literature
62
PGC-1α protein
A central dogma of molecular biology is that ‘DNA makes RNA and RNA makes protein’
[64]. It is not surprising therefore, that studies investigating the effects of a single exercise
bout on PGC-1α protein content indicate that a longer time is needed until PGC-1α protein
is increased; however, different time frames have been reported. There seems to be
consensus that a lapse of 24 h from the cessation of exercise is sufficient to increase PGC-
1α content, with reported increases ranging from 15 to 60% at this time point [159, 180,
224]. An increase in PGC-1α content has also been reported immediately [180, 301], or
half an hour [69] post-exercise. However, the majority of research has reported no change
immediately post-exercise [54, 159, 160, 184], or for a period lasting up to 3-5 h post-
exercise [18, 54, 57, 83, 159, 224]. The reasons for these differences are difficult to
explain and are likely related to the various methodological differences between studies.
The somewhat contrasting results presented above suggest that more research is needed
to investigate the timing of the response of PGC-1α protein to a single bout of exercise.
Nuclear accumulation of PGC-1α protein following an exercise bout has been shown in
human skeletal muscle [159, 160], and has been suggested to constitute the initial phase
of the exercise-induced adaptive response [351]. However, this topic will not be further
discussed at this stage, as it has been presented in detail in section 1.4.2.1.
1.5.3.1.2 Training-induced changes in PGC-1α protein content
Most published research indicates that PGC-1α protein content is increased (~20-100%)
following a training intervention (Table 1.4), with only two studies failing to observe a
significant change [161, 324]. Studies have also measured the level of resting PGC-1α
mRNA pre- and post-training. Results are contrasting, with some studies showing similar
increases to those in PGC-1α protein content (~20-70%) [74, 281], whereas others did
not observe a change [221, 233, 280]. One study has also assessed PGC-1α protein
content changes in single fibres, and reported that changes in PGC-1α content in type IIa
fibres are more than 3-fold greater than those in type I and IIx [258]. Finally, studies have
assessed changes in PGC-1α protein content in different cellular compartments. While
two studies demonstrated a 25-35% increase in nuclear PGC-1α protein content following
two weeks of HIIT [98, 161], another study reported no difference compared to pre-

Review of Literature
63
training values after eleven weeks of a mix of HIIT and continuous running in both the
nuclear and the cytosolic fraction [221]. While it is difficult to explain these
discrepancies, it is possible that the increase in nuclear PGC-1α protein content observed
after two weeks of training in the first two studies represents an early training-adaptation
that may no longer be present after eleven weeks of training. The type of exercise (cycling
vs. run) may also have confounded these results. Nonetheless, more research is required
to confirm these hypotheses and to better understand training-induced changes in PGC-
1α protein content in different subcellular compartments and in different fibre types.
Table 1.4. Changes in PGC-1α protein content measured in whole-muscle homogenates from the
vastus lateralis muscle of healthy human participants following cycle exercise training (unless
otherwise specified).
Study Participants
n - sex
age - V̇O2Peak
Training type Training
protocol
PGC-1α
protein
content
Comments
Pilegaard
2003, [233]
7 - M
22y - n/r
~1 h 1-leg knee
extensor @ 70% of
1-leg 2-min max
4w (5d/w);
increasing
resistance
mRNA: NC.
Russell
2003, [258]
7 - M
34y - 54
HIIT:
5-6x [1-3 min @ 70-
80% + 1 min @ 50%
V̇O2Peak]
CT:
40 min @ 60%
V̇O2Peak
6w (3d/w); HIIT-CT-HIIT each week;
increasing
resistance &
reps
type I:
↑50%
type IIa:
↑180%
type IIx:
↑50%
type IIa > type I & IIx;
↑2.7 fold increase in
baseline PGC-1α
mRNA.
Short 2003,
[291]
65 - M/F
21-87y - 41
20-40 min @ 70-80%
HRMax
16w (3-4d/w);
increasing
resistance,
frequency &
duration
mRNA: ↑55%;
Burgomaster
2008, [35] SIT:
5 - M/F
24y - 41
4-6x [30 s ‘all-out’ +
4.5 min @ 30 W]
6w (3d/w);
increasing
reps
↑100% Similar increase in
PGC-1α p.c. for both
groups (as main
effect of time). CT:
5 - M/F
23y - 41
40-60 min @ 65%
V̇O2Peak
6w (5d/w);
increasing
duration
↑100%

Review of Literature
64
Study Participants
n - sex
age - V̇O2Peak
Training type Training
protocol
PGC-1α
protein
content
Comments
Morton
2009, [200]
LO+G (MFW):
8 - M
20y - 41
5x [3 min @ 90% +
1.5 min @ 25% & 1.5
min @ 50% V̇O2Peak]
6w (2 a day
2d/w);
increasing
resistance
↑50% No effect of low
glycogen availability
or exogenous glucose
supplementation
(similar for
gastrocnemius
muscle).
LO+P (MFW):
7 - M
21y - 41
As above ↑40%
NORM (MFW):
8 - M
20y - 41
6w (1 a day
4d/w);
increasing
resistance
↑50%
Little
2010, [161]
7 - M
21y - 46
8-12x [60 s @ 100%
WPeak + 75 s @ 30 W]
2w (3d/w);
increasing
reps
WM: NC
Nuc: ↑24%
HIIT increases Nuc
but not WM PGC-1α
p.c.
Perry
2010, [224]
9 - M
23y - 46
10x [4 min @ ~90%
V̇O2Peak + 2 min rec]
2w (3.5d/w);
increasing
resistance
post-session
1: ↑23%
post-session
3: ↑35%
post-session
5: ↑42%
post-session
7: ↑38%
PGC-1α mRNA
increased/decreased
in a “stair-case” type
response (reduced
activation from 1st to
7th bout);
Gurd 2010,
[96]
9 - M/F
23y - 45
10x [4 min @ ~90%
V̇O2Peak +2 min rec]
6w (3d/w);
increasing
resistance
↑16%
Hood 2011,
[117]
7 - M/F
45y - 30
10x [60 s @ 60%
WPeak + 60 s @ 30 W]
2w (3d/w);
no progression
↑56%
Gurd 2011,
[98]
7 - M/F
n/r - n/r
10x 4 min @ ~90%
V̇O2Peak +2 min rec
2w (3.5d/w);
increasing
resistance
WM: ↑36%
Nuc: ↑34%
Serpiello
2012, [283]
10 - M/F
22y - 54
3 sets of: 5x [4 s ‘all-
out’ + 20 s rec], w/
4.5 min rec between
sets
4w (3d/w);
no progression
↑33%
Stepto 2012,
[301]
9 - M
23y - 44
6x [5 min @ ~95%
V̇O2Peak + 2 min rec]
or:
45, 60 or 90 min @
75% V̇O2Peak
2w (5d/w);
(4x HIIT + 6x
CT)
↑54%

Review of Literature
65
Study Participants
n - sex
age - V̇O2Peak
Training type Training
protocol
PGC-1α
protein
content
Comments
Egan 2013,
[74]
8 - M
23y - 37
60 min @ 80%
V̇O2Peak
2w (7d/w);
no progression
post-session
1: ↑52%
post-session
3: ↑49%
post-session
7: ↑90%
post-session
10: ↑80%
post-session
14: ↑77%
PGC-1α p.c.
increases after 1 bout,
and plateaus after 7th
bout;
PGC-1α mRNA
increases only after
3rd session (↑48%)
and slowly declines
thereafter (still ↑25%
after 14th session)
Paulsen
2014, [221]
27 - M
24y – 53
HIIT:
4-6x [4-6 min @
>90% HRMax]
CT:
30-60 min @ 70-90%
HRMax
11w (3-4d/w);
2x (HIIT+CT)
per week;
increasing
frequency,
intervals &
duration
WM: ↑50%
Cyt: NC
Nuc: NC
mRNA: NC;
Exercise was RUN.
Konopka
2014, [143]
Young:
7 - M
20y - 41
20-45 min @ 60-80%
HRRes
12w (3-4d/w);
increasing
intensity,
duration &
frequency
↑62% Aging does not
influence the PGC-1α
training-induced
response. Old:
6 - M
74y - 21
↑55%
Scribbans
2014, [280]
9 - M
21y - 48
HIIT:
8x [20 s @ ~170%
V̇O2Peak + 10 s rec]
6w (4d/w);
no progression
mRNA: NC
10 - M
21y - 48
CT:
30 min @ 65%
V̇O2Peak
6w (4d/w);
no progression
mRNA: NC
Scribbans
2014, [281]
8 - M
22y - 51
8x [20 s @ ~170%
V̇O2Peak + 10 s rec]
4w (3d/w);
no progression
mRNA: ↑70%
Vincent
2015, [324]
8 - M
22y - 46
12x [1 min @ ~120%
WPeak + 90 s rec]
2w (4d/w);
no progression
NC
V̇O2Peak: peak oxygen uptake (mL min-1 kg-1); PGC-1α: peroxisome proliferator-activated receptor
γ coactivator 1α; M: male; n/r: not reported; w: week; d: day; NC: no change; HIIT: high-intensity
interval training; CT: continuous training; F: female; HRMax: maximal heart rate; SIT: sprint
interval training; p.c.: protein content; W: Watt; ‘all-out’: maximal intensity exercise; LO: low
glycogen availability; G: glucose supplementation; MFW: matched for total work; P: placebo
supplementation; NORM: normal glycogen availability; WM: whole-muscle; Nuc: nuclear; rec:
recovery; WPeak: peak power; cyt: cytosolic; HRRes: heart rate reserve.

Review of Literature
66
The magnitude of the increase in whole-muscle PGC-1α protein content following
training does not appear dependent on the training volume, as demonstrated by two
studies measuring the time course of training-induced changes in PGC-1α protein content
[74, 224]. Despite using different training protocols (HIIT at 90% of V̇O2Peak for Perry et
al. (2010) and continuous cycling at 80% of V̇O2Peak for Egan et al. (2013)), also resulting
in different training volume amounts (3600 and 4800 training volume units per session,
respectively), both studies showed that PGC-1α protein content is significantly increased
within one training session, and reached maximum values after 5 to 7 sessions (Figure
1.12). The data in the figure indicate that changes in PGC-1α protein content seems to
plateau, or even a decrease, after reaching maximum values following bout 5-7. It would
be valuable for future research to assess a longer time course of PGC-1α change. This
would allow to explore whether, following the initial increase, the protein content of
PGC-1α plateaus, continues to decrease before possibly returning to pre-training levels,
or increases again at a later stage.
The role of training intensity as a determinant of changes in PGC-1α protein content has
not been addressed. The only study to directly compare two different training intensities
reported that continuous training (CT) at 65% of V̇O2Peak, and SIT at training intensities
greater than 200% of V̇O2Peak, increased PGC-1α protein content to a similar extent [35].
However, while training volume does not seem to be a key determinant of training-
induced changes in PGC-1α protein content [74, 224], the SIT group in the above study
performed less than 10% of the training volume performed by the CT group. This seems
to indicate that PGC-1α is sensitive to training intensity, and that SIT at maximal training
intensity represents a potent stimulus to increase PGC-1α protein content. In conclusion,
little is known about the role of training intensity in the regulation of PGC-1α. Therefore,
future research should aim to provide these answers by directly comparing different
training intensities, and where possible, trying to match training groups for total work.

Review of Literature
67
Figure 1.12. Time course of changes in PGC-1α protein content following either fourteen sessions
of continuous cycling for 60 min at 80% of V̇O2Peak [74], or seven sessions of high-intensity
interval cycling consisting of ten 4-min repetitions at ~90% V̇O2Peak interspersed with two min of
recovery [224]. * Significantly different from baseline (P < 0.05); † trend for a significant
difference from baseline (0.1 > P > 0.05). All values are mean ± SD. (Adapted from [74, 224])
1.5.3.2 p53
As described in detail in section 1.4.2.2, the tumour suppressor p53 is another important
regulator of exercise-induced mitochondrial biogenesis [266]. While its role as a
metabolic [329] and transcriptional [266] regulator has been well documented in rodent
and cell models, there is a paucity of research on the effects of exercise and exercise
training on p53 mRNA and protein expression in human skeletal muscle. A single bout
of HIIT, at exercise intensities of 73, 100, and 133% of WPeak, has been reported to
increase p53 mRNA, in human skeletal muscle, after 3 hours of recovery [72]. Moreover,
both a single bout of HIIT at 90% of V̇O2Peak, and continuous running at 70% of V̇O2Peak,
increased p53 phosphorylation at serine 15 [18] (a post-translational modification

Review of Literature
68
inducing p53 activity [71]), in human skeletal muscle, three hours following the cessation
of exercise. The latter study also reported no difference in p53 phosphorylation between
low-intensity continuous and HIIT matched for total work and average intensity. It has
also been observed that increases in exercise-induced p53 phosphorylation are enhanced
by low glycogen availability [19], suggesting a nutritional modulation of p53 activity,
and consistent with the notion that cellular stress increases p53 activity [215].
p53 nuclear accumulation is another post-translational modification that has been linked
with an increase in p53 activity [178, 215, 286]. However, no study to date has
investigated the effects of a single bout of exercise on the nuclear accumulation of p53 in
humans. A study in rat skeletal muscle reported a ~50% increase in whole-muscle p53
protein six hours after the termination of a single bout of maximally-activated eccentric
contractions, an effect preceded by a ~60% increase in nuclear p53 protein 1 hour post-
exercise [45]. Similarly, an increase in nuclear p53 has also been reported in mice
immediately after termination of a 60-min running bout at a variable intensity [227].
Conversely, a study in mouse skeletal muscle reported a decrease in nuclear p53 protein
content both immediately post-exercise and after 3 h of recovery following a 90-min
running bout [267]. Given the importance of the changes in p53 localisation in response
to oxidative stress [215], more research is required, specifically in human skeletal muscle,
to better understand the effects of exercise on p53 nuclear localisation and the cellular
mechanisms that regulate these processes. For an in-depth discussion on the events and
mechanisms related to p53 post-translational modifications, the reader is referred to
section 4.4.
While the above findings suggest that p53 is involved in the regulation of exercise-
induced mitochondrial adaptations, no study to date has measured changes in p53 protein
content following a training intervention in humans. Given the critical role that is
emerging for p53 [266], more research is needed to determine if exercise training results
in a changes in p53 protein content in human skeletal muscle, and its possible
consequences. Moreover, determining the role of training intensity and training volume
on the regulation of p53 is critical to better understand the mechanisms of exercise and
training-induced mitochondrial biogenesis.

Review of Literature
69
1.5.3.3 TFAM
TFAM is also a key player in the modulation of exercise-induced mitochondrial
biogenesis is [272]. TFAM mRNA has been shown to be upregulated 4-6 hours post-
exercise in human skeletal muscle [224, 233, 237, 236], with no change in TFAM protein
content within a 24-hour period [224]. Only one study to date has investigated the effects
of different exercise intensities on the modulation of TFAM mRNA [236]. This study
compared continuous vs. high-intensity intermittent exercise matched for total work at 54
and 70% of peak power output (WPeak) respectively, and reported that TFAM mRNA was
upregulated only following exercise at the higher intensities. Further research is needed
however, to rule out the possible effects of different training modalities (continuous vs.
intermittent training), and to also determine the role of training volume on the regulation
of TFAM. On the other hand, there is controversy regarding the effects of a training
intervention on TFAM protein content and basal mRNA abundance. Studies have
reported no change in TFAM protein content following seven sessions [224], or six weeks
[96] of cycling HIIT. Similarly, no change was reported in resting TFAM mRNA levels
following 10 days of one-legged, knee-extension exercise [210]. Conversely, an increase
in basal TFAM mRNA abundance was reported following 16 weeks of continuous
cycling [291], as well as increased TFAM protein content following four weeks of one-
legged cycling [21], or six sessions of HIIT cycling [161]. These discrepancies, which
may depend on several methodological differences between studies, are difficult to
explain. In addition, no study to date has directly investigated the effects of different
training intensities or training volumes on the modulation of TFAM following a training
intervention. Therefore, to better understand the effect of exercise and exercise training
on the modulation of TFAM, further research directly comparing the effects of
manipulating these parameters within one study is warranted.
1.5.4 Summary
These sections have provided an extensive review on the current knowledge regarding
the effects of training intensity and volume on exercise- and training-induced
mitochondrial adaptations. Although when comparing results from different studies it is

Review of Literature
70
difficult and somewhat risky to generalise, the present literature review seem to suggest
that while training intensity may be a key determinant of changes in mitochondrial
respiration, training volume appears to be an important modulator of mitochondrial
content. Conversely, little is known about the effects of exercise intensity and exercise
volume on the changes in the mRNA and protein expression of key coactivators and
transcription factors. The aim of Chapter 2 to 4 will be to provide a clearer and better
understanding of the above hypotheses, by directly comparing different training
intensities and volumes within the one study, and investigating their effects on genes and
proteins that have been proposed to regulate mitochondrial biogenesis.
1.6 Future research: a holistic approach to training-induced
mitochondrial adaptations
Despite the wealth of research investigating the several facets of exercise- and training-
induced mitochondrial adaptations, very few studies, if any, have looked at a more holistic
approach and measured several of these parameters simultaneously. For example, studies
investigating changes in mitochondrial respiration have in general neglected to measure
the protein content of key transcription factors reported to influence mitochondrial
function [5, 140, 181, 329]. Conversely, mechanistic studies investigating exercise- and
training-induced changes in the genes and proteins regulating mitochondrial biogenesis,
have not measured mitochondrial function. New evidence is emerging regarding the role
of transcription factors such as PGC-1α and p53 in the regulation of metabolism [140,
329], autophagic processes influencing mitochondrial turnover [173, 198, 320], and
mitochondrial remodelling events such as fusion and fission processes [42, 266].
Moreover, research in mice and humans indicates that mitochondrial content and function
are not necessarily linked [128, 252], and should be differentiated and measured
simultaneously [128]. Therefore, future research investigating exercise- and training-
induced mitochondrial adaptations should take a more holistic approach and measure
markers of mitochondrial content and function in parallel with changes in the protein
content of key transcription factors regulating exercise- and training-induced

Review of Literature
71
mitochondrial biogenesis. This would allow a better understanding of the interconnection
between mitochondrial content and function and would further define the role of key
transcription factors in the regulation of mitochondrial adaptations to training and the
remodelling of skeletal muscle phenotype.

Review of Literature
72

73
Chapter 2
Effects of training intensity on
markers of mitochondrial biogenesis
This study is presented as the first in a series of related studies investigating how the
manipulation of different training variables affects exercise- and training-induced
mitochondrial adaptations.
The specific purpose of this study was to investigate the role of training intensity. The
effects of four weeks of moderate-intensity continuous training (STCT), high-intensity
interval training (HIIT), and maximal-intensity sprint interval training (SIT), on
mitochondrial content, mitochondrial respiration, and the protein content of valid
biomarkers of mitochondrial biogenesis, were investigated.
The manuscript for this study is ready for submission:
Granata C, Oliveira RSF, Little JP, Renner K and Bishop DJ (2015). Training intensity
modulates changes in mitochondrial respiration, and PGC-1α and p53 protein content,
but not markers of mitochondrial content The FASEB Journal (under review).

Training Intensity
74

Training Intensity
75
2.1 Introduction
Mitochondria are key components of skeletal muscles, as they provide the energy required
for almost all cellular activities and play an important role in ageing and cell pathology.
For example, mitochondria have been implicated in many age-related degenerative
diseases, cardiomyopathies and atherosclerosis, as well as a large variety of metabolic
disorders [168, 333]. Given their pivotal role in energy provision, it is not surprising that
mitochondrial adaptations have also been associated with endurance performance [129].
However, while early studies focussed on changes in mitochondrial enzymes, such as
citrate synthase (CS) activity, a biomarker of mitochondrial content [145], subsequent
studies have suggested that increasing mitochondrial function may contribute more to
improvements in both health [333] and endurance performance [129]. It is therefore
important to better understand factors that may influence mitochondrial function.
Exercise is one factor that has been shown to provide a powerful stimulus to increase both
mitochondrial content [113] and/or function [67, 360], yet little is known about the
optimal exercise dose, and whether mitochondrial content and function are altered by the
same or different exercise prescriptions. Only a handful of studies have directly
investigated the effects of different types of training on mitochondrial function [67, 127,
300, 313, 332, 343]. Moreover, only one study [67] directly compared the effects of two
different training intensities on mitochondrial respiration in permeabilised skeletal
muscle fibres, a technique presenting several advantages over measurements in isolated
mitochondria [264, 312]. This study showed that mitochondrial respiration was increased
after high-intensity interval training (HIIT), but did not change following work-matched
continuous training at a moderate intensity. This is in contrast with the findings from an
earlier study reporting an increase in mitochondrial function, measured via mitochondrial
ATP production rate (MAPR), following continuous training at a moderate intensity
[343]. Studies have also investigated the effects of all-out sprint interval training (SIT)
on markers of mitochondrial content [35, 36, 82], and showed that SIT induces similar
increases in CS activity to continuous training at a moderate intensity [35]. However,
none of these studies directly measured the effects of SIT on mitochondrial function.
Furthermore, it has been hypothesised that changes in mitochondrial content seem to
depend on training volume, whilst changes in mitochondrial function seem to be related

Training Intensity
76
to training intensity [26]. To test these hypotheses, and given the sometimes contradictory
and limited sample size of available studies, further research directly comparing the
effects of different training intensities on mitochondrial content and function is warranted.
The oxidative capacity of mitochondria is determined by the abundance of mitochondrial
proteins, and their functional ability to produce ATP [135]. The abundance and functional
ability of these proteins is influenced by transcriptional activity. This requires the
concerted integration of signalling, transcription and translation events taking place in
both the nucleus and the mitochondrion, followed by the import and incorporation of the
newly-generated proteins into the mitochondrial reticulum [56]. Monitoring changes in
these events not only allows for an indirect assessment of mitochondria biogenesis, but
also contributes to a better understanding of the underlying cellular mechanisms.
Peroxisome proliferator-activated receptor coactivator-1 (PGC-1) is a transcriptional
coactivator that has been shown to regulate mitochondrial content and respiration in
cultured muscle cells [352], and also metabolic control in rat skeletal muscle [140].
Subsequent studies in humans have shown that exercise training leads to an increase in
PGC-1α protein content [35, 224, 258], and suggest that modulation of PGC-1α mRNA
is sensitive to training intensity [73]. However, no study to date has directly compared
the effects of exercise training at different intensities on changes in PGC-1 protein
abundance, and both mitochondrial content and respiration.
The tumour suppressor p53, has also been shown to be an important regulator of
mitochondrial biogenesis [266]. Studies in cells and mice indicate that ablation of p53
leads to a reduction in mitochondrial respiration and content, and endurance performance
[181, 265]. p53 is also up-regulated following a single bout of exercise [18], and, similar
to PGC-1, has been shown to regulate the mitochondrial transcription machinery via
modulation of mitochondrial transcription factor A (TFAM) [217, 267]. Furthermore, by
regulation of downstream targets, p53 can control mitochondrial function by modulating
the balance between glycolytic and oxidative pathways [181, 329], and has been linked
with mitochondria dynamics and the maintenance of mitochondrial morphology [266].
Although the signalling mechanisms upstream of p53 are not yet fully known, plant
homeodomain finger-containing protein 20 (PHF20) has been shown to up-regulate p53
transcription [218] and to stabilise p53 protein [65], emphasising the role of PHF20 as a

Training Intensity
77
regulator of p53. Despite evidence demonstrating the importance of the p53 pathway in
the regulation of mitochondria biogenesis, no study to date has examined the effects of a
period of exercise training at different intensities on p53 and its upstream regulators and
downstream targets.
The purpose of this research was to compare the effects of four weeks of sub-lactate
threshold continuous training (STCT), HIIT and SIT on markers of mitochondrial
biogenesis in human skeletal muscle. It was hypothesised that higher training intensities
would produce greater improvements in mitochondrial respiration, and that these changes
would be associated with increased protein content of transcription factors known to
regulate mitochondrial biogenesis.
2.2 Methods
Participants and ethics approval
Participants. Thirty-one healthy men, who were non-smokers, moderately-trained and
involved in various individual and team sports, volunteered to take part in this study.
After initial screening and testing, they were matched by the power attained at the lactate
threshold (WLT) and randomly assigned to the STCT (n=10), HIIT (n=11), or SIT (n=10)
group. Twenty-nine participants completed the study, whilst two, one each from the
STCT and SIT group, withdrew from the study due to time constraints. Baseline
physiological parameters for each group are described in Table 2.1.
Ethical approval. Participants were informed of the study requirements, benefits and risks
before giving written informed consent. Approval for the study’s procedures, which
conformed to the standards set by the latest revision of the Declaration of Helsinki, was
granted by the Victoria University Human Research Ethics Committee.

Training Intensity
78
Table 2.1. Baseline characteristics of the participants
Measurement STCT group (n=9) HIIT group (n=11) SIT group (n=9)
Age (y) 21 ± 2 21 ± 1 21 ± 3
Height (cm) 179.3 ± 6.3 180.0 ± 10.7 180.6 ± 7.3
Body Mass (kg) 77.4 ± 10.6 80.2 ± 13.8 84.5 ± 19.4
V̇O2Peak [mL min-1 kg-1] 46.7 ± 3.8 45.1 ± 7.2 47.1 ± 7.8
STCT: sub-lactate threshold continuous training; HIIT: high-intensity interval training; SIT:
sprint interval training; V̇O2Peak: peak oxygen uptake. All values are mean ± SD.
Study design
The experimental protocol began with a familiarisation session, and baseline testing that
consisted of, in the following order, a 20-km cycling time trial (20k-TT), a graded
exercise test (GXT), and a resting muscle biopsy; all tests were separated by a minimum
of 48 h (72 h for the biopsy trial). During the training phase participants trained three
times a week for four weeks regardless of group, with the STCT and HIIT groups matched
for total work. Due to the nature of sprint training, it was not possible to match the SIT
group for total work with the other two groups. Seventy-two hours following the last
training session a resting muscle biopsy took place, followed 48 hours later by the 20k-
TT test. The testing and training duration was approximately 6 weeks.
Testing procedures
Participants were required to refrain from any strenuous physical activity for the 48 hours
preceding each performance test (72 h for the biopsy trial), from alcohol and any exercise
for 24 h before testing, and from food and caffeine consumption for the 2 h preceding
each test. Each type of test was performed at the same time of the day during the course
of the entire study with the aim to avoid variations caused by circadian rhythm changes.

Training Intensity
79
20k-TT. Cycling time trials were used as an indicator of endurance performance and were
performed on an electronically-braked cycle ergometer (Velotron, RacerMate, Seattle,
WA, USA). Prior to each time trial participants completed a warm-up involving cycling
for 4 min at 66% of WLT followed by 2 min at WLT and 2 min of rest. During the time
trial, participants were only allowed access to cadence and completed distance, and were
provided with similar verbal encouragement during each test. Heart rate monitors (Polar
Electro, Kempele, Finland) were used in all exercise trials and training sessions to monitor
heart rate.
GXT. Prior to training, a discontinuous graded exercise test was performed on an
electronically-braked cycle ergometer (Lode Excalibur, v2.0, Groningen, The
Netherlands) to determine the peak oxygen uptake (V̇O2Peak), peak power output (WPeak),
WLT (using the modified DMax method [25]), and the training intensities for the STCT and
HIIT groups. The test consisted of 4-min stages at a constant power output, interspersed
with 30 seconds of rest. The test began at a power output of 60, 90 or 120 W depending
on participants’ fitness levels, and was subsequently increased by 30 W every 4 min. Prior
to the test, and during the 30-s rest, capillary blood samples were taken from the fingertip
for measurement of blood lactate concentration ([La-]). Participants were instructed to
keep a cadence > 60 rpm and were given verbal encouragement throughout the test, during
which they were only allowed access to cadence and elapsed time. The test was stopped
when a participant reached volitional exhaustion or cadence dropped below 60 rpm. The
WPeak was determined as the power of the last completed stage when participants stopped
at the end of a stage. If a participant stopped during a stage, WPeak was determined as the
power of the last completed stage plus 7.5 W for every completed minute.
Gas Analysis during the GXT. During the GXT, expired air was continuously analysed
for O2 and CO2 concentrations via a gas analyser (Moxus modular oxygen uptake system,
2010, AEI technologies, Pittsburgh, PA, USA). The gas analysers were calibrated
immediately before each test using known gas mixtures (A: 21% O2, 0% CO2; B: 16%
O2, 4% CO2; BOC, Melbourne, Australia). The ventilometer was calibrated using a 3-
liter syringe (Hans Rudolph). V̇O2 values were recorded every 15 s and the two highest
consecutive 15-s values recorded during the test were averaged and recorded as the
participant’s V̇O2Peak.

Training Intensity
80
Capillary blood sampling. Glass capillary tubes (MultiCap 140 μL, Siemens Healthcare
Diagnostics Inc. Deerfield, IL, USA) were used to collect about 50 μL of blood at the
various time points during the GXT. Capillary blood [La-] was determined using a blood-
lactate analyser (YSI 2300 STAT Plus Glucose & Lactate Analyser, YSI Inc., Yellow
Spring, Ohio, USA). The blood-lactate analyser was regularly calibrated using precision
standards and routinely assessed by external quality controls.
Muscle biopsies. All muscle samples were obtained in the morning by an experienced
practitioner at a constant depth of around 2-3 cm. Before and after the training period,
resting muscle biopsies (approximately 150-300 mg wet weight) were taken from the
vastus lateralis muscle using a biopsy needle with suction. Participants rested in the
supine position and after injection of a local anaesthetic into the skin and fascia (1%
xylocaine, Astra Zeneca) a small incision was made. The same leg was chosen post-
training. Once obtained, muscle samples were processed, cleaned of excess blood, fat and
connective tissue and split in two portions. One portion (10-20 mg) was immediately
immersed in a 5-mL tube containing ~3 mL of biopsy preserving solution kept on ice and
was used for in-situ measurements of mitochondrial respiration. The remaining portion
was immediately frozen in liquid nitrogen and stored at -80°C for subsequent analyses.
Training intervention
All training sessions were carried out on an electronically-braked cycle ergometer
(Velotron, RacerMate, Seattle, WA, USA) and were preceded by an 8-min warm up (as
described in the 20k-TT paragraph).
STCT. Training sessions consisted of continuous cycling at a fixed power equivalent to
90, 92.5, 95 and 97.5% of baseline WLT for week one to four respectively (Figure 2.1).
The workload was matched to that completed by the HIIT group.
HIIT. Training sessions consisted of 4-min cycling intervals interspersed with a 2-min
recovery period at a power of 60 W. The training intensities were defined as [WLT + x
(WPeak-WLT)] (with x equivalent to 0.35, 0.50, 0.65 and 0.75 for week one to four
respectively, Figure 2.1). For the above two groups, training intensity was set relative to
WLT rather than WPeak as metabolic and cardiac stresses are similar when individuals of

Training Intensity
81
differing fitness levels exercise at a percent of the WLT, but can vary significantly when
training at a percent of WPeak [15].
Figure 2.1. Training intensity expressed as percent of the peak power (WPeak) for the sub-lactate
threshold continuous training (STCT), high-intensity interval training (HIIT), and sprint interval
training (SIT) group. The numbers in each bar represent the duration in minutes (STCT) or the
number of intervals (HIIT, SIT) for each of the three weekly training sessions. WLT: power at the
lactate threshold attained during the graded exercise test (GXT) calculated using the modified
DMax method [25]. All values are mean ± SEM.
SIT. Training sessions consisted of 30-s “all-out” cycling bouts (Wingate test) against a
resistance set at 0.075 kg/kg body mass, interspersed with a 4-min recovery period (Figure
2.1). During recovery participants remained on the bikes and were allowed to either rest
or cycle against a low resistance (30 W) at low cadence (< 50 rpm). During the last 15 s
of the recovery period participants were instructed to begin pedalling and reach a cadence
of 80-100 rpm against no resistance (warm up phase) and in the last 2 seconds they were
instructed to begin pedalling as fast as possible (speed up phase). At this time the load
was applied via a software (Velotron Wingate Software, Velotron, RacerMate, Seattle,
WA, USA) loaded on a computer interfaced with the cycle ergometer. Participants were

Training Intensity
82
verbally encouraged to keep the cadence as high as possible during the entire duration of
the bout.
Physical activity and nutritional control
Participants were instructed to maintain a normal dietary pattern and to keep their routine
physical activity at a constant level throughout the entire study. To minimize variability
in muscle metabolism attributable to diet, participants were provided with a standardised
dinner (55 kJ kg-1 body mass (BM), providing 2.1 g carbohydrate kg-1 BM, 0.3 g fat kg-1
BM, and 0.6 g protein kg-1 BM) and breakfast (41 kJ kg-1 BM, providing 1.8 g
carbohydrate kg-1 BM, 0.2 g fat kg-1 BM, and 0.3 g protein kg-1 BM) prior to the two
biopsy trials. These meals were consumed 15 and 3 h prior to the biopsy trials
respectively. Participants were also required to fill in a nutrition diary recording the last
3 meals prior to each performance test undertaken during baseline testing and they were
asked to replicate the same nutritional intake thereafter prior to the same type of test.
Muscle analyses
Preparation of permeabilised skeletal muscle fibres for mitochondrial respiration. A 10-
20 mg fresh muscle sample was placed in ice cold BIOPS, a biopsy preserving solution
containing (in mM) 2.77 CaK2EGTA, 7.23 K2EGTA, 5.77 Na2ATP, 6.56 MgCl2, 20
taurine, 50 Mes, 15 Na2phosphocreatine, 20 imidazole and 0.5 DTT adjusted to pH 7.1
[225]. Samples were transferred to a 6-well plate kept on ice where the fibres were
mechanically separated using pointed forceps. Fibres were subsequently permeabilised
by gentle agitation for 30 min at 4°C in BIOPS containing 50 μg/mL of saponin. Samples
were then washed 3 times for 7 min at 4°C by gentle agitation in MiR05, a respiration
medium containing (in mM, unless specified) 0.5 EGTA, 3 MgCl2, 60 K-lactobionate, 20
taurine, 10 KH2PO4, 20 Hepes, 110 sucrose and 1 g/l BSA essentially fatty acid-free
adjusted to pH 7.1 at 37°C [225]. This method selectively permeabilises the cellular
membrane leaving the mitochondria intact and allows for in-situ measurements of
mitochondrial respiration.

Training Intensity
83
High-Resolution Respirometry. After washing, 3-4 mg wet weight of muscle fibres were
assayed in duplicate in a high-resolution respirometer (Oxygraph-2k, Oroboros
Instruments, Innsbruck, Austria) containing 2 mL of MiR05. Mitochondrial respiration
was measured at 37°C. Oxygen concentration (nmol/mL) and oxygen flux (pmol s-1 mg-
1) were recorded using DatLab software (Oroboros Instruments, Innsbruck, Austria), and
instrumental background oxygen flux, accounting for sensor oxygen consumption and
oxygen diffusion between the medium and the chamber boundaries, was corrected online.
Re-oxygenation by direct syringe injection of O2 in the chamber was necessary to
maintain O2 levels between 275 and 450 nmol/mL and to avoid potential oxygen diffusion
limitation.
Mitochondrial respiration protocol. A substrate-uncoupler-inhibitor titration (SUIT)
protocol was used and the SUIT sequence, with final chamber concentration in brackets,
was as follows: pyruvate (2 mM) and malate (5 mM) in the absence of adenylates were
added for measurement of LEAK respiration (L) with electron entry through Complex I
(CI) (CIL). ADP (5 mM) was then added for measurement of maximal oxidative
phosphorylation (OXPHOS) capacity (P) with electron input through CI (CIP), followed
by addition of succinate (10 mM) for measurement of P with simultaneous electron supply
through CI + Complex II (CII) combined (CI+IIP). This respiration state provides
convergent electron input to the Q-junction through CI (NADH provided by
malate/pyruvate) and CII (flavin adenine dinucleotide reduced (FADH2) provided by
succinate) and supports maximal mitochondrial respiration by reconstruction of the
tricarboxylic acid cycle function. Cytochrome c (10 μM) was then added to test for outer
mitochondrial membrane integrity; an exclusion criterion was set such that if a chamber
showed an increase in O2 flux > 6% after addition of cytochrome c, it was discarded. This
was followed by a series of stepwise carbonyl cyanide 4-(trifluoromethoxy)
phenylhydrazone titrations (FCCP, 0.75-1.5 μM) for measurement of electron transport
system (ETS) capacity (E) with convergent electron input through CI+II (CI+IIE).
Rotenone (0.5 μM), an inhibitor of CI, was then added to obtain a measurement of E with
electron input through CII (CIIE). This was followed by addition of antimycin A (2.5 μM),
an inhibitor of Complex III (CIII), to obtain a measurement of residual oxygen
consumption capacity (ROX). ROX was subtracted from all other measurements to
account for oxidative side reactions. Ascorbate (2 mM) and N,N,N',N'-tetramethyl-p-

Training Intensity
84
phenylenediamine (TMPD, 0.5 mM), artificial electron donors for Complex IV (CIV),
followed by sodium azide (> 200 mM), an inhibitor of CIV to account for auto oxidation
of ascorbate + TMPD, were then added to measure CIV respiration in the noncoupled
state (CIVE). Respiratory flux control ratios (FCR) were calculated. In brief, the leak
control ratio (LCR) is the quotient of CIL over CI+IIE; the phosphorylation control ratio
(PCR) is the quotient of CI+IIP over CI+IIE; the coupling control ratio is the quotient of
CIL over CI+IIP and is equivalent to the inverse respiratory control ratio (inv-RCR); and
the substrate control ratio (SCR) at constant P is the quotient of CIP over CI+IIP. Finally,
the reserve capacity of CIV (CIVRES) as the quotient of CI+IIP over CIVE was determined.
Preparation of whole muscle lysates. Approximately 10-20 mg of frozen muscle was
homogenised 4 times for 5 seconds with a hand-held mini-homogenizer (Kontes Pellet
Pestle Cordless Motor, Kimble Chase, NJ, USA.) on ice (1:20 w/v) in an ice-cold lysis
buffer containing 50 mM Tris, 150 mM NaCl, 1% Triton X-100, 0.5% sodium
deoxycholate, 0.1% SDS, 1 mM EDTA, 1 μg/mL aprotinin, 1 μg/mL leupeptin, 1 mM
benzamidine, 1 mM sodium orthovanadate, 1 mM sodium fluoride, 5 mM sodium
pyrophosphate, 1 mM DTT, 1 mM phenylmethanesulfonyl fluoride (PMSF), adjusted to
pH 7.4. Muscle homogenates were rotated end over end at 4 °C for 60 min, after which
they were centrifuged for two cycles of 10 min at 15 000 g at 4 °C separated by a similar
re-homogenization step to the initial one. After the second centrifugation the supernatant
was taken as the whole muscle lysates for Western Blotting and enzyme activity assay.
Protein concentration was determined using a commercial colorimetric assay (Bio-Rad
Protein Assay kit II, Bio-Rad Laboratories Pty Ltd, Gladesville, NSW, Australia) and
lysates were then diluted with an equal volume of 2x Laemmli buffer containing 10% -
mercaptoethanol.
Western Blotting. For each protein of interest a linearity study was conducted to determine
the ideal loading amount (data not shown). Muscle lysates were then loaded in equal
amounts (10-25 μg according to target protein) and separated by electrophoresis for 1.5-
2.5 h at 100 V using self-cast SDS-PAGE gels (8-12%). Once resolved, the gels were
then wet transferred onto PVDF membranes at 100 V for 70-90 min. Transfer efficiency
was checked by Coomassie staining the gels together with Ponceau S staining of the
membranes. Once transfer was confirmed, membranes were blocked at room temperature

Training Intensity
85
for 1 h using 5% skim milk in Tris Buffer Saline (TBS) 0.1% Tween-20 (TBS-T). After
3 x 5-min washes in TBS-T, membranes were incubated overnight at 4 °C with gentle
agitation in primary antibody solutions (3-5% BSA or 5% skim milk, plus 0.02% Na
Azide). Immunoblotting was carried out using the following antibodies (with the amount
loaded and the supplier noted in brackets): apoptosis-inducing factor (AIF) (12 µg; Cell
Signaling Tech (CST), 5318), dynamin-related protein 1 (DRP1) (15 µg; CST, 5391),
mitofusin 2 (7.5 µg; CST, 9482), p53 (25 µg; CST, 2527), PGC-1α (20 µg; Calbiochem,
st-1202), PHF20 (17 µg; CST, 3934), synthesis of cytochrome c oxidase (COX) 2 (SCO2)
(20 µg; Santa Cruz, sc-49110), TFAM (15 µg; Abcam, ab47517), and Total OXPHOS
(7.5 µg; MitoSciences, ab110411). The following morning, membranes were washed 3 x
5-min in TBS-T and subsequently incubated under gentle agitation at room temperature
with the appropriate host species-specific secondary antibody for 90 min in 1-5% skim
milk in TBS-T. Membranes were then washed again for 3 x 5-min in TBS-T followed by
a final 5-min wash in TBS before being immersed for 5 min under gentle agitation at
room temperature in a chemiluminescent solution (Solution A: 2.5 mM Luminol, 0.36
mM p-Coumaric Acid, 0.1 M Tris (pH 8.5) in 10 mL MilliQ H2O; Solution B: 6.1 μL
H2O2, 0.1 M Tris (pH 8.5) in 10 mL MilliQ H2O; solution A and B prepared separately
and mixed just prior to use). Protein bands were visualized using a Bio-Rad Versa-Doc
imaging system and band densities were determined using Bio-Rad Quantity One image
analysis software (Bio-Rad Laboratories Pty Ltd, Gladesville, NSW, Australia).
Coomassie Blue staining was performed at the end of the procedure and was used to verify
correct loading and equal transfer between lanes [338]. Finally, samples for both time
points for each participant were loaded on the same gel together with an identical amount
of internal standard (IS). Comparison and statistical analysis between each participant’s
time points were done using the raw density data normalised to the IS loaded in each gel
to reduce gel-to-gel variability. For graphical purposes, each time point was normalised
to baseline; for this reason WB graphs throughout this manuscript are presented as fold
change compared to baseline, and no error bar is presented for the baseline time point. A
representative blot for each protein analysed is presented in Figure 2.2.

Training Intensity
86
Figure 2.2. Representative immunoblots of transcription factors, downstream targets of p53 and subunits
of the five complexes of the electron transport system (ETS), measured in whole muscle lysates prepared
from skeletal muscle biopsy samples (vastus lateralis). Biopsies were obtained at rest before (Pre) and after
(Post) 4 weeks of training at each of the three training intensities: sub-lactate threshold continuous training
(STCT), high-intensity interval training (HIIT) and sprint interval training (SIT).
Citrate Synthase Activity Assay. CS activity was determined in triplicate on a microtiter
plate by adding: 5 µL of a 2 mg/mL muscle homogenate, 40 µL of 3mM acetyl CoA in
Tris buffer and 25 µL of 1mM 5,5’-dithiobis(2-nitrobenzoic acid) (DTNB) in Tris buffer
to 165 µL of 100 mM Tris buffer (pH 8.3) kept at 30°C. At this point 15 µL of 10 mM

Training Intensity
87
oxaloacetic acid were added to the cocktail and the plate was immediately placed in a
spectrophotometer kept at 30°C (xMark Microplate Spectrophotometer, Bio-Rad
Laboratories Pty Ltd, Gladesville, NSW, Australia). Following 30 s of linear agitation,
absorbance at 412 nm was recorded every 15 s for 3 min. CS activity was calculated and
reported as mol kg of protein-1 h-1.
Statistical analysis
All values are reported as means ± SD unless specified otherwise. A one-way ANOVA
was used to assess differences between the three groups for age, body mass, height and
V̇O2Peak, and for total training workload. A one-way RM ANOVA was used to assess
differences between the percent changes in the mitochondrial respiration measurements
of the SUIT protocol within each training group. To investigate the influence of treatment
and time, and the interaction between both of these variables, two-way ANOVA for
repeated measure were used. Significant interactions and main effects were further
analysed using a Tukey’s honestly significant difference post hoc test. Least squares
linear regression analysis was used to calculate correlation coefficients between variables
using Pearson's product moment (r). SigmaStat software (Jandel Scientific, San Rafael,
CA) was used for all statistical analyses. The level of statistical significance was set at P
< 0.05.
2.3 Results
Training and performance measurements.
Participants were matched for age, body mass, height, V̇O2Peak (Table 2.1), and WLT
(Table 2.2) (all P > 0.05). Participants in the SIT group completed a significantly lower
amount of total work (~35%) compared to the HIIT and STCT groups (1.3 ± 0.2, 3.6 ±
0.6 and 3.8 ± 0.7 MJ for the SIT, HIIT and STCT groups respectively, P < 0.001). There
were no changes in body mass following training (data not shown). WLT increased after

Training Intensity
88
training following all 3 training interventions (all P < 0.001), with no difference between
conditions (P = 0.754, Table 2.2). WPeak increased significantly following SIT (P = 0.011)
and HIIT (P < 0.001), and there was a similar trend following STCT although it failed to
reach significance (P = 0.063) (Table 2.2). 20k-TT time improved significantly following
STCT and HIIT (both P < 0.001), but did not change following SIT (P = 0.177) (Table
2.2).
Table 2.2. Participants’ endurance performance and physiological measurements before and after
4 weeks of training
Measurement STCT (n=9) HIIT (n=11) SIT (n=9)
WLT [W] pre
post†
194.9 ± 46.1
208.9 ± 50.0
198.1 ± 27.4
214.7 ± 29.7
204.4 ± 39.7
222.3 ± 45.4
WPeak [W] pre
post†
275.6 ± 54.6
284.4 ± 62.5
264.1 ± 37.4
293.2 ± 34.3*
280.8 ± 48.2
293.3 ± 51.5*
20k-TT time [s] pre
post†
2216.7 ± 183.8
2130.9 ± 176.0*
2247.7 ± 147.5
2138.1 ± 90.7*
2162.3 ± 143.1
2131.9 ± 165.1
CS activity
[mol h-1 kg prot-1]
pre
post
9.3 ± 1.6
9.8 ± 0.8
8.0 ± 2.2
8.6 ± 1.8
9.4 ± 1.8
9.6 ± 1.9
STCT: sub-lactate threshold continuous training; HIIT: high-intensity interval training; SIT:
sprint interval training; WLT: power at the lactate threshold; WPeak: peak power output; 20k-TT:
20-km time trial; CS: citrate synthase. † Significant main effect of time (P < 0.05). *Significantly
different (P < 0.05) vs. pre. All values are mean ± SD
Mass-specific mitochondrial respiration (all values in the text are expressed as pmol O2
s-1 mg-1)
Mass-specific mitochondrial respiration changes are shown in Figure 2.3A. SIT was the
only group increasing maximal coupled (CI+IIP) and noncoupled (CI+IIE) respiration
(interaction, P = 0.008 and 0.028 respectively). CI+IIP increased significantly following
SIT (85.6 ± 12.1 vs. 106.9 ± 19.0, P < 0.001) and did not change following HIIT (68.1 ±
11.6 vs. 65.6 ± 7.7, P = 0.625) or STCT (88.6 ± 19.3 vs. 89.5 ± 15.5, P = 0.873). Similarly,
CI+IIE increased significantly following SIT (107.4 ± 12.0 vs. 139.6 ± 36.7, P = 0.001)

Training Intensity
89
and did not change following HIIT (87.4 ± 16.2 vs. 87.9 ± 15.9, P = 0.966) or STCT
(111.4 ± 24.1 vs. 110.7 ± 21.1, P = 0.935). CIIE was also significantly increased following
SIT (47.0 ± 6.3 vs. 60.9 ± 17.5, P = 0.002) and did not change following HIIT (41.7 ± 7.7
vs. 41.1 ± 4.5, P = 0.860) or STCT (44.2 ± 11.9 vs. 46.9 ± 13.7, P = 0.524; interaction, P
= 0.027). Although it failed to reach statistical significance, the same trend was observed
for CIP (SIT: 59.1 ± 8.0 vs. 70.8 ± 13.8; HIIT: 45.2 ± 8.4 vs. 45.1 ± 6.2; STCT: 63.2 ±
15.3 vs. 60.1 ± 10.6; interaction, P = 0.055) and CIVE (SIT: 132.3 ± 22.3 vs. 160.9 ± 49.2;
HIIT: 124.0 ± 17.9 vs. 125.1 ± 14.0; STCT: 132.6 ± 30.9 vs. 128.3 ± 36.6; interaction, P
= 0.061). CIL did not change (SIT: 8.1 ± 1.5 vs. 10.0 ± 1.8; HIIT: 4.9 ± 2.2 vs. 5.5 ± 1.6;
STCT: 9.0 ± 2.8 vs. 8.3 ± 3.1; interaction, P = 0.271). The data presented in this study
showed no effect of the addition of cytochrome c as a control for outer mitochondrial
membrane integrity. There were no significant differences between the percentage
changes of the six measurements of the SUIT protocol within each training intervention,
or in the FCRs measured (all P > 0.05, Table 2.3).
Mitochondrial-specific respiration (all values in the text below were obtained by
normalising mass-specific mitochondrial respiration by CS activity and are expressed
as: pmol O2 s-1 CS-1)
CS activity did not change significantly following any of the training interventions (8.2 ±
20.6%, 12.4 ± 33.9%, and 2.8 ± 11.7% for STCT, HIIT and SIT respectively, all P > 0.05;
Table 2.2). Mitochondrial (mt)-specific respiration changes are shown in Figure 2.3B.
SIT was once again the only training intervention to significantly increase maximal
coupled (CI+IIP) and noncoupled (CI+IIE) respiration (interaction, P = 0.019 and P =
0.045 respectively). Specifically, CI+IIP/CS increased significantly following SIT (9.4 ±
2.1 vs. 11.3 ± 1.4, P = 0.014) and did not change following HIIT (8.8 ± 1.5 vs. 7.9 ± 1.8,
P = 0.218) or STCT (9.8 ± 2.8 vs. 9.1 ± 1.5, P = 0.375). Similarly CI+IIE/CS increased
significantly following SIT (11.7 ± 2.1 vs. 14.5 ± 2.0, P = 0.013) and did not change
following HIIT (10.7 ± 1.7 vs. 11.0 ± 2.5, P = 0.840) or STCT (12.4 ± 3.8 vs. 11.3 ± 1.8,
P = 0.302). CIIE/CS was also increased significantly following SIT (5.3 ± 0.9 vs. 6.6 ±
0.9, P = 0.004) and did not change following HIIT (5.3 ± 0.8 vs. 4.9 ± 0.9, P = 0.272) or
STCT (4.9 ± 1.7 vs. 4.9 ± 1.3, P = 0.946; interaction, P = 0.013). Despite not reaching

Training Intensity
90
statistical significance, the same trend was observed for CIP/CS (SIT: 6.5 ± 1.5 vs. 7.5 ±
1.3; HIIT: 5.8 ± 1.0 vs. 5.4 ± 1.3; STCT: 7.0 ± 2.2 vs. 6.1 ± 1.0; interaction, P = 0.107)
and CIVE/CS (SIT: 14.4 ± 2.8 vs. 16.7 ± 3.4; HIIT: 16.1 ± 3.1 vs. 15.2 ± 3.9; STCT: 14.6
± 4.3 vs. 13.0 ± 3.2; interaction, P = 0.072). CIL/CS did not change (SIT: 0.9 ± 0.3 vs. 1.1
± 0.3; HIIT: 0.6 ± 0.3 vs. 0.6 ± 0.2; STCT: 1.0 ± 0.4 vs. 0.9 ± 0.3; interaction, P = 0.313).
There were no significant differences between the magnitudes of change of the six
respiratory parameters measured with the SUIT protocol within each training
intervention.

Training Intensity
91
Figure 2.3. Mitochondrial respiration changes compared to baseline. A: percent change of mass-
specific mitochondrial respiration (pmol O2 s-1 mg-1), and B: percent change of mitochondrial-
specific respiration (obtained by normalising mass-specific mitochondrial respiration values by
citrate synthase activity expressed per kg of protein). Respiration was measured in permeabilised
fibres prepared from muscle biopsy samples (vastus lateralis) obtained at rest before and after 4
weeks of training at each of the three training intensities: sub-lactate threshold continuous training
(STCT), high-intensity interval training (HIIT) and sprint interval training (SIT). Respiration
values are: CIL: Leak respiration state (L) in the absence of adenylates and limitation of flux by
electron input through Complex I (CI); CIP: maximal oxidative phosphorylation state (P) with

Training Intensity
92
saturating levels of ADP and limitation of flux by electron input through CI; CI+IIP: P with
saturating levels of ADP and limitation of flux by convergent electron input through CI +
Complex II (CII); CI+IIE: maximal electron transport system (ETS) capacity (E) with saturating
levels of ADP and limitation of flux by convergent electron input through CI+II; CIIE: E with
saturating levels of ADP and limitation of flux by electron input through CII; CIVE: maximal
Complex IV noncoupled respiration with saturating levels of ADP and limitation of flux by
electron input through CIV. * Significantly different (P < 0.05) vs. pre, # vs. post-HIIT, ‡ vs. post-
STCT. All values are mean ± SEM.
Table 2.3. Respiratory flux control ratios
FCR STCT (n=9) HIIT (n=11) SIT (n=9)
LCR (L/E) pre
post
0.08 ± 0.03
0.08 ± 0.03
0.04 ± 0.02
0.07 ± 0.04
0.08 ± 0.02
0.07 ± 0.02
PCR (P/E) pre
post
0.80 ± 0.07
0.81 ± 0.05
0.81 ± 0.07
0.74 ± 0.03
0.80 ± 0.08
0.78 ± 0.08
Inv-RCR (L/P) pre
post
0.10 ± 0.04
0.10 ± 0.04
0.07 ± 0.03
0.09 ± 0.03
0.10 ± 0.02
0.09 ± 0.02
SCR
(Constant P)
pre
post
0.71 ± 0.10
0.67 ± 0.02
0.67 ± 0.05
0.69 ± 0.05
0.69 ± 0.05
0.66 ± 0.04
CIVRES pre
post
0.67 ± 0.08
0.73 ± 0.14
0.55 ± 0.05
0.53 ± 0.09
0.65 ± 0.07
0.69 ± 0.09
FCR: respiratory flux control ratio; STCT: sub-lactate threshold continuous training; HIIT: high-
intensity interval training; SIT: sprint interval training; L: leak respiration; P: oxidative
phosphorylation capacity; E: electron transport system capacity; LCR: leak control ratio
(CIL/CI+IIE); PCR: phosphorylation control ratio (CI+IIP/CI+IIE); inv-RCR: inverse of respiratory
control ratio (CIL/CI+IIP); SCR: substrate control ratio at constant P (CIP/CI+IIP); CIVRES: CIV
reserve capacity (CI+IIP/CIVE). CI: electron input through complex I; CI+II: convergent electron
input through complex I and II; CIV: electron input through complex IV. FCR were calculated
from mass-specific respiration measurements in permeabilised muscle fibres (vastus lateralis),
obtained from muscle biopsies taken before and after 4 weeks of training at each of the three
training intensities. All values are mean ± SD.
Protein content of transcription factors
PGC-1α protein content increased by 61 ± 58% following SIT (P = 0.011), but did not
change significantly following either STCT (P = 0.143) or HIIT (P = 0.137) (Figure

Training Intensity
93
2.4A). The protein content of p53 increased by 93 ± 77% following SIT (P = 0.004), but
did not change significantly following STCT (P = 0.554) or HIIT (P = 0.204) (Figure
2.4B). PHF20 protein content increased by 84 ± 76% following SIT (P = 0.003), but did
not change significantly following STCT (P = 0.175) or HIIT (P = 0.856) (Figure 2.4C).
The protein content of TFAM did not change after training (main effect of time, P =
0.364, Figure 2.4D).
Figure 2.4. Fold change compared to baseline of the protein content of peroxisome proliferator-
activated receptor γ coactivator-1α (PGC-1α), (A), p53 (B), plant homeodomain finger-containing
protein 20 (PHF20) (C), and mitochondrial transcription factor A (TFAM) D) in whole muscle
lysates prepared from skeletal muscle biopsy samples (vastus lateralis). Biopsies were obtained
at rest at baseline (dotted line) and after 4 weeks of training at each of the three training intensities:
sub-lactate threshold continuous training (STCT), high-intensity interval training (HIIT) and
sprint interval training (SIT). † Significant main effect of time (P < 0.05). *Significantly different
(P < 0.05) vs. pre, # vs. post-HIIT. All values are mean ± SEM.
0.0
0.5
1.0
1.5
2.0
2.5
PG
C-1
pro
tein
co
nte
nt
(fo
ld c
han
ge
re
lati
ve t
o p
re-t
rain
ing
)
*
STCT
HIIT
SIT
†
A B
C D
0.0
0.5
1.0
1.5
2.0
2.5
PH
F20 p
rote
in c
on
ten
t(f
old
ch
an
ge
re
lati
ve t
o p
re-t
rain
ing
)
#
#
*STCT
HIIT
SIT
†
0.0
0.5
1.0
1.5
2.0
2.5
p53 p
rote
in c
on
ten
t(f
old
ch
an
ge
re
lati
ve t
o p
re-t
rain
ing
)
*STCT
HIIT
SIT
†
0.0
0.5
1.0
1.5
2.0
2.5
TF
AM
pro
tein
co
nte
nt
(fo
ld c
han
ge
re
lati
ve t
o p
re-t
rain
ing
) STCT
HIIT
SIT

Training Intensity
94
Protein content of subunits from the five ETS complexes
The protein content of subunits from the five ETS complexes did not change significantly
following training (all P > 0.05, Figure 2.5).
Figure 2.5. Fold change compared to baseline of the protein content of subunits from the five
complexes of the electron transport system (ETS), complex I to V (CI to CV), in whole muscle
lysates prepared from skeletal muscle biopsy samples (vastus lateralis). Biopsies were obtained
at rest at baseline (dotted line) and after 4 weeks of training at each of the three training intensities:
sub-lactate threshold continuous training (STCT), high-intensity interval training (HIIT) and
sprint interval training (SIT). All values are mean ± SEM.

Training Intensity
95
Protein content of mitofusin 2, DRP1, SCO2 and AIF
The protein content of mitofusin 2 increased after training with no significant difference
between groups (main effect of time, P = 0.047, Figure 2.6A). The protein content of
DRP1 showed a trend to increase following training with no difference between groups
(main effect of time, P = 0.063, Figure 2.6B). The protein content of SCO2 and AIF did
not change with training (both P >0.05, Figure 2.6C and 6D respectively).
Figure 2.6. Fold change compared to baseline of the protein content of: Mitofusin 2 (A), dynamin
related protein 1 (DRP1) (B), synthesis of cytochrome c oxidase (COX) 2 (SCO2) (C) and
apoptosis inducing factor (AIF) (D) in whole muscle lysates prepared from skeletal muscle biopsy
samples (vastus lateralis). Biopsies were obtained at rest at baseline (dotted line) and after 4 weeks
of training at each of the three training intensities: sub-lactate threshold continuous training
(STCT), high-intensity interval training (HIIT) and sprint interval training (SIT). † Significant
main effect of time (P < 0.05); a P value next to a legend indicates a trend for a main effect of
time. All values are mean ± SEM.
0.0
0.5
1.0
1.5
2.0
2.5
Mit
ofu
sin
2 p
rote
in c
on
ten
t(f
old
ch
an
ge
re
lati
ve t
o p
re-t
rain
ing
)
STCT
HIIT
SIT
†
0.0
0.5
1.0
1.5
2.0
2.5
SC
O2 p
rote
in c
on
ten
t(f
old
ch
an
ge
re
lati
ve t
o p
re-t
rain
ing
) STCT
HIIT
SIT
0.0
0.5
1.0
1.5
2.0
2.5
DR
P1 p
rote
in c
on
ten
t(f
old
ch
an
ge
re
lati
ve t
o p
re-t
rain
ing
)
STCT
P = 0.063 HIIT
SIT
0.0
0.5
1.0
1.5
2.0
2.5
AIF
pro
tein
co
nte
nt
(fo
ld c
han
ge
re
lati
ve t
o p
re-t
rain
ing
)
STCT
HIIT
SIT
A B
C D

Training Intensity
96
Correlation between mass-specific mitochondrial respiration and performance
measurements
There was a significant linear correlation between CI+IIP and 20k-TT performance before
training (r = -0.65, P < 0.001, Figure 2.7A). No correlation was found between changes
in CI+IIP and 20k-TT performance with training (r = 0.21, P = 0.279), and the initial
correlation was no longer significant after training (r = -0.26, P = 0.188, Figure 2.7B).
Similarly CI+CIIP was significantly correlated with WLT and WPeak before training (r =
0.60 and r = 0.67 respectively, both P < 0.001), but there was no correlation after training
(r = 0.27 and r = 0.16 respectively, both P > 0.05).

Training Intensity
97
Figure 2.7. Correlation between 20-km cycling time trial (20k-TT) time and maximal ADP-
stimulated mass-specific mitochondrial respiration (CI+IIP), (A) before and (B) after training.
Data include participants from all three groups
1800 2000 2200 2400 260030
60
90
120
150
20km-TT [s]
CI+
CII
P [p
mo
l O
2 m
in-1
mg
-1] r = -0.65; P < 0.001
1800 2000 2200 2400 260030
60
90
120
150
20km-TT [s]
CI+
CII
P [p
mo
l O
2 m
in-1
mg
-1] r = -0.26; P = 0.188
A
B

Training Intensity
98
2.4 Discussion
The present study shows that four weeks of SIT increased mitochondrial respiration,
whilst the same training duration at lower exercise intensities (STCT, HIIT) resulted in
no change despite much higher training volumes. None of the interventions increased CS
activity. In addition, this is the first study to show that four weeks of SIT increased the
protein content of p53; this, along with changes in PGC-1 protein content may help to
explain the intensity-dependent changes in mitochondrial respiration. Furthermore, these
findings indicate that the protein content of PHF20, a transcription factor upstream of
p53, was increased following SIT, providing further mechanistic insights into the cellular
events that may mediate the adaptive response to exercise training. Finally, despite being
the only training intensity to improve mitochondrial respiration, SIT was the only type of
training that did not improve endurance performance.
Mass-specific mitochondrial respiration
A novel aspect of this research was to directly compare whether gains in mitochondrial
respiration were related to exercise intensity. The results provided indicate that CI+IIP
increased by 25% following four weeks of SIT, whereas neither HIIT nor STCT were
associated with an increase in mass-specific respiration. These findings highlight the role
of training intensity as a key determinant of changes in mitochondrial respiration.
Although caution is required due to various methodological differences and populations
examined between studies, it is relevant to compare the present results with previous
literature using only one type of training intensity, and that assessed mitochondrial
respiration in permeabilised fibres. The training intensities reported below were re-
calculated based on unpublished data from this laboratory suggesting that the continuous
incremental tests used in those studies yields a value for WPeak that is ~15% higher
compared to that obtained with GXT protocol used in the present research. In the studies
of Daussin et al. (2008) and Jacobs et al. (2013) interval training at intensities of ~105-
115% of WPeak led to increases in mass-specific respiration of 11-40%, which is in line
with the 25% increase reported after SIT. The lower training intensities associated with
the HIIT and STCT groups in the present study (89 and 66% of WPeak respectively), did

Training Intensity
99
not improve mass-specific mitochondrial respiration, which agrees with results for the
CT group (71% of WPeak) from Daussin et al. (2008).
Daussin et al. (2008) concluded that workload and oxygen uptake fluctuations, rather than
training volume or intensity, were the key determinants of exercise-induced
improvements in oxidative capacity. However, the present study provides evidence that,
despite workload and oxygen uptake fluctuations being a hallmark of both SIT and HIIT
protocols, only SIT, which elicits a much higher training intensity, increased mass-
specific mitochondrial respiration in the present study. This further strengthens the notion
that training intensity is likely the key factor behind exercise-induced improvements in
mitochondrial respiration. The present findings agree with those of Daussin et al. (2008)
and confirm that training volume is not a key factor in determining changes in
mitochondrial respiration. Neither STCT nor HIIT improved mass-specific mitochondrial
respiration, despite a training volume almost three-fold larger than that of the SIT group.
While further research is required, possible explanations for the present results relate to
differences in fibre recruitment, the activation of oxidative phosphorylation, and increases
in common stressors associated with training intensity. For example, studies monitoring
glycogen depletion revealed that the number (and type) of fibres activated during an
exercise bout increases in response to increased exercise intensity [327]. In addition,
studies measuring oxidative enzymes indicate that type II fibres, which are only
maximally recruited at greater training intensities, present similar metabolic adaptability
to high oxidative demand as type I fibres [49, 131]. It has been shown that SIT elicits full
activation and greater reliance on oxidative phosphorylation within each bout and with
each subsequent bout [219]. Therefore, it is possible that the higher training intensity
associated with the SIT protocol in the current study, led to improved mitochondrial
respiration by maximally stressing the oxidative phosphorylation system and by
recruiting a wider fibre pool when compared to HIIT and STCT. However, the lack of
change in mitochondrial respiration at the lower intensities may depend on the nature of
a muscle biopsy. Due the mosaic pattern of human muscle fibres, it is entirely possible
that during the biopsy a smaller portion of the muscle fibres obtained may have been
recruited at the lower training intensities. This would give the impression that the lower
exercise intensity had no effect on mitochondrial parameters, when in fact, if one

Training Intensity
100
measured the recruited fibres only, the outcome would likely show a positive adaptation.
This would dilute the magnitude of the effect observed, and it is the result of the limitation
that a mixed biopsy may not reveal the maximal adaptation that has taken place in
regularly recruited fibres. Finally, an intensity-dependent increase in common stressors
associated with exercise (e.g., the AMP:ATP ratio, calcium release, the redox state, and
reactive oxygen species (ROS) production) may affect upstream signalling and modulate
the response to different training intensities. Future research investigating changes in
single fibres, and upstream signalling is warranted.
Mitochondrial qualitative and quantitative changes
To separate qualitative and quantitative changes, mt-specific respiration was determined
by normalising mass-specific respiration values to CS activity, a biomarker of
mitochondrial content [145]. Results from the present study showed that CS activity was
not altered by any of the three training interventions. Although many studies have
reported increased CS activity following training at various intensities, the literature also
provides evidence of unaltered or even decreased CS activity following training [323].
The reasons for these discrepancies are not readily apparent, but may relate to
methodological differences in the CS activity assay and the sample preparation employed
[323], or could be related to the fitness level of the participants and differences in study
design.
As can be seen in Figure 2.3B, changes in mt-specific respiration mirror those for mass-
specific respiration. This indicates that SIT resulted in an increased mitochondrial
respiration relative to mitochondrial content. Whilst cross-sectional research has reported
that differences in the maximal aerobic capacity of individuals of various fitness levels
are accompanied by modifications in mt-specific respiration [128], the present study is
the first to show that these modifications can be achieved in as little as 4 weeks of SIT in
active individuals. In addition, the lack of change in the protein content of subunits from
the five ETS complexes (similar to CS activity), provides further confirmation that
changes in mitochondrial function can take place before, or independent of, changes in
mitochondrial content. This is perhaps not surprising, as the protein content of subunits
from the ETS complexes has been shown to poorly correlate to mitochondrial respiration

Training Intensity
101
and is not considered a valid biomarker of OXPHOS capacity [145]. The present research
demonstrate that mitochondrial respiration changes following SIT were independent of
changes in mitochondrial content, and highlight the dissociation between mitochondrial
respiration and content, as previously demonstrated in mice [252]. While further research
is required, it is possible that the lack of change in mitochondrial content may be the result
of matched changes in protein synthesis and degradation, whereas replacement of
damaged proteins with newly synthesised ones may be responsible for the increase in
mitochondrial function [173].
To further analyse the origin of these qualitative changes, FCRs were calculated. These
ratios provide an internal normalization expressing respiratory control independent of a
marker of mitochondrial content, and minimize experimental errors given they are
determined from measurements collected within the same experiment [225]. The present
findings indicate that FCRs did not change post-training. Specifically, there was no
change in the index of uncoupling (LCR), in the limitation of OXPHOS capacity by the
phosphorylation system (PCR), and in the degree of coupling between oxidation and
phosphorylation (inv-RCR). This is similar to the findings of Jacobs et al. (2013). On the
contrary, Daussin et al. (2008) showed improved coupling between oxidation and
phosphorylation (as measured by RCR) following IT; however, this may be due to the
use of sedentary individuals, for whom training adaptations are easier to obtain [146,
162]. The current results also show that improvements in mass-specific respiration
following SIT were not driven by changes in substrate control, as evidenced by the lack
of change in the CIP/CI+IIP (SCR), the CIIE/CI+IIE (P > 0.05, data not shown), and the
CIVRES ratio. Moreover, no significant difference between mass-specific respiration
changes at the different substrate control states within each training group was found.
Therefore, the present findings suggest that increased oxidative capacity following SIT
was mediated by an improvement in mitochondrial respiration relative to mitochondrial
content, without changes in the coupling and substrate control of the respiratory system.
Although evidence of improved mitochondrial respiration following only 4 weeks of SIT
was provided, it was not possible to identify the adaptations responsible for these changes.
While further research investigating the possible underlying mechanisms is required, this
could be the result of metabolite changes within the organelle, alterations in protein
import of selective ETS subunits, and/or assembly of the ETS complexes.

Training Intensity
102
Cellular mechanism of mitochondrial adaptations
To provide a mechanistic insight into the cellular events modulating the adaptive response
to exercise training, the protein content of key regulators of mitochondrial biogenesis was
measured. PGC-1 protein content was significantly increased only following SIT, in
agreement with previous research reporting increased PGC-1 protein content in whole
muscle fractions of male participants following 3 weeks of SIT [270]. Although separate
studies have shown that PGC-1 protein content can be increased following SIT, HIIT or
continuous training [35, 224, 270], the present study is the first to directly compare the
effects of different training intensities and to report a training-intensity dependent
regulation of PGC-1 protein. It has previously been suggested that PGC-1 mRNA is
regulated in an intensity-dependent manner following a single bout of exercise [73], but
that this intensity-dependent regulation is limited to exercise intensities below peak power
[72]. However, findings from the present study indicate that the intensity-dependent
regulation of PGC-1 protein content extends to intensities above peak power. The
importance of training intensity is strengthened further when considering that despite the
much greater training volumes of the STCT and HIIT protocols, these interventions were
not associated with an increase in PGC-1 content.
A novel finding of the present study was that increased PGC-1 content was associated
with an increase in mitochondrial function, but not mitochondrial content. PGC-1 has
been reported to mediate the downregulation of glycogenolytic and glycolytic enzymes
following exercise in rats [140]. In addition, PGC-1 has been shown to coordinate the
upregulation of autophagy and mitophagy following exercise in mice [320], with studies
in humans demonstrating that autophagy constitutes an important physiological response
to exercise [198]. Metabolic regulation and modulation of mitochondrial turnover are
therefore two potential mechanisms by which increased PGC-1 content may enhance
mitochondrial function independent of changes in mitochondrial content.
The tumour suppressor p53 has also been reported to be an important regulator of
mitochondrial biogenesis [266]. In the present study, only SIT increased p53 protein
content, indicating a possible intensity-dependent regulation similar to that of PGC-1.
These findings are in agreement with previous research showing that a single bout of

Training Intensity
103
high-intensity interval exercise activates p53 protein via phosphorylation in humans [18],
and that a single bout of maximally-activated eccentric contractions increase p53 protein
content in rats [45]. The increase in p53 protein content, coupled with greater
mitochondrial respiration following SIT, is consistent with the role of p53 as a metabolic
regulator [329], and its ability to modulate the balance of energy provision favouring a
switch from glycolytic to oxidative pathways [181]. The latter study revealed that in
mouse liver mitochondria this modulation is mediated downstream of p53 by SCO2, a
protein involved in the assembly of the mtDNA-encoded COX II subunit into the COX
complex. However, subsequent research failed to provide evidence of p53 control on
SCO2 in both mouse [217] and human [19] skeletal muscle. In line with these findings,
results from the present study indicate that the protein content of SCO2 does not change
following exercise training and adds to literature suggesting that p53 regulates
mitochondrial function in human skeletal muscle via modulation of proteins other than
SCO2 [217]. Another point of p53 control on mitochondrial function is through
transcriptional regulation of AIF [298], a protein assisting in the assembly and
stabilization of complex I [319]. The present results indicate that AIF protein content did
not change following training, consistent with previous research showing AIF protein
content to be unaffected following 14 weeks of continuous endurance training in humans
with mtDNA defects [4]. It is possible that the subcellular localization of AIF, whose
principal role is the induction of apoptosis, may be a more important factor in the
assessment of training-induced adaptations.
p53 has also been linked with mitochondrial dynamics [266], a series of processes
regulating mitochondrial morphology by maintaining a tight balance between fusion and
fission rates, which is crucial for a healthy mitochondrial pool [341]. Studies in cells have
shown that p53 can up-regulate transcription of both the fusion protein mitofusin 2 [335],
and the fission protein DRP1 [154]. In a study conducted with humans, seven sessions of
HIIT were reported to increase DRP1 but not mitofusin 2 content [224]. In the present
study, mitofusin 2 content was increased after training, with DRP1 showing a similar
trend (P = 0.063), but there were no differences between groups for either protein. An
additional novel finding was that although SIT was associated with a greater increase in
p53 content, this was not the case for mitofusin 2 or DRP1.

Training Intensity
104
TFAM is a nuclear-encoded gene that controls mtDNA transcription and maintenance
[272]. p53 can interact with TFAM directly or indirectly, and through modulation of its
expression can regulate the mitochondrial transcription machinery [217, 267]. The
present results indicate that TFAM protein content was unchanged following training;
this is consistent with previous findings [224], although increased TFAM protein content
has also been reported [21, 161]. The present findings seem consistent with the
hypotheses that activation of existing TFAM may promote mitochondrial adaptations
[224], and that it is the interaction of p53 with TFAM and mtDNA inside the mitochondria
that positively drives mtDNA transcription [267], rather than the protein content of
TFAM itself.
PHF20 is a novel transcription factor that binds directly to the p53 promoter and
transcriptionally up-regulates [218] and stabilises [65] p53. The present study indicates
that, similar to p53 and mass-specific respiration, PHF20 protein content was increased
only following SIT. Together, these findings seem to indicate that four weeks of SIT may
induce improved mitochondrial function via a mechanism involving the co-ordinated up-
regulation of the PHF20-p53 pathway. Future research investigating these hypotheses and
confirming the association of the PHF20-p53 pathway to training-induced changes in
mitochondrial respiration is warranted.
In conclusion, changes in the protein content of PGC-1, p53, and PHF20 mirrored those
in mitochondrial respiration, and seem to be mediated by training intensity. Nonetheless,
despite an increase in PGC-1, p53 and PHF20 protein content, no significant change in
markers of mitochondrial content was observed. Therefore, these results indicate that
changes in the content of these transcription factors may be more strongly associated with
changes in mitochondrial respiration rather than content. Moreover, the metabolic
adaptations (e.g., glycogen sparing, reduced lactic acid accumulation, increased fatty acid
oxidation) that follow exercise training in humans [92, 226], have also been shown to
precede increases in mitochondrial content. These findings therefore suggest that these
transcription factors may regulate mitochondrial function and content following different
pathways or kinetics.

Training Intensity
105
Mitochondrial respiration and endurance performance
Factors such as V̇O2Peak, WLT, and exercise efficiency, have all been demonstrated to be
good predictors of endurance performance [20]. Central to these factors, mitochondrial
respiration has been reported to be the strongest determinant of time-trial performance in
highly-trained athletes [129]. Consistent with these findings, the present results reveal a
significant linear correlation between pre-training CI+IIP and 20k-TT performance across
the twenty-nine participants completing this study. However, despite being the only
protocol increasing mitochondrial respiration, SIT did not improve 20k-TT performance
following training. This discrepancy between changes in mitochondrial respiration and
endurance performance is further supported by the lack of correlation between changes
in CI+IIP and 20k-TT time, and the subsequent loss of correlation between the same two
parameters post-training. This indicates that mitochondrial respiration was not the key
mediator of training-induced changes in endurance performance for the active population
in this study, which is in line with the concept that muscle oxidative capacity far exceeds
maximal oxygen delivery in humans [28].
Conclusions
The present study demonstrates that training intensity is a key factor determining
exercise-induced changes in mitochondrial respiration. Evidence was provided that as
little as four weeks of SIT were sufficient to induce improvements in mitochondrial
quality, such as an increased mt-specific respiration, a finding that could have
implications in the treatment of diseases associated with compromised mitochondrial
function. Furthermore, a dissociation between changes in mitochondrial content and
respiration was shown, suggesting that these changes may be mediated by different
molecular mechanisms. From a cellular mechanism standpoint, these results highlight the
potential role of PHF20 in the regulation of mitochondrial respiration in humans via a
mechanism involving the co-ordinated upregulation of the PHF20/p53 pathway. The
present research indicates that PHF20, p53, and PGC-1 are transcription factors that
may be involved in the exercise-induced regulation of mitochondrial respiration, as they
are all upregulated after SIT, but not STCT or HIIT. Finally, the present findings confirm
that mitochondrial respiration is a good determinant of baseline endurance performance.

Training Intensity
106
However, a discordance between changes in these two parameters was observed,
suggesting that mitochondria respiration is not the key mediator of training-induced
changes in endurance performance in active individuals.

107
Chapter 3
Effects of training volume on markers
of mitochondrial biogenesis
The main findings from Chapter 2 were that training intensity is a key factor regulating
training-induced changes in mass-specific mitochondrial respiration, but not mitochondrial
content, and that four weeks of SIT were sufficient to induce improvements in mt-specific
respiration (an indicator of mitochondrial quality). In parallel, it was observed that changes
in the protein content of key transcription factors, such as PGC-1, p53, and PHF20, were
more strongly associated with changes in mass-specific mitochondrial respiration than
mitochondrial content. These findings highlight the apparent dissociation between changes
in mitochondrial content and mitochondrial respiration, and indicate that these changes may
not be mediated by the same molecular mechanisms.
The purpose of this second study was to investigate the role of training volume. The effects
of four weeks of normal training volume (NT), followed by three weeks of a very large
training volume (INT) and two weeks of reduced training volume (RT), on mitochondrial
content, mitochondrial respiration, and the protein content of valid biomarkers of
mitochondrial biogenesis, were investigated.
The manuscript for this study is ready for submission:
Granata C, Oliveira RSF, Little JP, Renner K and Bishop DJ (2015). Training-induced
mitochondrial adaptations to intensive training are rapidly reversed following a reduction in
training volume in human skeletal muscle. FASEB Journal (ready for submission).

Training Volume
108

Training Volume
109
3.1 Introduction
Skeletal muscle is a remarkably plastic tissue, rapidly responding to different
physiological stimuli. As a consequence of this plasticity, the repeated physiological
alterations associated with exercise training lead to a host of adaptations, such as greater
mitochondrial function and content [26]. However, studies in mouse [252] and findings
in human skeletal muscle described in Chapter 2, have also observed an apparent
dissociation between training-induced changes in mitochondrial content and function,
highlighting the importance of measuring and differentiating these two parameters [128].
Mitochondrial adaptations have repeatedly been associated with improvements in both
health [31, 190, 333] and endurance performance [128], whereas mitochondrial
dysfunction has been linked with a wide range of metabolic and neurodegenerative
diseases [168, 333]. Collectively, these findings highlight the importance of better
understanding how mitochondria adapt to the physiological stress of exercise training.
Recently, there has been increased emphasis on the use of high-intensity exercise training
to promote mitochondrial adaptations [35, 81]. However, excessive high-intensity
training, without adequate recovery, can lead to maladaptation and overtraining syndrome
(OTS) [149]. The symptoms of OTS have many similarities with those of chronic fatigue
syndrome, which has been associated with reduced muscle oxidative capacity [182] and
mitochondrial dysfunction [205]. Studies in overtrained rats have also shown reduced
citrate synthase (CS) activity, a valid biomarker of mitochondrial content [145], in the red
gastrocnemius [78], and decreased mitochondrial respiration in the myocardium [138].
However, despite the above findings in rats, no study has investigated the effects of the
physiological stress associated with a large volume of high-intensity training without
adequate recovery on both mitochondrial respiration and content in humans.
If excessive training does result in mitochondrial maladaptation, it is important to know
if this is just a transient effect. Studies indicate that, if training intensity is maintained or
increased, a reduction in training volume following intense training is accompanied by a
series of positive physiological adaptations [202]. For example, the CS activity of highly-
trained athletes increased by ~18% after one week of reduced-volume, increased-intensity
training [288]. Conversely, following one week of complete detraining CS activity was

Training Volume
110
reduced by ~13% [288], and mitochondrial respiration measured in muscle homogenates
of elite swimmers decreased by 50% [62]. While these findings highlight the rapid and
specific adaptability of skeletal muscle to different training stimuli, no study has directly
compared the effects of a period of reduced training volume on both mitochondrial
respiration in permeabilised muscle fibres and markers of mitochondrial content in
parallel.
The underlying molecular mechanisms by which changes in the level of physical activity
mediate mitochondrial adaptations are only beginning to be understood. A key player in
this process, peroxisome proliferator-activated receptor coactivator-1 (PGC-1), is a
transcriptional coactivator regulating both mitochondrial content and respiration in
muscle cells [352]. PGC-1 mediates mitochondrial biogenesis by coactivation of,
amongst others, nuclear respiratory factor 1 (NRF1), which in turns activates
mitochondrial transcription factor A (TFAM), providing a link between nuclear and
mitochondrial gene expression [352, 325]. In humans, PGC-1 is sensitive to exercise
training, as indicated by the increase in PGC-1 protein content following seven sessions
of exercise training [224]. Similar to PGC-1, the tumour suppressor p53 is another key
transcription factor that modulates mitochondrial biogenesis [266], and can regulate the
mitochondrial transcriptional machinery via interaction with TFAM [217, 267]. Greater
p53 protein content following a 4-week training intervention, as described in Chapter 2
demonstrates that p53 is also sensitive to exercise training in humans. p53 can be
upregulated [218] and stabilised [65] by plant homeodomain finger-containing protein 20
(PHF20), a transcription factor that is also sensitive to exercise training, as observed in
Chapter 2. However, despite the above evidence, no study has investigated how altering
the training-induced physiological stress, via manipulation of training volume, affects the
protein content of these transcription factors, and their possible association with changes
in mitochondrial respiration and content.
Therefore, the aim of this research was to investigate the effects of intensified (INT),
followed by reduced (RT) training volume, on mitochondrial adaptations. It was
hypothesised that markers of mitochondrial content, mitochondrial respiration, and the
content of key proteins involved in the regulation of mitochondrial biogenesis, would be
reduced following INT, alongside a decrease in endurance performance, and for these

Training Volume
111
changes to be reversed following RT. It was also expected that changes in the protein
content of these transcription factors would be associated with changes in both
mitochondrial respiration and content.
3.2 Methods
Participants and ethics approval
Ten healthy men (20 ± 2 y; 179.7 ± 11.3 cm; 80.6 ± 14.5 kg), who were non-smokers and
involved in various individual and team sports, volunteered to take part in this study.
Their baseline peak oxygen uptake (V̇O2Peak) was 45.1 ± 7.6 mL min-1 kg-1 (Table 3.1).
Participants were informed of the study requirements, benefits and risks involved before
giving written informed consent. Approval for the study’s procedures, which conformed
to the standards set by the latest revision of the Declaration of Helsinki, was granted by
the Victoria University Human Research Ethics Committee.
Table 3.1. Participants’ physiological and endurance performance measurements before and after
each training phase
Measurement Pre-NT Post-NT Post-INT Post-RT
V̇O2Peak
[mL min-1 kg-1] 45.1 ± 7.6 46.9 ± 7.6 52.2 ± 7.7*# 48.9 ± 8.0*†
WLT [W] 199.9 ± 28.1 216.5 ± 30.5* 233.5 ± 34.9*# 228.0 ± 33.3*
WPeak [W] 265.8 ± 39.0 294.0 ± 36.1* 313.7 ± 40.2*# 302.6 ± 41.7*
20k-TT time [s] 2235.2 ± 149.2 2136.0 ± 95.4* 2033.2 ± 84.1*# 2047.2 ± 98.8*#
NT: normal training; INT: intensive training; RT: reduced training; V̇O2Peak: peak oxygen uptake; WLT:
power at the lactate threshold; WPeak: peak power output; 20k-TT: 20-km time trial. * Significantly
different (P < 0.05) vs. pre-NT, # vs. post-NT, † vs. post-INT. n=10. All values are mean ± SD.

Training Volume
112
Study design
The experimental protocol began with familiarization and baseline testing, followed by
three consecutive training phases, the normal training (NT), INT and RT phase, lasting 4,
3 and 2 weeks respectively. Each training phase was preceded (and followed) by a testing
period to monitor changes in physiological and performance parameters. During each
testing phase participants performed a 20-km cycling time trial (20k-TT), a graded
exercise test (GXT), and had a resting muscle biopsy. A series of 10-km cycling time trial
(10k-TT) were performed during the INT phase to monitor the participants’ state of
fatigue. The study duration was approximately 13 weeks.
Testing procedures
Participants were required to refrain from any strenuous physical activity for the 48 h
preceding each performance test (72 h for the biopsy trial), from alcohol and any exercise
for 24 h before testing, and from food and caffeine consumption for the 2 h preceding
each test. Each type of test was performed at the same time of the day during the course
of the entire study with the aim to avoid variations caused by circadian rhythm changes.
20k-TT and 10k-TT. Cycling time trials were used as an indicator of endurance
performance (20k-TT) or to monitor the state of fatigue during INT (10k-TT), and were
performed on an electronically-braked cycle ergometer (Velotron, RacerMate, Seattle,
WA, USA). Prior to each time trial participants completed a warm-up involving cycling
for 4 min at 66% of the power attained at the lactate threshold (WLT) followed by 2 min
at WLT and then 2 min of rest. During the time trial participants were only allowed access
to cadence and completed distance, and were provided with similar verbal encouragement
during each test. Heart rate monitors (Polar Electro, Kempele, Finland) were used in all
exercise trials and training sessions to monitor heart rate.
GXT. A discontinuous graded exercise test was performed on an electronically-braked
cycle ergometer (Lode Excalibur, v2.0, Groningen, The Netherlands) to determine
V̇O2Peak, peak power output (WPeak), WLT (using the modified DMax method [25]), and the
training intensities for the three training phases. The test consisted of 4-min stages at a
constant power output, interspersed with 30 s of rest. The test began at a power output of

Training Volume
113
60, 90 or 120 W, depending on a participant’s fitness level, and was subsequently
increased by 30 W every 4 min. Prior to the test, and during the 30-s rest, capillary blood
samples were taken from the fingertip for measurement of blood lactate concentration
([La-]). Participants were instructed to keep a cadence > 60 rpm and were given verbal
encouragement throughout the test, during which they were only allowed access to
cadence and elapsed time. The test was stopped when a participant reached volitional
exhaustion or cadence dropped below 60 rpm. The WPeak was determined as the power of
the last completed stage when participants stopped at the end of a stage. If a participant
stopped during a stage, WPeak was determined as the power of the last completed stage
plus 7.5 W for every completed minute.
Gas Analysis during the GXT: During the GXT, expired air was continuously analysed
for O2 and CO2 concentrations via a gas analyser (Moxus modular oxygen uptake system,
2010, AEI technologies, Pittsburgh, PA, USA). The gas analysers were calibrated
immediately before each test using known gas mixtures (A: 21% O2, 0% CO2; B: 16%
O2, 4% CO2; BOC, Melbourne, AUS). The ventilometer was calibrated using a 3-liter
syringe (Hans Rudolph). V̇O2 values were recorded every 15 s and the two highest
consecutive 15-s values recorded during the test were averaged and recorded as the
participant’s V̇O2Peak.
Capillary blood sampling. Glass capillary tubes (MultiCap 140 μL, Siemens Healthcare
Diagnostics Inc. Deerfield, IL, USA) were used to collect about 50 μL of blood at the
various time points during the GXT. Capillary blood [La-] was determined using a blood-
lactate analyser (YSI 2300 STAT Plus Glucose & Lactate Analyser, YSI Inc., Yellow
Spring, Ohio, USA). The blood-lactate analyser was regularly calibrated using precision
standards and routinely assessed by external quality controls.
Muscle biopsies
All muscle samples were obtained in the morning, at a constant depth of around 2-3 cm,
by an experienced practitioner. Resting muscle biopsies (approximately 150-300 mg wet
weight) were taken from the vastus lateralis muscle using a biopsy needle with suction at
the following four time points: pre-NT, post-NT, post-INT and post-RT. Participants

Training Volume
114
rested in the supine position, and after injection of a local anaesthetic into the skin and
fascia (1% xylocaine, Astra Zeneca) a small incision was made. The opposite leg was
chosen for each biopsy. Once obtained, muscle samples were processed, cleaned of excess
blood, fat and connective tissue and split in two portions. One portion (10-20 mg) was
immediately immersed in a 5-mL tube containing ~3 mL of biopsy preserving solution
(BIOPS) kept on ice, and then used for in-situ measurements of mitochondrial respiration.
The remaining portion was immediately frozen in liquid N2 and stored at -80°C for
subsequent analyses.
Training intervention
All training sessions were performed on an electronically-braked cycle ergometer
(Velotron, RacerMate, Seattle, WA, USA), and were preceded by an 8-min warm up (see
20k-TT). Participants performed high-intensity interval training (HIIT), with a work-to-
rest ratio of 2:1, at a training intensity set between WLT and WPeak (i.e., within the same
training zone) throughout the entire study. This allowed for training volume to be the only
parameter manipulated between the three training phases. Training intensity was set
relative to WLT, rather than WPeak, as metabolic and cardiac stresses are similar when
individuals of differing fitness levels exercise at a percent of the WLT, but can vary
significantly when training at a percent of WPeak [15].
NT phase. Participants performed HIIT three times a week for four weeks. Training
sessions consisted of four to seven 4-min cycling intervals interspersed with a 2-min
recovery period at a power of 60 W. The training intensities were defined as [WLT + x
(WPeak-WLT)] (with x equivalent to 0.35, 0.50, 0.65 and 0.75 for week one to four
respectively). This initial phase was conducted with the aim of conditioning the
participants to the rigours of the INT phase.
INT phase. Participants performed HIIT twice a day (morning and afternoon) for 20
consecutive days. Training sessions consisted of either five to twelve repetitions of the 4-
min cycling set with working intensities ranging from [WLT + 0.3 (WPeak-WLT)] to [WLT
+ 0.8 (WPeak-WLT)], or eight to twenty-two 2-min cycling intervals interspersed with a 1-
min recovery period at a power of 60 W, with working intensities ranging from [WLT +

Training Volume
115
0.5 (WPeak-WLT)] to [WLT + 0.8 (WPeak-WLT)]. Single session duration throughout this
phase increased from 30-35 min to 70-80 min. A 10k-TT was performed prior to, and at
regular weekly intervals during this phase (for a total of four 10k-TT tests), to monitor
the participants’ state of fatigue. An INT-termination criterion, not disclosed to
participants, was set so that if a participant’s performance on two consecutive 10k-TT
decreased by more than 15% compared to the initial test the participant would be declared
overreached and, following completion of the post-INT testing, would begin the RT
phase. No participant met this INT-termination criterion, and all completed the 20
consecutive days of intensive training.
RT phase. The RT phase consisted of a total of 5 sessions spread over 14 days.
Participants took part in HIIT sessions consisting of either four repetitions of the 4-min
cycling intervals at a working intensity set to [WLT + 0.7 (WPeak-WLT)], or five to one
repetitions of the 2-min cycling interval set, with working intensities ranging from [WLT
+ 0.8 (WPeak-WLT)] to [WLT + 0.9 (WPeak-WLT)].
Physical activity and nutritional control
Participants were instructed to maintain a normal dietary pattern and to keep their routine
physical activity at a constant level throughout the entire study. For this reason,
participants were required to fill in a food and activity diary that was regularly monitored.
To minimize variability in muscle metabolism attributable to diet, participants were
provided with a standardised dinner (55 kJ kg-1 body mass (BM), providing 2.1 g
carbohydrate (CHO) kg-1 BM, 0.3 g fat kg-1 BM, and 0.6 g protein kg-1 BM) and
breakfast (41 kJ kg-1 BM, providing 1.8 g carbohydrate kg-1 BM, 0.2 g fat kg-1 BM, and
0.3 g protein kg-1 BM) prior to the four biopsy trials. These meals were consumed 15 and
3 h prior to the biopsy trial respectively. Participants were also required to fill in a
nutrition diary recording the last 3 meals prior to each performance test undertaken during
baseline testing and they were asked to replicate the same nutritional intake thereafter
prior to the same type of test. During the INT phase, participants were asked to fill in a
food diary, which was collected and examined daily so that CHO intake was individually
monitored to prevent overtraining due to low body carbohydrate stores [100]. Following
previous research [100], all participants were administered 1-2 g kg-1 body mass of Poly-
Training Volume
116
Joule (Nutricia Australia Pty Ltd, Macquarie Park, NSW, AUS), a CHO powder dissolved
in water, during each training session, and a further 1-2 g kg-1 body mass in the first hour
after each training session for the entire duration of the INT phase. Hence, in an effort to
ensure optimum levels of muscle glycogen were maintained throughout this phase, a total
of approximately 4-6 g kg-1 body mass of CHO was provided each day with the aim to
reach a total daily CHO intake of 10-12 g kg-1 body mass.
Muscle analyses
Preparation of whole-muscle lysates. Approximately 10-20 mg of frozen muscle was
homogenised 4 times for 5 seconds with a hand-held mini-homogenizer (Kontes Pellet
Pestle Cordless Motor, Kimble Chase, NJ, USA.) on ice, in an ice-cold lysis buffer (1:20
w/v) containing 50 mM Tris, 150 mM NaCl, 1% Triton X-100, 0.5% sodium
deoxycholate, 0.1% SDS, 1 mM EDTA, 1 μg/mL aprotinin, 1 μg/mL leupeptin, 1 mM
benzamidine, 1 mM sodium orthovanadate, 1 mM sodium fluoride, 5 mM sodium
pyrophosphate, 1 mM DTT, 1 mM phenylmethanesulfonyl fluoride (PMSF), adjusted to
pH 7.4. Muscle homogenates were rotated end over end at 4 °C for 60 min, after which
they were centrifuged for two cycles of 10 min at 15 000 g at 4 °C separated by a similar
re-homogenization step to the initial one. After the second centrifugation the supernatant
was taken as the whole-muscle lysates for Western Blotting and enzyme activity assay.
Protein concentration was determined using a commercial colorimetric assay (Bio-Rad
Protein Assay kit II, Bio-Rad Laboratories Pty Ltd, Gladesville, NSW, AUS) and lysates
were then diluted with an equal volume in 2x Laemmli buffer containing 10% -
mercaptoethanol.
Western Blotting. For each protein of interest a linearity study was conducted to determine
the ideal loading amount (data not shown). Muscle lysates were then loaded in equal
amounts (10-25 μg according to target protein) and separated by electrophoresis for 1.5-
2.5 h at 100 V using self-cast SDS-PAGE gels (8-12%). Once resolved, the gels were
then wet transferred onto PVDF membranes at 100 V for 70-90 min. Transfer efficiency
was checked by Coomassie staining the gels together with Ponceau S staining of the
membranes. Once transfer was confirmed, membranes were blocked at room temperature
for 1 h using 5% skim milk in Tris Buffer Saline (TBS) 0.1% Tween-20 (TBS-T). After

Training Volume
117
3 x 5-min washes in TBS-T, membranes were incubated overnight at 4 °C with gentle
agitation in primary antibody solutions (3-5% BSA or 5% skim milk, plus 0.02% Na
Azide). Immunoblotting was carried out using the following antibodies: apoptosis-
inducing factor (AIF) (Cell Signaling Tech (CST), 5318), dynamin-related protein 1
(DRP1) (CST, 5391), mitofusin 2 (CST, 9482), NRF1 (Abcam, ab34682), p53 (CST,
2527), PGC-1α (Calbiochem, st-1202), PHF20 (CST, 3934), synthesis of cytochrome c
oxidase (COX) 2 (SCO2) (Santa Cruz, sc-49110), TFAM (Abcam, ab47517), and Total
OXPHOS (MitoSciences, ab110411). The following morning, membranes were washed
3 x 5-min in TBS-T and subsequently incubated under gentle agitation at room
temperature with the appropriate host species-specific secondary antibody for 90 min in
1-5% skim milk in TBS-T. Membranes were then washed again for 3 x 5-min in TBS-T
followed by a final 5-min wash in TBS before being immersed for 5 min under gentle
agitation at room temperature in a chemiluminescent solution (Solution A: 2.5 mM
Luminol, 0.36 mM p-Coumaric Acid, 0.1 M Tris (pH 8.5) in 10 mL MilliQ H2O; Solution
B: 6.1 μL H2O2, 0.1 M Tris (pH 8.5) in 10 mL MilliQ H2O; solution A and B prepared
separately and mixed just prior to use). Protein bands were visualized using a Bio-Rad
Versa-Doc imaging system and band densities were determined using Bio-Rad Quantity
One image analysis software (Bio-Rad Laboratories Pty Ltd, Gladesville, NSW, AUS).
Coomassie Blue staining was performed at the end of the procedure and was used to verify
correct loading and equal transfer between lanes [338]. Finally, samples for all four time
points for each participant were loaded on the same gel together with an identical amount
of internal standard (IS). Comparison and statistical analysis between each participant’s
time points were done using the raw density data normalised to the IS loaded in each gel
to reduce gel-to-gel variability. For graphical purposes, each time point was normalised
to baseline; for this reason WB graphs throughout this manuscript are presented as fold
change compared to baseline, and no error bar is presented for the baseline time point. A
representative blot for each protein analysed is presented in Figure 3.1.

Training Volume
118
Figure 3.1. Representative immunoblots of subunits from the five complexes of the electron
transport system (ETS), transcription factors, and downstream targets of p53 measured in whole-
muscle lysates prepared from skeletal muscle biopsy samples (vastus lateralis). Biopsies were
obtained at rest at baseline (pre-NT), and following the normal (post-NT), intensive (post-INT),
and reduced (post-RT) training phase.

Training Volume
119
Citrate Synthase Activity Assay. CS activity was determined in triplicate on a microtiter
plate by adding: 5 µL of a 2 mg/mL muscle homogenate, 40 µL of 3mM acetyl CoA in
Tris buffer and 25 µL of 1mM 5,5’-dithiobis(2-nitrobenzoic acid) (DTNB) in Tris buffer
to 165 µL of 100 mM Tris buffer (pH 8.3) kept at 30°C. At this point 15 µL of 10 mM
oxaloacetic acid were added to the cocktail and the plate was immediately placed in a
spectrophotometer kept at 30°C (xMark Microplate Spectrophotometer, Bio-Rad
Laboratories Pty Ltd, Gladesville, NSW, AUS). Following 30 s of linear agitation,
absorbance at 412 nm was recorded every 15 s for 3 min. CS activity was calculated and
reported as mol kg of protein-1 h-1.
Preparation of permeabilised skeletal muscle fibres for mitochondrial respiration. A 10-
20 mg fresh muscle sample was placed in ice cold BIOPS, a biopsy preserving solution
containing (in mM) 2.77 CaK2EGTA, 7.23 K2EGTA, 5.77 Na2ATP, 6.56 MgCl2, 20
taurine, 50 Mes, 15 Na2phosphocreatine, 20 imidazole and 0.5 DTT adjusted to pH 7.1
[225]. Samples were transferred to a 6-well plate kept on ice where the fibres were
mechanically separated using pointed forceps. Fibres were subsequently permeabilised
by gentle agitation for 30 min at 4°C in BIOPS containing 50 μg/mL of saponin. Samples
were then washed 3 times for 7 min at 4°C by gentle agitation in MiR05, a respiration
medium containing (in mM, unless specified) 0.5 EGTA, 3 MgCl2, 60 K-lactobionate, 20
taurine, 10 KH2PO4, 20 Hepes, 110 sucrose and 1 g/l BSA essentially fatty acid-free
adjusted to pH 7.1 at 37°C [225]. This method selectively permeabilises the cellular
membrane leaving the mitochondria intact and allows for in-situ measurements of
mitochondrial respiration.
High-Resolution Respirometry. After washing, 3-4 mg wet weight of muscle fibres were
assayed in duplicate in a high-resolution respirometer (Oxygraph-2k, Oroboros
Instruments, Innsbruck, Austria) containing 2 mL of MiR05. Mitochondrial respiration
was measured at 37°C. Oxygen concentration (nmol/mL) and oxygen flux (pmol s-1 mg-
1) were recorded using DatLab software (Oroboros Instruments, Innsbruck, Austria), and
instrumental background oxygen flux, accounting for sensor oxygen consumption and
oxygen diffusion between the medium and the chamber boundaries, was corrected online.
Re-oxygenation by direct syringe injection of O2 in the chamber was necessary to

Training Volume
120
maintain O2 levels between 275 and 450 nmol/mL, so as to avoid potential oxygen
diffusion limitation.
Mitochondrial respiration protocol. A substrate-uncoupler-inhibitor titration (SUIT)
protocol was used and the SUIT sequence, with final chamber concentration in brackets,
was as follows: pyruvate (2 mM) and malate (5 mM) in the absence of adenylates were
added for measurement of LEAK respiration (L) with electron entry through Complex I
(CI) (CIL). ADP (5 mM) was then added for measurement of maximal oxidative
phosphorylation (OXPHOS) capacity (P) with electron input through CI (CIP), followed
by addition of succinate (10 mM) for measurement of P with simultaneous electron supply
through CI + Complex II (CII) combined (CI+IIP). This respiration state provides
convergent electron input to the Q-junction through CI (NADH provided by
malate/pyruvate) and CII (flavin adenine dinucleotide reduced (FADH2) provided by
succinate) and supports maximal mitochondrial respiration by reconstruction of the
tricarboxylic acid cycle function. Cytochrome c (10 μM) was then added to test for outer
mitochondrial membrane integrity; an exclusion criterion was set such that if a chamber
showed an increase in O2 flux > 6% after addition of cytochrome c, it was discarded. This
was followed by a series of stepwise carbonyl cyanide 4-(trifluoromethoxy)
phenylhydrazone titrations (FCCP, 0.75-1.5 μM) for measurement of electron transport
system (ETS) capacity (E) with convergent electron input through CI+II (CI+IIE).
Rotenone (0.5 μM), an inhibitor of CI, was then added to obtain a measurement of E with
electron input through CII (CIIE). This was followed by addition of antimycin A (2.5 μM),
an inhibitor of Complex III (CIII), to obtain a measurement of residual oxygen
consumption capacity (ROX). ROX was subtracted from all other measurements to
account for oxidative side reactions. Ascorbate (2 mM) and N,N,N',N'-tetramethyl-p-
phenylenediamine (TMPD, 0.5 mM), artificial electron donors for Complex IV (CIV),
followed by sodium azide (> 200 mM), an inhibitor of CIV to account for auto oxidation
of ascorbate + TMPD, were then added to measure CIV respiration in the noncoupled
state (CIVE). Respiratory flux control ratios (FCR) were calculated. In brief, the leak
control ratio (LCR) is the quotient of CIL over CI+IIE; the phosphorylation control ratio
(PCR) is the quotient of CI+IIP over CI+IIE; the coupling control ratio is the quotient of
CIL over CI+IIP and is equivalent to the inverse respiratory control ratio (inv-RCR); and

Training Volume
121
the substrate control ratio (SCR) at constant P is the quotient of CIP over CI+IIP. Finally
the reserve capacity of CIV (CIVRES) was determined as the quotient of CI+IIP over CIVE.
Statistical analysis
All values are reported as means ± SD, unless specified otherwise. One-way ANOVA
with repeated measures for time were used to test for main effects. Significant main
effects were further analysed using a Tukey’s honestly significant difference post hoc
test. SigmaStat software (Jandel Scientific, San Rafael, CA) was used for all statistical
analyses. The level of statistical significance was set at P < 0.05.
3.3 Results
Training and performance measurements
Participants completed a significantly higher training volume during the INT phase (14.7
± 3.7 MJ), when compared to both the NT and RT phase (3.6 ± 0.6 and 0.6 ± 0.1 MJ
respectively, both P < 0.001, Figure 3.2). The training volume of the RT phase was also
significantly lower when compared to that of the NT phase (P = 0.015). There were no
changes in body mass throughout the study (data not shown). Performance results
(V̇O2Peak, WLT, WPeak, 20k-TT) are shown in Table 3.1. When compared to baseline, all
performance parameters improved following INT (9 to 19%, all P < 0.001), and remained
elevated at the end of the study (8 to 15%, all P < 0.05).

Training Volume
122
Figure 3.2. Total training volume per week for the entire study. MJ: megajoule; NT: normal
training; INT: intensive training; RT: reduced training. * Significantly different (P < 0.05) vs. pre-
NT, † vs. post-INT. n=10. All values are mean ± SEM.
Muscle analyses
Following NT, there were no significant changes in any of the measurements from the
muscle analyses (Figure 3.3 to Figure 3.7).
Citrate Synthase activity. Results are shown in Figure 3.3. Following INT, CS activity
increased by 49.9 ± 49.0% (P = 0.002) when compared to baseline (and 38.1 ± 32.4%
when compared to post-NT, both P = 0.007), and did not change significantly following
RT (-5.3 ± 28.2%, P = 0.645), where it was still elevated when compared to baseline (36.2
± 47.0%, P = 0.040).

Training Volume
123
Figure 3.3. Citrate synthase activity expressed per kg of protein. CS activity was measured in
whole-muscle lysates prepared from muscle biopsy samples (vastus lateralis) obtained at rest at
baseline (pre-NT), and following the normal (post-NT), intensive (post-INT), and reduced (post-
RT) training phase. * Significantly different (P < 0.05) vs. pre-NT, # vs. post-NT. n=10. All values
are mean ± SEM.
Protein content of subunits of the five ETS complexes. Results are shown in Figure 3.4.
Following INT, the protein content of all subunits increased when compared to baseline
(9 to 41%, all P < 0.05). With the exception of the CIII subunit (6%, P = 0.138), the
protein content of all subunits also increased as an effect of the INT phase alone (9 to
31%, all P < 0.05). During the RT phase, the protein content of the subunits of CI, CII
and CIV was reduced (10 to 20%, all P < 0.05), while that of CIII and CV did not change
significantly (-3 to -5%, both P > 0.05). By study end however, the protein content of all
subunits was not significantly different when compared to baseline (4 to 13%, all P >
0.05).
pre-NT post-NT post-INT post-RT0
5
10
15
* #
*
CS
activity [m
ol h
-1 k
g p
rote
in-1
]

Training Volume
124
Figure 3.4. Fold change compared to baseline of the protein content of subunits from the five
complexes of the electron transport system (ETS), complex I to V (CI to CV) in whole-muscle
lysates prepared from skeletal muscle biopsy (vastus lateralis). Biopsies were obtained at rest at
baseline (pre-NT), and following the normal (post-NT), intensive (post-INT), and reduced (post-
RT) training phase. *Significantly different (P < 0.05) vs. pre-NT, # vs. post-NT, † vs. post-INT.
n=10. All values are mean ± SEM.
Mass-specific mitochondrial respiration (expressed as pmol O2 s-1 mg-1). Results are
shown in Figure 3.5A. There were no significant changes in CIL throughout the study (all
P > 0.05). Following INT, CIP increased by 43.7 ± 26.9% when compared to baseline
(and 47.0 ± 18.3% when compared to post-NT, both P < 0.001), and decreased by 14.1 ±
12.7% following RT (P = 0.019); however, the post-RT value was still elevated by 23.7
± 31.6% when compared to baseline (P = 0.034). Following INT, CI+IIP increased by
41.0 ± 23.5% when compared to baseline (and 48.5 ± 20.0% when compared to post-NT,
both P < 0.001), and decreased by 17.0 ± 12.7% following RT (P = 0.003), where it was
not significantly different from baseline (P = 0.131). Following INT, CI+IIE increased by
41.3 ± 22.9% when compared to baseline (and 39.6 ± 16.4% when compared to post-NT,
both P = 0.002), and decreased by 25.0 ± 11.1% following RT (P = 0.003), where it was
not significantly different from baseline (P = 0.980). Following INT, CIIE increased by
34.5 ± 25.1% (P = 0.002) when compared to baseline (and 36.8 ± 23.4% when compared
CI-N
DUFB
8
CII-
30kD
a
CIII
-Cor
e 2
CIV
-II
CV-A
TP syn
α
0
0.8
1.0
1.2
1.4
1.6P
rote
in c
on
ten
t o
f su
bu
nit
sfr
om
th
e 5
ET
S c
om
ple
xes
(fo
ld c
han
ge r
ela
tive t
o p
re-N
T)
*
* #
†
* #
* #
* #
†
†
pre-NT
post-INT
post-NT
post-RT

Training Volume
125
to post-NT, P < 0.001), and decreased by 20.9 ± 15.1% following RT (P = 0.005), where
it was not significantly different when compared to baseline (P = 0.970). Following INT,
CIVE increased by 21.5 ± 24.4% when compared to baseline (P = 0.049), whereas a 20.5
± 26.4% increase from post-NT failed to reach statistical significance (P = 0.058). CIVE
did not change significantly following RT (-12.8 ± 18.0%, P = 0.100), where it was not
significantly different when compared to baseline (P = 0.986). The data presented in this
study showed no effect of the addition of cytochrome c as a control for outer
mitochondrial membrane integrity. FCRs changes are shown in Table 3.2. Following
INT, CIVRES increased by 19.3 ± 24.4% (P = 0.028), when compared to baseline (and
26.6 ± 20.7% when compared to post-NT, P = 0.003), and did not change significantly
following RT (-3.1 ± 13.4%, P = 0.848), where it was not significantly different from
baseline (both P = 0.155). There were no significant changes in all the other FCRs.
Mitochondrial (mt)-specific respiration (mass-specific mitochondrial respiration
normalised by CS activity, expressed as: pmol O2 s-1 CS-1). When normalised to CS
activity, mitochondrial respiration did not change throughout the study for any of the six
measurements of the SUIT protocol as shown in Figure 3.5B (all P > 0.05).

Training Volume
126
Figure 3.5. Mitochondrial respiration measurements at different coupling control states. A: mass-
specific mitochondrial respiration, and B: mitochondrial-specific respiration (obtained by
normalising mass-specific mitochondrial respiration by CS activity expressed per kg of protein).
Respiration was measured in permeabilised fibres prepared from muscle biopsy samples (vastus
lateralis) obtained at rest at baseline (pre-NT), and following the normal (post-NT), intensive
(post-INT), and reduced (post-RT) training phase. Respiration values are: CIL: Leak respiration
state (L) in the absence of adenylates and limitation of flux by electron input through Complex I
(CI); CIP: maximal oxidative phosphorylation state (P) with saturating levels of ADP and
limitation of flux by electron input through CI; CI+IIP: P with saturating levels of ADP and
limitation of flux by convergent electron input through CI + Complex II (CII); CI+IIE: maximal
electron transport system (ETS) capacity (E) with saturating levels of ADP and limitation of flux
by convergent electron input through CI+II; CIIE: E with saturating levels of ADP and limitation
of flux by electron input through CII; CIVE: maximal Complex IV noncoupled respiration with
saturating levels of ADP and limitation of flux by electron input through CIV. *Significantly
different (P < 0.05) vs. pre-NT, # vs. post-NT, † vs. post-INT. n=10. All values are mean ± SEM.

Training Volume
127
Table 3.2. Respiratory flux control ratios measurements before and after each training phase
FCR Pre-NT Post-NT Post-INT Post-RT
LCR (L/E) 0.04 ± 0.02 0.07 ± 0.04 0.06 ± 0.02 0.08 ± 0.01
PCR (P/E) 0.81 ± 0.07 0.74 ± 0.03 0.77 ± 0.04 0.81 ± 0.03
Inv-RCR (L/P) 0.07 ± 0.04 0.09 ± 0.04 0.08 ± 0.02 0.09 ± 0.02
SCR
(Constant P) 0.66 ± 0.05 0.68 ± 0.04 0.67 ± 0.03 0.70 ± 0.05
CIVRES 0.55 ± 0.05 0.51 ± 0.08 0.64 ± 0.09*# 0.62 ± 0.08#
FCR: respiratory flux control ratio; NT: normal training; INT: intensive training; RT: reduced
training. L: leak respiration; P: oxidative phosphorylation capacity; E: electron transport system
capacity; LCR: leak control ratio (CIL/CI+IIE); PCR: phosphorylation control ratio
(CI+IIP/CI+IIE); inv-RCR: inverse of respiratory control ratio (CIL/CI+IIP); SCR: substrate
control ratio at constant P (CIP/CI+IIP); CIVRES: CIV reserve capacity (CI+IIP/CIVE). CI: electron
input through complex I; CI+II: convergent electron input through complex I and II; CIV: electron
input through complex IV.FCR were calculated from mass-specific mitochondrial respiration
measurements in permeabilised muscle fibres (vastus lateralis), obtained from muscle biopsies
taken at baseline and after each training phase. *Significantly different (P < 0.05) vs. pre-NT, #
vs. post-NT. n=10. All values are mean ± SD.
Protein content of transcription factors. Following INT: the protein content of PGC-1α
increased by 73 ± 87% when compared to baseline (P = 0.026, Figure 3.6A); PHF20 protein
content was increased by 96 ± 146% (P = 0.022) when compared to baseline (and 93 ±
109% when compared to post-NT, P = 0.011) (Figure 3.6B); the protein content of NRF1
was increased by 63 ± 58% when compared to baseline (P < 0.001, Figure 3.6C); the protein
content of p53 increased by 168 ± 234% when compared to baseline (P = 0.002, Figure
3.6D); TFAM protein content was increased by 76 ± 69% when compared to baseline (P =
0.047, Figure 3.6E). During RT, there was a decrease in the protein content of NRF1 (19 ±
25%, P = 0.045, Figure 3.6C), and TFAM (49 ± 30%, P = 0.005, Figure 3.6E). Following
RT, the protein content of all the transcription factors was not significantly different when
compared to baseline (all P > 0.05, Figure 3.6A to E).

Training Volume
128
Figure 3.6. Fold change compared to baseline of the protein content of (A) PGC-1α, (B) PHF20,
(C) NRF1, (D) p53, and (E) TFAM in whole-muscle lysates prepared from skeletal muscle biopsy
samples (vastus lateralis). Biopsies were obtained at rest at baseline (pre-NT), and following the
normal (post-NT), intensive (post-INT), and reduced (post-RT) training phase. *Significantly
different (P < 0.05) vs. pre-NT, # vs. post-NT, † vs. post-INT. n=10. All values are mean ± SEM.
Protein content of AIF, SCO2, mitofusin 2, and DRP1. The protein content of AIF, SCO2,
mitofusin 2, and DRP1 did not change significantly throughout the study (all P > 0.05,
Figure 3.7A to D).

Training Volume
129
Figure 3.7. Fold change compared to baseline of the protein content of (A) AIF, (B) SCO2, (C)
mitofusin 2 and (D) DRP1 in whole-muscle lysates prepared from skeletal muscle biopsy samples
(vastus lateralis). Biopsies were obtained at rest at baseline (pre-NT), and following the normal
(post-NT), intensive (post-INT), and reduced (post-RT) training phase; n=10. All values are mean
± SEM.
3.4 Discussion
In contrast to what hypothesised, three weeks of very high-volume, high-intensity training
resulted in improved endurance performance, mitochondrial content and mitochondrial
respiration. These improvements were accompanied by an increase in the protein content of
key transcription factors regulating mitochondrial biogenesis. Two weeks of reduced training
however, were sufficient to revert the majority of the gains obtained during INT, with most
of the parameters measured in muscle returning to values that were not significantly different
from baseline. These results provide further evidence that training volume is an important
determinant of changes in mitochondrial content, and that human skeletal muscle is a
remarkably plastic tissue that rapidly adapts to an increase or decrease in training volume.

Training Volume
130
NT phase
The NT phase resulted in no significant changes in any of the measured muscle
parameters, and resulted in a small improvement in WLT, WPeak, and 20k-TT time. Results
from the NT phase will not be discussed further in this chapter as these represent a subset
of the HIIT group whose results have already been presented as part of Chapter 2.
Performance
Indicators of endurance performance (V̇O2Peak, WPeak, WLT, and 20k-TT time) improved
during INT (~5 to 12%), where all participants registered peak values for the study. These
findings are in contrast with what was hypothesised, and previous research showing a
reduction in markers of endurance performance after two weeks of intensified training
[99]. These discrepancies may relate to CHO supplementation during the INT phase
reducing or delaying the symptoms of overreaching [100]. Furthermore, in the study from
Halson et al. (2002), the increase in training volume was accompanied by an overall
increase in training intensity. However, training intensity was not changed in the present
study, allowing to isolate the manipulation of training volume, which had previously been
hypothesised as a key contributor to OTS in athletes [118]. Therefore, this research
indicates that when CHO levels are kept high, moderately-trained individuals are able to
positively adapt to a period of increased training volume (two HIIT sessions per day, each
lasting up to 80 min, for 20 consecutive days) at the same training intensity. As a
consequence of the positive adaptations that followed INT, the RT phase, which was
associated with a heavily reduced training volume, resulted in a very modest and mostly
insignificant loss of performance (~1 to 6%). This is consistent with previous research
showing that unless training intensity is increased, a subsequent reduction in training
volume does not improve endurance performance [288].
Markers of mitochondrial content
The increase in CS activity following the INT phase in the present study is consistent with
previous research reporting that exercise training is usually associated with an increase in
CS activity [323]. However, the magnitude of the change in CS activity varies

Training Volume
131
considerably following different training interventions [323], and has been suggested to
depend on the training volume employed [26]. The large increase in CS activity in the
present study (50%) is consistent with that from previous research employing very large
volumes of training [41, 70, 132, 204], and agrees well with the values predicted from the
relationship between training volume and training-induced changes in CS activity
reported in Bishop et al. (2014). This provides further support that training volume is an
important determinant of increases in mitochondrial content (as assessed by changes in
CS activity).
Following RT, CS activity showed a modest, non-significant decrease (5%). Previous
research, investigating various one-week protocols of reduced training volume, has
reported that CS activity increased only if training intensity increased during RT [288].
When training intensity remained constant, CS activity showed a modest non-significant
decrease [288], consistent with this research. These findings are also in agreement with
the modest (~5-10%) non-significant reduction in CS activity reported following a 3-
week reduction in training volume in both recreational [167, 316] and competitive
distance runners [166]. Studies investigating the effects of complete detraining on
mitochondrial enzymes have observed a reduction in CS activity ranging from 10% in 1
week [288] to 45% in as little as 3 weeks [199]. However, at the end of the present study
CS activity was still elevated when compared to baseline (36%), suggesting that, despite
a dramatic 23-fold reduction, maintenance of a minimal amount of training volume may
help to preserve CS activity and to avoid the loss that is associated with complete
detraining.
The protein content of the subunits of the complexes of the ETS is also considered a valid
biomarker of mitochondrial content, although the strength of this relationship varies for
each of the five complexes and is weaker than that for CS activity [145]. Following INT,
changes in the protein content of the subunits of the ETS complexes showed a similar
pattern to CS activity, and increased by 9-41%. No research to date has investigated
changes in the content of mitochondrial proteins following a period of intensified (or
reduced) training volume. In contrast to the results for CS activity however, the RT phase
induced a 3-20% reduction in the protein content of the subunits of the ETS complexes.
Moreover, by study end, the content of all five subunits was not significantly different

Training Volume
132
from baseline. This suggests that the training volume during the RT phase did not provide
a strong enough physiological stimulus to prevent the decrease in mitochondrial proteins
that is associated with detraining. It may also indicate that the protein content of the ETS
complexes is more sensitive to a reduction in training volume, when compared to CS
activity; this observation may relate to the different half-lives of mitochondrial complexes
and CS [27, 351]. This research highlights the rapid plasticity and adaptability of human
skeletal muscle to different training stimuli, and further supports the hypothesis that
training volume is an important determinant of changes in mitochondrial content [26].
Mitochondrial respiration
To assess adaptations in mitochondrial function, mitochondrial respiration in
permeabilised muscle fibres was measured. Following INT, all measurements of the
SUIT protocol following the addition of ADP showed a greater mass-specific
mitochondrial respiration (pmol O2 s-1 mg-1) when compared to both baseline and post-
NT values (Figure 3.5A). To determine the origin of these changes, mt-specific
respiration was determined by normalising mass-specific mitochondrial respiration by CS
activity (pmol O2 s-1 CS-1). As shown in Figure 3.5, mt-specific respiration did not change
throughout the study. This suggests that changes in mass-specific mitochondrial
respiration in the present study were mainly the result of changes in mitochondrial
content, consistent with previous research employing HIIT [127, 324]. However, when
training intensity is maximal (“all-out” sprint interval training), mass-specific
mitochondrial respiration has been shown to improve despite no change in mitochondrial
content, but as an effect of improved mitochondrial quality (i.e., greater mt-specific
respiration, as described in Chapter 2). Taken together, these findings seem to indicate
that mitochondrial respiration can be improved by either increasing training intensity,
which leads to greater mt-specific respiration (as described in Chapter 2), and/or by
increasing training volume, which leads to greater mitochondrial content with no apparent
changes in mt-specific respiration. Finally, findings from Chapter 2 have shown that
training at an intensity between WLT and WPeak was not sufficient to increase
mitochondrial respiration. However, the results of the present study indicate that, when

Training Volume
133
training volume is markedly increased, training at intensity between WLT and WPeak is
sufficient to enhance mitochondrial respiration (via increased mitochondrial content).
No study to date has investigated the influence of intensified training on changes in
mitochondrial respiration. However, these results demonstrate a similar increase in CIP to
that of the interval training group in Daussin et al. (2008) (~40 vs. 47% respectively),
even though the training volume was ~30% of that employed during INT in the present
study. Similarly, increases of 11% and 21% in CI+IIP, although smaller when compared
to the increase associated with the INT phase in this study (49%), were obtained with
training volumes equivalent to only ~5% [127] and ~10% [324] respectively, of that
employed during INT. Thus, although minor differences in training intensity,
methodology, and participant’s fitness may have influenced the outcome, these results
seem to suggest that mitochondrial respiration is sensitive, but not proportional, to the
training volume, as previously hypothesised [26].
The much reduced training volume of the RT phase was associated with an ~15-25%
reduction in mass-specific mitochondrial respiration across the SUIT protocol
measurements that followed the addition of ADP. No study to date has measured
mitochondrial respiration in permeabilised fibres following a reduction in training
volume. Nevertheless, it has been reported that mitochondrial respiration measured in
deltoid muscle homogenates of elite swimmers is reduced by 50% following one week of
detraining [62]. The greater decrease in mitochondrial respiration reported by Costill et
al. (1985) compared to that reported in this research may depend on factors such as
muscle type, fitness levels and training history, the use of complete detraining rather than
reduced training volume, and the use of muscle homogenates instead of permeabilised
fibres. The ~15-25% decrease in mass-specific mitochondrial respiration that followed
RT in this study is comparable with the 12-28% decrease in mitochondrial ATP
production rate (MAPR) reported following 3 weeks of detraining in active humans [343].
A remarkable finding of this research was that, at the end of the 13-week study, only CIP
was significantly higher compared to baseline, whereas all the other respiration states
were not significantly different from baseline despite the large increases that followed the
INT phase. These findings emphasise the reversibility of increases in mitochondrial
respiration following a period of reduced training, further highlighting the plasticity of

Training Volume
134
human skeletal muscle and the importance of maintaining training volume in order to
preserve the adaptations gained during exercise training.
Analysis of the FCRs showed that there was no change in the index of uncoupling (LCR),
the limitation of OXPHOS capacity by the phosphorylation system (PCR), the degree of
coupling between oxidation and phosphorylation (inv-RCR), and substrate control (SCR)
throughout the study. CIVRES however, was significantly elevated after INT when
compared to baseline. It is known that CIV oxidative capacity measured in permeabilised
fibres in the presence of ascorbate and TMPD is in excess of maximal coupled respiration
[225]; therefore, it is possible that the smaller increase in CIVE compared to CI+IIP (22
vs. 41% respectively) after INT, may be due to this overcapacity and the ability of CIV
to already sustain a higher overall mitochondrial respiration. Further research is needed
to confirm these hypotheses.
Cellular mechanisms of mitochondrial adaptations to changes in training volumes
To provide a better understanding of the cellular mechanisms involved in the regulation
of mitochondrial adaptations to different training volumes, the protein content of PGC-
1, p53, NRF1, PHF20 and TFAM, five transcription factors involved in the regulation
of mitochondrial biogenesis [266, 65, 271], was also measured. The protein content of all
five transcription factors responded to the large volume of HIIT, and was significantly
greater (~65-170%) following INT. The similar and concomitant increase in PGC-1,
NRF1 and TFAM protein content (73, 63, and 76% respectively), is consistent with the
changes in the same transcription factors (1.8-, 1.9-, and 1.4-fold respectively) following
four days of contractile activity in muscle cells [122], and is also in agreement with the
notion that NRF1 may provide a link between nuclear and mitochondrial gene expression
[325, 352]. It has been suggested that existing concentrations of NRF1 are sufficient to
meet the needs of the cell [233]. However, the increase in NRF1 protein content following
INT seems to indicate that when training volume is greatly increased, the existing
concentrations of this transcription factor may not be sufficient to support cellular needs.
The increase in PGC-1, p53 and PHF20 protein content following INT mirrored that of
mass-specific mitochondrial respiration, and is consistent with findings in from Chapter

Training Volume
135
2 showing an association between these parameters following training. These results are
also consistent with the role of PGC-1 [352] and p53 [181] as modulators of
mitochondrial respiration. Although no significant changes in these transcription factors
following moderate volume HIIT (3x/week for 4 weeks) have been reported in Chapter
2, the current findings indicate that when training volume is markedly increased, the
training intensity associated with HIIT is sufficient to increase the protein content of these
transcription factors in healthy males. In contrast, results from Chapter 2 indicate that
training-induced changes in the protein content of TFAM are not associated with changes
in mass-specific mitochondrial respiration. Following INT however, an increase in
TFAM protein content in parallel with increased mitochondrial content and mass-specific
mitochondrial respiration was also reported. Taken together, these findings seem to
suggest that changes in the protein content of TFAM may be associated primarily with
changes in mitochondrial content, and may only associate with changes in mitochondrial
respiration when these are driven by a change in mitochondrial content, as was the case
following INT. This would also be consistent with the role of TFAM as a key factor
regulating the mitochondrial transcriptional machinery [272]. Further research is needed
to investigate these hypotheses.
Following RT, only the content of TFAM and NRF1 was significantly decreased;
however, the protein content of all five transcription factors decreased to a level that was
not significantly different from baseline. This is the first report to demonstrate that these
transcription factors are sensitive to reductions in training volume. One of the most
striking findings of this research is that a reduction in training volume lasting as little as
two weeks was sufficient to reverse the majority of the gains obtained following eleven
weeks of testing and training at various intensities. The rapid changes in the content of
these transcription factors indicate that, even at the cellular level, human skeletal muscle
quickly responds to a change in training stimulus rapidly adapting to the new metabolic
and energy requirements, and highlights once again its remarkable plasticity.
A secondary aim of this research was to determine if different training volumes would
alter the protein content of selected downstream targets of p53. Through transcriptional
regulation of the COX assembly protein SCO2 [181], the apoptotic protein AIF [298,
319], the fusion protein mitofusin 2 [335], and the fission protein DRP1 [154] amongst

Training Volume
136
others, p53 has been linked with processes associated with the regulation of both
mitochondrial function and mitochondrial remodelling [266]. Data from this research
reveal that in humans the protein content of these downstream targets of p53 did not
change following INT, nor after RT. This lack of change is consistent with results from
the previous chapter showing that these targets did not respond to four weeks of HIIT in
human skeletal muscle. These results further support the notion that in skeletal muscle
p53 seems to regulate mitochondrial function via modulation of proteins other than
SCO2, as previously shown in mice [217] and in humans (Chapter 2). The present study
did not measure the mitochondrial (or nuclear) fraction of these proteins; nonetheless, it
may be possible that their location is linked with their activity. Therefore, future research
exploring how a single bout of exercise or exercise training alters the location of these
downstream targets of p53 is warranted.
Conclusions
The main finding of this research is that training volume is a key determinant of exercise-
induced mitochondrial adaptations. The present study demonstrated that a training
volume as large as 40 sessions of HIIT (lasting up to 80 min each) in 20 days increased
both markers of mitochondrial content and mass-specific mitochondrial respiration,
without changes in mt-specific respiration. Improvements in whole-body exercise
performance also mirrored these changes. A remarkable finding was that following a 23-
fold reduction in training volume (RT), and the maintenance of endurance performance,
all parameters measured in the muscle were not significantly different from pre-study
values (with the exception of CIP and CS activity). This suggests that maximal mass-
specific mitochondrial respiration may be reversed more rapidly than mitochondrial
content, providing further evidence that these two parameters are not necessarily
associated. Overall, these findings emphasise the rapid reversibility of mitochondrial
adaptations following a period of reduced training, and the importance of maintaining the
training stimulus to preserve the gains obtained during exercise training. The present
study shows that even at the cellular level human skeletal muscle is a malleable tissue
rapidly adapting to a change in training stimulus and to the metabolic and energy
requirements of the cell. This research provides further evidence that changes in the

Training Volume
137
protein content of PGC-1, p53 and PHF20 may be associated with changes in mass-
specific mitochondrial respiration, whereas it suggests that changes in the protein content
of TFAM may be primarily associated with changes in mitochondrial content. In
conclusion, this research highlights the remarkable plasticity of human skeletal muscle,
and provides valuable tools to better design exercise protocols for the prevention and cure
of diseases linked to impaired mitochondrial function.

Training Volume
138

139
Chapter 4
Effect of exercise intensity on PGC-1
and p53 in subcellular fractions of
human skeletal muscle
Findings from previous chapters have highlighted the role of training intensity and training
volume in the modulation of training-induced mitochondrial adaptations. However, the
cellular mechanisms regulating these processes are not yet fully understood.
The purpose of this third study was to investigate how training intensity regulates the initial
response to exercise. Previous research indicates that the initial phase of the exercise-
induced adaptive response may take place by nuclear accumulation of PGC-1 [351].
Moreover, while p53 has also been shown to regulate the exercise-induced adaptive
response, little is known on the molecular mechanisms that regulate its activity. Therefore,
the effects of a single bout of moderate-intensity continuous exercise (STCT) and maximal-
intensity sprint interval training (SIT) on changes in the protein content of PGC-1 and p53
in enriched nuclear and cytosolic fractions, were investigated.
The manuscript for this study is in the final stages of preparation:
Granata C, Oliveira RSF, Little JP, Renner K and Bishop DJ (2015). Modulation of the
exercise-induced adaptive response mediated by PGC-1 and p53, in enriched subcellular
fractions of human skeletal muscle. Journal of Physiology (final stages of preparation).

Exercise Intensity
140

Exercise Intensity
141
4.1 Introduction
Exercise is a powerful stimulus to induce mitochondrial biogenesis [224]. The result of
mitochondrial biogenesis is an increase in mitochondrial content [296] and/or
mitochondrial respiration [127], and an improved capacity for substrate oxidation [114]
and ATP production [343]. As a consequence, aerobic exercise training has been
associated with improved endurance performance [128], and has been used as a valuable
tool to help prevent and treat a host of chronic diseases linked to mitochondrial
dysfunction [106, 190, 206, 246]. Therefore, a better understanding of the molecular
mechanisms regulating exercise-induced mitochondrial adaptations provides important
information that may help to improve both endurance performance and health.
A key regulator of exercise-induced mitochondrial biogenesis is peroxisome proliferator-
activated receptor coactivator-1 (PGC-1), a transcriptional coactivator regulating the
expression of nuclear genes encoding mitochondrial proteins [242]. While initial research
focused on the increase in whole-muscle PGC-1 protein content in the hours following
the end of exercise [180, 224], more recent research has investigated changes in the
nuclear content of PGC-1. Research in rat skeletal muscle has demonstrated that the
increase in whole-muscle PGC-1 protein content following 3 hours of recovery is
preceded by an increase in nuclear PGC-1 protein content in muscle samples taken
immediately after the termination of exercise [351]. The authors suggested that the
increase in nuclear PGC-1 protein content may constitute the initial phase of the
exercise-induced adaptive response [351]. There is controversy however, on the timing
and magnitude of the increase in nuclear PGC-1 content in human skeletal muscle
following different exercise intensities. While a single bout of “all-out” sprint interval
exercise (SIT) has been shown to induce an increase in nuclear PGC-1 content after 3
hours of recovery [159], continuous exercise at a lower intensity has been reported to not
change [184] or to increase [160] nuclear PGC-1 content immediately post-exercise.
Moreover, the two latter studies did not investigate further changes in the subsequent
hours of recovery, potentially missing any delayed responses. Participants’ fitness levels
in the three studies were also different. Therefore, to better understand the influence of
different exercise intensities on the timing and magnitude of the change in nuclear PGC-

Exercise Intensity
142
1 protein content, it is important to directly compare participants of similar fitness levels
within the same study.
p53 is another key transcription factor involved in the regulation of exercise-induced
mitochondrial adaptations, as demonstrated by a reduction in mitochondrial respiration
and content, as well as endurance performance, in p53 knockout mice [217, 265]. p53 has
been implicated in the regulation of autophagy [174], mitochondrial remodelling [266]
and mitochondrial function [181]. Induction of the p53 response to physiological
stressors, such as exercise, occurs largely through alterations in the p53 protein [215]. For
example, in human skeletal muscle, a single bout of endurance exercise increases p53
phosphorylation at serine 15 [18], a post-translational modification enhancing p53
activity and stability [71, 289]. Subcellular localisation is also a key factor regulating the
activity of p53 [215, 266, 286]. An increase in p53 protein content in the nucleus, where
p53 can exert its transcriptional and biochemical activity [178, 286], has been reported in
cell culture following exposure to stress [177], and also in mouse skeletal muscle
immediately after a 60-min bout of running [227] or 1 hour after a 20-min bout of
intermittent eccentric muscle contractions [45]. Although the consensus is that cellular
stress induces p53 protein stabilisation and nuclear accumulation [178, 215], a decrease
in nuclear p53 protein content has been reported in mice following an exhaustive 90-min
running bout [267]. To date however, no study has investigated possible exercise-induced
changes in nuclear p53 content (or nuclear p53 phosphorylation) in human skeletal
muscle, and whether these changes may be regulated in an exercise intensity-dependent
manner. Similar to PGC-1, measuring changes in nuclear p53 may provide greater
physiological insight into its role in the modulation of exercise-induced mitochondrial
adaptations.
This study investigated, for the first time in human skeletal muscle, whether a single bout
of exercise can influence the protein content and phosphorylation of p53 in the nucleus.
It was hypothesised that, similar to PGC-1, exercise would represent a physiological
stress that leads to an increase in the nuclear content (and phosphorylation) of p53. It was
also hypothesised that the greater physiological stress associated with an increase in
exercise intensity would further increase these changes.

Exercise Intensity
143
4.2 Methods
Participants and ethics approval
Participants. Twenty healthy men, who were non-smokers, moderately-trained, and
involved in various individual and team sports, volunteered to participate in this study.
After initial screening and testing, participants were ranked by the power attained at the
lactate threshold (WLT) and assigned in reversed counterbalanced (ABBA) order to the
sub-lactate threshold continuous training (STCT) or SIT group (both n=10), in a between-
subjects study design. Nineteen participants completed the study, with one participant
from the SIT group withdrawing due to other commitments. Baseline physiological
parameters for each group are described in Table 4.1.
Table 4.1. Baseline characteristics of the participants.
Variable Study (n=19) STCT (n=10) SIT (n=9)
Age (y) 21 ± 2 21 ± 2 21 ± 3
Body Mass (kg) 82.0 ± 15.9 79.8 ± 12.7 84.5 ± 19.4
Height (cm) 180.1 ± 6.5 179.6 ± 6.1 180.6 ± 7.3
V̇O2Peak [mL min-1 kg-1] 47.0 ± 5.8 47.0 ± 3.7 47.1 ± 7.8
WLT 199.4 ± 40.8 194.8 ± 43.4 204.4 ± 39.7
WPeak 278.6 ± 48.6 276.5 ± 51.5 280.8 ± 48.2
STCT: sub-lactate threshold continuous training; SIT: sprint interval training; V̇O2Peak: peak
oxygen uptake; WLT: power at the lactate threshold; WPeak: peak power output. All values are
mean ± SD.
Ethical approval. Participants were informed of the study requirements, benefits and risks
before providing written informed consent. Approval for the study’s procedures, which
conformed to the standards set by the latest revision of the Declaration of Helsinki, was
granted by the Victoria University Human Research Ethics Committee.

Exercise Intensity
144
Study design
The experimental protocol consisted of, in the following order, a graded exercise test
(GXT), and the biopsy trial. Each of these two tests was preceded by a familiarisation
trial. All tests, including familiarisation tests, were separated by a minimum of 48 h (72
h prior to the biopsy trial). Due to the nature of sprint training, it was not possible to match
the two groups for total work. The study duration was approximately two weeks.
Experimental protocol and testing procedures
Participants were required to refrain from any strenuous physical activity for the 48 h
preceding each performance test (72 h for the biopsy trial), from alcohol and any exercise
for 24 h before testing, and from food and caffeine consumption for the 2 h preceding
each test (3 h for the biopsy trial).
GXT. A discontinuous graded exercise test was performed on an electronically-braked
cycle ergometer (Lode Excalibur, v2.0, Groningen, The Netherlands) to determine the
peak oxygen uptake (V̇O2Peak), peak power output (WPeak), and WLT (using the modified
DMax method [25]) for all the participants. The test consisted of 4-min stages at a constant
power output, interspersed with 30 s of rest. The test began at a power output of 60, 90 or
120 W depending on participants’ fitness levels, and was subsequently increased by 30
W every 4 min. Prior to the test, and during the 30-s rest, capillary blood samples were
taken from the fingertip for the measurement of blood lactate concentration ([La-]).
Participants were instructed to keep a cadence > 60 rpm and were given verbal
encouragement throughout the test, during which they were only allowed access to
cadence and elapsed time. The test was stopped when a participant reached volitional
exhaustion or cadence dropped below 60 rpm. The WPeak was determined as the power of
the last completed stage when participants stopped at the end of a stage. If a participant
stopped during a stage, WPeak was determined as the power of the last completed stage
plus 7.5 W for every completed minute.
Gas Analysis during the GXT. During the GXT, expired air was continuously analysed
for O2 and CO2 concentrations via a gas analyser (Moxus modular oxygen uptake system,
2010, AEI technologies, Pittsburgh, PA, USA). The gas analysers were calibrated

Exercise Intensity
145
immediately before each test using known gas mixtures (A: 21% O2, 0% CO2; B: 16%
O2, 4% CO2; BOC, Melbourne, Australia). The ventilometer was calibrated using a 3-
liter syringe (Hans Rudolph). V̇O2 values were recorded every 15 s and the two highest
consecutive 15-s values recorded during the test were averaged and recorded as the
participant’s V̇O2Peak.
Capillary blood sampling. Glass capillary tubes (MultiCap 140 μL, Siemens Healthcare
Diagnostics Inc. Deerfield, IL, USA) were used to collect about 50 μL of blood at various
time points during the GXT. Capillary blood [La-] was determined using a blood-lactate
analyser (YSI 2300 STAT Plus Glucose & Lactate Analyser, YSI Inc., Yellow Spring,
Ohio, USA). The blood-lactate analyser was regularly calibrated using precision
standards and routinely assessed by external quality controls.
Biopsy trial. Trials were always performed in the morning to avoid variations caused by
circadian rhythm changes. To minimize variability in muscle gene and protein expression
attributable to diet, participants were provided with a standardised dinner (55 kJ kg-1 body
mass (BM), providing 2.1 g carbohydrate kg-1 BM, 0.3 g fat kg-1 BM, and 0.6 g protein
kg-1 BM) and breakfast (41 kJ kg-1 BM, providing 1.8 g carbohydrate kg-1 BM, 0.2 g fat
kg-1 BM, and 0.3 g protein kg-1 BM) prior to the biopsy trial. Participants consumed these
meals 15 and 3 h prior to the biopsy trials respectively, and reported to the laboratory
thirty minutes before the first biopsy was scheduled. Participants rested in the supine
position, and after injection of a local anaesthetic into the skin and fascia (1% xylocaine,
Astra Zeneca) three small incisions, one for each biopsy to be taken during the biopsy
trial, were made about 2-3 cm apart. Fifteen minutes prior to the beginning of the exercise
protocol, a resting muscle biopsy (Pre) was obtained. All muscle biopsies (approximately
150-300 mg wet weight) were taken by an experienced practitioner at a constant depth of
around 2-3 cm, and were obtained from the vastus lateralis muscle using a biopsy needle
with suction. Once obtained, muscle samples were immediately processed, cleaned of
excess blood, fat, and connective tissue, were rapidly frozen in liquid nitrogen, and stored
at -80°C for subsequent analyses. At this stage participants were helped to an
electronically-braked cycle ergometer (Velotron, RacerMate, Seattle, WA, USA) where,
after completion of a warm-up involving cycling for 6 min at 66% of WLT followed by 2
min of rest, they began either the STCT or SIT protocol. Immediately upon completion

Exercise Intensity
146
of the exercise bout (< 2 s), a second muscle biopsy (+0 h) was obtained, with the
participant still sitting on the ergometer and while leaning his back towards a spotter.
Participants were then helped to a laboratory bed where they rested in the supine position
for 3 hours, at which stage a third muscle biopsy (+3 h) was obtained. Capillary blood
samples to measure [La-] were collected at rest, and immediately after the completion of
exercise. During this period participants had no access to food, and were permitted to
consume only water ab libitum.
STCT. Exercise consisted of 24 min of continuous cycling at a fixed power equivalent to
90% of baseline WLT. Exercise was set relative to WLT rather than WPeak as metabolic and
cardiac stresses are similar when individuals of differing fitness levels exercise at a
percent of the WLT, but can vary significantly when training at a percent of WPeak [15].
Participants were verbally encouraged for the duration of the exercise bout.
SIT. Exercise consisted of four repetitions of a 30-s “all-out” cycling bout against a
resistance set at 0.075 kg/kg body mass, interspersed with a 4-min recovery period.
During recovery participants remained on the bike and were allowed to either rest or cycle
against a low resistance (30 W) at a low cadence (< 50 rpm). During the last 15 s of the
recovery period participants were instructed to begin pedalling and reach a cadence of
80-100 rpm against no resistance (warm up phase), and in the last 2 seconds they were
instructed to begin pedalling as fast as possible (speed up phase). At this time, the load
was applied via the software (Velotron Wingate Software, Velotron, RacerMate, Seattle,
WA, USA) loaded on a computer and interfaced with the cycle ergometer. Participants
were verbally encouraged to keep the cadence as high as possible during the entire
duration of the bout.
Muscle analyses
Preparation of nuclear and cytosolic fractions. Nuclear and cytosolic fractions were
prepared from 40-60 mg of wet muscle using a commercially-available nuclear extraction
kit (NE-PER #78833; Pierce, Rockford, IL). Muscle samples were minced on ice with
sharp scissors in PBS containing a protease/phosphatase inhibitor cocktail (Cell Signaling
Technology (CST), 5872), and then centrifuged at 500 g for 5 min at 4°C. After discarding

Exercise Intensity
147
the supernatant, the muscle was homogenised 5 times for 5 seconds with a hand-held
mini-homogenizer (Kontes Pellet Pestle Cordless Motor, Kimble Chase, NJ, USA.) on
ice in CER-I buffer containing the same inhibitor cocktail. Homogenates were vortexed
vigorously and let sit on ice for 5-10 minutes. CER II buffer was then added.
Homogenates were vortexed vigorously and let sit on ice for 1 minute; this procedure was
repeated twice. Homogenates were centrifuged for 5 min at 16000 g at 4°C, and the
supernatant was taken as the crude cytosolic fraction and stored at -80°C. Pellets
containing nuclei were subsequently washed five times in PBS containing the same
inhibitor cocktail, to remove cytosolic contaminating proteins. Pellets were re-
homogenized with ~30 strokes using a Teflon pestle by hand in NER buffer supplemented
with the same inhibitor cocktail. Homogenates were vortexed vigorously and let sit on
ice for 10 minutes; this procedure was repeated four times. Following this 40-min
incubation step, samples were centrifuged at 16000 g at 4°C, and the supernatant was
taken as the soluble nuclear fraction and stored at -80°C. Sufficient biopsy material was
available to prepare and analyse nuclear and cytosolic fractions from nine participants in
each group. Determination of subcellular enrichment is described in the Results section.
Western Blotting. Protein concentration was determined using a commercial colorimetric
assay (Bio-Rad Protein Assay kit II, Bio-Rad, Hercules, CA), and lysates were then diluted
with a 3x Laemmli buffer, containing 1 mM DTT and 10% -mercaptoethanol. For each
protein of interest, a linearity study was conducted to determine the ideal loading amount
(data not shown). Muscle lysates were then loaded in equal amounts (10-45 μg according
to target protein and the fraction analysed) and separated by electrophoresis for 1.5-2.5 h at
100 V using self-cast SDS-PAGE gels (8-12%). Once resolved, the gels were wet
transferred onto PVDF membranes at 100 V for 70-90 min. Transfer efficiency was
checked by Coomassie staining the gels together with Ponceau S staining of the
membranes. Membranes were blocked at room temperature for 1 h using 5% skim milk in
Tris Buffer Saline (TBS) 0.1% Tween-20 (TBS-T). After 3 x 5-min washes in TBS-T,
membranes were incubated overnight at 4 °C with gentle agitation in primary antibody
solutions (3-5% BSA or 5% skim milk, plus 0.02% Na Azide). Immunoblotting was carried
out using the following antibodies (supplier and catalogue number noted in brackets):
histone H3 (CST, 9715), lactate dehydrogenase A (LDHA) (CST, 2012), p53 (CST, 2527),
PGC-1α (Calbiochem, st-1202), p-Acetyl-CoA Carboxylase (ACC)Ser79 (CST, 3661), p-

Exercise Intensity
148
p53Ser15 (CST, 9284), and plant homeodomain finger-containing protein 20 (PHF20) (CST,
3934). The following morning, membranes were washed 3 x 5-min in TBS-T and
subsequently incubated under gentle agitation at room temperature with the appropriate
host species-specific secondary antibody for 90 min in 1-5% skim milk in TBS-T.
Membranes were then washed again for 3 x 5-min in TBS-T followed by a final 5-min wash
in TBS before being immersed for 5 min under gentle agitation at room temperature in a
chemiluminescent solution [Solution A: 2.5 mM Luminol, 0.36 mM p-Coumaric Acid, 0.1
M Tris (pH 8.5) in 10 mL MilliQ H2O; Solution B: 6.1 μL H2O2, 0.1 M Tris (pH 8.5) in 10
mL MilliQ H2O; solution A and B prepared separately and mixed just prior to use]. Protein
bands were visualized using a Bio-Rad Versa-Doc imaging system and band densities were
determined using Bio-Rad Quantity One image analysis software (Bio-Rad, Hercules, CA).
Coomassie Blue staining was performed at the end of the procedure and was used to verify
correct loading and equal transfer between lanes [338]. Finally, samples for the three time
points for each participant were loaded on the same gel together with an identical amount
of internal standard (IS). Comparison and statistical analysis between each participant’s
time points were done using the raw density data normalised to the IS loaded in each gel to
reduce gel-to-gel variability. For graphical purposes, each time point was normalised to
baseline; for this reason WB graphs throughout this manuscript are presented as fold change
compared to baseline, and no error bar is presented for the baseline time point. A
representative blot for each protein analysed is presented in Figure 4.1.
Total RNA isolation. Total RNA was isolated from approximately 15-25 mg of muscle
tissue using the RNeasy® Mini kit (Qiagen, Mississauga, ON, Canada) according to the
manufacturer’s instructions. Briefly, muscle samples were homogenised using the
TissueLyser II (Qiagen, Mississauga, ON, Canada), and total RNA was isolated from the
aqueous phase following precipitation with 600 µL of 70% ethanol using RNeasy® Mini
kit. On-column DNA digestion was performed. RNA concentration was determined by
spectrophotometry (Nanodrop, ND1000, Thermo Fisher Scientific, Wilmington, DE) by
measuring the absorbance at 260 nm (A260) and 280 nm (A280), with A260/A280 ratios
above 1.8 indicating high-quality RNA. Sufficient biopsy material was available to isolate
and analyse total RNA from nine participants in each group.
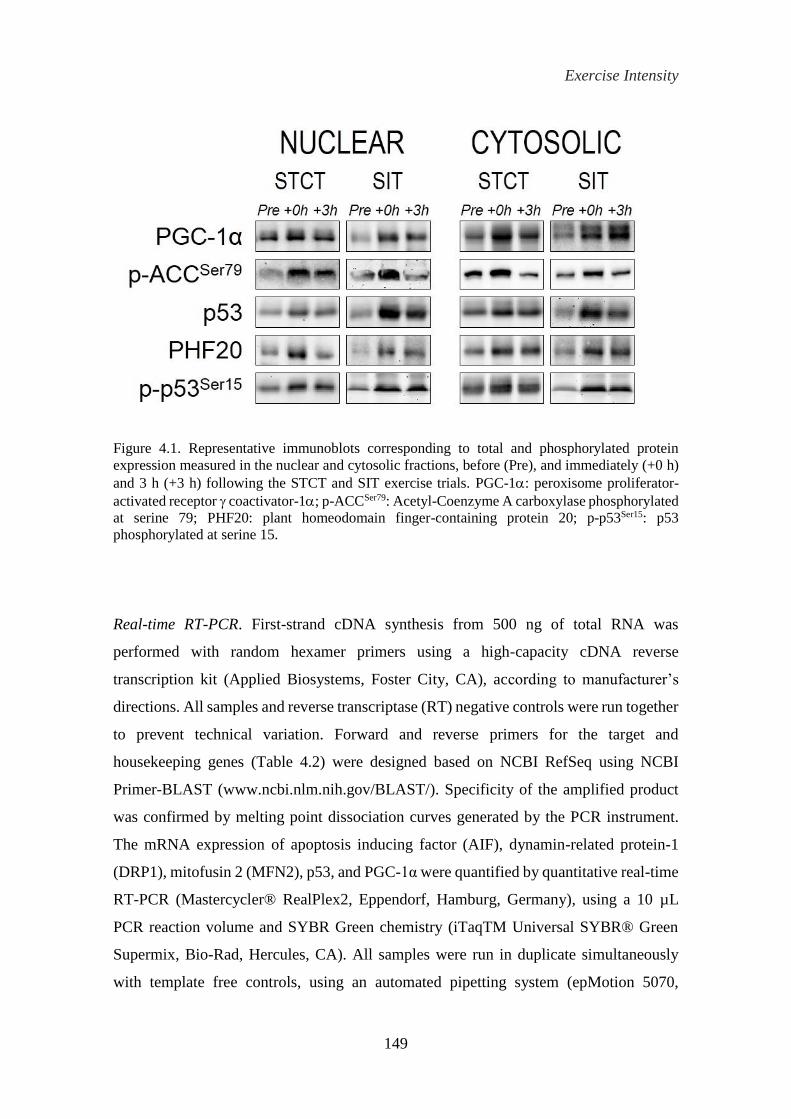
Exercise Intensity
149
Figure 4.1. Representative immunoblots corresponding to total and phosphorylated protein
expression measured in the nuclear and cytosolic fractions, before (Pre), and immediately (+0 h)
and 3 h (+3 h) following the STCT and SIT exercise trials. PGC-1: peroxisome proliferator-
activated receptor coactivator-1; p-ACCSer79: Acetyl-Coenzyme A carboxylase phosphorylated
at serine 79; PHF20: plant homeodomain finger-containing protein 20; p-p53Ser15: p53
phosphorylated at serine 15.
Real-time RT-PCR. First-strand cDNA synthesis from 500 ng of total RNA was
performed with random hexamer primers using a high-capacity cDNA reverse
transcription kit (Applied Biosystems, Foster City, CA), according to manufacturer’s
directions. All samples and reverse transcriptase (RT) negative controls were run together
to prevent technical variation. Forward and reverse primers for the target and
housekeeping genes (Table 4.2) were designed based on NCBI RefSeq using NCBI
Primer-BLAST (www.ncbi.nlm.nih.gov/BLAST/). Specificity of the amplified product
was confirmed by melting point dissociation curves generated by the PCR instrument.
The mRNA expression of apoptosis inducing factor (AIF), dynamin-related protein-1
(DRP1), mitofusin 2 (MFN2), p53, and PGC-1α were quantified by quantitative real-time
RT-PCR (Mastercycler® RealPlex2, Eppendorf, Hamburg, Germany), using a 10 µL
PCR reaction volume and SYBR Green chemistry (iTaqTM Universal SYBR® Green
Supermix, Bio-Rad, Hercules, CA). All samples were run in duplicate simultaneously
with template free controls, using an automated pipetting system (epMotion 5070,

Exercise Intensity
150
Eppendorf, Hamburg, Germany). The following PCR cycling patterns were used: initial
denaturation at 95°C for 3 min, 40 cycles of 95°C for 15 s and 60°C for 60 s. To account
for the efficiency of RT and initial RNA concentration, the mRNA expression of the
housekeeping genes cyclophilin, glyceraldehyde 3-phosphate dehydrogenase (GAPDH),
and TATA-binding protein (TBP), which did not change across time, were quantified,
and target genes were normalised to these housekeeping genes. Relative changes in
mRNA abundance were calculated using the normalized relative quantities (NRQs)
method as described previously [110].
Table 4.2. Primers used for real-time RT-PCR analyses of mRNA expression.
Gene Forward primer (5’→3’) Reverse primer (5’→3’)
AIF GATTGCAACAGGAGGTACTCCAAGA GATTTGACTTCCCGTGAAATCTTCTC
DRP1 CACCCGGAGACCTCTCATTC CCCCATTCTTCTGCTTCCAC
MFN2 CCCCCTTGTCTTTATGCTGATGTT TTTTGGGAGAGGTGTTGCTTATTTC
p53 GTTCCGAGAGCTGAATGAGG TTATGGCGGGAGGTAGACTG
PGC-1α GGCAGAAGGCAATTGAAGAG TCAAAACGGTCCCTCAGTTC
cyclophilin GTCAACCCCACCGTGTTCTTC TTTCTGCTGTCTTTGGGACCTTG
GAPDH AATCCCATCACCATCTTCCA TGGACTCCACGACGTACTCA
TBP CAGTGACCCAGCAGCATCACT AGGCCAAGCCCTGAGCGTAA
AIF: apoptosis-inducing factor; DRP1: dynamin-related protein 1; MFN2: mitofusin 2; PGC-1α:
peroxisome proliferator-activated receptor γ coactivator-1α; GAPDH: glyceraldehyde 3-
phosphate dehydrogenase; TBP: TATA-binding protein.
Statistical analysis
All values are reported as means ± SD unless specified otherwise. One-way ANOVA
were used to assess differences between the groups for age, height, body mass, WLT,
WPeak, V̇O2Peak, and for total work during the biopsy trial. To investigate the influence of
exercise type and time, and the interaction between both of these variables, two-way
ANOVA with repeated measures for time were used. Significant interactions and main

Exercise Intensity
151
effects were further analysed using a Tukey’s honestly significant difference post-hoc
test. Sigma Stat software (Jandel Scientific, San Rafael, CA) was used for all statistical
analyses. The level of statistical significance was set a priori at P < 0.05.
4.3 Results
Energy expenditure and performance parameters during the biopsy trial
Energy expenditure during the biopsy trial was 3.6-fold higher (P < 0.001) for the STCT
group compared with SIT (Table 4.3). In contrast, 1-s maximum and mean exercise
intensity during the biopsy trial, expressed in both absolute values and relative to WPeak,
were higher for the SIT group compared with STCT (all P < 0.001, Table 4.3). The
exercise-induced increase in blood lactate concentration ([La-], both P < 0.001, Table 4.3)
was also greater in SIT compared with STCT (P < 0.001, Table 4.3).
Table 4.3. Energy expenditure, performance parameters, and blood lactate concentration, during
the STCT and SIT exercise trials.
Measurement STCT (n=10) SIT (n=9)
Energy expenditure [kJ] 252.6 ± 59.7‡ 69.5 ± 9.1
1-s max exercise intensity [W] 175.4 ± 39.1‡ 823.4 ± 153.5
(%WPeak) 63.1 ± 3.1‡ 294.3 ± 33.7
Mean exercise intensity [W] 175.4 ± 39.1‡ 578.8 ± 75.6
(%WPeak) 63.1 ± 3.1‡ 207.7 ± 14.0
Blood [La-] [mmol/L] Pre 0.9 ± 0.2 0.9 ± 0.2
+0 h 3.9 ± 0.3*‡ 11.6 ± 1.4*
STCT: sub-lactate threshold continuous training; SIT: sprint interval training; WPeak: peak power
output; blood [La-]: blood lactate concentration. * Significantly different (P < 0.05) vs. Pre, ‡ vs.
SIT at the same time point. All values are mean ± SD.

Exercise Intensity
152
Muscle analyses
Cellular fractions enrichment, and antibody specificity. The enrichment and purity of
both nuclear and cytosolic fractions was confirmed by blotting the separated fractions
against the nuclear protein histone H3, and the cytosolic protein LDHA. Histone H3 was
only detected in nuclear fractions (Figure 4.2A), whereas LDHA was only detected in
cytosolic fraction (Figure 4.2B), confirming the cellular fractionation protocol was
successful. The specificity of the p53 antibody was confirmed by blotting samples beside
a commercially-available, untagged, full-length p53 recombinant human protein (Aviva
Systems Biology, AEP00002). The results in Figure 4.2C illustrate the specificity of the
chosen antibody. The same full-length p53 recombinant human protein, which was
expressed in E. coli and was not phosphorylated, was also used as a negative control
against the chosen p-p53Ser15 antibody. Results from Figure 4.2C show the p-p53Ser15
antibody did not recognise this protein, suggesting it is phospho-specific.
Figure 4.2. Subcellular fraction enrichment, and p53 antibody specificity. Histone H3 (A) and
lactate dehydrogenase A (LDHA) (B) were used as indicators of cytosolic and nuclear
enrichment, respectively. Confirmation of the specificity of the p53 antibody (C). Samples were
run beside an untagged full length p53 recombinant human protein and then blotted against both
Total-p53 (positive control) and p-p53Ser15 (negative control) antibodies. N: nuclear fractions; C:
cytosolic fractions; S: sample; RP: p53 recombinant protein.

Exercise Intensity
153
PGC-1α protein content. Nuclear PGC-1α protein content increased 2.3-fold immediately
following SIT (P < 0.001), but not after STCT (1.4-fold, P = 0.219), resulting in a
difference between groups at this time point (P = 0.043). Nuclear PGC-1α protein content
was still elevated, when compared to baseline, after 3 h of recovery following SIT only
(1.7-fold, P = 0.037) (Figure 4.3A). There was an interaction (P = 0.047) between group
and time for cytosolic PGC-1α protein content, and after 3 h of recovery cytosolic PGC-
1α protein content was 1.9-fold higher (P = 0.037) than baseline in the SIT group only
(Figure 4.3B).
Figure 4.3. Nuclear (A) and cytosolic (B) PGC-1α protein content before (Pre), and immediately
(+0 h) and 3 h (+3 h) following the STCT and SIT exercise trials. * Significantly different (P <
0.05) vs. Pre, ‡ vs. SIT at the same time point. n=9 for each group. All values are mean ± SEM.
PGC-1α mRNA. Muscle PGC-1α mRNA content increased 6-fold (P < 0.001) after 3 h of
recovery, with no difference between groups (P = 0.701, Figure 4.4A).

Exercise Intensity
154
Figure 4.4. PGC-1α (A), and p53 (B) mRNA content before (Pre), and immediately (+0 h) and 3
h (+3 h) following the STCT and SIT exercise trials, expressed relative to cyclophilin,
glyceraldehyde 3-phosphate dehydrogenase (GAPDH), and TATA-binding protein (TBP)
housekeeping genes. # Significant main effect of time (P < 0.05) vs. Pre. n=9 for each group. All
values are mean ± SEM.
P-ACCSer79 protein content. P-ACCSer79 content was increased in both the nuclear (2-fold,
P = 0.015, Figure 4.5A) and cytosolic (1.7-fold P = 0.017, Figure 4.5B) fraction
immediately post-exercise only, with no difference between groups (both P > 0.05).
Figure 4.5. Nuclear (A) and cytosolic (B) p-ACCSer79 protein content before (Pre), and
immediately (+0 h) and 3 h (+3 h) following the STCT and SIT exercise trials. # Significant main
effect of time (P < 0.05) vs. Pre. n=9 for each group. All values are mean ± SEM.

Exercise Intensity
155
p53 protein content. The content of p53 was increased in both the nuclear (2-fold, P =
0.001, Figure 4.6A) and cytosolic (1.8-fold, P = 0.014, Figure 4.6B) fraction immediately
post-exercise only, with no difference between groups (both P > 0.05).
PHF20 protein content. The content of PHF20 was increased in both the nuclear (1.7-
fold, P = 0.004, Figure 4.6C) and cytosolic (1.7-fold P < 0.001, Figure 4.6D) fraction
immediately post-exercise only, with no difference between groups (both P > 0.05).
P-p53Ser15 protein content. Nuclear p-p53Ser15 content increased immediately post-
exercise (3.1-fold, P < 0.001), and after 3 h of recovery (2.1-fold, P = 0.007), following
SIT but not STCT (both P > 0.05); it was significantly greater in SIT compared with
STCT at both time points (P < 0.001 and P = 0.044, at +0 and +3 h, respectively) (Figure
4.6E). Cytosolic p-p53Ser15 content increased immediately post-exercise (2.3-fold, P <
0.001), and after 3 h of recovery (2-fold, P = 0.020), with no difference between groups
(P = 0.304) (Figure 4.6F).
mRNA of p53, AIF, DRP1 and MFN2. There was no change in p53 mRNA content
throughout (P = 0.380, Figure 4.4B). The mRNA content of AIF was increased by 1.4-
fold (P = 0.040) after 3 h of recovery, with no difference between groups (P = 0.460)
(Table 4.4). The mRNA content of DRP1 and MFN2 was increased by 1.2- (P = 0.038)
and 1.4-fold (P = 0.014) respectively, at the end of exercise, with no difference between
groups (both P > 0.05) (Table 4.4).

Exercise Intensity
156
Figure 4.6. Protein content of nuclear (A) and cytosolic (B) p53, of nuclear (C) and cytosolic (D) PHF20,
and of nuclear (E) and cytosolic (F) p-p53Ser15 before (Pre), and immediately (+0 h) and 3 h (+3 h) following
the STCT and SIT exercise trials. # Significant main effect of time (P < 0.05) vs. Pre. *Significantly different
(P < 0.05) vs. Pre, ‡ vs. SIT at the same time point. n=9 for each group. All values are mean ± SEM.

Exercise Intensity
157
Table 4.4. Fold change compared to Pre, following the STCT and SIT exercise trials, for the
mRNA content of AIF, DRP1, and MFN2 expressed relative to cyclophilin, GAPDH and TBP
housekeeping genes.
Gene Time STCT (n=9) SIT (n=9)
AIF +0 h 1.24 ± 0.36 1.47 ± 0.98
+3 h# 1.19 ± 0.28 1.56 ± 0.98
DRP1 +0 h
# 1.16 ± 0.34 1.22 ± 0.31
+3 h 1.03 ± 0.22 1.20 ± 0.43
MFN2 +0 h
# 1.36 ± 0.50 1.37 ± 0.57
+3 h 1.27 ± 0.41 1.18 ± 0.72
STCT: sub-lactate threshold continuous training; SIT: sprint interval training; AIF: apoptosis-
inducing factor; DRP1: dynamin-related protein 1; MFN2: mitofusin 2; GAPDH: glyceraldehyde
3-phosphate dehydrogenase; TBP: TATA-binding protein. # Significant main effect of time (P <
0.05) vs. Pre. All values are mean ± SD.
4.4 Discussion
The aim of this study was to investigate whether, like PGC-1α, a single bout of exercise
would increase the protein content (and phosphorylation) of p53 in the nucleus. A second
aim was to determine whether the greater physiological stress associated with an increase
in exercise intensity would influence these changes. This study reports, for the first time,
an exercise-induced increase in the nuclear abundance of p53 in human skeletal muscle,
which was also accompanied by an increase in the nuclear abundance of PHF20, a protein
that stabilises and activates p53 [65]. Although there was not a clear effect of intensity on
the exercise-induced increase in nuclear p53 content, only SIT, and not STCT, was
associated with a post-exercise increase in the phosphorylation of p53 at serine 15 (a post-
translational modification that regulates p53 activity and stability [71, 289]), in the
nuclear fraction. Similarly, only SIT, and not STCT, was associated with a post-exercise
increase in the nuclear content of PGC-1.

Exercise Intensity
158
PGC-1α
This study demonstrates an increase in nuclear PGC-1α protein content immediately after
the termination of SIT, but not STCT, with this increase still apparent 3 hours after the
cessation of SIT. These findings are in agreement with previous research showing that a
similar bout of SIT increased nuclear PGC-1α protein content to a similar magnitude after
3 h of recovery [159]. In the present study however, this increase was also present
immediately post-exercise. The rapid increase in nuclear PGC-1α protein content
following SIT in this study provides further support that nuclear PGC-1α accumulation
may represent the initial phase of the adaptive response to exercise [351].
In contrast to SIT, STCT (24 min at ~65% of V̇O2Peak) did not appear to provide a
sufficient physiological stimulus to induce a significant increase in nuclear PGC-1α
accumulation. Findings from previous studies are conflicting; whereas cycling for 60 min
at 74% of V̇O2Peak was shown not to alter the nuclear content of PGC-1α [184], cycling
for 90 min at 65% of V̇O2Peak resulted in a 54% increase immediately post-exercise [160].
While the reasons for these discrepancies are not readily apparent, they may relate to the
many methodological differences (e.g., bout duration, the participants’ fitness levels, the
subcellular fractionation protocol employed) between studies. Moreover, due to the large
amount of skeletal muscle required for nuclear fractionation, the results from Little et al.
(2010) were based on a small number of participants (n=4); therefore, the intrinsic
variations between participants’ responses may have confounded the outcome. While
further research is required, results to date seem to indicate that there is not a large
increase in nuclear PGC-1α protein content immediately after moderate-intensity (65-
75% of V̇O2Peak) exercise.
This study provides evidence that the exercise-induced increase in nuclear PGC-1α
protein content might be influenced by exercise intensity. Results from Table 4.3 show
that while exercise duration and energy expenditure were 1.7- and 3.6-fold greater during
STCT, mean and maximal exercise intensity were 3.3- and 4.7-fold greater during SIT.
This seems to suggest that exercise intensity, rather than exercise duration or energy
expenditure, may be important factors affecting nuclear PGC-1α accumulation.
Moreover, the 3-fold greater blood [La-] values recorded following SIT may also indicate
that physiological stress is another important factor associated with the increase in nuclear

Exercise Intensity
159
PGC-1α protein. Results from the cytosolic pool, are also consistent with an exercise-
intensity effect in the regulation of PGC-1α protein. Similar to the nuclear fraction, only
SIT induced an increase in cytosolic PGC-1α protein content; however, this increase took
place only after 3 h of recovery. The delayed increase in cytosolic PGC-1α compared
with nuclear PGC-1α, seems to provide further evidence that the initial phase of the
exercise-induced adaptive response may indeed take place in the nucleus [351].
The combined results from the nuclear and cytosolic pool do not seem to directly support
translocation of PGC-1α between the two cellular compartments, as previously
hypothesised [351]. However, no study to date has provided convincing evidence of PGC-
1α translocation from the cytosol to the nucleus using cellular fractionation and
immunoblotting. Studies have either not measured PGC-1α in the cytosol and only
reported an increase in nuclear PGC-1α content [351], or have observed no change [160],
or an increase [9], in cytosolic PGC-1α alongside an increase in the nuclear fraction. The
greater PGC-1α content in the cytosol, coupled with the lack of sensitivity of the
immunoblotting technique to detect small changes from the larger cytosolic pool, have
been suggested as a possible reason for failing to show evidence of PGC-1α translocation
[160]. Another possible explanation for the concomitant increase in nuclear and cytosolic
PGC-1α content in this study may relate to an increase in PGC-1α stability. It has been
demonstrated that PGC-1α protein has a short half-life [9, 214], and that direct PGC-1α
phosphorylation by p38 MAPK increases its half-life by stabilising the PGC-1α protein
[241]. Unfortunately, phospho-specific PGC-1α antibodies are not commercially
available so further testing of this hypothesis is currently limited by technical challenges.
Any factor promoting PGC-1α stability, such as p38 phosphorylation, would likely result
in greater PGC-1α protein content independent of translocation. It was hypothesised that
SIT would be associated with greater p38 phosphorylation compared to STCT;
unfortunately, due to time constraints, it was not possible to test this hypothesis prior to
submission of this thesis. Although p38 phosphorylation does not seem to be regulated in
an intensity-dependent manner in whole-muscle lysates [55, 73], it may be possible that
exercise intensity differentially regulates nuclear and cytosolic phosphorylation of p38.
Finally, a model has been suggested whereby phosphorylation of p38 following exercise
results in the activation of PGC-1α and its subsequent translocation to the nucleus where
it initiates the adaptive response [351]. It is therefore important that future research should

Exercise Intensity
160
also measure the association between PGC-1α and the import proteins that potentially
regulate PGC-1α nuclear/cytosolic shuttling.
The PGC-1α protein has been shown to activate its own promoter through a feed-forward
loop [102]; as a result, increased stability of nuclear PGC-1α would further enhance PGC-
1α transcriptional activity before degradation. However, although nuclear PGC-1α
protein content was only increased following SIT, no effect of exercise intensity on the
exercise-induced increase in PGC-1α mRNA after 3 h of recovery was observed. The
timing and magnitude of this increase are in accordance with findings from previous
research employing similar exercise intensities [57, 159]. The similar increase in PGC-
1α mRNA following STCT and SIT is also in agreement with findings from previous
research [72]. By comparing high-intensity interval training (HIIT) at 73, 100 and 133%
of WPeak, these authors demonstrated that the exercise intensity-dependent regulation of
PGC-1α gene expression, which had been previously reported [73], is limited to
submaximal (i.e., < WPeak) exercise intensities. The similar increase in PGC-1α mRNA
following STCT (exercise intensity < WPeak) and SIT (exercise intensity > WPeak) in this
study, is consistent with the findings from Edgett et al. (2013).
The similar increase in PGC-1α mRNA between groups also seems to suggest that factors
other than increased nuclear PGC-1α may play a role in the upregulation of PGC-1α gene
expression. A possible factor is the activation of AMPK following exercise, a key
signalling event in the modulation of exercise-induced mitochondrial biogenesis [185].
This modulation leads to an increase in PGC-1α mRNA, either by direct AMPK
phosphorylation of the PGC-1α protein [130], or via AMPK regulation of multiple control
points in the PGC-1α feed-forward loop [185]. Therefore, the phosphorylation of ACC, a
downstream target and commonly used marker of AMPK activation [130] was measured.
While previous studies reported increased cytosolic p-ACCSer79 following both
continuous [160], and sprint interval [159] exercise, or increased nuclear AMPK
phosphorylation following continuous exercise [186], the present research directly
compared the effects of different exercise intensities on p-ACCSer79 in subcellular
fractions. This study shows that STCT and SIT similarly increased nuclear (and cytosolic)
p-ACCSer79 post-exercise, followed 3 h later by an increase in PGC-1α mRNA that was
also similar between groups. The similar increase in p-ACCSer79 in this study is in

Exercise Intensity
161
agreement with the hypothesis that the blunted response of PGC-1α mRNA at
supramaximal intensities may indicate that its signalling-mediated activation may also be
blunted [72].
p53
The tumour suppressor p53 is another key transcription factor influencing the metabolic
and transcriptional control of mitochondrial biogenesis [266], which is modulated by
exercise [18, 265]. The present study demonstrates that nuclear (and cytosolic) p53
protein content was increased immediately post-exercise, with no significant difference
between the two exercise intensities. Although Saleem & Hood, (2013) observed a
decrease in nuclear p53 protein content after a 90-min exhaustive exercise bout in mice,
the results from this study agree with previous findings in mice reporting increased
nuclear p53 protein content immediately after a 60-min bout of running [227], and 1 hour
after a 20-min bout of intermittent eccentric muscle contractions [45]. These findings are
also in agreement with the generally-accepted notion that cellular stress is associated with
accumulation of p53 protein in the nucleus [178, 215], a process that has been attributed
to post-translational events such as nuclear/cytosolic shuttling, and/or increased p53
protein stability [215].
While the C terminus of p53 contains a cluster of several nuclear localisation signals
(NLS) that mediate the migration of p53 into the cell nucleus [286], the concomitant
increase in nuclear and cytosolic p53 in this study does not provide direct evidence of
translocation. However, p53 cellular translocation is a tightly-regulated process that
requires a complex series of protein-protein interactions [178], and the help of import and
export receptors [330]. This suggests that p53 trafficking between these two
compartments cannot simply be assessed by measuring changes in p53 protein content in
the two separated pools. A possible explanation for this concomitant increase may relate
to an increase in p53 stability [215]. In this regard, p53 has been shown to have an
extremely short half-life [250], and cellular stress has been reported to increase its half-
life and stability [139, 175]. Consistent with these findings, p53 accumulation in both
cellular pools may have been the result of an increased p53 stability in response to the
increased physiological stress imparted to the cell by a single bout of exercise.

Exercise Intensity
162
PHF20 is a multidomain protein responsible for increasing p53 stability through direct
interaction in a methylation-dependent manner [65]. This study reports an increase in both
nuclear and cytosolic PHF20 protein content immediately post-exercise, with no
difference between exercise intensities. In unstressed cells, nuclear p53 is bound to
murine double minute-2 (MDM2), a p53 negative regulator that ubiquitinates p53 and
induces p53 cytosolic degradation by the proteasome [105, 177, 330]. Upon cellular stress
PHF20 interacts with p53 and enhances p53 stability by diminishing the MDM2-mediated
p53 degradation [65]. Although the direct interaction between PHF20 and p53 has not
been measured in this study, the concomitant and similar increase in these two proteins
in both compartments may indicate an increased PHF20-p53 interaction, and a subsequent
increase in p53 stability [65]. Future research is required to better understand the
molecular events regulating p53 stability, degradation, and the subsequent
nuclear/cytosolic shuttling following exercise.
An additional factor affecting p53 stability is phosphorylation at serine 15 (p-p53Ser15)
[289]. The present study demonstrates, that nuclear p-p53Ser15 was increased immediately
post-exercise only following SIT - an increase that persisted until 3 h of recovery.
Cytosolic p-p53Ser15 was also increased at both time points, but the difference between
the groups did not reach significance. The increase in p-p53Ser15 only following SIT,
which was associated with greater physiological stress than STCT, supports the notion
that cellular stress leads to an increase in p-p53Ser15 [289]. The only two studies
investigating p-p53Ser15 following endurance exercise with humans observed whole-
muscle p-p53Ser15 to increase only after 3 h of recovery, regardless of training modality
[18] or carbohydrate availability [19]. The earlier increase in nuclear p-p53Ser15 in this
research (+0 h), compared with that in whole-muscle p-p53Ser15 in the two studies above
(+3 h) [18, 19], indicates that, similar to PGC-1α, an increase in nuclear p-p53Ser15 may
represent the initial phase of the p53-mediated exercise-induced adaptive response. The
signalling kinases AMPK [136] and p38 MAPK [287] have also been shown to regulate
p-p53Ser15. The lack of an exercise intensity effect on the increase in p-ACCSer79, a marker
of AMPK activation [130], could indicate that other signalling proteins upstream of p53
(e.g., p38 MAPK) may have contributed to the different upregulation of p53
phosphorylation between STCT and SIT. Further research to test this hypothesis is
warranted. Overall, these findings seem to further support that an increase in p53 stability

Exercise Intensity
163
may have been responsible for the increase in p53 protein content observed in the present
study.
PHF20 can also act as a transcription factor, and has been shown to activate and regulate
p53 gene expression [218]. Nonetheless, despite an increase in PHF20 protein content
following both type of exercise, there was no significant change in p53 mRNA content
within 3 h from termination of exercise. However, studies in cells have observed
upregulation of p53 by PHF20 to take place only after 6 or 12 h [218]; this indicates that
any increase in p53 mRNA following STCT or SIT in the present study, may have not
taken place until after the third hour of recovery. Future research investigating exercise-
induced changes in p53 mRNA 6-24 h post-exercise is warranted, especially as previous
reports are scarce and controversial. While research in mice has observed a reduction in
p53 mRNA immediately post-exercise [267], a study with humans reported a small
increase (~1.3-fold) following 3 h of recovery, with no difference between the three
exercise intensities investigated [72]. When considering these findings, two observations
must be made. First, changes in the rate of p53 gene transcription have been suggested to
play a minor role in the induction of the p53 response to cellular stress [215]; second,
regulation of p53 activity is mainly related to the stress-induced post-translational
stabilisation of the p53 protein [177, 215]. The lack of change in p53 mRNA, and the
increase in p53 and p-p53Ser15 in this study, are consistent with these observations. This
proposed mechanism of action is especially attractive, as a rapid increase in p53 protein
content without the need for de novo transcription, would be particularly advantageous in
cells undergoing oxidative stress [215].
p53 is an inducible transcription factor regulating a host of mitochondrial genes [266].
Studies have revealed the presence of a p53 binding site in the promoter region of the
PGC-1α gene [124], as well as DRP1 [154] and MFN2 [335] - two key proteins involved
in the regulation of mitochondrial remodelling [266]. A p53 response element has also
been shown in the AIF gene [298], an apoptotic protein assisting in the assembly and
stabilization of complex I [319]. In agreement with an increase in the nuclear content of
p53, there was an increase in the mRNA of these 4 genes in response to exercise, with no
difference between the two exercise protocols. It has been suggested that the activity of
p53 as an inducible transcription factor depends on its rapid nuclear stabilization after

Exercise Intensity
164
stress [177]; findings from this study seem to agree with this notion, and indicate that the
physiological stress associated with exercise is also associated with the induction of p53
transcriptional activity.
Conclusion and significance
This research observed an increase in nuclear PGC-1α protein content following SIT but
not STCT, suggesting that exercise intensity could play a key role in the induction of
PGC-1α nuclear accumulation, an event thought to mediate the initial adaptive response
to exercise. Moreover, and for the first time, this study demonstrates that a single exercise
bout induces nuclear accumulation of p53, a transcription factor also involved in the
activation of exercise-induced mitochondrial adaptations. It is suggested that this increase
may relate to greater p53 stability, as demonstrated by an increase in PHF20 protein
content, a p53 regulatory protein that induces p53 stability. In addition, phosphorylation
of p53 at serine 15, a post-translational event also associated with increased p53 stability,
increased only following SIT. Collectively, this suggests that the greater physiological
stress associated with SIT may play a key role in the regulation of the p53 response,
consistent with the notion that greater cellular stress induces p53 activity. Considering
the important role of PGC-1α and p53 in the regulation of exercise-induced mitochondrial
biogenesis, these findings could have important implications for the design of therapeutic
exercise programs to prevent and treat a variety of metabolic and age-related diseases.

165
Chapter 5
Conclusions and future directions
The overall aim of this thesis was to investigate the effects of both training intensity and
training volume on markers of mitochondrial biogenesis in human muscle, and to provide
a better understanding of the molecular mechanisms mediating exercise-induced
mitochondrial adaptations. The aim of the first study (described in Chapter 2) was to
investigate the role of training intensity, by comparing a 4-week training protocol at either
moderate (STCT), high (HIIT), or maximal (SIT) training intensity. The purpose of the
second study (described in Chapter 3) was to examine the role of training volume by
comparing three subsequent periods of normal (NT), intensified (INT), and reduced (RT)
training volume. Finally, the third study (described in Chapter 4) compared the effects of
two different exercise intensities (moderate and maximal) on the molecular mechanisms
mediating the exercise-induced mitochondrial response in enriched cytosolic and nuclear
fractions.
5.1 Summary of key findings
Chapter 2:
Training intensity is a key factor regulating training-induced changes in mass-
specific mitochondrial respiration, as demonstrated by an increase in this
parameter only following four weeks of SIT but not HIIT or STCT.
Four weeks of SIT are sufficient to induce improvements in mt-specific
respiration (an indicator of mitochondrial quality).

Conclusions & Future Directions
166
Training intensity is not a key determinant of changes in mitochondrial content,
as suggested by the lack of change in CS activity following all three training
protocols.
Changes in the protein content of key transcription factors, such as PGC-1, p53,
and PHF20, seem to be more strongly associated with changes in mass-specific
mitochondrial respiration than mitochondrial content.
There appears to be an apparent dissociation between changes in mitochondrial
content and mitochondrial respiration, suggesting that these changes may not be
mediated by the same molecular mechanisms.
Mitochondrial respiration is a good determinant of baseline endurance
performance, but is not strongly associated with training-induced changes in
endurance performance.
Chapter 3:
Training volume is an important determinant of exercise-induced changes in
mitochondrial content
Increased mass-specific mitochondrial respiration following INT was the result of
an increase in mitochondrial content, as indicated by the unchanged mt-specific
respiration.
Following a reduction in training volume, mass-specific mitochondrial respiration
is reversed more rapidly than mitochondrial content, providing further evidence
that these two parameters are not necessarily associated.
Training-induced mitochondrial adaptations are rapidly reversed following a
period of reduced training, suggesting that maintenance of the training stimulus is
necessary to preserve the gains obtained during exercise training.
Changes in the protein content of TFAM may be primarily associated with
changes in mitochondrial content, whereas, consistent with results from Chapter

Conclusions & Future Directions
167
2, changes in the protein content of PGC-1, p53 and PHF20 seem to be
associated with changes in mass-specific mitochondrial respiration.
Human skeletal muscle is a remarkably plastic tissue, rapidly adapting to changes
in training stimulus and to the metabolic and energy requirements of the cell.
Chapter 4:
Exercise intensity is an important determinant of the induction of the initial
adaptive response to exercise mediated by PGC-1α, as demonstrated by the rapid
increase in the nuclear content of PGC-1 following SIT, but not STCT.
p53 protein content is increased in the nucleus immediately following exercise,
suggesting that nuclear accumulation of p53 may mediate the initial phase of the
p53-regulated response to exercise in human skeletal muscle.
Nuclear PHF20 protein content also increased immediately post-exercise,
indicating that nuclear accumulation of p53 following exercise may relate to
increased p53 stability, an effect that could be mediated by an increase in the
PHF20-p53 interaction [65].
Exercise intensity is also an important determinant of the exercise-induced
phosphorylation of p53 at serine 15 in the nucleus, a post-translational event also
associated with increased p53 stability and activity [71].
The greater physiological stress associated with SIT may play an important role
in the regulation of both the PGC-1 and p53 response to exercise.
5.2 The role of exercise intensity: findings and future directions
This research has provided extensive evidence that exercise intensity is an important
factor regulating exercise- and training-induced changes in markers of mitochondrial

Conclusions & Future Directions
168
biogenesis. Specifically, study 1 (described in Chapter 2) showed that 4 weeks of SIT,
but not STCT or HIIT, induced an increase in mitochondrial respiration. It has been
shown that mitochondrial oxidative capacity is in excess of maximal oxygen delivery in
humans [28]; however, this study shows that maximal-intensity training was still able to
increase mitochondrial respiration, despite this apparent overcapacity. Future research
aiming to explain this phenomenon is warranted. While only maximal training intensity
was associated with an increase in mitochondrial respiration, previous studies have shown
that lower training intensities can induce an increase in mitochondrial respiration [67,
127, 324]. It must also be noted that the training intensity associated with HIIT in this
research, which did not induce an increase in mitochondrial respiration, was 89% of
WPeak, whereas previous studies observing an increase in mitochondrial respiration
adopted a training intensity of ~105-120% of WPeak. Therefore, it is important that future
research attempts to determine if an intensity threshold is required to promote changes in
mitochondrial respiration, and if individuals’ fitness levels may influence these changes.
A key finding of this research was that SIT improved mt-specific respiration, an indicator
of mitochondrial quality. While previous cross-sectional research observed differences in
mitochondrial quality (as well as quantity) across a range of aerobic fitness levels [128],
this research is the first to show that improvements in mitochondrial quality can be
achieved in as little as four weeks. Considering SIT was associated with a training
intensity of ~200% of WPeak, and that training intensities of ~105-120% of WPeak [67, 127,
324] did not results in increased mt-specific respiration, future research should aim to
determine if only maximal training intensity results in an improved mitochondrial quality,
or if lower training intensities are still able to provide the same benefits.
The study described in Chapter 2 also showed an apparent dissociation between
mitochondrial content and mitochondrial respiration, consistent with previous finding in
mouse skeletal muscle [252]. While leading authors in the field have clearly suggested
that “it is important and necessary to differentiate mitochondrial content from function in
future studies” [128], this research provides the first evidence of such apparent
dissociations in human skeletal muscle. It is important for future research to better
understand the mechanisms behind this dissociation. This could be achieved by assessing
the exercise-induced regulation of mitochondrial quality [353], in parallel with direct

Conclusions & Future Directions
169
measurement of mitochondrial content by TEM. Given evidence is starting to emerge
about the effects of exercise on the modulation of mitochondrial turnover processes such
as autophagy [173, 198, 268], and mitochondrial morphology [42, 224, 266], future
research should focus on these topics, and also try to define the role of training intensity
(and training volume) on these important mechanisms. The exercise-induced replacement
of damaged proteins with de novo synthesised ones, would also induce an increase in
mitochondrial respiration without a change in mitochondrial content [173]. Therefore,
measurements of mitochondrial protein synthesis [61] and degradation should also be
integrated in future training studies investigating if training intensity (and training
volume) modulate this dissociation in human skeletal muscle.
From a cellular standpoint, this research suggests that the transcription factors PGC-1,
p53, and PHF20 may be more strongly associated with changes in mitochondrial
respiration than mitochondrial content. While studies investigating the transcriptional
activity of PGC-1 and p53 are extensive, research on their role as regulators of
metabolism [140, 181, 329] and mitochondrial turnover [42, 77, 266, 320] is starting to
emerge. A better understanding of their metabolic and mitochondrial turnover regulatory
function would not only help explain their associations with improved mitochondrial
respiration, but could also explain the dissociation between mitochondrial function and
content. It is known that exercise intensity dictates the number and type of fibres recruited
during exercise [327]; therefore a better understanding of the mechanisms of activation
of PGC-1 and p53 transcriptional and regulatory activity in single muscle fibres in
response to different exercise intensities is required.
Results from the study described in Chapter 4 seem to confirm that the initial phase of the
exercise-induced adaptive response may be modulated by increased nuclear content of
PGC-1 [351]. Moreover, this is the first research to show that this modulation is affected
by exercise intensity. In addition, and for the first time in human skeletal muscle, this
study demonstrates that nuclear p53 protein content is also rapidly increased following
exercise (although the intensity effect did not reach significance). This suggests that
nuclear activation of p53, similar to PGC-1, may represent the initial phase of the
adaptive response to exercise. Future research is needed to test this hypothesis. This study
also provides preliminary evidence that the increase in nuclear p53 may have been the

Conclusions & Future Directions
170
result of increased p53 stability, as suggested by the increase in nuclear PHF20 [65].
Similarly, increased phosphorylation of p53 at serine 15 is also indicative of enhanced
p53 stability [289] as well as an increase in p53 activity [71]. This is the first report to
show that in human skeletal muscle the physiological stress associated with exercise may
induce p53 stabilisation, and promote the activation of the p53 response, in agreement
with the notion that cellular stress is an activator of p53 [215]. Contrary to the increase in
p53 and PHF20 however, the nuclear increase in p-p53Ser15 showed a significant effect of
exercise intensity. Considering these events are closely linked, future research should aim
to reveal the cellular mechanisms leading to this differentiations. Finally, not only
increased stability, but also nuclear translocation, may represent a possible mechanism
for nuclear p53 accumulation. While this has been demonstrated in cells [177], future
research is needed to better understand the effects of exercise on the MDM2-mediated
inhibitory effect on p53 [105] and how this would influence p53 stability and
nuclear/cytosolic shuttling.
5.3 The role of training volume: findings and future directions
Study 2 (described in Chapter 3) clearly highlights that human skeletal muscle is a
remarkably plastic tissue, rapidly adapting to changes in training stimulus and to the
metabolic and energy requirements of the cell. A key finding of this study was that
exercise volume is an important factor regulating training-induced changes in markers of
mitochondrial content. Specifically, it was shown that 3 weeks of a very large training
volume induced an increase in CS activity and the protein content of subunits of the ETS,
two valid biomarkers of mitochondrial content [145]. Future research employing TEM,
which provides a direct measurement of mitochondrial content, would further strengthen
this hypothesis. Moreover, and contrary to the initial hypotheses and previous literature
[99], the large training volume in study 2 did not reduce endurance performance nor
markers of mitochondrial biogenesis. The likely explanation for these findings may relate
to CHO supplementation having delayed the symptoms of overreaching [100]. While this
constitutes a finding in itself (i.e., the symptoms of overreaching may be prevented, or at

Conclusions & Future Directions
171
least delayed, if high CHO levels during a period of intensified training are maintained),
future research is needed to confirm these hypotheses.
This research shows that a large training volume was also associated with an increase in
mass-specific mitochondrial respiration. However, in contrast to a greater training
intensity, which induced an increase in mt-specific respiration, an increase in training
volume did not alter mt-specific respiration. These findings indicate that training volume
induces improvements in mitochondrial respiration by an effect mediated by increased
mitochondrial content (unchanged mitochondrial quality). When combined, findings
from study 1 and 2 suggest that mitochondrial respiration can be improved either as an
effect of higher training intensity (resulting in increased mt-specific respiration), or as an
effect of larger training volumes (resulting in unchanged mt-specific respiration). These
findings also indicate that when training intensity is similar (HIIT in study 1 and INT in
study 2), a marked increase in training volume represents a sufficient stimulus to improve
mitochondrial respiration. Further research confirming these hypotheses is required.
Another important finding from study 2 is that training-induced mitochondrial
adaptations are rapidly reversed following a period of reduced training, as all the
parameters measured in the muscle (except for CS activity) were not different from
baseline after the 2-week reduced-volume phase. This clearly highlights that maintenance
of the training stimulus is necessary to preserve the gains obtained during exercise
training. Future research investigating the kinetics and mechanisms of this reversibility is
required. The different kinetics of reversibility between mitochondrial content and
mitochondrial respiration presented in study 2, further confirmed the presence of an
apparent dissociations between these two parameters. The reader is referred to section 5.2
for a discussion on this topic
This study also indicates that the protein content of key transcription factors associated
with mitochondrial biogenesis rapidly responded to a large increase (and a reduction) in
training volume. Specifically, study 2 shows that changes in the protein content of TFAM
may be primarily associated with changes in mitochondrial content, and confirms results
from study 1 about a possible association between changes in the protein content of PGC-
1, p53, and PHF20 and mass-specific mitochondrial respiration. Moreover, the similar
changes in the protein content of PGC-1, NRF1 and TFAM suggest that training volume

Conclusions & Future Directions
172
may increase mitochondrial content through the activation of the PGC-1-NRF1-TFAM
axis [352, 122]. Considering that the relationships between transcription factors and
markers of mitochondrial biogenesis suggested above can, for obvious reasons, only be
associative in human skeletal muscle, future research in cell or animal models is needed
to provide a clear mechanistic insight confirming these hypotheses.
5.4 Significance and practical applications
This research has helped define the role of training intensity and volume in the adaptive
response to endurance exercise, and has provided important mechanistic insights into the
cellular processes involved. The above findings provide an important contribution to the
body of available literature, and will have a significant impact in the design of therapeutic
exercise protocols and athletic training programs.
In a society plagued by diseases linked with mitochondrial dysfunction [164, 168, 197,
339], the increased knowledge provided by this thesis could represent a powerful tool for
the prevention and treatment of an ever-growing number of lifestyle and metabolic
diseases. Prevention and management of these diseases would undoubtedly help relieve
the health and economic burden of the 21st century society.
Moreover, the greater financial incentives and growing pressure on elite athletes to
perform at a high level, have brought an increased focus on developing new training
strategies to optimise training-induced adaptations. Given the pivotal role of training
intensity and training volume in the design of athletic training programs [12], the findings
of this research provide information that will influence and improve the current best
practice.

173
References
1. Achanta, G., Sasaki, R., Feng, L., Carew, J.S., Lu, W., Pelicano, H., Keating, M.J.
& Huang, P. 2005. Novel role of p53 in maintaining mitochondrial genetic
stability through interaction with DNA Pol γ. EMBO Journal, 24, 3482-3492.
2. Adhihetty, P.J., Ljubicic, V., Menzies, K.J. & Hood, D.A. 2005. Differential
susceptibility of subsarcolemmal and intermyofibrillar mitochondria to apoptotic
stimuli. American Journal of Physiology - Cell Physiology, 289, C994-C1001.
3. Adhihetty, P.J., O'Leary, M.F.N. & Hood, D.A. 2008. Mitochondria in skeletal
muscle: Adaptable rheostats of apoptotic susceptibility. Exercise and Sport
Sciences Reviews, 36, 116-121.
4. Adhihetty, P.J., Taivassalo, T., Haller, R.G., Walkinshaw, D.R. & Hood, D.A.
2007. The effect of training on the expression of mitochondrial biogenesis- and
apoptosis-related proteins in skeletal muscle of patients with mtDNA defects.
American Journal of Physiology - Endocrinology and Metabolism, 293, E672-
E680.
5. Adhihetty, P.J., Uguccioni, G., Leick, L., Hidalgo, J., Pilegaard, H. & Hood, D.A.
2009. The role of PGC-1α on mitochondrial function and apoptotic susceptibility
in muscle. American Journal of Physiology - Cell Physiology, 297, C217-C225.
6. Akimoto, T., Pohnert, S.C., Li, P., Zhang, M., Gumbs, C., Rosenberg, P.B.,
Williams, R.S. & Yan, Z. 2005. Exercise stimulates Pgc-1α transcription in
skeletal muscle through activation of the p38 MAPK pathway. Journal of
Biological Chemistry, 280, 19587-19593.
7. Akimoto, T., Sorg, B.S. & Yan, Z. 2004. Real-time imaging of peroxisome
proliferator-activated receptor-γ coactivator-1α promoter activity in skeletal
muscles of living mice. American Journal of Physiology - Cell Physiology, 287,
C790-C796.
8. Amat, R., Planavila, A., Chen, S.L., Iglesias, R., Giralt, M. & Villarroya, F. 2009.
SIRT1 controls the transcription of the peroxisome proliferator-activated
receptor-γ co-activator-1α(PGC-1α) gene in skeletal muscle through the PGC-1α
autoregulatory loop and interaction with MyoD. Journal of Biological Chemistry,
284, 21872-21880.
9. Anderson, R.M., Barger, J.L., Edwards, M.G., Braun, K.H., O'Connor, C.E.,
Prolla, T.A. & Weindruch, R. 2008. Dynamic regulation of PGC-1α localization

References
174
and turnover implicates mitochondrial adaptation in calorie restriction and the
stress response. Aging Cell, 7, 101-111.
10. Aquilano, K., Baldelli, S., Pagliei, B., Cannata, S.M., Rotilio, G. & Ciriolo, M.R.
2013. P53 orchestrates the PGC-1α-mediated antioxidant response upon mild
redox and metabolic imbalance. Antioxidants and Redox Signaling, 18, 386-399.
11. Aquilano, K., Vigilanza, P., Baldelli, S., Pagliei, B., Rotilio, G. & Ciriolo, M.R.
2010. Peroxisome Proliferator-activated Receptor gamma Co-activator 1 alpha
(PGC-1 alpha) and Sirtuin 1 (SIRT1) Reside in Mitochondria - Possible direct
function in mitochondrial biogenesis. Journal of Biological Chemistry, 285,
21590-21599.
12. Astrand, P.O. & Rodahl, K. 1986. Textbook of Work Physiology. McGraw Hill,
New York,.
13. Baar, K., Wende, A.R., Jones, T.E., Marison, M., Nolte, L.A., Chen, M., Kelly,
D.P. & Holloszy, J.O. 2002. Adaptations of skeletal muscle to exercise: Rapid
increase in the transcriptional coactivator PGC-1. FASEB Journal, 16, 1879-1886.
14. Bakkman, L., Sahlin, K., Holmberg, H.C. & Tonkonogi, M. 2007. Quantitative
and qualitative adaptation of human skeletal muscle mitochondria to hypoxic
compared with normoxic training at the same relative work rate. Acta
Physiologica, 190, 243-251.
15. Baldwin, J., Snow, R.J. & Febbraio, M.A. 2000. Effect of training status and
relative exercise intensity on physiological responses in men. Medicine and
Science in Sports and Exercise, 32, 1648-1654.
16. Barja, G. 1999. Mitochondrial oxygen radical generation and leak: Sites of
production in States 4 and 3, organ specificity, and relation to aging and longevity.
Journal of Bioenergetics and Biomembranes, 31, 347-366.
17. Barnett, C., Carey, M., Proietto, J., Cerin, E., Febbraio, M.A. & Jenkins, D. 2004.
Muscle metabolism during sprint exercise in man: Influence of sprint training.
Journal of Science and Medicine in Sport, 7, 314-322.
18. Bartlett, J.D., Joo, C.H., Jeong, T.S., Louhelainen, J., Cochran, A.J., Gibala, M.J.,
Gregson, W., Close, G.L., Drust, B. & Morton, J.P. 2012. Matched work high-
intensity interval and continuous running induce similar increases in PGC-1α
mRNA, AMPK, p38, and p53 phosphorylation in human skeletal muscle. Journal
of Applied Physiology, 112, 1135-1143.
19. Bartlett, J.D., Louhelainen, J., Iqbal, Z., Cochran, A.J., Gibala, M.J., Gregson, W.,
Close, G.L., Drust, B. & Morton, J.P. 2013. Reduced carbohydrate availability

References
175
enhances exercise-induced p53 signaling in human skeletal muscle: implications
for mitochondrial biogenesis. American journal of physiology. Regulatory,
integrative and comparative physiology, 304, R450-458.
20. Bassett Jr, D.R. & Howley, E.T. 2000. Limiting factors for maximum oxygen
uptake and determinants of endurance performance. Medicine and Science in
Sports and Exercise, 32, 70-84.
21. Bengtsson, J., Gustafsson, T., Widegren, U., Jansson, E. & Sundberg, C.J. 2001.
Mitochondrial transcription factor A and respiratory complex IV increase in
response to exercise training in humans. Pflugers Archiv European Journal of
Physiology, 443, 61-66.
22. Berchtold, M.W., Brinkmeier, H. & Muntener, M. 2000. Calcium ion in skeletal
muscle: Its crucial role for muscle function, plasticity, and disease. Physiological
Reviews, 80 (3) 1215-1265.
23. Bergeaud, M., Mathieu, L., Guillaume, A., Moll, U.M., Mignotte, B., Le Floch,
N., Vayssière, J.L. & Rincheval, V. 2013. Mitochondrial p53 mediates a
transcription-independent regulation of cell respiration and interacts with the
mitochondrial F1F0-ATP synthase. Cell Cycle, 12, 3781-3793.
24. Bergeron, R., Ren, J.M., Cadman, K.S., Moore, I.K., Perret, P., Pypaert, M.,
Young, L.H., Semenkovich, C.F. & Shulman, G.I. 2001. Chronic activation of
AMP kinase results in NRF-1 activation and mitochondrial biogenesis. American
Journal of Physiology - Endocrinology and Metabolism, 281, E1340-E1346.
25. Bishop, D., Jenkins, D.G., McEniery, M. & Carey, M.F. 2000. Relationship
between plasma lactate parameters and muscle characteristics in female cyclists.
Medicine and Science in Sports and Exercise, 32, 1088-1093.
26. Bishop, D.J., Granata, C. & Eynon, N. 2014. Can we optimise the exercise training
prescription to maximise improvements in mitochondria function and content?
Biochimica Et Biophysica Acta-General Subjects, 1840, 1266-1275.
27. Booth, F.W. & Holloszy, J.O. 1977. Cytochrome c turnover in rat skeletal
muscles. Journal of Biological Chemistry, 252, 416-419.
28. Boushel, R., Gnaiger, E., Calbet, J.A.L., Gonzalez-Alonso, J., Wright-Paradis, C.,
Sondergaard, H., Ara, I., Helge, J.W. & Saltin, B. 2011. Muscle mitochondrial
capacity exceeds maximal oxygen delivery in humans. Mitochondrion, 11, 303-
307.

References
176
29. Braun, A.P. & Schulman, H. 1995. The multifunctional calcium/calmodulin-
dependent protein kinase: From form to function. Annual Review of Physiology,
57, 417-445.
30. Brierley, E.J., Johnson, M.A., James, O.F.W. & Turnbull, D.M. 1996. Effects of
physical activity and age on mitochondrial function. QJM - Monthly Journal of
the Association of Physicians, 89, 251-258.
31. Bruce, C.R., Anderson, M.J., Carey, A.L., Newman, D.G., Bonen, A., Kriketos,
A.D., Cooney, G.J. & Hawley, J.A. 2003. Muscle Oxidative Capacity Is a Better
Predictor of Insulin Sensitivity than Lipid Status. Journal of Clinical
Endocrinology and Metabolism, 88, 5444-5451.
32. Bruce, C.R., Kriketos, A.D., Cooney, G.J. & Hawley, J.A. 2004. Disassociation
of muscle triglyceride content and insulin sensitivity after exercise training in
patients with Type 2 diabetes. Diabetologia, 47, 23-30.
33. Bruce, C.R., Thrush, A.B., Mertz, V.A., Bezaire, V., Chabowski, A.,
Heigenhauser, G.J.F. & Dyck, D.J. 2006. Endurance training in obese humans
improves glucose tolerance and mitochondrial fatty acid oxidation and alters
muscle lipid content. American Journal of Physiology - Endocrinology and
Metabolism, 291, E99-E107.
34. Burgomaster, K.A., Heigenhauser, G.J.F. & Gibala, M.J. 2006. Effect of short-
term sprint interval training on human skeletal muscle carbohydrate metabolism
during exercise and time-trial performance. Journal of Applied Physiology, 100,
2041-2047.
35. Burgomaster, K.A., Howarth, K.R., Phillips, S.M., Rakobowchuk, M.,
Macdonald, M.J., McGee, S.L. & Gibala, M.J. 2008. Similar metabolic
adaptations during exercise after low volume sprint interval and traditional
endurance training in humans. Journal of Physiology, 586, 151-160.
36. Burgomaster, K.A., Hughes, S.C., Heigenhauser, G.J.F., Bradwell, S.N. & Gibala,
M.J. 2005. Six sessions of sprint interval training increases muscle oxidative
potential and cycle endurance capacity in humans. Journal of Applied Physiology,
98, 1985-1990.
37. Calvo, J.A., Daniels, T.G., Wang, X., Paul, A., Lin, J., Spiegelman, B.M.,
Stevenson, S.C. & Rangwala, S.M. 2008. Muscle-specific expression of PPARγ
coactivator-1α improves exercise performance and increases peak oxygen uptake.
Journal of Applied Physiology, 104, 1304-1312.
38. Canto, C. 2012. Targeting Sirtuin 1 to Improve Metabolism: All You Need Is
NAD+?

References
177
39. Canto, C. & Auwerx, J. 2010. AMP-activated protein kinase and its downstream
transcriptional pathways. Cellular and Molecular Life Sciences, 67, 3407-3423.
40. Cantó, C., Gerhart-Hines, Z., Feige, J.N., Lagouge, M., Noriega, L., Milne, J.C.,
Elliott, P.J., Puigserver, P. & Auwerx, J. 2009. AMPK regulates energy
expenditure by modulating NAD + metabolism and SIRT1 activity. Nature, 458,
1056-1060.
41. Carter, S.L., Rennie, C.D., Hamilton, S.J. & Tarnopolsky, M.A. 2001. Changes in
skeletal muscle in males and females following endurance training. Canadian
Journal of Physiology and Pharmacology, 79, 386-392.
42. Cartoni, R., Léger, B., Hock, M.B., Praz, M., Crettenand, A., Pich, S., Ziltener,
J.L., Luthi, F., Dériaz, O., Zorzano, A., Gobelet, C., Kralli, A. & Russell, A.P.
2005. Mitofusins 1/2 and ERRα expression are increased in human skeletal
muscle after physical exercise. Journal of Physiology, 567, 349-358.
43. Chen, D., Bruno, J., Easlon, E., Lin, S.J., Cheng, H.L., Alt, F.W. & Guarente, L.
2008. Tissue-specific regulation of SIRT1 by calorie restriction. Genes and
Development, 22, 1753-1757.
44. Chen, G., Carroll, S., Racay, P., Dick, J., Pette, D., Traub, I., Vrbova, G., Eggli,
P., Celio, M. & Schwaller, B. 2001. Deficiency in parvalbumin increases fatigue
resistance in fast-twitch muscle and upregulates mitochondria. American Journal
of Physiology - Cell Physiology, 281, C114-C122.
45. Chen, Y.W., Nader, G.A., Baar, K.R., Fedele, M.J., Hoffman, E.P. & Esser, K.A.
2002. Response of rat muscle to acute resistance exercise defined by
transcriptional and translational profiling. Journal of Physiology, 545, 27-41.
46. Chen, Z., Gibson, T.B., Robinson, F., Silvestro, L., Pearson, G., Xu, B., Wright,
A., Vanderbilt, C. & Cobb, M.H. 2001. MAP Kinases. Cemical Reviews, 101,
2449-2476.
47. Chen, Z.P., Stephens, T.J., Murthy, S., Canny, B.J., Hargreaves, M., Witters, L.A.,
Kemp, B.E. & McConell, G.K. 2003. Effect of exercise intensity on skeletal
muscle AMPK signaling in humans. Diabetes, 52, 2205-2212.
48. Chesley, A., Heigenhauser, G.J.F. & Spriet, L.L. 1996. Regulation of muscle
glycogen phosphorylase activity following short-term endurance training.
American Journal of Physiology, 270, E328-E335.
49. Chi, M.M., Hintz, C.S., Coyle, E.F., Martin 3rd, W.H., Ivy, J.L., Nemeth, P.M.,
Holloszy, J.O. & Lowry, O.H. 1983. Effects of detraining on enzymes of energy

References
178
metabolism in individual human muscle fibers. The American journal of
physiology, 244, C276-287.
50. Chin, E.R. 2004. The role of calcium and calcium/calmodulin-dependent kinases
in skeletal muscle plasticity and mitochondrial biogenesis. Proceedings of the
Nutrition Society, 63, 279-286.
51. Chin, E.R. 2005. Role of Ca2+/calmodulin-dependent kinases in skeletal muscle
plasticity. Journal of Applied Physiology, 99, 414-423.
52. Chipuk, J.E. & Green, D.R. 2006. Dissecting p53-dependent apoptosis. Cell
Death and Differentiation, 13, 994-1002.
53. Cluberton, L.J., McGee, S.L., Murphy, R.M. & Hargreaves, M. 2005. Effect of
carbohydrate ingestion on exercise-induced alterations in metabolic gene
expression. Journal of Applied Physiology, 99, 1359-1363.
54. Cochran, A.J.R., Little, J.P., Tarnopolsky, M.A. & Gibala, M.J. 2010.
Carbohydrate feeding during recovery alters the skeletal muscle metabolic
response to repeated sessions of high-intensity interval exercise in humans.
Journal of Applied Physiology, 108, 628-636.
55. Cochran, A.J.R., Percival, M.E., Tricarico, S., Little, J.P., Cermak, N., Gillen,
J.B., Tarnopolsky, M.A. & Gibala, M.J. 2014. Intermittent and continuous high-
intensity exercise training induce similar acute but different chronic muscle
adaptations. Experimental Physiology, 99, 782-791.
56. Coffey, V.G. & Hawley, J.A. 2007. The Molecular Bases of Training Adaptation.
Sports Medicine, 37, 737-763.
57. Coffey, V.G., Zhong, Z., Shield, A., Canny, B.J., Chibalin, A.V., Zierath, J.R. &
Hawley, J.A. 2006. Early signaling responses to divergent exercise stimuli in
skeletal muscle from well-trained humans. FASEB Journal, 20, 190-192.
58. Coggan, A.R., Spina, R.J., King, D.S., Rogers, M.A., Brown, M., Nemeth, P.M.
& Holloszy, J.O. 1992. Skeletal muscle adaptations to endurance training in 60-
to 70-yr-old men and women. Journal of Applied Physiology, 72, 1780-1786.
59. Cogswell, A.M., Stevens, R.J. & Hood, D.A. 1993. Properties of skeletal muscle
mitochondria isolated from subsarcolemmal and intermyofibrillar regions.
American Journal of Physiology - Cell Physiology, 264, C383-C389.
60. Conley, K.E., Amara, C.E., Jubrias, S.A. & Marcinek, D.J. 2007. Mitochondrial
function, fibre types and ageing: New insights from human muscle in vivo.
Experimental Physiology, 92, 333-339.

References
179
61. Connor, M.K., Bezborodova, O., Escobar, C.P. & Hood, D.A. 2000. Effect of
contractile activity on protein turnover in skeletal muscle mitochondrial
subfractions. Journal of Applied Physiology, 88, 1601-1606.
62. Costill, D.L., Fink, W.J., Hargreaves, M., King, D.S., Thomas, R. & Fielding, R.
1985. Metabolic characteristics of skeletal muscle during detraining from
competitive swimming. Medicine and Science in Sports and Exercise, 17, 339-
343.
63. Crane, J.D., Devries, M.C., Safdar, A., Hamadeh, M.J. & Tarnopolsky, M.A.
2010. The effect of aging on human skeletal muscle mitochondrial and
intramyocellular lipid ultrastructure. Journals of Gerontology - Series A
Biological Sciences and Medical Sciences, 65, 119-128.
64. Crick, F. 1970. Central dogma of molecular biology. Nature, 227, 561-563.
65. Cui, G., Park, S., Badeaux, A.I., Kim, D., Lee, J., Thompson, J.R., Yan, F.,
Kaneko, S., Yuan, Z., Botuyan, M.V., Bedford, M.T., Cheng, J.Q. & Mer, G.
2012. PHF20 is an effector protein of p53 double lysine methylation that stabilizes
and activates p53. Nature Structural and Molecular Biology, 19, 916-924.
66. Czubryt, M.P., McAnally, J., Fishman, G.I. & Olson, E.N. 2003. Regulation of
peroxisome proliferator-activated receptor γ coactivator 1α (PGC-1α) and
mitochondrial function by MEF2 and HDAC5. Proceedings of the National
Academy of Sciences of the United States of America, 100, 1711-1716.
67. Daussin, F.N., Zoll, J., Dufour, S.P., Ponsot, E., Lonsdorfer-Wolf, E., Doutreleau,
S., Mettauer, B., Piquard, F., Geny, B. & Richard, R. 2008. Effect of interval
versus continuous training on cardiorespiratory and mitochondrial functions:
Relationship to aerobic performance improvements in sedentary subjects.
American Journal of Physiology - Regulatory Integrative and Comparative
Physiology, 295, R264-R272.
68. Daussin, F.N., Zoll, J., Ponsot, E., Dufour, S.P., Doutreleau, S., Lonsdorfer, E.,
Ventura-Clapier, R., Mettauer, B., Piquard, F., Geny, B. & Richard, R. 2008.
Training at high exercise intensity promotes qualitative adaptations of
mitochondrial function in human skeletal muscle. Journal of Applied Physiology,
104, 1436-1441.
69. De Filippis, E., Alvarez, G., Berria, R., Cusi, K., Everman, S., Meyer, C. &
Mandarino, L.J. 2008. Insulin-resistant muscle is exercise resistant: Evidence for
reduced response of nuclear-encoded mitochondrial genes to exercise. American
Journal of Physiology - Endocrinology and Metabolism, 294, E607-E614.

References
180
70. Dubouchaud, H., Butterfield, G.E., Wolfel, E.E., Bergman, B.C. & Brooks, G.A.
2000. Endurance training, expression, and physiology of LDH, MCT1, and MCT4
in human skeletal muscle. American Journal of Physiology - Endocrinology and
Metabolism, 278, E571-E579.
71. Dumaz, N. & Meek, D.W. 1999. Serine 15 phosphorylation stimulates p53
transactivation but does not directly influence interaction with HDM2. EMBO
Journal, 18, 7002-7010.
72. Edgett, B.A., Foster, W.S., Hankinson, P.B., Simpson, C.A., Little, J.P., Graham,
R.B. & Gurd, B.J. 2013. Dissociation of Increases in PGC-1α and Its Regulators
from Exercise Intensity and Muscle Activation Following Acute Exercise. PLoS
ONE, 8.
73. Egan, B., Carson, B.P., Garcia-Roves, P.M., Chibalin, A.V., Sarsfield, F.M.,
Barron, N., McCaffrey, N., Moyna, N.M., Zierath, J.R. & O'Gorman, D.J. 2010.
Exercise intensity-dependent regulation of peroxisome proliferator-activated
receptor γ coactivator-1α mRNA abundance is associated with differential
activation of upstream signalling kinases in human skeletal muscle. Journal of
Physiology, 588, 1779-1790.
74. Egan, B., O'Connor, P.L., Zierath, J.R. & O'Gorman, D.J. 2013. Time Course
Analysis Reveals Gene-Specific Transcript and Protein Kinetics of Adaptation to
Short-Term Aerobic Exercise Training in Human Skeletal Muscle. PLoS ONE, 8.
75. Egan, B. & Zierath, J.R. 2013. Exercise metabolism and the molecular regulation
of skeletal muscle adaptation. Cell Metabolism, 17, 162-184.
76. Falkenberg, M., Larsson, N.G. & Gustafsson, C.M. 2007. DNA replication and
transcription in mammalian mitochondria. Annual Review of Biochemistry.
77. Feng, Z., Zhang, H., Levine, A.J. & Jin, S. 2005. The coordinate regulation of the
p53 and mTOR pathways in cells. Proceedings of the National Academy of
Sciences of the United States of America, 102, 8204-8209.
78. Ferraresso, R.L.P., Buscariolli De Oliveira, R., MacEdo, D.V., Alessandro Soares
Nunes, L., Brenzikofer, R., Damas, D. & Hohl, R. 2012. Interaction between
overtraining and the interindividual variability May (Not) trigger muscle
oxidative stress and cardiomyocyte apoptosis in rats. Oxidative Medicine and
Cellular Longevity.
79. Freyssenet, D., Connor, M.K., Takahashi, M. & Hood, D.A. 1999. Cytochrome c
transcriptional activation and mRNA stability during contractile activity in
skeletal muscle. American Journal of Physiology - Endocrinology and
Metabolism, 277, E26-E32.

References
181
80. Gasier, H.G., Fluckey, J.D. & Previs, S.F. 2010. The application of 2H2O to
measure skeletal muscle protein synthesis. Nutrition and Metabolism, 7.
81. Gibala, M.J., Little, J.P., Macdonald, M.J. & Hawley, J.A. 2012. Physiological
adaptations to low-volume, high-intensity interval training in health and disease.
Journal of Physiology, 590, 1077-1084.
82. Gibala, M.J., Little, J.P., van Essen, M., Wilkin, G.P., Burgomaster, K.A., Safdar,
A., Raha, S. & Tarnopolsky, M.A. 2006. Short-term sprint interval versus
traditional endurance training: Similar initial adaptations in human skeletal
muscle and exercise performance. Journal of Physiology, 575, 901-911.
83. Gibala, M.J., McGee, S.L., Garnham, A.P., Howlett, K.F., Snow, R.J. &
Hargreaves, M. 2009. Brief intense interval exercise activates AMPK and p38
MAPK signaling and increases the expression of PGC-1α in human skeletal
muscle. Journal of Applied Physiology, 106, 929-934.
84. Gleyzer, N., Vercauteren, K. & Scarpulla, R.C. 2005. Control of mitochondrial
transcription specificity factors (TFB1M and TFB2M) by nuclear respiratory
factors (NRF-1 and NRF-2) and PGC-1 family coactivators. Molecular and
Cellular Biology, 25, 1354-1366.
85. Gnaiger, E. 2009. Capacity of oxidative phosphorylation in human skeletal
muscle. New perspectives of mitochondrial physiology. International Journal of
Biochemistry and Cell Biology, 41, 1837-1845.
86. Gonzalez, G.A. & Montminy, M.R. 1989. Cyclic AMP stimulates somatostatin
gene transcription by phosphorylation of CREB at serine 133. Cell, 59, 675-680.
87. Gordon, J.W., Rungi, A.A., Inagaki, H. & Hood, D.A. 2001. Selected
contribution: Effects of contractile activity on mitochondrial transcription factor
A expression in skeletal muscle. Journal of Applied Physiology, 90, 389-396.
88. Gorostiaga, E.M., Walter, C.B., Foster, C. & Hickson, R.C. 1991. Uniqueness of
interval and continuous training at the same maintained exercise intensity.
European Journal of Applied Physiology and Occupational Physiology, 63, 101-
107.
89. Green, H., Grant, S., Bombardier, E. & Ranney, D. 1999. Initial aerobic power
does not alter muscle metabolic adaptations to short-term training. American
Journal of Physiology - Endocrinology and Metabolism, 277, E39-E48.
90. Green, H., Tupling, R., Roy, B., O'Toole, D., Burnett, M. & Grant, S. 2000.
Adaptations in skeletal muscle exercise metabolism to a sustained session of
heavy intermittent exercise. Am J Physiol Endocrinol Metab, 278, E118-26.

References
182
91. Green, H.J., Bombardier, E., Burnett, M.E., Smith, I.C., Tupling, S.M. & Ranney,
D.A. 2009. Time-dependent effects of short-term training on muscle metabolism
during the early phase of exercise. American Journal of Physiology - Regulatory
Integrative and Comparative Physiology, 297, R1383-R1391.
92. Green, H.J., Helyar, R., Ball-Burnett, M., Kowalchuk, N., Symon, S. & Farrance,
B. 1992. Metabolic adaptations to training precede changes in muscle
mitochondrial capacity. Journal of Applied Physiology, 72, 484-491.
93. Green, H.J., Jones, S., Ball-Burnett, M.E., Smith, D., Livesey, J. & Farrance, B.W.
1991. Early muscular and metabolic adaptations to prolonged exercise training in
humans. Journal of Applied Physiology, 70, 2032-2038.
94. Greer, E.L., Oskoui, P.R., Banko, M.R., Maniar, J.M., Gygi, M.P., Gygi, S.P. &
Brunet, A. 2007. The energy sensor AMP-activated protein kinase directly
regulates the mammalian FOXO3 transcription factor. Journal of Biological
Chemistry, 282, 30107-30119.
95. Gross, D.N., Wan, M. & Birnbaum, M.J. 2009. The role of FOXO in the
regulation of metabolism. Current Diabetes Reports, 9, 208-214.
96. Gurd, B.J., Perry, C.G., Heigenhauser, G.J., Spriet, L.L. & Bonen, A. 2010. High-
intensity interval training increases SIRT1 activity in human skeletal muscle.
Applied physiology, nutrition, and metabolism = Physiologie appliquée, nutrition
et métabolisme, 35, 350-357.
97. Gurd, B.J., Yoshida, Y., Lally, J., Holloway, G.P. & Bonen, A. 2009. The
deacetylase enzyme SIRT1 is not associated with oxidative capacity in rat heart
and skeletal muscle and its overexpression reduces mitochondrial biogenesis.
Journal of Physiology, 587, 1817-1828.
98. Gurd, B.J., Yoshida, Y., McFarlan, J.T., Holloway, G.P., Moyes, C.D.,
Heigenhauser, G.J.F., Spriet, L. & Bonen, A. 2011. Nuclear SIRT1 activity, but
not protein content, regulates mitochondrial biogenesis in rat and human skeletal
muscle. American Journal of Physiology - Regulatory Integrative and
Comparative Physiology, 301, R67-R75.
99. Halson, S.L., Bridge, M.W., Meeusen, R., Busschaert, B., Gleeson, M., Jones,
D.A. & Jeukendrup, A.E. 2002. Time course of performance changes and fatigue
markers during intensified training in trained cyclists. Journal of Applied
Physiology, 93, 947-956.
100. Halson, S.L., Lancaster, G.I., Achten, J., Gleeson, M. & Jeukendrup, A.E. 2004.
Effects of carbohydrate supplementation on performance and carbohydrate

References
183
oxidation after intensified cycling training. Journal of Applied Physiology, 97,
1245-1253.
101. Handschin, C., Chin, S., Li, P., Liu, F., Maratos-Flier, E., LeBrasseur, N.K., Yan,
Z. & Spiegelman, B.M. 2007. Skeletal muscle fiber-type switching, exercise
intolerance, and myopathy in PGC-1α muscle-specific knock-out animals.
Journal of Biological Chemistry, 282, 30014-30021.
102. Handschin, C., Rhee, J., Lin, J., Tarr, P.T. & Spiegelman, B.M. 2003. An
autoregulatory loop controls peroxisome proliferator-activated receptor γ
coactivator 1α expression in muscle. Proceedings of the National Academy of
Sciences of the United States of America, 100, 7111-7116.
103. Hardie, D.G., Hawley, S.A. & Scott, J.W. 2006. AMP-activated protein kinase -
Development of the energy sensor concept. Journal of Physiology, 574, 7-15.
104. Harmer, A.R., Chisholm, D.J., McKenna, M.J., Hunter, S.K., Ruell, P.A., Naylor,
J.M., Maxwell, L.J. & Flack, J.R. 2008. Sprint training increases muscle oxidative
metabolism during high-intensity exercise in patients with type 1 diabetes.
Diabetes Care, 31, 2097-2102.
105. Haupt, Y., Maya, R., Kazaz, A. & Oren, M. 1997. Mdm2 promotes the rapid
degradation of p53. Nature, 387, 296-299.
106. Hawley, J.A. 2004. Exercise as a therapeutic intervention for the prevention and
treatment of insulin resistance. Diabetes/Metabolism Research and Reviews, 20,
383-393.
107. Hawley, S.A., Davison, M., Woods, A., Davies, S.P., Beri, R.K., Carling, D. &
Hardie, D.G. 1996. Characterization of the AMP-activated protein kinase kinase
from rat liver and identification of threonine 172 as the major site at which it
phosphorylates AMP-activated protein kinase. Journal of Biological Chemistry,
271, 27879-27887.
108. Hawley, S.A., Pan, D.A., Mustard, K.J., Ross, L., Bain, J., Edelman, A.M.,
Frenguelli, B.G. & Hardie, D.G. 2005. Calmodulin-dependent protein kinase
kinase-β is an alternative upstream kinase for AMP-activated protein kinase. Cell
Metabolism, 2, 9-19.
109. Heilbronn, L.K., Seng, K.G., Turner, N., Campbell, L.V. & Chisholm, D.J. 2007.
Markers of mitochondrial biogenesis and metabolism are lower in overweight and
obese insulin-resistant subjects. Journal of Clinical Endocrinology and
Metabolism, 92, 1467-1473.

References
184
110. Hellemans, J., Mortier, G., De Paepe, A., Speleman, F. & Vandesompele, J. 2007.
qBase relative quantification framework and software for management and
automated analysis of real-time quantitative PCR data. Genome biology, 8.
111. Henze, K. & Martin, W. 2003. Essence of mitochondria. Nature, 426, 127-128.
112. Heyne, K., Mannebach, S., Wuertz, E., Knaup, K.X., Mahyar-Roemer, M. &
Roemer, K. 2004. Identification of a putative p53 binding sequence within the
human mitochondrial genome. FEBS Letters, 578, 198-202.
113. Holloszy, J.O. 1967. Biochemical adaptations in muscle. Effects of exercise on
mitochondrial oxygen uptake and respiratory enzyme activity in skeletal muscle.
Journal of Biological Chemistry, 242, 2278-2282.
114. Holloszy, J.O. & Booth, F.W. 1976. Biochemical adaptations to endurance
exercise in muscle. Annual Review of Physiology, 38, 273-291.
115. Hood, D.A. 2001. Invited review: Contractile activity-induced mitochondrial
biogenesis in skeletal muscle. Journal of Applied Physiology, 90, 1137-1157.
116. Hood, D.A. 2009. Mechanisms of exercise-induced mitochondrial biogenesis in
skeletal muscle. Applied Physiology, Nutrition and Metabolism, 34, 465-472.
117. Hood, M.S., Little, J.P., Tarnopolsky, M.A., Myslik, F. & Gibala, M.J. 2011.
Low-volume interval training improves muscle oxidative capacity in sedentary
adults. Medicine and Science in Sports and Exercise, 43, 1849-1856.
118. Hooper, S.L., Mackinnon, L.T., Howard, A., Gordon, R.D. & Bachmann, A.W.
1995. Markers for monitoring overtraining and recovery. Medicine and Science
in Sports and Exercise, 27, 106-112.
119. Hoppeler, H. 1986. Exercise-induced ultrastructural changes in skeletal muscle.
International journal of sports medicine, 7, 187-204.
120. Howarth, K.R., LeBlanc, P.J., Heigenhauser, G.J.F. & Gibala, M.J. 2004. Effect
of endurance training on muscle TCA cycle metabolism during exercise in
humans. Journal of Applied Physiology, 97, 579-584.
121. Iborra, F.J., Kimura, H. & Cook, P.R. 2004. The functional organization of
mitochondrial genomes in human cells. BMC Biology, 2.
122. Irrcher, I., Adhihetty, P.J., Sheehan, T., Joseph, A.M. & Hood, D.A. 2003. PPARγ
coactivator-1α expression during thyroid hormone- and contractile activity-
induced mitochondrial adaptations. American Journal of Physiology - Cell
Physiology, 284, C1669-C1677.

References
185
123. Irrcher, I., Ljubicic, V. & Hood, D.A. 2009. Interactions between ROS and AMP
kinase activity in the regulation of PGC-1α transcription in skeletal muscle cells.
American Journal of Physiology - Cell Physiology, 296, C116-C123.
124. Irrcher, I., Ljubicic, V., Kirwan, A.F. & Hood, D.A. 2008. AMP-Activated Protein
Kinase-Regulated Activation of the PGC-1α Promoter in Skeletal Muscle Cells.
PLoS ONE, 3.
125. Irving, B.A., Short, K.R., Nair, K.S. & Stump, C.S. 2011. Nine days of intensive
exercise training improves mitochondrial function but not insulin action in adult
offspring of mothers with type 2 diabetes. Journal of Clinical Endocrinology and
Metabolism, 96, E1137-E1141.
126. Jacobs, I., Esbjornsson, M., Sylven, C., Holm, I. & Jansson, E. 1987. Sprint
training effects on muscle myoglobin, enzymes, fiber types, and blood lactate.
Medicine and Science in Sports and Exercise, 19, 368-374.
127. Jacobs, R.A., Flück, D., Bonne, T.C., Bürgi, S., Christensen, P.M., Toigo, M. &
Lundby, C. 2013. Improvements in exercise performance with high-intensity
interval training coincide with an increase in skeletal muscle mitochondrial
content and function. Journal of Applied Physiology, 115, 785-793.
128. Jacobs, R.A. & Lundby, C. 2013. Mitochondria express enhanced quality as well
as quantity in association with aerobic fitness across recreationally active
individuals up to elite athletes. Journal of Applied Physiology, 114, 344-350.
129. Jacobs, R.A., Rasmussen, P., Siebenmann, C., Díaz, V., Gassmann, M., Pesta, D.,
Gnaiger, E., Nordsborg, N.B., Robach, P. & Lundby, C. 2011. Determinants of
time trial performance and maximal incremental exercise in highly trained
endurance athletes. Journal of Applied Physiology, 111, 1422-1430.
130. Jäger, S., Handschin, C., St-Pierre, J. & Spiegelman, B.M. 2007. AMP-activated
protein kinase (AMPK) action in skeletal muscle via direct phosphorylation of
PGC-1α. Proceedings of the National Academy of Sciences of the United States
of America, 104, 12017-12022.
131. Jansson, E. & Kaijser, L. 1977. Muscle adaptation to extreme endurance training
in man. Acta Physiologica Scandinavica, 100, 315-324.
132. Jeppesen, J., Jordy, A.B., Sjøberg, K.A., Füllekrug, J., Stahl, A., Nybo, L. &
Kiens, B. 2012. Enhanced fatty acid oxidation and FATP4 protein expression after
endurance exercise training in human skeletal muscle. PLoS ONE, 7.
133. Ji, L.L., Gomez-Cabrera, M.C. & Vina, J. 2006. Exercise and hormesis:
Activation of cellular antioxidant signaling pathway.

References
186
134. Jobsis, F.F. 1977. Noninvasive, infrared monitoring of cerebral and myocardial
oxygen sufficiency and circulatory parameters. Science, 198, 1264-1267.
135. Johnson, M.L., Robinson, M.M. & Nair, K.S. 2013. Skeletal muscle aging and the
mitochondrion. Trends Endocrinol Metab, 24, 247-56.
136. Jones, R.G., Plas, D.R., Kubek, S., Buzzai, M., Mu, J., Xu, Y., Birnbaum, M.J. &
Thompson, C.B. 2005. AMP-activated protein kinase induces a p53-dependent
metabolic checkpoint. Molecular Cell, 18, 283-293.
137. Jørgensen, S.B., Richter, E.A. & Wojtaszewski, J.F.P. 2006. Role of AMPK in
skeletal muscle metabolic regulation and adaptation in relation to exercise.
Journal of Physiology, 574, 17-31.
138. Kadaja, L., Eimre, M., Paju, K., Roosimaa, M., Põdramägi, T., Kaasik, P., Pehme,
A., Orlova, E., Mudist, M., Peet, N., Piirsoo, A., Seene, T., Gellerich, F.N. &
Seppet, E.K. 2010. Impaired oxidative phosphorylation in overtrained rat
myocardium. Experimental and Clinical Cardiology, 15, e116-e127.
139. Kastan, M.B., Onyekwere, O., Sidransky, D., Vogelstein, B. & Craig, R.W. 1991.
Participation of p53 protein in the cellular response to DNA damage. Cancer
Research, 51, 6304-6311.
140. Kim, S.H., Koh, J.H., Higashida, K., Jung, S.R., Holloszy, J.O. & Han, D.H. 2014.
PGC-1alpha Mediates a Rapid, Exercise-Induced Down Regulation of
Glycogenolysis in Rat Skeletal Muscle. J Physiol.
141. Knutti, D. & Kralli, A. 2001. PGC-1, a versatile coactivator. Trends in
Endocrinology and Metabolism, 12, 360-365.
142. Knutti, D., Kressler, D. & Kralli, A. 2001. Regulation of the transcriptional
coactivator PGC-1 via MAPK-sensitive interaction with a repressor. Proceedings
of the National Academy of Sciences of the United States of America, 98, 9713-
9718.
143. Konopka, A.R., Suer, M.K., Wolff, C.A. & Harber, M.P. 2014. Markers of human
skeletal muscle mitochondrial biogenesis and quality control: Effects of age and
aerobic exercise training. Journals of Gerontology - Series A Biological Sciences
and Medical Sciences, 69, 371-378.
144. Kulawiec, M., Ayyasamy, V. & Singh, K.K. 2009. p53 regulates mtDNA copy
number and mitocheckpoint pathway. Journal of Carcinogenesis, 8.
145. Larsen, S., Nielsen, J., Hansen, C.N., Nielsen, L.B., Wibrand, F., Stride, N.,
Schroder, H.D., Boushel, R., Helge, J.W., Dela, F. & Hey-Mogensen, M. 2012.

References
187
Biomarkers of mitochondrial content in skeletal muscle of healthy young human
subjects. Journal of Physiology, 590, 3349-3360.
146. Laursen, P.B. & Jenkins, D.G. 2002. The scientific basis for high-intensity
interval training: Optimising training programmes and maximising performance
in highly trained endurance athletes. Sports Medicine, 32, 53-73.
147. LeBlanc, P.J., Peters, S.J., Tunstall, R.J., Cameron-Smith, D. & Heigenhauser,
G.J.F. 2004. Effects of aerobic training on pyruvate dehydrogenase and pyruvate
dehydrogenase kinase in human skeletal muscle. Journal of Physiology, 557, 559-
570.
148. Lee, W.J., Kim, M., Park, H.S., Kim, H.S., Jeon, M.J., Oh, K.S., Koh, E.H., Won,
J.C., Kim, M.S., Oh, G.T., Yoon, M., Lee, K.U. & Park, J.Y. 2006. AMPK
activation increases fatty acid oxidation in skeletal muscle by activating PPARα
and PGC-1. Biochemical and Biophysical Research Communications, 340, 291-
295.
149. Lehmann, M.J., Lormes, W., Opitz-Gress, A., Steinacker, J.M., Netzer, N., Foster,
C. & Gastmann, U. 1997. Training and overtraining: An overview and
experimental results in endurance sports. Journal of Sports Medicine and Physical
Fitness, 37, 7-17.
150. Leick, L., Wojtaszewski, J.F.P., Johansen, S.T., Kiilerich, K., Comes, G.,
Hellsten, Y., Hidalgo, J. & Pilegaard, H. 2008. PGC-1α is not mandatory for
exercise- and training-induced adaptive gene responses in mouse skeletal muscle.
American Journal of Physiology - Endocrinology and Metabolism, 294, E463-
E474.
151. Leone, T.C., Lehman, J.J., Finck, B.N., Schaeffer, P.J., Wende, A.R., Boudina,
S., Courtois, M., Wozniak, D.F., Sambandam, N., Bernal-Mizrachi, C., Chen, Z.,
Holloszy, J.O., Medeiros, D.M., Schmidt, R.E., Saffitz, J.E., Abel, E.D.,
Semenkovich, C.F. & Kelly, D.P. 2005. PGC-1alpha deficiency causes multi-
system energy metabolic derangements: muscle dysfunction, abnormal weight
control and hepatic steatosis. PLoS biology., 3.
152. Lerin, C., Rodgers, J.T., Kalume, D.E., Kim, S.h., Pandey, A. & Puigserver, P.
2006. GCN5 acetyltransferase complex controls glucose metabolism through
transcriptional repression of PGC-1α. Cell Metabolism, 3, 429-438.
153. Levine, A.J., Hu, W. & Feng, Z. 2006. The P53 pathway: What questions remain
to be explored? Cell Death and Differentiation, 13, 1027-1036.

References
188
154. Li, J., Donath, S., Li, Y., Qin, D., Prabhakar, B.S. & Li, P. 2010. miR-30 regulates
mitochondrial fission through targeting p53 and the dynamin-related protein-1
pathway. PLoS Genetics, 6.
155. Liljedahl, M.E. 1996. Different responses of skeletal muscle following sprint
training in men and women. European Journal of Applied Physiology and
Occupational Physiology, 74, 375-383.
156. Lin, J., Handschin, C. & Spiegelman, B.M. 2005. Metabolic control through the
PGC-1 family of transcription coactivators. Cell Metabolism, 1, 361-370.
157. Lin, J., Wu, H., Tarr, P.T., Zhang, C.Y., Wu, Z., Boss, O., Michael, L.F.,
Puigserver, P., Isotani, E., Olson, E.N., Lowell, B.B., Bassel-Duby, R. &
Spiegelman, B.M. 2002. Transcriptional co-activator PGC-1α drives the
formation of slow-twitch muscle fibres. Nature, 418, 797-801.
158. Linossier, M.T., Dormois, D., Perier, C., Frey, J., Geyssant, A. & Denis, C. 1997.
Enzyme adaptations of human skeletal muscle during bicycle short-sprint training
and detraining. Acta Physiologica Scandinavica, 161, 439-445.
159. Little, J.P., Safdar, A., Bishop, D., Tarnopolsky, M.A. & Gibala, M.J. 2011. An
acute bout of high-intensity interval training increases the nuclear abundance of
PGC-1alpha and activates mitochondrial biogenesis in human skeletal muscle. Am
J Physiol Regul Integr Comp Physiol, 300, R1303-10.
160. Little, J.P., Safdar, A., Cermak, N., Tarnopolsky, M.A. & Gibala, M.J. 2010.
Acute endurance exercise increases the nuclear abundance of PGC-1α in trained
human skeletal muscle. American Journal of Physiology - Regulatory Integrative
and Comparative Physiology, 298, R912-R917.
161. Little, J.P., Safdar, A., Wilkin, G.P., Tarnopolsky, M.A. & Gibala, M.J. 2010. A
practical model of low-volume high-intensity interval training induces
mitochondrial biogenesis in human skeletal muscle: Potential mechanisms.
Journal of Physiology, 588, 1011-1022.
162. Londeree, B.R. 1997. Effect of training on lactate/ventilatory thresholds: A meta-
analysis. Medicine and Science in Sports and Exercise, 29, 837-843.
163. Long, Y.C., Widegren, U. & Zierath, J.R. 2004. Exercise-induced mitogen-
activated protein kinase signalling in skeletal muscle. Proceedings of the Nutrition
Society, 63, 227-232.
164. Lowell, B.B. & Shulman, G.I. 2005. Mitochondrial dysfunction and type 2
diabetes. Science, 307, 384-387.

References
189
165. Lu, J., McKinsey, T.A., Nicol, R.L. & Olson, E.N. 2000. Signal-dependent
activation of the MEF2 transcription factor by dissociation from histone
deacetylases. Proceedings of the National Academy of Sciences of the United
States of America, 97, 4070-4075.
166. Luden, N., Hayes, E., Galpin, A., Minchev, K., Jemiolo, B., Raue, U., Trappe,
T.A., Harber, M.P., Bowers, T. & Trappe, S. 2010. Myocellular basis for tapering
in competitive distance runners. Journal of Applied Physiology, 108, 1501-1509.
167. Luden, N., Hayes, E., Minchev, K., Louis, E., Raue, U., Conley, T. & Trappe, S.
2012. Skeletal muscle plasticity with marathon training in novice runners.
Scandinavian Journal of Medicine and Science in Sports, 22, 662-670.
168. Luft, R. 1994. The development of mitochondrial medicine. Proceedings of the
National Academy of Sciences of the United States of America, 91, 8731-8738.
169. Luo, J., Nikolaev, A.Y., Imai, S.I., Chen, D., Su, F., Shiloh, A., Guarente, L. &
Gu, W. 2001. Negative control of p53 by Sir2α promotes cell survival under
stress. Cell, 107, 137-148.
170. Ma, J.K., Scribbans, T.D., Edgett, B.A., Boyd, J.C., Simpson, C.A., Little, J.P. &
Gurd, B.J. 2013. Extremely low-volume, high-intensity interval training improves
exercise capacity and increases mitochondrial protein content in human skeletal
muscle. Open Journal of Molecular and Integrative Physiology 3, 202-210.
171. Macdougall, J.D., Hicks, A.L., Macdonald, J.R., McKelvie, R.S., Green, H.J. &
Smith, K.M. 1998. Muscle performance and enzymatic adaptations to sprint
interval training. Journal of Applied Physiology, 84, 2138-2142.
172. Mahoney, D.J., Parise, G., Melov, S., Safdar, A. & Tarnopolsky, M.A. 2005.
Analysis of global mRNA expression in human skeletal muscle during recovery
from endurance exercise. FASEB Journal, 19, 1498-1500.
173. Mai, S., Muster, B., Bereiter-Hahn, J. & Jendrach, M. 2012. Autophagy proteins
LC3B, ATG5 and ATG12 participate in quality control after mitochondrial
damage and influence life span. Autophagy, 8, 47-62.
174. Maiuri, M.C., Galluzzi, L., Morselli, E., Kepp, O., Malik, S.A. & Kroemer, G.
2010. Autophagy regulation by p53. Current Opinion in Cell Biology, 22, 181-
185.
175. Maltzman, W. & Czyzyk, L. 1984. UV irradiation stimulates levels of p53 cellular
tumor antigen in nontransformed mouse cells. Molecular and Cellular Biology, 4,
1689-1694.

References
190
176. Mandroukas, K., Krotkiewski, M., Hedberg, M., Wroblewski, Z., Björntorp, P. &
Grimby, G. 1984. Physical training in obese women - Effects of muscle
morphology, biochemistry and function. European Journal of Applied Physiology
and Occupational Physiology, 52, 355-361.
177. Marchenko, N.D., Hanel, W., Li, D., Becker, K., Reich, N. & Moll, U.M. 2010.
Stress-mediated nuclear stabilization of p53 is regulated by ubiquitination and
importin-α3 binding. Cell Death and Differentiation, 17, 255-267.
178. Marine, J.C. 2010. P53 stabilization: The importance of nuclear import. Cell
Death and Differentiation, 17, 191-192.
179. Masuda, K., Okazaki, K., Kuno, S., Asano, K., Shimojo, H. & Katsuta, S. 2001.
Endurance training under 2500-m hypoxia does not increase myoglobin content
in human skeletal muscle. European Journal of Applied Physiology, 85, 486-490.
180. Mathai, A.S., Bonen, A., Benton, C.R., Robinson, D.L. & Graham, T.E. 2008.
Rapid exercise-induced changes in PGC-1α mRNA and protein in human skeletal
muscle. Journal of Applied Physiology, 105, 1098-1105.
181. Matoba, S., Kang, J.G., Patino, W.D., Wragg, A., Boehm, M., Gavrilova, O.,
Hurley, P.J., Bunz, F. & Hwang, P.M. 2006. p53 regulates mitochondrial
respiration. Science, 312, 1650-1653.
182. McCully, K.K., Natelson, B.H., Iotti, S., Sisto, S. & Leigh Jr, J.S. 1996. Reduced
oxidative muscle metabolism in chronic fatigue syndrome. Muscle and Nerve, 19,
621-625.
183. McGee, S.L. 2007. Exercise and MEF2-HDAC interactions. Applied Physiology,
Nutrition and Metabolism, 32, 852-856.
184. McGee, S.L. & Hargreaves, M. 2004. Exercise and Myocyte Enhancer Factor 2
Regulation in Human Skeletal Muscle. Diabetes, 53, 1208-1214.
185. McGee, S.L. & Hargreaves, M. 2010. AMPK-mediated regulation of transcription
in skeletal muscle. Clinical Science, 118, 507-518.
186. McGee, S.L., Howlett, K.F., Starkie, R.L., Cameron-Smith, D., Kemp, B.E. &
Hargreaves, M. 2003. Exercise increases nuclear AMPK α2 in human skeletal
muscle. Diabetes, 52, 926-928.
187. McKenzie, S., Phillips, S.M., Carter, S.L., Lowther, S., Gibala, M.J. &
Tarnopolsky, M.A. 2000. Endurance exercise training attenuates leucine
oxidation and BCOAD activation during exercise in humans. American Journal
of Physiology - Endocrinology and Metabolism, 278, E580-E587.

References
191
188. McKinsey, T.A., Zhang, C.L., Lu, J.R. & Olson, E.N. 2000. Signal-dependent
nuclear export of a histone deacetylase regulates muscle differentiation. Nature,
408, 106-111.
189. Medeiros, D.M. 2008. Assessing mitochondria biogenesis. Methods, 46, 288-294.
190. Meex, R.C.R., Schrauwen-Hinderling, V.B., Moonen-Kornips, E., Schaart, G.,
Mensink, M., Phielix, E., Van De Weijer, T., Sels, J.P., Schrauwen, P. &
Hesselink, M.K.C. 2010. Restoration of muscle mitochondrial function and
metabolic flexibility in type 2 diabetes by exercise training is paralleled by
increased myocellular fat storage and improved insulin sensitivity. Diabetes, 59,
572-579.
191. Mehagnoul-Schipper, D.J., Van Der Kallen, B.F.W., Colier, W.N.J.M., Van Der
Sluijs, M.C., Van Erning, L.J.T.O., Thijssen, H.O.M., Oeseburg, B., Hoefnagels,
W.H.L. & Jansen, R.W.M.M. 2002. Simultaneous measurements of cerebral
oxygenation changes during brain activation by near-infrared spectroscopy and
functional magnetic resonance imaging in healthy young and elderly subjects.
Human Brain Mapping, 16, 14-23.
192. Merrill, G.F., Kurth, E.J., Hardie, D.G. & Winder, W.W. 1997. AICA riboside
increases AMP-activated protein kinase, fatty acid oxidation, and glucose uptake
in rat muscle. American Journal of Physiology - Endocrinology and Metabolism,
273, E1107-E1112.
193. Messonnier, L., Denis, C., Prieur, F. & Lacour, J.R. 2005. Are the effects of
training on fat metabolism involved in the improvement of performance during
high-intensity exercise? European Journal of Applied Physiology, 94, 434-441.
194. Mettauer, B., Zoll, J., Sanchez, H., Lampert, E., Ribera, F., Veksler, V., Bigard,
X., Mateo, P., Epailly, E., Lonsdorfer, J. & Ventura-Clapier, R. 2001. Oxidative
capacity of skeletal muscle in heart failure patients versus sedentary or active
control subjects. Journal of the American College of Cardiology, 38, 947-954.
195. Michishita, E., Park, J.Y., Burneskis, J.M., Barrett, J.C. & Horikawa, I. 2005.
Evolutionarily conserved and nonconserved cellular localizations and functions
of human SIRT proteins. Molecular Biology of the Cell, 16, 4623-4635.
196. Miller, B.F. & Hamilton, K.L. 2012. A perspective on the determination of
mitochondrial biogenesis. American Journal of Physiology - Endocrinology and
Metabolism, 302, E496-E499.
197. Mogensen, M., Sahlin, K., Fernström, M., Glintborg, D., Vind, B.F., Beck-
Nielsen, H. & Højlund, K. 2007. Mitochondrial respiration is decreased in skeletal
muscle of patients with type 2 diabetes. Diabetes, 56, 1592-1599.

References
192
198. Møller, A.B., Vendelbo, M.H., Christensen, B., Clasen, B.F.F., Bak, A.M.,
Jørgensen, J.O.L., Møller, N. & Jessen, N. 2015. Physical exercise increases
autophagic signaling through ULK1 in human skeletal muscle.
199. Moore, R.L., Thacker, E.M., Kelley, G.A., Musch, T.I., Sinoway, L.I., Foster,
V.L. & Dickinson, A.L. 1987. Effect of training/detraining on submaximal
exercise responses in humans. Journal of Applied Physiology, 63, 1719-1724.
200. Morton, J.P., Croft, L., Bartlett, J.D., MacLaren, D.P.M., Reilly, T., Evans, L.,
McArdle, A. & Drust, B. 2009. Reduced carbohydrate availability does not
modulate training-induced heat shock protein adaptations but does upregulate
oxidative enzyme activity in human skeletal muscle. Journal of Applied
Physiology, 106, 1513-1521.
201. Mosner, J., Mummenbrauer, T., Bauer, C., Sczakiel, G., Grosse, F. & Deppert, W.
1995. Negative feedback regulation of wild-type p53 biosynthesis. EMBO
Journal, 14, 4442-4449.
202. Mujika, I., Padilla, S., Pyne, D. & Busso, T. 2004. Physiological changes
associated with the pre-event taper in athletes. Sports Medicine, 34, 891-927.
203. Munday, M.R., Carling, D. & Hardie, D.G. 1988. Negative interactions between
phosphorylation of acetyl-CoA carboxyase by the cyclic AMP-dependent and
AMP-activated protein kinases. FEBS Letters, 235, 144-148.
204. Murias, J.M., Kowalchuk, J.M., Ritchie, D., Hepple, R.T., Doherty, T.J. &
Paterson, D.H. 2011. Adaptations in capillarization and citrate synthase activity
in response to endurance training in older and young men. Journals of
Gerontology - Series A Biological Sciences and Medical Sciences, 66 A, 957-964.
205. Myhill, S., Booth, N.E. & McLaren-Howard, J. 2009. Chronic fatigue syndrome
and mitochondrial dysfunction. International Journal of Clinical and
Experimental Medicine, 2, 1-16.
206. Nisoli, E., Clementi, E., Carruba, M.O. & Moncada, S. 2007. Defective
mitochondrial biogenesis: A hallmark of the high cardiovascular risk in the
metabolic syndrome? Circulation Research, 100, 795-806.
207. Nordsborg, N.B., Lundby, C., Leick, L. & Pilegaard, H. 2010. Relative workload
determines exercise-induced increases in PGC-1α mRNA. Medicine and Science
in Sports and Exercise, 42, 1477-1484.
208. Norrbom, J., Sällstedt, E.K., Fischer, H., Sundberg, C.J., Rundqvist, H. &
Gustafsson, T. 2011. Alternative splice variant PGC-1α-b is strongly induced by

References
193
exercise in human skeletal muscle. American Journal of Physiology -
Endocrinology and Metabolism, 301, E1092-E1098.
209. Norrbom, J., Sundberg, C.J., Ameln, H., Kraus, W.E., Jansson, E. & Gustafsson,
T. 2004. PGC-1α mRNA expression is influenced by metabolic perturbation in
exercising human skeletal muscle. Journal of Applied Physiology, 96, 189-194.
210. Norrbom, J., Wallman, S.E., Gustafsson, T., Rundqvist, H., Jansson, E. &
Sundberg, C.J. 2010. Training response of mitochondrial transcription factors in
human skeletal muscle. Acta Physiologica, 198, 71-79.
211. Ogata, T. & Yamasaki, Y. 1997. Ultra-high-resolution scanning electron
microscopy of mitochondria and sarcoplasmic reticulum arrangement in human
red, white, and intermediate muscle fibers. Anatomical Record, 248, 214-223.
212. Ojuka, E.O., Jones, T.E., Han, D.H., Chen, M., Wamhoff, B.R., Sturek, M. &
Holloszy, J.O. 2002. Intermittent increases in cytosolic Ca 2+ stimulate
mitochondrial biogenesis in muscle cells. American Journal of Physiology -
Endocrinology and Metabolism, 283, E1040-E1045.
213. Olesen, J., Kiilerich, K. & Pilegaard, H. 2010. PGC-1α-mediated adaptations in
skeletal muscle. Pflugers Archiv European Journal of Physiology, 460, 153-162.
214. Olson, B.L., Hock, M.B., Ekholm-Reed, S., Wohlschlegel, J.A., Dev, K.K., Kralli,
A. & Reed, S.I. 2008. SCFCdc4 acts antagonistically to the PGC-1α
transcriptional coactivator by targeting it for ubiquitin-mediated proteolysis.
Genes and Development, 22, 252-264.
215. Oren, M. 1999. Regulation of the p53 tumor suppressor protein. Journal of
Biological Chemistry, 274, 36031-36034.
216. Østergård, T., Andersen, J.L., Nyholm, B., Lund, S., Nair, K.S., Saltin, B. &
Schmitz, O. 2006. Impact of exercise training on insulin sensitivity, physical
fitness, and muscle oxidative capacity in first-degree relatives of type 2 diabetic
patients. American Journal of Physiology - Endocrinology and Metabolism, 290,
E998-E1005.
217. Park, J.Y., Wang, P.Y., Matsumoto, T., Sung, H.J., Ma, W., Choi, J.W., Anderson,
S.A., Leary, S.C., Balaban, R.S., Kang, J.G. & Hwang, P.M. 2009. P53 improves
aerobic exercise capacity and augments skeletal muscle mitochondrial DNA
content. Circulation Research, 105, 705-712.
218. Park, S., Kim, D., Dan, H.C., Chen, H., Testa, J.R. & Cheng, J.Q. 2012.
Identification of Akt interaction protein PHF20/TZP that transcriptionally
regulates p53. Journal of Biological Chemistry, 287, 11151-11163.

References
194
219. Parolin, M.L., Chesley, A., Matsos, M.P., Spriet, L.L., Jones, N.L. &
Heigenhauser, G.J.F. 1999. Regulation of skeletal muscle glycogen
phosphorylase and PDH during maximal intermittent exercise. American Journal
of Physiology - Endocrinology and Metabolism, 277, E890-E900.
220. Parra, J., Cadefau, J.A., Rodas, G., Amigó, N. & Cussö, R. 2000. The distribution
of rest periods affects performance and adaptations of energy metabolism induced
by high-intensity training in human muscle. Acta Physiologica Scandinavica, 169,
157-165.
221. Paulsen, G., Cumming, K.T., Holden, G., Hallén, J., Rønnestad, B.R., Sveen, O.,
Skaug, A., Paur, I., Bastani, N.E., Østgaard, H.N., Buer, C., Midttun, M.,
Freuchen, F., Wiig, H., Ulseth, E.T., Garthe, I., Blomhoff, R., Benestad, H.B. &
Raastad, T. 2014. Vitamin C and E supplementation hampers cellular adaptation
to endurance training in humans: A double-blind, randomised, controlled trial.
Journal of Physiology, 592, 1887-1901.
222. Pedhazur, E.J. 1997. Multiple Regression in Behavioral Research: Explanation
and Prediction (3rd Ed). Harcourt Brace College Publishers, 156-194.
223. Perry, C.G.R., Heigenhauser, G.J.F., Bonen, A. & Spriet, L.L. 2008. High-
intensity aerobic interval training increases fat and carbohydrate metabolic
capacities in human skeletal muscle. Applied Physiology, Nutrition and
Metabolism, 33, 1112-1123.
224. Perry, C.G.R., Lally, J., Holloway, G.P., Heigenhauser, G.J.F., Bonen, A. &
Spriet, L.L. 2010. Repeated transient mRNA bursts precede increases in
transcriptional and mitochondrial proteins during training in human skeletal
muscle. Journal of Physiology, 588, 4795-4810.
225. Pesta, D. & Gnaiger, E. 2012. High-resolution respirometry: OXPHOS protocols
for human cells and permeabilized fibers from small biopsies of human muscle.
In: PALMEIRA, C. M. & MORENO, A. J. (eds.) Mitochondrial Bioenergetics:
Methods and Protocols. Springer Science+Business Media.
226. Phillips, S.M., Green, H.J., Tarnopolsky, M.A., Heigenhauser, G.J.F., Hill, R.E.
& Grant, S.M. 1996. Effects of training duration on substrate turnover and
oxidation during exercise. Journal of Applied Physiology, 81, 2182-2191.
227. Philp, A. & Schenk, S. 2013. Unraveling the complexities of sirt1-mediated
mitochondrial regulation in skeletal muscle. Exercise and Sport Sciences Reviews,
41, 174-181.
228. Picard, M., Shirihai, O.S., Gentil, B.J. & Burelle, Y. 2013. Mitochondrial
morphology transitions and functions: Implications for retrograde signaling?

References
195
American Journal of Physiology - Regulatory Integrative and Comparative
Physiology, 304, R393-R406.
229. Picard, M., Taivassalo, T., Gouspillou, G. & Hepple, R.T. 2011. Mitochondria:
Isolation, structure and function. Journal of Physiology, 589, 4413-4421.
230. Picard, M., Taivassalo, T., Ritchie, D., Wright, K.J., Thomas, M.M., Romestaing,
C. & Hepple, R.T. 2011. Mitochondrial structure and function are disrupted by
standard Isolation methods. PLoS ONE, 6.
231. Pich, S., Bach, D., Briones, P., Liesa, M., Camps, M., Testar, X., Palacín, M. &
Zorzano, A. 2005. The Charcot-Marie-Tooth type 2A gene product, Mfn2, up-
regulates fuel oxidation through expression of OXPHOS system. Human
Molecular Genetics, 14, 1405-1415.
232. Pilegaard, H., Osada, T., Andersen, L.T., Helge, J.W., Saltin, B. & Neufer, P.D.
2005. Substrate availability and transcriptional regulation of metabolic genes in
human skeletal muscle during recovery from exercise. Metabolism: Clinical and
Experimental, 54, 1048-1055.
233. Pilegaard, H., Saltin, B. & Neufer, D.P. 2003. Exercise induces transient
transcriptional activation of the PGC-1α gene in human skeletal muscle. Journal
of Physiology, 546, 851-858.
234. Pletjushkina, O.Y., Lyamzaev, K.G., Popova, E.N., Nepryakhina, O.K., Ivanova,
O.Y., Domnina, L.V., Chernyak, B.V. & Skulachev, V.P. 2006. Effect of
oxidative stress on dynamics of mitochondrial reticulum. Biochimica et
Biophysica Acta - Bioenergetics, 1757, 518-524.
235. Pogozelski, A.R., Geng, T., Li, P., Yin, X., Lira, V.A., Zhang, M., Chi, J.T. &
Yan, Z. 2009. p38γ mitogen-activated protein kinase is a key regulator in skeletal
muscle metabolic adaptation in mice. PLoS ONE, 4.
236. Popov, D., Zinovkin, R., Karger, E., Tarasova, O. & Vinogradova, O. 2014.
Effects of continuous and intermittent aerobic exercise upon mRNA expression
of metabolic genes in human skeletal muscle. Journal of Sports Medicine and
Physical Fitness, 54, 362-369.
237. Popov, D.V., Zinovkin, R.A., Karger, E.M., Tarasova, O.S. & Vinogradova, O.L.
2013. The effect of aerobic exercise on the expression of genes in skeletal muscles
of trained and untrained men. Human Physiology, 39, 190-195.
238. Powers, S.K., Duarte, J., Kavazis, A.N. & Talbert, E.E. 2010. Reactive oxygen
species are signalling molecules for skeletal muscle adaptation. Experimental
Physiology, 95, 1-9.

References
196
239. Proctor, D.N., Sinning, W.E., Walro, J.M., Sieck, G.C. & Lemon, P.W.R. 1995.
Oxidative capacity of human muscle fiber types: Effects of age and training status.
Journal of Applied Physiology, 78, 2033-2038.
240. Psilander, N., Frank, P., Flockhart, M. & Sahlin, K. 2013. Exercise with low
glycogen increases PGC-1α gene expression in human skeletal muscle. European
Journal of Applied Physiology, 113, 951-963.
241. Puigserver, P., Rhee, J., Lin, J., Wu, Z., Yoon, J.C., Zhang, C.Y., Krauss, S.,
Mootha, V.K., Lowell, B.B. & Spiegelman, B.M. 2001. Cytokine Stimulation of
Energy Expenditure through p38 MAP Kinase Activation of PPARγ Coactivator-
1. Molecular Cell, 8, 971-982.
242. Puigserver, P. & Spiegelman, B.M. 2003. Peroxisome proliferator-activated
receptor-γ coactivator 1α (PGC-1α): Transcriptional coactivator and metabolic
regulator. Endocrine Reviews, 24, 78-90.
243. Puigserver, P., Wu, Z., Park, C.W., Graves, R., Wright, M. & Spiegelman, B.M.
1998. A cold-inducible coactivator of nuclear receptors linked to adaptive
thermogenesis. Cell, 92, 829-839.
244. Putman, C.T., Jones, N.L., Hultman, E., Hollidge-Horvat, M.G., Bonen, A.,
McConachie, D.R. & Heigenhauser, G.J.F. 1998. Effects of short-term
submaximal training in humans on muscle metabolism in exercise. American
Journal of Physiology - Endocrinology and Metabolism, 275, E132-E139.
245. Reznick, R.M. & Shulman, G.I. 2006. The role of AMP-activated protein kinase
in mitochondrial biogenesis. Journal of Physiology, 574, 33-39.
246. Rimbert, V., Boirie, Y., Bedu, M., Hocquette, J.F., Ritz, P. & Morio, B. 2004.
Muscle fat oxidative capacity is not impaired by age but by physical inactivity:
association with insulin sensitivity. The FASEB journal : official publication of
the Federation of American Societies for Experimental Biology, 18, 737-739.
247. Ristow, M., Zarse, K., Oberbach, A., Klöting, N., Birringer, M., Kiehntopf, M.,
Stumvoll, M., Kahn, C.R. & Blüher, M. 2009. Antioxidants prevent health-
promoting effects of physical exercise in humans. Proceedings of the National
Academy of Sciences of the United States of America, 106, 8665-8670.
248. Rodgers, J.T., Lerin, C., Haas, W., Gygi, S.P., Spiegelman, B.M. & Puigserver,
P. 2005. Nutrient control of glucose homeostasis through a complex of PGC-1α
and SIRT1. Nature, 434, 113-118.
249. Roepstorff, C., Schjerling, P., Vistisen, B., Madsen, M., Steffensen, C.H., Rider,
M.H. & Kiens, B. 2005. Regulation of oxidative enzyme activity and eukaryotic

References
197
elongation factor 2 in human skeletal muscle: Influence of gender and exercise.
Acta Physiologica Scandinavica, 184, 215-224.
250. Rogel, A., Popliker, M., Webb, C.G. & Oren, M. 1985. p53 cellular tumor antigen:
Analysis of mRNA levels in normal adult tissues, embryos, and tumors.
Molecular and Cellular Biology, 5, 2851-2855.
251. Rose, A.J., Kiens, B. & Richter, E.A. 2006. Ca2+-calmodulin-dependent protein
kinase expression and signalling in skeletal muscle during exercise. Journal of
Physiology, 574, 889-903.
252. Rowe, G., Patten, I., Zsengeller, Z.K., El-Khoury, R., Okutsu, M., Bampoh, S.,
Koulisis, N., Farrell, C., Hirshman, M.F., Yan, Z., Goodyear, L.J., Rustin, P. &
Arany, Z. 2013. Disconnecting Mitochondrial Content from Respiratory Chain
Capacity in PGC-1-Deficient Skeletal Muscle. Cell Reports, 3, 1449-1456.
253. Rowe, G.C., El-Khoury, R., Patten, I.S., Rustin, P. & Arany, Z. 2012. PGC-1α is
dispensable for exercise-induced mitochondrial biogenesis in skeletal muscle.
PLoS ONE, 7.
254. Rubinstein, J.L. & Walker, J.E. 2002. ATP synthase from Saccharomyces
cerevisiae: Location of the OSCP subunit in the peripheral stalk region. Journal
of Molecular Biology, 321, 613-619.
255. Rud, B., Foss, Ø., Krustrup, P., Secher, N.H. & Hallén, J. 2012. One-legged
endurance training: Leg blood flow and oxygen extraction during cycling
exercise. Acta Physiologica, 205, 177-185.
256. Ruiz, J.I. & Ochoa, B. 1997. Quantification in the subnanomolar range of
phospholipids and neutral lipids by monodimensional thin-layer chromatography
and image analysis. Journal of Lipid Research, 38, 1482-1489.
257. Russell, A., Wadley, G., Snow, R., Giacobino, J.P., Muzzin, P., Garnham, A. &
Cameron-Smith, D. 2002. Slow component of V̇O2 kinetics: The effect of training
status, fibre type, UCP3 mRNA and citrate synthase activity. International
Journal of Obesity, 26, 157-164.
258. Russell, A.P., Feilchenfeldt, J., Schreiber, S., Praz, M., Crettenand, A., Gobelet,
C., Meier, C.A., Bell, D.R., Kralli, A., Giacobino, J.P. & Dériaz, O. 2003.
Endurance Training in Humans Leads to Fiber Type-Specific Increases in Levels
of Peroxisome Proliferator-Activated Receptor-γ Coactivator-1 and Peroxisome
Proliferator-Activated Receptor-α in Skeletal Muscle. Diabetes, 52, 2874-2881.

References
198
259. Russell, A.P., Hesselink, M.K.C., Lo, S.K. & Schrauwen, P. 2005. Regulation of
metabolic transcriptional co-activators and transcription factors with acute
exercise. FASEB Journal, 19, 986-988.
260. Ryan, M.T. & Hoogenraad, N.J. 2007. Mitochondrial-nuclear communications.
261. Ryan, T.E., Brophy, P., Lin, C.T., Hickner, R.C. & Neufer, P.D. 2014. Assessment
of in vivo skeletal muscle mitochondrial respiratory capacity in humans by near-
infrared spectroscopy: A comparison with in situ measurements. Journal of
Physiology, 592, 3231-3241.
262. Safdar, A., Little, J.P., Stokl, A.J., Hettinga, B.P., Akhtar, M. & Tarnopolsky,
M.A. 2011. Exercise increases mitochondrial PGC-1α content and promotes
nuclear-mitochondrial cross-talk to coordinate mitochondrial biogenesis. Journal
of Biological Chemistry, 286, 10605-10617.
263. Sahin, E., Colla, S., Liesa, M., Moslehi, J., Müller, F.L., Guo, M., Cooper, M.,
Kotton, D., Fabian, A.J., Walkey, C., Maser, R.S., Tonon, G., Foerster, F., Xiong,
R., Wang, Y.A., Shukla, S.A., Jaskelioff, M., Martin, E.S., Heffernan, T.P.,
Protopopov, A., Ivanova, E., Mahoney, J.E., Kost-Alimova, M., Perry, S.R.,
Bronson, R., Liao, R., Mulligan, R., Shirihai, O.S., Chin, L. & DePinho, R.A.
2011. Telomere dysfunction induces metabolic and mitochondrial compromise.
Nature, 470, 359-365.
264. Saks, V.A., Veksler, V.I., Kuznetsov, A.V., Kay, L., Sikk, P., Tiivel, T., Tranqui,
L., Olivares, J., Winkler, K., Wiedemann, F. & Kunz, W.S. 1998. Permeabilized
cell and skinned fiber techniques in studies of mitochondrial function in vivo.
Molecular and Cellular Biochemistry, 184, 81-100.
265. Saleem, A., Adhihetty, P.J. & Hood, D.A. 2009. Role of p53 in mitochondrial
biogenesis and apoptosis in skeletal muscle. Physiological Genomics, 37, 58-66.
266. Saleem, A., Carter, H.N., Iqbal, S. & Hood, D.A. 2011. Role of p53 within the
regulatory network controlling muscle mitochondrial biogenesis. Exercise and
Sport Sciences Reviews, 39, 199-205.
267. Saleem, A. & Hood, D.A. 2013. Acute exercise induces tumour suppressor protein
p53 translocation to the mitochondria and promotes a p53-Tfam-mitochondrial
DNA complex in skeletal muscle. Journal of Physiology, 591, 3625-3636.
268. Sanchez, A.M.J., Bernardi, H., Py, G. & Candau, R.B. 2014. Autophagy is
essential to support skeletal muscle plasticity in response to endurance exercise.
American Journal of Physiology-Regulatory Integrative and Comparative
Physiology, 307, R956-R969.

References
199
269. Saraste, M. 1999. Oxidative phosphorylation at the fin de siecle. Science, 283,
1488-1493.
270. Scalzo, R.L., Peltonen, G.L., Binns, S.E., Shankaran, M., Giordano, G.R., Hartley,
D.A., Klochak, A.L., Lonac, M.C., Paris, H.L.R., Szallar, S.E., Wood, L.M.,
Peelor Iii, F.F., Holmes, W.E., Hellerstein, M.K., Bell, C., Hamilton, K.L. &
Miller, B.F. 2014. Greater muscle protein synthesis and mitochondrial biogenesis
in males compared with females during sprint interval training. FASEB Journal,
28, 2705-2714.
271. Scarpulla, R.C. 2002. Nuclear activators and coactivators in mammalian
mitochondrial biogenesis. Biochimica et Biophysica Acta - Gene Structure and
Expression, 1576, 1-14.
272. Scarpulla, R.C. 2008. Transcriptional paradigms in mammalian mitochondrial
biogenesis and function. Physiological Reviews, 88, 611-638.
273. Scarpulla, R.C. 2011. Metabolic control of mitochondrial biogenesis through the
PGC-1 family regulatory network. Biochimica et Biophysica Acta - Molecular
Cell Research, 1813, 1269-1278.
274. Scarpulla, R.C., Vega, R.B. & Kelly, D.P. 2012. Transcriptional integration of
mitochondrial biogenesis. Trends in Endocrinology and Metabolism, 23, 459-466.
275. Schagger, H. & Von Jagow, G. 1991. Blue native electrophoresis for isolation of
membrane protein complexes in enzymatically active form. Analytical
Biochemistry, 199, 223-231.
276. Schreiber, S.N., Emter, R., Hock, M.B., Knutti, D., Cardenas, J., Podvinec, M.,
Oakeley, E.J. & Kralli, A. 2004. The estrogen-related receptor α (ERRα) functions
in PPARγ coactivator 1α (PGC-1α)-induced mitochondrial biogenesis.
Proceedings of the National Academy of Sciences of the United States of America,
101, 6472-6477.
277. Schreiber, S.N., Knutti, D., Brogli, K., Uhlmann, T. & Kralli, A. 2003. The
transcriptional coactivator PGC-1 regulates the expression and activity of the
orphan nuclear receptor estrogen-related receptor α (ERRα). Journal of Biological
Chemistry, 278, 9013-9018.
278. Schwer, B. & Verdin, E. 2008. Conserved Metabolic Regulatory Functions of
Sirtuins. Cell Metabolism, 7, 104-112.
279. Scott, J.W., Hawley, S.A., Green, K.A., Anis, M., Stewart, G., Scullion, G.A.,
Norman, D.G. & Hardie, D.G. 2004. CBS domains form energy-sensing modules

References
200
whose binding of adenosine ligands is disrupted by disease mutations. Journal of
Clinical Investigation, 113, 274-284.
280. Scribbans, T.D., Edgett, B.A., Vorobej, K., Mitchell, A.S., Joanisse, S.D.,
Matusiak, J.B.L., Parise, G., Quadrilatero, J. & Gurd, B.J. 2014. Fibre-specific
responses to endurance and low volume high intensity interval training: Striking
similarities in acute and chronic adaptation. PLoS ONE, 9.
281. Scribbans, T.D., Ma, J.K., Edgett, B.A., Vorobej, K.A., Mitchell, A.S., Zelt,
J.G.E., Simpson, C.A., Quadrilatero, J. & Gurd, B.J. 2014. Resveratrol
supplementation does not augment performance adaptations or fibre-type–
specific responses to high-intensity interval training in humans. Applied
Physiology, Nutrition and Metabolism, 39, 1305-1313.
282. Sengupta, S. & Harris, C.C. 2005. p53: Traffic cop at the crossroads of DNA
repair and recombination. Nature Reviews Molecular Cell Biology, 6, 44-55.
283. Serpiello, F.R., McKenna, M.J., Bishop, D.J., Aughey, R.J., Caldow, M.K.,
Cameron-Smith, D. & Stepto, N.K. 2012. Repeated sprints alter signaling related
to mitochondrial biogenesis in humans. Medicine and Science in Sports and
Exercise, 44, 827-834.
284. Sevrioukova, I.F. 2011. Apoptosis-inducing factor: Structure, function, and redox
regulation Antioxidants and Redox Signaling 14 (12), 2545-2579
285. Shadgan, B., Reid, W.D., Gharakhanlou, R., Stothers, L. & MacNab, A.J. 2009.
Wireless near-infrared spectroscopy of skeletal muscle oxygenation and
hemodynamics during exercise and ischemia. Spectroscopy, 23, 233-241.
286. Shaulsky, G., Goldfinger, N., Ben-Ze'ev, A. & Rotter, V. 1990. Nuclear
accumulation of p53 protein is mediated by several nuclear localization signals
and plays a role in tumorigenesis. Molecular and Cellular Biology, 10, 6565-
6577.
287. She, Q.B., Bode, A.M., Ma, W.Y., Chen, N.Y. & Dong, Z. 2001. Resveratrol-
induced activation of p53 and apoptosis is mediated by extracellular-signal-
regulated protein kinases and p38 kinase. Cancer Research, 61, 1604-1610.
288. Shepley, B., MacDougall, J.D., Cipriano, N., Sutton, J.R., Tarnopolsky, M.A. &
Coates, G. 1992. Physiological effects of tapering in highly trained athletes.
Journal of Applied Physiology, 72, 706-711.
289. Shieh, S.Y., Ikeda, M., Taya, Y. & Prives, C. 1997. DNA damage-induced
phosphorylation of p53 alleviates inhibition by MDM2. Cell, 91, 325-334.

References
201
290. Short, K.R. 2012. Measuring mitochondrial protein synthesis to assess biogenesis.
American Journal of Physiology - Endocrinology and Metabolism, 302, E1153-
E1154.
291. Short, K.R., Vittone, J.L., Bigelow, M.L., Proctor, D.N., Rizza, R.A., Coenen-
Schimke, J.M. & Nair, K.S. 2003. Impact of aerobic exercise training on age-
related changes in insulin sensitivity and muscle oxidative capacity. Diabetes, 52,
1888-1896.
292. Slivka, D.R., Dumke, C.L., Hailes, W.S., Cuddy, J.S. & Ruby, B.C. 2012.
Substrate use and biochemical response to a 3,211-km bicycle tour in trained
cyclists. European Journal of Applied Physiology, 112, 1621-1630.
293. Smith, B.K., Mukai, K., Lally, J.S., Maher, A.C., Gurd, B.J., Heigenhauser,
G.J.F., Spriet, L.L. & Holloway, G.P. 2013. AMP-activated protein kinase is
required for exercise-induced peroxisome proliferator-activated receptor γ co-
activator 1α translocation to subsarcolemmal mitochondria in skeletal muscle.
Journal of Physiology, 591, 1551-1561.
294. Smith, G.I., Patterson, B.W. & Mittendorfer, B. 2011. Human muscle protein
turnover - Why is it so variable? Journal of Applied Physiology, 110, 480-491.
295. Soderling, T.R., Chang, B. & Brickey, D. 2001. Cellular Signaling through
Multifunctional Ca 2+/Calmodulin-dependent Protein Kinase II. Journal of
Biological Chemistry, 276, 3719-3722.
296. Spina, R.J., Chi, M.M.Y., Hopkins, M.G., Nemeth, P.M., Lowry, O.H. &
Holloszy, J.O. 1996. Mitochondrial enzymes increase in muscle in response to 7-
10 days of cycle exercise. Journal of Applied Physiology, 80, 2250-2254.
297. Sriwijitkamol, A., Coletta, D.K., Wajcberg, E., Balbontin, G.B., Reyna, S.M.,
Barrientes, J., Eagan, P.A., Jenkinson, C.P., Cersosimo, E., DeFronzo, R.A.,
Sakamoto, K. & Musi, N. 2007. Effect of acute exercise on AMPK signaling in
skeletal muscle of subjects with type 2 diabetes: A time-course and dose-response
study. Diabetes, 56, 836-848.
298. Stambolsky, P., Weisz, L., Shats, I., Klein, Y., Goldfinger, N., Oren, M. & Rotter,
V. 2006. Regulation of AIF expression by p53. Cell Death and Differentiation,
13, 2140-2149.
299. Stannard, S.R., Buckley, A.J., Edge, J.A. & Thompson, M.W. 2010. Adaptations
to skeletal muscle with endurance exercise training in the acutely fed versus
overnight-fasted state. Journal of Science and Medicine in Sport, 13, 465-469.

References
202
300. Starritt, E.C., Angus, D. & Hargreaves, M. 1999. Effect of short-term training on
mitochondrial ATP production rate in human skeletal muscle. Journal of Applied
Physiology, 86, 450-454.
301. Stepto, N.K., Benziane, B., Wadley, G.D., Chibalin, A.V., Canny, B.J., Eynon, N.
& McConell, G.K. 2012. Short-Term Intensified Cycle Training Alters Acute and
Chronic Responses of PGC1α and Cytochrome C Oxidase IV to Exercise in
Human Skeletal Muscle. PLoS ONE, 7.
302. Svedenhag, J., Henriksson, J. & Sylven, C. 1983. Dissociation of training effects
on skeletal muscle mitochondrial enzymes and myoglobin in man. Acta
Physiologica Scandinavica, 117, 213-218.
303. Takahashi, M. & Hood, D.A. 1996. Protein import into subsarcolemmal and
intermyofibrillar skeletal muscle mitochondria: Differential import regulation in
distinct subcellular regions. Journal of Biological Chemistry, 271, 27285-27291.
304. Talanian, J.L., Galloway, S.D.R., Heigenhauser, G.J.F., Bonen, A. & Spriet, L.L.
2007. Two weeks of high-intensity aerobic interval training increases the capacity
for fat oxidation during exercise in women. Journal of Applied Physiology, 102,
1439-1447.
305. Tanno, M., Sakamoto, J., Miura, T., Shimamoto, K. & Horio, Y. 2007.
Nucleocytoplasmic shuttling of the NAD+-dependent histone deacetylase SIRT1.
Journal of Biological Chemistry, 282, 6823-6832.
306. Thomson, D.M., Herway, S.T., Fillmore, N., Kim, H., Brown, J.D., Barrow, J.R.
& Winder, W.W. 2008. AMP-activated protein kinase phosphorylates
transcription factors of the CREB family. Journal of Applied Physiology, 104,
429-438.
307. Thomson, D.M., Porter, B.B., Tall, J.H., Kim, H.J., Barrow, J.R. & Winder, W.W.
2007. Skeletal muscle and heart LKB1 deficiency causes decreased voluntary
running and reduced muscle mitochondrial marker enzyme expression in mice.
American Journal of Physiology - Endocrinology and Metabolism, 292, E196-
E202.
308. Tiidus, P.M., Pushkarenko, J. & Houston, M.E. 1996. Lack of antioxidant
adaptation to short-term aerobic training in human muscle. American Journal of
Physiology - Regulatory Integrative and Comparative Physiology, 271, R832-
R836.
309. Tonkonogi, M., Harris, B. & Sahlin, K. 1997. Increased activity of citrate synthase
in human skeletal muscle after a single bout of prolonged exercise. Acta
Physiologica Scandinavica, 161, 435-436.

References
203
310. Tonkonogi, M., Harris, B. & Sahlin, K. 1998. Mitochondrial oxidative function
in human saponin-skinned muscle fibres: Effects of prolonged exercise. Journal
of Physiology, 510, 279-286.
311. Tonkonogi, M. & Sahlin, K. 1997. Rate of oxidative phosphorylation in isolated
mitochondria from human skeletal muscle: Effect of training status. Acta
Physiologica Scandinavica, 161, 345-353.
312. Tonkonogi, M. & Sahlin, K. 2002. Physical exercise and mitochondrial function
in human skeletal muscle. Exercise and Sport Sciences Reviews, 30, 129-137.
313. Tonkonogi, M., Walsh, B., Svensson, M. & Sahlin, K. 2000. Mitochondrial
function and antioxidative defence in human muscle: Effects of endurance
training and oxidative stress. Journal of Physiology, 528, 379-388.
314. Tonkonogi, M., Walsh, B., Tiivel, T., Saks, V. & Sahlin, K. 1999. Mitochondrial
function in human skeletal muscle is not impaired by high intensity exercise.
Pflugers Archiv European Journal of Physiology, 437, 562-568.
315. Toyoda, T., Hayashi, T., Miyamoto, L., Yonemitsu, S., Nakano, M., Tanaka, S.,
Ebihara, K., Masuzaki, H., Hosoda, K., Inoue, G., Otaka, A., Sato, K., Fushiki, T.
& Nakao, K. 2004. Possible involvement of the α1 isoform of 5′AMP-activated
protein kinase in oxidative stress-stimulated glucose transport in skeletal muscle.
American Journal of Physiology - Endocrinology and Metabolism, 287, E166-
E173.
316. Trappe, S., Harber, M., Creer, A., Gallagher, P., Slivka, D., Minchev, K. &
Whitsett, D. 2006. Single muscle fiber adaptations with marathon training.
Journal of Applied Physiology, 101, 721-727.
317. Truscott, K.N., Brandner, K. & Pfanner, N. 2003. Mechanisms of protein import
into mitochondria. Current Biology, 13, R326-R337.
318. Uguccioni, G. & Hood, D.A. 2011. The importance of PGC-1α in contractile
activity-induced mitochondrial adaptations. American Journal of Physiology -
Endocrinology and Metabolism, 300, E361-E371.
319. Vahsen, N., Candé, C., Brière, J.J., Bénit, P., Joza, N., Larochette, N.,
Mastroberardino, P.G., Pequignot, M.O., Casares, N., Lazar, V., Feraud, O.,
Debili, N., Wissing, S., Engelhardt, S., Madeo, F., Piacentini, M., Penninger, J.M.,
Schägger, H., Rustin, P. & Kroemer, G. 2004. AIF deficiency compromises
oxidative phosphorylation. EMBO Journal, 23, 4679-4689.
320. Vainshtein, A., Tryon, L.D., Pauly, M. & Hood, D.A. 2015. The role of PGC-1α
during acute exercise-induced autophagy and mitophagy in skeletal muscle.

References
204
321. Vaziri, H., Dessain, S.K., Eaton, E.N., Imai, S.I., Frye, R.A., Pandita, T.K.,
Guarente, L. & Weinberg, R.A. 2001. hSIR2SIRT1 functions as an NAD-
dependent p53 deacetylase. Cell, 107, 149-159.
322. Vega, R.B., Huss, J.M. & Kelly, D.P. 2000. The coactivator PGC-1 cooperates
with peroxisome proliferator-activated receptor α in transcriptional control of
nuclear genes encoding mitochondrial fatty acid oxidation enzymes. Molecular
and Cellular Biology, 20, 1868-1876.
323. Vigelso, A., Andersen, N.B. & Dela, F. 2014. The relationship between skeletal
muscle mitochondrial citrate synthase activity and whole body oxygen uptake
adaptations in response to exercise training. International journal of physiology,
pathophysiology and pharmacology, 6, 84-101.
324. Vincent, G., Lamon, S., Gant, N., Vincent, P., MacDonald, J., Markworth, J.,
Edge, J. & Hickey, A. 2015. Changes in mitochondrial function and mitochondria
associated protein expression in response to 2-weeks of high intensity interval
training. Frontiers in Physiology, 6.
325. Virbasius, J.V. & Scarpulla, R.C. 1994. Activation of the human mitochondrial
transcription factor A gene by nuclear respiratory factors: A potential regulatory
link between nuclear and mitochondrial gene expression in organelle biogenesis.
Proceedings of the National Academy of Sciences of the United States of America,
91, 1309-1313.
326. Vissing, K., Andersen, J.L. & Schjerling, P. 2005. Are exercise-induced genes
induced by exercise? FASEB Journal, 19, 94-96.
327. Vollestad, N.K. & Blom, P.C.S. 1985. Effect of varying exercise intensity on
glycogen depletion in human muscle fibres. Acta Physiologica Scandinavica, 125,
395-405.
328. Vousden, K.H. & Lu, X. 2002. Live or let die: The cell's response to p53. Nature
Reviews Cancer, 2, 594-604.
329. Vousden, K.H. & Ryan, K.M. 2009. P53 and metabolism. Nature Reviews
Cancer, 9, 691-700.
330. Vousden, K.H. & Vande Woude, G.F. 2000. The ins and outs of p53. Nature Cell
Biology, 2, E178-E180.
331. Wadley, G.D., Lee-Young, R.S., Canny, B.J., Wasuntarawat, C., Chen, Z.P.,
Hargreaves, M., Kemp, B.E. & McConell, G.K. 2006. Effect of exercise intensity
and hypoxia on skeletal muscle AMPK signaling and substrate metabolism in

References
205
humans. American Journal of Physiology - Endocrinology and Metabolism, 290,
E694-E702.
332. Walsh, B., Tonkonogi, M. & Sahlin, K. 2001. Effect of endurance training on
oxidative and antioxidative function in human permeabilized muscle fibres.
Pflugers Archiv European Journal of Physiology, 442, 420-425.
333. Wang, C.H., Wang, C.C. & Wei, Y.H. 2010. Mitochondrial dysfunction in insulin
insensitivity: Implication of mitochondrial role in type 2 diabetes. In: WEI, Y. H.,
LEE, H. M. & TZENG, C. R. (eds.) Annals of the New York Academy of Sciences.
334. Wang, L., Psilander, N., Tonkonogi, M., Ding, S. & Sahlin, K. 2009. Similar
expression of oxidative genes after interval and continuous exercise. Medicine
and Science in Sports and Exercise, 41, 2136-2144.
335. Wang, W., Cheng, X., Lu, J., Wei, J., Fu, G., Zhu, F., Jia, C., Zhou, L., Xie, H. &
Zheng, S. 2010. Mitofusin-2 is a novel direct target of p53. Biochemical and
Biophysical Research Communications, 400, 587-592.
336. Wang, Y.X., Zhang, C.L., Yu, R.T., Cho, H.K., Nelson, M.C., Bayuga-Ocampo,
C.R., Ham, J., Kang, H. & Evans, R.M. 2004. Regulation of muscle fiber type and
running endurance by PPARδ. PLoS Biology, 2.
337. Watt, M.J., Southgate, R.J., Holmes, A.G. & Febbraio, M.A. 2004. Suppression
of plasma free fatty acids upregulates peroxisome proliferator-activated receptor
(PPAR) α and δ and PPAR coactivator 1α in human skeletal muscle, but not lipid
regulatory genes. Journal of Molecular Endocrinology, 33, 533-544.
338. Welinder, C. & Ekblad, L. 2011. Coomassie staining as loading control in
Western blot analysis. Journal of Proteome Research, 10, 1416-1419.
339. Wells, G.D., Noseworthy, M.D., Hamilton, J., Tarnopolski, M. & Tein, I. 2008.
Skeletal muscle metabolic dysfunction in obesity and metabolic syndrome.
Canadian Journal of Neurological Sciences, 35, 31-40.
340. Wende, A.R., Schaeffer, P.J., Parker, G.J., Zechner, C., Han, D.H., Chen, M.M.,
Hancock, C.R., Lehman, J.J., Huss, J.M., McClain, D.A., Holloszy, J.O. & Kelly,
D.P. 2007. A role for the transcriptional coactivator PGC-1α in muscle refueling.
Journal of Biological Chemistry, 282, 36642-36651.
341. Westermann, B. 2010. Mitochondrial fusion and fission in cell life and death.
Nature Reviews Molecular Cell Biology, 11, 872-884.

References
206
342. Wibom, R. & Hultman, E. 1990. ATP production rate in mitochondria isolated
from microsamples of human muscle. American Journal of Physiology -
Endocrinology and Metabolism, 259, E204-E209.
343. Wibom, R., Hultman, E., Johansson, M., Matherei, K., Constantin-Teodosiu, D.
& Schantz, P.G. 1992. Adaptation of mitochondrial ATP production in human
skeletal muscle to endurance training and detraining. Journal of Applied
Physiology, 73, 2004-2010.
344. Wibrand, F., Jeppesen, T.D., Frederiksen, A.L., Olsen, D.B., Duno, M., Schwartz,
M. & Vissing, J. 2010. Limited diagnostic value of enzyme analysis in patients
with mitochondrial tRNA mutations. Muscle and Nerve, 41, 607-613.
345. Winder, W.W., Holmes, B.F., Rubink, D.S., Jensen, E.B., Chen, M. & Holloszy,
J.O. 2000. Activation of AMP-activated protein kinase increases mitochondrial
enzymes in skeletal muscle. Journal of Applied Physiology, 88, 2219-2226.
346. Wisløff, U., Najjar, S.M., Ellingsen, Ø., Haram, P.M., Swoap, S., Al-Share, Q.,
Fernström, M., Rezaei, K., Lee, S.J., Koch, L.G. & Britton, S.L. 2005.
Cardiovascular risk factors emerge after artificial selection for low aerobic
capacity. Science, 307, 418-420.
347. Witczak, C.A., Sharoff, C.G. & Goodyear, L.J. 2008. AMP-activated protein
kinase in skeletal muscle: From structure and localization to its role as a master
regulator of cellular metabolism. Cellular and Molecular Life Sciences, 65, 3737
- 3755.
348. Wojtaszewski, J.F.P., MacDonald, C., Nielsen, J.N., Hellsten, Y., Grahame
Hardie, D., Kemp, B.E., Kiens, B. & Richter, E.A. 2003. Regulation of 5′-AMP-
activated protein kinase activity and substrate utilization in exercising human
skeletal muscle. American Journal of Physiology - Endocrinology and
Metabolism, 284, E813-E822.
349. Woods, A., Johnstone, S.R., Dickerson, K., Leiper, F.C., Fryer, L.G.D., Neumann,
D., Schlattner, U., Wallimann, T., Carlson, M. & Carling, D. 2003. LKB1 Is the
Upstream Kinase in the AMP-Activated Protein Kinase Cascade. Current
Biology, 13, 2004-2008.
350. Wright, D.C., Geiger, P.C., Han, D.H., Jones, T.E. & Holloszy, J.O. 2007.
Calcium induces increases in peroxisome proliferator-activated receptor γ
coactivator-1α and mitochondrial biogenesis by a pathway leading to p38
mitogen-activated protein kinase activation. Journal of Biological Chemistry,
282, 18793-18799.

References
207
351. Wright, D.C., Han, D.H., Garcia-Roves, P.M., Geiger, P.C., Jones, T.E. &
Holloszy, J.O. 2007. Exercise-induced mitochondrial biogenesis begins before the
increase in muscle PGC-1α expression. Journal of Biological Chemistry, 282,
194-199.
352. Wu, Z., Puigserver, P., Andersson, U., Zhang, C., Adelmant, G., Mootha, V.,
Troy, A., Cinti, S., Lowell, B., Scarpulla, R.C. & Spiegelman, B.M. 1999.
Mechanisms controlling mitochondrial biogenesis and respiration through the
thermogenic coactivator PGC-1. Cell, 98, 115-124.
353. Yan, Z., Lira, V.A. & Greene, N.P. 2012. Exercise training-induced regulation of
mitochondrial quality. Exercise and Sport Sciences Reviews, 40, 159-164.
354. Yang, Y., Creer, A., Jemiolo, B. & Trappe, S. 2005. Time course of myogenic and
metabolic gene expression in response to acute exercise in human skeletal muscle.
Journal of Applied Physiology, 98, 1745-1752.
355. Yfanti, C., Åkerström, T., Nielsen, S., Nielsen, A.R., Mounier, R., Mortensen,
O.H., Lykkesfeldt, J., Rose, A.J., Fischer, C.P. & Pedersen, B.K. 2010.
Antioxidant supplementation does not alter endurance training adaptation.
Medicine and Science in Sports and Exercise, 42, 1388-1395.
356. Yoshida, Y., Izumi, H., Torigoe, T., Ishiguchi, H., Itoh, H., Kang, D. & Kohno,
K. 2003. p53 physically interacts with mitochondrial transcription factor A and
differentially regulates binding to damaged DNA. Cancer Research, 63, 3729-
3734.
357. Yu, M., Stepto, N.K., Chibalin, A.V., Fryer, L.G.D., Carling, D., Krook, A.,
Hawley, J.A. & Zierath, J.R. 2003. Metabolic and mitogenic signal transduction
in human skeletal muscle after intense cycling exercise. Journal of Physiology,
546, 327-335.
358. Yu, T., Robotham, J.L. & Yoon, Y. 2006. Increased production of reactive oxygen
species in hyperglycemic conditions requires dynamic change of mitochondrial
morphology. Proceedings of the National Academy of Sciences of the United
States of America, 103, 2653-2658.
359. Zhao, M., New, L., Kravchenko, V.V., Kato, Y., Gram, H., Di Padova, F., Olson,
E.N., Ulevitch, R.J. & Han, J. 1999. Regulation of the MEF2 family of
transcription factors by p38. Molecular and Cellular Biology, 19, 21-30.
360. Zoll, J., Sanchez, H., N'Guessan, B., Ribera, F., Lampert, E., Bigard, X., Serrurier,
B., Fortin, D., Geny, B., Veksler, V., Ventura-Clapier, R. & Mettauer, B. 2002.
Physical activity changes the regulation of mitochondrial respiration in human
skeletal muscle. Journal of Physiology, 543, 191-200.

References
208

209
Appendices

Appendices
210

Appendices
211
GENERIC APPLICATION FORMS

Appendices
212

Appendices
213

Appendices
214

Appendices
215

Appendices
216

Appendices
217
FORMS FOR INDIVIDUAL
RESEARCH PROJECTS
In the following pages the “Information to Participants Involved in Research” and the
“Consent form to Participants Involved in Research” forms are presented for the 2 research
projects completed during the course of this PhD (ethics clearance number: HRETH 11/94,
and HRETH 12/189).
Findings described in Chapter 2 use data obtained from project HRETH 11/94 (the phase
described in research project A as NT was presented as the HIIT group for the purpose of this
Chapter), and project HRETH 12/189 (STCT and SIT groups).
Findings described in Chapter 3 use data obtained entirely from project HRETH 11/94 (NT,
INT and RT phases). Results for the NT phase have been presented in this chapter, but have
not been discussed, as they have been discussed as part of Chapter 2 (as the HIIT group).
Findings described in Chapter 4 use data obtained entirely from project HRETH 12/189
(STCT and SIT groups).
Project HRETH 11/94 was conducted prior to project HRETH 12/189.

Appendices
218

Appendices
219
Project HRETH 11/94

Appendices
220

Appendices
221

Appendices
222
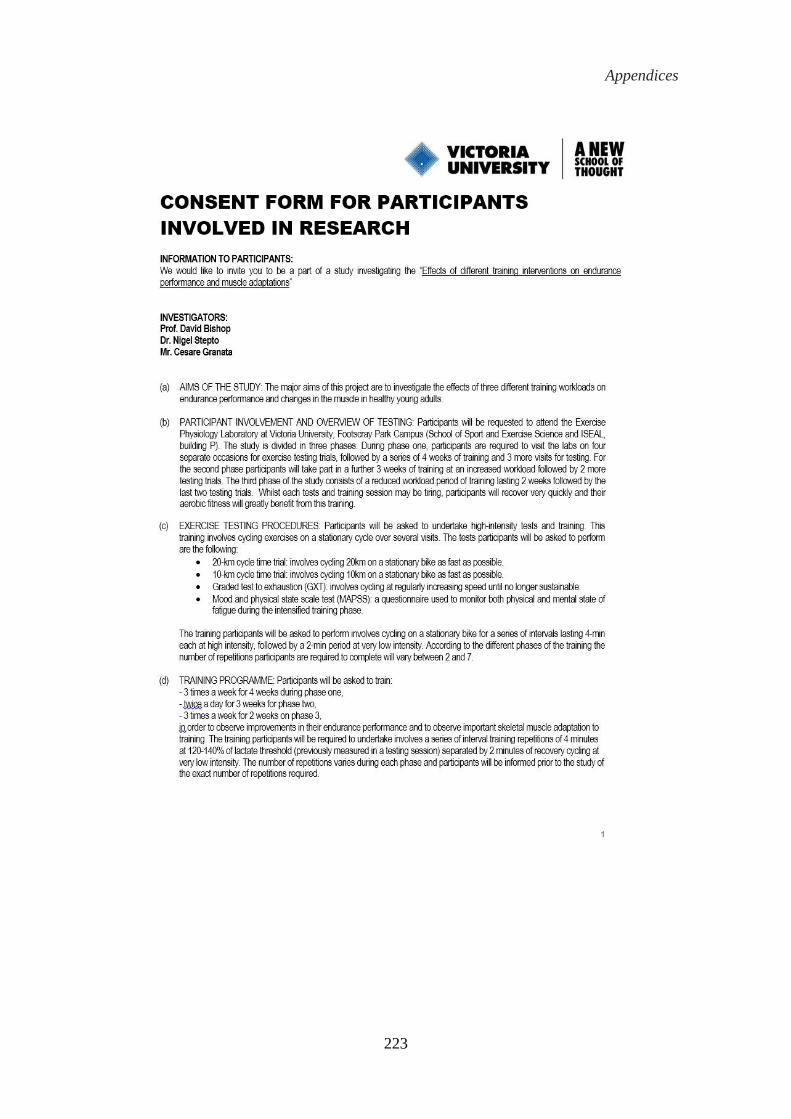
Appendices
223

Appendices
224

Appendices
225
Project HRETH 12/189

Appendices
226

Appendices
227

Appendices
228

Appendices
229

Appendices
230

Appendices
231

Appendices
232

Appendices
233
CHAPTER 2 – RAW DATA
Physiological parameters
Pcpt Age Mass Height Tot Work Pcpt Age Mass Height Tot Work Pcpt Age Mass Height Tot Work
HIT 1 20.2 94.7 191.6 4.1 STCT 1 23.3 77.7 180.5 3.3 SIT 1 19.7 70.7 174.4 1.3
HIT 2 24.0 69.4 169.0 3.2 STCT 2 18.8 86.5 181.6 4.9 SIT 2 21.7 93.1 191.9 1.5
HIT 3 20.9 72.5 174.0 4.2 STCT 3 21.6 75.5 177.6 3.7 SIT 3 24.9 84.9 183.5 1.7
HIT 4 19.6 112.0 180.3 3.4 STCT 4 19.8 76.2 178.0 4.1 SIT 4 21.6 67.9 176.9 1.0
HIT 5 20.6 80.4 183.0 3.1 STCT 5 24.4 79.6 182.2 4.3 SIT 5 22.1 125.5 180.4 1.6
HIT 6 19.3 66.1 170.7 3.7 STCT 6 20.5 84.7 180.5 3.7 SIT 6 19.6 87.0 184.7 1.4
HIT 7 20.6 86.5 193.0 4.0 STCT 7 18.8 92.0 191.0 4.6 SIT 7 18.5 97.6 188.3 1.4
HIT 8 19.9 82.8 198.6 4.0 STCT 8 20.8 67.7 174.4 2.5 SIT 8 18.4 66.6 176.8 1.1
HIT 9 21.8 76.6 180.5 3.8 STCT 9 20.6 56.3 167.5 3.2 SIT 9 25.7 67.1 168.3 1.2
HIT 10 18.7 65.5 165.8 3.6
HIT 11 19.9 75.6 173.4 2.1
Mean 20.5 80.2 180.0 3.6 Mean 21.0 77.4 179.3 3.8 Mean 21.3 84.5 180.6 1.3
SD 1.4 13.8 10.7 0.6 SD 1.9 10.6 6.3 0.7 SD 2.6 19.4 7.3 0.2
SE 0.4 4.1 3.2 0.2 SE 0.6 3.5 2.1 0.2 SE 0.9 6.5 2.4 0.1
Age [y] - Mass [kg] - Height [cm] - Total Work [MJ]HIIT STCT SIT
Pcpt Pre Post % Δ Pcpt Pre Post % Δ Pcpt Pre Post % Δ
HIT 1 216.0 238.9 10.60 STCT 1 172.0 179.5 4.39 SIT 1 193.2 200.4 3.71
HIT 2 163.2 187.5 14.89 STCT 2 259.8 277.8 6.91 SIT 2 233.6 262.0 12.13
HIT 3 246.3 266.4 8.16 STCT 3 176.6 190.2 7.70 SIT 3 271.7 297.3 9.42
HIT 4 184.8 203.4 10.06 STCT 4 219.6 237.0 7.89 SIT 4 139.2 164.1 17.87
HIT 5 179.7 196.0 9.07 STCT 5 225.6 255.8 13.37 SIT 5 226.0 260.0 15.03
HIT 6 209.4 207.8 -0.76 STCT 6 194.9 206.2 5.78 SIT 6 213.5 201.1 -5.82
HIT 7 209.8 217.7 3.77 STCT 7 242.7 251.6 3.67 SIT 7 186.2 212.9 14.33
HIT 8 211.6 247.5 16.97 STCT 8 128.5 137.1 6.75 SIT 8 161.1 165.6 2.77
HIT 9 208.0 226.1 8.70 STCT 9 134.6 145.3 7.93 SIT 9 215.0 237.2 10.33
HIT 10 202.4 210.0 3.75
HIT 11 147.5 159.9 8.41
Mean 198.1 214.7 8.5 Mean 194.9 208.9 7.2 Mean 204.4 222.3 8.9
SD 27.4 29.6 5.0 SD 46.1 50.0 2.8 SD 39.7 45.4 7.4
SE 8.3 8.9 1.5 SE 15.4 16.7 0.9 SE 13.2 15.1 2.5
WLT [W]HIIT STCT SIT

Appendices
234
Pcpt Pre Post % Δ Pcpt Pre Post % Δ Pcpt Pre Post % Δ
HIT 1 300.0 320.0 6.67 STCT 1 262.5 255.0 -2.86 SIT 1 262.5 270.0 2.86
HIT 2 230.0 252.5 9.78 STCT 2 345.0 367.5 6.52 SIT 2 315.0 345.0 9.52
HIT 3 340.0 361.9 6.43 STCT 3 255.0 262.5 2.94 SIT 3 367.5 382.5 4.08
HIT 4 237.5 275.0 15.79 STCT 4 307.5 315.0 2.44 SIT 4 217.5 240.0 10.34
HIT 5 247.5 285.0 15.15 STCT 5 307.5 337.5 9.76 SIT 5 315.0 337.5 7.14
HIT 6 262.5 285.0 8.57 STCT 6 270.0 285.0 5.56 SIT 6 285.0 255.0 -10.53
HIT 7 275.0 305.0 10.91 STCT 7 337.5 345.0 2.22 SIT 7 262.5 285.0 8.57
HIT 8 287.5 317.5 10.43 STCT 8 185.0 197.5 6.76 SIT 8 217.5 232.5 6.90
HIT 9 262.5 307.5 17.14 STCT 9 210.0 195.0 -7.14 SIT 9 285.0 292.5 2.63
HIT 10 262.5 277.5 5.71
HIT 11 200.0 238.0 19.00
Mean 264.1 293.2 11.4 Mean 275.6 284.4 2.9 Mean 280.8 293.3 4.6
SD 37.4 34.3 4.6 SD 54.6 62.5 5.2 SD 48.2 51.5 6.3
SE 11.3 10.4 1.4 SE 18.2 20.8 1.7 SE 16.1 17.2 2.1
Wpeak [W]HIIT STCT SIT
Pcpt Pre Post % Δ Pcpt Pre Post % Δ Pcpt Pre Post % Δ
HIT 1 2191.0 2096.0 -4.34 STCT 1 2185.0 2129.0 -2.56 SIT 1 2285.0 2168.0 -5.12
HIT 2 2460.0 2234.0 -9.19 STCT 2 2005.0 1949.0 -2.79 SIT 2 2017.0 1947.0 -3.47
HIT 3 1995.0 1985.0 -0.50 STCT 3 2162.0 2200.0 1.76 SIT 3 1904.0 1857.0 -2.47
HIT 4 2375.0 2220.0 -6.53 STCT 4 2075.0 1993.0 -3.95 SIT 4 2319.0 2355.0 1.55
HIT 5 2373.0 2159.0 -9.02 STCT 5 2170.0 1996.0 -8.02 SIT 5 2082.0 2037.0 -2.16
HIT 6 2161.0 2142.0 -0.88 STCT 6 2215.0 2149.0 -2.98 SIT 6 2216.0 2273.0 2.57
HIT 7 2204.0 2128.0 -3.45 STCT 7 2105.0 1963.0 -6.75 SIT 7 2205.0 2139.0 -2.99
HIT 8 2142.0 2038.0 -4.86 STCT 8 2575.0 2403.0 -6.68 SIT 8 2315.0 2299.0 -0.69
HIT 9 2211.0 2093.0 -5.34 STCT 9 2458.0 2396.0 -2.52 SIT 9 2118.0 2112.0 -0.28
HIT 10 2157.0 2118.0 -1.81
HIT 11 2456.0 2306.0 -6.11
Mean 2247.7 2138.1 -4.7 Mean 2216.7 2130.9 -3.8 Mean 2162.3 2131.9 -1.5
SD 147.5 90.7 2.9 SD 183.8 176.0 3.0 SD 143.1 165.1 2.5
SE 44.5 27.4 0.9 SE 61.3 58.7 1.0 SE 47.7 55.0 0.8
20 km TT [s]HIIT STCT SIT
Pcpt Pre Post % Δ Pcpt Pre Post % Δ Pcpt Pre Post % Δ
HIT 1 38.2 39.6 3.63 STCT 1 51.2 51.5 0.65 SIT 1 51.5 54.7 6.25
HIT 2 47.1 46.9 -0.40 STCT 2 48.7 54.9 12.88 SIT 2 44.6 48.4 8.46
HIT 3 55.3 59.7 7.93 STCT 3 46.3 50.7 9.47 SIT 3 59.4 62.4 5.03
HIT 4 33.3 35.8 7.53 STCT 4 51.5 54.5 5.96 SIT 4 44.9 48.8 8.65
HIT 5 44.9 46.8 4.39 STCT 5 47.9 55.2 15.13 SIT 5 37.5 37.0 -1.22
HIT 6 52.6 51.0 -3.09 STCT 6 47.8 45.6 -4.67 SIT 6 39.1 40.8 4.42
HIT 7 39.2 42.9 9.58 STCT 7 43.9 51.5 17.40 SIT 7 41.2 42.5 3.27
HIT 8 45.8 44.2 -3.55 STCT 8 41.8 41.2 -1.49 SIT 8 48.5 51.7 6.50
HIT 9 47.9 53.8 12.31 STCT 9 41.1 46.9 14.06 SIT 9 57.4 59.8 4.14
HIT 10 53.5 54.3 1.55
HIT 11 38.1 41.3 8.40
Mean 45.1 46.9 4.4 Mean 46.7 50.2 7.7 Mean 47.1 49.6 5.1
SD 7.2 7.2 5.3 SD 3.8 4.8 8.0 SD 7.8 8.6 3.0
SE 2.2 2.2 1.6 SE 1.3 1.6 2.7 SE 2.6 2.9 1.0
VO2Peak [mL min-1
kg-1
]HIIT STCT SIT

Appendices
235
Mitochondrial respiration (expressed as pmol O2 s-1 mg-1)
Pcpt Pre Post % Δ Pcpt Pre Post % Δ Pcpt Pre Post % Δ
HIT 1 8.5 6.0 -29.28 STCT 1 13.6 7.4 -45.50 SIT 1 8.6 9.1 5.95
HIT 2 5.8 7.1 21.52 STCT 2 5.3 7.4 39.78 SIT 2 8.9 10.9 22.74
HIT 3 5.5 3.5 -36.60 STCT 3 6.4 12.1 89.95 SIT 3 8.6 7.4 -13.56
HIT 4 7.6 4.5 -41.14 STCT 4 6.2 4.9 -21.29 SIT 4 8.5 12.1 42.50
HIT 5 3.4 7.2 114.63 STCT 5 9.2 6.0 -34.59 SIT 5 6.0 9.1 50.28
HIT 6 4.5 4.9 9.98 STCT 6 8.2 4.3 -47.70 SIT 6 5.8 12.7 120.41
HIT 7 2.3 4.8 107.34 STCT 7 12.5 8.8 -29.13 SIT 7 9.2 8.6 -7.01
HIT 8 2.0 3.4 73.41 STCT 8 8.9 11.6 30.82 SIT 8 10.2 8.9 -13.10
HIT 9 3.5 8.7 146.25 STCT 9 10.5 12.5 19.69 SIT 9 7.1 10.9 53.13
HIT 10 7.6 5.4 -29.36
HIT 11 3.5 5.2 48.46
Mean 4.9 5.5 35.0 Mean 9.0 8.3 0.2 Mean 8.1 10.0 29.0
SD 2.2 1.6 67.5 SD 2.8 3.1 47.2 SD 1.5 1.8 43.3
SE 0.7 0.5 20.4 SE 0.9 1.0 15.7 SE 0.5 0.6 14.4
CIL(PM)HIIT STCT SIT
Pcpt Pre Post % Δ Pcpt Pre Post % Δ Pcpt Pre Post % Δ
HIT 1 46.7 41.3 -11.46 STCT 1 81.2 67.5 -16.87 SIT 1 55.5 68.8 24.00
HIT 2 36.5 44.5 22.05 STCT 2 63.5 51.3 -19.20 SIT 2 52.1 64.0 22.73
HIT 3 50.9 50.1 -1.62 STCT 3 60.1 62.7 4.49 SIT 3 62.5 56.3 -9.82
HIT 4 36.7 40.1 9.04 STCT 4 52.0 79.3 52.60 SIT 4 73.2 92.6 26.42
HIT 5 37.0 52.3 41.26 STCT 5 75.1 60.8 -19.01 SIT 5 59.6 77.6 30.16
HIT 6 44.4 37.8 -14.88 STCT 6 72.9 47.9 -34.29 SIT 6 51.0 78.5 53.96
HIT 7 49.3 40.5 -17.92 STCT 7 79.7 62.6 -21.47 SIT 7 60.8 54.3 -10.65
HIT 8 44.6 52.2 17.03 STCT 8 44.1 45.0 1.97 SIT 8 49.5 58.6 18.29
HIT 9 43.7 36.6 -16.07 STCT 9 40.0 63.6 59.04 SIT 9 67.7 86.9 28.28
HIT 10 65.7 53.4 -18.72
HIT 11 41.9 46.9 12.14
Mean 45.2 45.1 1.9 Mean 63.2 60.1 0.8 Mean 59.1 70.8 20.4
SD 8.4 6.2 19.9 SD 15.3 10.6 33.4 SD 8.0 13.8 20.1
SE 2.5 1.9 6.0 SE 5.1 3.5 11.1 SE 2.7 4.6 6.7
CIP(PM)HIIT STCT SIT
Pcpt Pre Post % Δ Pcpt Pre Post % Δ Pcpt Pre Post % Δ
HIT 1 79.3 61.7 -22.23 STCT 1 99.1 99.9 0.75 SIT 1 84.4 102.0 20.86
HIT 2 53.4 63.0 18.04 STCT 2 106.4 78.5 -26.24 SIT 2 77.1 92.6 20.21
HIT 3 82.7 76.2 -7.94 STCT 3 71.8 92.2 28.40 SIT 3 92.9 101.4 9.21
HIT 4 55.5 64.2 15.72 STCT 4 83.7 117.4 40.20 SIT 4 109.6 137.9 25.82
HIT 5 54.8 69.4 26.52 STCT 5 106.9 90.9 -14.94 SIT 5 74.9 120.6 61.14
HIT 6 71.7 63.3 -11.67 STCT 6 86.3 70.9 -17.85 SIT 6 74.3 112.2 51.08
HIT 7 73.2 58.6 -20.01 STCT 7 115.0 97.5 -15.19 SIT 7 83.4 83.4 0.07
HIT 8 70.9 76.9 8.39 STCT 8 61.6 67.1 8.99 SIT 8 76.5 84.6 10.60
HIT 9 61.5 51.5 -16.33 STCT 9 66.8 91.1 36.31 SIT 9 97.6 127.0 30.11
HIT 10 85.3 73.5 -13.79
HIT 11 60.2 63.8 6.04
Mean 68.0 65.6 -1.6 Mean 88.6 89.5 4.5 Mean 85.6 106.9 25.5
SD 11.6 7.7 17.0 SD 19.3 15.5 25.3 SD 12.1 19.0 19.8
SE 3.5 2.3 5.1 SE 6.4 5.2 8.4 SE 4.0 6.3 6.6
CI+CIIP(PMS)HIIT STCT SIT

Appendices
236
Pcpt Pre Post % Δ Pcpt Pre Post % Δ Pcpt Pre Post % Δ
HIT 1 59.2 89.3 50.89 STCT 1 116.4 138.0 18.49 SIT 1 100.4 129.8 29.23
HIT 2 50.9 75.0 47.41 STCT 2 132.3 92.4 -30.14 SIT 2 96.5 109.1 13.04
HIT 3 81.6 98.4 20.57 STCT 3 99.4 123.9 24.72 SIT 3 120.6 131.4 8.90
HIT 4 50.4 85.9 70.49 STCT 4 121.2 137.6 13.55 SIT 4 117.6 186.3 58.39
HIT 5 50.1 85.7 71.12 STCT 5 126.5 110.9 -12.33 SIT 5 101.7 168.7 65.85
HIT 6 67.2 86.6 28.95 STCT 6 105.2 83.4 -20.72 SIT 6 113.5 124.4 9.57
HIT 7 91.0 80.3 -11.78 STCT 7 147.3 115.1 -21.87 SIT 7 97.7 104.1 6.48
HIT 8 86.4 101.5 17.45 STCT 8 80.5 82.1 2.05 SIT 8 92.5 101.9 10.11
HIT 9 66.4 68.2 2.67 STCT 9 73.7 112.6 52.82 SIT 9 125.5 200.6 59.88
HIT 10 111.2 106.7 -3.99
HIT 11 81.9 82.7 1.00
Mean 87.4 87.9 1.1 Mean 111.4 110.7 3.0 Mean 107.4 139.6 29.1
SD 16.2 15.9 10.7 SD 24.1 21.1 27.0 SD 12.0 36.7 25.2
SE 7.2 7.1 4.8 SE 8.0 7.0 9.0 SE 4.0 12.2 8.4
CI+CIIE(PMS)HIIT STCT SIT
Pcpt Pre Post % Δ Pcpt Pre Post % Δ Pcpt Pre Post % Δ
HIT 1 49.1 38.7 -21.28 STCT 1 36.8 62.7 70.40 SIT 1 44.2 54.2 22.57
HIT 2 35.2 38.8 10.18 STCT 2 58.9 38.3 -34.97 SIT 2 39.6 48.5 22.41
HIT 3 49.6 41.1 -17.16 STCT 3 21.5 52.1 142.39 SIT 3 45.7 59.6 30.45
HIT 4 31.6 39.8 26.10 STCT 4 50.1 70.8 41.36 SIT 4 54.4 86.2 58.42
HIT 5 34.4 39.9 16.07 STCT 5 49.8 47.3 -5.07 SIT 5
HIT 6 51.4 48.8 -5.18 STCT 6 28.0 42.5 51.88 SIT 6 52.6 59.1 12.42
HIT 7 40.1 37.6 -6.25 STCT 7 56.3 58.1 3.15 SIT 7 43.4 42.3 -2.57
HIT 8 46.9 44.8 -4.47 STCT 8 31.3 30.6 -2.22 SIT 8 40.8 48.0 17.56
HIT 9 35.3 48.9 38.48 STCT 9 35.2 40.6 15.40 SIT 9 55.6 89.1 60.19
HIT 10 49.8 39.3 -21.03
HIT 11 35.5 34.8 -1.91
Mean 41.72 41.13 1.23 Mean 44.22 46.89 9.93 Mean 47.05 60.87 27.68
SD 7.65 4.50 19.46 SD 11.87 13.70 34.67 SD 6.27 17.53 21.76
SE 2.31 1.36 5.87 SE 4.20 4.84 12.26 SE 2.22 6.20 7.69
CIIE(PMS+Rot)HIIT STCT SIT
Pcpt Pre Post % Δ Pcpt Pre Post % Δ Pcpt Pre Post % Δ
HIT 1 124.5 141.0 13.25 STCT 1 173.5 195.3 12.58 SIT 1 131.6 137.8 4.71
HIT 2 101.9 115.5 13.32 STCT 2 165.9 116.6 -29.68 SIT 2 101.5 144.8 42.59
HIT 3 140.2 116.7 -16.79 STCT 3 98.0 144.2 47.22 SIT 3 126.6 128.0 1.16
HIT 4 122.5 146.8 19.85 STCT 4 118.8 169.7 42.86 SIT 4 179.5 231.5 28.94
HIT 5 94.3 98.7 4.65 STCT 5 135.8 117.7 -13.28 SIT 5 126.3 188.1 48.92
HIT 6 144.4 119.6 -17.15 STCT 6 154.1 114.5 -25.70 SIT 6 137.2 142.7 4.03
HIT 7 120.0 139.7 16.44 STCT 7 153.7 126.7 -17.56 SIT 7 116.6 111.9 -4.04
HIT 8 134.8 128.2 -4.90 STCT 8 98.3 79.8 -18.77 SIT 8 121.1 117.9 -2.60
HIT 9 116.5 119.2 2.28 STCT 9 95.7 90.2 -5.77 SIT 9 150.6 245.5 63.01
HIT 10 152.7 131.7 -13.77
HIT 11 111.9 118.6 5.99
Mean 124.0 125.1 2.1 Mean 132.6 128.3 -0.9 Mean 132.3 160.9 20.7
SD 17.9 14.0 13.5 SD 30.9 36.6 28.8 SD 22.3 49.2 25.5
SE 5.4 4.2 4.1 SE 10.3 12.2 9.6 SE 7.4 16.4 8.5
CIVRes(Tm+As)HIIT STCT SIT

Appendices
237
Enzyme activity
Protein content (expressed as arbitrary units)
Pcpt Pre Post % Δ Pcpt Pre Post % Δ Pcpt Pre Post % Δ
HIT 1 11.7 9.2 -21.22 STCT 1 8.1 10.4 27.89 SIT 1 10.0 8.5 -14.71
HIT 2 6.2 11.8 91.33 STCT 2 11.9 9.2 -22.20 SIT 2 8.4 7.5 -11.29
HIT 3 7.3 7.0 -3.84 STCT 3 10.2 11.3 10.64 SIT 3 9.7 10.9 12.81
HIT 4 5.4 7.6 38.63 STCT 4 7.5 9.7 28.52 SIT 4 10.1 10.5 4.72
HIT 5 6.2 8.7 40.54 STCT 5 10.3 9.8 -4.94 SIT 5 11.2 12.9 14.65
HIT 6 10.1 8.9 -11.74 STCT 6 9.7 9.7 -0.70 SIT 6 9.1 8.9 -2.04
HIT 7 6.7 6.1 -8.31 STCT 7 7.6 10.2 35.55 SIT 7 5.9 7.1 20.18
HIT 8 8.5 8.0 -6.88 STCT 8 7.7 8.9 15.68 SIT 8 8.1 8.4 3.01
HIT 9 7.2 9.3 29.80 STCT 9 10.8 9.0 -16.58 SIT 9 11.9 11.7 -2.24
HIT 10 11.4 11.3 -0.63
HIT 11 7.4 6.6 -11.40
Mean 8.0 8.6 12.4 Mean 9.3 9.8 8.2 Mean 9.4 9.6 2.8
SD 2.2 1.8 33.9 SD 1.6 0.8 20.6 SD 1.8 2.0 11.7
SE 0.6 0.5 10.2 SE 0.5 0.3 6.9 SE 0.6 0.7 3.9
CS activity (mol/h/kg protein)HIIT STCT SIT
Pcpt Pre Post % Δ Pcpt Pre Post % Δ Pcpt Pre Post % Δ
HIT 1 1.73 1.39 -20.0 STCT 1 1.52 1.25 -17.7 SIT 1 1.15 1.35 17.5
HIT 2 1.84 2.09 13.8 STCT 2 0.73 1.25 71.6 SIT 2 0.63 1.71 172.4
HIT 3 1.77 1.52 -14.2 STCT 3 1.74 0.91 -48.1 SIT 3 1.09 1.66 51.2
HIT 4 0.94 2.51 167.0 STCT 4 1.12 1.60 42.3 SIT 4 1.13 1.60 41.7
HIT 5 0.97 1.76 81.4 STCT 5 0.74 1.43 92.4 SIT 5 1.06 1.37 28.9
HIT 6 0.86 1.70 97.9 STCT 6 0.90 1.20 33.0 SIT 6 0.62 1.28 107.0
HIT 7 1.25 1.14 -8.8 STCT 7 2.25 2.50 11.2 SIT 7 1.86 1.61 -13.7
HIT 8 0.80 1.53 90.9 STCT 8 2.13 3.37 58.1 SIT 8 1.08 1.40 30.3
HIT 9 1.36 0.78 -42.6 STCT 9 1.52 1.80 18.9 SIT 9 1.29 2.77 115.6
HIT 10 0.75 0.90 19.5
HIT 11 0.73 0.67 -8.1
Mean 1.2 1.5 34.3 Mean 1.4 1.7 29.1 Mean 1.1 1.6 61.2
SD 0.4 0.6 65.3 SD 0.6 0.8 43.9 SD 0.4 0.5 58.5
SE 0.1 0.2 19.7 SE 0.2 0.3 14.6 SE 0.1 0.2 19.5
PGC-1αHIIT - raw data STCT - raw data SIT - raw data

Appendices
238
Pcpt Pre Post % Δ Pcpt Pre Post % Δ Pcpt Pre Post % Δ
HIT 1 0.82 1.08 31.0 STCT 1 1.54 1.50 -3.1 SIT 1 0.74 1.89 154.3
HIT 2 1.58 1.58 0.0 STCT 2 0.72 1.09 50.5 SIT 2 0.79 1.86 133.8
HIT 3 1.62 1.58 -2.1 STCT 3 1.53 0.76 -50.3 SIT 3 1.39 1.97 42.1
HIT 4 1.02 1.64 60.5 STCT 4 1.01 1.39 37.9 SIT 4 0.70 1.21 72.3
HIT 5 0.81 1.96 143.0 STCT 5 0.92 1.38 50.8 SIT 5 0.79 1.03 30.6
HIT 6 0.37 1.08 189.8 STCT 6 0.92 1.20 30.3 SIT 6 0.52 1.24 138.1
HIT 7 0.49 0.93 87.7 STCT 7 1.76 1.41 -20.0 SIT 7 1.58 0.80 -49.2
HIT 8 0.93 0.98 6.0 STCT 8 1.28 1.72 33.9 SIT 8 0.45 0.96 111.3
HIT 9 1.14 0.38 -67.0 STCT 9 0.52 0.71 35.1 SIT 9 0.46 1.41 206.2
HIT 10 0.48 0.87 79.6
HIT 11 1.19 0.64 -46.1
Mean 1.0 1.2 43.8 Mean 1.1 1.2 18.3 Mean 0.8 1.4 93.3
SD 0.4 0.5 77.9 SD 0.4 0.3 34.9 SD 0.4 0.4 77.2
SE 0.1 0.1 23.5 SE 0.1 0.1 11.6 SE 0.1 0.1 25.7
p53HIT - raw data STCT - raw data SIT - raw data
Pcpt Pre Post % Δ Pcpt Pre Post % Δ Pcpt Pre Post % Δ
HIT 1 1.20 1.31 8.9 STCT 1 2.32 3.09 33.2 SIT 1 1.57 2.26 43.7
HIT 2 1.51 1.29 -14.2 STCT 2 1.35 1.81 33.4 SIT 2 0.95 3.01 217.7
HIT 3 1.74 1.42 -18.5 STCT 3 2.94 1.26 -57.1 SIT 3 3.02 3.41 13.0
HIT 4 0.96 0.92 -4.0 STCT 4 1.29 2.14 65.3 SIT 4 1.00 2.09 109.4
HIT 5 0.92 0.84 -8.6 STCT 5 1.01 1.63 61.6 SIT 5 0.98 1.36 38.0
HIT 6 0.55 0.44 -20.8 STCT 6 1.49 1.48 -0.4 SIT 6 0.74 1.77 138.0
HIT 7 0.94 1.24 32.1 STCT 7 2.53 2.23 -11.8 SIT 7 2.17 1.50 -30.8
HIT 8 1.52 1.96 29.1 STCT 8 2.05 3.05 48.6 SIT 8 0.79 1.49 89.2
HIT 9 1.91 0.90 -52.7 STCT 9 1.29 2.48 92.3 SIT 9 0.91 2.19 140.1
HIT 10 0.69 0.87 25.9
HIT 11 0.94 1.27 34.7
Mean 1.2 1.1 1.1 Mean 1.8 2.1 29.5 Mean 1.3 2.1 84.3
SD 0.4 0.4 27.7 SD 0.7 0.7 45.8 SD 0.8 0.7 76.3
SE 0.1 0.1 8.3 SE 0.2 0.2 15.3 SE 0.3 0.2 25.4
PHF20HIT - raw data STCT - raw data SIT - raw data
Pcpt Pre Post % Δ Pcpt Pre Post % Δ Pcpt Pre Post % Δ
HIT 1 0.96 1.50 55.6 STCT 1 2.04 1.56 -23.5 SIT 1 2.25 1.41 -37.1
HIT 2 1.43 0.90 -37.1 STCT 2 1.54 1.79 15.9 SIT 2 1.56 1.57 0.6
HIT 3 1.74 1.56 -10.2 STCT 3 1.96 2.29 16.5 SIT 3 2.32 3.68 58.5
HIT 4 1.39 1.08 -22.2 STCT 4 1.32 1.65 25.0 SIT 4 1.42 1.93 35.5
HIT 5 0.97 2.07 113.3 STCT 5 1.31 1.18 -9.4 SIT 5 1.46 1.65 12.4
HIT 6 1.09 1.06 -3.0 STCT 6 1.30 1.42 9.2 SIT 6 1.28 1.03 -19.4
HIT 7 1.02 0.76 -25.4 STCT 7 1.11 1.00 -9.9 SIT 7 1.36 1.07 -20.7
HIT 8 1.20 2.91 143.2 STCT 8 0.71 1.86 163.7 SIT 8 0.95 1.10 15.6
HIT 9 0.86 0.46 -46.2 STCT 9 2.08 1.33 -36.1 SIT 9 1.36 1.87 37.3
HIT 10 0.41 0.72 74.9
HIT 11 1.69 0.93 -44.9
Mean 1.2 1.3 18.0 Mean 1.5 1.6 16.8 Mean 1.6 1.7 9.2
SD 0.4 0.7 67.3 SD 0.5 0.4 58.7 SD 0.5 0.8 31.4
SE 0.1 0.2 20.3 SE 0.2 0.1 19.6 SE 0.2 0.3 10.5
TFAMHIT - raw data STCT - raw data SIT - raw data

Appendices
239
Pcpt Pre Post % Δ Pcpt Pre Post % Δ Pcpt Pre Post % Δ
HIT 1 1.05 1.07 1.6 STCT 1 1.37 1.36 -1.0 SIT 1 1.33 1.19 -10.4
HIT 2 0.93 1.22 31.3 STCT 2 1.07 1.03 -3.7 SIT 2 0.92 0.99 7.4
HIT 3 1.25 1.05 -16.0 STCT 3 1.18 1.25 5.7 SIT 3 1.66 1.58 -4.7
HIT 4 1.02 1.21 19.4 STCT 4 1.09 1.37 26.2 SIT 4 1.07 1.03 -3.9
HIT 5 1.36 1.24 -8.7 STCT 5 1.04 0.92 -12.2 SIT 5 1.11 1.31 17.5
HIT 6 1.15 1.26 9.6 STCT 6 1.23 1.14 -7.3 SIT 6 0.77 0.75 -2.9
HIT 7 1.29 1.15 -11.1 STCT 7 0.71 1.01 41.8 SIT 7 0.56 1.05 88.6
HIT 8 1.10 1.15 5.2 STCT 8 0.36 0.57 57.1 SIT 8 0.30 0.53 74.9
HIT 9 1.20 1.42 17.7 STCT 9 1.16 0.71 -38.7 SIT 9 1.06 1.11 4.4
HIT 10 1.05 1.17 11.0
HIT 11 0.87 0.89 3.2
Mean 1.1 1.2 5.8 Mean 1.0 1.0 7.6 Mean 1.0 1.1 19.0
SD 0.2 0.1 14.2 SD 0.3 0.3 29.4 SD 0.4 0.3 36.7
SE 0.0 0.0 4.3 SE 0.1 0.1 9.8 SE 0.1 0.1 12.2
Complex IHIT - raw data STCT - raw data SIT - raw data
Pcpt Pre Post % Δ Pcpt Pre Post % Δ Pcpt Pre Post % Δ
HIT 1 1.26 1.42 12.7 STCT 1 1.02 1.37 34.4 SIT 1 1.27 1.21 -4.7
HIT 2 1.07 1.56 46.4 STCT 2 1.03 0.85 -17.3 SIT 2 0.99 0.88 -10.7
HIT 3 1.34 1.20 -9.8 STCT 3 1.22 1.18 -3.5 SIT 3 1.25 1.23 -1.9
HIT 4 1.11 1.29 16.0 STCT 4 1.37 2.03 48.2 SIT 4 1.34 1.22 -9.5
HIT 5 1.42 1.23 -13.2 STCT 5 1.59 1.34 -16.1 SIT 5 1.82 1.80 -0.6
HIT 6 1.08 1.19 10.3 STCT 6 1.48 1.37 -7.3 SIT 6 1.20 0.91 -23.9
HIT 7 1.87 1.06 -43.0 STCT 7 0.68 1.01 48.3 SIT 7 0.72 1.30 80.4
HIT 8 0.94 1.42 51.0 STCT 8 0.46 0.54 17.9 SIT 8 0.57 0.88 53.5
HIT 9 1.34 1.68 25.3 STCT 9 1.00 1.00 -0.1 SIT 9 0.66 0.75 14.5
HIT 10 0.72 0.67 -7.9
HIT 11 0.79 0.92 16.2
Mean 1.2 1.2 9.5 Mean 1.1 1.2 11.6 Mean 1.1 1.1 10.8
SD 0.3 0.3 27.2 SD 0.4 0.4 26.4 SD 0.4 0.3 34.1
SE 0.1 0.1 8.2 SE 0.1 0.1 8.8 SE 0.1 0.1 11.4
Complex IIHIT - raw data STCT - raw data SIT - raw data
Pcpt Pre Post % Δ Pcpt Pre Post % Δ Pcpt Pre Post % Δ
HIT 1 1.20 1.14 -4.9 STCT 1 1.38 1.46 6.1 SIT 1 1.34 1.44 7.2
HIT 2 1.09 1.22 12.0 STCT 2 1.32 1.39 5.9 SIT 2 1.39 1.18 -15.3
HIT 3 1.20 1.28 6.2 STCT 3 1.40 1.69 20.3 SIT 3 1.44 1.70 18.0
HIT 4 1.13 1.27 12.4 STCT 4 2.02 2.25 11.4 SIT 4 1.38 2.09 51.2
HIT 5 1.22 1.24 1.5 STCT 5 1.91 1.71 -10.4 SIT 5 2.12 2.02 -5.1
HIT 6 1.30 1.29 -0.6 STCT 6 1.94 2.12 9.1 SIT 6 1.86 1.56 -16.0
HIT 7 1.06 1.04 -1.8 STCT 7 1.69 2.00 18.6 SIT 7 1.01 1.12 11.4
HIT 8 1.04 1.10 6.2 STCT 8 1.58 1.86 17.8 SIT 8 1.71 1.94 13.9
HIT 9 1.05 1.09 3.7 STCT 9 1.83 1.55 -15.1 SIT 9 2.02 1.91 -5.5
HIT 10 1.01 0.94 -6.5
HIT 11 1.02 1.05 3.8
Mean 1.1 1.2 2.9 Mean 1.7 1.8 7.1 Mean 1.6 1.7 6.6
SD 0.1 0.1 6.2 SD 0.3 0.3 12.5 SD 0.4 0.4 20.8
SE 0.0 0.0 1.9 SE 0.1 0.1 4.2 SE 0.1 0.1 6.9
Complex IIIHIT - raw data STCT - raw data SIT - raw data

Appendices
240
Pcpt Pre Post % Δ Pcpt Pre Post % Δ Pcpt Pre Post % Δ
HIT 1 0.98 1.08 10.2 STCT 1 1.12 1.26 13.2 SIT 1 1.25 1.09 -13.0
HIT 2 0.91 1.27 39.9 STCT 2 0.89 0.86 -3.4 SIT 2 0.74 0.79 6.1
HIT 3 1.41 1.32 -6.4 STCT 3 1.22 1.24 1.8 SIT 3 1.28 1.25 -2.0
HIT 4 1.06 1.15 8.5 STCT 4 1.01 1.33 31.4 SIT 4 1.00 1.10 10.3
HIT 5 1.35 1.12 -17.0 STCT 5 1.15 0.99 -13.8 SIT 5 1.18 1.18 -0.4
HIT 6 1.07 1.22 14.7 STCT 6 1.20 1.26 5.6 SIT 6 1.00 0.81 -19.1
HIT 7 1.15 1.01 -12.2 STCT 7 0.78 1.08 39.1 SIT 7 0.71 1.06 49.2
HIT 8 1.05 1.01 -3.4 STCT 8 0.04 0.04 9.5 SIT 8 0.40 0.80 99.3
HIT 9 1.07 1.16 8.4 STCT 9 1.87 1.08 -42.3 SIT 9 1.14 1.22 6.9
HIT 10 0.80 0.88 9.8
HIT 11 0.81 0.83 2.8
Mean 1.1 1.1 5.0 Mean 1.0 1.0 4.6 Mean 1.0 1.0 15.2
SD 0.2 0.2 15.4 SD 0.5 0.4 24.0 SD 0.3 0.2 36.9
SE 0.1 0.0 4.6 SE 0.2 0.1 8.0 SE 0.1 0.1 12.3
Complex IVHIT - raw data STCT - raw data SIT - raw data
Pcpt Pre Post % Δ Pcpt Pre Post % Δ Pcpt Pre Post % Δ
HIT 1 1.18 1.26 7.2 STCT 1 1.18 1.66 40.1 SIT 1 1.18 1.31 10.5
HIT 2 1.12 1.26 12.5 STCT 2 1.29 1.40 8.8 SIT 2 1.22 1.15 -5.9
HIT 3 1.30 1.25 -4.2 STCT 3 1.14 1.63 42.9 SIT 3 1.51 1.53 1.2
HIT 4 1.25 1.26 1.0 STCT 4 1.45 1.60 10.0 SIT 4 1.06 1.21 13.8
HIT 5 1.21 1.27 5.4 STCT 5 1.36 1.31 -3.9 SIT 5 1.51 1.61 6.4
HIT 6 1.21 1.22 1.3 STCT 6 1.85 1.59 -14.4 SIT 6 1.20 0.98 -18.0
HIT 7 1.07 0.98 -8.5 STCT 7 1.23 2.04 65.5 SIT 7 0.92 1.04 12.9
HIT 8 0.95 1.13 19.4 STCT 8 0.92 1.43 54.8 SIT 8 1.12 1.57 39.9
HIT 9 0.97 1.01 4.2 STCT 9 2.10 1.47 -30.0 SIT 9 1.66 1.53 -7.5
HIT 10 0.89 0.83 -7.1
HIT 11 0.86 0.79 -8.0
Mean 1.1 1.1 2.1 Mean 1.4 1.6 19.3 Mean 1.3 1.3 5.9
SD 0.2 0.2 8.9 SD 0.4 0.2 32.9 SD 0.2 0.2 16.6
SE 0.0 0.1 2.7 SE 0.1 0.1 11.0 SE 0.1 0.1 5.5
Complex VHIT - raw data STCT - raw data SIT - raw data
Pcpt Pre Post % Δ Pcpt Pre Post % Δ Pcpt Pre Post % Δ
DR 2.86 1.75 -38.8 4MM 1.67 2.17 29.8 1EA 1.36 1.47 7.6
EA 1.49 3.09 107.8 5JR 1.27 1.34 5.5 2DR 1.55 1.70 9.5
AG 1.45 1.62 11.8 7MR 1.23 1.95 58.4 8SM 1.48 1.77 19.9
MV 0.96 1.16 21.2 10JK 1.91 2.23 16.7 9MA 2.26 2.37 4.9
HB 1.23 1.66 35.0 12SA 1.81 2.75 52.1 11FS 2.23 2.64 18.0
EC 1.41 1.05 -25.4 13DD 1.97 2.04 3.6 17JS 1.96 2.07 5.7
MP 2.22 1.36 -38.8 14MT 0.63 2.44 285.2 18MF 0.78 0.74 -4.6
MM 2.01 3.12 55.4 16HM 0.59 1.53 158.5 19SB 0.61 1.66 170.1
PV 1.44 1.24 -14.1 21SO 2.04 0.98 -52.1 23TS 1.05 0.74 -29.1
BO 0.79 1.41 79.0
PA 0.96 0.72 -24.7
Mean 1.5 1.7 15.3 Mean 1.5 1.9 61.9 Mean 1.5 1.7 22.4
SD 0.6 0.8 49.6 SD 0.6 0.6 101.2 SD 0.6 0.6 57.2
SE 0.2 0.2 15.0 SE 0.2 0.2 33.7 SE 0.2 0.2 19.1
MFN2HIT - raw data STCT - raw data SIT - raw data

Appendices
241
Pcpt Pre Post % Δ Pcpt Pre Post % Δ Pcpt Pre Post % Δ
DR 0.59 0.62 5.7 4MM 1.90 1.14 -40.0 1EA 2.52 1.12 -55.4
EA 0.92 0.71 -22.7 5JR 1.14 2.33 104.3 2DR 1.39 1.95 40.2
AG 0.78 0.70 -10.1 7MR 1.49 2.16 45.3 8SM 1.70 3.97 133.2
MV 0.62 1.14 84.3 10JK 3.37 9.04 168.5 9MA 2.90 10.46 260.8
HB 0.58 1.12 92.7 12SA 4.11 2.97 -27.6 11FS 3.82 4.21 10.1
EC 0.33 0.90 173.1 13DD 6.36 7.23 13.7 17JS 6.04 3.88 -35.8
MP 0.52 0.48 -8.4 14MT 5.14 4.36 -15.1 18MF 2.59 1.19 -54.1
MM 0.84 0.99 17.9 16HM 0.84 4.31 414.7 19SB 1.91 2.42 27.0
PV 0.77 0.63 -18.0 21SO 3.53 2.60 -26.4 23TS 1.39 3.13 125.7
BO 0.51 0.54 4.2
PA 0.57 0.63 9.5
Mean 0.6 0.8 29.8 Mean 3.1 4.0 70.8 Mean 2.7 3.6 50.2
SD 0.2 0.2 61.1 SD 1.9 2.6 146.5 SD 1.5 2.8 105.2
SE 0.1 0.1 18.4 SE 0.6 0.9 48.8 SE 0.5 0.9 35.1
DRP1HIT - raw data STCT - raw data SIT - raw data
Pcpt Pre Post % Δ Pcpt Pre Post % Δ Pcpt Pre Post % Δ
DR 2.29 3.87 68.9 4MM 2.08 3.10 48.9 1EA 2.43 2.24 -7.7
EA 2.64 3.31 25.3 5JR 1.70 2.53 49.0 2DR 2.57 2.08 -19.2
AG 1.70 1.21 -28.8 7MR 1.50 1.69 12.5 8SM 1.59 2.19 37.6
MV 2.03 2.53 24.7 10JK 1.85 2.26 22.1 9MA 1.07 1.84 71.8
HB 3.17 3.38 6.7 12SA 1.95 2.29 17.6 11FS 1.94 2.30 18.9
EC 3.13 1.73 -44.6 13DD 1.74 1.52 -12.5 17JS 1.68 1.83 9.0
MP 1.96 1.19 -39.4 14MT 2.80 4.16 48.3 18MF 1.85 2.58 39.4
MM 1.48 1.29 -12.6 16HM 1.98 2.80 41.4 19SB 3.00 2.26 -24.6
PV 1.20 1.25 4.0 21SO 1.55 1.91 23.3 23TS 2.48 2.88 16.3
BO 1.40 2.45 75.1
PA 2.68 1.46 -45.5
Mean 2.2 2.2 3.1 Mean 1.9 2.5 27.8 Mean 2.1 2.2 15.7
SD 0.7 1.0 42.7 SD 0.4 0.8 21.0 SD 0.6 0.3 30.9
SE 0.2 0.3 12.9 SE 0.1 0.3 7.0 SE 0.2 0.1 10.3
SCO2HIT - raw data STCT - raw data SIT - raw data
Pcpt Pre Post % Δ Pcpt Pre Post % Δ Pcpt Pre Post % Δ
DR 1.94 1.88 -3.3 4MM 2.42 3.59 48.5 1EA 1.98 2.70 36.5
EA 1.49 2.76 85.5 5JR 1.87 2.24 19.6 2DR 1.44 2.67 85.2
AG 1.49 1.68 12.7 7MR 4.06 2.29 -43.6 8SM 3.28 2.32 -29.2
MV 0.99 1.34 35.5 10JK 5.24 4.80 -8.4 9MA 2.25 4.23 88.3
HB 0.82 1.22 48.0 12SA 1.91 3.19 67.2 11FS 6.09 4.15 -31.9
EC 0.60 0.45 -25.1 13DD 1.97 6.47 228.1 17JS 1.66 3.41 106.2
MP 2.32 2.08 -10.5 14MT 2.29 2.95 28.6 18MF 2.05 2.27 10.9
MM 1.31 3.40 160.5 16HM 1.57 3.09 97.1 19SB 1.92 2.40 25.0
PV 3.16 2.24 -29.1 21SO 2.47 1.44 -41.7 23TS 2.74 2.44 -10.9
BO 2.15 0.92 -57.3
PA 0.34 1.46 334.3
Mean 1.5 1.8 50.1 Mean 2.6 3.3 43.9 Mean 2.6 3.0 31.1
SD 0.8 0.8 112.2 SD 1.2 1.5 83.6 SD 1.4 0.8 52.1
SE 0.3 0.3 33.8 SE 0.4 0.5 27.9 SE 0.5 0.3 17.4
AIFHIT - raw data STCT - raw data SIT - raw data

Appendices
242

Appendices
243
CHAPTER 3 – RAW DATA
Physiological parameters
Pcpt Age Mass Height Pcpt NT INT RT
Ptcp 1 20.2 94.7 191.6 Ptcp 1 4.1 20.5 0.7
Ptcp 2 24.0 69.5 169.0 Ptcp 2 3.2 16.8 0.6
Ptcp 3 20.9 72.5 174.0 Ptcp 3 4.2 12.1 0.8
Ptcp 4 19.6 112.0 180.3 Ptcp 4 3.4 12.2 0.6
Ptcp 5 19.3 66.1 170.7 Ptcp 5 3.7 15.2 0.6
Ptcp 6 20.6 86.5 193.0 Ptcp 6 4.0 18.3 0.7
Ptcp 7 19.9 84.7 198.6 Ptcp 7 4.0 17.6 0.7
Ptcp 8 21.8 76.6 180.5 Ptcp 8 3.8 8.2 0.6
Ptcp 9 18.7 65.9 165.8 Ptcp 9 3.6 14.1 0.6
Ptcp 10 19.9 77.0 173.4 Ptcp 10 2.1 11.8 0.5
Mean 20.5 80.6 179.7 Mean 3.6 14.7 0.6
SD 1.5 14.5 11.3 SD 0.6 3.7 0.1
SE 0.5 4.6 3.6 SE 0.2 1.2 0.0
Age [y] - Mass [kg] - Height [cm] Total Work [MJ]
Pcpt pre-NT post-NT post-INT post-RT Pcpt pre-NT post-NT post-INT post-RT
Ptcp 1 216.0 238.9 272.4 271.6 Ptcp 1 300.0 320.0 370.0 330.0
Ptcp 2 163.2 187.5 187.0 200.2 Ptcp 2 230.0 252.5 275.0 283.0
Ptcp 3 246.3 266.4 283.4 270.7 Ptcp 3 340.0 361.9 374.2 390.0
Ptcp 4 184.8 203.4 225.9 202.4 Ptcp 4 237.5 275.0 297.5 260.0
Ptcp 5 209.4 207.8 214.6 203.0 Ptcp 5 262.5 285.0 285.0 277.5
Ptcp 6 209.8 217.7 259.1 264.3 Ptcp 6 275.0 305.0 335.0 335.0
Ptcp 7 211.6 247.5 264.1 250.0 Ptcp 7 287.5 317.5 347.5 325.0
Ptcp 8 208.0 226.1 222.3 202.3 Ptcp 8 262.5 307.5 300.0 285.0
Ptcp 9 202.4 210.0 222.7 229.1 Ptcp 9 262.5 277.5 292.5 285.0
Ptcp 10 147.5 159.9 183.2 186.0 Ptcp 10 200.0 238.0 260.0 255.0
Mean 199.9 216.5 233.5 228.0 Mean 265.8 294.0 313.7 302.6
SD 28.1 30.5 34.9 33.3 SD 39.0 36.1 40.2 41.7
SE 8.9 9.6 11.0 10.5 SE 12.3 11.4 12.7 13.2
WLT [w] Wpeak [w]

Appendices
244
Enzyme activity
Pcpt pre-NT post-NT post-INT post-RT Pcpt pre-NT post-NT post-INT post-RT
Ptcp 1 2191.0 2096.0 1932.0 1987.0 Ptcp 1 38.2 39.6 48.0 43.5
Ptcp 2 2460.0 2234.0 2092.0 2094.0 Ptcp 2 47.1 46.9 54.2 51.5
Ptcp 3 1995.0 1985.0 1963.0 1925.0 Ptcp 3 55.3 59.7 62.9 63.1
Ptcp 4 2375.0 2220.0 2063.0 2052.0 Ptcp 4 33.3 35.8 38.7 37.2
Ptcp 5 2161.0 2142.0 2064.0 2140.0 Ptcp 5 52.6 51.0 53.9 47.4
Ptcp 6 2204.0 2128.0 1963.0 1978.0 Ptcp 6 39.2 42.9 45.4 40.7
Ptcp 7 2142.0 2038.0 1932.0 1927.0 Ptcp 7 45.8 44.2 55.8 47.1
Ptcp 8 2211.0 2093.0 2079.0 2041.0 Ptcp 8 47.9 53.8 58.9 56.3
Ptcp 9 2157.0 2118.0 2051.0 2087.0 Ptcp 9 53.5 54.3 59.6 56.8
Ptcp 10 2456.0 2306.0 2193.0 2241.0 Ptcp 10 38.1 41.3 44.5 45.2
Mean 2235.2 2136.0 2033.2 2047.2 Mean 45.1 46.9 52.2 48.9
SD 149.2 95.4 84.1 98.8 SD 7.6 7.6 7.7 8.0
SE 47.2 30.2 26.6 31.2 SE 2.4 2.4 2.4 2.5
20k-TT [s] VO2Peak [mL min-1
kg-1
]
Pcpt pre-NT post-NT post-INT post-RT
Ptcp 1 11.7 9.2 8.5 13.5
Ptcp 2 6.2 11.8 14.7 14.5
Ptcp 3 7.3 7.0 10.9 12.3
Ptcp 4 5.4 7.6 11.1 10.3
Ptcp 5 10.1 8.9 13.7 10.8
Ptcp 6 6.7 6.1 13.0 7.1
Ptcp 7 8.5 8.0 9.6 9.5
Ptcp 8 7.2 9.3 10.4 9.9
Ptcp 9 11.4 11.3 15.0 10.1
Ptcp 10 7.4 6.6 8.7 7.7
Mean 8.2 8.6 11.6 10.6
SD 2.2 1.9 2.4 2.4
SE 0.7 0.6 0.8 0.7
CS activity (mol/h/kg protein)

Appendices
245
Mitochondrial respiration (expressed as pmol O2 s-1 mg-1)
Pcpt pre-NT post-NT post-INT post-RT Pcpt pre-NT post-NT post-INT post-RT
Ptcp 1 8.5 6.0 7.0 4.2 Ptcp 1 46.7 41.3 75.2 53.0
Ptcp 2 5.8 7.1 7.5 8.6 Ptcp 2 36.5 44.5 72.1 71.0
Ptcp 3 5.5 3.5 7.8 7.8 Ptcp 3 50.9 50.1 76.7 59.5
Ptcp 4 7.6 4.5 8.0 5.0 Ptcp 4 36.7 40.1 54.6 46.6
Ptcp 5 4.5 4.9 7.6 8.2 Ptcp 5 44.4 37.8 57.4 59.3
Ptcp 6 2.3 4.8 5.8 6.7 Ptcp 6 49.3 40.5 49.8 47.4
Ptcp 7 2.0 3.4 11.7 5.9 Ptcp 7 44.6 52.2 67.0 51.8
Ptcp 8 3.5 8.7 5.8 8.1 Ptcp 8 43.7 36.6 59.2 54.5
Ptcp 9 7.6 5.4 5.2 9.2 Ptcp 9 65.7 53.4 73.6 48.1
Ptcp 10 3.5 5.2 8.3 7.1 Ptcp 10 41.9 46.9 63.0 59.3
Mean 5.1 5.3 7.5 7.1 Mean 46.0 44.3 64.9 55.0
SD 2.3 1.6 1.8 1.6 SD 8.3 6.0 9.5 7.5
SE 0.7 0.5 0.6 0.5 SE 2.6 1.9 3.0 2.4
CIL(PM) CIP(PM)
Pcpt pre-NT post-NT post-INT post-RT Pcpt pre-NT post-NT post-INT post-RT
Ptcp 1 79.3 61.7 115.7 80.3 Ptcp 1 59.2 89.3 154.0 118.0
Ptcp 2 53.4 63.0 105.0 109.8 Ptcp 2 50.9 75.0 145.8 137.8
Ptcp 3 82.7 76.2 110.5 83.4 Ptcp 3 81.6 98.4 167.0 110.3
Ptcp 4 55.5 64.2 82.7 70.4 Ptcp 4 50.4 85.9 111.3 85.3
Ptcp 5 71.7 63.3 84.9 86.2 Ptcp 5 67.2 86.6 109.5 107.3
Ptcp 6 73.2 58.6 79.5 63.0 Ptcp 6 91.0 80.3 96.9 75.9
Ptcp 7 70.9 76.9 99.7 70.5 Ptcp 7 86.4 101.5 132.9 84.2
Ptcp 8 61.5 51.5 87.9 71.7 Ptcp 8 66.4 68.2 111.6 89.5
Ptcp 9 85.3 73.5 109.8 77.6 Ptcp 9 111.2 106.7 156.5 100.4
Ptcp 10 60.2 63.8 87.6 80.6 Ptcp 10 81.9 82.7 112.6 100.4
Mean 69.4 65.3 96.3 79.3 Mean 87.4 87.9 122.1 90.1
SD 11.3 8.0 13.3 12.8 SD 16.2 15.9 23.1 10.6
SE 3.6 2.5 4.2 4.1 SE 7.2 7.1 10.3 4.7
CI+CIIP(PMS) CI+CIIE(PMS)
Pcpt pre-NT post-NT post-INT post-RT Pcpt pre-NT post-NT post-INT post-RT
Ptcp 1 49.1 38.7 54.7 46.5 Ptcp 1 124.5 141.0 179.4 140.3
Ptcp 2 35.2 38.8 63.5 66.9 Ptcp 2 101.9 115.5 155.9 173.2
Ptcp 3 49.6 41.1 69.1 48.5 Ptcp 3 140.2 116.7 186.3 139.8
Ptcp 4 31.6 39.8 51.2 41.3 Ptcp 4 122.5 146.6 125.9 135.5
Ptcp 5 51.4 48.8 48.5 42.7 Ptcp 5 144.4 119.6 108.1 109.0
Ptcp 6 40.1 37.6 54.6 35.0 Ptcp 6 120.0 139.7 141.1 92.4
Ptcp 7 46.9 44.8 56.4 32.6 Ptcp 7 134.8 128.2 127.7 108.6
Ptcp 8 35.3 48.9 53.1 38.5 Ptcp 8 116.5 119.2 160.3 129.5
Ptcp 9 49.8 39.3 63.6 43.9 Ptcp 9 152.7 131.7 207.0 128.2
Ptcp 10 35.5 34.8 43.7 42.9 Ptcp 10 111.9 118.6 136.4 144.9
Mean 42.5 41.3 55.8 43.9 Mean 126.9 127.7 152.8 130.1
SD 7.6 4.7 7.7 9.4 SD 15.8 11.5 30.9 22.7
SE 2.4 1.5 2.4 3.0 SE 5.0 3.6 9.8 7.2
CIIE(PMS+Rot) CIVE (Tm+As)

Appendices
246
Protein content (expressed as arbitrary units)
Pcpt pre-NT post-NT post-INT post-RT Pcpt pre-NT post-NT post-INT post-RT
Ptcp 1 1.05 1.07 1.19 1.14 Ptcp 1 1.26 1.42 1.51 1.38
Ptcp 2 0.93 1.22 1.27 1.41 Ptcp 2 1.07 1.56 1.56 1.51
Ptcp 3 1.25 1.05 1.35 1.19 Ptcp 3 1.34 1.20 1.64 1.68
Ptcp 4 1.02 1.21 1.44 1.25 Ptcp 4 1.11 1.29 1.90 1.32
Ptcp 5 1.36 1.24 1.45 1.27 Ptcp 5 1.42 1.23 1.54 1.12
Ptcp 6 1.15 1.26 1.37 1.21 Ptcp 6 1.08 1.19 1.35 1.08
Ptcp 7 1.29 1.15 1.28 1.07 Ptcp 7 1.87 1.06 1.53 0.85
Ptcp 8 1.10 1.15 1.31 1.21 Ptcp 8 0.94 1.42 1.96 1.80
Ptcp 9 1.20 1.42 1.48 1.18 Ptcp 9 1.34 1.68 2.55 1.68
Ptcp 10 1.05 1.17 1.31 1.11 Ptcp 10 0.72 0.67 0.99 0.69
Mean 1.14 1.19 1.34 1.21 Mean 1.21 1.27 1.65 1.31
SD 0.14 0.10 0.09 0.09 SD 0.31 0.28 0.42 0.37
SE 0.04 0.03 0.03 0.03 SE 0.10 0.09 0.13 0.12
Complex I Complex II
Pcpt pre-NT post-NT post-INT post-RT Pcpt pre-NT post-NT post-INT post-RT
Ptcp 1 1.20 1.14 1.26 1.08 Ptcp 1 0.98 1.08 1.15 1.16
Ptcp 2 1.09 1.22 1.29 1.35 Ptcp 2 0.91 1.27 1.33 1.41
Ptcp 3 1.20 1.28 1.25 1.26 Ptcp 3 1.41 1.32 1.56 1.35
Ptcp 4 1.13 1.27 1.44 1.30 Ptcp 4 1.06 1.15 1.39 1.06
Ptcp 5 1.22 1.24 1.48 1.23 Ptcp 5 1.35 1.12 1.34 1.07
Ptcp 6 1.30 1.29 1.39 1.49 Ptcp 6 1.07 1.22 1.27 1.10
Ptcp 7 1.06 1.04 1.04 1.07 Ptcp 7 1.15 1.01 1.19 0.94
Ptcp 8 1.04 1.10 1.07 1.06 Ptcp 8 1.05 1.01 1.16 1.18
Ptcp 9 1.05 1.09 1.16 0.98 Ptcp 9 1.07 1.16 1.20 1.26
Ptcp 10 1.01 0.94 0.97 0.92 Ptcp 10 0.80 0.88 1.08 0.80
Mean 1.13 1.16 1.24 1.17 Mean 1.09 1.12 1.27 1.13
SD 0.10 0.12 0.17 0.18 SD 0.18 0.13 0.14 0.18
SE 0.03 0.04 0.05 0.06 SE 0.06 0.04 0.04 0.06
Complex III Complex IV
Pcpt pre-NT post-NT post-INT post-RT Pcpt pre-NT post-NT post-INT post-RT
Ptcp 1 1.18 1.26 1.43 1.26 Ptcp 1 0.96 0.77 1.03 1.52
Ptcp 2 1.12 1.26 1.36 1.39 Ptcp 2 1.02 1.16 1.31 1.81
Ptcp 3 1.30 1.25 1.38 1.65 Ptcp 3 0.98 0.84 1.51 1.29
Ptcp 4 1.25 1.26 1.48 1.27 Ptcp 4 0.52 1.35 1.11 0.82
Ptcp 5 1.21 1.27 1.51 1.24 Ptcp 5 0.49 0.97 1.82 1.07
Ptcp 6 1.21 1.22 1.39 1.36 Ptcp 6 0.52 0.98 1.05 0.34
Ptcp 7 1.07 0.98 1.06 1.02 Ptcp 7 0.69 0.63 0.75 0.45
Ptcp 8 0.95 1.13 0.97 1.03 Ptcp 8 0.44 0.85 0.72 0.43
Ptcp 9 0.97 1.01 1.06 1.06 Ptcp 9 0.66 0.24 0.41 0.70
Ptcp 10 0.89 0.83 0.93 0.83 Ptcp 10 0.42 0.50 0.91 0.72
Mean 1.11 1.15 1.26 1.21 Mean 0.67 0.83 1.06 0.92
SD 0.14 0.16 0.23 0.23 SD 0.24 0.32 0.41 0.49
SE 0.04 0.05 0.07 0.07 SE 0.07 0.10 0.13 0.16
Complex V PGC-1α

Appendices
247
Pcpt pre-NT post-NT post-INT post-RT Pcpt pre-NT post-NT post-INT post-RT
Ptcp 1 1.56 1.87 2.89 2.58 Ptcp 1 0.57 0.62 0.78 0.89
Ptcp 2 1.86 2.72 2.65 2.72 Ptcp 2 0.72 0.62 0.80 0.89
Ptcp 3 1.71 2.58 2.71 2.74 Ptcp 3 0.83 0.67 0.97 0.90
Ptcp 4 0.58 1.43 1.39 0.66 Ptcp 4 0.46 0.44 0.80 0.86
Ptcp 5 0.71 1.52 1.50 0.46 Ptcp 5 0.44 0.40 0.76 0.71
Ptcp 6 0.31 0.92 0.81 1.39 Ptcp 6 0.26 0.21 0.62 0.50
Ptcp 7 0.22 0.44 0.58 0.27 Ptcp 7 0.45 0.59 1.00 0.53
Ptcp 8 0.55 0.51 1.66 0.65 Ptcp 8 0.72 0.93 1.09 0.92
Ptcp 9 0.68 0.27 0.18 0.95 Ptcp 9 0.91 0.43 0.46 1.14
Ptcp 10 0.30 0.48 2.65 1.65 Ptcp 10 0.33 0.41 1.90 0.60
Mean 0.85 1.27 1.70 1.41 Mean 0.57 0.53 0.92 0.79
SD 0.62 0.90 0.98 0.97 SD 0.22 0.20 0.39 0.20
SE 0.20 0.29 0.31 0.31 SE 0.07 0.06 0.12 0.06
p53 PHF20
Pcpt pre-NT post-NT post-INT post-RT Pcpt pre-NT post-NT post-INT post-RT
Ptcp 1 1.71 1.62 1.91 1.99 Ptcp 1 0.96 1.50 1.65 1.14
Ptcp 2 1.68 2.43 2.27 2.60 Ptcp 2 1.43 0.90 2.59 1.00
Ptcp 3 2.32 2.13 2.26 2.12 Ptcp 3 1.74 1.56 0.80 0.22
Ptcp 4 1.45 1.81 1.90 1.40 Ptcp 4 1.39 1.08 1.85 2.03
Ptcp 5 0.69 1.06 1.63 0.79 Ptcp 5 0.97 2.07 2.64 1.27
Ptcp 6 0.56 0.53 1.58 0.69 Ptcp 6 1.09 1.06 3.08 0.54
Ptcp 7 0.77 1.10 1.15 1.22 Ptcp 7 1.02 0.76 1.58 0.56
Ptcp 8 1.13 1.36 1.44 1.22 Ptcp 8 1.20 2.91 1.58 0.76
Ptcp 9 1.31 2.18 2.36 1.36 Ptcp 9 0.86 0.46 1.56 0.41
Ptcp 10 1.36 1.44 2.39 2.04 Ptcp 10 0.41 0.72 0.86 0.78
Mean 1.30 1.57 1.89 1.54 Mean 1.11 1.30 1.82 0.87
SD 0.54 0.59 0.43 0.62 SD 0.36 0.74 0.75 0.52
SE 0.17 0.19 0.14 0.20 SE 0.11 0.23 0.24 0.17
NRF1 TFAM
Pcpt pre-NT post-NT post-INT post-RT Pcpt pre-NT post-NT post-INT post-RT
Ptcp 1 1.94 1.88 2.63 2.46 Ptcp 1 2.29 3.87 2.71 3.27
Ptcp 2 1.49 2.76 2.00 1.34 Ptcp 2 2.64 3.31 2.51 2.83
Ptcp 3 1.49 1.68 1.84 2.27 Ptcp 3 1.70 1.21 1.75 1.31
Ptcp 4 0.99 1.34 1.17 1.85 Ptcp 4 2.03 2.53 3.02 3.65
Ptcp 5 0.82 1.22 0.80 1.46 Ptcp 5 3.17 3.38 3.88 2.59
Ptcp 6 0.60 0.45 1.85 0.38 Ptcp 6 3.13 1.73 1.80 1.25
Ptcp 7 2.32 2.08 1.96 3.07 Ptcp 7 1.96 1.19 0.99 1.19
Ptcp 8 1.31 3.40 2.76 3.91 Ptcp 8 1.48 1.29 1.35 1.39
Ptcp 9 3.16 2.24 4.74 1.34 Ptcp 9 1.20 1.25 1.10 1.08
Ptcp 10 2.15 0.92 1.91 2.06 Ptcp 10 1.40 2.45 1.64 1.89
Mean 1.63 1.80 2.17 2.02 Mean 2.10 2.22 2.08 2.05
SD 0.78 0.88 1.07 0.99 SD 0.70 1.03 0.93 0.96
SE 0.25 0.28 0.34 0.31 SE 0.22 0.33 0.29 0.30
AIF SCO2

Appendices
248
Pcpt pre-NT post-NT post-INT post-RT Pcpt pre-NT post-NT post-INT post-RT
Ptcp 1 2.86 1.75 2.99 2.24 Ptcp 1 0.59 0.62 0.97 1.04
Ptcp 2 1.49 3.09 2.26 3.24 Ptcp 2 0.92 0.71 0.82 1.03
Ptcp 3 1.45 1.62 2.53 2.22 Ptcp 3 0.78 0.70 0.88 0.84
Ptcp 4 0.96 1.16 1.41 1.63 Ptcp 4 0.62 1.14 1.27 0.58
Ptcp 5 1.23 1.66 1.19 1.42 Ptcp 5 0.58 1.12 1.08 0.41
Ptcp 6 1.41 1.05 2.15 1.11 Ptcp 6 0.33 0.90 0.64 1.37
Ptcp 7 2.22 1.36 2.00 2.07 Ptcp 7 0.52 0.48 0.94 0.46
Ptcp 8 2.01 3.12 2.35 2.46 Ptcp 8 0.84 0.99 1.13 1.09
Ptcp 9 1.44 1.24 1.82 1.12 Ptcp 9 0.77 0.63 0.54 1.11
Ptcp 10 0.79 1.41 0.70 1.11 Ptcp 10 0.51 0.54 1.52 0.77
Mean 1.59 1.75 1.94 1.86 Mean 0.65 0.78 0.98 0.87
SD 0.62 0.75 0.68 0.71 SD 0.18 0.24 0.29 0.31
SE 0.20 0.24 0.22 0.22 SE 0.06 0.08 0.09 0.10
MFN-2 DRP1

Appendices
249
CHAPTER 4 – RAW DATA
Physiological parameters and measurements of work
PcptAge
[y]
Mass
[kg]
Height
[cm]Pcpt
Age
[y]
Mass
[kg]
Height
[cm]
STCT 1 23.3 77.7 180.5 SIT 1 19.7 70.7 174.4
STCT 2 18.8 86.5 181.6 SIT 2 21.7 93.1 191.9
STCT 3 21.6 75.5 177.6 SIT 3 24.9 84.9 183.5
STCT 4 19.8 76.2 178.0 SIT 4 21.6 67.9 176.9
STCT 5 24.4 79.6 182.2 SIT 5 22.1 125.5 180.4
STCT 6 20.5 84.7 180.5 SIT 6 19.6 87.0 184.7
STCT 7 18.8 92.0 191.0 SIT 7 18.5 97.6 188.3
STCT 8 20.8 67.7 174.4 SIT 8 18.4 66.6 176.8
STCT 9 20.6 56.3 167.5 SIT 9 25.7 67.1 168.3
STCT 10 19.9 101.9 182.6
Mean 20.9 79.8 179.6 Mean 21.3 84.5 180.6
SD 1.8 12.7 6.1 SD 2.6 19.4 7.3
SE 0.6 4.0 1.9 SE 0.9 6.5 2.4
PcptWLT
[w]
WPeak
[w]
VO2Peak
[ml min-1
kg-1
]
En Expen
[kJ]Pcpt
WLT
[w]
WPeak
[w]
VO2Peak
[ml min-1
kg-1
]
En Expen
[kJ]
STCT 1 172.0 262.5 51.2 222.9 SIT 1 193.2 262.5 51.5 64.5
STCT 2 259.8 345.0 48.7 336.7 SIT 2 233.6 315.0 44.6 79.8
STCT 3 176.6 255.0 46.3 228.9 SIT 3 271.7 367.5 59.4 80.7
STCT 4 219.6 307.5 51.5 284.7 SIT 4 139.2 217.5 44.9 57.4
STCT 5 225.6 307.5 47.9 292.4 SIT 5 226.0 315.0 37.5 80.4
STCT 6 194.9 270.0 47.8 252.6 SIT 6 213.5 285.0 39.1 70.9
STCT 7 242.7 337.5 43.9 314.6 SIT 7 186.2 262.5 41.2 67.6
STCT 8 128.5 185.0 41.8 166.5 SIT 8 161.1 217.5 48.5 59.2
STCT 9 134.6 210.0 41.1 174.4 SIT 9 215.0 285.0 57.4 64.6
STCT 10 194.0 285.0 49.7 251.4
Mean 194.8 276.5 47.0 252.5 Mean 204.4 280.8 47.1 69.5
SD 43.4 51.5 3.7 56.3 SD 39.7 48.2 7.8 9.1
SE 13.7 16.3 1.2 17.8 SE 13.2 16.1 2.6 3.0

Appendices
250
Exercise intensity
Blood Lactate concentration
Pcpt
Mean ex
intensity[% WPeak]
Max ex
intensity[% WPeak]
Mean ex
intensity[W]
Max ex
intensity[W]
Pcpt
Mean ex
intensity[% WPeak]
Max ex
intensity[% WPeak]
Mean ex
intensity[W]
Max ex
intensity[W]
STCT 1 59.0 59.0 154.8 154.8 SIT 1 204.9 266.5 537.8 699.5
STCT 2 67.8 67.8 233.8 233.8 SIT 2 211.2 312.5 665.3 984.4
STCT 3 62.3 62.3 158.9 158.9 SIT 3 183.0 261.3 672.7 960.4
STCT 4 64.3 64.3 197.7 197.7 SIT 4 220.0 293.2 478.4 637.6
STCT 5 66.0 66.0 203.1 203.1 SIT 5 212.7 338.8 670.0 1067.4
STCT 6 65.0 65.0 175.4 175.4 SIT 6 207.2 245.7 590.5 700.2
STCT 7 64.7 64.7 218.5 218.5 SIT 7 214.6 333.0 563.2 874.2
STCT 8 62.5 62.5 115.6 115.6 SIT 8 226.8 321.6 493.2 699.5
STCT 9 57.7 57.7 121.1 121.1 SIT 9 188.9 276.5 538.4 788.0
STCT 10 61.3 61.3 174.6 174.6
Mean 63.1 63.1 175.4 175.4 Mean 207.7 294.3 578.8 823.4
SD 3.1 3.1 39.1 39.1 SD 14.0 33.7 75.6 153.5
SE 1.0 1.0 12.4 12.4 SE 4.7 11.2 25.2 51.2
Pcpt[La
- ]b pre
[mmol/L]
[La- ]b +0h
[mmol/L]Pcpt
[La- ]b pre
[mmol/L]
[La- ]b +0h
[mmol/L]
STCT 1 1.0 4.1 SIT 1 0.8 12.7
STCT 2 0.8 3.2 SIT 2 0.8 12.5
STCT 3 1.2 3.8 SIT 3 1.3 11.7
STCT 4 1.0 4.4 SIT 4 1.0 9.0
STCT 5 0.7 4.1 SIT 5 0.9 10.8
STCT 6 0.9 3.9 SIT 6 0.7 10.1
STCT 7 0.8 4.1 SIT 7 0.9 11.7
STCT 8 1.2 3.9 SIT 8 1.1 12.4
STCT 9 0.9 3.7 SIT 9 0.9 13.8
STCT 10 0.7 3.8
Mean 0.9 3.9 Mean 0.9 11.6
SD 0.2 0.3 SD 0.2 1.4
SE 0.1 0.1 SE 0.1 0.5

Appendices
251
Protein content (expressed as arbitrary units)
Pcpt Pre +0 h +3 h Pcpt Pre +0 h +3 h Pcpt Pre +0 h +3 h Pcpt Pre +0 h +3 h
STCT 1 0.26 0.35 0.49 SIT 1 0.29 0.74 0.25 STCT 1 3.84 1.41 1.48 SIT 1 1.69 2.20 3.47
STCT 2 0.27 0.87 0.36 SIT 2 0.13 0.33 0.19 STCT 2 1.88 3.70 1.85 SIT 2 0.98 1.71 1.34
STCT 3 0.53 0.58 0.38 SIT 3 0.77 1.87 1.22 STCT 3 1.62 3.38 0.49 SIT 3 1.60 2.98 2.43
STCT 4 0.64 1.05 0.78 SIT 4 0.35 0.45 0.78 STCT 4 2.10 3.11 2.03 SIT 4 0.89 1.17 2.11
STCT 5 0.28 0.31 0.22 SIT 5 0.38 0.60 0.62 STCT 5 1.09 1.70 1.34 SIT 5 0.54 1.08 0.91
STCT 6 0.11 0.14 0.13 SIT 6 0.29 0.70 0.59 STCT 6 1.55 1.25 1.46 SIT 6 6.55 10.71 11.87
STCT 8 0.20 0.14 0.09 SIT 7 0.45 0.74 0.34 STCT 8 0.99 0.52 0.31 SIT 7 1.83 1.62 0.87
STCT 9 0.39 0.25 0.22 SIT 8 0.22 0.98 0.66 STCT 9 1.95 1.65 1.23 SIT 8 0.55 2.01 2.76
STCT 10 0.43 0.63 0.44 SIT 9 0.32 0.55 0.41 STCT 10 0.58 2.51 2.67 SIT 9 0.88 1.02 1.13
Mean 0.35 0.48 0.35 Mean 0.36 0.78 0.56 Mean 1.73 2.14 1.43 Mean 1.72 2.72 2.99
SD 0.17 0.32 0.21 SD 0.18 0.45 0.32 SD 0.93 1.09 0.73 SD 1.87 3.06 3.45
SE 0.06 0.11 0.07 SE 0.06 0.15 0.11 SE 0.31 0.36 0.24 SE 0.62 1.02 1.15
PGC-1α Nuc PGC-1α CytSTCT SIT STCT SIT
Pcpt Pre +0 h +3 h Pcpt Pre +0 h +3 h Pcpt Pre +0 h +3 h Pcpt Pre +0 h +3 h
STCT 1 1.06 2.95 1.45 SIT 1 0.62 2.08 0.63 STCT 1 32.61 78.08 31.39 SIT 1 26.27 40.04 18.90
STCT 2 0.54 0.05 0.85 SIT 2 0.96 2.54 1.04 STCT 2 12.99 5.88 9.42 SIT 2 20.75 30.68 15.06
STCT 3 0.23 0.67 0.24 SIT 3 0.23 0.50 0.12 STCT 3 2.49 6.79 2.22 SIT 3 4.69 4.49 1.60
STCT 4 0.31 0.34 0.12 SIT 4 0.19 0.29 0.16 STCT 4 1.58 2.88 0.95 SIT 4 2.08 2.85 2.30
STCT 5 1.05 1.68 0.16 SIT 5 1.27 3.92 1.11 STCT 5 8.08 15.01 1.08 SIT 5 3.44 10.09 7.39
STCT 6 0.90 1.53 1.16 SIT 6 0.25 0.61 0.01 STCT 6 6.87 14.18 6.21 SIT 6 4.24 9.70 2.69
STCT 8 0.24 1.16 0.97 SIT 7 0.67 0.55 0.37 STCT 8 506.54 1644.0 202.62 SIT 7 436.19 683.11 702.84
STCT 9 0.80 1.22 0.62 SIT 8 1.55 1.06 0.70 STCT 9 31.79 40.27 14.69 SIT 8 17.37 18.84 20.13
STCT 10 2.79 2.93 2.95 SIT 9 3.05 7.06 0.83 STCT 10 6.24 8.39 3.82 SIT 9 13.82 14.65 7.04
Mean 0.88 1.39 0.95 Mean 0.98 2.07 0.55 Mean 67.69 201.72 30.27 Mean 58.76 90.49 86.44
SD 0.79 1.03 0.88 SD 0.91 2.23 0.41 SD 164.98 541.39 65.35 SD 141.80 222.56 231.26
SE 0.26 0.34 0.29 SE 0.30 0.74 0.14 SE 54.99 180.46 21.78 SE 47.27 74.19 77.09
p-ACC CytSTCT SIT
p-ACC NucSTCT SIT
Pcpt Pre +0 h +3 h Pcpt Pre +0 h +3 h Pcpt Pre +0 h +3 h Pcpt Pre +0 h +3 h
STCT 1 0.49 1.31 1.64 SIT 1 0.16 1.22 0.66 STCT 1 0.55 0.89 0.84 SIT 1 0.31 0.64 0.37
STCT 2 0.27 1.00 0.35 SIT 2 0.38 0.63 0.17 STCT 2 0.72 1.93 0.51 SIT 2 0.31 0.75 0.56
STCT 3 0.45 0.38 0.59 SIT 3 0.41 0.96 0.92 STCT 3 0.85 0.95 0.74 SIT 3 1.14 2.27 1.72
STCT 4 0.27 0.60 0.45 SIT 4 0.27 0.48 0.43 STCT 4 0.88 1.14 1.10 SIT 4 0.61 0.99 1.01
STCT 5 0.28 0.37 0.42 SIT 5 0.38 0.51 0.46 STCT 5 0.53 1.21 1.86 SIT 5 0.80 1.25 0.98
STCT 6 0.28 0.26 0.26 SIT 6 0.42 0.49 0.78 STCT 6 0.89 1.00 0.85 SIT 6 0.64 2.36 3.86
STCT 8 0.41 0.18 0.25 SIT 7 0.61 0.95 0.76 STCT 8 1.25 0.80 0.62 SIT 7 2.52 2.70 1.86
STCT 9 0.77 0.53 0.44 SIT 8 0.61 1.58 1.18 STCT 9 0.31 0.33 0.48 SIT 8 0.31 1.15 1.33
STCT 10 0.34 0.54 0.31 SIT 9 0.33 0.64 0.49 STCT 10 0.67 1.31 1.18 SIT 9 0.52 0.72 0.83
Mean 0.40 0.57 0.52 Mean 0.40 0.83 0.65 Mean 0.74 1.06 0.91 Mean 0.80 1.43 1.39
SD 0.16 0.36 0.43 SD 0.15 0.38 0.30 SD 0.27 0.43 0.43 SD 0.70 0.80 1.05
SE 0.05 0.12 0.14 SE 0.05 0.13 0.10 SE 0.09 0.14 0.14 SE 0.23 0.27 0.35
p53 Nuc p53 CytSTCT SIT STCT SIT

Appendices
252
Pcpt Pre +0 h +3 h Pcpt Pre +0 h +3 h Pcpt Pre +0 h +3 h Pcpt Pre +0 h +3 h
STCT 1 0.42 0.81 1.04 SIT 1 0.45 0.79 0.50 STCT 1 1.48 2.34 2.47 SIT 1 1.16 2.38 1.37
STCT 2 0.25 0.84 0.32 SIT 2 0.06 0.27 0.24 STCT 2 0.51 1.36 0.46 SIT 2 0.40 0.63 0.43
STCT 3 0.25 0.26 0.23 SIT 3 0.26 0.57 0.46 STCT 3 2.00 2.73 1.91 SIT 3 3.17 5.79 4.36
STCT 4 0.25 0.57 0.32 SIT 4 0.21 0.49 0.30 STCT 4 0.58 0.84 0.68 SIT 4 0.48 0.98 1.12
STCT 5 0.19 0.24 0.13 SIT 5 0.25 0.18 0.23 STCT 5 0.30 0.87 0.77 SIT 5 0.75 1.43 0.88
STCT 6 0.24 0.24 0.22 SIT 6 0.42 0.51 0.44 STCT 6 0.38 0.46 0.60 SIT 6 0.43 0.98 1.44
STCT 8 0.65 0.41 0.45 SIT 7 0.73 0.88 0.58 STCT 8 0.54 0.59 0.41 SIT 7 0.90 1.12 0.80
STCT 9 0.49 0.27 0.23 SIT 8 0.22 0.28 0.22 STCT 9 1.56 1.51 1.55 SIT 8 1.05 1.40 1.12
STCT 10 0.90 1.38 1.34 SIT 9 0.70 1.16 1.07 STCT 10 0.73 0.78 0.60 SIT 9 0.36 0.44 0.60
Mean 0.41 0.56 0.48 Mean 0.37 0.57 0.45 Mean 0.90 1.28 1.05 Mean 0.97 1.68 1.35
SD 0.24 0.39 0.42 SD 0.23 0.32 0.27 SD 0.61 0.79 0.74 SD 0.88 1.64 1.18
SE 0.08 0.13 0.14 SE 0.08 0.11 0.09 SE 0.20 0.26 0.25 SE 0.29 0.55 0.39
PHF20 Nuc PHF20 CytSTCT SIT STCT SIT
Pcpt Pre +0 h +3 h Pcpt Pre +0 h +3 h Pcpt Pre +0 h +3 h Pcpt Pre +0 h +3 h
STCT 1 0.65 0.96 1.03 SIT 1 0.65 1.54 0.78 STCT 1 0.75 1.66 1.48 SIT 1 0.29 0.84 0.45
STCT 2 0.18 0.69 0.23 SIT 2 0.20 0.34 0.26 STCT 2 0.92 1.96 0.77 SIT 2 0.49 0.65 0.64
STCT 3 0.25 0.22 0.25 SIT 3 0.34 0.83 0.65 STCT 3 0.45 0.58 0.49 SIT 3 0.40 1.03 0.85
STCT 4 0.71 0.72 0.85 SIT 4 0.16 1.18 0.74 STCT 4 1.00 1.80 1.50 SIT 4 0.59 0.89 1.19
STCT 5 0.37 0.48 0.80 SIT 5 0.63 0.95 0.92 STCT 5 0.90 1.26 1.68 SIT 5 0.64 0.99 0.75
STCT 6 0.12 0.26 0.12 SIT 6 0.70 1.40 1.75 STCT 6 1.39 1.43 1.95 SIT 6 0.46 2.09 2.51
STCT 8 0.68 0.40 0.51 SIT 7 0.52 1.24 0.89 STCT 8 1.66 1.01 0.75 SIT 7 6.54 8.44 7.15
STCT 9 0.70 0.48 0.33 SIT 8 0.25 1.84 0.96 STCT 9 1.05 1.32 0.68 SIT 8 0.61 1.64 1.35
STCT 10 0.57 0.68 0.61 SIT 9 0.85 1.01 0.63 STCT 10 1.63 2.15 1.82 SIT 9 0.29 0.56 0.37
Mean 0.47 0.54 0.52 Mean 0.48 1.15 0.84 Mean 1.08 1.46 1.24 Mean 1.15 1.90 1.69
SD 0.24 0.24 0.32 SD 0.25 0.43 0.40 SD 0.40 0.49 0.56 SD 2.03 2.50 2.14
SE 0.08 0.08 0.11 SE 0.08 0.14 0.13 SE 0.13 0.16 0.19 SE 0.68 0.83 0.71
p-p53 Nuc p-p53 CytSTCT SIT STCT SIT

Appendices
253
mRNA content (expressed as arbitrary units)
Pcpt PGC-1a p53 AIF DRP1 MFN2
STCT 1 pre 1.00 1.00 1.00 1.00 1.00
STCT 1 +0h 0.90 1.05 0.86 0.96 1.21
STCT 1 +3h 3.93 1.12 0.95 0.93 1.01
STCT 2 pre 1.00 1.00 1.00 1.00 1.00
STCT 2 +0h 0.66 0.60 0.67 0.55 0.48
STCT 2 +3h 4.05 0.90 1.03 0.79 1.01
STCT 3 pre 1.00 1.00 1.00 1.00 1.00
STCT 3 +0h 1.05 0.88 1.18 1.67 1.53
STCT 3 +3h 6.93 1.02 0.87 1.12 0.92
STCT 4 pre 1.00 1.00 1.00 1.00 1.00
STCT 4 +0h 1.96 1.34 1.40 1.56 1.35
STCT 4 +3h 8.40 1.24 1.19 1.51 1.32
STCT 5 pre 1.00 1.00 1.00 1.00 1.00
STCT 5 +0h 1.19 1.00 1.45 1.24 1.85
STCT 5 +3h 3.55 1.17 0.95 1.00 1.47
STCT 6 pre 1.00 1.00 1.00 1.00 1.00
STCT 6 +0h 1.47 1.08 1.52 1.37 2.01
STCT 6 +3h 4.25 1.19 1.38 1.10 1.60
STCT 7 pre 1.00 1.00 1.00 1.00 1.00
STCT 7 +0h 1.27 0.85 1.08 1.01 1.42
STCT 7 +3h 7.10 0.94 1.43 1.09 1.62
STCT 8 pre 1.00 1.00 1.00 1.00 1.00
STCT 8 +0h 1.16 0.57 1.86 1.01 1.64
STCT 8 +3h 8.49 0.81 1.74 0.94 1.85
STCT 10 pre 1.00 1.00 1.00 1.00 1.00
STCT 10 +0h 0.92 0.65 1.14 1.10 0.73
STCT 10 +3h 3.43 0.48 1.20 0.75 0.59
Mean STCT pre 1.00 1.00 1.00 1.00 1.00
Mean STCT +0h 1.17 0.89 1.24 1.16 1.36
Mean STCT +3h 5.57 0.99 1.19 1.03 1.27
SD STCT pre 0.00 0.00 0.00 0.00 0.00
SD STCT +0h 0.38 0.26 0.36 0.34 0.50
SD STCT +3h 2.12 0.24 0.28 0.22 0.41
SEM STCT pre 0.00 0.00 0.00 0.00 0.00
SEM STCT +0h 0.13 0.09 0.12 0.11 0.17
SEM STCT +3h 0.71 0.08 0.09 0.07 0.14

Appendices
254
Pcpt PGC-1a p53 AIF DRP1 MFN2
SIT 1 pre 1.00 1.00 1.00 1.00 1.00
SIT 1 +0h 1.23 1.06 0.99 1.45 1.22
SIT 1 +3h 9.17 1.44 1.32 1.39 1.27
SIT 2 pre 1.00 1.00 1.00 1.00 1.00
SIT 2 +0h 0.98 0.78 1.19 1.11 1.10
SIT 2 +3h 5.79 1.02 1.20 1.21 1.15
SIT 3 pre 1.00 1.00 1.00 1.00 1.00
SIT 3 +0h 1.00 1.03 1.24 1.27 1.62
SIT 3 +3h 7.45 1.57 1.63 1.33 1.55
SIT 4 pre 1.00 1.00 1.00 1.00 1.00
SIT 4 +0h 1.18 1.42 1.23 1.03 2.07
SIT 4 +3h 2.76 0.88 1.52 1.09 0.89
SIT 5 pre 1.00 1.00 1.00 1.00 1.00
SIT 5 +0h 1.50 1.05 1.32 1.16 1.29
SIT 5 +3h 5.29 1.22 1.08 0.97 0.86
SIT 6 pre 1.00 1.00 1.00 1.00 1.00
SIT 6 +0h 1.14 0.69 1.12 1.07 0.74
SIT 6 +3h 4.78 0.61 1.45 1.01 0.49
SIT 7 pre 1.00 1.00 1.00 1.00 1.00
SIT 7 +0h 1.29 1.52 4.04 1.43 2.32
SIT 7 +3h 11.21 2.22 4.03 2.06 2.80
SIT 8 pre 1.00 1.00 1.00 1.00 1.00
SIT 8 +0h 0.85 0.93 0.72 0.68 0.55
SIT 8 +3h 2.95 0.63 0.52 0.45 0.35
SIT 9 pre 1.00 1.00 1.00 1.00 1.00
SIT 9 +0h 1.48 1.56 1.35 1.79 1.41
SIT 9 +3h 6.95 1.32 1.23 1.29 1.23
Mean SIT pre 1.00 1.00 1.00 1.00 1.00
Mean SIT +0h 1.18 1.12 1.47 1.22 1.37
Mean SIT +3h 6.26 1.21 1.56 1.20 1.18
SD SIT pre 0.00 0.00 0.00 0.00 0.00
SD SIT +0h 0.22 0.31 0.98 0.31 0.57
SD SIT +3h 2.77 0.51 0.98 0.43 0.72
SE SIT pre 0.00 0.00 0.00 0.00 0.00
SE SIT +0h 0.07 0.10 0.33 0.10 0.19
SE SIT +3h 0.92 0.17 0.33 0.14 0.24

Appendices
255

Appendices
256