effects of different heat treatments on hardness of grade 91 steel
TRANSCRIPT

Effects of different heat treatments on hardness of Grade 91 steel
Effekter av olika värmebehandlingar på hårdheten hos Grade 91 stål
Jonas Ohlsson
Faculty of Science and Technology
Degree project for Bachelor of Science in Mechanical Engineering
15 credit points
Supervisor: Andres Gåård, Christer Burman
Date: Spring semester 2014-05-25

Abstract:
CCI Valve Technology AB is a company located in Säffle, Sweden, that manufactures and
installs bypass valves. Due to requirements outside normal standards on the valve's hardness
values, some measurements have had difficulties meeting such requirements. During this
thesis work, tests were carried out to determine how to overcome the difficulties. The
experiments focused on five different areas that may affect the components hardness, welding
method, soaking temperature during post weld heat treatment, measuring procedure,
component thickness and number of heat treatment cycles. The Grade 91 steel specimens that
were examined consisted of five solid cylinders and three various pipes that were welded
together by using shielded metal arc welding (SMAW) or gas tungsten arc welding (GTAW).
Each pipe was sawed apart into three equal parts. All specimens were hardness tested and
eight of the specimens' microstructure was studied with an optical microscope. The hardness
measurement instruments used, LECO V-100-C2 and GE-MIC 10, are Vickers hardness
testers, one stationary and the other one portable. The measuring results contain a vast number
of different hardness measurement data. From the analyzed data, the conclusions were drawn
that the most suitable soaking temperature during post weld heat treatment were 750° C, that
the SMAW method creates a more stable hardness profile than the GTAW method, and that
one heat treatment cycle is more beneficial than two or more.
Key words: Grade 91, Post weld heat treatment, Heat treatment cycles, Hardness.
Sammanfattning
CCI Valve Technology AB är ett företag stationerat i Säffle, Sverige, som tillverkar och
installerar bypassventiler. På grund av krav utanför normal standard på ventilernas hårdhet,
har vissa härdhetsmätningar på ventilerna haft svårt att uppfylla dessa krav. I detta
kandidatexamensarbete har tester utförts för att fastställa hur dessa svårigheter skall
övervinnas. De experiment som utfördes fokuserade på fem områden som kan ha påverkan på
ventilernas hårdhet; svetsmetod, hålltemperatur under efterföljande värmebehandling,
mätteknik respektive mätinstrument, godstjocklek samt antal värmebehandlingscykler. De
prover som undersöktes bestod av fem solida cylindrar och tre rör av olika dimensioner,
hopsvetsade med metallbågsvetsning (SMAW) eller gasvolframsvetsning (GTAW). Varje rör
sågades sedan isär till tre lika stora delar. Alla prover bestod av Grade 91 stål. Samtliga
prover hårdhetstestades och åtta av dessa provers mikrostruktur studerades även i ett
ljusmikroskop. De mätinstrument som användes, LECO V-100-C2 och GE-MIC 10, är båda
två vickers-hårdhetsmätare, en stationär hårdhetsmätare respektive en portabel. Resultaten
innehåller väldigt mycket data erhållen från en mängd olika hårdhetsmätningar. Dessa resultat
analyserades och de slutsatser som kunde dras från detta var att den mest lämpliga
hålltemperaturen för efterföljande värmebehandling var 750° C, att SMAW metoden skapar
en jämnare hårdhetsprofil än GTAW metoden, och att en värmebehandlingscykel är mer
fördelaktig än flera stycken.

Table of contents
1. Introduction: ........................................................................................................................... 1
1.1 Aim of thesis work ........................................................................................................... 1
1.2 Background of the material: ............................................................................................. 2
1.3 Background on practices .................................................................................................. 3
1.3.1 Welding................................................................................................................................... 3
1.3.2 Heat treatments ..................................................................................................................... 4
1.3.3 Hardness measurements ........................................................................................................ 5
2. Method ................................................................................................................................... 6
2.1 Test 1 ................................................................................................................................ 6
2.2 Test 2 ................................................................................................................................ 9
3. Results .................................................................................................................................. 12
3.1 Test 1 .............................................................................................................................. 12
3.1.1 Hardness by number of heat treatments ............................................................................. 12
3.1.2 Hardness by measuring instrument ..................................................................................... 14
3.1.3 Hardness by operator ........................................................................................................... 15
3.2 Test 2 .............................................................................................................................. 16
3.2.1 Hardness by soaking temperature ....................................................................................... 16
3.2.2 Hardness by welding method ............................................................................................... 24
3.2.3 Hardness by thickness .......................................................................................................... 27
4. Discussion ............................................................................................................................ 28
4.1 Test 1 .............................................................................................................................. 28
4.2 Test 2 .............................................................................................................................. 29
5. Conclusion ............................................................................................................................ 30
6. Acknowledgements .............................................................................................................. 31
7. References ............................................................................................................................ 32
8. Appendices ........................................................................................................................... 33
8.1 Heat treatments for pucks ............................................................................................... 33
8.2 Pre-heat diagrams for pipes ............................................................................................ 39
8.3 Welding protocols for pipes ........................................................................................... 43
8.4 Post weld heat treatments for pipes ................................................................................ 51

1
1. Introduction:
This thesis work was carried out at CCI Valve Technology AB in Säffle, Sweden, which is a
global company that during the past 50 years have placed nearly 100 thousand valves into
service. CCI Valve designs and manufactures valves for applications in pulp and paper plants,
and in the power, oil and gas industry. CCI Valve purchases pipes, rods, outlets and valve
housings. These components are machined, welded and heat-treated. Prior to delivery, the
bypass valves are functionally tested and after approval, they are assembled with actuators.
Recently, they have had difficulties with fulfilling the requirements on hardness outside
standard requirements. Despite accurate post weld heat treatment, several valves show too
high hardness values in the welds and too low hardness values in the base material when
measured with a portable hardness tester.
1.1 Aim of thesis work
The aim of this thesis work is to discover why the valves fail to meet the outside standard
requirements and how different parameters affect the material properties, so that CCI Valve
can improve their products.
The main objectives of this thesis work are listed below:
Examine how the number of heat treatment cycles affects the hardness of the material.
Test how material properties are affected by the selection of welding method, pipe
thickness and soaking temperature during post weld heat treatment.
Examine how the value of hardness is affected by the operator or the measuring
instrument.

2
1.2 Background of the material:
The material that CCI Valve use is called Grade 91, which is a modification of the steal alloy
9Cr-1 Mo. The alloy's chemical composition is presented in Table 1. Grade 91 was co-
developed by the Oak Ridge National Laboratory and Combustion Engineering, who, in their
study, demonstrated the alloy's good mechanical properties [1,2,3]. The standard 9Cr-1 Mo
alloy was improved by addition of vanadium, niobium and nitrogen for precipitation
strengthening the alloy additionally. The addition of these elements resulted in a ferritic alloy
with greater creep strength than before.
In 1983, ASME boiler and pressure vessel code approved the Grade 91 steel and during the
1990's it was commonly used for upgrading traditional fossil plants and when manufacturing
critical pressure part components for newer power plants [4]. However, some issues
frequently appear when using this alloy, and one of them is the hardness.
Before the valve is installed, the hardness values should be in the range of 200-263 HV for
components and 200-294 HV for welds [5]. However, the requirements outside normal
standards implies that the hardness of the base material at field weld joint shall be a minimum
of 210 HV after post weld heat treatment. And that the weld joints after post weld heat
treatment shall be between 200-270 HV, with a spread no greater than 30 HV, from lowest to
highest, at each of the locations.
Table 1 shows the Grade 91 steel's chemical composition. The elements marked with the
letter A are not required to be controlled by ASME specifications, but the elements' values
should be considered target levels. Elements marked with the letter D are Carbon and
Nitrogen, the sum of these elements must exceed 0,12%. The minimum level of Chromium is
marked with the letter C for the reason that, for piping the minimum amount of Chromium
should be 8,5%. Composition values marked with the letter B is different from ASME.
Table 1: Chemical composition of Grade 91 steel [5].

3
1.3 Background on practices
1.3.1 Welding
When using the shielded metal arc process (SMAW), a minimum pre-heat temperature of
205° C shall be maintained for components that are highly restrained, for example
components that have been forced together before welding. For a tube-to-tube butt weld, it is
acceptable that the maintained pre-heat temperature reaches 150° C before welding, for both
the shielded metal arc process and the gas tungsten process (GTAW) [5]. During the welding,
the component shall not be subjected to temperatures above 350° C. If welding is interrupted,
the pre-heat temperature must be maintained unless the weld is thicker than one third of the
components thickness [5]. If so, the component shall be given a hydrogen bake, which
involves heating the component above 300° C for one or two hours, depending on its
thickness, followed by slow cooling. Once the hydrogen bake is finished, the component must
be kept dry until the welding process is resumed.
There is no standard welding method for joining Grade 91 material; there are only
recommended filler materials. However, the various welding methods differ a little from each
other. The GTAW weld metal will not get as hard as the SMAW weld metal [6]. The heat
affected zone (HAZ) and the base material may however not reach a higher hardness when
using SMAW, compared to GTAW, as shown in Figure 1 [7]. The material examined and
presented in Figure 1 is not Grade 91 steel, but a medium carbon steel (MCS).
Figure 1: Hardness profile for SMAW and GTAW along medium carbon steel side [7].
The distance shown on the X-axis is in mm.

4
1.3.2 Heat treatments
If the component is heat-treated directly after welding, its temperature must have dropped to
at least 80° C before heat-treated. This must be done so that the austenite is completely
transformed to martensite before heat treatment, otherwise martensite may form after the post
weld heat treatment (PWHT) and that will result in a hard and brittle weld [8]. The post weld
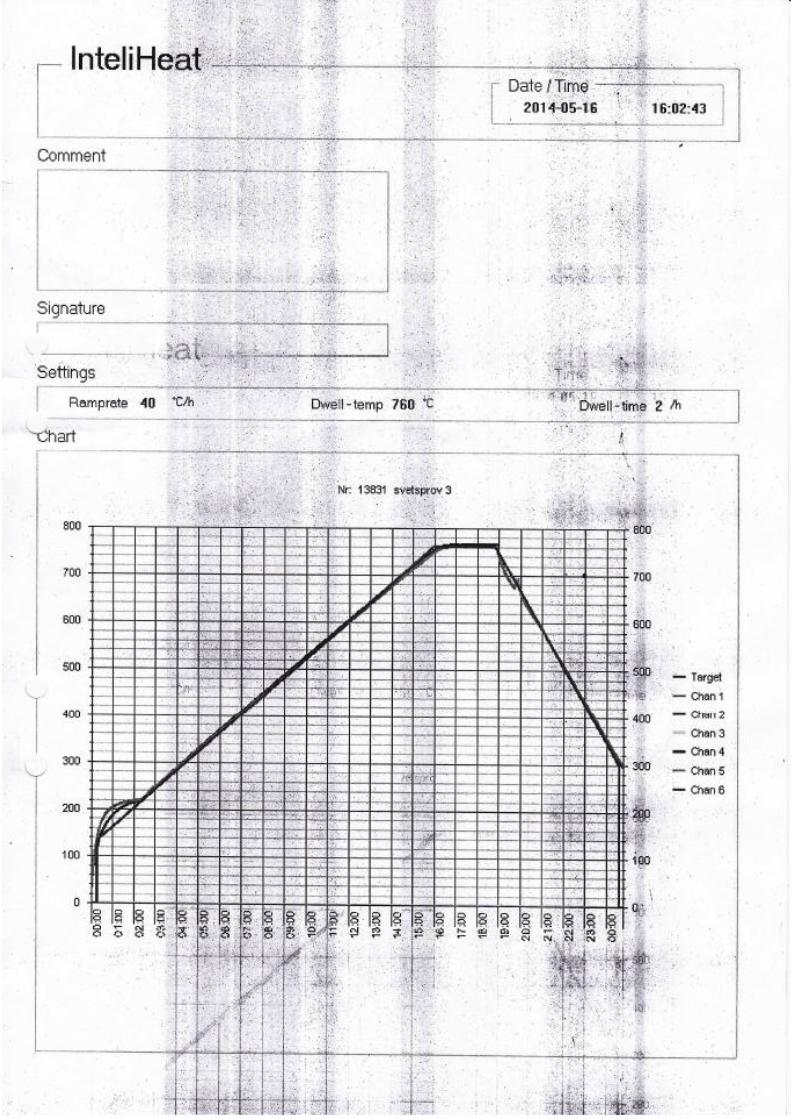
heat treatment performed at CCI Valve for Grade 91 involves heating the component at a rate
of 40° C per hour until it reaches a temperature of 760° C (this soaking temperature can be
varied between 740-780° C). The component is held at chosen soaking temperature for one or
two hours (depending on its thickness) and is then cooled with a rate of 80° C per hour until it
reaches 300° C, from which it can be air cooled to room temperature. A Common problem
encountered with post weld heat treatments is that the different parts of a component can cool
at different rates depending on their thickness, thicker components will cool with a lower rate,
and this causes a variety of hardness in the product.
As previously stated, the soaking temperature can be varied between 740-780° C, but what
happens to the material properties within that range? When tempering modified 9Cr–1Mo
steel, or Grade 91 steel, at the temperatures 720° C, 740° C and 760° C for one hour, hardness
measurements show that the material's hardness decreases faster in the beginning and then
slower at the higher heat treatment temperatures, as the curve in Figure 2 shows [9]. The
hardness decreases because of growing precipitates.
Figure 2: Decreasing hardness due to heat treatments at various temperatures [9].

5
1.3.3 Hardness measurements
Since the components are very expensive to produce a non-destructive hardness test is a good
way to control their quality. The hardness testing method used in this report is the Vickers-
method. The Vickers-method uses a diamond pyramid indenter. The indenter is pressed into
the surface of the material with a preset load for a period of time. When the indenter is
unloaded, the two diagonal distances between the corners of the indentation are measured and
a mean value is calculated. With the load, F, and the average distance, d, known the hardness
of the material can be calculated with Equation (1) [10].
2
8544,1
d
FHV
(1)
There are several guidelines to follow when measuring the hardness of a component, but the
main one is to prepare the test surface to at least a 240-grit finish before using the GE MIC-
10. The measuring instrument must be properly calibrated before measuring [5]. Pressure part
components with a diameter smaller than 600 mm, shall be hardness tested at four locations
around the circumference, with 90° between the locations. If the component's diameter
exceeds 600 mm, measurements shall be made at eight locations, with 45° between each
location [5].

6
2. Method
2.1 Test 1
During Test 1, the specimens were measured using two different hardness testers, the
stationary LECO V-100- C2 and the portable GE-MIC 10. The stationary hardness tester is
shown in Figure 3 with one of the pucks placed on the V-shaped anvil. When the
measurements were made, the machine was set to a pressure load of 20 kilopond. Ten
measurements were obtained for each puck. After the heat treatments, the oxide layer was
removed by polishing the pucks' surfaces, and then the same procedure was performed once
again.
GE MIC-10, Portable hardness tester:
The Measured values were obtained using the portable hardness tester GE MIC-10. Prior to
the measurements, the instrument was calibrated against another metal ingot with a hardness
of 225 HB. When calibrating the GE-MIC 10 a minimum of five readings are made on an
ingot of the same material with a predetermined hardness, out of these five values an average
is calculated. This average is then corrected so that the display shows the ingots
predetermined value [11]. When measuring the ingot once more it can be determined whether
the calibration is good enough, if not, the same procedure can be carried out once again, but
with more readings. During the procedure, the instrument was held vertically against the
surface of the metal puck, into which the indenter was pressed until a value shown on its
display. This was done ten times for each puck. After the heat treatments, the oxide layer was
removed by polishing the pucks' surfaces, and then the same procedure were performed once
again, but with two different operators.
Figure 3: Stationary hardness tester, LECO V-100-C2,
with puck placed on its V-shaped anvil.
7
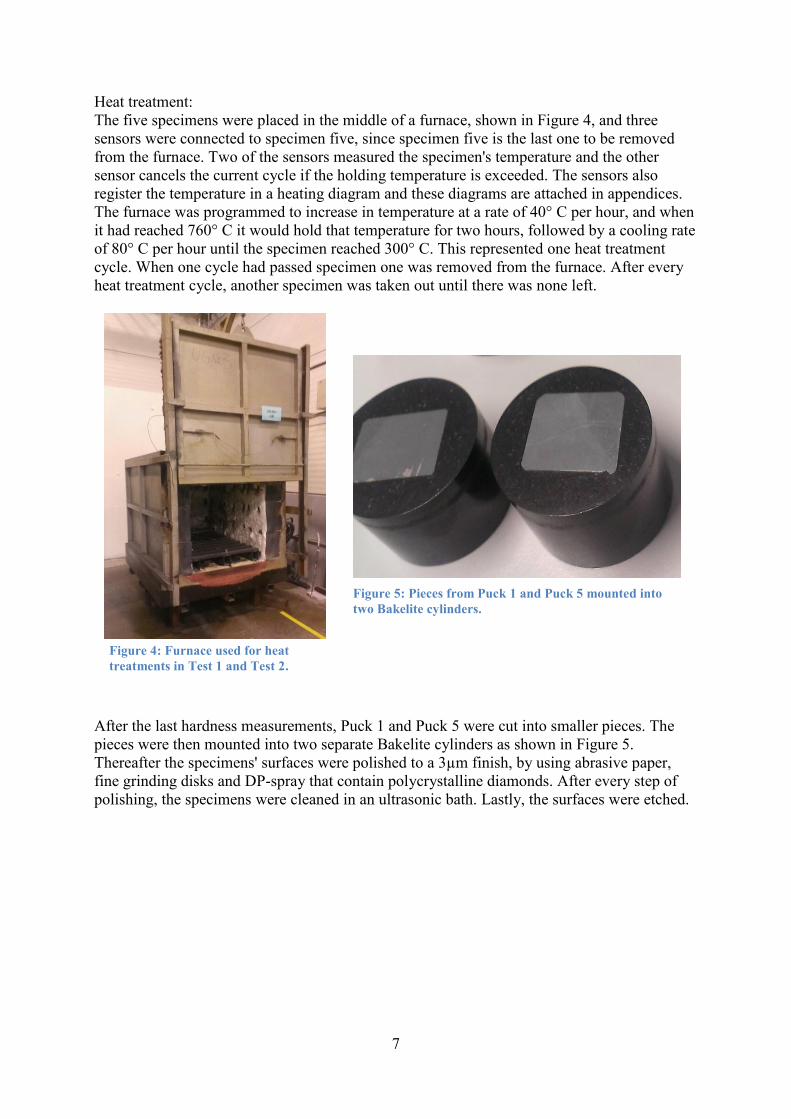
Heat treatment:
The five specimens were placed in the middle of a furnace, shown in Figure 4, and three
sensors were connected to specimen five, since specimen five is the last one to be removed
from the furnace. Two of the sensors measured the specimen's temperature and the other
sensor cancels the current cycle if the holding temperature is exceeded. The sensors also
register the temperature in a heating diagram and these diagrams are attached in appendices.
The furnace was programmed to increase in temperature at a rate of 40° C per hour, and when
it had reached 760° C it would hold that temperature for two hours, followed by a cooling rate
of 80° C per hour until the specimen reached 300° C. This represented one heat treatment
cycle. When one cycle had passed specimen one was removed from the furnace. After every
heat treatment cycle, another specimen was taken out until there was none left.
After the last hardness measurements, Puck 1 and Puck 5 were cut into smaller pieces. The
pieces were then mounted into two separate Bakelite cylinders as shown in Figure 5.
Thereafter the specimens' surfaces were polished to a 3µm finish, by using abrasive paper,
fine grinding disks and DP-spray that contain polycrystalline diamonds. After every step of
polishing, the specimens were cleaned in an ultrasonic bath. Lastly, the surfaces were etched.
Figure 4: Furnace used for heat
treatments in Test 1 and Test 2.
Figure 5: Pieces from Puck 1 and Puck 5 mounted into
two Bakelite cylinders.

8
After polishing the steel surfaces, the microstructure of the specimens were studied through
an optical microscope, shown in Figure 6. Pictures were captured and analyzed.
Figure 6: Optical microscope connected to computer screen, used when studying the pucks' microstructure
9
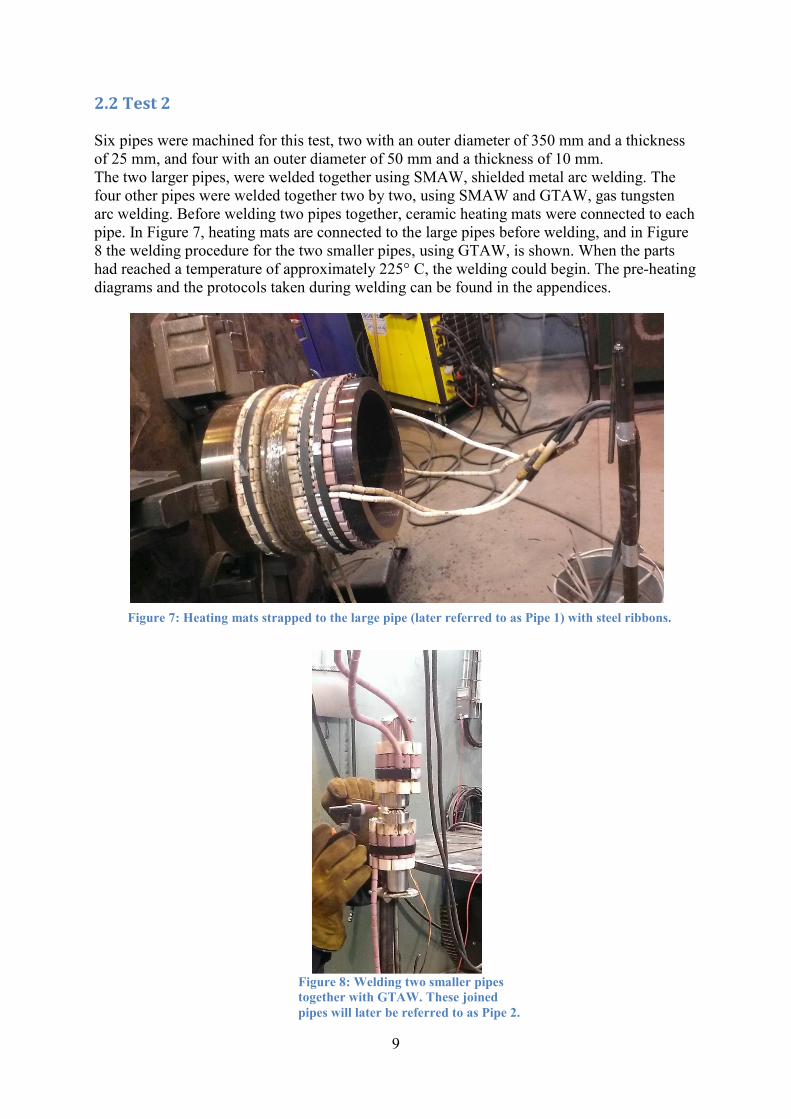
2.2 Test 2
Six pipes were machined for this test, two with an outer diameter of 350 mm and a thickness
of 25 mm, and four with an outer diameter of 50 mm and a thickness of 10 mm.
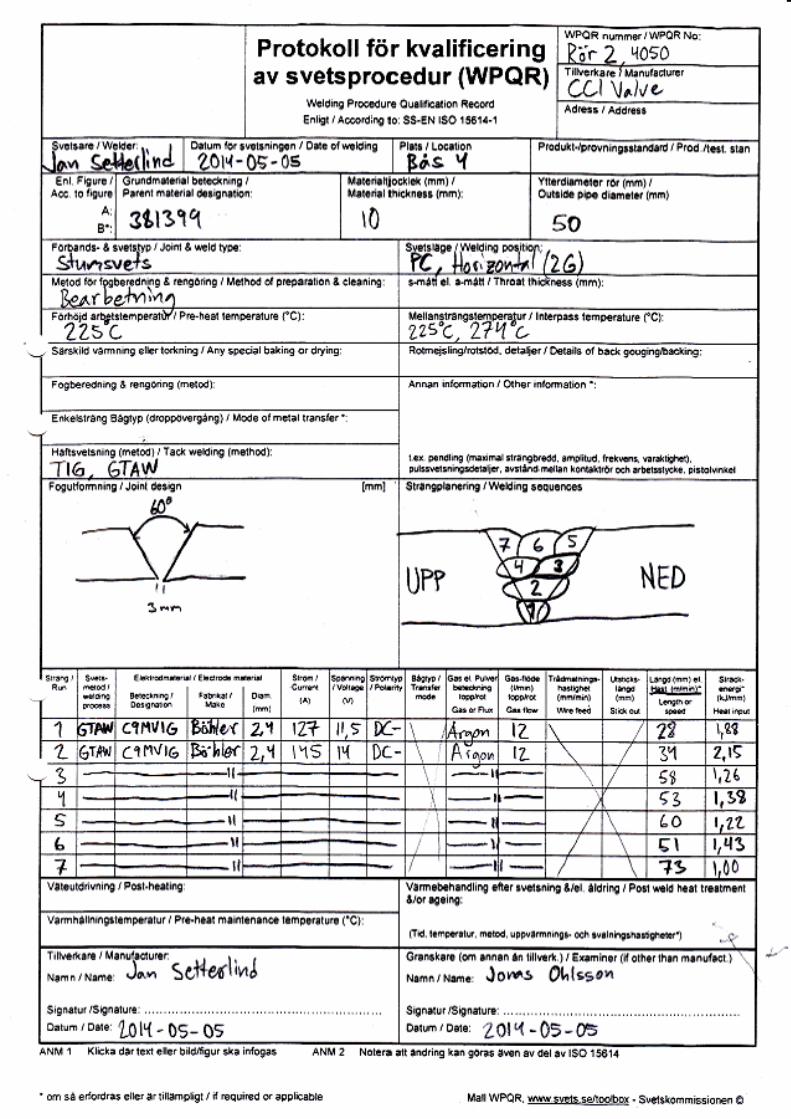
The two larger pipes, were welded together using SMAW, shielded metal arc welding. The
four other pipes were welded together two by two, using SMAW and GTAW, gas tungsten
arc welding. Before welding two pipes together, ceramic heating mats were connected to each
pipe. In Figure 7, heating mats are connected to the large pipes before welding, and in Figure
8 the welding procedure for the two smaller pipes, using GTAW, is shown. When the parts
had reached a temperature of approximately 225° C, the welding could begin. The pre-heating
diagrams and the protocols taken during welding can be found in the appendices.
Figure 7: Heating mats strapped to the large pipe (later referred to as Pipe 1) with steel ribbons.
Figure 8: Welding two smaller pipes
together with GTAW. These joined
pipes will later be referred to as Pipe 2.

10
After welding, the pipes were sawed apart into three parts and each part's surface was finished
according to EPRI's technical report, Guidelines and Specifications for High-Reliability Fossil
Power Plants. Each part was hardness tested on its outer surface, with the stationary hardness
tester, as illustrated in Figure 9. Some of the parts were harder to measure because of their
uneven edges, but this was solved by using smaller triangular pieces and applying the 3-2-1
method for fixing their degrees of freedom.
Three parallel measurements were performed across the base material, the heat affected zones
and the weld, where each measurement consisted of 15 indentations. The indentations are
shown in Figure 10. Apart from those measurements, another one consisting of 10
indentations was carried out on the surface of the base material.
Figure 9: Measuring the hardness of one part from the large pipe. The triangular piece was used to
stabilize the object during measurements.
Figure 10: The 45 indentations made on one of the parts from a smaller pipe
during three different measurements. The indentations were made approximately
2 mm apart on a 30 mm distance.

11
The parts were then heat-treated in three different ways so that one part of Pipe 1, one part of
Pipe 2 and one part of Pipe 3 went through the same heat treatment, and so on. The difference
between the three heat treatments were only their soaking temperatures, 740° C during the
first heat treatment, 750° C during the second one and 760° C for the third one. Their heating-
and cooling rates were the same through all three. These heating diagrams can all be found in
the appendices under the heading Post weld heat treatments for pipes.
Once the parts completed their heat treatment, their hardness was examined again, as close as
possible to where previous measurements were made, without hitting earlier indentations.
The parts from Pipe 1 and Pipe 2 were studied with the optical microscope as well. The parts
were cut into smaller pieces and mounted into several Bakelite cylinders. As in the previous
test, the parts were polished and etched before studying the various parts' microstructures.
The designations stated in Table 2 are how the parts will be referred to in the results.
Table 2: Designations used in the results.
Treatments performed: Designation:
Large pipe, SMAW, PWHT at 740° C Pipe 1.1
Large pipe, SMAW, PWHT at 750° C Pipe 1.2
Large pipe, SMAW, PWHT at 760° C Pipe 1.3
Small pipe, GTAW, PWHT at 740° C Pipe 2.1
Small pipe, GTAW, PWHT at 750° C Pipe 2.2
Small pipe, GTAW, PWHT at 760° C Pipe 2.3
Small pipe, SMAW, PWHT at 740° C Pipe 3.1
Small pipe, SMAW, PWHT at 750° C Pipe 3.2
Small pipe, SMAW, PWHT at 760° C Pipe 3.3

12
0
20
40
60
80
100
120
140
160
180
200
220
240
260
Before After
Har
dn
ess
(H
V)
Hardness before and after heat treatment (LECO V-100-C2)
Puck 1
Puck 2
Puck 3
Puck 4
Puck 5
3. Results
3.1 Test 1
3.1.1 Hardness by number of heat treatments
Figure 11 shows the various pucks' mean hardness. Each bar shows the hardness mean value
calculated from ten readings on respective puck's surface. The hardness of each puck is
measured before and after their individual heat treatment. Puck 1 has completed one heat
treatment cycle, Puck 2 has completed two heat treatment cycles and so on. Studying Figure
11 shows that the decrease in hardness levels off after the first two heat treatments.
Figure 11: Hardness before and after several heat treatments. The puck's name does also
explain the number of heat treatment cycles it has completed.

13
Figure 12 shows the microstructure of Puck 1 and Puck 5 when studied with an optical
microscope. The top two pictures show the microstructure of Puck 1 respective Puck 5 at a
magnification of 20x, and the bottom two shows the microstructure of Puck 1 respective Puck
5 at a magnification of 100x. The big difference between Puck 1 and Puck 5 can be seen when
comparing the 100x magnifications. The carbides in Puck 5 are bigger than the carbides seen
in Puck 1. Larger carbides soften the material.
Figure 12: The microstructure of Puck 1 and Puck 5 at two different magnifications.

14
0
20
40
60
80
100
120
140
160
180
200
220
240
260
Har
dn
ess
(H
V)
Mean hardness values before heat treatment
Standard deviation
3.1.2 Hardness by measuring instrument
Figure 13 shows the differences between the mean hardness values from the measurements
made by the various types of measuring instruments. The largest difference is more than 20
HV. The standard deviation for each testing method is shown as red bars in the figure. The
lower the value, the more even measurements are made.
Figure 13: Mean hardness and standard deviation for the different measuring instruments.

15
0
20
40
60
80
100
120
140
160
180
200
220
240
Har
dn
ess
(H
V)
Mean hardness values by different operators
Standard deviation
3.1.3 Hardness by operator
Figure 14 illustrates how the obtained mean hardness values depend on the operator. Both
operators have measured each puck with the GE-MIC 10 hardness tester. The difference
between their results differs by almost 20 HV for each puck. The red bars show the standard
deviation for the operators, but there is not a big difference between those values.
Figure 14: The mean hardness values and standard deviations of the various operators.

16
3.2 Test 2
3.2.1 Hardness by soaking temperature
Figure 15 shows the change in hardness after post weld heat-treating the various pipes at three
different soaking temperatures. The blue lines show the hardness of Pipe 1, the red lines show
the hardness of Pipe 2 and the green lines show the hardness of Pipe 3. The letter N on the
X-axis represents the condition of the pipes prior to the post weld heat treatment.
Figure 15: Hardness of the pipes' base material before and after PWHT at different soaking temperatures.
N shows the pipes' hardness before they were heat-treated.
17
150
200
250
300
350
400
450
500
550
-35 -30 -25 -22 -19 -16 -8 0 8 16 19 22 25 30 35
Har
dn
ess
(HV
)
Distance from weld (mm)
Hardness for Pipe 1.1 before and after PWHT
Target
Pipe 1.1 Before
Pipe 1.1 After
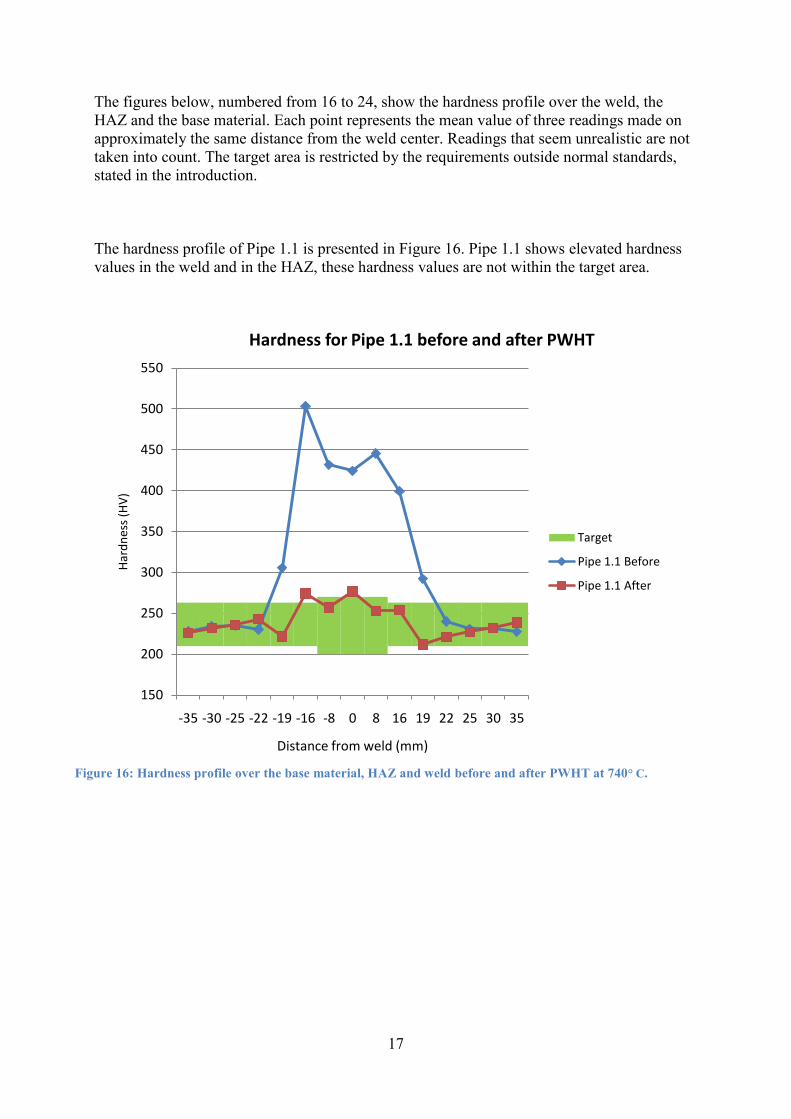
The figures below, numbered from 16 to 24, show the hardness profile over the weld, the
HAZ and the base material. Each point represents the mean value of three readings made on
approximately the same distance from the weld center. Readings that seem unrealistic are not
taken into count. The target area is restricted by the requirements outside normal standards,
stated in the introduction.
The hardness profile of Pipe 1.1 is presented in Figure 16. Pipe 1.1 shows elevated hardness
values in the weld and in the HAZ, these hardness values are not within the target area.
Figure 16: Hardness profile over the base material, HAZ and weld before and after PWHT at 740° C.

18
150
200
250
300
350
400
450
500
550
-35 -30 -25 -22 -19 -16 -8 0 8 16 19 22 25 30 35
Har
dn
ess
(HV
)
Distance from weld (mm)
Hardness for Pipe 1.2 before and after PWHT
Target
Pipe 1.2 Before
Pipe 1.2 After
150
200
250
300
350
400
450
500
550
-35 -30 -25 -22 -19 -16 -8 0 8 16 19 22 25 30 35
Har
dn
ess
(HV
)
Distance from weld (mm)
Hardness for Pipe 1.3 before and after PWHT
Target
Pipe 1.3 Before
Pipe 1.3 After
Figure 17 presents the hardness profile of Pipe 1.2. The hardness profile is stable and all
hardness values are within the target area.
Figure 18 presents the hardness profile of Pipe 1.3. The hardness profile is less stable than the
hardness profile presented in Figure 17, but all hardness values are within the target area.
Figure 17: Hardness profile over the base material, HAZ and weld before and after PWHT at 750° C.
Figure 18: Hardness profile over the base material, HAZ and weld before and after PWHT at 760° C.

19
150
200
250
300
350
400
450
500
550
-14 -12 -10 -8 -6 -4 -2 0 2 4 6 8 10 12 14
Har
dn
ess
(HV
)
Distance from weld (mm)
Hardness for Pipe 2.1 before and after PWHT
Target
Pipe 2.1 Before
Pipe 2.1 After
150
200
250
300
350
400
450
500
550
-14 -12 -10 -8 -6 -4 -2 0 2 4 6 8 10 12 14
Har
dn
ess
(HV
)
Distance from weld (mm)
Hardness for Pipe 2.2 before and after PWHT
Target
Pipe 2.2 Before
Pipe 2.2 After
Figure 19 shows the hardness profile of Pipe 2.1. This specimen has three elevated hardness
values in the HAZ that do not stay within the target area.
Figure 20 shows the hardness profile of Pipe 2.2. This hardness profile is more stable than the
hardness profile of Pipe 2.1, but one hardness value in the HAZ lies outside the target area.
Figure 19: Hardness profile over the base material, HAZ and weld before and after PWHT at 740° C.
Figure 20: Hardness profile over the base material, HAZ and weld before and after PWHT at 750° C.
20
150
200
250
300
350
400
450
500
550
-14 -12 -10 -8 -6 -4 -2 0 2 4 6 8 10 12 14
Har
dn
ess
(HV
)
Distance from weld (mm)
Hardness for Pipe 2.3 before and after PWHT
Target
Pipe 2.3 Before
Pipe 2.3 After
150
200
250
300
350
400
450
500
550
-14 -12 -10 -8 -6 -4 -2 0 2 4 6 8 10 12 14
Har
dn
ess
(HV
)
Distance from weld (mm)
Hardness for Pipe 3.1 before and after PWHT
Target
Pipe 3.1 Before
Pipe 3.1 After
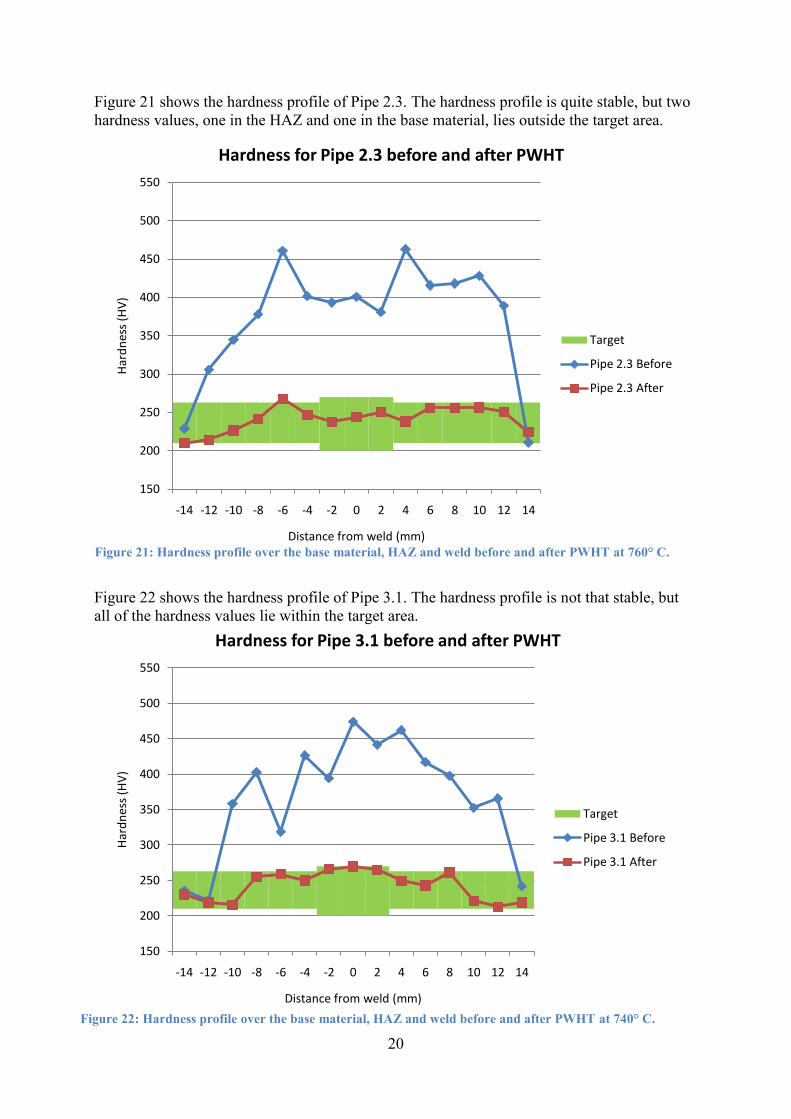
Figure 21 shows the hardness profile of Pipe 2.3. The hardness profile is quite stable, but two
hardness values, one in the HAZ and one in the base material, lies outside the target area.
Figure 22 shows the hardness profile of Pipe 3.1. The hardness profile is not that stable, but
all of the hardness values lie within the target area.
Figure 21: Hardness profile over the base material, HAZ and weld before and after PWHT at 760° C.
Figure 22: Hardness profile over the base material, HAZ and weld before and after PWHT at 740° C.
21
150
200
250
300
350
400
450
500
550
-14 -12 -10 -8 -6 -4 -2 0 2 4 6 8 10 12 14
Har
dn
ess
(HV
)
Distance from weld (mm)
Hardness for Pipe 3.2 before and after PWHT
Target
Pipe 3.2 Before
Pipe 3.2 After
150
200
250
300
350
400
450
500
550
-14 -12 -10 -8 -6 -4 -2 0 2 4 6 8 10 12 14
Har
dn
ess
(HV
)
Distance from weld (mm)
Hardness for Pipe 3.3 before and after PWHT
Target
Pipe 3.3 Before
Pipe 3.3 After
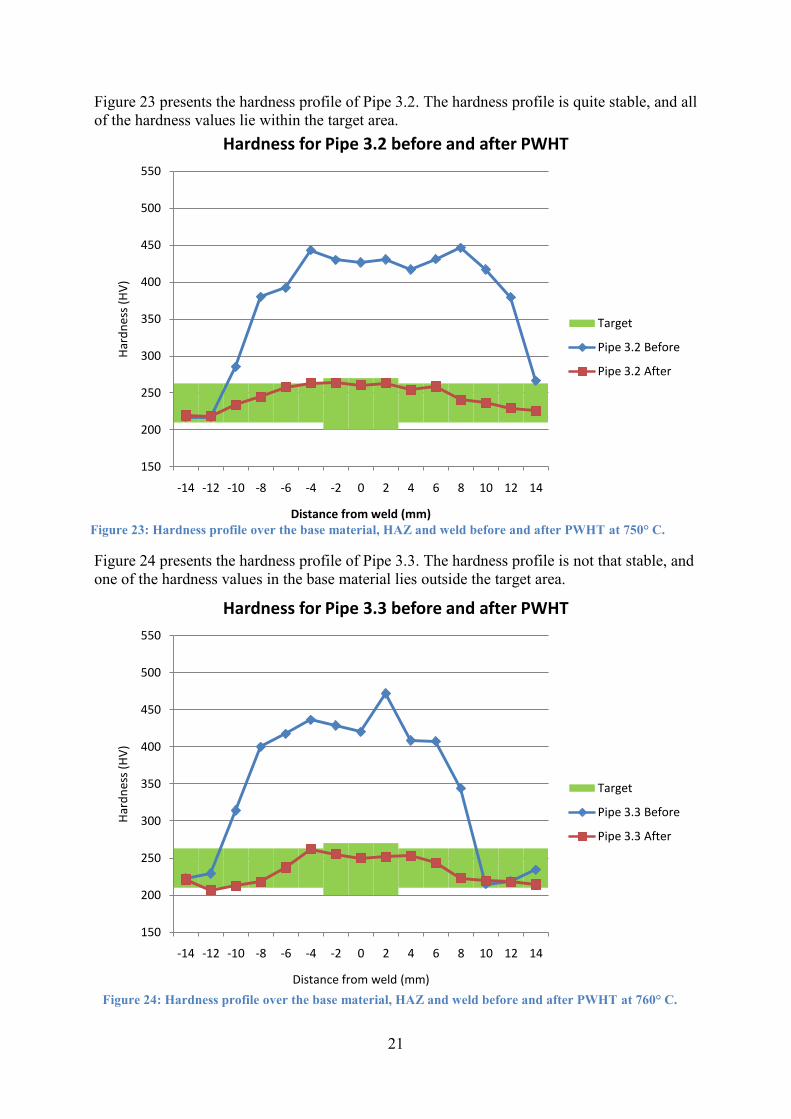
Figure 23 presents the hardness profile of Pipe 3.2. The hardness profile is quite stable, and all
of the hardness values lie within the target area.
Figure 24 presents the hardness profile of Pipe 3.3. The hardness profile is not that stable, and
one of the hardness values in the base material lies outside the target area.
Figure 23: Hardness profile over the base material, HAZ and weld before and after PWHT at 750° C.
Figure 24: Hardness profile over the base material, HAZ and weld before and after PWHT at 760° C.

22
Figure 25 shows the microstructure of Pipe 1.1, Pipe 1.2 and Pipe 1.3 when studied with an
optical microscope at two different magnifications. When comparing the different
microstructures, it is easy to see that the carbides grow with increasing soaking temperature.
Pipe 1.1 has very small carbides, in Pipe 1.2 the carbides have grown but they are still small
and for Pipe 1.3 the carbides have grown big.
Figure 25: Microstructure of Pipe 1.1, Pipe 1.2 and Pipe 1.3 at two different magnifications.

23
Figure 26 shows the microstructure of Pipe 2.1, Pipe 2.2 and Pipe 2.3 when studied with an
optical microscope at two different magnifications. There is not a huge difference between the
three microstructures; the carbides are approximately the same size.
Figure 26: Microstructure of Pipe 2.1, Pipe 2.2 and Pipe 2.3 at two different magnifications.

24
200
250
300
350
400
450
Before After
Har
dn
ess
(HV
)
Hardness in weld before and after PWHT at 740° C
Pipe 1.1
Pipe 2.1
Pipe 3.1
200
250
300
350
400
450
Before After
Har
dn
ess
(HV
)
Hardness in weld before and after PWHT at 750° C
Pipe 1.2
Pipe 2.2
Pipe 3.2
200
250
300
350
400
450
Before After
Har
dn
ess
(HV
)
Hardness in weld before and after PWHT at 760° C
Pipe 1.3
Pipe 2.3
Pipe 3.3
3.2.2 Hardness by welding method
The figures below show the hardness of the welds before and after PWHT. In all of these
figures the green bar (Pipe 3) shows a higher value of hardness than the red bar (Pipe 2). The
pipes represented by these two colors have the same dimensions, but are joined using different
welding methods. The welding method resulting in a harder weld is, according to this data,
SMAW.
Figure 27: Hardness in weld before and after PWHT at 740° C.
Figure 28: Hardness in weld before and after PWHT at 750° C.
Figure 29: Hardness in weld before and after PWHT at 760° C.
25
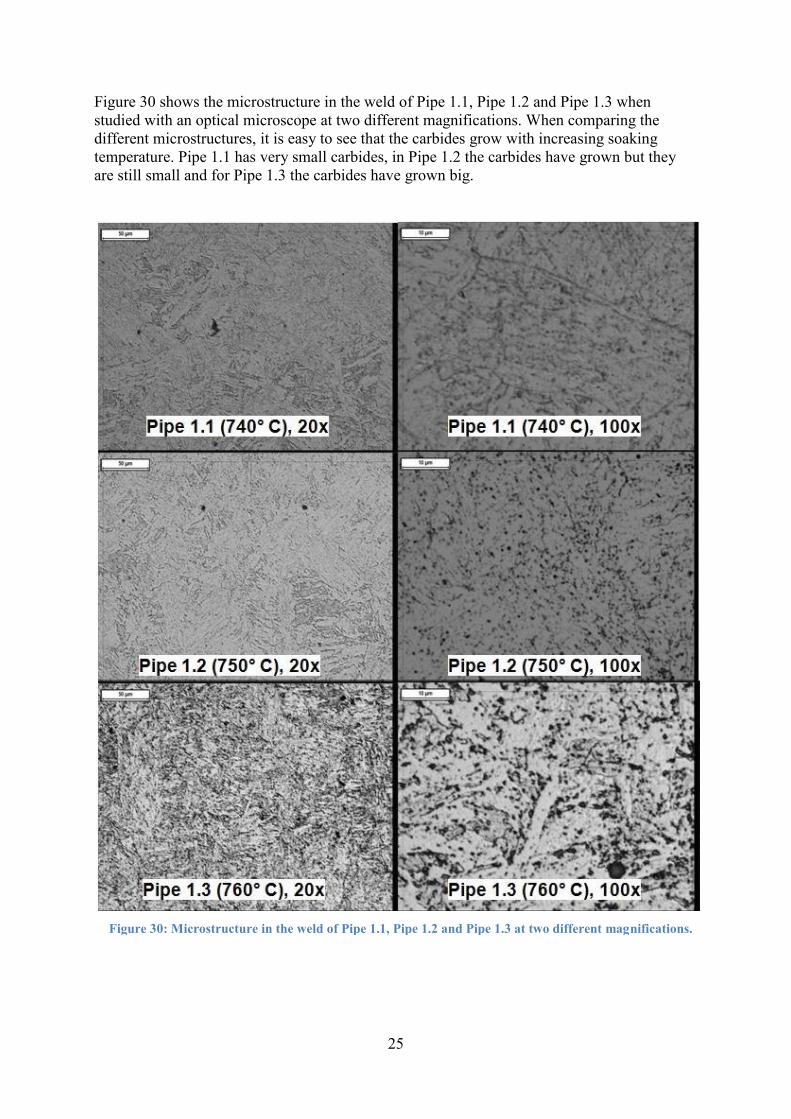
Figure 30 shows the microstructure in the weld of Pipe 1.1, Pipe 1.2 and Pipe 1.3 when
studied with an optical microscope at two different magnifications. When comparing the
different microstructures, it is easy to see that the carbides grow with increasing soaking
temperature. Pipe 1.1 has very small carbides, in Pipe 1.2 the carbides have grown but they
are still small and for Pipe 1.3 the carbides have grown big.
Figure 30: Microstructure in the weld of Pipe 1.1, Pipe 1.2 and Pipe 1.3 at two different magnifications.

26
Figure 31 shows the microstructure in the weld of Pipe 2.1, Pipe 2.2 and Pipe 2.3 when
studied with an optical microscope at two different magnifications. The differences that can
be seen between the various specimens are mainly the sizes of the carbides. But when
studying Pipe 2.1, the shape of the grains also differs from the other two microstructures.
The grains of Pipe 2.1 are round, but the grains of Pipe 2.2 and Pipe 2.3 are elongated.
Figure 31: Microstructure in the weld of Pipe 1.1, Pipe 1.2 and Pipe 1.3 at two different magnifications.

27
3.2.3 Hardness by thickness
The mean hardness of the base material affected by the thickness of the pipe can be seen when
studying Figure 17. The differences between Pipe 1 (blue lines), Pipe 2 (red lines) and Pipe 3
(green lines) when subjected to the same heat treatments are also presented in Table 3 below.
PWHT Hardness of Pipe 1 Hardness of Pipe 2 Hardness of Pipe 3
740° C 227 HV 232 HV 237 HV
750° C 235 HV 236 HV 225 HV
760° C 223 HV 225 HV 220 HV
Table 3: Mean hardness of the pipes' base material. The highest hardness value is marked by green
background filling and the lowest value is marked by red background filling.

28
4. Discussion
4.1 Test 1
The first test was performed to evaluate the behavior of the material's hardness under the
effect of numerous heat treatment cycles. When studying the results shown in Figure 11 the
decrease in hardness grows with the number of heat treatments, the more heat treatments the
softer the material gets. However, the difference between the mean hardness of Puck 1 and
Puck 5 are only 1,5 HV. According to Figure 12, the growth of the material's carbides causes
the decrease in hardness.
When comparing the different measuring instruments, the stationary hardness tester shows a
much higher hardness of the material than the portable hardness tester. Even though both
testers obtain mean values within the target area the total mean values for the two instruments,
calculated by 50 readings, differs by almost 17 HV. The standard deviations for the stationary
hardness tester (4.3 units) and the portable hardness tester (14.6 units) in Figure 13 show an
even bigger difference.
However, the obtained hardness value may not depend on the measuring instruments but on
the operator. When comparing the two results in Figure 14, the mean hardness values
obtained by the various operators differ by almost 20 HV for each puck, but their standard
deviations are rather similar. This indicates that something must have gone wrong during the
calibration of the GE-MIC 10. As the calibration procedure is explained in the introduction,
the accuracy of the calibration lies in the number of readings on the ingot's surface and the
operators' effort during the procedure. It is the operator who decides when the GE-MIC 10 is
calibrated and when it is accurate enough to start measuring. The accuracy may also be
affected by how the hardness tester is held during the procedure, but in that case, the standard
deviations would differ a lot more. The influence of the operator on the obtained hardness
values should be reviewed.

29
4.2 Test 2
Previous reports have shown that when heat treating Grade 91 material the hardness decreases
with increasing soaking temperature (as shown in Figure 2), at least within a certain
temperature range [9]. The soaking temperatures investigated in this report are in the range of
740-760° C. In Figure 15, the decrease in hardness is plotted against soaking temperature, but
there are different results for the various pipes. Pipe 1 softens when heat-treated at 740° C and
760° C, but increases in hardness by 5 HV when heat-treated at 750° C. Pipe 2 and Pipe 3
however, decreases in hardness after every heat treatment. Although the curves are different,
the trend shows that the hardness of the pucks decreases when they are heat treated at a higher
soaking temperature. Studying Figure 25 and Figure 26, the growth of the material's carbides
causes the decrease in hardness. Small precipitations increase the hardness of a material, but
when the precipitations grow the hardness decreases, and this happens when post weld heat-
treating the pipes at higher soaking temperatures.
However, the main reason for a PWHT is not to make the base material softer, that is only a
side effect, the main reasons are to release residual stresses after welding and to eliminate
susceptibility to stress corrosion cracking. Although, in this case one of the reasons is to
decrease the hardness of the weld so that is satisfies the requirements outside normal
standards. Throughout all of the different PWHT's the hardness of the weld meets the
customer demands upper limit, and just like in the previous statement the hardness of the weld
decreases with increasing soaking temperature. But how are the hardness affected by different
welding methods?
When studying figures 27 to 29, the comparable pipes are Pipe 2 and Pipe 3, since the only
parameter separating these two pipes is the type of weld. In each diagram the green bar (Pipe
3) shows a higher value than the red bar (Pipe 2). This means that, just like in Figure 1, the
hardness of a shielded metal arc weld exceeds the hardness of the gas tungsten arc weld [7].
The GTAW process should therefore be more appropriate when welding these components,
since CCI Valve have obtained too high values of hardness in the weld earlier. However, there
are many parameters to take into account; the pipes joined with GTAW show a value of
hardness in the HAZ that is not within the acceptable range. The figures numbered from 16 to
24 show the hardness profile over the weld, HAZ and the base material, and Pipe 2 (GTAW)
does not meet the hardness demands of the HAZ after any of the PWHT's. That might be a
coincidence, but when studying the specimens' hardness profiles it seems that SMAW
generally is the best welding method. Although the shielded metal arc weld reach a higher
hardness it does not affect the base material as much as the GTAW.
The effect the thickness of the pipe has on its hardness is something that is harder to evaluate
from the obtained data. In Table 3, the mean hardness of the pipe's base material after the
different PWHT's are presented. By looking at the results, there are very few conclusions that
can be drawn since the difference between the various pipe's hardness only differ by 10 HV at
most. There is not a considerable difference between them and neither is there an obvious
trend. However, if any conclusions were to be drawn, it seems that the thinner pipes gain a
harder base material than the thicker one. It is not a great difference, but it exists.

30
5. Conclusion
From the results obtained during this work the following conclusions can be made:
When heat treating the Grade 91 material there is no significant benefit attained from
putting it through several cycles, one heat treatment cycle is enough.
Despite that the results obtained from the GE-MIC 10 are widely dispersed, the
measurements seem to depend on the calibration of the measuring instrument and not
on the measuring instrument itself. If the procedure of the measurement and the
calibration could be standardized, so that every operator performed the calibration and
the measurement the same way, the GE-MIC 10 would be an adequate measuring
instrument.
The welding method previously used at CCI Valve for larger pipes is SMAW, and
according to the results the shielded metal arc weld gains a higher hardness but it
affects the base material less than the gas tungsten arc welding method. A continued
use of SMAW is recommended.
When studying the different PWHT's a soaking temperature of 750° C is what
generates the most stable hardness profile when measuring the hardness over the base
material, HAZ and the weld. A PWHT at 750° C does not make the weld to hard nor
the base material to soft.
When heat treating components that vary in thickness the soaking temperature does
not seem essential to the obtained hardness.

31
6. Acknowledgements
This thesis work has been completed thanks to the contribution from the following people:
Anders Gåård, mentor at Karlstad University, Sweden
Mattias Eng, quality assurance manager at CCI Valve Technology AB, Sweden
Johan Fremling, international welding engineer at CCI Valve Technology AB, Sweden
Nicklas Gustafsson, welding specialist at CCI Valve Technology AB, Sweden
Christer Burman, research engineer at Karlstad University, Sweden
Welders and other employees at CCI Valve Technology AB, Sweden
Thank you!

32
7. References
[1] DiStefano, J. R. and Sikka, V. K., "Summary of Modified 9Cr-1Mo Steel Development
Program," 1975-1985. ORNL-6303, Oak Ridge National Laboratory, October 1986.
[2] King, J.F, Sikka V.K., Santella M.L., Turner J.F. and Pickering E.W., "Weldability of
Modified 9Cr-1Mo Steel," ORNL-6299, Oak Ridge National Laboratory, September 1986.
[3] Brinkmann, C.R., Sikka, V.K., Horak, J.A. and Santella, M.L., "Long term creep rupture
behavior of Modified 9Cr-!Mo Steel Base and Weldment Behavior," ORNL/TM-10504, Oak
Ridge national Laboratory, November 1987.
[4] David Buzza, P91 Piping Fabrication Guidelines, 2011, http://ccusers.org/wp-
content/uploads/2012/04/111031_CCUG_P91_Fabrication_Guidelines_Dave_Buzza-1.pdf
(Retrieved 2014-05-07)
[5] Guidelines and Specifications for High-Reliability Fossil Power Plants: Best Practice
Guideline for Manufacturing and Construction of Grade 91 Steel Components. EPRI, Palo
Alto, CA: 2011. 1023199.
[6] Sperko Engineering Services, Inc., Welding "Grade 91" Alloy Steel", 2012,
http://www.sperkoengineering.com/html/Grade%2091%20R%208-12.pdf,
(Retrieved 2014-05-22)
[7] Husnain Shabir, Khalid. H. Hashmi, Ghulam Zakria, Shahid Khalil, Mahboob Alam and
Muhammad Farooq, "Characterization of DissimilarAlloys Welding Techniques with
Enhanced Galvanic Corrosion", World Applied Sciences Journal, 29, 2014, s. 89-95.
[8] K. Natesan, S. Majumdar, P.S. Shankar, and V.N. Shah, "Preliminary Materials Selection
Issues for the Next Generation Nuclear Plant Reactor Pressure Vessel," 2006, Argonne
National Laboratory, http://www.ipd.anl.gov/anlpubs/2007/03/57698.pdf,
(Retrieved 2014-05-22)
[9] B.K. Choudhary ⇑ , J. Christopher, D.P. Rao Palaparti, E. Isaac Samuel, M.D. Mathew,
"Influence of temperature and post weld heat treatment on tensile stress–strain and work
hardening behaviour of modified 9Cr–1Mo steel", Materials and Design, 52, 2013, s. 58-65.
[10] Gordon England, Vickers Hardness Test,
http://www.gordonengland.co.uk/hardness/vickers.htm, (Retrieved 2014-05-21)
[11] GE Inspection Technologies, Krautkramer MIC-10 operation manual, 2005,
http://www.ge-mcs.com/download/hardness-testing/MIC%2010/om-mic10-EN.pdf
(Retrieved 2014-05-21)

33
8. Appendices
8.1 Heat treatments for pucks

34

35

36

37

38

39
8.2 Pre-heat diagrams for pipes

40

41

42

43
8.3 Welding protocols for pipes

44

45

46

47

48
49

50

51
8.4 Post weld heat treatments for pipes

52

53
54