effects of fish species on the characteristics of fish … (05) 2015/(47).pdf · fish meat, tapioca...
TRANSCRIPT
© All Rights Reserved
*Corresponding author. Email: [email protected]: 66-7331-3928; Fax: 66-7333-4609
International Food Research Journal 22(5): 2078-2087 (2015)Journal homepage: http://www.ifrj.upm.edu.my
1*Kaewmanee, T., 1Karrila, T.T. and 2Benjakul, S.
1Department of Food Science and Nutrition, Faculty of Science and Technology Prince of Songkla University, Muang, Pattani, 94000, Thailand
2Department of Food Technology, Faculty of Agro-Industry, Prince of Songkla University, Hat Yai, Songkhla, 90112, Thailand
Effects of fish species on the characteristics of fish cracker
Abstract
Fish cracker (Thai name: Khao Kieb Pla, also widely known as Keropok) is a popular snack in Thailand and other ASEAN countries. The main ingredients for making fish cracker are tapioca flour, fish meat, and some seasonings. The types of fish used could affect the cracker characteristics. The aim of this research was to investigate the effects of fish type on physical, textural, microstructure and sensory properties of cracker. The characteristics of cracker gel (CG), half-finished cracker (HFC) and puffed cracker (PC) prepared from 6 fish species, namely Thunnus tonggol, Decapterus maruadsi, Sardinella gibbosa, Trichiurus lepturus, Priacanthus tayenus, and Nemipterus hexodon, were compared. The CG and PC samples varied in colour and texture. The lowest lightness (L*) and highest redness (a*), in both CG and PC, were found with T. tonggol (p< 0.05), while the highest yellowness (b*) was obtained with D. maruadsi. The CG made with T. lepturus, P. tayenusor N. hexodon showed lower hardness, springiness and cohesiveness than with the other fish species (p< 0.05). The pasting behaviors of HFC varied with fish species, and a high linear expansion with a low hardness of PC were obtained in samples with fishes that have a low lipid content. The PC from T. tonggol had low oil absorption while the other fishes gave absorptions similar to each other. Confocal laser scanning micrographs indicated released lipids in CG made with fatty fish. Scanning electron micrographs revealed that the lean fish gave porous puffed products, with comparatively thin-walled pores in the cracker relative to PC from fatty fish. This study demonstrated that fish type affects important characteristics of cracker. Therefore, the quality control of fish cracker will necessarily involve also control of the raw materials, and in particular screening of the fish species.
Introduction
On preparing fish cracker one starts by mixing fish meat, tapioca flour, water, and some seasonings including salt, sugar, and monosodium glutamate. The homogeneous mixture, typically in a cylindrical shape resembling a sausage, is gelatinized by boiling or steaming to obtain gelatinized dough. The dough is then cooled, sliced and air-dried or sun-dried to 10-12 percent moisture content (Huda et al., 2010). The dried sliced product (a half-finished product) has a comparatively good shelf-life, and is fried in cooking oil to the finished product consumed as snack food. During deep-frying in oil, within only a few seconds the cracker expands from small-sized semi-transparent chips to turbid puffy crackers, as water bound to the starch expands to steam. Good quality cracker must have sufficient expansion on puffing for crispness, as well as low moisture content and low oil absorption (Karrila et al., 2011). A number of previous studies have attempted to improve the
quality and acceptability of fish cracker. In order to improve fish cracker quality, the effects of steaming time and the addition of food additives (sodium bicarbonate, sodium polyphosphate and ammonium bicarbonate) have been studied (Cheow et al., 1999; Nurul et al., 2009).
Marine fish are more commonly used than freshwater fish in making cracker. The commercial fish crackers in Thailand are usually produced from tuna, sardine and mackerel, though the choice of fish depends on availability, cost and the required quality of the final product (Huda et al., 2010). In the southern part of Thailand, fish used by the surimi producing industry are also used for making cracker. In general, both pelagic and demersal fish can be used in fish cracker. The pelagic fish inhabit water close to the surface or in middle depths, and generally feed on plankton. The demersal fish in contrast sink close to or onto the bottom of the sea, feeding on benthic organisms. These categories of fish differ in composition, such as protein and lipid
Keywords
Fish speciesCrackerTextural propertyLinear expansionHardness
Article history
Received: 3 September 2014Received in revised form: 23 January 2015Accepted: 29 January 2015
2079 Kaewmanee et al./IFRJ 22(5): 2078-2087
contents, and the choice of category might affect the characteristics of cracker. Fish protein hydrolysate, dried surimi powder, and wash water protein from fish ball processing have also been used in fish cracker formulations (Yu et al., 1990; Yu et al, 1994).Although many kinds of fish have been used to make cracker, there is no prior information regarding the effects of fish type on cracker characteristics, at least not in the scientific literature. Therefore, the objective of this study was to determine the effects of fish species on cracker characteristics, including pelagic fish, namely T. tonggol, D. maruadsi and S. gibbosa, and demersal fish, namely T. lepturus, P. tayenus and N. hexodon. Knowledge of how the choice of fish affects the quality of cracker helps make informed choices on selecting the fish raw material, or on substituting with other fish when the primary choice is not available. These choices become the more important as cracker production progresses from a cottage industry towards true industrial scale. When such scale is reached, likely mixtures of fish species will need to be used, with some bounds for the blend ratios.
Materials and Methods
ChemicalsNile blue A and acridine orange were procured
from Sigma (St. Louis, MO, USA). Glutaraldehyde and ethanol were obtained from Merck (Darmstadt, Germany).
Fish collection and preparationSamples of the pelagic fish species T. tonggol
(1.5 fish/kg), D. maruadsi (7 fish/kg), S. gibbosa (14 fish/kg), as well as the demersal fish species T. lepturus (1.5 fish/kg), P. tayenus (5 fish/kg) and N. hexodon (10 fish/kg), were purchased fresh from a dock in Pattani, Thailand during the period between September to August, 2003. Freshness of fish was decided by staffs experienced in sensory evaluation. The fish were considered for appearance, texture, odor, eye and gills too determined their overall quality. The low overall quality of fish was not accepted for the experiment. The initial pH values of fish muscle using in this study was accepted at range of 6.5–7.0 only. The whole fish samples were transported in ice, with a fish/ice ratio of 1:2 (w/w), to the Department of Food Science and Nutrition, Prince of Songkla University, Pattani, Thailand, within 2 h. The each fish were immediately washed, deskinned, and filleted. The belly flap of fish was removed from the flesh and the flesh, collected and packed in polyethylene bags. Each bag was labeled species of fish and stored in ice
until use within approximately 1 h. Before making cracker the fish was minced, using a mincer (NG-12, Fry King, Thailand) with 5 mm diameter holes.
Proximate analysis of fish meatThe fish minces were analyzed for moisture,
protein, lipid, and ash contents, following AOAC methods 950.46, 928.08, 960.39 and 920.153, respectively (AOCA, 2000).
Preparation of fish crackerTapioca flour was mixed well with minced fish
at a 1:1 ratio (w/w fresh). One-fifth of the total flour was separately mixed with water (1:2, w/v), and heated with constant stirring until the paste became clear, sticky, and glue-like. The resulting paste was mixed well with the remaining flour and minced fish. The mixture was then kneaded well, using a kneading machine for 15 min, to obtain cracker dough. The moisture content of the dough was adjusted to 70% by the addition of water, so that the final dry matter content was 30%. The cracker dough was shaped as a 3 cm diameter cylinder with 12 cm length, then cooked by steaming for 90 min to obtain “cracker gel” (CG). The CG was left at 4±1oC for 12 hr, and then cut into 2 mm thick slices. The sliced CG was hot air dried at 60oC to obtain 11±1% moisture content, to obtain half-finished cracker (HFC). The HFC samples ware separately stored in well proven air tight polyethylene bags. The HFC was deep fried in hot oil (190oC, 30sec) to provide the final product, namely “puffed crackers” (PC). Cracker without fish mince was also prepared and used as the control. All crackers were subjected to analyses.
Characterization of CG
Texture profile analysis (TPA) TPA was performed as described by Bourne with
a TA-XT2i texture analyzer (Stable Micro Systems, Surrey, England) (Bourne, 1978). The cylindrical CG was cut into 3 cm length and then was compressed twice to 70% of the original height with an aluminum cylindrical compression probe (50 mm diameter). The textural analyses were performed at room temperature. Force-distance deformation curves were recorded at cross head speed of 5 mm s-1, and the recording speed of a plotter was 5 mm s-1. Hardness (N), springiness (mm),and cohesiveness were computed by the Micro Stable software (Exponent Version 6.0.7.0,Stable Micro Systems, Surrey, England), and recorded.
Determination of colour The colour of CG was measured at a planar
Kaewmanee et al./IFRJ 22(5): 2078-2087 2080
sample surface. Lightness (L*), redness/greenness (a*) and yellowness/blueness (b*) were measured using Hunter Lab (Color Flex, Hunter Associates Laboratory, VA, USA).
Determination of microstructure The microstructure of CG was examined with
confocal laser scanning microscopy (CLSM) (Olympus, FV300, Tokyo, Japan), following with minor modifications the method of Mineki and Kobayashi (1997).The CG samples were cut into 0.5 x 0.5 x 0.2 cm size, then immersed in 0.01% Nile blue A solution at a ratio of 1:10 (w/v) for 5 min, and finally immersed in 0.01% acridine orange for 5 min. The samples were placed on microscope slides, and the CLSM was operated in fluorescence mode. The excitation from a Helium Neon Red laser (HeNe-R) was at 533 nm wavelength, and the emission wavelength was 630 nm for lipid analysis. For protein analysis, the 488 nm excitation from a Helium Neon Green laser (HeNe-G) was used with 540 nm emission wavelength.
Characterization of PC
Determination of hardnessHardness was measured by a penetration test
using a Texture Analyzer (TA-XT2 Stable Micro System, England). The PC samples were placed on a support rig and penetrated using ball probes (p/0.25 s –type stainless steel ball probe), to measure maximum compression force. The conditions of the texture determination were as follows: pre-test speed, 2.0 mm s-1; post-test speed, 5.0 mm s-1; distance, 5.0 mm; time, 5.0 s; trigger type, auto; and trigger force, 10 g. Hardness (N) was reported.
Determination of linear expansion Linear expansion was measured according to the
method of Nurul et al. (2009) with slight modifications. The percentage linear expansion of HFC during deep frying in oil at 190ºC was determined. A permanent ink fine pen was used to mark a straight line on the HFC, approximately along the major or minor axis of the near elliptical shape, and the line length was measured before and after frying. The percentage linear expansion was calculated in the obvious manner also used by:
where L2= length after frying and L1=length before frying.
Determination of oil absorption Oil absorption was measured according to the
modified method of Mohamed et al (1989). The HFC and obtained PC were weighed before and after frying in palm oil (190oC), respectively. They were ground and dried in the oven overnight and dry matter content was determined.
Oil absorption was determined as follow:
where W2= dry matter content of PC and W1= dry matter content of HFC.
Determination of microstructure Microstructures of PC were analyzed using
scanning electron microscopy. Prior to analysis, the liquid lipids on external surfaces of PC were removed using tissue paper. The PC sample was then cut into 0.5 x 0.5 cm pieces and select pieces were mounted on SEM sample stubs, using double-sided adhesive cellophane tape. The samples on stubs were gold coated, and then imaged with a scanning electron microscope (JEOL JSM-5800LV, Tokyo, Japan).
Determination of colourFor the PC samples, colour was determined in the
same manner as earlier described for CG, and L*, a*
and b* values were reported.
Sensory evaluation The sensory evaluation panel consisted of 30
postgraduate students from the Department of Food Science and Nutrition, Prince of Songkla University, Pattani, Thailand. The panelists consumed fish cracker regularly. Prior to testing, each cracker sample was individually sealed in a pouch and coded with a three-digit number. Drinking water was provided for mouth rinsing between the samples. Panelists were required to evaluate the colour, crispness, taste, and overall like/dislike of the crackers, using the 7-point hedonic scale (1=dislike extremely, 7=like extremely).
Characterization of HFC
Determination of pasting properties Pasting characteristics of HFC were determined
with a Rapid Visco Analyzer or RVA (RVA Super 4, Newport Scientific, Australia). The HFC sample was ground into powder, and sieved through a 250 µm mesh. Then 3 g of the HFC flour was added to 25 ml of distilled water to prepare a 12% (w/v) suspension. The suspension, in an aluminium can equipped with a plastic paddle, was stirred during the temperature
2081 Kaewmanee et al./IFRJ 22(5): 2078-2087
controlled measurements. The temperature profile used was 25-95-25oC. The sample was held at 25oC for 2 min, the temperature ramped up from25 to 95oC at a rate of 14oC min-1, held at 95oC for 3 min, and finally cooled to 25oC at the same 14oC min-1rate and kept for 5 min. The characteristics recorded were peak viscosity and final viscosity (at 25oC). The Thermocline software accompanying the measurement device computed these parameters.
Statistical analysisCompletely random design was used throughout
the study. The experiments were run in triplicate. Data are presented as mean values with standard deviations. One-way analysis of variance (ANOVA) was carried out, and means comparisons are based on Duncan’s multiple range tests.
Results and Discussion
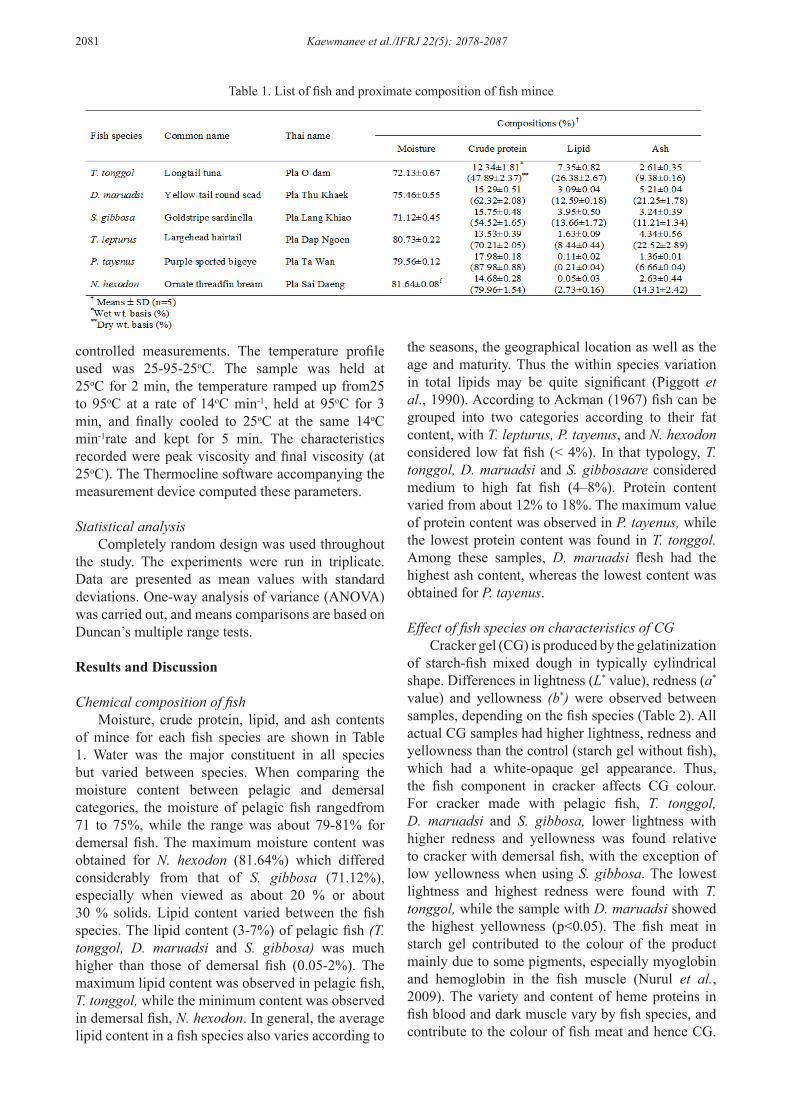
Chemical composition of fish Moisture, crude protein, lipid, and ash contents
of mince for each fish species are shown in Table 1. Water was the major constituent in all species but varied between species. When comparing the moisture content between pelagic and demersal categories, the moisture of pelagic fish rangedfrom 71 to 75%, while the range was about 79-81% for demersal fish. The maximum moisture content was obtained for N. hexodon (81.64%) which differed considerably from that of S. gibbosa (71.12%), especially when viewed as about 20 % or about 30 % solids. Lipid content varied between the fish species. The lipid content (3-7%) of pelagic fish (T. tonggol, D. maruadsi and S. gibbosa) was much higher than those of demersal fish (0.05-2%). The maximum lipid content was observed in pelagic fish, T. tonggol, while the minimum content was observed in demersal fish, N. hexodon. In general, the average lipid content in a fish species also varies according to
the seasons, the geographical location as well as the age and maturity. Thus the within species variation in total lipids may be quite significant (Piggott et al., 1990). According to Ackman (1967) fish can be grouped into two categories according to their fat content, with T. lepturus, P. tayenus, and N. hexodon considered low fat fish (< 4%). In that typology, T. tonggol, D. maruadsi and S. gibbosaare considered medium to high fat fish (4–8%). Protein content varied from about 12% to 18%. The maximum value of protein content was observed in P. tayenus, while the lowest protein content was found in T. tonggol. Among these samples, D. maruadsi flesh had the highest ash content, whereas the lowest content was obtained for P. tayenus.
Effect of fish species on characteristics of CGCracker gel (CG) is produced by the gelatinization
of starch-fish mixed dough in typically cylindrical shape. Differences in lightness (L* value), redness (a*
value) and yellowness (b*) were observed between samples, depending on the fish species (Table 2). All actual CG samples had higher lightness, redness and yellowness than the control (starch gel without fish), which had a white-opaque gel appearance. Thus, the fish component in cracker affects CG colour. For cracker made with pelagic fish, T. tonggol, D. maruadsi and S. gibbosa, lower lightness with higher redness and yellowness was found relative to cracker with demersal fish, with the exception of low yellowness when using S. gibbosa. The lowest lightness and highest redness were found with T. tonggol, while the sample with D. maruadsi showed the highest yellowness (p<0.05). The fish meat in starch gel contributed to the colour of the product mainly due to some pigments, especially myoglobin and hemoglobin in the fish muscle (Nurul et al., 2009). The variety and content of heme proteins in fish blood and dark muscle vary by fish species, and contribute to the colour of fish meat and hence CG.
Table 1. List of fish and proximate composition of fish mince
Kaewmanee et al./IFRJ 22(5): 2078-2087 2082
Love reported that pelagic species have dark tissue of brown or reddish colour, and up to 48% of the body weight may consist of dark muscle, whereas in demersal species the amount of dark muscle is much lower (Love, 1970).There are many differences in the chemical composition of the two muscle types, noteworthy being the high levels of lipids and myoglobin in the dark muscle. Chaijan et al (2007) also found that lipid and myoglobin contents were higher in the dark muscle than in ordinary muscle, both in sardine (Sardinella gibbosa) and in mackerel (Rastrelliger kanagurta).
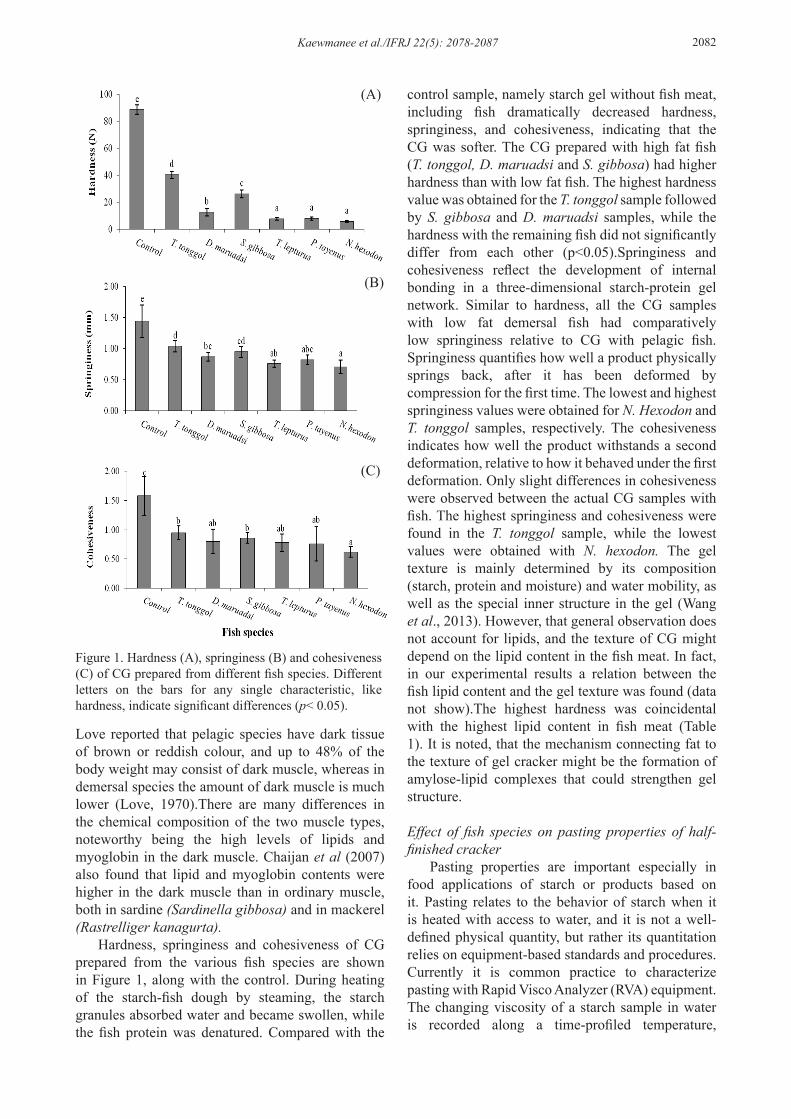
Hardness, springiness and cohesiveness of CG prepared from the various fish species are shown in Figure 1, along with the control. During heating of the starch-fish dough by steaming, the starch granules absorbed water and became swollen, while the fish protein was denatured. Compared with the
control sample, namely starch gel without fish meat, including fish dramatically decreased hardness, springiness, and cohesiveness, indicating that the CG was softer. The CG prepared with high fat fish (T. tonggol, D. maruadsi and S. gibbosa) had higher hardness than with low fat fish. The highest hardness value was obtained for the T. tonggol sample followed by S. gibbosa and D. maruadsi samples, while the hardness with the remaining fish did not significantly differ from each other (p<0.05).Springiness and cohesiveness reflect the development of internal bonding in a three-dimensional starch-protein gel network. Similar to hardness, all the CG samples with low fat demersal fish had comparatively low springiness relative to CG with pelagic fish. Springiness quantifies how well a product physically springs back, after it has been deformed by compression for the first time. The lowest and highest springiness values were obtained for N. Hexodon and T. tonggol samples, respectively. The cohesiveness indicates how well the product withstands a second deformation, relative to how it behaved under the first deformation. Only slight differences in cohesiveness were observed between the actual CG samples with fish. The highest springiness and cohesiveness were found in the T. tonggol sample, while the lowest values were obtained with N. hexodon. The gel texture is mainly determined by its composition (starch, protein and moisture) and water mobility, as well as the special inner structure in the gel (Wang et al., 2013). However, that general observation does not account for lipids, and the texture of CG might depend on the lipid content in the fish meat. In fact, in our experimental results a relation between the fish lipid content and the gel texture was found (data not show).The highest hardness was coincidental with the highest lipid content in fish meat (Table 1). It is noted, that the mechanism connecting fat to the texture of gel cracker might be the formation of amylose-lipid complexes that could strengthen gel structure.
Effect of fish species on pasting properties of half-finished cracker
Pasting properties are important especially in food applications of starch or products based on it. Pasting relates to the behavior of starch when it is heated with access to water, and it is not a well-defined physical quantity, but rather its quantitation relies on equipment-based standards and procedures. Currently it is common practice to characterize pasting with Rapid Visco Analyzer (RVA) equipment. The changing viscosity of a starch sample in water is recorded along a time-profiled temperature,
Figure 1. Hardness (A), springiness (B) and cohesiveness (C) of CG prepared from different fish species. Different letters on the bars for any single characteristic, like hardness, indicate significant differences (p< 0.05).
(A)
(B)
(C)

2083 Kaewmanee et al./IFRJ 22(5): 2078-2087
and a pasting profile is obtained (data not show). Since our HFC samples are already gelatinized, a temperature scan over 25-95-25oC was used in their testing, with attention to the viscosity temperatures below 50oC. In these cases, the cold peak viscosity (highest viscosity in 0-2.33 min of the test) did not appear for all samples, although the samples were gelatinized. This is different from the behavior of pregelatinized starches reported earlier, which show clearly cold peak viscosities (Nakorn et al., 2009). This implies that the steaming process used in the current experiments disrupted the starch granules less than the drum drying process used to pregelatinize starch. At low temperatures the starch molecules are not degraded enough by heat, so they don’t begin to absorb water. The viscosities of the HFC samples started to increase around 50-55oC, indicating that steaming had affected the structure of starch granules.
The viscosity profiles for the HFC samples appear to form three clusters or groups. Control HFC (without fish) showed the highest peak viscosity (4262.67±46.54 cP), forming a group by itself. The second group comprises the low fat fish (T. lepturus, P. tayenus and N. hexodon), which had peak viscosities around 50% lower than control (2438.67±8.96, 2298.33±29.14 and 2276.00±15.72cP, respectively). The last group comprises the high fat fish (T. tonggol, D. maruadsi and S. gibbosa), showing lower viscosities of HFC than the second group (322.33±2.31, 877.67±5.69 and 553.33±16.17 cP, respectively). The starch content in HFC affects viscosity, and this was highest in the control. The low fat fish and high fat fish had clearly different peak and final viscosities of HFC. This could be due to the different fish meat compositions in general, but especially the fat content is a plausible factor. When starch is gelatinized, amylose molecules are released from the ruptured granules, and these can form complexes with lipids. A higher fat content in the fish should enable more amylose-lipid complexes that have strong structures with melting points around
105-139oC (Stauffer, 1998).Once the HFC samples had been reheated in water during RVA testing, the water absorption ability of HFC with high fat fish was reduced, and became lower than in HFC with low fat fish; hence the lower final viscosity. Davies et al. (1980) found that the complexation of amylose and fat reduces swelling (decreased swelling power) and solubility of starch.
The final viscosity as a quality parameter indicates the ability to form a viscous paste or gel after cooling. Re-association of amylose molecules during cooling forms a gel network that increases the viscosity (Miles et al., 1985). The final viscosities of HFC samples tended to have similar trends as the peak viscosities. The pelagic fish had higher final viscosities of HFC than the demersal fish, with values ranging from about 4117.33±10.50 to 6006.00±26.04 cP. The highest final viscosity was obtained with P. tayenus (6006.00±36.04 cP), and the lowest value was found with T. tonggol (1164.00±5.20 cP). From this result, RVA pasting test can be seen able a quick method to provide some information on HFC properties.
Effects of fish species on characteristics of puffed cracker (PC)
The colour coordinates of PC are also shown in Table 2.The control sample without fish was white to very light yellow in colour, with high lightness (L* = 48.02), low redness (a*= -0.76) and yellowness (b*= 6.11). The colour of actual PC varied the fish species, and had similar trends as the colour of actual CG. The pelagic fish gave darker PC (lower lightness, higher redness and yellowness) than the demersal fish. The darkest colour was obtained with T. tonggol, with the lowest L* and a* values, whereas the highest b* was found with D. maruadsi. Myoglobin and hemoglobin in the fish meat, particularly in the dark meat, might contribute to the colour of PC. Generally, the factors affecting the colour of fish cracker include the amount and type of fish used, as well as the amount and type of
Table 2. Colour of CG and PC prepared from different fish species
Kaewmanee et al./IFRJ 22(5): 2078-2087 2084
starch added. Nurul et al. (2009) found that lightness and redness tended to decrease with the ratio of fish meat to tapioca flour, whereas yellowness tended to decrease. Thermal treatment (frying) may also affect the colour of PC due to structural changes in starch granules and proteins. Slight browning, including the Maillard reaction and the caramelization by heat, as well as changes in pigment concentration caused by dehydration and expansion, might be among the factors that determine the colour of cracker (Wang et al., 2013). The a* and b* values were governed by lipids, myoglobin as well as hemoglobin in the dark muscles. Both values are influenced by myoglobin. The changes in a* values were mainly related to myoglobin oxidation, while the gelatinization and swelling ability of starch might cause some changes
in b* values (Yang and Park, 1998; Pilar and Reyes, 2007).
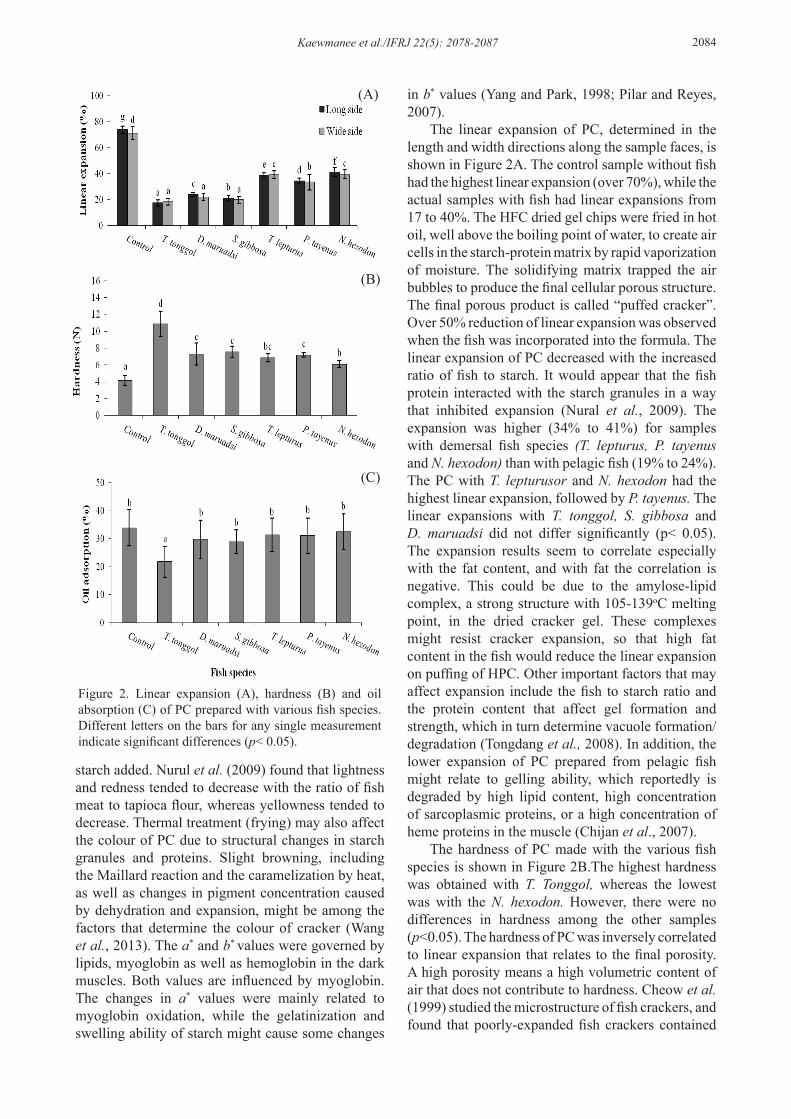
The linear expansion of PC, determined in the length and width directions along the sample faces, is shown in Figure 2A. The control sample without fish had the highest linear expansion (over 70%), while the actual samples with fish had linear expansions from 17 to 40%. The HFC dried gel chips were fried in hot oil, well above the boiling point of water, to create air cells in the starch-protein matrix by rapid vaporization of moisture. The solidifying matrix trapped the air bubbles to produce the final cellular porous structure. The final porous product is called “puffed cracker”. Over 50% reduction of linear expansion was observed when the fish was incorporated into the formula. The linear expansion of PC decreased with the increased ratio of fish to starch. It would appear that the fish protein interacted with the starch granules in a way that inhibited expansion (Nural et al., 2009). The expansion was higher (34% to 41%) for samples with demersal fish species (T. lepturus, P. tayenus and N. hexodon) than with pelagic fish (19% to 24%).The PC with T. lepturusor and N. hexodon had the highest linear expansion, followed by P. tayenus. The linear expansions with T. tonggol, S. gibbosa and D. maruadsi did not differ significantly (p< 0.05). The expansion results seem to correlate especially with the fat content, and with fat the correlation is negative. This could be due to the amylose-lipid complex, a strong structure with 105-139oC melting point, in the dried cracker gel. These complexes might resist cracker expansion, so that high fat content in the fish would reduce the linear expansion on puffing of HPC. Other important factors that may affect expansion include the fish to starch ratio and the protein content that affect gel formation and strength, which in turn determine vacuole formation/degradation (Tongdang et al., 2008). In addition, the lower expansion of PC prepared from pelagic fish might relate to gelling ability, which reportedly is degraded by high lipid content, high concentration of sarcoplasmic proteins, or a high concentration of heme proteins in the muscle (Chijan et al., 2007).
The hardness of PC made with the various fish species is shown in Figure 2B.The highest hardness was obtained with T. Tonggol, whereas the lowest was with the N. hexodon. However, there were no differences in hardness among the other samples (p<0.05). The hardness of PC was inversely correlated to linear expansion that relates to the final porosity. A high porosity means a high volumetric content of air that does not contribute to hardness. Cheow et al. (1999) studied the microstructure of fish crackers, and found that poorly-expanded fish crackers contained
Figure 2. Linear expansion (A), hardness (B) and oil absorption (C) of PC prepared with various fish species. Different letters on the bars for any single measurement indicate significant differences (p< 0.05).
(A)
(B)
(C)
2085 Kaewmanee et al./IFRJ 22(5): 2078-2087
large aggregates of fish protein. This prevented the starch gel from expanding in hot cooking oil, and the denser structure of cracker increased its hardness.
The oil absorption of PC with the various fish species is shown in Figure 2C. The lowest oil absorption was obtained from PC prepared with T. tonggol, matching the lowest linear expansion. No differences were observed in the oil absorption among PC samples with D. maruadsi, S. gibbosa, T. lepturus, P. tayenus and N. hexodon (p<0.05). Due to absorption of the frying oil, the fat content of fried fish crackers tends to increase with linear expansion (King, 2002). Mellema suggests that the evaporation of water causes oil absorption, as the oil gets pulled into pores to replace the lost water (Mellema, 2003).
Relation of fish lipid content to the characteristics of cracker gel and puffed cracker
The correlation between lipid content in fish meat with hardness of CG, hardness and linear expansion of PC made from the 6 fish species were tested in this study (data not show). Results revealed positive correlation between hardness of CG and PC with lipid content (R2=0.892 and 0.929 for the CG and PC, respectively). A good correlation between the linear expansion of PC and lipid content in fish meat was also found (R2=0.808 and 0.0.720 for the wide and long expansion, respectively). Therefore, the amount of fat in fish meat had rather high correlation with firmness of cracker gel, linear expansion and also
hardness of puffed crackers.Effect of fish species on microstructure of cracker gel and puffed cracker
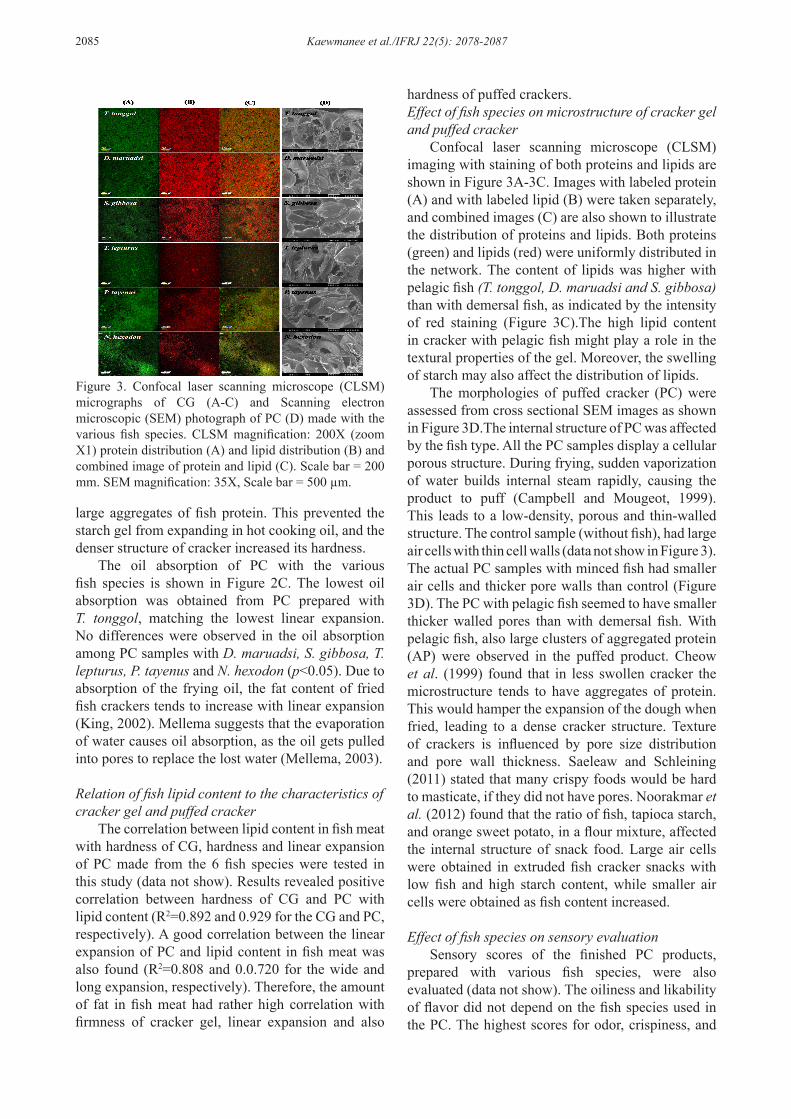
Confocal laser scanning microscope (CLSM) imaging with staining of both proteins and lipids are shown in Figure 3A-3C. Images with labeled protein (A) and with labeled lipid (B) were taken separately, and combined images (C) are also shown to illustrate the distribution of proteins and lipids. Both proteins (green) and lipids (red) were uniformly distributed in the network. The content of lipids was higher with pelagic fish (T. tonggol, D. maruadsi and S. gibbosa) than with demersal fish, as indicated by the intensity of red staining (Figure 3C).The high lipid content in cracker with pelagic fish might play a role in the textural properties of the gel. Moreover, the swelling of starch may also affect the distribution of lipids.
The morphologies of puffed cracker (PC) were assessed from cross sectional SEM images as shown in Figure 3D.The internal structure of PC was affected by the fish type. All the PC samples display a cellular porous structure. During frying, sudden vaporization of water builds internal steam rapidly, causing the product to puff (Campbell and Mougeot, 1999).This leads to a low-density, porous and thin-walled structure. The control sample (without fish), had large air cells with thin cell walls (data not show in Figure 3). The actual PC samples with minced fish had smaller air cells and thicker pore walls than control (Figure 3D). The PC with pelagic fish seemed to have smaller thicker walled pores than with demersal fish. With pelagic fish, also large clusters of aggregated protein (AP) were observed in the puffed product. Cheow et al. (1999) found that in less swollen cracker the microstructure tends to have aggregates of protein. This would hamper the expansion of the dough when fried, leading to a dense cracker structure. Texture of crackers is influenced by pore size distribution and pore wall thickness. Saeleaw and Schleining (2011) stated that many crispy foods would be hard to masticate, if they did not have pores. Noorakmar et al. (2012) found that the ratio of fish, tapioca starch, and orange sweet potato, in a flour mixture, affected the internal structure of snack food. Large air cells were obtained in extruded fish cracker snacks with low fish and high starch content, while smaller air cells were obtained as fish content increased.
Effect of fish species on sensory evaluationSensory scores of the finished PC products,
prepared with various fish species, were also evaluated (data not show). The oiliness and likability of flavor did not depend on the fish species used in the PC. The highest scores for odor, crispiness, and
Figure 3. Confocal laser scanning microscope (CLSM) micrographs of CG (A-C) and Scanning electron microscopic (SEM) photograph of PC (D) made with the various fish species. CLSM magnification: 200X (zoom X1) protein distribution (A) and lipid distribution (B) and combined image of protein and lipid (C). Scale bar = 200 mm. SEM magnification: 35X, Scale bar = 500 µm.
Kaewmanee et al./IFRJ 22(5): 2078-2087 2086
colour likability were obtained with D. maruadsi, which also gave the highest overall acceptability score (5.05).
Conclusions
The colour and the texture of fish cracker were affected by the type of fish used as raw material. Both cracker gel and puffed cracker prepared with fatty fish (pelagic species) had darker colour and harder texture than those with lean fish (demersal species).The hardnesses of CG and PC correlated positively with the lipid content in fish meat. Overall, the puffed cracker with D. maruadsi had the best human acceptability across the fish species tested. Thus, the fish types/species affected both technical characteristic of intermediate products and resulting cracker, as well as the subjective quality of the final product. The effects of storage on the quality of fish cracker may similarly depend on the fish species, and this might be the subject of a future study.
Acknowledgements
The authors would like to express their sincere gratitude for financial support by the Establish Project of the Halal Food Science Center, Department of Food Science and Nutrition, Prince of Songkla University (SAT-HC54-ST06). We are thankful to Assoc. Prof. Dr. Seppo Karrila for editing the manuscript.
References
Ackman, R. G. 1967. Characteristics of the fatty acid composition and biochemistry of some fresh-water fish oils and lipids in comparison with marine oils and lipids. Comparative Biochemistry and Physiology 22: 907-922.
AOAC. 2000. Official methods of analysis. 18th ed. 950.46, 928.08, 960.39, 920.153 AOAC, Washington, DC.
Bourne, M. C. 1978. Texture profile analysis. Food Technology 32: 62–72.
Campbell, G.M. and Mougeot, E. 1999. Creation and characterization of aerated food products. Trends in Food Science and Technology 10: 283-296.
Chaijan, M., Benjakul, S., Visessanguan, W., Lee, S. and Faustman, C. 2007. The effect of freezing and aldehydes on the interaction between fish myoglobin and myofibrillar proteins. Journal of Agricultural and Food Chemistry 55: 4562-4568.
Cheow, C. S., Yu, Y. S. and Howell, N. K. 1999. Effect of salt, sugar and monosodium glutamate on the viscoelastic properties of fish cracker (Keropok) gel. Journal of Food Processing and Preservation 23: 21-37.
Davies, T., Miller, D. C. and Procter, A. A. 1980. Inclusion complexes of free fatty acids with amylose. Starch-Starke 32: 149–158.
Huda, N., Leng, A. L., Yee, C. X. and Herpandi. 2010. Chemical composition, colour and linear expansion properties of Malaysian commercial fish cracker (Keropok). Asian Journal of Food and Agro-Industry 3: 473-482.
Karrila, T. T. 2011. Cracker “Keropok”: A review on factors influencing expansion. International Food Research Journal 18: 855-866.
King, M. A. 2002. Development and sensory acceptability of crackers made from the big-eye fish (Branchydeuterus auritus). Food and Nutrition Bulletin 23: 317-340.
Love, R. M. 1970. The chemical biology of fishes. Academic Press, London.
Mellema, M. 2003. Mechanism and reduction of fat uptake in deep-fat fried foods. Trends in Food Science and Technology 14: 364-373.
Miles, M. J., Morris, V. J., Orford, P. D. and Ring, S. G. 1985. The role of amylose and amylopectin in the gelation and retrogradation of starch. Carbohydrate Research 135: 271-28.
Mineki, M. and Kobayashi, M. 1997. Microstructure of yolk from fresh eggs by improved method. Journal of Food Science. 62: 757-761.
Mohamed, S., Abdullah, N. and Muthu. M. K. 1989. Physical properties of keropok (fried crisps) in relation to the amylopectin content of starch flour. Journal of Agricultural and Food Chemistry 49: 369–377.
Nakorn, K.N., Tongdang, T. and Sirivongpaisal, P. 2009. Crystallinity and rheological properties of pregelatinized rice starches differing in amylose content. Starch/Starke 61:101-108.
Noorakmar, A. W., Cheow, C. S., Norizzah, A. R., Mohd-Zahid, A. and Ruzaina, I. 2012. Effect of orange sweet potato (Ipomoea batatas) flour on the physical properties of fried extruded fish crackers. International Food Research Journal 19: 657-664.
Nurul, H., Boni, I. and Noryati, I. 2009. The effect of different ratios of Dory fish to tapioca flour on the linear expansion, oil absorption, colour and hardness of fish crackers. International Food Research Journal16: 195-165.
Piggott, G. M. and Tucker, B. W. 1990. Seafood: Effect of technology and nutrition. Marcel Dekker Inc., New York.
Pilar, T. and Reyes, P. 2007. Simultaneous application of transglutaminase and high pressure to improve functional properties of chicken meat gels. Food Chemistry 100: 264-272.
Saeleaw, M. and Schleininga, G. 2011. Effect of frying parameters on crispiness and sound emission of cassava crackers. Journal of Food Engineering103: 229–236.
Stauffer, C. E. 1998. Fat and oil in bakery products. Cereal Food World 43:120-126.
Tongdang, T., Meenun , M. and Chainui, J. 2008. Effect of sago starch addition and steaming time on making cassava cracker (Keropok). Starch-Starke 60: 568-
2087 Kaewmanee et al./IFRJ 22(5): 2078-2087
576.Wang, Y., Zhang, M. and Mujumdar, A. S. 2013. Effect of
cassava starch gel, fish gel and mixed gels and thermal treatment on structure development and various quality parameters in microwave vacuum-dried gel slices. Food Hydrocolloids 33: 26-37.
Yang, H. and Park, J. W. 1998. Effects of starch properties and thermal-processing conditions on surimi-starch gels. Food Science and Technology 31: 344-353.
Yu, S. Y. and Tan, L. K. 1990. Acceptability of crackers (Keropok) with fish protein hydrolysate. International Journal of Food Science and Technology 25: 204-208.
Yu, S. Y., Chai, Y. K. and Motohiro, T. 1994. Utilization of protein from fish ball processing wash water in fish crackers (Keropok). Journal of Food Processing and Preservation. 18: 453-459.