effects of foreign exchange rate fluctuation on …
TRANSCRIPT

EFFECTS OF FOREIGN EXCHANGE RATE FLUCTUATION ON STOCK
RETURNS VOLATILITY: A CASE STUDY OF NAIROBI SECURITIES
EXCHANGE (NSE)
1996-2012
JUMAH IRENE MUTINDI
Research thesis submitted in partial fulfillment of the requirements of
Masters of Arts in Economics (University of Nairobi)
2013

i
DECLARATION STATEMENT
This research paper is my original work and has not been presented for a degree award in any
other university.
NAME: Irene Mutindi Jumah
SIGNATURE:.............................................
DATE:..........................................................
This research paper has been submitted for examination with our approval as University
supervisors.
NAME: Dr. P. Muriu
SIGNATURE:.............................................
DATE:..........................................................
NAME: Dr. P. Machyo
SIGNATURE:.............................................
DATE:..........................................................

ii
DEDICATION
I dedicate this project to my loving husband Johnbosco M. Muthama, and my two lovely sons
Joseph Muthama and Brian Kioko.

iii
ACKNOWLEDGEMENT
The preparation and completion of this project would not have materialized were it not for
encouragement and assistant from various persons. I am therefore indebted to many whom I owe
appreciation for their encouragement, guidance and assistance in conducting this study. I wish to
thank all my course mates for their help and direction. Special thanks are due to Dr. Peter Muriu
and Dr. Patrick Machyo for their tireless guidance and encouragement through extremely useful
suggestions for improving this project both at the initial and final stages of my project. My
colleagues in the M.A Economics class Moses, John, Faith, Lucy, Mary and Angel warrant a
mention here for their support and encouragement.
I acknowledge with deep appreciation the moral support and invaluable assistance from my
friends Ken, my sisters and my family at large especially my loving husband who had to take
care of our sons as I spend extra time to actualize my dream. I wish to also appreciate the staff of
NSE who provided humble environment that enabled me to collect data required for this study.
I wish to state that the views expressed in this study are my own and thus do not represent the
views of the University of Nairobi or any other institution. I am however responsible for any
errors and shortcomings of this study.
iv
ABSTRACT
This study sought to examine the effect of foreign exchange rate fluctuations on the stock
return volatility on the Nairobi Securities Exchange, Kenya. It used monthly time series data
covering the period 1996 to 2012. The study employed Exponential Generalized Autoregressive
Conditional Heteroscedasticity (EGARCH) in the empirical analysis. Study findings reveal that
Foreign exchange rate affect stock return volatility. The magnitude of volatility, as measured by
β is relatively low though significant. The result of the study offers investors and policy makers a
basis upon which to make strategic investment decisions. The study therefore recommends a
policy that creates favourable foreign exchange market to ensure stability in the stock market.
Keywords: stock returns, foreign exchange rate, stock market volatility.
v
TABLE OF CONTENTS
DECLARATION STATEMENT ..................................................................................................... i
DEDICATION ................................................................................................................................ ii
ACKNOWLEDGEMENT ............................................................................................................. iii
ABSTRACT ................................................................................................................................... iv
LIST OF ACRONYMS ................................................................................................................ viii
CHAPTER ONE ............................................................................................................................. 1
1.1 Introduction ...................................................................................................................................... 1
1.2 Nairobi Securities Market: Stylized facts. ................................................................................... 3
1.3 Objectives of the study. .................................................................................................................... 5
1.4 Statement of the problem. ................................................................................................................ 5
1.5 Significance of the study .................................................................................................................. 6
1.6 Organization of the research paper. .............................................................................................. 7
CHAPTER TWO ............................................................................................................................ 8
LITERATURE REVIEW. ........................................................................................................................ 8
2.1 Introduction ...................................................................................................................................... 8
2.2 Theoretical Literature ...................................................................................................................... 8
2.3 Empirical Literature ........................................................................................................................ 9
2.4 Overview of the literature ............................................................................................................. 13
CHAPTER THREE ....................................................................................................................... 14
RESEARCH METHODOLOGY .......................................................................................................... 14
3.1 Introduction. ................................................................................................................................... 14
3.2 Model Specification ....................................................................................................................... 14
3.21 GARCH (1, 1) Model .................................................................................................... 14
3.22 EGARCH Model. .......................................................................................................... 16
3.3 Definition and measurement of variables ................................................................................... 17
3.31 Foreign exchange rate .................................................................................................... 17
3.32 Stock Returns:................................................................................................................ 18
3.4 Sources of Data. ............................................................................................................................. 19
vi
CHAPTER FOUR. ........................................................................................................................ 20
4.1 Introductions. .................................................................................................................................. 20
4.2 Descriptive Statistics ...................................................................................................................... 20
4.3 Test for stationarity ........................................................................................................................ 23
4.4 Testing for correlation ................................................................................................................... 24
4.5 Estimation of the EGARCH model ............................................................................................... 25
CHAPTER FIVE ........................................................................................................................... 28
5.1 Introduction .................................................................................................................................... 28
5.2 Summary of the findings ................................................................................................................ 28
5.3 Conclusions and policy implications ........................................................................................... 29
5.4 Limitation of the study. .................................................................................................................. 30
5.5 Areas for further research. ............................................................................................................ 30
REFERENCES .............................................................................................................................. 31
Appendices .................................................................................................................................... 39
Appendix I: Sample data ...................................................................................................................... 45
Appendix III: Linear graphical representation of NSE- 20 share index data ............................... 47
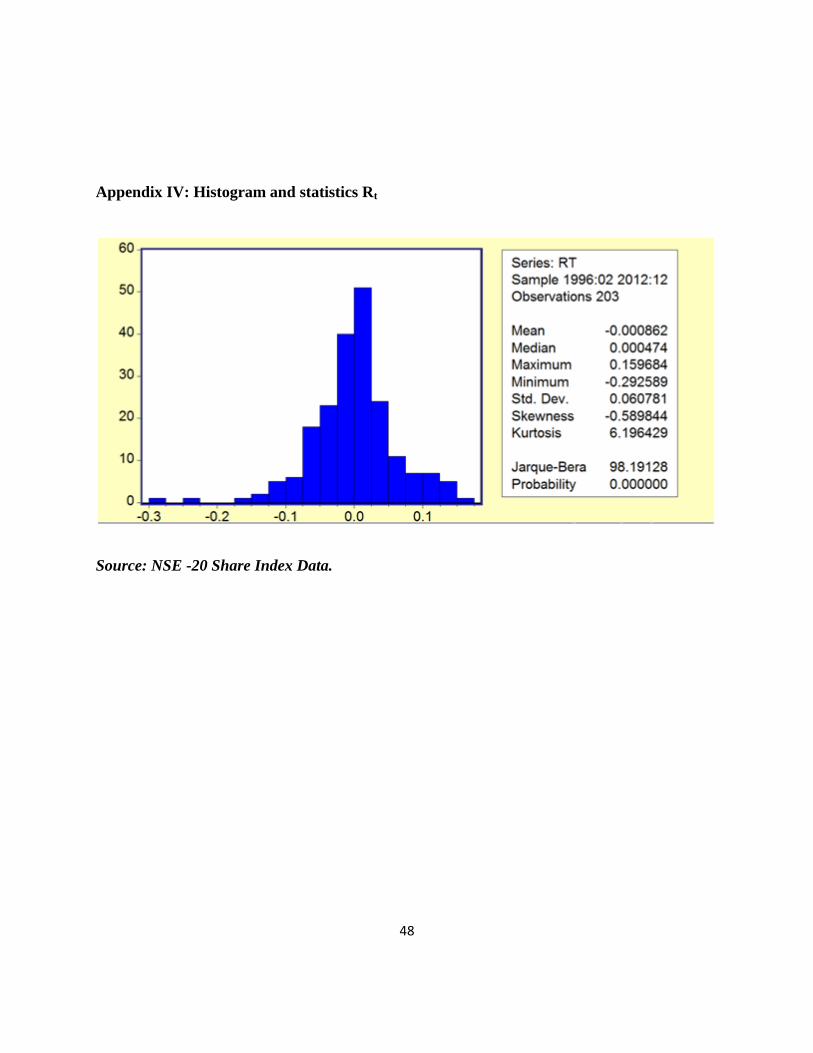
Appendix IV: Histogram and statistics Rt .......................................................................................... 48
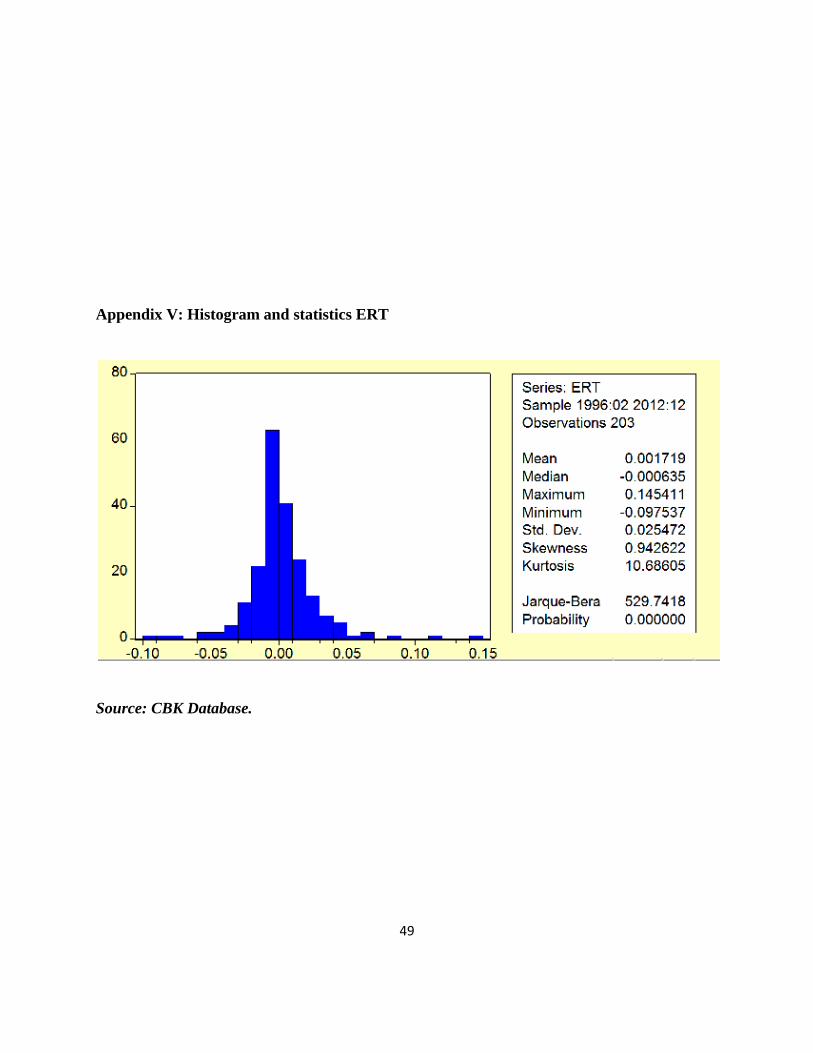
Appendix V: Histogram and statistics ERT ....................................................................................... 49

vii
LIST OF TABLES
Table 1: Descriptive statistics. ....................................................................................................... 20
Table 2: Results of Augmented Dickey Fuller (ADF) stationarity test at level ............................. 24
Table 3: Correlation matrix ........................................................................................................... 25
Table 4: EGARCH model results .................................................................................................. 26
Table 5: Summary statistics from estimated GARCH Model ........................................................ 27
viii
LIST OF ACRONYMS
NSE -Nairobi Securities Exchange.
IFC -International Finance Corporation.
ATS -Automated Trading Systems.
USD - United States Dollar
KSH - Kenya Shillings.
GARCH - Generalized Autoregressive Conditional Heteroscedasticity
EGARCH -Exponential Generalized Autoregressive Conditional Heteroscedasticity
SPSS -Statistical Package for Social Studies
ADF -Augmented Dickey-Fuller.
JB - Jarque-Bera
ERT -Foreign Exchange rate.
Rt -Returns
VAR -Variance
CBK -Central Bank of Kenya

1
CHAPTER ONE
1.1 Introduction
Stock markets especially in small economies plays a vital role in mobilizing economic
resources within and from outside the economy. It serves as an important conduit through which
funds flow from individuals and corporate entities across the globe to investors in a particular
economy. High stock returns imply higher firm and thus overall growth of an economy and vice
versa. Stock return volatility1 leads to uncertainty which hinders effective performance of the
financial sector as well as the entire economy at large, (Olweny and Omondi, 2011).
A developing stock market like the Nairobi Securities exchange (NSE) brings about other
benefits to the economy through lower cost of equity for firms, existence of mechanism for
appropriate pricing and hedging risk and through increased capital flows to the domestic
economy as international capital responds to the thriving stock market, Muriu,(2003).
Accordingly, emerging stock markets have captured the attention of investors and researchers in
recent years.
Volatility analysis in any stock market including NSE is useful in capital cost
determination as well as in the evaluation of asset allocation decision. As a result, policy makers
rely on volatility estimates to predict how vulnerable the financial markets are. This is because
1 volatility refers to the amount of uncertainty or risk about the size of changes in a security's value
2
volatility may prejudice the even performance of the financial system, negatively affecting
economic performance, (Gabriel and Ugochukwu, 2012).
An inconsistent stock prices change is perceived as a measure of risk by rational
investors, financial analysts, brokers, and regulators. In addition this makes them worry about
“excessive” volatility in which observed fluctuations in stock prices do not appear to be
accompanied by any important news about the firm or market as a whole. In such situation,
excessive volatility in stock returns, or “noise,” destabilizes the usefulness of stock prices as an
“indicator” of the true fundamental value of a firm, (Karolyi, 2001).
Policy makers are therefore concerned about macroeconomic factors that may influence
stock returns volatility. Many firms devote substantial resources to control and manage foreign
exchange rate risk that need to be actively hedged against by investors. Foreign exchange rate
has been found to play an important role in the investment and the international trade systems as
the appreciation of real exchange rate can lead to growth of foreign direct inflow, hence affecting
the overall economy, (Jamil and Ullah, 2013).
Exchange rate volatility has implications on a country‟s stock market. Exchange rate
movement affects output levels of firms including the trade balance of an economy. Price
movements in the stock market also affect aggregate demand through wealth, liquidity effects
and indirectly the exchange rate, (Subair and Salihu, 2004).

3
1.2 Nairobi Securities Market: Stylized facts.
Dealing in shares and stocks in Kenya started in the 1920's when the country was still a
British colony. The market was informal since there were no rules and regulations to administer
stock broking activities. Nairobi securities market was established in 1954 as an extension of the
activities at the London stock exchange. Asians and Africans were not allowed to trade in
securities, until after the attainment of independence in 1963.
Documented literature shows that NSE is the center of financial markets in East and
Central Africa and also one of the best performing securities exchanges in Africa. It contains
three segments; Main investors markets segment(MIMS) which deals with the main quotation,
the alternative investment market segment (AIMS) which deals with alternative methods of
raising capital for small , medium and young companies that find it difficult to meet the MIMS
listing requirement and finally the fixed income securities segment (FISMS) which provide
independent market for fixed income securities like Treasury bonds, corporate bonds, preference
shares and debenture stock and short term securities like the treasury bills and commercial
papers.
The NSE market has passed through a number of changes and developments up to date;
there are currently 60 companies that are publicly quoted in this market. Live trading on the
automated trading systems of the Nairobi Stock Exchange was implemented in September 2006
where it trades in equities, immobilized corporate bonds and treasury bonds. In July 2007 NSE
reviewed the Index and announced the companies that would constitute the NSE Share Index that

4
would become the true gauge of the market. In 2007, A Wide Area Network (WAN) platform
was implemented .This eradicated the need for dealers to conduct business presently at the
trading floor. Equity settlement cycle moved from the previous T+4 settlement cycles to the T+3
settlement cycle allowing, investors who sell their shares, to get their money three (3) days after
the sale of their shares.
NSE is licensed and regulated by Capital Market Authority (established in 1989) to
provide a trading platform for listed securities and overseeing its Member. Several policy
changes have also been made which include removal of the role of the capital market committee
in regulating shares, elimination of double taxation of dividends by conversion of the
withholding tax into the final tax ,elimination of the corporate tax on dividend income of the unit
trusts, exemption of withholding tax on dividends of corporate tax exempt bodies ,abolition of
the stamp duties on retail share transactions and deductibility of all costs incurred in the issue of
shares debentures and bonds.
Demutualization was a collaborative initiative by NSE, Capital Markets Authority
(CMA) and Kenya Association of Stock Brokers (KASIB), a process supported by the Kenyan
government and managed by the Demutualization Steering Committee (DSC) which was
established in 2009. Demutualization in NSE was implemented with the objective to improve the
governance system by separating the ownership structure and the trading participation rights of
the exchange, from a ownership currently limited by guarantee into a company limited by shares.
Draft demutualization bill is in place awaiting the Cabinet for approval to become a Act through
Cabinet Memorandum.

5
1.3 Objectives of the study.
The Main objective of this study is to investigate the effects of foreign exchange rate
fluctuations on stock market return volatility at the Nairobi Securities Exchange.
Specifically the study shall.
i) Determine the effects of foreign exchange rate fluctuation on stock return
volatility in the NSE market.
ii) Draw appropriate policy measures to enhance and promote development of the
NSE market.
1.4 Statement of the problem.
The stock market activity is important because the market sets up prices that affect the
cost of capital and also because excess market volatility may distort the economy's allocation of
capital and lead to financial strains through liquidity crises and macroeconomic instability.
Economies characterized stock return volatility usually attracts little or no funds because they are
regarded as risky. Developing economies are perceived to have high level of risk that
international investors shy away from especially the potentially profitable emerging markets.
This perception is more prone when we consider foreign exchange fluctuations, (Muriu, 2003).
Foreign Exchange rate volatility spillover is bad for firms because it affects the real
output of a country. The share prices of companies are eventually influenced due to the changes
in the current and future cash flows of the firm. The exchange rate fluctuations therefore bear the

6
effects on stock return, through economic exposure due to changes in foreign exchange rates
where operating costs rise. This renders the firms uncompetitive in the world market, which
further erodes profitability. This is through the systematic risk that cannot be diversified, which
every enterprise must endure with. Foreign exchange rates fluctuations reduce a company‟s
earnings and weaken its balance sheet through translation exposure, (Giddy and Dufey, (1991).
Consistent with other emerging markets worldwide, NSE faces stock return volatility.
This volatility adds another layer of risks, not only making the prices of financial assets more
difficult but also by generating portfolio flows that are potentially more unstable, Muriu, (2003).
Though there have been several studies carried out in Kenya on stock market volatility which
include; Equity risk and returns factors (Malamba, 2002), Volatility of stock returns (Muriu,
2003), the effect of macro-economic factors on stock return volatility (Olweny and Omondi,
2010) and the impact of inflation on stock market return and volatility (Murungi, 2012), the
evidence on effects of foreign exchange rate fluctuations on stock returns volatility is however
missing.
This study aims at filling this gap. In addition the recent global financial crisis has
attracted the attention on the financial assets behaviour in the context of foreign exchange rate
volatility. The study will set precedence for future research in NSE.
1.5 Significance of the study
This study will be of great interest to academics, investors and policy makers. First, most
of the existing evidence is on the developed stock markets, for example, on the response of
7
Australian stocks, foreign exchange and bond markets to foreign asset returns and volatilities
(McNelis, 1993), on the causal relationship between stock returns and exchange rates changes
for seven developed and six emerging markets, (Tudor, 2012), and on foreign exchange risk and
risk exposure in the Japanese stock market, (Tai, 2010). The scant literature in the Kenya‟s stock
market (NSE) does not address the exchange rate volatility spillover. This study will therefore
make a contribution to existing literature.
Second, this study is important to the policy makers in that it will enable them determine
the foreign exchange rate levels that would be consistent with the performance of the equity
market. It will also enable the government to make sound economic policy decisions for
managing exchange rate fluctuations and which regime to adopt.
Finally the study will enable investors to understand how vulnerable the stock market is
to exchange rate volatility in order to make the right decisions for minimizing risks and
maximizing on the stock returns, through diversification for better risk and portfolio
management strategies.
1.6 Organization of the research paper.
This paper is structured into five chapters. Chapter two presents the literature review both
theoretical and empirical, chapter three discusses the methodology, chapter four presents the
empirical findings and discussions. Chapter five concludes the study.
8
CHAPTER TWO
LITERATURE REVIEW.
2.1 Introduction
This chapter reviews both theoretical and empirical literature on the effects of foreign
exchange rate fluctuations on stock returns volatility. It gives us an overview of the literature
which is important in laying the foundation for the analytical framework discussed in the next
chapter.
2.2 Theoretical Literature
Classical economic theory considers that stock prices and exchange rates can interact in
two ways, the first way is through the „flow oriented‟ model and the second is the „portfolio
balance‟ models. These are two theoretical approaches on foreign exchange rate and stock
returns volatility. Flow oriented models according to Richards and Simpson (2009) suggest that
exchange rate fluctuations lead to movements in stock prices. The flow oriented approach is
based on the macroeconomic view that since stock prices represent the discounted present value
of a firm‟s expected future cash flows, then any incident that affects a firm‟s cash flow will be
reflected in its stock price. According to this model, devaluation of the national currency
increases the competitiveness of domestic producers causing the rise of the stock prices and in
the contrary their competitiveness is eroded by a too strong national currency causing decline of
stock prices, (Dornbusch and Fisher, 1980).

9
On the contrary, the second classical economic model; the Portfolio balance approaches,
or the „stock oriented‟ model which was developed by Branson et al,( 1977) posit that through
capital account dealings changes in stock prices can cause fluctuations in exchange rates. This
model assigned the leading role to stock prices variations which would affect foreign exchange
rate evolution through demand for domestic financial assets, (Richard and Simpson, 2009). Any
form of trade of domestic securities in foreign currency (either by foreigners or domestic
investors) by moving funds from offshore into domestic equities) in response to domestic stock
market has a flow through effect into the currency market.
The increase in stock prices attracts foreign capitals causing the appreciation of the
national currency while a decrease of stock prices could discourage the foreign investment,
leading to the depreciation of the national currency. The outcomes of the literature on these two
models have been mixed in terms of the evidence as to which of the models is most pertinent, or
preferred within an economy. This is because the outcomes may depend on the business cycle
stage and or the wider economic factors in a given stock market economy, Stefanescu and
Dumitriu, (2013).
2.3 Empirical Literature
Some financial economists find the causes of volatility rooted in unexpected new
information that modify expected returns on a stock .Others claim that volatility is caused mainly
by changes in trading volume, practices or patterns, which in turn are driven by factors such as

10
modifications in macroeconomic policies, shift in investors‟ tolerance of risk and increased
uncertainty, (Gabriel and Ugochukwu, 2012).
Chang et al, (2013) examined the effects of volatility spillovers for firm performance and
exchange rates with asymmetry in the Taiwan found a negative correlation between exchange
rate returns and stock returns. Aroni,(2011) analyzed factors influencing stock prices for firms
listed in NSE and the results showed that there is a negative correlation between foreign
exchange rate fluctuations and stock returns. Olweny and Omondi, (2011) studied the effects of
macroeconomic factors on stock return volatility at the Nairobi Securities Exchange with foreign
exchange rate being one of the explanatory factors. The results showed that foreign exchange
rate affect stock return volatility negatively.
Brooks, et al, (2010) undertook an analysis on foreign exchange rate exposure of
Australian firms and found that a greater part of firms experienced positive foreign exchange rate
exposure than negative one. The strongest degree of exposure was observed in the energy,
materials and industrial sectors. Australian firms illustrated irregularity and time variation in
exchange rate exposure with varying results in different sectors.
Adjasi et al, (2008) carried a study in Ghana stock exchange on the effect of exchange
rate and the results showed that exchange rate volatility and stock market returns had a negative
relationship. To be specific a reduction in stock prices reduces wealth of local investors and
further reduces liquidity in the economy. The liquidity level fall in addition reduces interest rates
which in turn stimulate capital outflows and as a result causes currency depreciation. This is
consistent with Abugri, (2008) who carried out a study in four Latin American countries on the

11
impact of macroeconomic variables on stock prices. For United States, the results revealed that
the stock price was negatively influenced by the exchange rate.
Liu and Shrestha, (2008) observed existence of a strong association among Chinese stock
market and macro economic variables. A negative and inverse relationship was observed
between currency value and stock prices. Though stock market was observed risky In the short
run, outcomes proved that economic basics prevail in the long run. Regardless of short term
unpredictability, as Chinese market has a negative association with USA and other developed
markets, it can offer shareholders with variegation and superior long-term returns.
Adjasi and Biekpe,(2005) showed that in the long-run, exchange rate depreciation leads
to increase in stock market prices in some of the countries and in the short-run exchange rate
depreciation reduces stock market returns. The empirical results show a negative correlation
between exchange rate returns and stock returns. Subair and Salihu, (2004) also carried a study
on the exchange rate volatility and the stock market in Nigeria and found that the exchange rate
volatility had a negative impact on the stock markets.
Cheng et el, (2011) in their study covering electronic industries in Taiwan found that
exchange rate was significant and had a positive effect on stock returns. Hsing, (2011) examined
the effects of selected macroeconomic variables on the stock market index of Johannesburg
Stock Exchange in South Africa. His study used EGARCH model and the estimates found a
positive relationship between exchange rate and the stock market.

12
Additionally a study by Kandir, (2008) on Turkey to determine the relationship between
exchange rate and stock return showed that exchange rate has a positive relationship with
portfolio return. Joseph and Vezos, (2006) in their study on the understanding of stock returns to
exchange rates in US banks found a strong deviation in foreign exchange rate sensitivity by
financial division of banks. According to results found, coefficients of foreign exchange rate
sensitivity were characteristically positive for both Ordinary Least Squares and EGARCH. The
impact of foreign exchange rates was not significant regardless of employing high frequency
data.
Mishra,(2004) carried a study on stock market and foreign exchange market in India and
found a significant positive relationship between stock prices and exchange rates. Similarly,
Apte,(2001) examined the interrelationship between the stock markets and the foreign exchange
market and found a significant positive relationship between exchange rates and stock prices.
In a study carried out by Jefferies and Okeahalam, (2000) on the relationship between
stock prices and selected economic variables for South Africa, Zimbabwe and Botswana, the
results revealed that in South Africa, stock return volatility was positively affected by real
exchange rate. A study carried by Bailey and Chung, (1995) on exchange rate fluctuations,
political risk, and stock returns at the Mexican stock market that established a positive
relationship between exchange rate changes and stock market return volatility.
13
Coleman and Tettey, (2008) examined the effect of macroeconomic pointers on stock
market conduct of Ghana Stock Exchange (GSE). It was observed that exchange rate losses did
not affect the equities on the market, rather the shareholders benefited from the market as the
Cedi depreciated.
A study by Benita and Lauterbach, (2004) on the policy factors and exchange rate
volatility in the department of foreign exchange activity, Bank of Israel, Jerusalem found that
exchange rate volatility has real economic expenditure that influence the price stability of the
firm and its profitability as well as country‟s economic stability as a whole.
2.4 Overview of the literature
Some scholars like Jefferis and Okeahalam, (2000), Hsing, (2011), Cheng' et al (2011)
have documented a positive relationship between foreign exchange rate and stock returns. Other
scholars like Chang et al ,(2013) Aroni,(2011), Olweny and Omondi,(2011) Brooks et al,(2010),
Subair and Salihu, (2004), show a negative relationship between foreign exchange rate and stock
returns volatility- depreciation in the local currency leads to increases in stock market prices in
the long run. There is therefore no convergence on the evidence on the previous studies empirical
literature; hence the study seeks to fill this gap.

14
CHAPTER THREE
RESEARCH METHODOLOGY
3.1 Introduction
This section provides the theoretical framework on which the study is based on. It also
presents the source of data, the empirical design and variable measurement which were used
during the study. In this sub-section, we discuss several models that we used to estimate the
effects of foreign exchange rate fluctuations on stock returns volatility. The study used various
GARCH model frameworks which builds on the ARCH model first introduced by (Engel 1982).
3.2 Model Specification
3.21 GARCH (1, 1) Model
The ARCH Model takes the form,
...........................................................1
..........................................................................2
With equation 1 and 2 being the mean and the variance equation respectively, whereby
are constant parameters. The conditional variance ht under the ARCH model
reflects only information from time t-p to t-1
The model however has only one memory period ,therefore the study goes further to
employ GARCH model as generalized by Bollerslev, (1986) which makes the variance ( = )

15
linear in lagged values of where by the volatility in period j depends on the volatility for the
previous period t.
The variance equation for GARGH (1, 1) model is as depicted as,
...............................................................3
These models are well known for capturing persistence of volatility observed in time series. This
is because the two models treat heteroskedasticity as a variance on each error term.
The main weaknesses with these models is that they ignore information on the direction
of stock returns and foreign exchange rate since it‟s only the magnitude that matters to the two
models while volatility is affected by direction of the information. As we try to investigate the
volatility in stock returns and the fluctuations in foreign exchange rate, we are faced with the
following challenges. Since the stock returns and the foreign exchange rate fluctuations have
non-normal distribution, it is unlikely that the ARCH and the GARCH models are useful since
they impose symmetry on conditional variance of stock returns and foreign exchange
fluctuations hence producing biased estimates when price and exchange rate movements are
large. Particularly they fail to model leverage effect.
In this case therefore we adopt asymmetric models with a view of establishing the
validity of the symmetric distribution. Specifically, we estimate the asymmetrical EGARCH
model because the data used is time series data and has a long span of period (seventeen years
with daily stock returns and foreign exchange rate).
16
3.22 EGARCH Model.
A number of studies have investigated the performance of GARCH models on explaining
volatility of mature stock markets, for example; Sentana and Wadhwani, 1992; Kim and Kon,
1994; Floros, 2007; Floros , 2008), but only a few have tested the GARCH models using daily
data in the developing stock markets, (Olweny and Omondi,2011). The Exponential Generalized
Autoregressive Conditional Heteroskedascity (EGARCH) model was used to determine the
effect of foreign exchange rate on stock returns volatility in NSE. This is most often preferred to
the symmetrical GARCH model in studying financial markets. As recognized by Koulakiotis et
al (2006), GARCH (1,1) is relatively weaker than the EGARCH in studying financial markets
phenomenon.
The EGARCH model is expressed as shown:
...........................................................4
+λ + .........................................5
Rt is defined as
In this case equation (4) gives the mean while equation (5) estimates the variance.
Rt -represents the returns of the NSE 20 share Index.

17
Pt -represents the prices of the NSE 20 share Index.
- log of conditional variance of stock market returns.
ERT- Foreign Exchange Rate
β - Vector of coefficient
- Error term
λ- Leverage
EGARCH Model explains the leverage effect and volatility clustering. Leverage effect is
shown by λ< 0. If λ ≠ 0, then the impact of news is asymmetric. The stock return was calculated
using the NSE 20 share index as, log of the stock prices. The NSE 20 share index is an indicator
of the stock market performance. EGARCH model is an important model since it measures the
leverage effect, volatility magnitude effect and its persistence in the market.
3.3 Definition and measurement of variables
3.31 Foreign exchange rate
An exchange rate is the price of one country‟s currency for another. In practice, almost
all trading of currencies are quoted in terms of the U.S. dollar. This is to say that U. S.D is used
as the base currency. For example, both the Euro and the British pound will be traded with their
price quoted in U.S. dollars. If the quoted price is the price in dollars of a unit of foreign
exchange, the quotation is said to be in direct (or American) terms, (Ross, 2002). The change in
18
exchange rate is given by difference between the current rates less the previous rate dividend by
the previous rate which can also be taken in logarithmic form.
3.32 Stock Returns:
Existing literature defines stock returns as earning per share that the investors generate
out of their stock investment, (Murungi, 2012). It could be in form of profit through trading in
secondary market or in form of dividends given by the company to its shareholders. They are not
fixed ensured returns but are subject to market risk, they are not homogenous and may change
from investor to investor depending on the amount of risk one is prepared to take and the quality
of his stock market analysis. Contrary to the fixed return generated by bonds, the stock market
returns are variable in nature .The idea behind stock return is to buy low and sell high, Choudhry,
(1999). Stock market returns are subject to risk, but there are many derivative instruments for
example futures, options, that are used for hedging and arbitrage against risk associated with
such investment though they don't give higher returns but help in minimizing losses and in
protecting the capital. The stock return is measured in logarithmic form as;
Whereby,
Rt - represents the returns of the NSE 20 share Index.
Pt - represents the prices of the NSE 20 share Index.

19
3.4 Sources of Data.
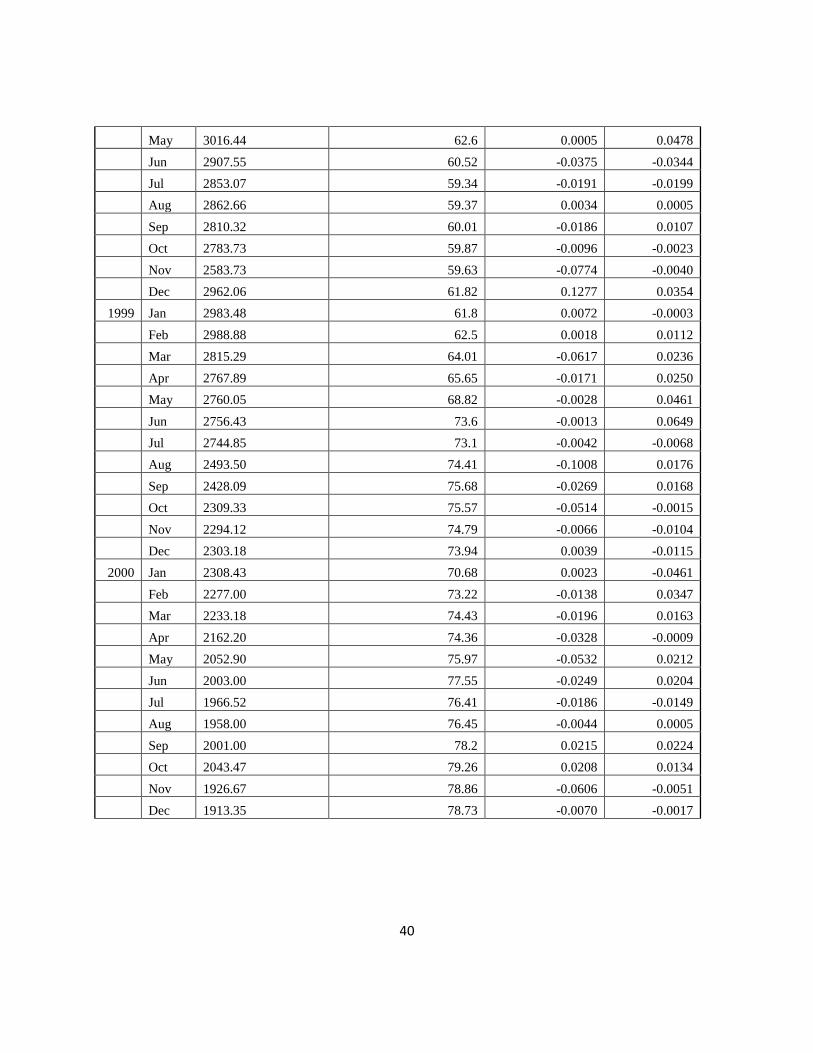
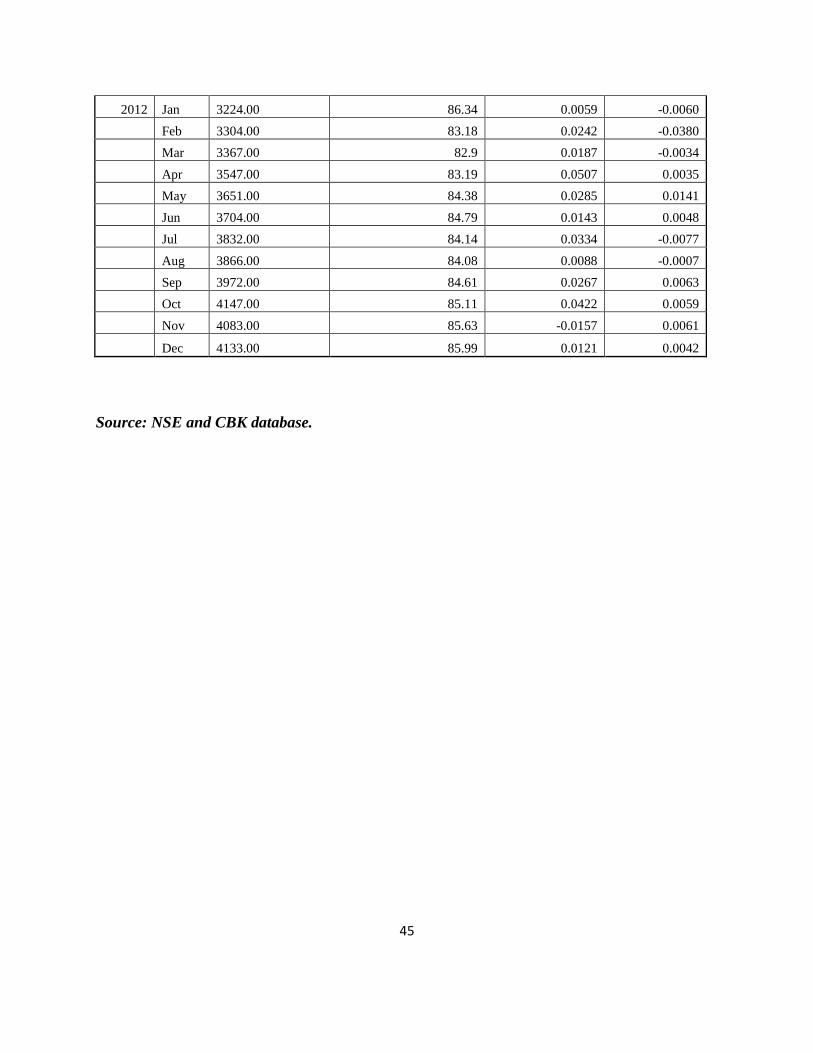
Data for this study was obtained from Nairobi Securities Exchange. The study used daily
time series data for NSE-20 share index and the foreign exchange rate (USD) that covered the
period 1996 to 2012. NSE 20 share index is the main stock index consisting of stocks from 20
blue chip companies. The series of index values for each month is calculated by averaging the
daily values of the index. The index is selected as the proxy representing the overall stock prices
since it reflects the change in different types of asset securities in the stock exchange
representing all the segments in the in the market. Data on foreign exchange rate (USD) was
obtained from Central Bank of Kenya database.
Previous studies that have used the same data set but with different time period and
model specification include; Muriu (2003), Olweny and Omondi (2011), Aroni, (2012) and
Murungi, (2012). The data used and the sample period is in Appendix I.
20
CHAPTER FOUR.
EMPIRICAL RESULTS
4.1 Introductions.
This chapter provides discussion on the summary statistics and empirical findings. The
study relied on descriptive statistics, the unit root Augmented Dickey fuller (ADF) test as
proposed by Dickey and fuller (1979, 1981) and EGARCH (Nelson 1991) models and SPSS in
data analysis.
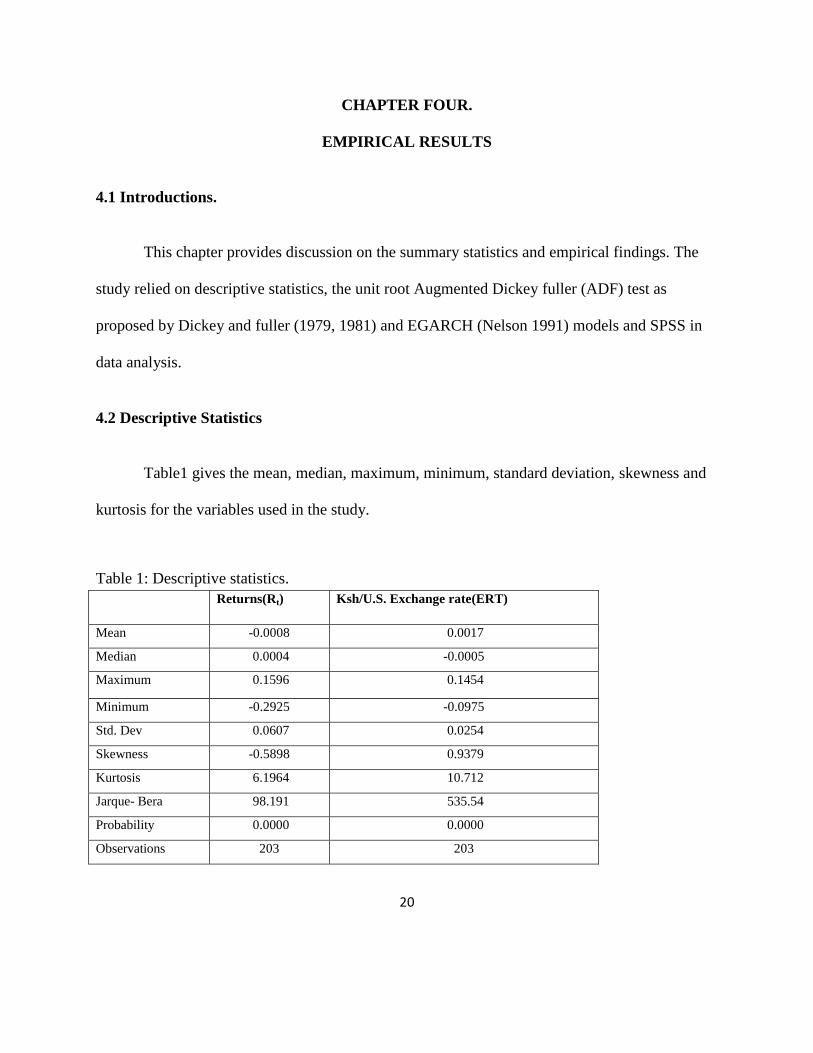
4.2 Descriptive Statistics
Table1 gives the mean, median, maximum, minimum, standard deviation, skewness and
kurtosis for the variables used in the study.
Table 1: Descriptive statistics.
Returns(Rt) Ksh/U.S. Exchange rate(ERT)
Mean -0.0008 0.0017
Median 0.0004 -0.0005
Maximum 0.1596 0.1454
Minimum -0.2925 -0.0975
Std. Dev 0.0607 0.0254
Skewness -0.5898 0.9379
Kurtosis 6.1964 10.712
Jarque- Bera 98.191 535.54
Probability 0.0000 0.0000
Observations 203 203

21
A distribution is negatively skewed when the mean is less than the median and positively
skewed if the mean is more than the median. Stock return is negatively skewed while foreign
exchange rate has a positive skewness. Jarque-Bera test statistics uses two statistic components
which are skewness and the kurtosis. Skewness confers a measure of how symmetric the
observations are about the mean which is equal to a zero value in case of a normal distribution.
A distribution can have positive skewness or a negative skewness while Kurtosis
measures the thickness in the tails of a probability density function. For a normal distribution the
kurtosis is equal to a value of 3.This test statistic is used to find out whether the variables in this
study follow normal probability distribution. JB test take the form,
Whereby n= sample size, S = Skewness coefficient k= kurtosis coefficient. Here we test
the null hypothesis against the alternative hypothesis
ho =normal distribution,
h1 =non normal distribution.
Table 1 shows that the two variables are not normally distributed since the stock returns
and foreign exchange rate Jarque-Bera values exceed the critical values for any reasonable
significance level to lead to the conclusion that the stock returns and foreign exchange rate

22
fluctuations do not follow a normal distribution. Here we compare the χ2 (chi-square)
distribution with 2 degrees of freedom at 1%, 5% and 10% significance levels the critical values
being 9.21, 5.99 and 4.61 respectively.
Further descriptive statistics are given in the Appendices. These are the linear graphical
representation of foreign exchange rate data (ERT) and NSE-20 share index in appendix II and
III respectively, histogram and statistical figures for the two variables in appendix IV and V.
The linear graphs represent the fluctuation levels of both stock returns and foreign
exchange rate. The graph shows a maximum value of 0.15 in 1997M08, a minimum value of -
0.10 in 2008M03 and a mean value of 0.001. Appendix III shows maximum value of 0.16 in
June 2005, minimum value of -0.29 in February 2009 and mean values of -0.001.
The histogram gives the representation of the descriptive statistics for stock returns and
foreign exchange rate. In Appendix IV and V, we demonstrate that the two variables are not
normally distributed since the Jarque-Bera values for the two variables exceeds the critical
values for any reasonable significance level hence we conclude that stock returns and foreign
exchange rate fluctuations do not follow a normal distribution. The graph in Appendix IV shows
a negative skewness (it is slightly skewed to the left) while the Appendix V shows a positive
skewness (it is slightly skewed to the right).
23
4.3 Test for stationarity
In empirical analysis, the main concern is to establish if a series is stationary (do not
contain a unit root) or non-stationary (contains a unit root). This is to ensure that both the right
hand side and the left hand side of the regressed variables are balanced. Time series data is often
assumed to be non-stationary, therefore it‟s necessary to perform a pre-test to ensure there is a
stationary relationship in order to avoid spurious regression problem. Therefore to tackle the issue
of non-stationarity in order to avoid the problem of spurious regression, we carry out a unit root
test (ADF) which is the modified version of Dickey-Fuller (DF).
The Augmented Dickey-Fuller test is specified as;
Yt = bo+ βYt-1 + µ1 Yt-1 + µ2 Yt-2 +.................... + µp Yt-p + et
Where Yt represents time series to be tested, b is the intercept term, β is the coefficient of
interest in the unit root test, µi is the parameter of augmented lagged first difference of Yt. to
represent the pth
order autoregressive process and et is the white noise error term.
ho; a=0 (non stationary).......................Null hypothesis
ho; a ≠ 0 (stationary)...............................Alternative hypothesis.
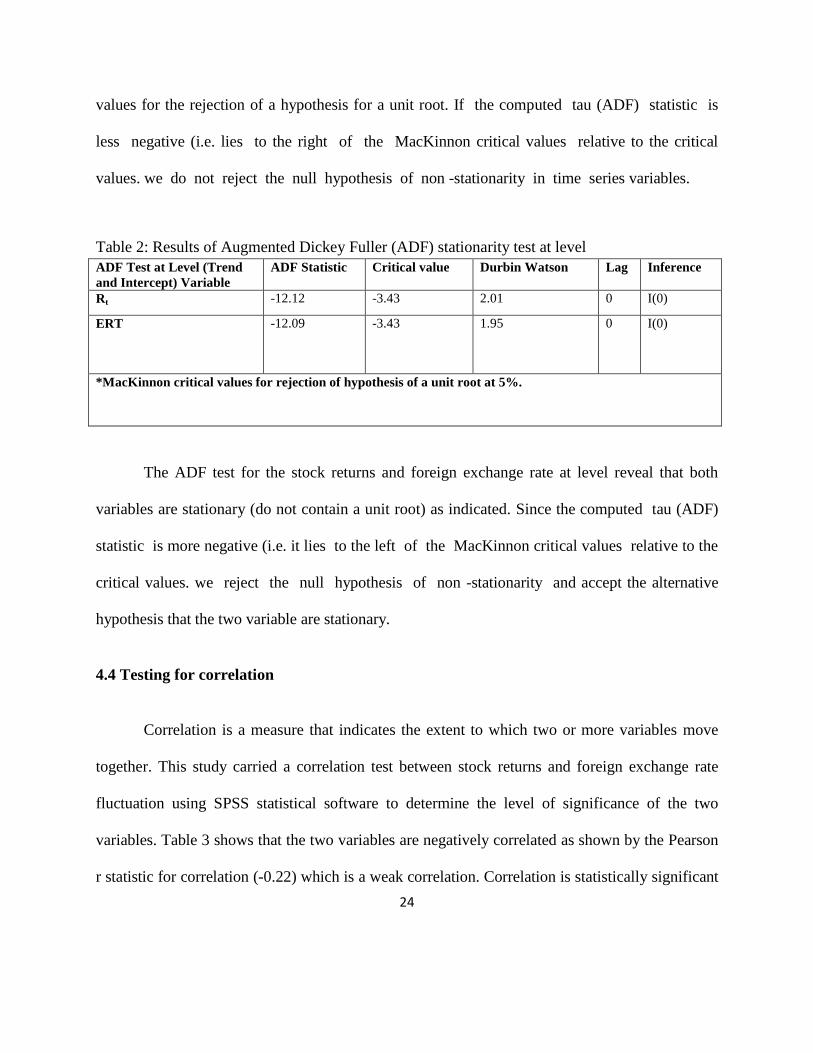
If the null hypothesis is rejected, this means that the time series data is stationary. The
decision criteria involve comparing the computed tau (ADF) values with the MacKinnon critical
24
values for the rejection of a hypothesis for a unit root. If the computed tau (ADF) statistic is
less negative (i.e. lies to the right of the MacKinnon critical values relative to the critical
values. we do not reject the null hypothesis of non -stationarity in time series variables.
Table 2: Results of Augmented Dickey Fuller (ADF) stationarity test at level
ADF Test at Level (Trend
and Intercept) Variable
ADF Statistic Critical value Durbin Watson Lag Inference
Rt -12.12 -3.43 2.01 0 I(0)
ERT -12.09 -3.43 1.95 0 I(0)
*MacKinnon critical values for rejection of hypothesis of a unit root at 5%.
The ADF test for the stock returns and foreign exchange rate at level reveal that both
variables are stationary (do not contain a unit root) as indicated. Since the computed tau (ADF)
statistic is more negative (i.e. it lies to the left of the MacKinnon critical values relative to the
critical values. we reject the null hypothesis of non -stationarity and accept the alternative
hypothesis that the two variable are stationary.
4.4 Testing for correlation
Correlation is a measure that indicates the extent to which two or more variables move
together. This study carried a correlation test between stock returns and foreign exchange rate
fluctuation using SPSS statistical software to determine the level of significance of the two
variables. Table 3 shows that the two variables are negatively correlated as shown by the Pearson
r statistic for correlation (-0.22) which is a weak correlation. Correlation is statistically significant

25
at the 0.01 level (2-tailed), meaning that increase or decrease in stock returns significantly relate
to increase or decrease in foreign exchange rate. The results show that when foreign exchange
rate increases by 1%, stock return decreases by 22%. This has an inference that when
exchange rate increases, investors shy away from the market and divest or offload their
stocks . This consequently results in the decrease of stock return.
Table 3: Correlation matrix
Variable Rt ERT
Rt Pearson Correlation 1 -0.22
Sig. (2-tailed) 0.002
Sample size(N) 203 203
ERT Pearson Correlation -0.22 1
Sig. (2-tailed) 0.002
Sample size(N) 203 203
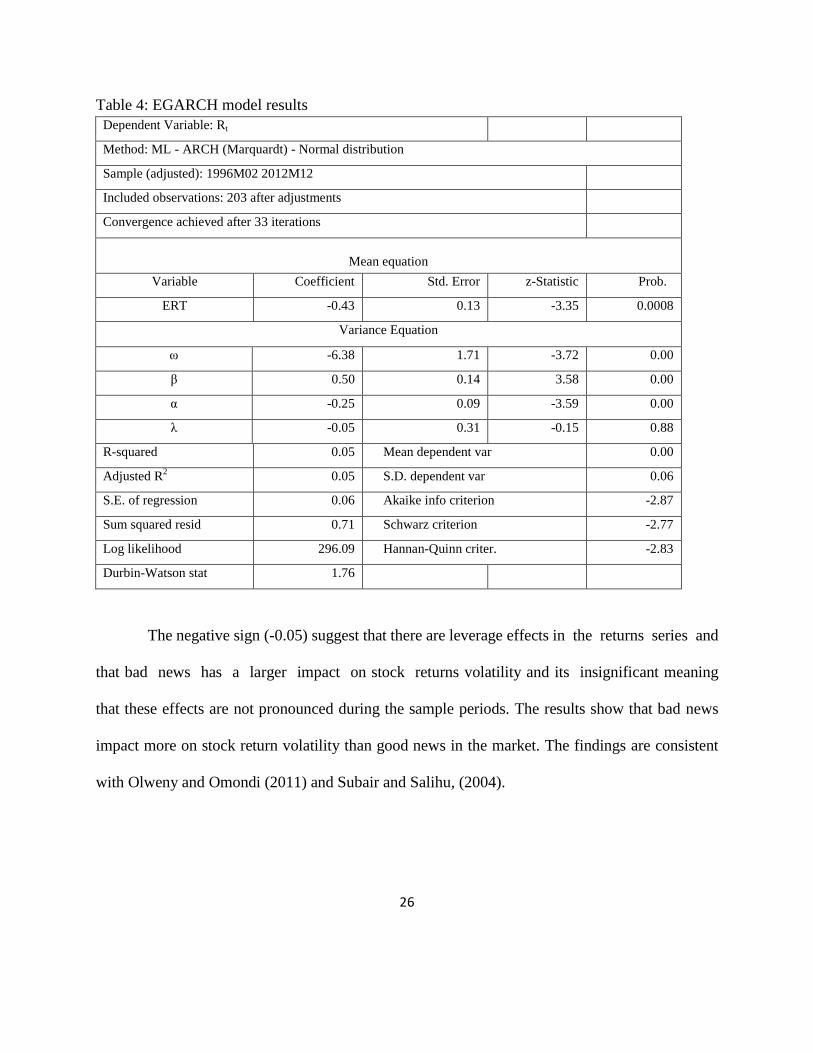
4.5 Estimation of the EGARCH model.
Table 4 shows EGARCH estimation results. Table 4 shows that the magnitude of
volatility, as denoted by β is relatively low and highly significant . This implies that investors
prefer using local currency as opposed to the foreign currency which is deemed less risky. The
volatility persistence of foreign exchange rate is low (-0.25) but it is significant as indicated by the
p-values (0.0003).
26
Table 4: EGARCH model results
Dependent Variable: Rt
Method: ML - ARCH (Marquardt) - Normal distribution
Sample (adjusted): 1996M02 2012M12
Included observations: 203 after adjustments
Convergence achieved after 33 iterations
Mean equation
Variable Coefficient Std. Error z-Statistic Prob.
ERT -0.43 0.13 -3.35 0.0008
Variance Equation
ω -6.38 1.71 -3.72 0.00
β 0.50 0.14 3.58 0.00
α -0.25 0.09 -3.59 0.00
λ -0.05 0.31 -0.15 0.88
R-squared 0.05 Mean dependent var 0.00
Adjusted R2 0.05 S.D. dependent var 0.06
S.E. of regression 0.06 Akaike info criterion -2.87
Sum squared resid 0.71 Schwarz criterion -2.77
Log likelihood 296.09 Hannan-Quinn criter. -2.83
Durbin-Watson stat 1.76
The negative sign (-0.05) suggest that there are leverage effects in the returns series and
that bad news has a larger impact on stock returns volatility and its insignificant meaning
that these effects are not pronounced during the sample periods. The results show that bad news
impact more on stock return volatility than good news in the market. The findings are consistent
with Olweny and Omondi (2011) and Subair and Salihu, (2004).

27
Table 5: Summary statistics from estimated GARCH Model.
Co-efficient EGARCH
ω -6.38
α -0.25
β 0.50
λ -0.05
Mean 0.00
Std deviation 0.06
Skewness -0.56
Kurtosis 6.08
Jarque-Bera 88.91
Probability 0.00
Table 5 shows the values of the Ljung box test statistics. The ARCH procedure does not
normalize residuals as indicated by presence of kurtosis, skewness and Jarque-Bera statistic. The
skewness statistics indicate rejection of the symmetric distribution null hypothesis while the
values for kurtosis show that there is leptokurtosis in the distribution of the residuals from the
stock returns and the foreign exchange series. These findings indicate that the estimated
asymmetric conditional variance process is appropriate for explaining the evolution of the
variance in both variables.

28
CHAPTER FIVE
5.1 Introduction
This section provides summary of the empirical findings, conclusions and policy
implications of the study. Additionally it suggests areas for further research.
5.2 Summary of the findings
This study sought to establish whether changes in foreign exchange rate had any effect on
the stock returns volatility. The analysis covered firms listed in the NSE, sampled monthly
average which was computed from the daily NSE-20 Share index and monthly USD Exchange
rate data for 204 months covering the period 1996-2012. The study used Eviews 7.0 software in
estimation of the EGARCH model and SPSS statistical software to analyze the time series data
with tests being carried to establish the uniqueness of the two variables in this study. The
estimates for descriptive statistics for the two variables reveal that stock returns is negatively
skewed while foreign exchange rate has a positive skewness.
A test on the normal distribution was carried out using the JB test. This was mainly
carried out to find out whether the variables in the study follow a normal distribution. The
results show that stock returns and foreign exchange rate are not normally distributed because the
JB values for both variables exceeds the critical values as per the chi square values with 2(two)
degrees of freedom. The test for stationarity using the ADF test indicate that time series for

29
stock returns and foreign exchange rate at level are stationary hence we rejected the null
hypothesis that time series is non stationary.
The study also did correlation analysis in order to establish the extent to which the two
variables move together. The results reveal that the two are negatively correlated and a week
correlation in this case is found. That is when foreign exchange rate increases by 1% stock
returns decrease by 22%. When local currency appreciates against the U.S.D, there is increased
investment because the investors are assured of higher returns. EGARCH estimates revealed that
the magnitude of volatility as denoted by β is relatively low but is significant. The volatility
persistence of foreign exchange rate is also low.
5.3 Conclusions and policy implications
Though there is a weak correlation between the two variables as depicted by the
estimation results, important policy implications arise out of the findings of the study. The
Capital Markets Authority and other policy makers should be conscious of the effects of
exchange rate on stock returns. The aim should be to stimulate development of the financial
markets to mobilize long term capital for the economic development. In setting relevant
strategies policy makers, need to consider the effects of foreign exchange rate such that effective
decisions can be made for long term financial market sustainability. The study therefore makes
the following recommendation.

30
There should be a deliberate policy framework aimed at creating favourable foreign
exchange market to provide stability to the national currency. This would reinforce investors‟
confidence, attracting more foreign investments into the equity market which will enhance
market liquidity.
5.4 Limitation of the study.
The study used the NSE- 20 share index which includes all listed companies in the NSE.
The use of NSE- 20 share index makes the sample selection to be biased and so excludes those
companies that have not been listed at NSE. It also limits itself to one currency (USD).
Therefore the policy implications relate to only those firms that are listed at NSE.
5.5 Areas for further research.
This study sought to explore the effects of foreign exchange rate fluctuations on stock
return volatility in the NSE .The finding in this study reveal that there is a weak correlation
between the two variables. Since the stock market is a very vital institution to drive economic
growth and development, efficiency should be a core value in this market. Therefore, further
research may be undertaken to find out how money supply will impact stock returns volatility in
NSE and which exchange rate regime will be most suitable for CBK to adopt, either the fixed
exchange rate regime, floating exchange rate regime or both depending on the situation in the
market. It could also be interesting to research on stock returns volatility in NSE relative to
another developing stock market in Africa.

31
REFERENCES
Abugri, B. A. (2008). Empirical relationship between macroeconomic volatility and stock
returns: Evidence from Latin American markets. International Review of Financial Analysis,
17, 396–410.
Adjasi C. Harvey S.K and Agyapong, D. (2008), “Effect of exchange rate volatility on the Ghana
stock exchange” African Journal of Accounting, Economics, Finance and Banking Research Vol.
3. No.3
Adjasi, C.K. and Biekpe, B.N. (2005). “Stock market returns and exchange rate dynamics in
selected Africa countries: A Bivariate analysis”, the Africa financial journal, July, Cape Town,
South Africa.
Apte, P.G (2001). “The Interrelationship Between the Stock Markets and the Foreign Exchange
Market” Journal of Foreign Exchange and International Finance, Vol. 12, No. 92, pp. 135-143.
Aroni, J. M. (2011),''Factors influencing stock prices for firms listed in the Nairobi Stock
Exchange'' International Journal of Business and Social Science Vol. 2 No. 20.
Bailey, W. & Chung.P. (1995), “Exchange Rate Fluctuations, Political Risk and Stock Returns:
Some Evidence from an Emerging Market”, Journal of Financial and Quantitative Analysis, 30,
pp. 541-561.
32
Benita, G, & B. Lauterbach. (2004), “Policy Factors and Exchange Rate Volatility: Panel Data
Verses a Specific Country Analysis, Research Unit, Foreign Exchange Activity Department,
Bank of Israel, Jerusalem”
Black, F. (1976), “Studies in stock price volatility changes”, Proceedings of the 1976 Business
Meeting of the Business and Economics Section, American Statistical Association, Boston, MA,
USA, pp. 177-81.
Bollerslev, T. (1986), “Generalised autoregressive conditional Heteroscedasticity”, Journal of
Econometrics, 31 (3), pp. 307-27.
Branson, W.H. (1983): Macroeconomic Determinants of Real Exchange Rate Risk. In: Herring,
R .J. (ed.) Managing Foreign Exchange Rate Risk, Cambridge University Press, Cambridge.
Branson, W. Halttunen, H., and Masson, P. (1977). “Exchange rate in the short run: the dollar
Deutsche mark rate”, European Economic Review, 10, pp. 303–324.
Brooks, R.D., Iorio, A., Faff, R.W., Fry, T., & Joymungul, Y. (2010). Asymmetry and time
variation in exchange rate exposure: An investigation of Australian stocks returns.
International Journal of Commerce and Management, 20(4), 276-295.

33
Capital Market Authority, (2012) “Capital Market Authority Statistical Bulletin.” Government of
Kenya Press, 2012.
Chang, Chia-Lin and Hsu, Hui-Kuang and McAleer, Michael (2013) Is Small Beautiful? Size
Effects of Volatility Spillovers for Firm Performance and Exchange Rates in Tourism. Working
Paper (Unpublished), Taiwan Tourism Industry.
Cheng, B., Ioannou, I. and Serafeim, G. (2011). ''Corporate Social Responsibility and Access to
Finance''. HBS Working Paper Series 11-130.
Choe, Hyuk, Bong-Chan Kho and Rene M. Stulz (1999), “Do Foreign Investors Destabilize
Stock Markets? The Korean Experience in 1997,” Journal of Financial Economics, 54:227-264.
Clark, John and Elizabeth Berko, (1997), “Foreign Investment Fluctuations and Emerging
Market Stock returns,” Staff Reports No.24, Reserve Bank of New York.
Coleman, A. K., & Tettey, K.F.A. (2008). Impact of macroeconomic indicators on stock market
performance: The case of the Ghana Stock Exchange. The Journal of Risk Finance, 9(4), 365-
378.
Dickey, D. A. and Fuller, W. A. (1979), Estimators for autoregressive time series with a unit
root, Journal of the American Statistical Association 74: 427-431
34
Dornbusch, R. and Fischer, S (1980): Exchange Rates and the Current Account. The American
Economic Review 70(5), 960–971.
Engle, R.F. (1982),“Autoregressive conditional Heteroscedasticity with estimates of the variance
of U.K. inflation”, Econometrica, 50, pp. 987-1008.
Engle, R. F. (2001) “GARCH 101: The Use of ARCH/GARCH Models in Applied
Econometrics” Journal of Economic Perspectives, Vol. 15, Number 4, pp.157-168.
Floros, C., (2007), “The use of GARCH models for the calculation of Minimum Capital Risk
Requirements: International Evidence”, International Journal of Managerial Finance, 3(4), pp.
360-371.
Floros, C. (2008), “Modeling volatility using GARCH models: evidence from Egypt and Israel”,
Middle Eastern Finance and Economics, 2, pp. 32-41.
Gabriel, A. M. and Ugochukwu W. M, (2012),''Volatility Estimation and Stock Price Prediction
in the Nigerian Stock Market”, International Journal of Financial Research Vol. 3, No. 1
Giddy, Ian H., and Gunter Dufey,(1991), “The management of foreign exchange risk.” In
Frederick D. S. Choi (ed). Handbook of International Accounting. New York: Wiley, 1991.

35
Glosten, L., Jagannathan, R. and Runkle, D. (1993). On the Relation between the Expected
Value and the Volatility of the Nominal Excess Return on Stocks, Journal of Finance, Vol. 48,
pp. 1779-1801.
Jamil, M and Ullah, N. (2013), „„Impact of Foreign Exchange rate on stock prices'' IOSR Journal
of Business and Management Volume 7, Issue 3, PP 45-51.
Jefferis, K. & Okeahalam C.C (2000), “The Impact of Economic Fundamentals on Stock
Markets in Southern Africa”, Development Southern Africa, 17(1), pp. 23-51.
Joseph, N. L., & Vezos, P. (2006). The sensitivity of US banks‟ stock returns to interest rate
and exchange rate changes. Managerial Finance,33(2), 182-199
Kandir, S., Y. (2008), “Macroeconomic variables, firm characteristic and stock returns: evidence
from Turkey. International research journal of finance and economics, Issue 16. ISSN: 1450-
2887.
Karolyi, G. A. (2001), “Why Stock Return Volatility Really Matters”, Institutional Investor
Journals Series, pp. 1-16.
36
Kim, C.M. & Kon. S. (1994), “Alternative Model of Conditional Heteroscedasticity in Stock
Returns.” Journal of Business, 67, pp. 563-98.
Koulakiotis, A., PapasyriopoulosN. & Molyneux. P. (2006), “More Evidence on the Relationship
between Stock Price Returns and Volatility”, International Research Journal of Finance and
Economics, 1, pp. 21-28.
Liu, M. H., & Shrestha, K. M. (2008). Analysis of the long-term relationship between
macroeconomic variables and the Chinese stock market using heteroscedastic co-integration.
Managerial Finance, 34(11), 744-755.
Malamba, M (2002),"Equity risk and return factors on Nairobi Stocks Exchange'', Unpublished
MA. Thesis, University Of Nairobi.
McNelis,P.D.(1993), ,''The response of Australian stock, foreign exchange and bond markets to
foreign asset returns and volatilities'', Research Discussion Paper,9301.
Ming-Chang Cheng, Zuwei-Ching Tzeng & Wei-Ling Kang, (2011), “The Impact of Non
Macroeconomic Events on Taiwan Electronic Industry Stock Index Returns”, Global Economy
and Finance Journal, 4 (1).pp. 80-101.
37
Mishra, K.A. (2004). “Stock Market and Foreign Exchange Market in India. Are they Related?
“South Asia Economic Journal. Vol. 5, No. 2, Sage Publications, New Delhi.
Murungi, C. M. (2012), "The impact of inflation on stock market returns and volatility"
Unpublished MBA (Finance). Thesis, University of Nairobi.
Muriu, P.W.(2003), „Volatility of stock returns -an empirical analysis of NSE‟, Unpublished
MA. Thesis, University of Nairobi.
Nairobi Securities Exchange Website https://www.nse.co.ke. 8/9/2013 10.20PM
Olweny, T. & Omondi, K. (2011). The Effects of Macro-Economic factors on stock returns
volatility in the Nairobi Stock Exchange, Kenya - Economics and Finance Review Vol. 1(10) pp.
34 – 48,
Richards, N. D and Simpson, J. (2009),''The Interaction between Exchange Rates and Stock
Prices, An Australian Context'', international journal of economics and finance Vol 1,No. 1
Ross−Westerfield−Jaffe: Corporate Finance, Sixth Edition ©The McGraw−Hill Companies,
2002.

38
Sentana, E. & Wadhwani, S. (1992), “Feedback Traders and Stock Return Autocorrelations:
Evidence from a Century of Daily Data”, The Economic Journal, 102, pp.415 – 25.
Stefanescu, R. and Dumitriu, R., (2013), "Impact of the foreign exchange rate fluctuations on
returns and volatility of the Bucharest Stock Exchange".http://mpra.ub.uni-
muenchen.de/47229/1/MPRA_paper_47229.pdf. 9/10/2013 6.29 AM.
Subair, K., & Salihu, O. M. (2004),''Exchange Rate Volatility and the Stock Market: The
NigerianExperience.http://www.iiste.org/Journals/index.php/EJBM/article/view/1504.8/10/2013
10.09 PM.
Yu Hsing, (2011), "The Stock Market and Macroeconomic Variables in a BRICS Country and
Policy Implications", International Journal of Economics and Financial Issues, 1(1), pp. 12-18.
Zakoian, J.M. (1994), “Threshold heteroscedastic models”, Journal of Economic Dynamics and
Control, 18 (5), pp. 931-55.

39
Appendices
Appendix I: Sample Data
Year Month
NSE-20 Share
Index
Ksh/U.S.D Exchange
rate(ERT) Stock returns (Rt) Δ ERT
1996 Jan 3409.40 56.71
Feb 3230.08 58.29 -0.0555 0.0271
Mar 3041.79 58.41 -0.0619 0.0021
Apr 3019.20 58.37 -0.0075 -0.0007
May 3031.02 58.24 0.0039 -0.0022
Jun 3144.33 57.99 0.0360 -0.0043
Jul 3150.06 57.31 0.0018 -0.0119
Aug 3073.88 56.99 -0.0248 -0.0056
Sep 3089.80 56.43 0.0052 -0.0099
Oct 3055.97 55.86 -0.0111 -0.0102
Nov 3042.06 55.63 -0.0046 -0.0041
Dec 3114.11 55.15 0.0231 -0.0087
1997 Jan 3479.67 54.74 0.1051 -0.0075
Feb 3473.99 54.93 -0.0016 0.0035
Mar 3354.72 54.89 -0.0356 -0.0007
Apr 3288.44 54.38 -0.0202 -0.0094
May 3460.55 53.75 0.0497 -0.0117
Jun 3530.43 54.24 0.0198 0.0090
Jul 3466.92 57.36 -0.0183 0.0544
Aug 3403.22 67.12 -0.0187 0.1454
Sep 3447.41 63.77 0.0128 -0.0525
Oct 3314.84 62.64 -0.0400 -0.0180
Nov 3046.60 63.93 -0.0880 0.0202
Dec 3115.14 63.05 0.0220 -0.0140
1998 Jan 3348.11 61.16 0.0696 -0.0309
Feb 3362.23 60.52 0.0042 -0.0106
Mar 3213.30 60.13 -0.0463 -0.0065
Apr 3015.01 59.61 -0.0658 -0.0087
40
May 3016.44 62.6 0.0005 0.0478
Jun 2907.55 60.52 -0.0375 -0.0344
Jul 2853.07 59.34 -0.0191 -0.0199
Aug 2862.66 59.37 0.0034 0.0005
Sep 2810.32 60.01 -0.0186 0.0107
Oct 2783.73 59.87 -0.0096 -0.0023
Nov 2583.73 59.63 -0.0774 -0.0040
Dec 2962.06 61.82 0.1277 0.0354
1999 Jan 2983.48 61.8 0.0072 -0.0003
Feb 2988.88 62.5 0.0018 0.0112
Mar 2815.29 64.01 -0.0617 0.0236
Apr 2767.89 65.65 -0.0171 0.0250
May 2760.05 68.82 -0.0028 0.0461
Jun 2756.43 73.6 -0.0013 0.0649
Jul 2744.85 73.1 -0.0042 -0.0068
Aug 2493.50 74.41 -0.1008 0.0176
Sep 2428.09 75.68 -0.0269 0.0168
Oct 2309.33 75.57 -0.0514 -0.0015
Nov 2294.12 74.79 -0.0066 -0.0104
Dec 2303.18 73.94 0.0039 -0.0115
2000 Jan 2308.43 70.68 0.0023 -0.0461
Feb 2277.00 73.22 -0.0138 0.0347
Mar 2233.18 74.43 -0.0196 0.0163
Apr 2162.20 74.36 -0.0328 -0.0009
May 2052.90 75.97 -0.0532 0.0212
Jun 2003.00 77.55 -0.0249 0.0204
Jul 1966.52 76.41 -0.0186 -0.0149
Aug 1958.00 76.45 -0.0044 0.0005
Sep 2001.00 78.2 0.0215 0.0224
Oct 2043.47 79.26 0.0208 0.0134
Nov 1926.67 78.86 -0.0606 -0.0051
Dec 1913.35 78.73 -0.0070 -0.0017

41
2001 Jan 1897.50 78.622 -0.0084 -0.0014
Feb 1932.90 78.081 0.0183 -0.0069
Mar 1830.50 77.817 -0.0559 -0.0034
Apr 1767.90 77.551 -0.0354 -0.0034
May 1636.50 78.523 -0.0803 0.0124
Jun 1657.10 78.985 0.0124 0.0058
Jul 1620.70 78.876 -0.0225 -0.0014
Aug 1505.50 78.934 -0.0765 0.0007
Sep 1400.90 79.021 -0.0747 0.0011
Oct 1472.90 79.081 0.0489 0.0008
Nov 1420.50 78.973 -0.0369 -0.0014
Dec 1355.10 78.6 -0.0483 -0.0047
2002 Jan 1343.40 78.597 -0.0087 0.0000
Feb 1313.60 78.11 -0.0227 -0.0062
Mar 1183.10 78.058 -0.1103 -0.0007
Apr 1129.30 78.302 -0.0476 0.0031
May 1071.10 78.321 -0.0543 0.0002
Jun 1086.60 78.786 0.0143 0.0059
Jul 1097.70 78.736 0.0101 -0.0006
Aug 1043.38 78.677 -0.0521 -0.0007
Sep 1043.40 79.026 0.0000 0.0044
Oct 1116.36 79.659 0.0654 0.0079
Nov 1161.60 80.107 0.0389 0.0056
Dec 1362.90 77.072 0.1477 -0.0394
2003 Jan 1510.60 77.743 0.0978 0.0086
Feb 1557.70 76.603 0.0302 -0.0149
Mar 1608.30 76.646 0.0315 0.0006
Apr 1846.60 74.498 0.1290 -0.0288
May 2074.70 73.114 0.1099 -0.0189
Jun 2005.10 74.167 -0.0347 0.0142

42
Jul 1935.00 75.431 -0.0362 0.0168
Aug 2107.40 76.678 0.0818 0.0163
Sep 2379.90 78.417 0.1145 0.0222
Oct 2457.10 78.447 0.0314 0.0004
Nov 2737.00 76.35 0.1023 -0.0275
Dec 2738.00 76.139 0.0004 -0.0028
2004 Jan 3157.90 76.472 0.1330 0.0044
Feb 3175.40 76.45 0.0055 -0.0003
Mar 2770.60 77.762 -0.1461 0.0169
Apr 2707.60 78.347 -0.0233 0.0075
May 2689.10 79.372 -0.0069 0.0129
Jun 2639.80 79.513 -0.0187 0.0018
Jul 2708.00 80.4 0.0252 0.0110
Aug 2708.90 80.044 0.0003 -0.0044
Sep 2670.70 81.114 -0.0143 0.0132
Oct 2829.70 81.272 0.0562 0.0019
Nov 2918.20 81.242 0.0303 -0.0004
Dec 2945.60 77.344 0.0093 -0.0504
2005 Jan 3094.30 76.801 0.0481 -0.0071
Feb 3212.80 75.622 0.0369 -0.0156
Mar 3208.70 75.017 -0.0013 -0.0081
Apr 3227.60 76.602 0.0059 0.0207
May 3505.40 77.057 0.0792 0.0059
Jun 3972.20 76.206 0.1175 -0.0112
Jul 3982.00 76.044 0.0025 -0.0021
Aug 3938.70 75.696 -0.0110 -0.0046
Sep 3832.70 74.078 -0.0277 -0.0218
Oct 3339.50 73.606 -0.1477 -0.0064
Nov 3974.10 74.486 0.1597 0.0118
Dec 3973.00 72.367 -0.0003 -0.0293

43
2006 Jan 4171.80 71.982 0.0477 -0.0053
Feb 4056.60 73.198 -0.0284 0.0166
Mar 4101.60 71.872 0.0110 -0.0184
Apr 4025.20 71.158 -0.0190 -0.0100
May 4349.80 72.27 0.0746 0.0154
Jun 4260.50 73.88 -0.0210 0.0218
Jul 4258.50 73.617 -0.0005 -0.0036
Aug 4486.10 72.624 0.0507 -0.0137
Sep 4879.90 72.679 0.0807 0.0008
Oct 5314.40 72.02 0.0818 -0.0092
Nov 5615.20 69.948 0.0536 -0.0296
Dec 5645.70 69.397 0.0054 -0.0079
2007 Jan 5774.30 70.537 0.0223 0.0162
Feb 5387.30 69.733 -0.0718 -0.0115
Mar 5133.70 68.781 -0.0494 -0.0138
Apr 5148.10 68.306 0.0028 -0.0070
May 5001.80 66.966 -0.0292 -0.0200
Jun 5146.70 66.564 0.0282 -0.0060
Jul 5340.10 67.509 0.0362 0.0140
Aug 5372.00 66.989 0.0059 -0.0078
Sep 5146.50 66.971 -0.0438 -0.0003
Oct 4971.00 67.114 -0.0353 0.0021
Nov 5234.50 64.424 0.0503 -0.0418
Dec 5444.80 62.675 0.0386 -0.0279
2008 Jan 4712.70 70.561 -0.1553 0.1118
Feb 5072.40 68.978 0.0709 -0.0229
Mar 4843.20 62.848 -0.0473 -0.0975
Apr 5336.00 62.136 0.0924 -0.0115
May 5175.80 62.029 -0.0310 -0.0017
Jun 5185.60 64.694 0.0019 0.0412
Jul 4868.30 67.318 -0.0652 0.0390
Aug 4648.80 68.733 -0.0472 0.0206
Sep 4180.40 73.219 -0.1120 0.0613
Oct 3386.70 79.653 -0.2344 0.0808
Nov 3341.50 77.881 -0.0135 -0.0228
Dec 3521.20 77.711 0.0510 -0.0022

44
2009 Jan 3198.90 79.544 -0.1008 0.0230
Feb 2474.80 79.687 -0.2926 0.0018
Mar 2805.00 80.431 0.1177 0.0093
Apr 2800.10 78.662 -0.0017 -0.0225
May 2852.60 78.348 0.0184 -0.0040
Jun 3294.60 77.158 0.1342 -0.0154
Jul 3273.10 76.607 -0.0066 -0.0072
Aug 3102.70 76.233 -0.0549 -0.0049
Sep 3005.50 74.999 -0.0323 -0.0165
Oct 3083.60 75.239 0.0253 0.0032
Nov 3189.60 74.907 0.0332 -0.0044
Dec 3247.40 75.82 0.0178 0.0120
2010 Jan 3565.30 75.886 0.0892 0.0009
Feb 3629.40 76.897 0.0177 0.0131
Mar 4072.90 77.331 0.1089 0.0056
Apr 4233.20 77.266 0.0379 -0.0008
May 4241.80 79.745 0.0020 0.0311
Jun 4339.30 81.917 0.0225 0.0265
Jul 4438.60 80.23 0.0224 -0.0210
Aug 4454.60 81.071 0.0036 0.0104
Sep 4629.80 80.778 0.0378 -0.0036
Oct 4659.60 80.787 0.0064 0.0001
Nov 4395.20 80.974 -0.0602 0.0023
Dec 4464.90 80.752 0.0156 -0.0027
2011 Jan 4465.00 81.03 0.0000 0.0034
Feb 4240.00 81.47 -0.0531 0.0054
Mar 3887.00 84.21 -0.0908 0.0325
Apr 4029.00 83.89 0.0352 -0.0038
May 4078.00 85.43 0.0120 0.0180
Jun 3968.00 89.05 -0.0277 0.0407
Jul 3738.00 89.9 -0.0615 0.0095
Aug 3464.00 92.79 -0.0791 0.0311
Sep 3284.00 96.36 -0.0548 0.0370
Oct 3507.00 101.27 0.0636 0.0485
Nov 3155.00 93.68 -0.1116 -0.0810
Dec 3205.00 86.86 0.0156 -0.0785
45
2012 Jan 3224.00 86.34 0.0059 -0.0060
Feb 3304.00 83.18 0.0242 -0.0380
Mar 3367.00 82.9 0.0187 -0.0034
Apr 3547.00 83.19 0.0507 0.0035
May 3651.00 84.38 0.0285 0.0141
Jun 3704.00 84.79 0.0143 0.0048
Jul 3832.00 84.14 0.0334 -0.0077
Aug 3866.00 84.08 0.0088 -0.0007
Sep 3972.00 84.61 0.0267 0.0063
Oct 4147.00 85.11 0.0422 0.0059
Nov 4083.00 85.63 -0.0157 0.0061
Dec 4133.00 85.99 0.0121 0.0042
Source: NSE and CBK database.

46
Appendix II: Linear graphical representation of ERT Data.
Source: CBK Data-Foreign Exchange Rate

47
Appendix III: Linear graphical representation of NSE- 20 share index data
Source: NSE-20 share index Data.
48
Appendix IV: Histogram and statistics Rt
Source: NSE -20 Share Index Data.
49
Appendix V: Histogram and statistics ERT
Source: CBK Database.