effects of forest fragmentation on deer in southeast · pdf filealaska department of fish and...
TRANSCRIPT

Alaska Department of Fish and Game Division of Wildlife Conservation
November 1992
Effects of Forest Fragmentation on Deer in Southeast Alaska
Matthew D. Kirchoff
Federal Aid in Wildlife Restoration Research Progress Report
Grant W-23-5 Study 2.10
This is a progress report on continuing research. Information may be refined at a later date.
If using information from this report, please credit author(s) and the Alaska Department of Fish and Game.

STATE OF ALASKA Walter J. Hickel, Governor
DEPARTMENT OF FISH AND GAME Carl L. Rosier, Commissioner
DIVISION OF WILDLIFE CONSERVATION David G. Kelleyhouse, Director
Wayne L. Regelin, Deputy Director
Persons intending to cite this material should obtain permission from the author(s) andlor the Alaska Department of Fish and Game. Because most reports deal with preliminary results of continuing studies, conclusions are tentative and should be identified as such. Due credit.wil1 be appreciated.
*
Additional copies of this report and other Division of Wildlife Conservation publications may be obtained from:
Publications Specialist ADF&G, Wildlife Conservation
P.O. Box 22526 Juneau, AK 99802
(907) 465-41 90
~ The Alaska Department of Fish and Game conducts all programs and activities free from discrimination on the basis of race, color, national origin, age, marital status, pregnancy, parenthood, or disability. For information on alternative formats for this and other department publications, please contact the department ADA Coordinator at (voice) 907 - 465-4120, (TDD) 1-800-478-3648, or FAX 907-586-6595. Any person who believes shelhe has been discriminated against should write to: ADF&G, PO Box 25526, Juneau, AK 99802-5526 or O.E.O., U.S. Department of the Interior, Washington, DC 20240.
Project Title: Wildlife Research and Management
PROGRESS REPORT (RESEARCH)
State: Alaska
Cooperators: None
Project No: W-23-5
Study No.: Study Title: Effects of Forest Fragmentation on Deer in Southeast Alaska
Period Covered: 1 July 1991-30 June 1992
SUMMARY
We have monitored deer population densities since 1989 on over 100 islands of varying size, shape, and insularity in Sea Otter Sound. A wide range of deer densities have been observed (0-97 deer/km2), with an average of 25.3 deer/km2. We assume that relative habitat suitability, or quality, is reflected in the relative density of deer the habitat supports over time. Factors we are examining to explain differences in habitat suitability include quality and abundance of available food, type of overstory cover, predation risk, and habitat fragmentation.
I developed regression equations which predict available browse biomass as a function of basal stem diameter for blueberry (Vaccinium alaskensislovalijiolium) and huckleberry (V. parvifolium). I found a curvilinear relationship with maximum available biomass on plants with basal diameters of 10-16 mrn. As plants grow larger, browse biomass is carried beyond the reach of deer and availability declines. The total forage available in winter (including evergreen forbs) on the islands ranged from 0 to over 250 kgha, with an average of 45.8 kgha. Islands with the most abundant food did not necessarily have the highest densities of deer. The available food per deer averaged 2.2 kgha, but ranged from less than 1 kgha to over 10 kgha on different islands.
I developed regression equations which predict the biomass of Vaccinium consumed as a function of number and diameter of browsed twigs. The amount of Vaccinium consumed is significantly correlated with deer density (P < 0.00 1) across all islands. Deer density is also correlated both with the amount of huckleberry eaten, and the amount available (P < 0.001). Although huckleberry was only half as abundant as blueberry on the islands, over 2 times as much huckleberry biomass was eaten. The reasons for this

strong preference are not clear, however, it may be related to production of energy-rich carbohydrates by huckleberry during winter.
I assigned indices of fragmentation to each island, based on total land area, edge:area ratio, and insularity. Insularity was reflected by the distance to the nearest large island. Large islands were those with resident wolves. Of these three indices, insularity appears most important in influencing habitat suitability, with higher deer densities, and lower per capita forage availability, on remote islands. Deer are apparently accepting a lower quality diet, in exchange for increased security from predators. I presume deer can recognize predation risk through olfactory and auditory cues, based on proximity to regular howling sites of wolves.
Individual deer experience differential mortality risks (starvation versus predation) with every island choice they make (stay or leave). The end result of good or bad decision-making is reflected in the number of deer that survive and reproduce on a given habitat patch. The exact information a deer uses when making these decisions is not known. We expect that the decisions are strongly influenced by the individual's nutritional and reproductive status, the density of deer in the current habitat patch, and the probability of finding more suitable habitat elsewhere. Pregnant does, for example, may place greater weight on security from predation during fawning.
The next, and final field season in Sea Otter Sound will be devoted to filling in missing data for a number of islands, as well as collecting summer plant biomass data for all islands. The preliminary hypotheses generated by univariate statistics in this report will be re-examined using log-linear techniques. The results of this study will help guide the optimal design of old-growth reserves for deer.
Key words: biogeography, black-tailed deer, browse, edge, fragmentation, insular, islands, Odocoileus hemionus sitkensis, old growth, pellet-groups, southeast Alaska, Vaccinium.
TABLE OF CONTENTS Page
SUMMARY . . . . . . . . . . . . . . . . . . . . . . . . . . . . . . . . . . . . . . . . . . . . . . . . . i INTRODUCTION . . . . . . . . . . . . . . . . . . . . . . . . . . . . . . . . . . . . . . . . . . . . . 1 STUDY AREA . . . . . . . . . . . . . . . . . . . . . . . . . . . . . . . . . . . . . . . . . . . . . . . 2 METHODS . . . . . . . . . . . . . . . . . . . . . . . . . . . . . . . . . . . . . . . . . . . . . . . . . . 3
1992 Field Season . . . . . . . . . . . . . . . . . . . . . . . . . . . . . . . . . . . . . . . . 3 RESULTS AND DISCUSSION . . . . . ; . . . . . . . . . . . . . . . . . . . . . . . . . . . . . . 4
DeerUse . . . . . . . . . . . . . . . . . . . . . . . . . . . . . . . . . . . . . . . . . . . . . . 4 . . . . . . . . . . . . . . . . . . . . . . . . . . . . . . . . . . Understory Characteristics 6
Overstory Characteristics . . . . . . . . . . . . . . . . . . . . . . . . . . . . . . . . . . . 7 Landscape Characteristics . . . . . . . . . . . . . . . . . . . . . . . . . . . . . . . . . . . 8
ACKNOWLEDGEMENTS . . . . . . . . . . . . . . . . . . . . . . . . . . . . . . . . . . . . . . . 9 LITERATURE CITED . . . . . . . . . . . . . . . . . . . . . . . . . . . . . . . . . . . . . . . . . . 10 FIGURES . . . . . . . . . . . . . . . . . . . . . . . . . . . . . . . . . . . . . . . . . . . . . . . . . . . 13
INTRODUCTION
Habitat fragmentation is a process by which large blocks of continuous habitat are converted into smaller, more isolated patches. Concerns about the effects of habitat fragmentation on wildlife stem from biogeographical studies of true islands (MacArthur and Wilson 1967). These studies documented the near universal tendency for fewer species to inhabit smaller islands (the "area effect"), and the frequent tendency for fewer species to inhabit more isolated islands (the "distance effectM)(Temple and Wilcox 1986). We assume these basic principles of island biogeography apply also to human-created habitat fragments in a terrestrial setting (MacArthur and Wilson 1967), and in particular, to forest habitats subject to logging or agricultural development (Burgess and Sharpe 1981, Harris 1984).
Empirical data on the effects of forest fragmentation on wildlife, particularly birds, is accumulating rapidly (Verner 1986). Forest fragmentation reduces habitat suitability for diverse species, from "area-sensitive" large mammals (Picton and Mackie 1980) to "edge-sensitive" birds (Wilcove 1985, Temple and Cary 1988). Even where fragmentation does not result in the elimination of a species, effects may be reflected in other ways, including altered population dynamics or distribution patterns (Robinson et al. 1992).
In this study, we are monitoring deer density on over 100 islands, each characterized by a unique set of food, cover, and fragmentation conditions. In choosing what habitat to occupy, deer assess habitat suitability with reference to a host of factors, including biomass of food available, quality of that food, type of cover, risk of predation, and extent of habitat fragmentation. By measuring factors that affect habitat suitability (and resulting deer response) over many different islands, we can determine the functional importance of individual factors. In this case, the factor of primary interest is fragmentation, specifically, how patch size, shape, and isolation affects the suitability of habitat for deer.

Although logging is creating "islands" of old-growth surrounded by a "sea" of clearcuts, questions remain about what the real habitat island is (Laudenslayer 1986). In the case of wide-ranging animals like deer, is the old-growth patch the island, or are the clearcut and patch together an island? This troublesome question is avoided by studying habitat fragmentation on true islands. Not only are the habitat patches clearly defined, both to the deer and the researcher, but the matrix between patches has no habitat value and, therefore, need not be measured. By this approach, the functional importance of habitat size, shape, and insularity to deer can be described. Those insights should be useful in guiding the design of effective old-growth reserves in southeast Alaska.
This progress report describes the results of ongoing field work conducted during 1992. Previous progress reports (Kirchhoff 1990a, 1992) can be referred to for further background information.
STUDY AREA
Sea Otter Sound is located off the northwest side of Prince of Wales Island, in the southern Alexander Archipelago (Figure 1). The area is characterized by cool summers, mild winters, and abundant rain year round. The islands of Sea Otter Sound are forested with a mix of western hemlock (Tsuga heterophylla), Sitka spruce (Picea sitchensis), and red cedar (Thuja plicata). The understory is dominated by woody shrubs (e.g., Vaccinium spp., Menzesia ferruginea, Galtheria shallon), low-growing forbs (e.g., Cornus canadensis, Rubus pedatus, Maianthemum dilitatum), and a variety of ferns and mosses. Most of the smaller islands (< 50 ha) are unlogged, and support cornrnercial-quality old growth typical of this temperate rainforest. A number of the large islands in the study area were substantially logged 20-30 years ago.
We selected the study area because it features approximately 200 forested islands which vary in size, shape, and insularity. The islands range from mostly small (< 1 ha) to relatively large (> 1,000 ha), and are separated from one another by distances of 0.01 to 1.5 km. We chose sample islands to reflect a wide range of spatial conditions (small and isolated versus large and close) and a wide range of deer densities (0 to 100 deer/km2). Median size of sampled islands was 1.7 ha. (range 0.1 to 7,226 ha).
Sitka black-tailed deer (Odocoileus hemionus sitkensis) are common throughout the study area and are frequently seen swimming between islands. Wolves (Canis lupus) and black bears (Ursus americanus) reside on larger islands (e.g., Tuxekan, El Capitan, MarbleIOrr), and based on wolf scat evidence, make occasional forays to smaller islands as well. Human activity in this remote area is minimal. Two people live year-round in nearby Tokeen; hunting and trapping pressure in the area is light.
METHODS
We have conducted field work annually in Sea Otter Sound since 1989. We collect two types of data in the field: measures of deer density, or use, and vegetative characteristics of the individual islands. Deer pellet-group density (Neff 1968) serves as the primary indicator of relative deer density. Availability of plant biomass is based on measurements of the percent ground cover or basal stem diameters (Alaback 1986). I calculated the browse biomass eaten by deer using twig countldiameter methods (Potvin 1981, Pitt and Schwab 1988, 1990). In 1989 and 1992, crews concentrated on quantifying availability of forbs and shrubs. In 1990 and 199 1, crews concentrated on quantifying consumption of Vaccinium spp. Staff sampled most of the islands at least three out of four years.
1992 Field Season
We conducted field work from 13 April through 1 May. Staff measured pellet-group densities and vegetative characteristics on 1,434 plots on 94 islands. Pellet-groups were counted and vegetative characteristics measured in sequential plots laid out along established transect lines (Kirchhoff 1990a, 1992). Pellet-groups in southeast Alaska persist for 7-1 1 months, depending on environmental factors (Fisch 1979, Kirchhoff 1990b). We converted deer pellet-group densities to equivalent deer density, based on experimental work with a known-size, introduced deer population on a small island near Juneau (Kirchhoff l99Ob).
Staff measured basal area of each tree species with a cruising gauge from the endpoint of each pellet-group plot. We estimated percent cover of ferns and forbs in randomly located 1 m2 circular plots (0.56 m radius), and percent cover of shrubs was estimated in randomly located 0.001 ha circular plots (1.3 m radius). Estimates were made by category: trace, 1-5%, 6-25%, 26-5096, 51-7596, 76-9596, and over 95%. Field crews visually estimated the percent of Vaccinium twigs available to deer (i.e., below 1.25 m) on each plot, as well as the percentage of twigs that showed evidence of browsing. We estimated percent availability and use by category: 0, < 2%, 3-2096, 21-50%, 51-80% and over 80%. Biomass of Cornus canadensis, Rubus pedatus, Coptis aspleniifalia, and Tiarella trifaliata was calculated from percent cover estimates using regression equations developed for southeast Alaska (Alaback 1986).
Fourteen people conducted field work in 1992, including ADF&G personnel, outside volunteers, and five students from Juneau-Douglas High School. As in previous years, we worked out of a central field camp at Tokeen on El Capitan Island.
After the field season, we determined the area of each island using the U.S. Forest Service's Geographic Information System (TLMP office, Juneau). Island areas were computed to the nearest 0.1 ac (0.04 ha). We measured the perimeter, or coastline of each island from 1:40000 scale nautical charts with an electronic planimeter (Lasico Inc., CA). Many islands sampled are very close together, and deer may treat such clusters or

groups of small islands as the functional habitat patch. If islands were within 500 m of one another, we assumed they were in the same group. By this standard, we classified 110 islands into 32 different groups. Various landscape-level attributes were measured for these groups, including total surface area (by convex polygon method), number of islands per group, total land area per group, and cumulative coastline per group. I also measured the distance from the center of the group to the nearest large island (Prince of Wales, Kosciusco, Tuxekan, Marble, Orr, and El Capitan) where, based on local knowledge, wolves are regularly found.
RESULTS AND DISCUSSION
Deer Use
We based deer density estimates on 3,976 pellet-group plots sampled on 110 islands from 1989-92. We sampled 70% of the islands in three or more years. A wide range of deer densities have been observed (0-97 deer/km2), with an average of 25.3 deer/km2 and a median value of 17.3 deer/km2 (Figure 2). Because all islands are accessible to deer, we assumed that differences in population density on the various islands reflect differences in habitat suitability.
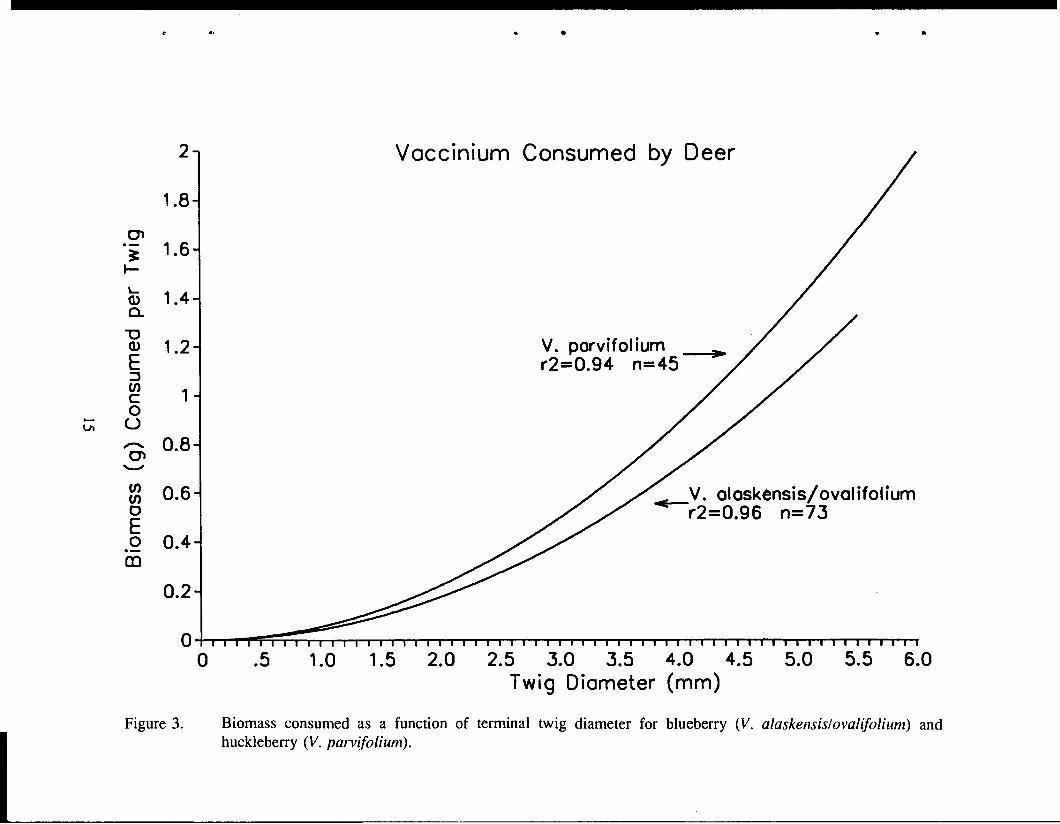
In 1990-1992, we measured use of Vaccinium browse as an index of deer use. During 1990, crews counted and measured 11,698 browsed twigs within the survey plots (Kirchhoff 1992). I developed regression equations to predict biomass as a function of terminal twig diameter (Figure 3), and from that, total biomass consumed per island. To reduce the labor involved, in 1991 I instructed crews to count (instead of measure) the number of browsed twigs per plot. I used those counts, along with mean twig diameter values and regression equations from 1990, to calculate total Vaccinium biomass consumed.
Deer strongly prefer red huckleberry (V. parvijiolium) over either of the other blueberry species (V, alaskensis and V. ovalijiolium). Even though huckleberry plants are only half as abundant as blueberry plants on the islands, deer eat over twice as much biomass of huckleberry as they do blueberry (9.67 gramslplot versus 4.06 gramslplot). The reasons for this strong preference are not clear. Analysis of crude protein, fiber, and lignin suggest that huckleberry may be superior to blueberry as deer food, but the differences are relatively small (Kirchhoff 1992). Another explanation may be that huckleberry remains photosynthetically active throughout the winter, producing energy-rich or good-tasting carbohydrates. The only circumstantial evidence for this is the fact that huckleberry stems are very green (much more so than other Vaccinium spp.), and huckleberry shoots apparently grow throughout the winter. We will collect and analyze additional plant samples during the winter in Juneau to help answer this question.

In 1992, browsed stems were neither measured nor counted. Instead, crews made visual estimates of the percentage of browse available and the percentage used within the plot. Although such estimates are convenient, testing revealed them to be relatively inaccurate. Consequently, I disregarded those estimates in the summary analyses; all biomass values reported here are based on twig:biomass regressions and coundmeasurement data collected in 1990-91.
My recommendation to persons wanting to make relatively quick, accurate assessments of biomass eaten, is to count all browsed twigs on the sampled plants, and record a single measurement that reflects the average terminal diameter of the counted twigs. Although there is often significant variability in twig diameters among plants .(especially plants in different stands), the diameters of browsed twigs on individual plants are relatively constant. This mean value can be used with biomass:twig diameter regression equations to yield good estimates of biomass consumed per plant. Depending on how individual plants within the stand have been sampled, these measures can be expanded to reflect biomass consumed per stand.
A number of hypotheses are suggested by the patterns of deer use and vegetative attributes measured on the islands. I have illustrated these patterns using five islands with contrasting deer use characteristics (Figure 4). For example, island number 9 has one of the highest deer densities and the greatest amount of biomass consumed, while island 23 has one of the lowest densities and biomass consumption levels. Not surprisingly, across all islands, the amount of Vaccinium biomass consumed is significantly correlated (r=0.48, p< 0.001, N=95) with deer density. This correlation is weakened somewhat by the fact that on some islands, more of a deer's diet may consist of non-woody vegetation. In these circumstances, deer produce pellet-groups but leave no measurable sign of browsing. Under these circumstances, pellet-group densities are a more reliable indicator of relative deer density.
Understory Characteristics
The most logical explanation for the wide range of deer densities might lie in a similarly wide range of food abundance across individual islands. Islands with more abundant food, or more nutritious food, would logically support higher densities of deer. To address this possibility, we quantified the amount and types of food on each island.
Previous research has documented predictable relationships between plant dimensions (e.g., basal diameter, height, % cover, leaf length, etc.) and total biomass across a variety of sites in southeast Alaska (Alaback 1986, 1987, Yarie and Mead 1989). The total biomass of a plant is not necessarily all available to deer. The most common shrub in southeast Alaska is the Alaska bluebeny (V. alaskensis), and the most preferred shrub is hucklebeny. Both species exceed 2 meters at maturity, with some hucklebeny plants exceeding 3 meters in height. To determine the amount of biomass actually available to deer, I developed new regression equations in 199 1 based on samples of available browse

(green stems below 1.25 m) collected fiom 142 plants (Kirchhoff 1992). As expected, the best fit regression showed a curvilinear relationship between available biomass and plant size (Figure 5). Plants with basal diameters of between 10 and 16 rnrn have the maximum biomass available, after which, the biomass available declines. The stems of huckleberry plants remain green for five or more years, whereas after two years, the stems of the other species are brown. Consequently, for a given sized plant, huckleberry produces more available biomass than blueberry.
It is important to note the relatively low 3 values for both of these regressions (0.67 and 0.68). For large plants especially, there is high variability in biomass available, depending on the growth form of the plant and the history of browsing pressure i t has received. On islands where browsing is very heavy, plants are either severely stunted (and have little biomass), or have acquired a tree-like growth where no biomass is in reach. On islands where browsing pressure is light, there is usually more biomass available for a given-sized stem.
I determined the amount of forb biomass available to deer from percent cover estimates (Alaback 1986). In early spring, the new growth of deciduous forbs has not developed, and percent cover estimates are variable. For comparison purposes, the biomass data reported here are only for those species that do not die back in winter, including Cornus canadensis, Rubus pedatus, Coptis asplenivolia, and Tiarella trifoliata. Of these, Cornus and Rubus are the most abundant. Species which are abundant later in spring and summer include, Maianthemurn dilitatum, Streptopus spp., and Clintonia spp.. We plan next summer's field work to quantify the contribution of these deciduous forbs to summer biomass.
I calculated the total available food biomass (winter only) for each Island. As with deer density, we found a wide range of values. Available biomass ranged fiom 0 to over 250 kg/ha, with a mean value of 45.8 kg/ha, and a median value of 30.5 kg/ha (Figure 6). As before, available biomass is graphically portrayed, by forage class, for the same five islands highlighted previously (Figure 7). Most notable is the abundance of food, particularly huckleberry, on island 9, which had high deer density, and the lack of food on island 23, which had low deer density. Island 57, which had a substantial amount of blueberry biomass available, had relatively low deer use.
Over all islands, a highly significant correlation existed between deer density, and huckleberry available (r=0.53, P < 0.001), and huckleberry eaten (r=0.47, P <0.001). There were no significant correlations between deer density and similar parameters for blueberry. Highly nutritious forbs which are generally preferred by deer, were not significantly correlated either. This probably reflects the fact that at high deer densities, most forbs have been eaten. To illustrate, one small island had no sign of deer when first visited in 1989. The forb biomass at the time was extremely high (94.9 kg/ha), and covered most of the ground area. In 1990, deer apparently discovered the island and

reached a maximum density in 199 1 of 43.2 deer/km2. By 1992, the deer had consumed almost all the forbs (biomass = 1.3 kgha) and had left the island.
Over time, the density of deer on different habitat patches or islands should reflect the suitability of those islands. By adjusting their density on different habitats (in this case, islands), deer should distribute themselves such that expected rates of survival and reproductive success are the same for all individuals (Fretwell 1972). This is the "ideal-free" model of habitat selection. If food abundance were the sole factor affecting habitat suitability, we would expect the available food per deer to be about the same on all islands. By graphing per capita food availability, we find this is not the case (Figure 8). The average food availability per deer across all islands is 2.2 kgha, but it ranges from less than 1 kgha on some islands, to over 10 kgha on others. One can conclude that there are factors besides food abundance that affect habitat suitability for deer.
Overstory Characteristics
Overstory characteristics can also influence habitat suitability. The forest canopy effectively intercepts snow, making more forage available at lower energetic cost. It can also act as a thermal banier, slowing radiant heat loss in winter, and providing some measure of protection from wind and rain. The structure of the old-growth canopy is important. High-volume old-growth stands intercept snow more effectively than low-volume stands (Kirchhoff and Schoen 1987), and are important habitat for deer during winter (Schoen and Kirchhoff 1990). Other overstory attributes which are correlated with snow interception include tree height, stem density, basal area, canopy cover and species composition (Kirchhoff and Schoen 1987).
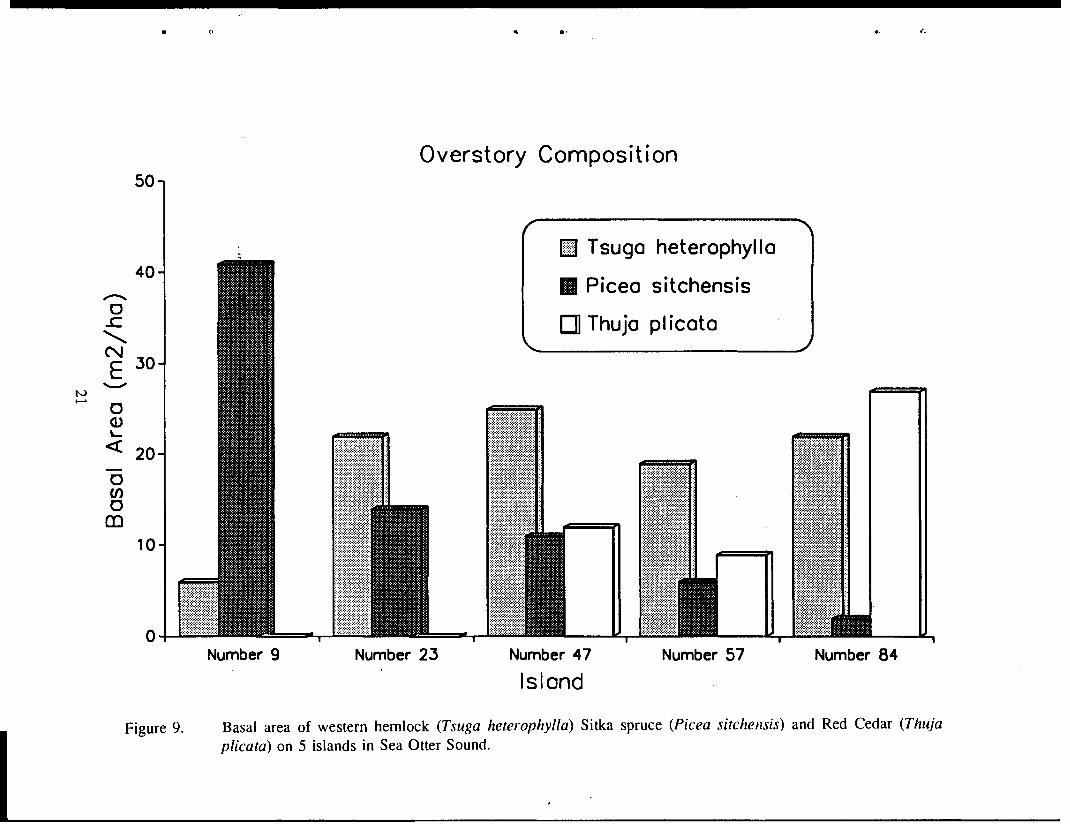
Overstory characteristics measured on the islands since 1989 include basal area, volume class, and percent composition (by basal area) of western hemlock, Sitka spruce, and red cedar (Kirchhoff 1990 1992). Again, there was a wide spread in overstory characteristics among the islands. Island 9 had the highest mean volume (37,770 mbflac), the highest percentage spruce composition (84%), and the fifth highest basal area of all islands in the study (Figure 9). Island 84 also had a relatively high basal area, but it was dominated by red cedar instead of spruce. How important overstory factors are in determining habitat suitability probably depends a great deal on the type of winter weather an area receives. Snowfall in this area of Southeast has been relatively light the last four years.
In addition to its influence on snow, the overstory composition and structure may also be closely associated with species composition and structure in the understory. For example, salal often occurs in association with low-volume cedar stands; Menzesia and Vaccinium are associated with hemlock-dominated sites; and devil's club (Oplopanax horridum) is commonly found on productive, spruce-dominated sites. These and other plant associations were described by DeMeo (1 9891, and may provide a useful predictor of deer habitat suitability that can eventually be assessed remotely (e.g., from aerial photographs).

Landscape Characteristics
This category includes spatial characteristics of habitat at the landscape scale, including size, shape, and relative insularity of habitat patches. As previously noted, these spatial attributes were measured for groups or clusters of islands, as defined by their proximity (< 500 m) to one another. We identified 32 island groups, with a mean of 4.6 islands per group (SD=4.5). The average size of individual islands within a group was 9.6 ha (SD=12.7). Total surface area (including water) of the group was 101 ha (SD=136); the total land area was 47.5 ha/group (SD=68.4), and the average, cumulative perimeter of islands in a group was 5.1 km (SD=5.2). We assigned individual islands within a group the fragmentation indices of the group as a whole.
With increased fragmentation, habitat becomes smaller in total area, the amount of edge per unit area increases, and the habitat becomes more insular, or isolated, from other similar habitats. The first fragmentation index, land area, is the simple sum of island areas within a group. The second index, edge per unit area, is expressed as the sum of the perimeters of the islands in a group, divided by the sum of the areas. The third factor, isolation or insularity, was represented as the shortest straight-line distance to a "large" island. "Large" islands were defined as those on which wolves are continuously present for periods of at least two weeks. Local resident identified islands meeting those criteria (El Capitan and larger).
To make the 3 indices comparable, I computed percentile ranks for each. For example, if an island ranks in the 83rd percentile in edge:area ratio, that means its edge:area ratio is larger than 83% of all sampled islands. Indices of isolation, edgearea, and land area are shown for five highlighted islands (Figure 10). Simple correlations between habitat fragmentation indices and deer density suggest that deer density increases as islands become increasingly isolated (r=0.34, P < 0.001). Surprisingly, deer densities decreased as edge increased (r=-0.26, p < 0.01), however, I suspect this may simply be an artifact of correlation with other variables.
Predation risk appears to be a significant factor affecting habitat suitability, and may explain why certain islands that have abundant food resources are underused. It is not clear if, or how, deer recognize predation risk when they select habitat. Deer probably recognize and avoid small islands that either have wolves on them, or have had wolves on them recently. However, if it has been months, or years, since the last wolf visitation, there may be no visual or olfactory cues. Deer may be sensing and reacting to inherent predation risk by olfactory and auditory cues. Howling by wolf packs canies over long distances, and most deer hear wolves regularly. Deer probably gravitate away from areas of high risk and towards areas of lower risk, depending on where wolves are being heard. This may explain why deer end up at relatively high densities on more remote islands.
All islands, however, have a finite capacity to support deer. At high densities, some deer will have to move from these islands to other islands to find enough food. Individual
deer accept the various risks (starvation versus predation) with every island choice they make (stay or leave). This is a dynamic process which varies depending on an individual deer's nutritional and reproductive status, the density of deer in the current habitat patch, and the probability of finding more suitable habitat elsewhere. Adult females, for example, may place more emphasis on security than on food when they are having fawns, and move to smaller, more remote islands during that time. This is interesting in light of local residents' characterization of certain islands as "deer nurseries."
CONCLUSIONS
Despite the temptation to draw conclusions from univariate comparisons, it would be difficult (and perhaps misleading) to say how one factor affects deer habitat suitability. I intend to analyze these data in the next report period using a log-linear modelling approach (Lee 1978, Agresti 1984). The specific hypotheses I will be testing are shown in Figure 1 1.
The next, and final field season in Sea Otter Sound will be devoted to filling in missing data for a number of islands, as well as collecting summer forb biomass data for all islands. I also expect to prepare some intermediate findings for publication, principally, the regressions for understory biomass and browse utilization, and the Portland Island data which quantifies the relationship between deer density and pellet-group density (Kirchhoff 1990). Finally, I will be evaluating alternative ways to characterize habitat fragmentation, group size, and security from wolves.
ACKNOWLEDGEMENTS
I thank the 13 members of my field crew who performed their work so capably and cheerfully during this rainy field season. They were: ADF&G employees Kathleen Meddleton, Bruce Dinneford, Angelica Gates, and Tom Paul; Juneau-Douglas High School students Aaron Landvik, Erik Erikson, Tricia Satre, Scott Bloom, and Zeff Throwell; and several volunteers who took time off from their regular jobs to count deer pellets: Lynette and Cecil McNutt, Kate Savage, and Claire Fordyce. I also thank John Norton, GT Science advisor at the high school, for his help arranging student participation. Gene Degayner, with the U.S. Forest Service, helpfully calculated the land areas of all study islands. Sylvia Geraghty, in Tokeen, again provided much appreciated logistical support, and contributed to another smooth field season. And finally, thanks to Susan Abbott for reviewing and editing this manuscript.

LITERATURE CITED
Agresti, A. 1984. Analysis of ordinal, categorical data. J. Wiley and Sons, NY. 287pp.
Alaback, P. B. 1986. Biomass regression equations for understory plants in coastal Alaska: Effects of species and sampling design on estimates. Northw. Sci. 60-90- 103.
. 1987. Biomass-dimension relationships of understory vegetation in relation to site and stand age. E. H. Wharton and T. Cunia (eds). Estimating tree biomass regressions and their error. SUNY Coll. Environ. Sci. and .F~restry, Syracuse, N.Y. Pp 141-148.
Burgess, R. L. and D. M. Sharpe (eds.). 1981. Forest island dynamics in man-dominated landscapes. Springer-Verlag, New York. 3 10pp.
DeMeo, T. E. 1989. Preliminary forest plant association management guide: Ketchikan Area, Tongass National Forest. Draft unpubl. report on file, Ketchikan, AK.
Fisch, G. 1979. Deer pellet deterioration. pp. 207-209 in: O.C. Wallrno and J.W. Schoen, eds. Sitka black-tailed deer: proceedings of a conference in Juneau, AK. U.S. Dep. Agric., For. Serv., Alaska Reg. Series No. 410-48.
Fretwell, S. D. 1972. Populations in a seasonal environment. Princeton Univ. Press, Princeton. 2 17pp.
Harris, L. D. 1984. The fragmented forest, island biogeography and the preservation of biotic diversity. Univ. Chicago Press. 2 1 lpp.
Kirchhoff, M. D. 1990a. Effects of forest fragmentation on deer in southeast Alaska. Ak. Dep. Fish and Game, Fed. Aid Prog. Rep., Proj. W-23-3, Study 2.10. 24pp.
. 1990b. Evaluation of methods for assessing deer population trends in southeast Alaska. Ak. Dep. Fish and Game, Fed. Aid Prog. Rep., Proj. W-22-6, W-23-2,W-23- 1 and W-23-3, Study 2.9. 35pp.
. 1992. Effects of forest fragmentation on deer in southeast Alaska. Ak. Dep. Fish and Game, Fed. Aid Prog. Rep., Proj. W-23-4, Study 2.10. 40pp.
and . 1987. Forest Cover and Snow: implications for deer habitat in southeast Alaska. J. Wildl. Manage. 5 1(1):28-33.
Laudenslayer, W. F. 1986. Predicting the effects of habitat patchiness and fragmentation - the manager's viewpoint. Pp. 331-333 in: Wildlife 2000, modeling habitat

relationships of terresmal vertebrates. J. Verner, M. Momson, and C. Ralph, eds. Univ. Wisc. Press. 470pp.
Lee, S. K. 1978. An example for teaching some basic concepts in multidimensional contingency table analysis. Amer. Statistician. 32(2):69-71.
MacArthur, R. H. and E. 0. Wilson. 1967. The theory of island biogeography. Princeton Univ. Press, Princeton, N.J. 203pp.
Neff, D. J. 1968. The pellet-group technique for big game trend, census, and distribution: a review. J. Wildl. Manage. 48:478-88.
Picton, H. and R. J. Mackie. 1980. Single species island biogeography and Montana mule deer. Biol. Cons. (1980-8 1) pp. 41-49.
Pitt, M. D. and F. E. Schwab. 1988. Quantitative determinations of shrub biomass and production: a problem analysis. B.C. Ministry of Forests and Lands. Land Management Rep. 54. Victoria, B.C.
and . 1990. Assessment of a double-sampling technique for estimating browse biomass. J. Wildl. Manage. 54:342-348.
Potvin, F. 1981. Constructing dry weight-diameter curves for browsed twigs. J. Wildl. Manage. 35:5O 1-507.
Robinson, G. R., R. D. Holt, M. S. Gaines, S. P. Hamburg, M. L. Johnson, H. S. Fitch, and E. A. Martinko. 1992. Diverse and contrasting effects of habitat fragmentation. Science Vol. 257524-25.
Schoen, J. W. and M. D. Kirchhoff. 1990. Seasonal habitat use by Sitka black-tailed deer on Admiralty Island, Alaska. J. Wildl. Manage. 54(3):371-78.
Temple, S. A. and J. R. Cary. 1988. Modeling dynamics of habitat-interior bird populations in fragmented landscapes. Cons. Biol. 2(4):340-47.
and B. A. Wilcox. 1986. Introduction: Predicting the effects of habitat patchiness and fragmentation. Pp. 26 1-262 in: Wildlife 2000, modeling habitat relationships of terresmal vertebrates. J. Verner, M. Momson, and C. Ralph, eds. Univ. Wisc. Press. 470pp.
Verner, J. 1986. Predicting the effects of habitat patchiness and fragmentation-- the researcher's viewpoint. Pp. 327-329 in: Wildlife 2000, modeling habitat relationships of terrestrial vertebrates. J. Verner, M. Morrison, and C. Ralph, eds. Univ. Wisc. Press. 470pp.

Wilcove, D. S. 1985. Nest predation in forest tracts and the decline of migratory songbirds. Ecology 66: 121 1- 12 14.
Yarie, J. and B. R. Mead. 1989. Biomass regression equations for determination of vertical structure of major understory species of southeast Alaska. Northw. Sci. 63(5):221-23 1.
Prepared by:
Matthew D. Kirchhoff Wildlife Biologist HI
Submitted by:
David Anderson Regional Supervisor
David G. ~ellefiouse, Director Division of Wildlife Coordination
-!&even R. Peterson, ~ e z i o r Staff Biologist Division of Wildlife Conservation

Figure 1. Map of Sea Otter Sound Study Area.

Deer Density on Islands in Sea Otter Sound
Islands (ordered by deer density)
Figure 2. Deer density measured on 110 island in Sea Otter Sound, 1989-92.
6 ., 7 . L *
Voccinium Consumed by Deer
V. parvifolium r2=0.94 n=45
0 .5 1.0 1.5 2.0 2.5 3.0 3.5 4.0 4.5 5.0 5.5 6.0 Twig Diameter (mm)
Figure 3. Biomass consumed as a function of terminal twig diameter for blueberry (V. alaskensislovalifolium) and huckleberry ( V . parvifolium).

Deer Densitv and Foraae Consum~t ion
( H Deer Density 1 [7 Vaccinium
Consumed
Number 9 Number 23 Number 47 Number 57 Number 8 4
Island
Figure 4. Comparisons of deer density (deer/km2) and Vaccinium consumed (kgha) on 5 Islands in Sea Otter Sound.
a w * I ) a v

Vaccinium Biomass Available to Deer
0 5 10 15 20 25 Basal Diameter (mm)
Figure 5. Biomass available to deer as a function of basal stem diameter for blueberry and (V. alaskensislovalifolium) and huckleberry (V. patvifolium).

Avaialable Food Biomass on Islands in Sea Otter Sound
250
200
1 50
1 00
Meon (45.8 kg/ho)
50 Medion (30.5 kg/ho)
0
Islands (ordered by available Biomass)
Figure 6. Available biomass of winter foods (V. alaskensislovalifolium, V. parvifolium, C . canadensis, R. pedatus, C . aspleniifolia, and T. trifoliata) on 96 islands in Sea Otter Sound, 1989-92.
* n c qj

Amount and Type of Forage Available to Deer
V. oloskensis/ovolifolium
V. porvifoIium
C. conodensis/R. pedatus
Number 9 Number 23 Number 47 Number 57 Number 84
Island
Figure 7. Amounts and types of winter forage available to deer on 5 islands in Sea Otter Sound.

Per Capita Food Availability on Islands in Sea Otter Sound
Islands (ordered by food avai labi l ity per deer)
Figure 8. Available food per deer on 96 islands in Sea Otter Sound, 1989-92.
a <. V * I .
Overstory Composition
Picea sitchensis
Thujo plicoto
Number 9 Number 23 Number 47 Number 57 Number 84
Island
Figure 9. Basal area of western hemlock (Tsuga heterophylla) Sitka spruce (Picea sitchensis) and Red Cedar (Thuja plicata) on 5 islands in Sea Otter Sound.

Percentile Rank Based on Fragmentation/lnsularity Indices
Number 9 Number 23 Number 47 Number 57 Number 84
Island
Figure 10. Indices of fragmentation/insularity expressed in percentile ranks on 5 islands in Sea Otter Sound. Isolation is based on the distance to the nearest large land mass with resident wolves. Edge:area is the island perimeter(s) divided by the island area(s). Land area is cumulative land area within an island group.

Ho: Large Patches Are Preferable to Small Patches. ... . . . Ho: Clumped Patches Are Preferable to Dispersed Patches.
- I predators1 *@ @+ predators]
Ho: Remote Patches are Preferable to Accessible Patches.
Ho: High-edge Patches Are Preferable to Low-edge Patches
Figure 11. Hypotheses regarding the optimal design of old-growth reserves for deer in southeast Alaska.

Alaska's Game Management Units
ULF O F A L A S
*
I
Project funded by Federal Aid in Wildlife Restoration

The Alaska Department of Fish and Game administers all programs and activities free from discrimination based on race, color, national origin, age, sex, religion, marital status, pregnancy, parenthood, or disability. The department administers all programs and activities in compliance with Title VI of the Civil Rights Act of 1964, Section 504 of the Rehabilitation Act of 1973, Title II of the Americans with Disabilities Act of 1990, the Age Discrimination Act of 1975, and Title IX of the Education Amendments of 1972. If you believe you have been discriminated against in any program, activity, or facility, or if you desire further information please write to ADF&G, P.O. Box 25526, Juneau, AK 99802-5526; U.S. Fish and Wildlife Service, 4040 N. Fairfax Drive, Suite 300 Webb, Arlington, VA 22203 or O.E.O., U.S. Department of the Interior, Washington DC 20240. For information on alternative formats for this and other department publications, please contact the department ADA Coordinator at (voice) 907-465-6077, (TDD) 907-465-3646, or (FAX) 907-465-6078.