effects of forest management on click beetle (coleoptera
TRANSCRIPT
EFFECTS OF FOREST MANAGEMENT ON CLICK BEETLE (COLEOPTERA:
ELATERIDAE) ASSEMBLAGES IN THE ACADIAN FOREST OF MAINE
By
Shelly L. Thomas
B.S. Eastern University, 1995
A THESIS
Submitted in Partial Fulfillment of the
Requirements for the Degree of
Doctor of Philosophy
(in Ecology and Environmental Science)
The Graduate School
The University of Maine
May, 2007
Advisory Committee:
Robert G. Wagner, Henry W. Saunders Distinguished Professor in Forestry, Advisor
William A. Halteman, Associate Professor of Mathematics and Statistics
Malcolm L. Hunter, Jr., Libra Professor of Conservation Biology
Alan S. White, Professor of Forest Ecology
Francis A. Drummond, Professor of Insect Ecology and Insect Pest Management
John C. Brissette, Research Forester and Project Leader, USDA Forest Service

LIBRARY RIGHTS STATEMENT
In presenting this thesis in partial fulfillment of the requirements for an advanced degree
at The University of Maine, I agree that the Library shall make it freely available for
inspection. I further agree that permission for “fair use” copying of this thesis for
scholarly purposes may be granted by the Librarian. It is understood that any copying of
publication of this thesis for financial gain shall not be allowed without my written
permission.
Signature:
Date:
EFFECTS OF FOREST MANAGEMENT ON CLICK BEETLE (COLEOPTERA:
ELATERIDAE) ASSEMBLAGES IN THE ACADIAN FOREST OF MAINE
By Shelly L. Thomas
Thesis Advisor: Robert G. Wagner
An Abstract of the Thesis Presented
in Partial Fulfillment of the Requirements for the Degree of Doctor of Philosophy
(In Ecology and Environmental Science) May, 2007
Click beetle (Coleoptera: Elateridae) assemblages were examined in three
experiments in the Acadian forest of Maine. First, I used flight intercept traps to compare
Elaterid assemblages in stands that developed after clearcut, shelterwood, and selection
harvests. Click beetle richness was highest in stands managed under a selection system
and lowest in stands regenerated using the clearcut method. The abundance of click
beetle species was lower in stands managed by clearcutting than in stands managed using
the shelterwood and selection methods. Hardwood basal area was the best environmental
predictor for both species richness and species abundance.
Second, I examined whether Elaterid assemblages in soil were associated with
hardwood (Maple, Birch, Aspen, Blueberry, and Oak) and softwood (Spruce-Fir-Pine,
Pine, Hemlock, and Fern-Hemlock) cover types. Elaterid diversity was generally higher
in hardwood than softwood stands. Species richness was lowest in the Spruce-Fir-Pine
and highest in the Oak cover type. Species abundance was lowest in the Spruce-Fir-Pine
and Pine and highest in the Oak, Maple, and Hemlock cover types. Assemblages in
hardwood stands were less similar to those in coniferous stands than they were to each
other, with assemblages in oak stands being least similar to those in coniferous or other
hardwood stands. Four species of click beetle were more abundant in softwood stands,
and seven species were associated with increases in specific softwood tree and shrub
species. Nine species of click beetle were more abundant in hardwood stands, and fifteen
species were associated with increases in specific hardwood tree and shrub species,
including six species associated with oak stands.
Third, I examined how the species richness, abundance, diversity, and assemblage
similarity of click beetles inhabiting coarse woody material (CWM) were affected by gap
harvesting and characteristics of the CWM (diameter, degree of decay, and wood type) in
Maine’s Acadian forest. Species assemblages varied between harvest treatments, canopy
conditions, CWM wood type (hardwood vs. softwood), and especially between CWM
decay classes and among diameter classes. Size of harvest gap did not influence the
species abundance of click beetles across the small range of gap sizes studied (0.01 to
0.21 ha), and there were few differences between the two harvest treatments. Four of the
most common species had higher abundances in closed canopy than harvest gaps. Click
beetle species richness and species abundance were higher in CWM that had larger
diameters and were more decayed. Click beetle diversity was higher in softwood than
hardwood CWM.

i
ACKNOWLEDGEMENTS
I would like to thank my advisor, Bob Wagner; your encouragement, dedication,
input, and sense of humor were invaluable and made it possible for me to complete my
work. Thank you very, very much! Thank you to my committee members, including
Frank Drummond and John Brissette, for your reviews, especially to Mac Hunter for
inviting me to your “Mac Meetings,” Al White for your encouragement and time, and
most especially to Bill Halteman for the many hours you spent helping me understand my
statistical analyses and honing my statistical skills, and going above and beyond the call
of duty when it was needed the most. Thank you to Rebecca Holberton and Dave Foster
for participating in my comprehensive exams. Thanks to Steve Woods for making it
possible for me to study click beetles. Susan Brawley, thank you for your dedication to
excellent education, for your hard work at sustaining the GK-12 program, and for helping
to make it possible for me to travel back to Kenya. Thank you to Steve Kingsbury for
being such a good example of an excellent middle school science teacher. Thanks to the
many graduate students who have helped me, including Hanne Jorgensen, Mike
Saunders, Tom Woodcock, and the “Mac Meeting” students- Steve Campbell, Fred
Beaudry, Dave Patrick, Sean Blomquist, and the late Dave Ververka. Thanks to Dick
Dearborne and Charlene Donahue for the use of the MFS insect collection, to Tim Stone
for his help with PEF data, and to my many student workers, without whom little could
be accomplished. Sincere gratitude to Edward C. Becker and Serge Laplant for
correcting my click beetle reference collections.
Heartfelt thanks to Joe Sheldon, who guided me into the wonderful world of very
small critters and who instigated my thinking about the deep connection between faith

ii
and ecology. Thanks to the staff and volunteers of Au Sable Environmental Institute,
Christians for Biblical Equality, and A Rocha International for your dedication and
witness. Thanks to my church families in PA and ME for praying for me through the
years; special thanks to Pathway for helping me develop my gifts as the director of the
Growth Rings Ministry. My deepest gratitude goes to the many friends who have
prayed, laughed, and cried with me during this time, especially Kathy and Chris, Steph
O., Traci, Gary, Christi, Jean, Karen, Steph N., Jenny, Megan, Joy, Amy, Fair, and Julie.
I would especially like to thank Jack J. Heddon. My favorite memories of these grad
school years are inundated with experiences I shared with you. Thank you for your
loving friendship, for your enduring patience, for your constant encouragement, and for
allowing me to learn from you. I love you, my friend, and I wish you well in all things.
Mom and Dad, you have been my inspiration, my shelter, my encouragers, my
teachers, and my most rabid fans! Thank you for raising me in a beautiful home,
infecting me with your curiosity, passion, and joy, making it possible for me to travel the
world, and supporting me through these years. Thank you for introducing me to the
Beautiful One and to the Way. I love you both very much!
Finally, to the One who was, who is, and who is to come: thank you for your
creativity. Please help us to care for your creation and to love as you would have us love-
with action, strength, humility, justice, mercy, and hope- and in so doing to create the
community you desire. Baruch ata adonai, eloheinu melech ha'olam, borei ha'chipvushit!
iii
TABLE OF CONTENTS
ACKNOWLEDGEMENTS.................................................................................................ii
LIST OF TABLES...............................................................................................................x
LIST OF FIGURES..........................................................................................................xiv
PROLOGUE........................................................................................................................1
Chapter
1. EFFECT OF SYLVICULTURAL METHODS AND ASSOCIATED STAND
CHANGES ON CLICK BEETLE (COLEOPTERA: ELATERIDAE)
ASSEMBLAGES IN MAINE’S REGION OF THE ACADIAN FOREST.......................6
1.1. Abstract............................................................................................................6
1.2. Introduction......................................................................................................7
1.3. Methods..........................................................................................................10
1.3.1. Study Site........................................................................................10
1.3.2. Measurements.................................................................................13
1.3.2.1. Beetle Sampling...............................................................13
1.3.2.2. Vegetation Sampling.......................................................14
1.3.3. Analytical Approach......................................................................15
1.4. Results...........................................................................................................18
1.4.1. Beetle Taxa.....................................................................................18
iv
1.4.2. Effect of Silvicultural Methods....................................................19
1.4.3. Effect of Vegetation.......................................................................20
1.4.3.1. Relative Canopy Height..................................................20
1.4.3.2. Stand Structural and Vegetation Species Diversity........20
1.4.3.3. Basal Area of Hardwoods and Softwoods......................26
1.4.4. Effect of Deadwood Conditions.....................................................27
1.4.4.1. Snag Classes 2-4..............................................................27
1.4.4.2. CWM Classes 2, 3, and 4.................................................27
1.5. Discussion.....................................................................................................27
1.5.1. Effect of Silvicultural Methods......................................................28
1.5.2. Influence of Vegetation..................................................................30
1.5.2.1. Canopy Height.................................................................30
1.5.2.2. Stand Structural Diversity...............................................32
1.5.2.3. Forest Composition.........................................................33
1.5.3. Deadwood Influences.....................................................................36
2. RELATION BETWEEN VEGETATION COMPOSITION AND CLICK
BEETLE (COLEOPTERA: ELATERIDAE) ASSEMBLAGES IN MAINE’S
ACADIAN FOREST.........................................................................................................38
2.1. Abstract........................................................................................................38
2.2. Introduction..................................................................................................39
2.3. Methods.........................................................................................................41
2.3.1. Study Site.......................................................................................41
v
2.3.2. Cover Types...................................................................................42
2.3.3. Beetle and Vegetation Sampling....................................................44
2.3.4. Analytical Approach......................................................................46
2.4. Results...........................................................................................................48
2.4.1. Description of Beetle Taxa.............................................................48
2.4.2. Relation of Click Beetle Assemblages with Cover Types.............48
2.4.3. Relation of Click Beetle Species with Cover Types and
Plant Species..................................................................................58
2.5. Discussion.....................................................................................................60
2.5.1. Click Beetle Assemblages and Plant Cover Types........................60
2.5.2. Softwood Associates......................................................................62
2.5.3. Hardwood Associates.....................................................................64
3. INFLUENCE OF HARVEST GAPS AND COARSE WOODY MATERIAL
ON CLICK BEETLES (COLEOPTERA: ELATERIDAE) IN MAINE’S
ACADIAN FOREST.........................................................................................................68
3.1. Abstract..........................................................................................................68
3.2. Introduction....................................................................................................68
3.3. Methods..........................................................................................................71
3.3.1. Study Site........................................................................................71
3.3.2. Field Invertebrate Sampling............................................................72
3.3.3. Analytical Approach.......................................................................74
3.4. Results............................................................................................................77
vi
3.4.1. Description of Taxa.........................................................................77
3.4.2. Harvest Treatment..........................................................................77
3.4.3. Canopy Condition...........................................................................77
3.4.4. Coarse Woody Material Characteristics.........................................78
3.4.4.1. Wood Type......................................................................78
3.4.4.2. Decay Class.....................................................................79
3.4.4.3. Diameter...........................................................................84
3.5. Discussion......................................................................................................85
3.5.1. Harvest Gaps...................................................................................85
3.5.1.1. Gap Size and Harvest Treatment.....................................85
3.5.1.2. Canopy Condition............................................................86
3.5.2. CWM Characteristics......................................................................87
3.5.2.1. Wood Type......................................................................87
3.5.2.2. Decay Class.....................................................................87
3.5.2.3. Diameter..........................................................................88
3.6. Conclusion.....................................................................................................90
EPILOGUE........................................................................................................................91
Summary................................................................................................................91
Strengths and Limitations......................................................................................93
Conservation and Forest Management Implications..............................................96
Future Directions...................................................................................................98
Context of Faith in Natural Resources Conservation............................................99
vii
LITERATURE CITED....................................................................................................103
APPENDIX A..................................................................................................................120
APPENDIX B..................................................................................................................126
B.1. Figures and Tables from Chapter 2.............................................................126
B.2. NMS v. CCA...............................................................................................129
B.3. Variation in Click Beetle Assemblages.......................................................136
B.3.1. Distant hemlock trees did not influence Maple Cover Type........136
B.3.2. Possible Small-Scale Heterogeneity.............................................137
B.3.3. Vegetation Species Explain Majority of Variation in
Click Beetle Assemblages............................................................138
APPENDIX C..................................................................................................................143
C.1. Figures and Tables from Chapter 3.............................................................143
C.2. Diameter v. Volume of CWM.....................................................................151
C.3. Experiment 3: Soil......................................................................................155
C.3.1. Abstract.......................................................................................155
C.3.2. Introduction..................................................................................155
C.3.3. Methods......................................................................................156
C.3.3.1. Field Invertebrate Sampling..........................................156
C.3.3.2. Analytical Approach....................................................156
C.3.4. Results.........................................................................................158
C.3.4.1. Description of Taxa.................................................... 158
C.3.4.2. Harvest Treatment.......................................................158
viii
C.3.4.3. Canopy Condition ........................................................159
C.3.4.4. CWM and Soil...............................................................160
C.3.5. Discussion....................................................................................161
C.3.5.1. Canopy Condition.........................................................161
C.3.5.2. Gap Size........................................................................162
C.3.5.3. Harvest Treatment........................................................162
C.3.5.4. CWM and Soil...........................................................................163
BIOGRAPHY OF THE AUTHOR..................................................................................174
ix
LIST OF TABLES
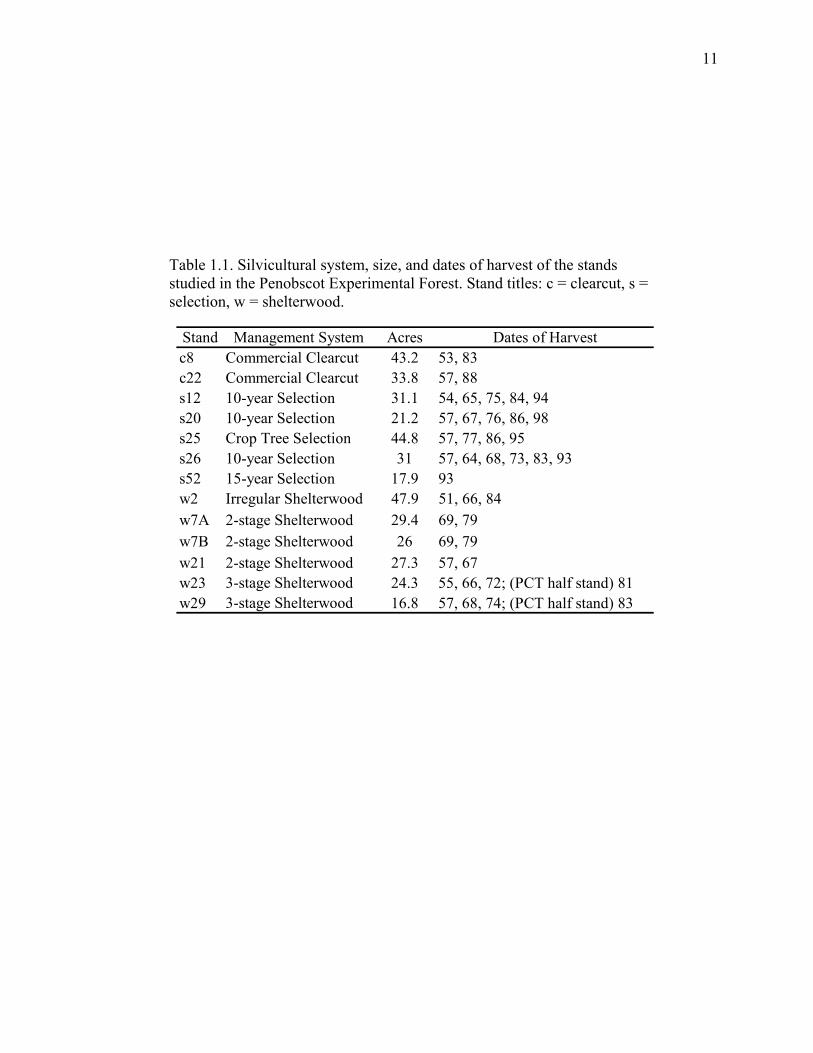
Table 1.1. Silvicultural system, size, and dates of harvest of the stands
studied in the Penobscot Experimental Forest...........................................11
Table 1.2. Environmental variables for each stand.....................................................19
Table 1.3. Results for the Site and Height general linear models of click beetle
species richness..........................................................................................21
Table 1.4. Results for the Site and Height general linear models of click beetle
species abundance......................................................................................21
Table 1.5. Summary of richness (number of species) per stand, total abundance
(number of individuals per trap week) per stand, and rarefaction-
estimated species diversity of click beetles for 1997-1998.......................22
Table 1.6. Pearson and Kendall correlations of click beetle species and
environmental variables with site locations along two NMS
ordination axes...........................................................................................23
Table 2.1. Tree basal area (m2/ha) for each stand for 2001 and 2002........................43
Table 2.2. General linear model results of click beetle species abundance for
2001 and 2002............................................................................................50
Table 2.3. Click beetle Jaccard assemblage similarity and rarefaction diversity
results between vegetation treatments for 2001.........................................51
Table 2.4. Click beetle Jaccard assemblage similarity and rarefaction diversity
results between vegetation treatments for 2002.........................................51
x
Table 2.5. Pearson and Kendall correlations of 2001 click beetle species
abundance, tree species basal area, and shrub species canopy width
with site locations along two NMS ordination axes..................................56
Table 2.6. Pearson and Kendall correlations of 2002 click beetle species
abundance, tree species basal area, and shrub species canopy width
with site locations along two NMS ordination axes..................................57
Table 3.1. General linear model results of click beetle species abundance for
Experiment 1 and Experiment 2................................................................80
Table 3.2. Summary of richness (number of species), total abundance
(number of individuals), and rarefaction-estimated species diversity
of click beetles for Experiment 1 (averaged by CWM type) and
Experiment 2..............................................................................................81
Table 3.3. Indicator species analysis of click beetle species for Experiment 1
and Experiment 2.......................................................................................82
Table A.1. Click beetle abundance per trap week for all species, stands,
and years..................................................................................................120
Table A.2. Click beetle richness and total abundance (per trap week) by year
and total between years............................................................................121
Table A.3. Summary of significant responses of click beetle species
richness to general linear models.............................................................122
Table A.4. Summary of significant responses of click beetle species
abundance to general linear models.........................................................122
xi
Table A.5. AIC comparisons between Stand and Height models for click
beetle species richness and species abundance........................................125
Table B.1. Total canopy width (m/ha) per stand of shrub and small tree
species for 2001 and 2002........................................................................127
Table B.2. Click beetle species abundance (total number of individuals within
each stand) for each cover type in 2001 and 2002...................................128
Table B.3. Results of Canonical Correspondence Analysis for 2001 and 2002
click beetle abundances with tree and shrub species...............................134
Table B.4. Inter-set correlations for two axes of four Canonical
Correspondence Analyses for Shrubs only or Shrubs & Trees for
2001 and 2002..........................................................................................135
Table B.5. Mineral Soil Types for each 2001 and 2001 site.....................................142
Table C.1. General linear model results of click beetle species abundance in
trap locations in gaps only for Experiment 1 and Experiment 2..............144
Table C.2. Abundance of the most common click beetle species by harvest
treatment, canopy condition, and decay class for CWM samples
in 2001 and 2002......................................................................................145
Table C.3. Summary of significant responses to general linear models of the
abundance of the most common click beetle species in all trap
locations...................................................................................................147
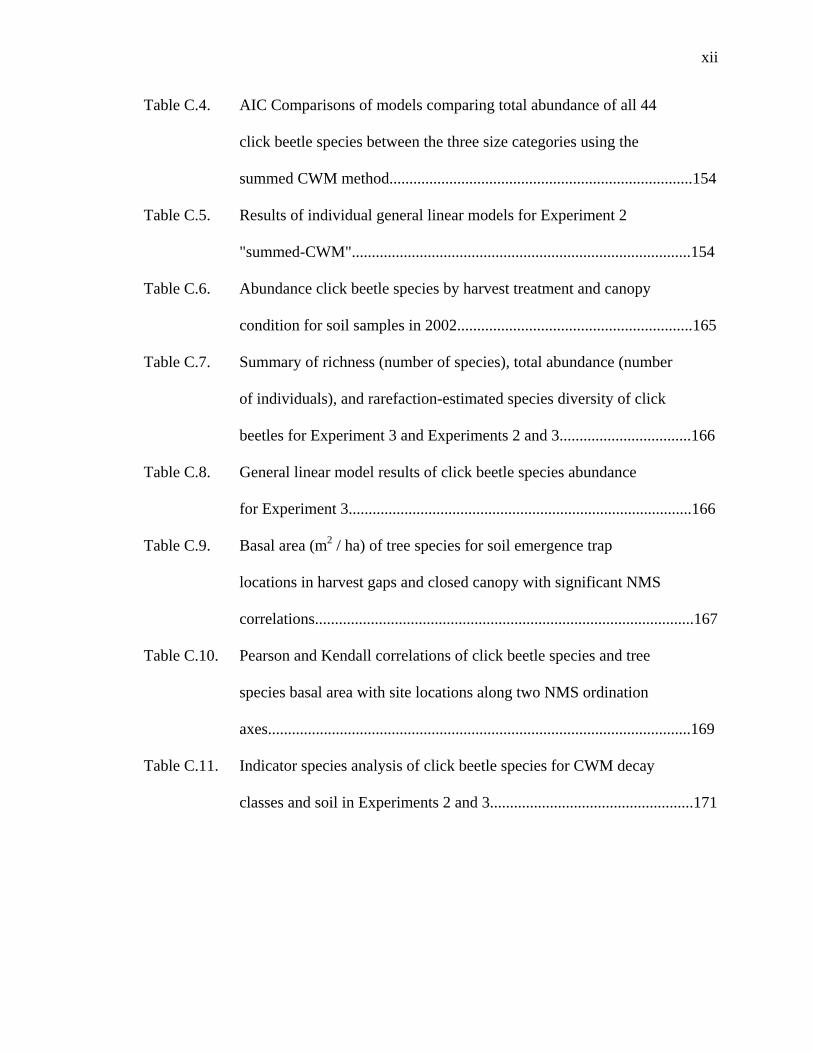
xii
Table C.4. AIC Comparisons of models comparing total abundance of all 44
click beetle species between the three size categories using the
summed CWM method............................................................................154
Table C.5. Results of individual general linear models for Experiment 2
"summed-CWM".....................................................................................154
Table C.6. Abundance click beetle species by harvest treatment and canopy
condition for soil samples in 2002...........................................................165
Table C.7. Summary of richness (number of species), total abundance (number
of individuals), and rarefaction-estimated species diversity of click
beetles for Experiment 3 and Experiments 2 and 3.................................166
Table C.8. General linear model results of click beetle species abundance
for Experiment 3......................................................................................166
Table C.9. Basal area (m2 / ha) of tree species for soil emergence trap
locations in harvest gaps and closed canopy with significant NMS
correlations...............................................................................................167
Table C.10. Pearson and Kendall correlations of click beetle species and tree
species basal area with site locations along two NMS ordination
axes..........................................................................................................169
Table C.11. Indicator species analysis of click beetle species for CWM decay
classes and soil in Experiments 2 and 3...................................................171
xiii
LIST OF FIGURES
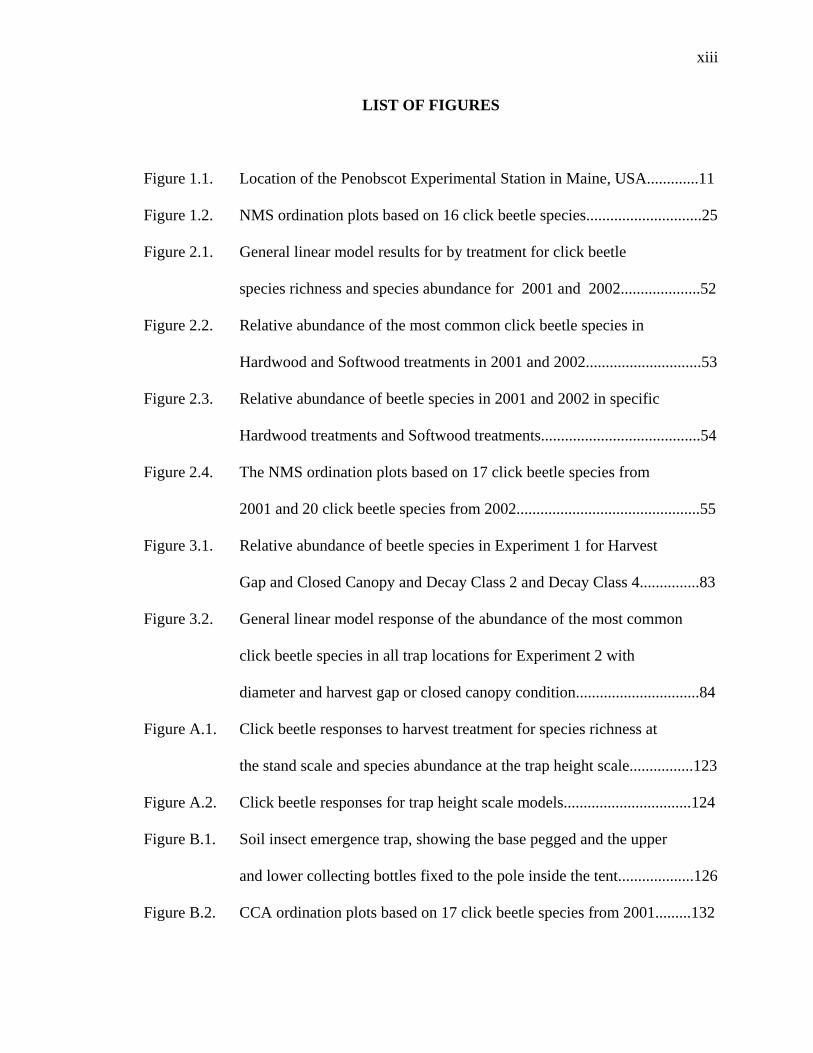
Figure 1.1. Location of the Penobscot Experimental Station in Maine, USA.............11
Figure 1.2. NMS ordination plots based on 16 click beetle species.............................25
Figure 2.1. General linear model results for by treatment for click beetle
species richness and species abundance for 2001 and 2002....................52
Figure 2.2. Relative abundance of the most common click beetle species in
Hardwood and Softwood treatments in 2001 and 2002.............................53
Figure 2.3. Relative abundance of beetle species in 2001 and 2002 in specific
Hardwood treatments and Softwood treatments........................................54
Figure 2.4. The NMS ordination plots based on 17 click beetle species from
2001 and 20 click beetle species from 2002..............................................55
Figure 3.1. Relative abundance of beetle species in Experiment 1 for Harvest
Gap and Closed Canopy and Decay Class 2 and Decay Class 4...............83
Figure 3.2. General linear model response of the abundance of the most common
click beetle species in all trap locations for Experiment 2 with
diameter and harvest gap or closed canopy condition...............................84
Figure A.1. Click beetle responses to harvest treatment for species richness at
the stand scale and species abundance at the trap height scale................123
Figure A.2. Click beetle responses for trap height scale models................................124
Figure B.1. Soil insect emergence trap, showing the base pegged and the upper
and lower collecting bottles fixed to the pole inside the tent...................126
Figure B.2. CCA ordination plots based on 17 click beetle species from 2001.........132
xiv
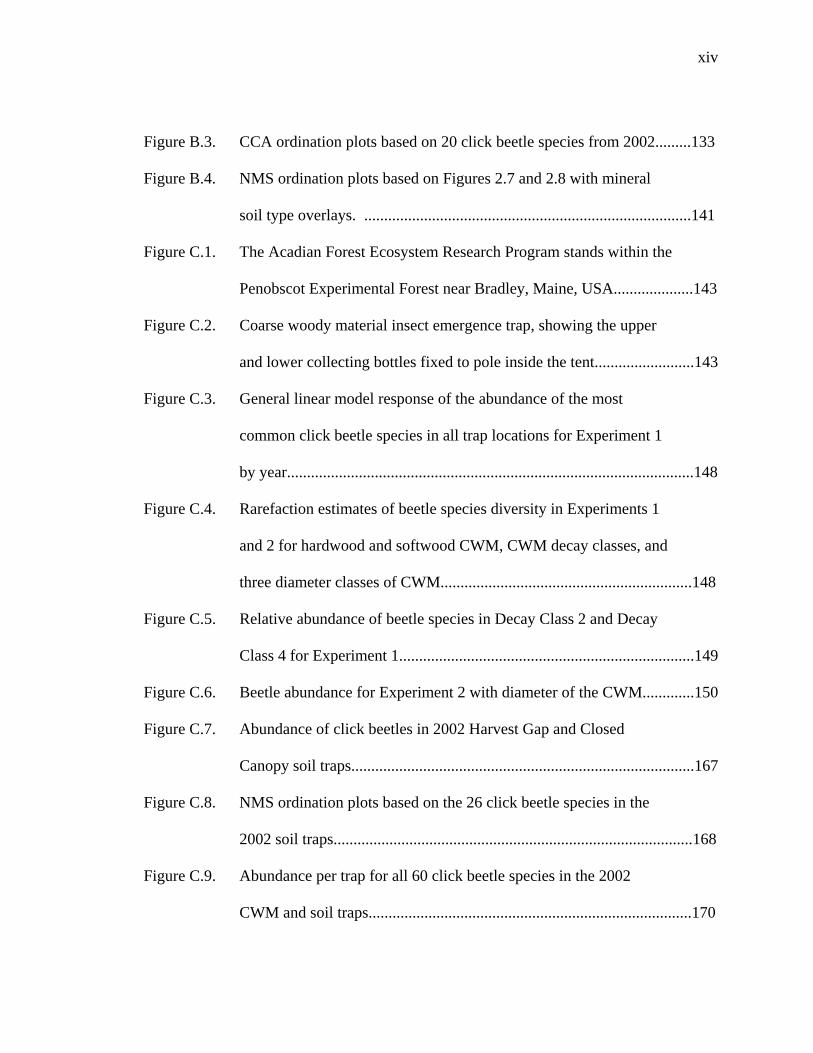
Figure B.3. CCA ordination plots based on 20 click beetle species from 2002.........133
Figure B.4. NMS ordination plots based on Figures 2.7 and 2.8 with mineral
soil type overlays. ..................................................................................141
Figure C.1. The Acadian Forest Ecosystem Research Program stands within the
Penobscot Experimental Forest near Bradley, Maine, USA....................143
Figure C.2. Coarse woody material insect emergence trap, showing the upper
and lower collecting bottles fixed to pole inside the tent.........................143
Figure C.3. General linear model response of the abundance of the most
common click beetle species in all trap locations for Experiment 1
by year......................................................................................................148
Figure C.4. Rarefaction estimates of beetle species diversity in Experiments 1
and 2 for hardwood and softwood CWM, CWM decay classes, and
three diameter classes of CWM...............................................................148
Figure C.5. Relative abundance of beetle species in Decay Class 2 and Decay
Class 4 for Experiment 1..........................................................................149
Figure C.6. Beetle abundance for Experiment 2 with diameter of the CWM.............150
Figure C.7. Abundance of click beetles in 2002 Harvest Gap and Closed
Canopy soil traps......................................................................................167
Figure C.8. NMS ordination plots based on the 26 click beetle species in the
2002 soil traps..........................................................................................168
Figure C.9. Abundance per trap for all 60 click beetle species in the 2002
CWM and soil traps.................................................................................170
xv
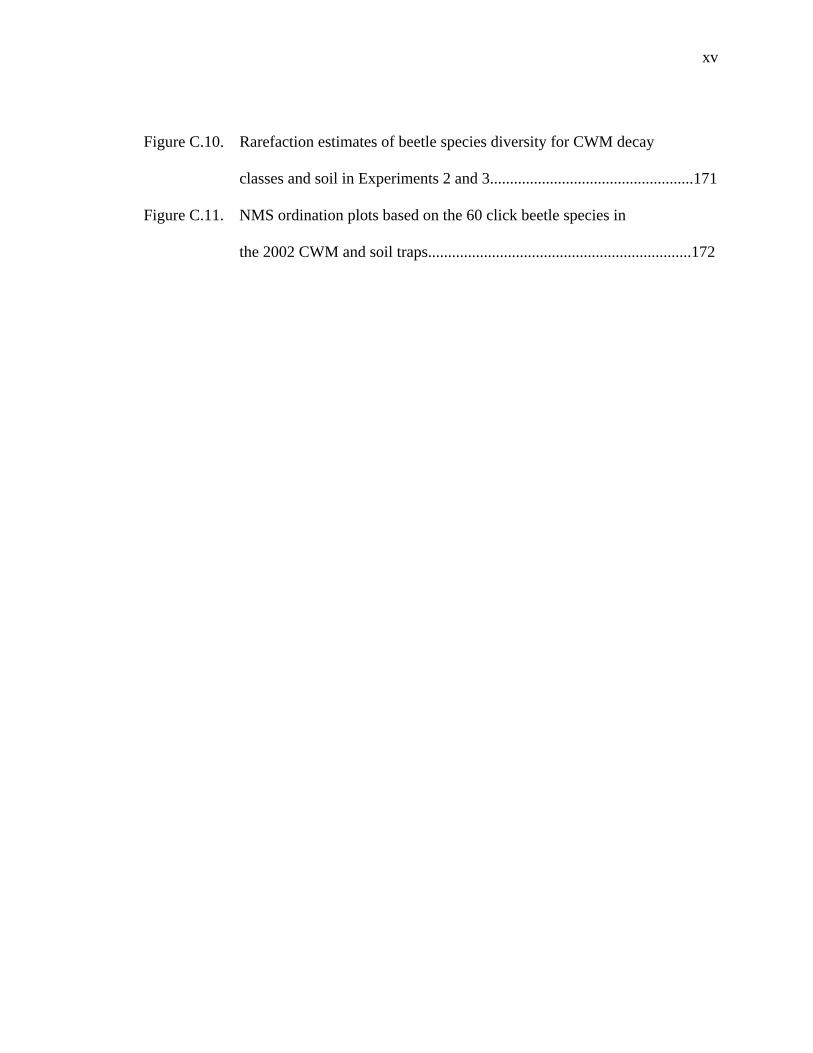
Figure C.10. Rarefaction estimates of beetle species diversity for CWM decay
classes and soil in Experiments 2 and 3...................................................171
Figure C.11. NMS ordination plots based on the 60 click beetle species in
the 2002 CWM and soil traps..................................................................172
PROLOGUE
I arrived in Maine with the goal of studying the effects of forest management on a
family of beetles. My overall research interests were motivated by questions about how
to use our natural resources (especially forest ecosystems) while still protecting and
caring for all the creatures that depend on these resources. My interests have paralleled
directions that conservation biology has taken over the last few decades, first in the
conservation of biodiversity in forests reserves and then in managed forests (Hunter
1999, Lindenmayer and Franklin 2002).
To meet this goal, we need to know which species exist in our forests and their
habitat preferences. This basic information is still largely unknown for the majority of
invertebrate species in North American temperate forests (Danks and Foottit 1989,
Carlton and Robison 1998). Insects are an important group to investigate because they
are highly diverse, far outnumbering other higher taxa (MEA 2005), and perform many
important functions in forest ecosystems (Crowson 1981, Wilson 1992). Because forest
management affects insect populations (Niemelä 1997, Grove 2002a), they can serve as
important indicators of ecological sustainability (Kremen et al. 1993, Taylor and Doran
2001). Coleoptera (beetles) is the largest order of insects and includes approximately
40% of all arthropods (Grove and Stork 2000), and Elateridae (click beetles) is the ninth
most biodiverse family of Coleoptera, with approximately 10,000 described and many
undescribed species (Johnson, 2002).
I find click beetles to be entertaining and quite lovely, so I was surprised to
discover that relatively little was known about most species of this family. Click beetles
are a delight to observe, both in the field and in the lab. Beyond their ability to snap
1
suddenly and propel themselves into the air, they may scamper rapidly or fly in dizzying
vertical circles at the first opportunity; other times they may tuck only their head in moss,
apparently to hide, leaving the rest of their body visible. These small creatures have
fascinating, minute details in their sclerites (the hardened parts of the exoskeleton),
antennae, and tarsal claws. The species have an amazing diversity of colors, shapes,
divots, and tufts of “hair” that are only visible under magnification; this is a constant
reminder of the infinite amount of diversity and activity occurring right under our noses
of which we have almost no knowledge or concept. Other scientists can have those ever
so commonly studied mammals, birds, and amphibians; I was blessed to have this
opportunity to study these little-known beetles!
Although some species of Elateridae are considered pests in agricultural systems,
this family does not cause serious damage to forest trees (Craighead 1950, Anderson
1960, and Williams 1985). The larvae live in soil or plant materials in various stages of
decomposition, including duff and deadwood- both upright snags and material on the
forest floor (Owen 1986, Kaila et al. 1997, Jacobs 2004). In soil they are omnivorous,
preying on insects or eating decaying plant materials; some species are herbivorous on
highly metabolic tissues, such as meristematic regions, sprouting seeds, or high sugar
content tubers (Johnson 2002 and personal communication). In wood they are often
predators of small invertebrates or saprophagous on decaying plant materials or other
saprophagous organisms like slime molds (Morris 1951, Wolters 1989, Johnson 2002).
Although many studies found that the larval stage can last up to six years (e.g. Miles
1942, Strey 1972), Johnson (personal communication) insisted that this extended life
span was due to faulty rearing conditions and that larvae take 1-3 years to develop,
2
depending on food availability and quality. Elaterid adults are common in temperate
forests, usually active in the afternoon and evening during the summer months. Many
species feed on plant parts (on floral parts, nectar, pollen, and decaying or overripe fruit,
or at glandular trichomes, extra-floral nectaries, and phloem weeps) or fungal fruiting
bodies, and some are predators on the soft bodies and honey-dew exudates of the insects
in suborder Sternorrhyncha (ex. psyllids, aphids, scale insects, and white flies) or
caterpillars and larvae of other insects (Balduf 1935, Morris 1951, Johnson 2002).
Click beetles are notable predators of forest insect pests (Morris 1951, Yano et al.
1984), prey for birds and other biota (Barron and Walley 1983, Holmes and Robinson
1981, Heinrich and Bell 1995), and mediators of nutrient cycling (Wolters 1989). Some
species are considered threatened or endangered (Anon. 1999, Alexander 2003, Zach
2003). Elaterids are valuable for forest biodiversity studies because the family is
numerically abundant and species rich, they can be collected using comparably simple
trapping methods, and the species have diverse food and habitat preferences. However,
the deficiency of detailed information regarding most species in this family is an
impediment to their conservation.
The knowledge of European species is much greater than for North American
species. Are there click beetles here that are dependent very specific habitats like large,
hollow trees as in Nilsson and Baranowski (1997)? Are there species that are ought to be
listed as endangered, like in Alexander (2003) and Zach (2003)? Are there larval
predators that clue in on the sex pheremones of its prey (Svensson et al. 2004)? Even just
the basics are still unknown. What species exist in the Acadian forest? Which ones are
common or uncommon? Do they have habitat preferences? How do our traditional
3
forest harvesting methods affect click beetle populations? Can we use forest resources
(harvest trees) in such a way that we still provide the habitat these species need? To
address these information gaps, three experiments were designed to examine click beetle
assemblages and habitat preferences for the species living in Maine’s Acadian forests, a
transitional ecotone between the eastern temperate and boreal forests.
In the first experiment, the effect of harvest systems (clearcut, shelterwood, and
selection) and stand characteristics (vegetation composition and structural diversity,
hardwood. softwood, and snag basal area, and coarse woody material volume) on click
beetle abundance and assemblage composition was investigated. Changes in the richness
and abundance of click beetles at various heights in the forest canopy were investigated
using flight-intercept traps. Because flight-intercept traps only capture flying adults that
have already emerged, it was not possible to identify where click beetles spend the
majority of their years as larvae. Adult beetles may disperse some distance from their
emergence points, but click beetle dispersal distances have not been widely studied (but
see Kishita et al. 2003 and Yamamura et al. 2003).
Based on findings and limitations from this first experiment, two additional
studies were designed to determine whether click beetle assemblages were related to the
composition of forest vegetation and the characteristics of deadwood within the stand.
To investigate these site-specific relationships, emergence traps were used in the
subsequent studies.
In the second study, the relation between click beetle assemblages emerging from
soil on sites dominated by common plant species in the Acadian forest (blueberry, aspen,
maple, birch, oak, spruce, fir, pine, fern, and/or hemlock) was examined. Of particular
4
interest was assessing whether dominant plant species affected the abundance and
composition of click beetle assemblages and whether specific species of click beetle had
any specific habitat preferences.
The third study focused on whether harvest gaps that were designed after patterns
of natural disturbance in the Acadian forest provided adequate habitat for click beetles,
thus providing for Elaterid diversity and abundance in managed forests. A unique aspect
of this study was examining whether the abundance and composition of click beetles
living in coarse woody material (CWM) were affected by gap harvesting and CWM
characteristics, including decay class, diameter, and wood type (softwood or hardwood).
I believe that results from the three studies described in the following dissertation
have significantly advanced our understanding about Elateridae occupying the Acadian
forest, as well as how management practices in this forest can potentially influence
assemblages and individual species of click beetles.
5
Chapter 1
EFFECT OF SILVICULTURAL METHODS AND ASSOCIATED
STAND CHANGES ON CLICK BEETLE (COLEOPTERA: ELATERIDAE)
ASSEMBLAGES IN THE MAINE REGION OF THE ACADIAN FOREST
1.1. Abstract
Click beetle (Coleoptera: Elateridae) communities were sampled using flight
intercept traps at 1, 3, 5, 7, 9, and 11 m above the ground in a long-term experiment
comparing clearcut, shelterwood, and selection silvicultural methods in the Acadian
forest of central Maine, USA. We used forest stand characteristics (vegetation
composition and structural diversity, hardwood and softwood basal area, and amount of
deadwood) to predict click beetle assemblages. Click beetle richness was highest in
stands managed under a selection system and lowest in stands regenerated using the
clearcut method. The abundance of click beetle species was lower in stands managed by
clearcutting than in stands managed using the shelterwood and selection methods.
Silviculural method was the best predictor of click beetle richness, however, hardwood
basal area was the best environmental predictor. Hardwood basal area was a better
predictor of click beetle species abundance than silvicultural method. Species richness
decreased with increasing height above the ground and was best predicted using relative
canopy height rather than absolute canopy height. Species abundance increased with trap
height in selection stands and decreased with trap height in clearcut and shelterwood
stands, but relative canopy height was a better predictor than trap height, suggesting click
beetle species respond to the forest canopy rather than absolute height above the ground.
6
Click beetle species composition varied with the forest stand characteristics, indicating
that differences in habitat characteristics created by different silvicultural methods
determined long-term differences in click beetle assemblages.
1.2. Introduction
The conservation of biodiversity has become a concern in management of natural
resources (Hunter 1999, Lindenmayer and Franklin 2002). Balancing this goal with
meeting human demands for wood requires that forest management be based on sound
ecological principles (Seymour and Hunter 1999, Lindenmayer and Franklin 2002).
Much of the Acadian forest, a transition ecoregion between the boreal spruce-fir forest to
the north and the deciduous eastern temperate forest to the south (Bailey 1995, Lorimer
and White 2003), is managed using traditional silvicultural methods and harvesting
techniques (Maine Forest Service 2005). Therefore, it is important to understand how
traditional silvicultural methods (such as clearcut, shelterwood, and selection harvesting)
influence biodiversity by creating forest stands of different compositional and structural
characteristics.
At least two thirds of the world’s terrestrial species inhabit forests (Salim and
Ullsten 1999), and these taxa are affected by changes in stand characteristics such as
vegetation composition, vertical structure, and the amount of deadwood. The
composition of forest vegetation can affect invertebrate assemblages through insect-plant
associations within a stand (Saetre et al. 1999, Paquin and Coderre 1997, and Ohsawa
2004). Tree species composition is closely related to vertical structure (Palik and
Engstrom 1999), and structural diversity is associated with the abundance, diversity or
7

richness of other species (Wilson 1974, Schowalter 1995, DeGraaf et al. 1998, and Walla
et al. 2004). Finally, the importance of deadwood, both dead-standing trees (snags) and
coarse woody material (CWM), has been recognized as vital for conserving biodiversity
in forests (Speight 1989, Elton 1966, Harmon et al. 1986, Lohr et al. 2002) because it
supports a wide variety of animals, fungi, and plants (Speight 1989, Lindenmayer and
Franklin 2002, Machmer 2002).
The method of forest harvesting and other silvicultural interventions can have a
strong influence on the long-term structure and composition of forest stands.
Regeneration methods such as clearcutting remove the entire stand in one operation to
produce future even-aged stands of desired composition (Smith et al. 1997). Shelterwood
cutting removes the entire stand in a succession of harvests to provide seed and shaded
micro-environments suitable for regenerating an even-aged stand when the overstory is
removed. Selection harvesting removes single trees or small groups of trees on a regular
cutting cycle to produce a continuous flow of regeneration, recruit trees into larger
diameter classes, and maintain an uneven-aged stand. All three harvest methods are used
to regenerate hardwood, mixedwood, or softwood stands in northern temperate forests.
Depending on how each of the methods is implemented across a forest landscape, various
patterns of stand composition and structure can be established. Unless it is designed into
the silvicultural system, all harvest systems can deplete snags and CWM through removal
of large living trees (potential CWM), stand preparation, and slash disposal (Fridman and
Walheim 2000). Different harvest methods can modify the distribution of size and decay
class of snags and CWM through the addition of small diameter slash and through the
8

mechanical crushing of larger pieces in late-stage decay (Freedman et al. 1996, Fraver et
al. 2002).
Harvesting affects the flora and fauna of a forest ecosystem, including insects, the
most plentiful and richest group of higher organisms (MEA 2005). Although many
important natural processes within forest ecosystems are facilitated by insects (Crowson
1981, Wilson 1992), most species are poorly understood (Danks and Foottit 1989).
Beetles (Coleoptera) are the largest order of insects and include approximately 40% of all
arthropods (Grove and Stork 2000). Elateridae (click beetles), including approximately
10,000 described and many undescribed species, is the ninth most biodiverse family of
Coleoptera (Johnson 2002).
Click beetles are well known as pests in agricultural systems, but many species
live in forest soil and deadwood without causing serious damage to living trees.
Moreover, click beetles have been shown to be beneficial as prey for birds and other
forest biota (Barron and Walley 1983, Holmes and Robinson 1988, Heinrich and Bell
1995), as predators of forest pests (Morris 1951, Yano et al. 1984), and as mediators of
nutrient cycling (Wolters 1989). Some species of click beetles have been determined to
be threatened or endangered (Anon. 1999, Alexander 2003, Zach 2003), but the paucity
of information regarding most species in this family (especially outside Europe) is an
impediment to their conservation. Elaterids are useful for studying the effects of forest
management on biodiversity because the many species have diverse habitat and food
preferences. In addition, the family is numerically abundant, species rich, and can be
sampled using relatively simple trapping methods.
9
In this study, we hypothesized that 1) long-term differences in the forest stand
development created by various silvicultural methods (such as clearcut, shelterwood, and
selection harvesting) in the Acadian forest would create varied click beetle assemblages
at different heights in the forest canopy and among silvicultural methods, and 2) stand
characteristics (vegetation structure, composition, deadwood, and relative canopy height)
would better predict click beetle assemblages than using silvicultural methods alone.
1.3. Methods
1.3.1. Study Site
This study took place in the Penobscot Experimental Forest (PEF) in east-central
Maine (44°50’ N, 68°35’ W, Figure 1.1). Dominant tree species in the forest included
softwoods such as red (Picea rubens Sarg.), white (P. glauca (Moench) Voss) and black
spruce (P. mariana (Mill.) B.S.P.), balsam fir (Abies balsamea (L.) Mill.), eastern white
pine (Pinus strobus L.), eastern hemlock (Tsuga canadensis (L.) Carr.), and northern
white cedar (Thuja occidentalis L.), and hardwoods such as red maple (Acer rubrum L.),
paper (Betula papyrifera Marsh.) and gray birch (B. populifolia Marsh.), and quaking
(Populus tremuloides Michx.) and bigtooth aspen (P. grandidentata Michx.). The PEF
has a complicated history of insect outbreaks and repeated partial cuttings that resulted in
multi-cohort stand structures of many species (R. Seymour, unpublished data). Soils
range from glacial till ridges with well-drained or sandy loams to flat areas between
ridges with poorly to very poorly drained loams and silt loams (Brissette 1996).
10
Stand Management System Acres Dates of Harvestc8 Commercial Clearcut 43.2 53, 83c22 Commercial Clearcut 33.8 57, 88s12 10-year Selection 31.1 54, 65, 75, 84, 94s20 10-year Selection 21.2 57, 67, 76, 86, 98s25 Crop Tree Selection 44.8 57, 77, 86, 95s26 10-year Selection 31 57, 64, 68, 73, 83, 93s52 15-year Selection 17.9 93w2 Irregular Shelterwood 47.9 51, 66, 84w7A 2-stage Shelterwood 29.4 69, 79w7B 2-stage Shelterwood 26 69, 79w21 2-stage Shelterwood 27.3 57, 67w23 3-stage Shelterwood 24.3 55, 66, 72; (PCT half stand) 81w29 3-stage Shelterwood 16.8 57, 68, 74; (PCT half stand) 83
Table 1.1. Silvicultural system, size, and dates of harvest of the stands studied in the Penobscot Experimental Forest. Stand titles: c = clearcut, s = selection, w = shelterwood.
11
Thirteen stands were selected in long-term research plots established by the
USDA Forest Service on the PEF (Sendak et al. 2003). All the stands were
approximately 10 ha in size and were created over a 50-year period following the
application of various silvicultural methods. Although there was some variability in
harvest dates and procedures used to apply the silvicultural methods among stands, we
divided the stands into those managed using clearcut, shelterwood, and selection methods
(Table 1.1). In the two stands where commercial clearcuts were applied, most or all
merchantable trees were removed with no plan for regeneration. The culls and
unmerchantable trees were left scattered or in patches.
The six stands that were shelterwood harvested in 2- or 3-stages produced a
single-age class of red spruce, balsam fir, and white pine. The shelterwood harvests
removed much of the overstory in one or two stages; a residual overstory was retained as
seed and shade trees to promote regeneration of softwood trees. Final overstory removal
occurred six to ten years later. Some shelterwood harvests included precommercial
thinning (PCT) of the regeneration to 2 x 3m spacing. In the irregular shelterwood cut,
half the stand was whole-tree harvested by hand-felling and cable skidding with advanced
regeneration protected (Kenefic, personal communication). The second half included
whole-tree harvesting and chipping on non-merchantable parts of the harvested trees that
destroyed advanced regeneration, but scarified the soil and resulted in pine-dominated
regeneration.
The five stands that have been continuously managed using three methods of
selection harvesting created uneven-aged stands. Single tree and group selection
harvesting used 10- or 15-year cutting cycles and produced stands dominated by red
12
spruce, eastern hemlock, and balsam fir in mixture with other softwood and hardwood
species. In the crop tree selection treatment, trees were released and additional trees
recruited by diameter limit cutting at 15-year intervals.
1.3.2. Measurements
1.3.2.1. Beetle Sampling
We sampled insects in the thirteen stands using non-baited flight intercept traps
designed to form a four-panel intercepting surface. Each trap was constructed with two
panes of clear plastic (approximately 60 cm tall x 44 cm wide) that were intersected in
the middle and perpendicular to one another. A funnel and collecting jar were attached at
the top and bottom of the intersecting panes. A 15 mm2 section of Vapona (2,2-
Dichlorovinyl dimethyl phosphate) was placed in each jar as a killing agent. Six traps
were suspended from nylon cord at heights of 1, 3, 5, 7, 9, and 11 m above the ground on
16.8 m high towers made of metal pipe. Two towers were installed (no less than 10 m
apart) near the center of each stand (26 towers total; see Su and Woods 2001 for a more
detailed description). We also used three pitfall traps and one malaise trap at each tower,
but very few click beetles were trapped by these methods; no analyses were performed on
these samples.
We extracted samples from the traps at approximately one-week intervals from
June 24 to August 21, 1997 and at two-week intervals from May 19 to August 18, 1998.
Because of uneven sampling effort due to weather-damaged traps, capture from each trap
was standardized to capture per trap week, and then summed between towers in each
stand. Insects were sorted to order and stored in 70% ethanol. Elaterid specimens were
13
identified to species, stored in alcohol or pinned, and incorporated into the University of
Maine Insect Collection. A reference collection for verification of species identification
was sent to E.C. Becker and Serge LaPlante in Ottawa, Ontario, Canada. All further
identifications were made by S. L. Thomas following the nomenclature of Dietrich
(1945) and Downie and Arnett (1996).
1.3.2.2. Vegetation Sampling
We measured overstory trees, understory vegetation, and deadwood in 1997 using
four 2 x 200 m belt transects (1,600 m2 total area) in each stand. Hardwood and
softwood basal area, vegetation species and structural diversity indices, and snag basal
area and CWM class volume indices (Table 1.2) were calculated to characterize the
structure and composition of the forest stands. To test the degree of colinearity among
these variables, Pearson’s correlations with Bonferonni probabilities were calculated for
all pairs of variables. No significant correlation was found (p > 0.05).
To quantify overstory trees greater than 2 cm DBH and 5 m height, we recorded
the species and measured DBH, lower canopy height, and upper canopy height. Mean
canopy length for the stand was calculated by summing the crown lengths at 3 m height
intervals for all trees by species . The basal area of hardwoods and softwoods were
calculated for each stand, and the density (numbers of stems per m2) was also calculated
for each understory species.
The Shannon diversity index (Hill 1973) was used to quantify plant species
diversity and stand structural diversity. Shannon's index was calculated as: H' = -Σ pi
ln(pi), where pi is a measure of relative abundance (proportion of S made up of the ith
species or canopy lengths), and i ranges from 1 to S. For plant species diversity, S =
14
number species occurring in a stand and pi = proportion of S made up of the ith species.
For stand structural diversity (overstory only), S = total canopy length across all species
at each height interval in each stand, and pi = proportion of S made up of the ith three
meter height interval. Relative canopy height was determined by dividing each trap
height by the mean height of the tallest 10% of trees in each stand.
To quantify deadwood, we measured the DBH and height of each snag located in
the transect. The length and the diameter of each piece of CWM > 4 cm diameter was
measured where they crossed the central transect. The decay condition of each snag and
piece of CWM was categorized into four decomposition classes following Fraver et al.
(2002). We calculated the basal area for each snag decay class. The total volume of
CWM pieces greater than 7 cm in diameter was calculated using the formula of Van
Wagner (1968): CWM Volume = (sum of diameters x π)2/8L, where L is the length of
transect. However, we tallied all logs rather than disregarding those described in Van
Wagner, so our measure was a volume index rather than an absolute volume. Click
beetles tend not to be found in fresh deadwood, so we analyzed only decay classes 2, 3,
and 4. The snag basal area was relatively low in each stand, so we summed classes 2-4.
1.3.3. Analytical Approach
We examined relationships between click beetle species abundance and the stand
variables (vegetation diversity, stand structural diversity, hardwood and softwood basal
area, and snag basal area and CWM volume index by decay class) by ordinating stands in
species-space with non-metric multidimensional scaling (NMS; Kruskal 1964) using PC-
ORD (McCune and Mefford 1999). NMS is an iterative ordination method based on
15
ranked distances between sample units. This method searches for low stress, measured
by the relationship between the ranked distances in the original multidimensional space
and the reduced dimensions produced by the ordination. NMS is an effective ordination
method for community data; it is robust to a large proportion of zero values and does not
assume normality (Clarke 1993, McCune and Grace 2002). In an initial NMS analysis,
we examined the relative positions of species and found little difference between years.
As a result, we pooled click beetle samples from both years for all click beetle species.
Random starting configurations and the quantitative version of the Sorensen distance
measure were used; the run with the lowest stress (14.6) was selected for the final
analysis. We assessed the dimensionality of six axes and selected two axes; both axes
had significant Monte Carlo test results (p < 0.05), and described 30.0% and 47.3% of the
variation in the click beetle assemblages. Subsequently, Pearson and Kendall
Correlations were compared between the ordination axes with the beetle species and the
stand variables, and joint-plotted these variables. A high correlation between any stand
variable and an NMS axis indicated a persuasive association between that variable with
the beetle species associated with the axis.
We assessed the relation between click beetle richness (total number of species)
and species abundance (abundance of each species per trap week) with stand variables
using linear models for each stand (stand scale) and for trap-height within each stands
(trap-height scale). At the stand scale, we derived elaterid richness from the summed
elaterid species abundances within each stand; we used year, harvest treatment, and stand
within harvest treatment as predictor variables. To determine which stand variables best
predicted the patterns, we substituted stand variables (vegetation species and stand
16
structural diversity, hardwood and softwood basal area, and snag basal area and CWM
volume) for harvest treatment and stands. At the trap-height scale, we based click beetle
richness and species abundances on data from each trap height within each stand; we
used year, harvest treatment, stand within harvest treatment, and trap heights as predictor
variables. To determine which trap-height variables best predicted the patterns, we
subsequently a exchanged height-related variable (relative canopy height) for trap
heights, harvest treatment, and stands. PROC GLM (SAS Institute 2000) was used for
the click beetle species richness models. Because the data were over-dispersed, PROC
GENMOD (SAS Institute 2000) with a negative binomial error distribution was used for
species abundance models of the sixteen most abundant click beetle species. We
generated models based on the main effects and their interactions, selecting a biologically
meaningful optimal model with the second order Akaike Information Criterion (Akaike
1974). Therefore, four models each of species richness and species abundance were
used- a harvest treatment model and environmental variable model for both the stand
scale and trap-height scale.
We examined the relation between the click beetle assemblages with the
following stand variables: vegetation diversity, stand structural diversity, hardwood and
softwood basal area, and snag basal area and CWM volume index by decay class. The
stands produced a range of results for each stand variable, so we arranged stands into two
groups (low and high) by sorting the stands and searching for the largest difference
between successive values. These groups were used to compare click beetle assemblage
measurements for each year individually and both years combined; the text description
17
refers to the total between years. We used a t-tests to determine differences in click
beetle richness and total abundance between stands.
Click beetle assemblage was measured using species richness, total abundance,
assemblage similarity, and diversity, as each addressed different aspects of beetle
assemblage. We used a cluster analysis of the Jaccard percent similarity measure,
calculated using internet-based software provided by Brzustowski (2002). Higher
percent similarity referred to greater overlap in species composition between the two
assemblages. Rarefaction takes into account both richness and abundance, so it can be
used as a measure of species diversity; herein we use “diversity” to refer to rarefaction-
estimated species richness. PAST (Hammer et al. 2001) was used to calculate the
expected number of species derived from random subsamples of the total abundance, and
compared species diversity between subsamples of similar sizes (Sanders 1968, Hurlbert
1971). We considered diversity between two groups of stands to be different when 95%
confidence intervals did not overlap.
1.4. Results
1.4.1. Beetle Taxa
We collected 2,823 click beetles of 60 different species, including two species (Isorhiphis
obliqua Say and Fornax canadensis Brown) from Eunemidae, the false click beetles
(Tables A.1 and A.2). Ctenicera triundulata Randall, Agriotes stabilis LeC., Ampedus
mixtus Herbst, and Sericus brunneus L. were the most common species, representing
52%, 9%, 5%, and 4% of the total abundance, respectively. Twelve species were
singletons, and 23 species were represented by only two to nine individuals. Click beetle
18
species abundance per trap week was 37% higher in 1997 than in 1998 (p = 0.013, Table
1.3, Table A.4).
1.4.2. Effect of Silvicultural Methods
At the stand scale, stands managed using the selection method contained 4.3 more
species of click beetles than in stands initiated by clearcutting (p = 0.016, Tables 1.3a and
A.3a, Figure A.1a). Model comparisons using AICc indicated that the best model
predicting click beetle species richness at the stand scale included silvicultural method
rather than any environmental variables (Table A.5a). At the trap-height scale, species
richness decreased with increasing trap height (p < 0.001, Tables 1.3c and A.3c and
Figure A.2a). However, model comparisons using AICc indicated that the best model
predicting click beetle species richness at the trap-height scale included relative canopy
height instead of silvicultural method and height (Table A.5b).
At the stand scale, click beetle species abundance per trap week was 194% and
264% higher in the shelterwood and selection stands, respectively, than in the clearcut
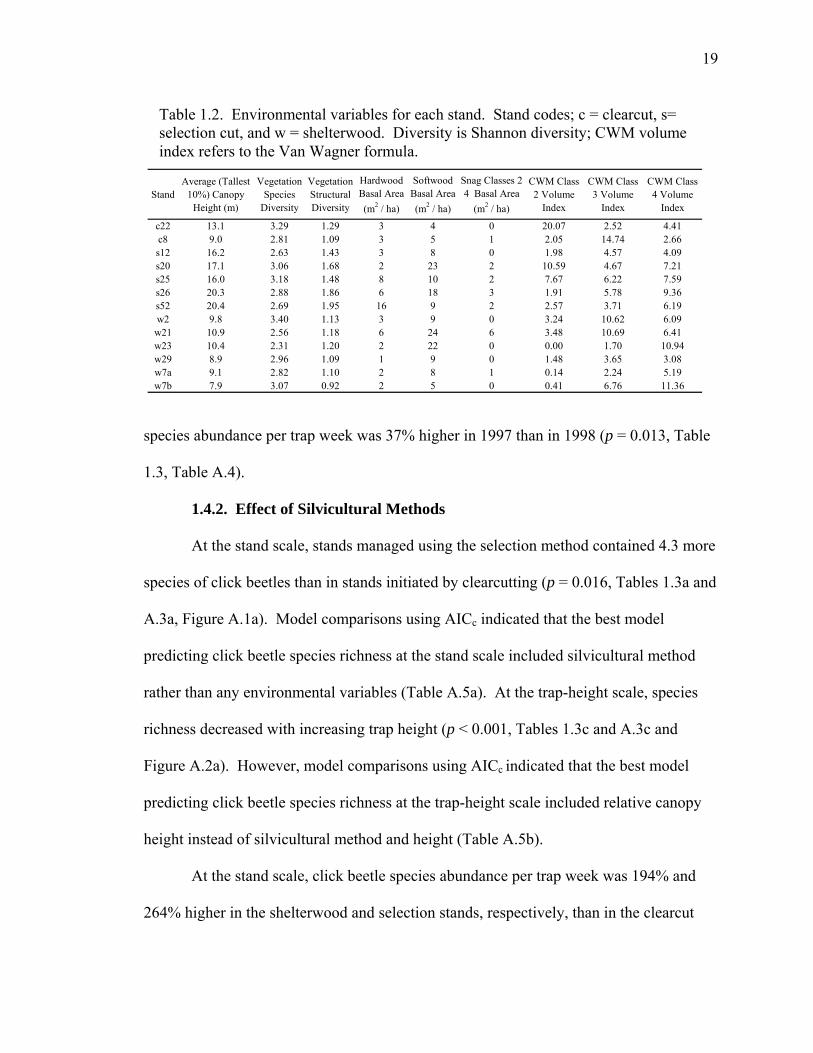
Table 1.2. Environmental variables for each stand. Stand codes; c = clearcut, s= selection cut, and w = shelterwood. Diversity is Shannon diversity; CWM volume index refers to the Van Wagner formula.
StandAverage (Tallest
10%) Canopy Height (m)
Vegetation Species
Diversity
Vegetation Structural Diversity
Hardwood Basal Area (m2 / ha)
Softwood Basal Area (m2 / ha)
Snag Classes 2-4 Basal Area
(m2 / ha)
CWM Class 2 Volume
Index
CWM Class 3 Volume
Index
CWM Class 4 Volume
Index
c22 13.1 3.29 1.29 3 4 0 20.07 2.52 4.41c8 9.0 2.81 1.09 3 5 1 2.05 14.74 2.66s12 16.2 2.63 1.43 3 8 0 1.98 4.57 4.09s20 17.1 3.06 1.68 2 23 2 10.59 4.67 7.21s25 16.0 3.18 1.48 8 10 2 7.67 6.22 7.59s26 20.3 2.88 1.86 6 18 3 1.91 5.78 9.36s52 20.4 2.69 1.95 16 9 2 2.57 3.71 6.19w2 9.8 3.40 1.13 3 9 0 3.24 10.62 6.09w21 10.9 2.56 1.18 6 24 6 3.48 10.69 6.41w23 10.4 2.31 1.20 2 22 0 0.00 1.70 10.94w29 8.9 2.96 1.09 1 9 0 1.48 3.65 3.08w7a 9.1 2.82 1.10 2 8 1 0.14 2.24 5.19w7b 7.9 3.07 0.92 2 5 0 0.41 6.76 11.36
19
stands (p < 0.001, Tables 1.4a and A.4a). However, model comparison with AICc
indicated that the best model predicting the abundance of click beetle species at the stand
scale included hardwood basal area (Table A.5c). NMS ordination separated stands
according to harvest treatment (Figure 1.2a), suggesting a correlation between the harvest
treatments and click beetle assemblages. At the trap-height scale, species abundance in
selection stands increased with trap height, while abundance in clearcut and shelterwood
stands decreased with increased trap height (p < 0.001, Tables 1.4c, A.4c, Figure A.2c).
Model comparisons using AICc indicated that the best model for click beetle species
abundance at the trap-height scale included relative canopy height (Table A.5d).
1.4.3. Effect of Vegetation
1.4.3.1. Relative Canopy Height
Model comparisons using AICc indicated that the strongest model predicting click
beetle species richness and species abundance at the trap-height scale contained relative
canopy height rather than silvicultural method and height (Table A.5b and d). Both
species richness (p < 0.001, Tables 1.3d, A.3d, Figure A.2b) and species abundance (p <
0.001, Tables 1.4d, A.4d, Figure A.2d) decreased with increasing relative canopy height.
1.4.3.2. Stand Structural and Vegetation Species Diversity
Click beetle species richness, total abundance, and diversity per trap week were
18% (p = 0.10), 19% (p = 0.10), and 19% (p = 0.05) higher in stands of high stand
structural diversity than in stands of low stand structural diversity, respectively (Table
1.5). Assemblage similarity, a measure of the overlap of species between groups of
stands, was 65%, indicating that 35% of the species were found only in stands of high
20
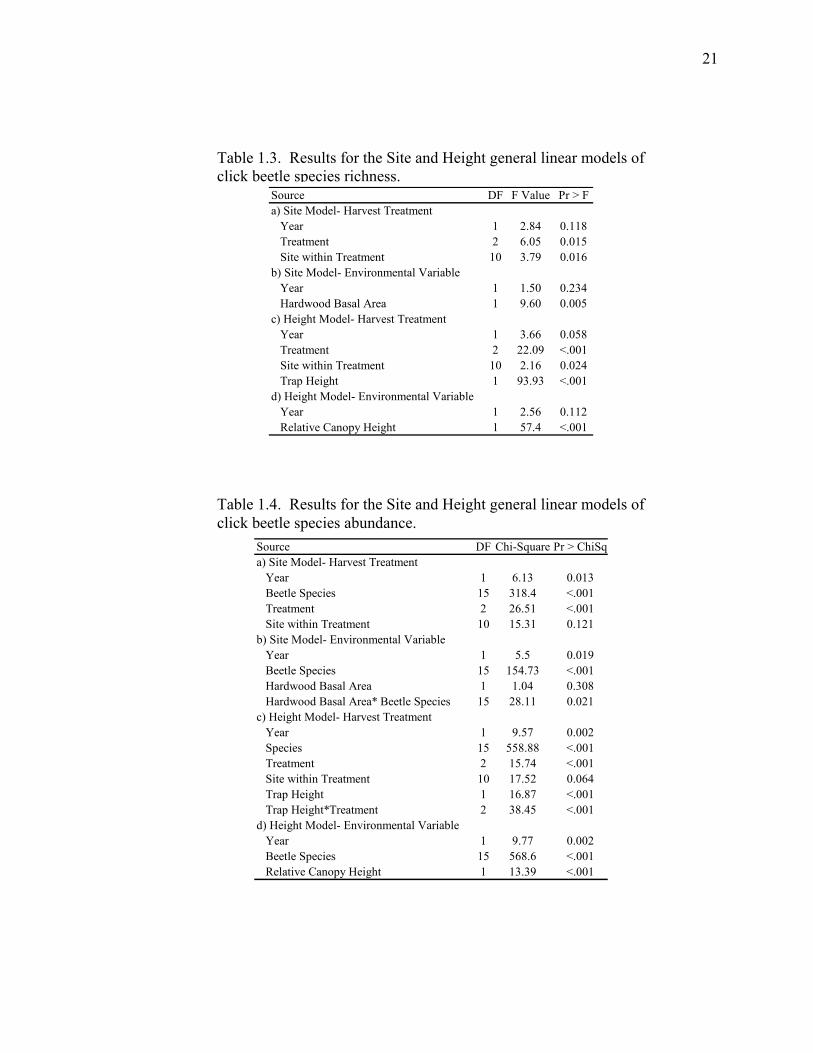
Source DF F Value Pr > Fa) Site Model- Harvest Treatment Year 1 2.84 0.118 Treatment 2 6.05 0.015 Site within Treatment 10 3.79 0.016b) Site Model- Environmental Variable Year 1 1.50 0.234 Hardwood Basal Area 1 9.60 0.005c) Height Model- Harvest Treatment Year 1 3.66 0.058 Treatment 2 22.09 <.001 Site within Treatment 10 2.16 0.024 Trap Height 1 93.93 <.001d) Height Model- Environmental Variable Year 1 2.56 0.112 Relative Canopy Height 1 57.4 <.001
Table 1.3. Results for the Site and Height general linear models of click beetle species richness.
Table 1.4. Results for the Site and Height general linear models of click beetle species abundance.
Source DF Chi-Square Pr > ChiSqa) Site Model- Harvest Treatment Year 1 6.13 0.013 Beetle Species 15 318.4 <.001 Treatment 2 26.51 <.001 Site within Treatment 10 15.31 0.121b) Site Model- Environmental Variable Year 1 5.5 0.019 Beetle Species 15 154.73 <.001 Hardwood Basal Area 1 1.04 0.308 Hardwood Basal Area* Beetle Species 15 28.11 0.021c) Height Model- Harvest Treatment Year 1 9.57 0.002 Species 15 558.88 <.001 Treatment 2 15.74 <.001 Site within Treatment 10 17.52 0.064 Trap Height 1 16.87 <.001 Trap Height*Treatment 2 38.45 <.001d) Height Model- Environmental Variable Year 1 9.77 0.002 Beetle Species 15 568.6 <.001 Relative Canopy Height 1 13.39 <.001
21
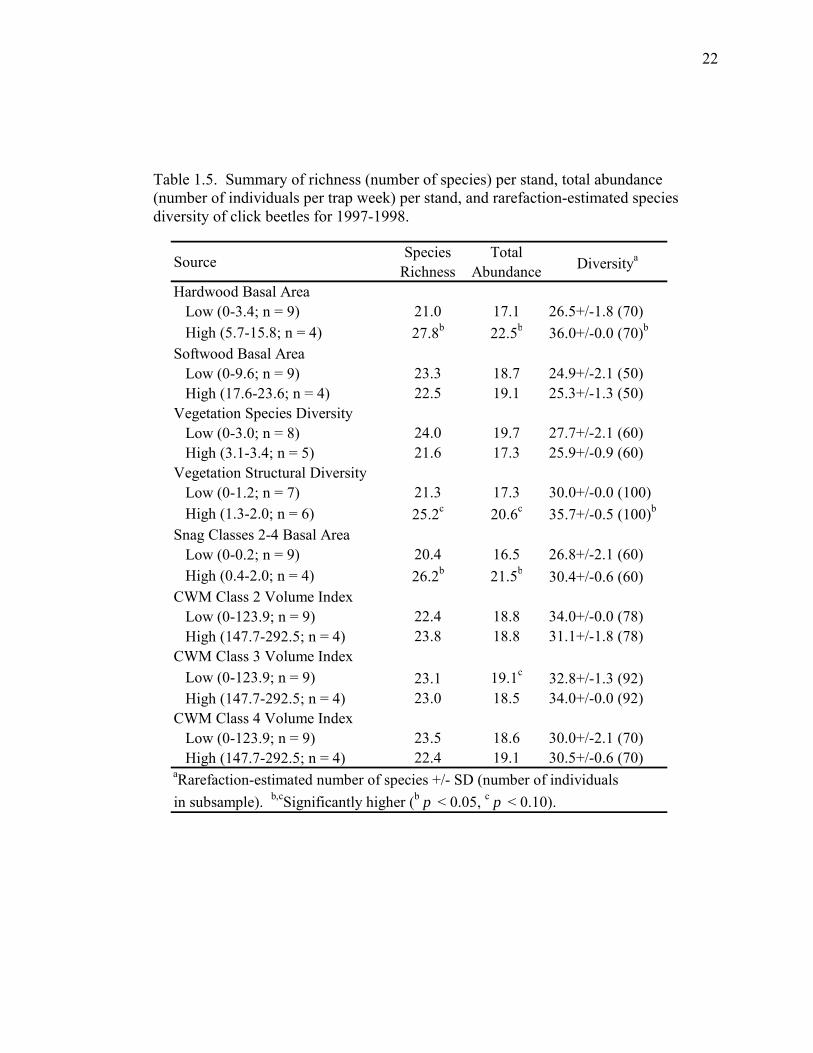
Table 1.5. Summary of richness (number of species) per stand, total abundance (number of individuals per trap week) per stand, and rarefaction-estimated species diversity of click beetles for 1997-1998.
Source Species Richness
Total Abundance Diversitya
Hardwood Basal Area Low (0-3.4; n = 9) 21.0 17.1 26.5+/-1.8 (70) High (5.7-15.8; n = 4) 27.8b 22.5b 36.0+/-0.0 (70)b
Softwood Basal Area Low (0-9.6; n = 9) 23.3 18.7 24.9+/-2.1 (50) High (17.6-23.6; n = 4) 22.5 19.1 25.3+/-1.3 (50)Vegetation Species Diversity Low (0-3.0; n = 8) 24.0 19.7 27.7+/-2.1 (60) High (3.1-3.4; n = 5) 21.6 17.3 25.9+/-0.9 (60)Vegetation Structural Diversity Low (0-1.2; n = 7) 21.3 17.3 30.0+/-0.0 (100) High (1.3-2.0; n = 6) 25.2c 20.6c 35.7+/-0.5 (100)b
Snag Classes 2-4 Basal Area Low (0-0.2; n = 9) 20.4 16.5 26.8+/-2.1 (60) High (0.4-2.0; n = 4) 26.2b 21.5b 30.4+/-0.6 (60)CWM Class 2 Volume Index Low (0-123.9; n = 9) 22.4 18.8 34.0+/-0.0 (78) High (147.7-292.5; n = 4) 23.8 18.8 31.1+/-1.8 (78)CWM Class 3 Volume Index Low (0-123.9; n = 9) 23.1 19.1c 32.8+/-1.3 (92) High (147.7-292.5; n = 4) 23.0 18.5 34.0+/-0.0 (92)CWM Class 4 Volume Index Low (0-123.9; n = 9) 23.5 18.6 30.0+/-2.1 (70) High (147.7-292.5; n = 4) 22.4 19.1 30.5+/-0.6 (70)aRarefaction-estimated number of species +/- SD (number of individualsin subsample). b,cSignificantly higher (b p < 0.05, c p < 0.10).
22
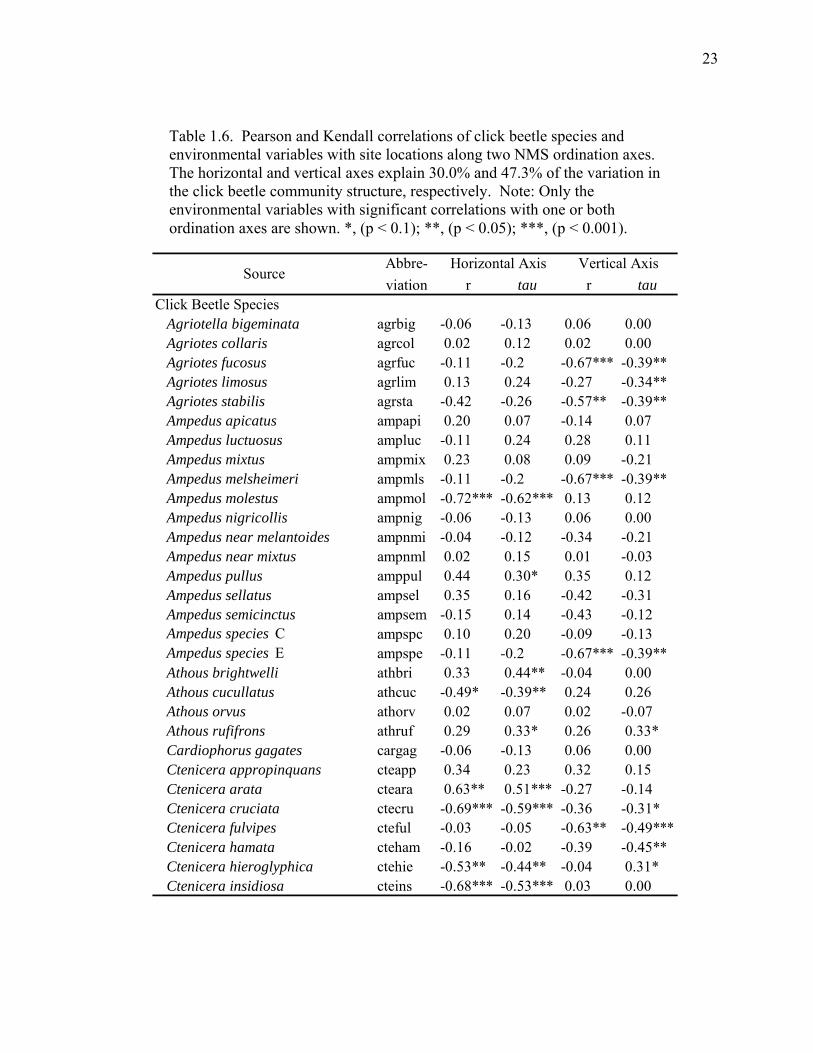
Table 1.6. Pearson and Kendall correlations of click beetle species and environmental variables with site locations along two NMS ordination axes. The horizontal and vertical axes explain 30.0% and 47.3% of the variation in the click beetle community structure, respectively. Note: Only the environmental variables with significant correlations with one or both ordination axes are shown. *, (p < 0.1); **, (p < 0.05); ***, (p < 0.001).
Abbre-viation r tau r tau
Click Beetle Species Agriotella bigeminata agrbig -0.06 -0.13 0.06 0.00 Agriotes collaris agrcol 0.02 0.12 0.02 0.00 Agriotes fucosus agrfuc -0.11 -0.2 -0.67*** -0.39** Agriotes limosus agrlim 0.13 0.24 -0.27 -0.34** Agriotes stabilis agrsta -0.42 -0.26 -0.57** -0.39** Ampedus apicatus ampapi 0.20 0.07 -0.14 0.07 Ampedus luctuosus ampluc -0.11 0.24 0.28 0.11 Ampedus mixtus ampmix 0.23 0.08 0.09 -0.21 Ampedus melsheimeri ampmls -0.11 -0.2 -0.67*** -0.39** Ampedus molestus ampmol -0.72*** -0.62*** 0.13 0.12 Ampedus nigricollis ampnig -0.06 -0.13 0.06 0.00 Ampedus near melantoides ampnmi -0.04 -0.12 -0.34 -0.21 Ampedus near mixtus ampnml 0.02 0.15 0.01 -0.03 Ampedus pullus amppul 0.44 0.30* 0.35 0.12 Ampedus sellatus ampsel 0.35 0.16 -0.42 -0.31 Ampedus semicinctus ampsem -0.15 0.14 -0.43 -0.12 Ampedus species C ampspc 0.10 0.20 -0.09 -0.13 Ampedus species E ampspe -0.11 -0.2 -0.67*** -0.39** Athous brightwelli athbri 0.33 0.44** -0.04 0.00 Athous cucullatus athcuc -0.49* -0.39** 0.24 0.26 Athous orvus athorv 0.02 0.07 0.02 -0.07 Athous rufifrons athruf 0.29 0.33* 0.26 0.33* Cardiophorus gagates cargag -0.06 -0.13 0.06 0.00 Ctenicera appropinquans cteapp 0.34 0.23 0.32 0.15 Ctenicera arata cteara 0.63** 0.51*** -0.27 -0.14 Ctenicera cruciata ctecru -0.69*** -0.59*** -0.36 -0.31* Ctenicera fulvipes cteful -0.03 -0.05 -0.63** -0.49*** Ctenicera hamata cteham -0.16 -0.02 -0.39 -0.45** Ctenicera hieroglyphica ctehie -0.53** -0.44** -0.04 0.31* Ctenicera insidiosa cteins -0.68*** -0.53*** 0.03 0.00
SourceHorizontal Axis Vertical Axis
23
Table 1.6 continued. Abbre-viation r tau r tau
Click Beetle Species Ctenicera mediana ctemed -0.21 -0.24 0.08 -0.04 Ctenicera nitidula ctenit 0.27 0.37** 0.06 0.02 Ctenicera propola ctepro -0.48* -0.33* -0.67*** -0.62*** Ctenicera resplendens cteres 0.22 0.17 0.26 0.26 Ctenicera rufopleuralis cteruf 0.39 0.24 0.52** 0.42* Ctenicera spinosa ctespi -0.38 -0.10 -0.03 -0.10 Ctenicera tarsalis ctetar -0.11 -0.20 -0.67*** -0.39** Ctenicera triundulata ctetri 0.47* 0.46** -0.35 -0.28* Dalopius species dalspp 0.39 0.26 -0.05 0.03 Danosoma brevicornis danbre -0.26 -0.08 0.37 0.14 Danosoma obtectus danobt 0.10 0.13 0.07 0.07 Denticollis denticornis denden -0.61** -0.57*** -0.47* -0.34** Drasterius debilis dradeb 0.68*** 0.39** 0.12 0.13 Elathous dicalceatus eladic 0.18 0.20 -0.26 -0.37** Fornax canadensis forcan -0.20 -0.15 -0.66*** -0.53*** Isoriphis obliqua isoobl 0.12 0.10 -0.51** -0.33* Lacon auroratus lacaur 0.15 0.26 -0.31 -0.33* Limonius aeger limaeg 0.42 0.37** 0.00 0.06 Limonius confusus limcon 0.11 0.07 -0.37 -0.07 Melanotus castanipes melcas 0.38 0.19 -0.51* -0.64*** Melanotus hyslopi melhys -0.21 -0.29* 0.17 0.15 Melanotus sagitarius melsag -0.06 -0.13 0.06 0.00 Melanotus similis melsim -0.24 -0.26 0.15 -0.02 Melanotus species melspe -0.16 -0.02 0.00 0.02 Microhypnus striatulus micstr -0.23 -0.16 0.14 0.16 Oxygonus montanus oxymon -0.17 -0.14 -0.80*** -0.65*** Oxygonus obesus oxyobe -0.11 -0.2 -0.67*** -0.39** Sericus brunneus serbru -0.19 ' 0.03 -0.45* -0.39** Sericus honesticus serhon -0.34 -0.36** -0.71*** -0.56*** Sericus viridanus servir -0.06 -0.05 -0.63** -0.47**Environmental Variables Vegetation Species Diversity VSTRH 0.00 0.03 0.65*** -0.51*** Vegetation Structural Diversity VSPPH 0.31** -0.28* 0.07 0.10 Hardwood Basal Area HARD 0.06 -0.13 0.45*** -0.10 Softwood Basal Area SOFT 0.51*** 0.39** 0.00 0.00 CWM Class 3 CWD2 0.13 -0.05 0.22* 0.18 CWM Class 4 CWD4 0.38** 0.46** 0.02 -0.18
SourceHorizontal Axis Vertical Axis
24
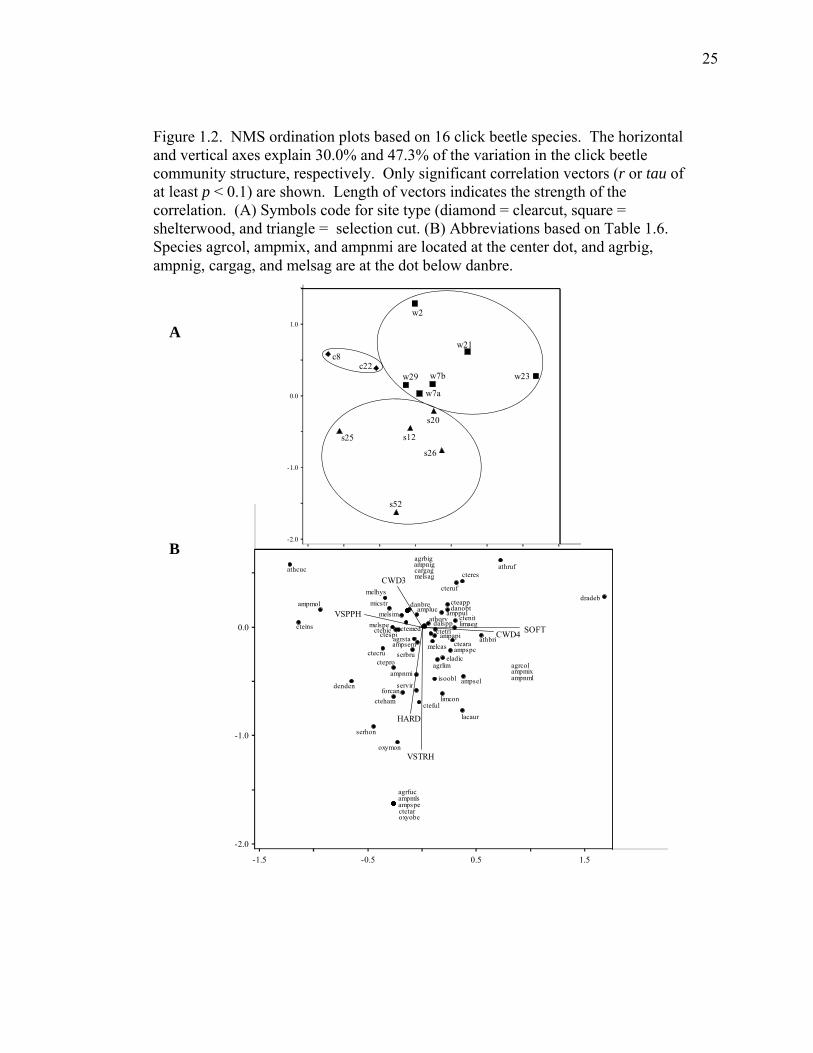
s12
w2
s20
w21
c22w23
s25
s26
w29
s52
w7a
w7b
c8
-1.5
-2.0
-0.5 0.5 1.5
-1.0
0.0
1.0
s12
w2
s20
w21
c22w23
s25
s26
w29
s52
w7a
w7b
c8
-1.5
-2.0
-0.5 0.5 1.5
-1.0
0.0
1.0
Figure 1.2. NMS ordination plots based on 16 click beetle species. The horizontal and vertical axes explain 30.0% and 47.3% of the variation in the click beetle community structure, respectively. Only significant correlation vectors (r or tau of at least p < 0.1) are shown. Length of vectors indicates the strength of the correlation. (A) Symbols code for site type (diamond = clearcut, square = shelterwood, and triangle = selection cut. (B) Abbreviations based on Table 1.6. Species agrcol, ampmix, and ampnmi are located at the center dot, and agrbig, ampnig, cargag, and melsag are at the dot below danbre.
A
B
ampmls
ampnig
ampspc
ampspe
athcuc
athorv
athrufcargag
ctetar
danobt
lacaur
melsag
agrbig
athbri
cteins
dradebmelhys
oxyobe
agrfuc
ampmol
ampnmi
cteham
melspe
limcon
micstr
cteres
denden
serhon
ampsel
agrlim
cteful
eladic
ctenit
forcan
isoobl
melsim
ampapi
agrcol
servir
cteapp
cteruf
ampnml
ctespi
ctecru
oxymon
cteara
limaeg
danbre
ctehie
ampluc
ctepro
ctemed
melcas
dalspp
ampsem
amppul
serbru
ampmix
agrstactetri
HARD
SOFT
VSPPH
VSTRH
CWD3
CWD4
-1.5
-2.0
-0.5 0.5 1.5
-1.0
0.0
25
structural diversity or only in stands of low structural diversity. Beetle assemblage
similarity was 65% between stands of low and high vegetation species diversity. Stand
structural diversity was correlated with the horizontal axis of the NMS ordination and
associated with the 17 beetle species correlated with that axis; vegetation diversity was
correlated with the vertical axis and associated with the 25 beetle species correlated with
that axis (Table 1.6, Figure 1.2b).
1.4.3.3. Basal Area of Hardwoods and Softwoods
Model comparisons using AICc indicated that the best model for click beetle
species richness at the stand scale contained silvicultural method; however, the best
model of environmental variables included basal area of hardwoods (Table A.5a).
Furthermore, model comparisons using AICc suggested that the best model predicting
click beetle species abundance at the stand scale included hardwood basal area rather
than silvicultural method (Table A.5c). Click beetle richness increased with hardwood
basal area (p = 0.005, Tables 1.3b, A.3b, Figure A.2e). The abundance of three click
beetle species (A. semicinctus, Ctenicera hieroglyphica Say, and Oxygonus montanus
Schaeffer) increased with hardwood basal area (p = 0.021, Table 1.4b and A.4b, Figure
A.2f).
Click beetle species richness, total abundance, and diversity per trap week were
32%, 31%, and 36% higher in stands of high hardwood basal area than in stands of low
hardwood basal area, respectively (p = 0.05, Table 1.5). Beetle assemblage similarity
was 63% between stands of high and low hardwood basal area and 62% between stands
of high and low softwood basal area. Hardwood basal area was correlated with the NMS
vertical axis and the associated 25 click beetle species, and softwood basal area was
26
correlated with the horizontal axis and the associated 17 click beetle species (Table 1.6,
Figure 1.2b).
1.4.4. Effect of Deadwood Conditions
1.4.4.1. Snag Classes 2-4
Click beetle species richness and total abundance per trap week were 28% and
31% higher in stands of high snag basal area than in stands of low snag basal area,
respectively (p = 0.05, Table 1.5). Click beetle assemblage similarity was 65% between
stands of low and high snag basal area, indicating a difference in beetle species
composition among the stands.
1.4.4.2. CWM Classes 2, 3, and 4
Click beetle total abundance per trap week was 3% higher in stands of high decay
class 3 CWM volume than in stands of low decay class 3 CWM (p = 0.10, Table 1.5).
Beetle assemblage similarity was 62%, 63%, and 67% between stands of low and high
decay class 2, 3, and 4 CWM volume, respectively. The volume of decay class 3 CWM
was correlated with the NMS vertical axis and the associated 25 click beetle species, and
the volume of decay class 4 CWM was correlated with the horizontal axis and the
associated 17 click beetle species (Table 1.6, Figure 1.2b).
1.5. Discussion
This study demonstrated that the species richness and abundance of click beetles
differed among stands created by clearcut, shelterwood, and selection silvicultural
methods in the Acadian forest of Maine. The primary factors affecting differences in the
27
click beetle richness and abundance among stands that were managed using different
methods appeared to be associated with differences in relative canopy height and the
presence of hardwoods. Vegetation composition, stand structural diversity, and amount
of deadwood were also important stand characteristics determining habitat suitability for
individual species of click beetles.
1.5.1. Effect of Silvicultural Methods
Management practices have been previously shown to affect insect assemblages
in forest stands (Niemelä 1997, Grove 2002a). We found that silvicultural method was a
better predicted click beetle richness than any of the environmental variables. However,
hardwood basal area was a better predictor of click beetle species abundance than
silvicultural method. Species richness of click beetles was higher in stands developed
from repeated selection harvesting than clearcut harvesting. Species abundance of click
beetles was lower in stands created by clearcutting than in either shelterwood or selection
harvesting. These differences among harvest treatments were supported by the NMS
ordination that separated harvest treatments based on the abundance of each click beetle
species.
Su and Woods (2001) also found differences among silvicultural methods for
Elateridae in a study based on a similar experimental design using some of the stands
sampled in this study. In several cases, more than one elaterid species were grouped into
a single morphospecies, and several individual species were separated into two
morphospecies. As a result, findings by Su and Woods (2001) are difficult to compare
with our study, where all Elateridae specimens were identified to species. Three
28
morphospecies (O. montanus, Ctenicera fulvipes Bland, and one morphospecies of A.
stabilis) were associated with selection harvested stands, three morphospecies (A.
semicinctus, C. triundulata, a second morphospecies of A. stabilis, and one of the
morphospecies of A. mixtus) were associated with stands that developed following
clearcutting, and one morphospecies (made up of at least two species, A. mixtus and
Ampedus pedalis Germar) was associated with shelterwood harvested stands. However,
the models that best predicted species abundance did not included an interaction term
between click beetle species abundances and silvicultural method; therefore we did not
test for specific species differences among silvicultural methods.
Studies of other invertebrate taxa have found varied results depending on the taxa
and forest management treatments. For example, ground beetles (Coleoptera: Carabidae)
are commonly studied as indicators of ecosystem perturbations. In many instances,
clearcutting appears to increase carabid species richness, abundance, and/or diversity
(Jennings et. al. 1986, Beaudry et al. 1997, Heliola et al. 2001, Koivula 2002). On the
other hand, Moore et al. (2004) found no significant effect of selective cutting (6-8 years
after treatment) or strip clear-cutting (12-13 years after treatment) on carabids in northern
hardwoods stands. Other beetle taxa often have differing results. For example, even 30-
80 years after a clearcut, longicorn beetle (Coleoptera: Cerambycidae and Disteniidae)
richness was lower than in uncut conifer and evergreen broad-leaved forests (Maeto et al.
2002). Sippola et al. (2002) found that an old-growth pine forest had lower overall beetle
richness than a one year-old selection cut and lower non-saproxylic richness than a 15
year-old selection cut. No difference in overall beetle richness was found between the
old-growth sites and the clearcut, but rare saproxylic beetle species were much lower in
29
the clearcut than in the old growth. The authors accounted for these differing results by
different habitat requirements among species. For example, the higher richness or
abundance in clearcut areas was often due to disturbed regions hosting open-habitat
species that did not penetrate into the forest, but species that require deeper forest were
reduced in disturbed habitats.
Click beetle larvae (called wireworms) are well-known as agricultural and
grassland (i.e., open habitat) pests. One might therefore expect, as with many carabid
species, that a forest disturbance (such as clearcuts) might result in increased richness and
abundance. In our study, however, species richness and species abundance were lowest
in stands created by clearcutting, and species richness was highest in stands that had been
created from repeated selection harvesting. This result suggests that differing responses
among species of click beetles may be attributed to forest stand characteristics and
species-specific requirements, rather than from a simple dichotomy between open versus
forested habitat. Furthermore, we found environmental variables to be better predictors
of click beetle richness and abundance than silvicultural method. This result may reflect
the fact that varying degrees of environmental variables (such as hardwood basal area,
stand structure, and deadwood content) can be achieved through using different
silvicultural approaches.
1.5.2. Influence of Vegetation
1.5.2.1 Canopy Height
Many studies have demonstrated a change in insect species assemblage with
height in or near forests (Rodgers and Kitching 1998, Fermon et al. 2003, Schowalter and
30
Zhang 2005), likely due to dispersal barriers, habitat requirements, management
practices, and differences in tree species in the overstory and understory. In our study,
click beetle abundance in selection stands increased with trap height, while abundance in
clearcut and shelterwood stands decreased with trap height; however, click beetle species
richness and species abundance decreased with relative canopy height. This result
suggested that click beetles were responding to the canopy rather than simply to height
above the ground.
Su and Woods (2001) also found differences among heights for Elateridae in the
study discussed above. Recognizing the limitations of the groups of morphospecies,
three morphospecies (later identified by S.L. Thomas from the reference collection as A.
stabilis, A. semicinctus, and several Melanotus species) were consistently more abundant
in upper traps among silvicultural treatments (clearcut, shelterwood, and selection), and
one morphospecies (O. montanus) was consistently more abundant in lower traps. Four
morphospecies (C. triundulata, Dalopius spp. Brown, several Melanotus species, and one
of the A. mixtus morphospecies- formerly A. rubricus) were more abundant in the lower
traps than the upper traps, but this difference depended upon the type of silvicultural
method. The change among silvicultural method likely corresponded to differences in
canopy height resulting from the patterns of harvest, which would corroborate our finding
about the importance of relative canopy height.
Boiteau et al. (2000), however, indicated that click beetles responded to absolute
height rather than canopy height, as there was no overstory canopy in their study. They
examined Carabidae and Elateridae vertical flight distribution above a 0.22 ha meadow,
surrounded by a forest on one side (at approximately 130 m from the traps) and field
31
crops on all other sides. While Carabidae and Elateridae abundance decreased with
height, many species were caught in the highest traps (14.3 m), and the authors concluded
that flights for these species extended above the highest traps. Eight species of Elateridae
were caught in sufficient numbers to establish vertical distribution profiles; the intercept
varied among the species, demonstrating that, although they all decreased in numbers
with height, the vertical profile varied among species. Of the 46 species of Elateridae
collected, 32 species were also found in our study.
There are various reasons why adult click beetles may be found in the canopy.
Click beetle adults may be actively dispersing to find new territory; Yamamura et al.
(2003) found a mean dispersal distance of over 140m, and Boiteau et al. (2000) trapped
click beetles at 14.3m off the ground. They may use vertical flight for escape. Click
beetle adults may also be occupying the canopy to search for food, as some species of
adults feed on aphid honeydew, aphids, other herbivores, or flower nectar or pollen
(Yano et al. 1984, Johnson 2002).
1.5.2.2. Stand Structural Diversity
In our study, click beetle richness, abundance, and diversity were higher in stands
of high stand structural diversity, and there were differences in species composition
among stands. Seventeen species of Elateridae were correlated with increased stand
structural diversity. It may be that some species of click beetles responded to the
increased habitat provided by greater amounts of vegetation structure. This suggestion
may be supported by Linit et al. (1986) in a study of insects inhabiting 80 year-old
northern red oak (Quercus rubra) stands that had been harvested (clearcut or thinned) and
32
replaced with red oak seedlings. They collected adults of a click beetle (Limonius spp.)
on red oak (Quercus rubra) seedlings, but did not capture any adults emerging from soil.
Therefore, this species likely dispersed to these sites as adults. All of the specimens were
collected in the partial cut rather than in the clearcut, suggesting that adults preferred
greater vegetation structure.
Structural diversity in forest stands is often related to canopy height, with taller
stands providing more diverse stand structures and foliage, and therefore more structural
complexity (Brokaw and Lent 1999). Even- and uneven-aged silvicultural methods, such
as shelterwood and selection systems, alter canopy structure by affecting the amount and
distribution of foliage. As a result, silvicultural practices can directly and indirectly
influence invertebrates through the vertical placement of food and shelter, and by
affecting microclimate and prey items (Pettersson 1996, Phillips and Cobb 2005). For
example, Hamer et al. (1997) rated forest stands according to forest structure (measured
primarily as tree density, height, and diameter) and found that overall butterfly diversity
was highest in the most heavily disturbed forest stand (with intermediate tree size and
low tree density), but the most common species in these sites had wide-ranging
geographical distributions. On the other hand, biogeographical distinctness (a measure of
endemism) was higher on sites with greater forest structure, demonstrating that species
with small geographical ranges required greater stand structure.
1.5.2.3. Forest Composition
The abundance of hardwood or softwood tree species also can have a large
influence on the invertebrate populations occupying forest stands (Hughes et al. 2000,
33
Novotny et al. 2006). For example, Work et al. (2004) found that differences in the
epigaeic arthropod community among forest stands were influenced by the relative
proportion of coniferous and deciduous trees in the overstory and understory. Grove
(2002b) found that, although the volume of CWM was most strongly correlated with
saproxylic species richness, basal area was also an appropriate surrogate measure.
However, the basal area of larger-diameter trees was a better measure than total basal
area.
In our study, the basal area of hardwoods was the best predictor of species
abundance in all models, and it was the best predictor of species richness among the
environmental variables examined. There were differences in beetle assemblages
between stands of low or high vegetation species diversity, and eighteen click beetle
species were correlated with vegetation species diversity. Stands of high or low
hardwood and softwood basal area also varied in click beetle species composition. Click
beetle species richness, total abundance, and diversity were higher in stands of high
hardwood basal area, and hardwood basal area was the best predictor of both click beetle
species richness and species abundance. Although click beetles are clearly found in
softwood-dominated stands and to emerge from softwood logs (see Chapters 2 and 3),
click beetle species richness, total abundance, and diversity were similar between stands
of high and low softwood basal area. Assemblage similarity measures demonstrated
differences in click beetle assemblages between stands of high and low softwood or
hardwood content. Twenty-five species of Elateridae were correlated with increased
hardwood basal area, and seventeen species were correlated with increased softwood
34
basal area, further demonstrating click beetle assemblage response to hardwood or
softwood content.
Click beetles generally spend 1 to 3 years as larvae in soil and/or deadwood
(Johnson 2002). Adults captured by our traps may have emerged from these stands
and/or dispersed to these sites as adults and were responding to above-ground conditions
such as food or habitat conditions in the aboveground portions of the plants (see above).
On the other hand, adults captured by our traps may have emerged from these stands and
were responding to humus, leaf litter, or deadwood conditions influenced by forest
composition. Saetre et al. (1999) studied soil fauna in spruce and mixed spruce-birch
stands, finding that the abundance of many taxa, including Elateridae, was higher in the
mixed stands than in the pure spruce stands. They concluded that the birch leaf litter was
important in determining soil fauna composition by addition of substrate and by
sustaining leaf litter moisture. However, Scheu et al. (2003) studied soil fauna in pure
and mixed stands of beech and spruce; although most invertebrate species had higher
biomass in the pure beech or mixed stands, click beetles had higher biomass in the spruce
forests. Beech leaves are a more favorable food resource than spruce needles, so they
speculated that these elaterid larvae are able to live on poor food substrates due to their
slow growth and long larval development. Linit et al. (1986) collected adults of one
unidentified elaterid species emerging from soil in stands of 80 year-old northern red oak
(Quercus rubra) that had been cut and replaced with red oak seedlings. Because no
specimens were collected on the seedlings themselves, it is likely this species inhabited
the stand only at the larval stage, and responded to soil or humus conditions.
Invertebrates living in deadwood are also affected by forest composition; Jacobs (2004)
35
found that saproxylic beetle richness was influenced by stands dominated by deciduous
or coniferous trees.
1.5.3. Deadwood Influences
Saproxylic insects depend on dying or dead wood (or taxa associated with
deadwood) for at least part of their life cycle (Speight 1989). Studies of saproxylics are
becoming more common as ecologists recognize their importance to the conservation of
biodiversity in the management of forests. Deadwood includes snags, CWM, and live
trees with hollows or dead parts (Siitonen 2001, Ranius 2002, Ranius and Jansson 2002).
There are many factors affecting saproxylic insect assemblages, including deadwood
characteristics such as species, stage of decay, diameter, point of origination (i.e. trunk,
branch, roots), and fungi and other saproxylic species assemblages, but also including
stand and landscape conditions such as amount of surrounding CWM, sun exposure,
forest fragmentation, and forest successional stage and cover type (Schiegg 2000,
Siitonen 2001, Jacobs 2004).
CWM is increasingly studied as crucial habitat for forest biodiversity. There are
twice as many saproxylic beetles as all terrestrial vertebrates combined (Parker 1982),
and saproxylics comprise a substantial percentage of forest insects (Martikainen et al.
2000, Siitonen 2001). Many studies have established a strong link between species
richness and CWM volume (Økland et al. 1996, Martikainen et al. 2000, Grove 2002a
and b). Snags, although less commonly studied, are also important habitat with different
assemblage successional patterns from downed logs (Siitonen 2001). Siitonen (1994)
collected saproxylic beetles in two old spruce forests. Common generalist species were
abundant in both forests, but specialists on spruce (including four elaterid species) or
36
birch snags were more abundant in the forest with more decaying wood. Jacobs (2004)
studied beetle assemblages on girdled and natural snags in stands of several cover types.
Beyond differences between girdled (aspens did not die as readily as spruce trees) and
natural snags, he found that stand scale snag and CWM volume and cover type were
important to beetle communities. Therefore, it is not surprising that click beetle
assemblages in our study differed among stands with varying amounts of deadwood.
Click beetle richness and total abundance in our study also were higher in stands
of high snag (decay classes 2-4) basal area, and click beetle total abundance was higher in
stands with high CWM (decay class 3) volume. Click beetle assemblage similarity
differed between stands of high and low classes 2-4 snag basal area and CWM classes 2,
3, and 4 volume. Twenty-five species of click beetles were correlated with CWM class 3
volume, and seventeen species were correlated with CWM class 4 volume.
The apparent effect of deadwood on the click beetle species assemblage is
consistent with their natural history. Click beetles are known to inhabit both snags and
CWM as larvae, and those inhabiting soil can be influenced by the proximity to CWM
(Chershire 1988, Marra and Edmonds 1998). Both snags and CWM undergo a
succession of insect species as the wood decays. Insects that inhabit newly dead wood
often require fresh phloem or sapwood (Hammond et al. 2004). The species richness of
predators, fungivores, and scavengers increases in response to further wood
decomposition (aided by suites of fungus) and greater microhabitat diversity (Siitonen
2001). Elateridae are not common to fresh deadwood, but in our study, the later classes
of decay were important forest stand characteristics that showed positive relationships
with their species assemblages.
37
Chapter 2
RELATION BETWEEN VEGETATION COMPOSITION AND
CLICK BEETLE (COLEOPTERA: ELATERIDAE)
ASSEMBLAGES IN MAINE’S ACADIAN FOREST
2.1. Abstract
I examined whether populations and communities of click beetles (Coleoptera:
Elateridae) were associated with habitats dominated by specific plant species in the
Acadian forest of Maine. Emergence traps were used to collect adult beetles as they
emerged from soil beneath hardwood (Maple, Birch, Aspen, Blueberry, and Oak) and
softwood (Spruce-Fir-Pine, Pine, Hemlock, and Fern-Hemlock) cover types. Forty
species of click beetle were collected, with Ctenicera triundulata, Dalopius spp., and
Agriotes stabilis being most abundant. Click beetle assemblages, measured with
richness, abundance, diversity and similarity, varied among the five hardwood and four
softwood plant communities. Species richness was lowest in the Spruce-Fir-Pine and
highest in the Oak cover type. Species abundance was lowest in the Spruce-Fir-Pine and
Pine and highest in the Oak, Maple, and Hemlock cover types. Diversity was generally
higher on hardwood cover types than softwood cover types. Assemblage similarity was
generally low between hardwood and softwood cover types, indicating that species
composition differed between these stands. Assemblages in non-oak hardwood cover
types were more similar to each other than to the Oak cover type. Four species of click
beetle were more abundant in softwood stands, and seven species were associated with
increases in specific softwood tree and shrub species. Nine species of click beetle were
more abundant in hardwood stands, and fifteen species were associated with increases in
38
specific hardwood tree and shrub species, including six species associated with oak
stands.
2.2. Introduction
Conserving biodiversity has been identified as an important concern in forest
management (Hunter 1999, Lindenmayer and Franklin 2002). Identifying species that
are present in forests, their habitat preferences, and how management practices affect
these relationships are keys to addressing this concern. This basic information is
unknown for the majority of invertebrate species in North American temperate forests
(Danks and Foottit 1989, Carlton and Robison 1998). Insects are an important group of
organisms to understand because they are highly diverse, outnumbering all other higher
taxa (MEA 2005), and perform many important functions in forest ecosystems (Crowson
1981, Wilson 1992). Furthermore, since forest management practices affect insect
populations (Niemelä 1997, Grove 2002), insects may serve as important indicators of
ecological sustainability (Kremen et al. 1993, Taylor and Doran 2001).
There are approximately 10,000 described species in the family Elateridae (click
beetles), making it the ninth most species rich family of beetles (Johnson, 2002). Often
considered pests in agricultural systems, this family does not cause serious damage to
forest trees. Living in forest soils and deadwood as larvae, click beetles are notable
predators of forest insect pests (Morris 1951, Yano et al. 1984), prey for birds and other
biota (Barron and Walley 1983, Holmes and Robinson 1981, Heinrich and Bell 1995),
and influences in nutrient cycles (Wolters 1989). Several species of click beetle are
considered threatened or endangered in Europe (Anon. 1999, Alexander 2003, Zach
39
2003), but the dearth of detailed information about most species in this family currently
limits strategic attempts at their conservation. Elaterids are ideal for forest biodiversity
research because the family is numerically abundant and species rich, they can be
collected using relatively simple trapping methods, and the species are characterized by
diverse food and habitat preferences.
I designed a series of studies to investigate the habitat preferences of Elaterid
species living in the Acadian forest in Maine. In a previous study, I determined that plant
species diversity and the basal area of hardwoods and softwoods were important
predictors of adult Elaterid assemblages in the Acadian forest of Maine (Chapter 1).
Other studies have also demonstrated that the composition of forest vegetation can affect
invertebrate assemblages through hardwood or softwood-specific insect-plant
associations within a stand (Saetre et al. 1999, Paquin and Coderre 1997, and Ohsawa
2004).
Trees and shrubs influence the temperature and moisture of the soil (Phillips and
Shure 1990 and Kapos 1989), both of can strongly impact the presence and movement of
click beetle larvae in the soil (Lees 1943a&b, Zacharuk 1962, and LaFrance 1968). Leaf
litter can also influence click beetle assemblages, as several species are considered to be
saprophagous on dead leaves (Zacharuk 1963, Wolters 1989, and David et al. 1993), and
carnivorous larvae will become detritivorous or saprophagous in the absence of prey
(Balduf 1935). Because of this, Saetre et al. (1999) and Scheu et al. (2003) interpreted
changes in click beetle assemblages across different forest stands as responses to
nutrients from leaf input.
40
In this study, I tested whether the composition of click beetle assemblages and
abundance of individual species emerging from soil were affected by the species
composition of overstory and understory vegetation in the Acadian forest of central
Maine. Previous studies by Paquin and Coderre (1997) and Saetre et al. (1999) found
higher click beetle abundance in hardwood stands than softwood stands. In addition, my
previous work (Chapter 1) found greater numbers of species associated with hardwood
basal area than softwood basal area. Therefore, I hypothesized in this study that species
richness and abundance of click beetles would be lower in stands dominated by softwood
than hardwood species, and that some species (including Agriotes stabilis LeC.,
Ctenicera cruciata, Ctenicera hieroglyphica Say, Ctenicera propola LeC., Ctenicera
triundulata Randall, Elathous dicalceatus Say, Fornax canadensis Brown, Isorhipis
obliqua Say, Melanotus castanipes, Oxygonus montanus LeC., Sericus brunneus LeC.,
and Sericus viridanus Say) would be associated with hardwood stands and other species
(including Ctenicera arata LeC., Ctenicera nitidula LeC., and Limonius aeger LeC.)
would be associated with softwood stands (Chapter 1).
2.3. Methods
2.3.1. Study Site
This study took place in the Penobscot Experimental Forest (44°50’ N, 68°35’
W), east-central Maine, USA (Figure B.1). The forest is part of the Acadian forest region
(Bailey 1995, Lorimer and White 2003), which is considered transitional between the
eastern temperate forest to the south and the boreal forest to the north. Common
softwood tree species on the Penobscot Experimental Forest (PEF) include red (Picea
41
rubens Sarg.), white (P. glauca (Moench) Voss) and black spruce (P. mariana (Mill.)
B.S.P.), balsam fir (Abies balsamea (L.) Mill.), eastern white pine (Pinus strobus L.),
eastern hemlock (Tsuga canadensis (L.) Carr.), and northern white cedar (Thuja
occidentalis L.), and common hardwoods include red maple (Acer rubrum L.), white
(Betula papyrifera Marsh.) and gray birch (B. populifolia Marsh.), and quaking (Populus
tremuloides Michx.) and bigtooth aspen (P. grandidentata Michx.). The PEF has a
complicated history of periodic partial harvests and insect outbreaks resulting in multi-
cohort stand structures of many species (R. Seymour, unpublished data). Soils vary
between glacial till ridges with sandy or well-drained loams to flat areas between ridges
with poorly to very poorly drained loams and silt loams (Brissette 1996).
2.3.2. Cover Types
Most forest stands selected for sampling in this study were established as part of a
long-term silvicultural experiment by the USDA Forest Service (Sendak et al. 2003).
Silvicultural treatments that are part of this 60 year-long experiment produced stands of
widely different composition- and structures. In addition, one red oak (Quercus rubra L.)
stand (oak05) was located on the nearby University of Maine campus, and one eastern
white pine plantation (pin07) was located on private land near Hampden, Maine.
In this study stand was defined as a relatively uniform area that was dominated by
specific hardwood and softwood plant species common to the Acadian forest, including
low blueberry (Vaccinium angustifolium Aiton), interrupted fern (Osmunda claytoniana
L.), quaking (Populus tremuloides Michx.) and bigtooth aspen (P. grandidentata
Michx.), white birch (Betula papyrifera Marsh.), red maple (Acer rubrum
42
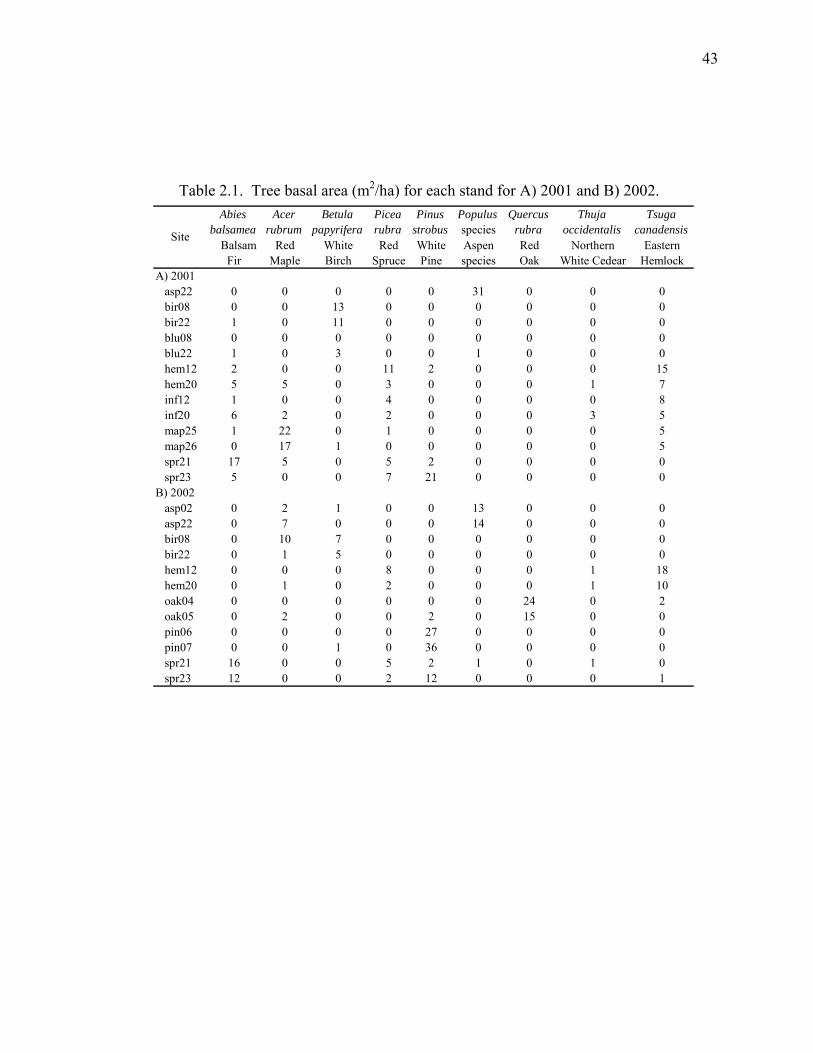
Table 2.1. Tree basal area (m2/ha) for each stand for A) 2001 and B) 2002. Abies
balsameaAcer
rubrumBetula
papyriferaPicea rubra
Pinus strobus
Populus species
Quercus rubra
Thuja occidentalis
Tsuga canadensis
Balsam Fir
Red Maple
White Birch
Red Spruce
White Pine
Aspen species
Red Oak
Northern White Cedear
Eastern Hemlock
A) 2001 asp22 0 0 0 0 0 31 0 0 0 bir08 0 0 13 0 0 0 0 0 0 bir22 1 0 11 0 0 0 0 0 0 blu08 0 0 0 0 0 0 0 0 0 blu22 1 0 3 0 0 1 0 0 0 hem12 2 0 0 11 2 0 0 0 15 hem20 5 5 0 3 0 0 0 1 7 inf12 1 0 0 4 0 0 0 0 8 inf20 6 2 0 2 0 0 0 3 5 map25 1 22 0 1 0 0 0 0 5 map26 0 17 1 0 0 0 0 0 5 spr21 17 5 0 5 2 0 0 0 0 spr23 5 0 0 7 21 0 0 0 0B) 2002 asp02 0 2 1 0 0 13 0 0 0 asp22 0 7 0 0 0 14 0 0 0 bir08 0 10 7 0 0 0 0 0 0 bir22 0 1 5 0 0 0 0 0 0 hem12 0 0 0 8 0 0 0 1 18 hem20 0 1 0 2 0 0 0 1 10 oak04 0 0 0 0 0 0 24 0 2 oak05 0 2 0 0 2 0 15 0 0 pin06 0 0 0 0 27 0 0 0 0 pin07 0 0 1 0 36 0 0 0 0 spr21 16 0 0 5 2 1 0 1 0 spr23 12 0 0 2 12 0 0 0 1
Site
43
L.), northern red oak (Quercus rubra L.) eastern hemlock (Tsuga canadensis (L.) Carr.),
red spruce (Picea rubens Sarg.), balsam fir (Abies balsamea (L.) Mill.), and eastern white
pine (Pinus strobus L.). "Cover type" was defined as a stand condition dominated by a
specific plant species or group of plant species and served as a treatment
in the experimental design. Two stands were selected as replicates for each cover type.
The one exception was the Aspen cover type in 2001, which had only one replicate.
Three trap locations within each stand were selected based on the dominance and
relatively uniform distribution of desired plant species. Plant species were considered
dominant if at least 50% of the overstory basal area within 5 m of the center of the site or
at least 50% of the understory canopy width within 2 m of the trap location was
composed of that vegetation. In 2001, the cover types included Aspen (asp22), Birch
(bir22, bir08), Blueberry (blu22, blu08), Maple (map25, map26), Fern-Hemlock (inf12,
inf20, Hemlock (hem12, hem20), and Spruce-Fir-Pine (spr21, spr23). In 2002, the cover
types included Aspen (asp02, asp22), Birch-Maple (bir08, bir22), Oak (oak04, oak05),
Hemlock (hem12, hem20), Spruce-Fir-Pine (spr21, spr23), and Pine (pin06, pin07).
Therefore, I used thirteen stands of seven cover types in 2001, and twelve stands of six
cover types in 2002.
2.3.3. Beetle and Vegetation Sampling
Emergence traps were designed to collect adult insects as they emerged from the
soil and were located at the center of each trap location. The traps, which covered 1 m2 of
soil, were constructed as dark mesh tents with clear collecting bottles, containing
propylene glycol, located at the approximately 1.0 m high peak (Figure B.1). An inverted
44
upper collecting bottle was fitted with a funnel to catch strong flying insects, and a lower
collecting bottle, positioned directly below the upper bottle, was used to capture weaker
flying insects that could not maneuver into the funnel. The traps were positioned over
areas of soil with little or no coarse woody material (CWM) within one meter. The edges
of the traps were sealed against the ground with weights to prohibit insects from entering
or escaping the traps.
Insect samples were collected from the bottles biweekly from the beginning of
June through the end of August of 2001 and 2002, and stored in a solution of 70%
alcohol. Adult elaterid specimens were identified to species, stored in alcohol or pinned,
and incorporated into the University of Maine Insect Collection. A reference collection
for verification of species identification was sent to E.C. Becker and Serge LaPlante in
Ottawa, Ontario, Canada. All further identifications were made by S.L. Thomas
following the nomenclature of Dietrich (1945) and Downie and Arnett (1996).
Overstory and understory vegetation were sampled around each trap location
during July of 2001 and 2002. For the overstory, a 10-factor prism was used to determine
the basal area of each tree species. For the understory (ferns, shrubs, and small trees),
canopy width at the widest point of each individual plant was measured within a 2 m
distance from the trap location. I calculated the total canopy width for each understory
species. Vegetation data were averaged between trap locations within each stand (Tables
2.1. and B.1).
45
2.3.4. Analytical Approach
I compared click beetle richness (numbers of species), abundance (numbers of
individuals of each species), assemblage similarity, and diversity among cover types.
Cluster analysis of Jaccard percent similarity measures using internet-based software
provided by Brzustowski (2002) was used to measure assemblage similarity, the overlap
of click beetle species among cover types. The rarefaction index takes into account both
species richness and abundance, so it can be used as a measure of species diversity (Heck
et al. 1975, Raup 1975); herein I use “diversity” to refer to rarefaction-estimated species
richness. PAST (Hammer et al. 2001) was used to calculate the expected number of
species derived from random subsamples of the total abundance, and compared species
diversity among subsamples of similar sizes (Sanders 1968). I considered diversity
between two groups significantly different when respective 95% confidence intervals did
not overlap.
Two ordination analyses were used to examine the relation between click beetle
species abundance and the vegetation community. I used non-metric multidimensional
scaling (NMS; Kruskal 1964) to determine the strongest gradients in the click beetle
assemblage structure among cover types and to associate click beetle species with
particular vegetation species. Canonical correspondence analysis (CCA, Ter Braak 1986)
was used to determine the amount of the variation in the click beetle assemblage that
could be accounted for by vegetation variables. To exclude bias provided by including
rare species (Jongman et al. 1995), I included only the 20 and 17 most common species
for 2001 and 2002, respectively, in the analyses. A cube root transformation was used to
reduce dominance of the most abundant species (McCune & Grace 2002).
46
For NMS, I used PC-ORD (McCune and Mefford 1999) with random starting
configurations and the quantitative version of the Sorensen distance measure; the run
with the lowest stress was used for the final analysis. For each year, six axes were
assessed and three axes were selected. I presented results for only the two axes that had
significant Monte Carlo test results (p < 0.05). The final stresses were was 5.96 and 6.11,
and the two axes were 93.6% and 99.9% orthogonal for 2001 and 2002, respectively. I
subsequently performed Pearson and Kendall correlations between the ordination axes
with the beetle species and the vegetation species, and joint-plotted the vegetation
species. A high correlation between a vegetation species and an NMS axis indicated a
strong association between that vegetation species with the click beetle species associated
with the axis. I overlaid polygons encircling the stands of major vegetation types.
For CCA, I used CANOCO version 4.5A (Ter Braak 2003) to employ an
automatic CCA of click beetle species with overstory and understory vegetation. Monte
Carlo analysis was performed using 1,000 permutations to test each CCA model at a
significance level of alpha = 0.05. The results from the CCA showed that no
multicollinearity was detected in any of the models. For each model the CCA stand
ordination plots were very similar to the NMS ordination plots; therefore, I presented
only the NMS site ordinations, but included the variation explained in the results
(Appendix B.2).
I assessed the relationship between click beetle species richness and species
abundance with the cover types using general linear models. For species richness,
numbers of species were totaled within each stand; the main effect was cover type with
PROC GLM (SAS Institute 2000). For species abundance, the abundances of each
47
species were totaled within each stand; the main effects were species, cover type, and
stand within cover type, and I used PROC GENMOD (SAS Institute 2000) with a
negative binomial distribution because the data were over-dispersed. I used post-hoc
contrasts with LSMEANS (SAS Institute 2000) to compare click beetle species richness
and species abundances among cover types. In addition, I used post-hoc comparisons of
relative abundances of all individual species of at least 5 specimens with 95% confidence
intervals. I compared the softwood cover types to the hardwood cover types, excluding
the 2001 aspen stand from the 2001 analysis to standardize numbers of stands within
cover types. I also compared the three cover types within hardwoods and within
softwoods, retaining all species in each analysis.
2.4. Results
2.4.1. Description of Beetle Taxa
I collected 998 click beetles of 41 different species, including one species
(Isorhipis obliqua) from the family Eunemidae, the false click beetles (Table B.2).
Ctenicera triundulata, Dalopius spp. Brown, and Agriotes stabilis, were the most
common species, representing 36.0%, 19.2%, and 11.7%, of the total abundance,
respectively. Nine species were singletons, and seventeen species were represented by
only two to nine individuals.
2.4.2. Relation of Click Beetle Assemblages with Cover Types
In 2001, click beetle species richness varied among cover types (DF = 6,6, F =
6.03, p = 0.023); the Blueberry (p = 0.041), Maple (p = 0.019), Fern-Hemlock (p =
0.028), and Hemlock (p = 0.093) cover types had 110%, 650%, 120%, and 450% more
48
species than the Spruce-Fir-Pine cover type, respectively (Figure 2.1a). In 2002, richness
varied slightly among cover types (DF = 5,6, F = 3.77, p = 0.069); the Oak had 163%
more species than the Spruce-Fir-Pine cover type (p = 0.093, Figure 2.1b).
In 2001, species abundance varied slightly among cover types (p = 0.083, Table
2.2a, Figure 2.1c). The Maple cover type had 147%, 87%, and 166% higher abundance
than the Aspen (p = 0.044), Blueberry (p = 0.074), and Spruce-Fir-Pine (p = 0.006) cover
types, respectively, and Hemlock (p = 0.021) and Fern-Hemlock (p = 0.048) had 219%
and 263% greater abundance than the Spruce-Fir-Pine cover type, respectively. In 2002,
species abundance varied among cover types (p < 0.001, Table 2.2b and Figure 2.1d).
The Aspen (p = 0.008 and p = 0.099), Birch (p < 0.001 and p = 0.007), Hemlock (p <
0.001 and p = 0.004), and Oak (p < 0.001 and p = 0.001) cover types had 163% and 75%,
260% and 140%, 279% and 152%, and 357% and 205% higher abundance than the
Spruce-Fir-Pine and Pine cover types, respectively. The Oak cover type had 74% higher
abundance than the Aspen cover type (p = 0.073).
In 2001, click beetle diversity (p = 0.05, Table 2.3b) in the Blueberry and Aspen
cover types was 35-100% and 48-67% higher than all other cover types, respectively,
except Aspen was not different from Maple cover type. Diversity was 49%, 18%, and
49% higher in the Maple treatment than the coniferous Hemlock, Fern-Hemlock, and
Spruce-Fir-Pine cover types, respectively. Diversity was 28% and 23% lower in
Hemlock stand than in Birch or Fern-Hemlock cover types, respectively. In 2002, click
beetle diversity (p = 0.05, Table 2.4b) was 32% and 28-58% higher in the Aspen than in
Birch-Maple or the coniferous cover type (Pine, Spruce-Fir-Pine, and Hemlock),
respectively. Diversity was 50% and 41-83% higher in Aspen than in Birch-Maple or the
49
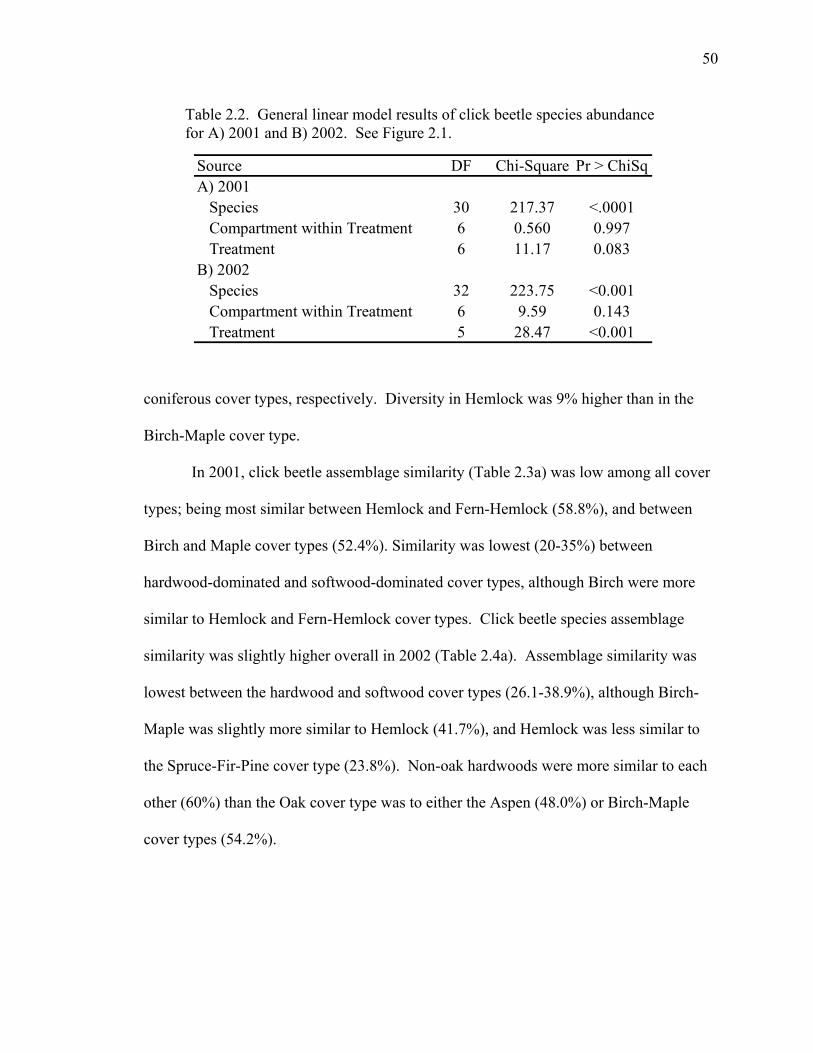
coniferous cover types, respectively. Diversity in Hemlock was 9% higher than in the
Birch-Maple cover type.
In 2001, click beetle assemblage similarity (Table 2.3a) was low among all cover
types; being most similar between Hemlock and Fern-Hemlock (58.8%), and between
Birch and Maple cover types (52.4%). Similarity was lowest (20-35%) between
hardwood-dominated and softwood-dominated cover types, although Birch were more
similar to Hemlock and Fern-Hemlock cover types. Click beetle species assemblage
similarity was slightly higher overall in 2002 (Table 2.4a). Assemblage similarity was
lowest between the hardwood and softwood cover types (26.1-38.9%), although Birch-
Maple was slightly more similar to Hemlock (41.7%), and Hemlock was less similar to
the Spruce-Fir-Pine cover type (23.8%). Non-oak hardwoods were more similar to each
other (60%) than the Oak cover type was to either the Aspen (48.0%) or Birch-Maple
cover types (54.2%).
Table 2.2. General linear model results of click beetle species abundance for A) 2001 and B) 2002. See Figure 2.1.
Source DF Chi-Square Pr > ChiSqA) 2001 Species 30 217.37 <.0001 Compartment within Treatment 6 0.560 0.997 Treatment 6 11.17 0.083B) 2002 Species 32 223.75 <0.001 Compartment within Treatment 6 9.59 0.143 Treatment 5 28.47 <0.001
50
Table 2.3. Click beetle Jaccard assemblage similarity and rarefaction diversity results between vegetation treatments for 2001.
Source Aspen Birch Blueberry Maple Hemlock Fern-Hemlock Spruce-Fir-PineA) Similarity Aspen 100.0 43.8 21.1 31.6 33.3 21.1 23.1 Birch 43.8 100.0 30.4 52.4 42.1 42.9 27.8 Blueberry 21.1 30.4 100.0 33.3 35.0 25.0 21.1 Maple 31.6 52.4 33.3 100.0 45.0 39.1 25.0 Hemlock 33.3 42.1 35.0 45.0 100.0 58.8 33.3 Fern-Hemlock 21.1 42.9 25.0 39.1 58.8 100.0 43.8 Spruce-Fir-Pine 23.1 27.8 21.1 25.0 33.3 43.8 100.0B) Diversity Aspen 8.0+/-0.0 (15) Birch 5.4+/-1.3 (15)a 15.0+/-0.0 (94) 9.2+/-1.5 (40)a 9.9+/-1.5 (46) Blueberry 8.5+/-1.3 (15) 15.0+/-0.0 (40) Maple 6.5+/-1.4 (15) 15.8+/-1.0 (94) 11.1+/-1.5 (40)a 17.0+/-0.0 (115) 11.9+/-1.5 (46)a
Hemlock 5.1+/-1.2 (15)a 10.8+/-0.9 (94)a 8.0+/-1.3 (40)a 11.4+/-0.7 (115)a 12.0+/-0.0 (150) 11.6+/-0.6 (127)a 8.5+/-1.3 (46) Fern-Hemlock 4.9+/-1.3 (15)a 13.0+/-1.2 (94) 8.3+/-1.5 (40)a 14.3+/-0.8 (115)a 15.0+/-0.0 (127) 9.0+/-1.5 (46) Spruce-Fir-Pine 4.8+/-1.0 (15)a 7.5+/-0.7 (40)a 8.0+/-0.0 (46)Note: Rarefaction diversity is the estimated number of species +/- standard deviation for (number of individuals). Compare columns(main category with fewest number of individuals) to vegetation treatments in rows. Empty spaces indicate number of individuals in rowwas lower than that of the column. aSignificantly different: respective 95% confidence intervals do not overlap.
Table 2.4. Click beetle Jaccard assemblage similarity and rarefaction diversity results between vegetation treatments for 2002. Source Aspen Birch-Maple Oak Pine Spruce-Fir-Pine HemlockA) Similarity Aspen 100.0 60.0 48.0 38.9 33.3 36.0 Birch-Maple 60.0 100.0 54.2 38.9 33.3 41.7 Oak 48.0 54.2 100.0 36.4 26.1 34.5 Pine 38.9 38.9 36.4 100.0 41.7 42.1 Spruce-Fir-Pine 33.3 33.3 26.1 41.7 100.0 23.8 Hemlock 36.0 41.7 34.5 42.1 23.8 100.0B) Diversity Aspen 17.0+/-0.0 (110) 15.8+/-1.0 (92)a 13.0+/-1.5 (60)a
Birch-Maple 12.9+/-1.5 (110)a 17.0+/-0.0 (202) 14.7+/-1.3 (148)a 11.9+/-1.6 (92) 9.8+/-1.6 (60) Oak 19.7+/-1.3 (110) 22.0+/-0.0 (148) 18.3+/-1.5 (92)a 15.0+/-1.7 (60)a
Pine 10.0+/-0.0 (92) 8.7+/-1.0 (60) Spruce-Fir-Pine 9.0+/-0.0 (60) Hemlock 13.3+/-1.7 (110)a 18.6+/-0.6 (202)a 15.6+/-1.5 (148)a 12.1+/-1.7 (92) 19.0+/-0.0 (209)Note: Rarefaction diversity is the estimated number of species +/- standard deviation for (number of individuals). Compare columns(main category with fewest number of individuals) to vegetation treatments in rows. Empty spaces indicate number of individuals inrow was lower than that of the column. aSignificantly different: respective 95% confidence intervals do not overlap.
51
Figure 2.1. General linear model results for by treatment for click beetle (A&B) species richness and (C&D) species abundance (performed on log data) for (A&C) 2001 and (B&D) 2002 with standard error bars. See Table 2.5.
C D
Log
Mea
n B
eetle
Abu
ndan
ce
-2.0
-1.5
-1.0
-0.5
0.0
Aspen
Birch
Bluebe
rry
Hemloc
k
Fern-H
emloc
kMap
le
Spruce-
Fir-Pine
Log
Mea
n B
eetle
Abu
ndan
ce
-3.0
-2.5
-2.0
-1.5
-1.0
-0.5
Aspen
Birch-M
aple
Oak Pine
Hemloc
k
Spruce-
Fir-Pine
A B
Mea
n B
eetle
Ric
hnes
s
0
2
4
6
8
10
12
14
Aspen
Birch
Bluebe
rry
Hemloc
k
Fern-H
emloc
kMap
le
Spruce-
Fir-Pine
Mea
n B
eetle
Ric
hnes
s0
6
12
18
Aspen
Birch-M
aple
Oak Pine
Hemloc
k
Spruce-
Fir-Pine
52
Figure 2.2. Relative abundance of the most common click beetle species in Hardwood and Softwood treatments (three stands in each) in A) 2001 and B) 2002. Asterisk denotes treatment with significantly higher relative abundance within a species.
Rel
ativ
e A
bund
ance
of B
eetle
s
0.00
0.25
0.50
0.75
1.00
**
**
*
*
**
Cten
icera
triu
ndul
ata
(119
)
Dalo
pius
spe
cies
(60)
Agrio
tes
stab
ilis (6
3)
Lim
oniu
s ae
ger (
22)
Cten
icera
hie
rogl
yphi
ca (3
5)
Atho
us o
rvus
(10)
Cten
icera
ara
ta (7
)
Cten
icera
rufif
rons
(12)
Ampe
dus
near
mel
anot
oide
s (8
)
Cten
icera
pro
pola
(21)
Cten
icera
spi
nosa
(5)
Cten
icera
app
ropi
nqua
ns (7
)
Mel
anot
us c
asta
nipe
s (8
)*
Rel
ativ
e A
bund
ance
of B
eetle
s
0.00
0.25
0.50
0.75
1.00
Hardwood Softwood
*
**
**
*
*
*
Cten
icera
triu
ndul
ata
(247
)
Dalo
pius
spe
cies
(132
)
Agrio
tes
stab
ilis (4
9)
Cten
icera
pro
pola
(21)
Lim
oniu
s ae
ger (
16)
Atho
us b
right
welli
(17)
Atho
us o
rvus
(8)
Cten
icera
ara
ta (8
)
Seric
us b
runn
eus
(12)
Isor
iphi
s ob
liqua
(5)
Ampe
dus
mixt
us (1
2)
A
B
53
Figure 2.3. Relative abundance of beetle species in (A & B) 2001 and (C & D) 2002 in (A & C) Hardwood treatments and (B & D) Softwood treatments with confidence interval bars. Letters refer to differences among treatments within a species; only species with significant responses are included.
Ctenice
ra
triund
ulata
(180)
Dalopiu
s
spec
ies (4
5)
Agriote
s
stabil
is (45
)
Limon
ius
aege
r (13
)
Sericu
s
brunn
eus (
7)
Spruce-Fir-Pine Hemlock Fern-Hemlock
ab
a
b
ca
a
a
a
ab
b
b
b
b
b
c
Ctenice
ra
triund
ulata
(67)
Dalopiu
s
spec
ies (8
7)
Rel
ativ
e A
bund
ance
of B
eetle
s
0.00
0.25
0.50
0.75
1.00
Blueberry Birch Maple
a
a
bb
b b
Ctenice
ra
triund
ulata
(67)
Dalopiu
s
spec
ies (8
7)
Rel
ativ
e A
bund
ance
of B
eetle
s
0.00
0.25
0.50
0.75
1.00
Blueberry Birch Maple
a
a
bb
b b
B A
Ctenice
ra
triund
ulata
(36)
Dalopiu
s
spec
ies (4
5)
Agriote
s
stabil
is (41
)
Ctenice
ra
hierog
lyphic
a (32
)
Melano
tus
casta
nipes
(8)
Rel
ativ
e A
bund
ance
of B
eetle
s
0.00
0.25
0.50
0.75
1.00
Aspen-Birch Birch-Maple Oak
a a
a aa
aa
a
b b bb
b
c
a
Ctenice
ra
triund
ulata
(36)
Dalopiu
s
spec
ies (4
5)
Agriote
s
stabil
is (41
)
Ctenice
ra
hierog
lyphic
a (32
)
Melano
tus
casta
nipes
(8)
Rel
ativ
e A
bund
ance
of B
eetle
s
0.00
0.25
0.50
0.75
1.00
Aspen-Birch Birch-Maple Oak
a a
a aa
aa
a
b b bb
b
c
a
Ctenice
ra
triund
ulata
(83)
Dalopiu
s
spec
ies (1
5)
Agriote
s
stabil
is (22
)
Ctenice
ra
propo
la (18
).00
.25
.50
.75
.00
Spruce-Fir-Pine Pine Hemlock
a
c
a
aa
aa
b
b bb
a
Ctenice
ra
triund
ulata
(83)
Dalopiu
s
spec
ies (1
5)
Agriote
s
stabil
is (22
)
Ctenice
ra
propo
la (18
).00
.25
.50
.75
.00
Spruce-Fir-Pine Pine Hemlock
a
c
a
aa
aa
b
b bb
a
Ctenice
ra
triund
ulata
(83)
Dalopiu
s
spec
ies (1
5)
Agriote
s
stabil
is (22
)
Ctenice
ra
propo
la (18
).00
.25
.50
.75
.00
Spruce-Fir-Pine Pine Hemlock
a
c
a
aa
aa
b
b bb
a
D C
54
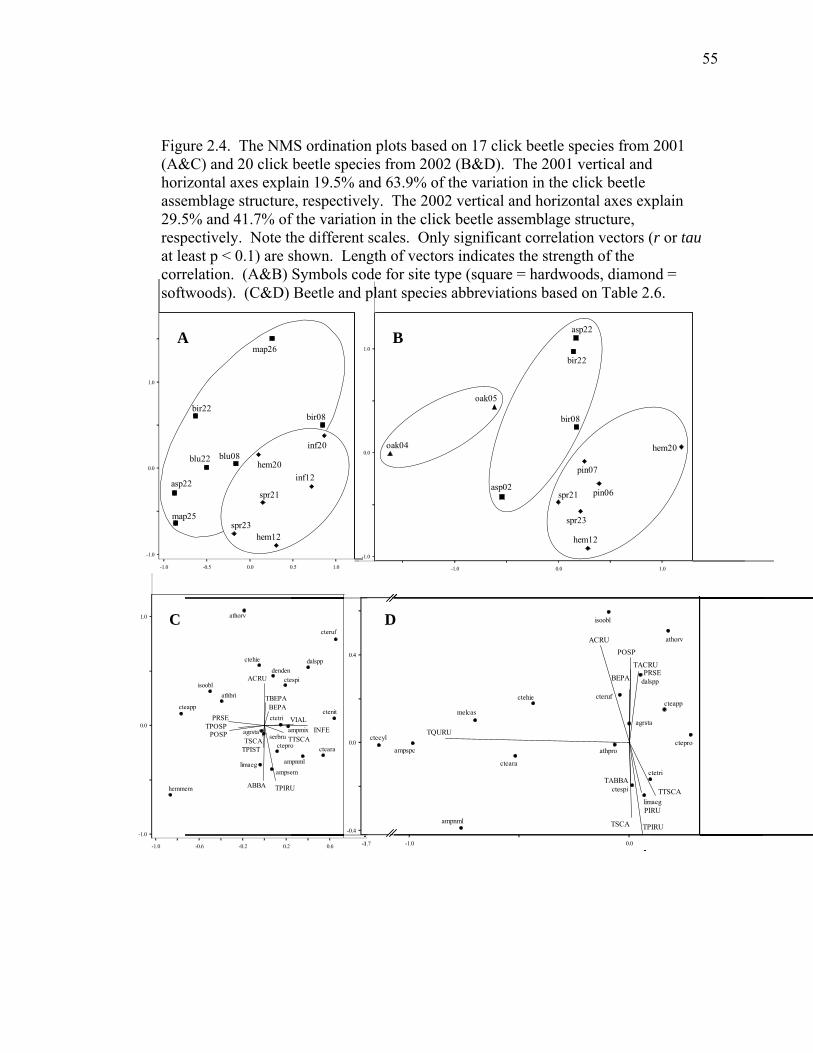
Figure 2.4. The NMS ordination plots based on 17 click beetle species from 2001 (A&C) and 20 click beetle species from 2002 (B&D). The 2001 vertical and horizontal axes explain 19.5% and 63.9% of the variation in the click beetle assemblage structure, respectively. The 2002 vertical and horizontal axes explain 29.5% and 41.7% of the variation in the click beetle assemblage structure, respectively. Note the different scales. Only significant correlation vectors (r or tau at least p < 0.1) are shown. Length of vectors indicates the strength of the correlation. (A&B) Symbols code for site type (square = hardwoods, diamond = softwoods). (C&D) Beetle and plant species abbreviations based on Table 2.6.
cteapp
ctehie
cteruf
denden
hemmem
ampnmlampsem
ctenit
ctespiisoobl
athorv
cteara
ampmixserbru
limaeg
athbri
ctepro
agrsta
dalspp
ctetri
TBEPA
TPIRU
TPIST
TPOSP
TTSCA
ABBA
ACRU
BEPA
INFEPOSP
PRSE
TSCA
VIAL
-1.0
-1.0
-0.6 -0.2 0.2 0.6
0.0
1.0
athpro
isoobl
ampspc
cteara
ctespi
cteapp
ampnml
melcas
athorv
cteruf
ctepro
limaeg
ctehie
dalspp
agrsta
ctetriTABBA
TACRU
TPIRU
TQURU
TTSCA
ACRU
BEPA
PIRU
POSP
PRSE
TSCA
-1.0 0.0
athpro
isoobl
ampspc
cteara
ctespi
cteapp
ampnml
melcas
athorv
cteruf
ctepro
limaeg
ctehie
dalspp
agrsta
ctetriTABBA
TACRU
TPIRU
TQURU
TTSCA
ACRU
BEPA
PIRU
POSP
PRSE
TSCA
-1.0 0.0
athpro
isoobl
ampspc
cteara
ctespi
cteapp
ampnml
melcas
athorv
cteruf
ctepro
limaeg
ctehie
dalspp
agrsta
ctetriTABBA
TACRU
TPIRU
TQURU
TTSCA
ACRU
BEPA
PIRU
POSP
PRSE
TSCA
-1.0 0.0
athpro
isoobl
ampspc
cteara
ctespi
cteapp
ampnml
melcas
athorv
cteruf
ctepro
limaeg
ctehie
dalspp
agrsta
ctetriTABBA
TACRU
TPIRU
TQURU
TTSCA
ACRU
BEPA
PIRU
POSP
PRSE
TSCA
-1.0 0.0
-0.4
0.0
0.4
-0.4
0.0
0.4
ctecylctecyl
-0.4
0.0
0.4
-0.4
0.0
0.4
ctecylctecyl
-1.7
athpro
isoobl
ampspc
cteara
ctespi
cteapp
ampnml
melcas
athorv
cteruf
ctepro
limaeg
ctehie
dalspp
agrsta
ctetriTABBA
TACRU
TPIRU
TQURU
TTSCA
ACRU
BEPA
PIRU
POSP
PRSE
TSCA
-1.0 0.0
athpro
isoobl
ampspc
cteara
ctespi
cteapp
ampnml
melcas
athorv
cteruf
ctepro
limaeg
ctehie
dalspp
agrsta
ctetriTABBA
TACRU
TPIRU
TQURU
TTSCA
ACRU
BEPA
PIRU
POSP
PRSE
TSCA
-1.0 0.0
athpro
isoobl
ampspc
cteara
ctespi
cteapp
ampnml
melcas
athorv
cteruf
ctepro
limaeg
ctehie
dalspp
agrsta
ctetriTABBA
TACRU
TPIRU
TQURU
TTSCA
ACRU
BEPA
PIRU
POSP
PRSE
TSCA
-1.0 0.0
athpro
isoobl
ampspc
cteara
ctespi
cteapp
ampnml
melcas
athorv
cteruf
ctepro
limaeg
ctehie
dalspp
agrsta
ctetriTABBA
TACRU
TPIRU
TQURU
TTSCA
ACRU
BEPA
PIRU
POSP
PRSE
TSCA
-1.0 0.0
-0.4
0.0
0.4
-0.4
0.0
0.4
ctecylctecyl
-0.4
0.0
0.4
-0.4
0.0
0.4
ctecylctecyl
athpro
isoobl
ampspc
cteara
ctespi
cteapp
ampnml
melcas
athorv
cteruf
ctepro
limaeg
ctehie
dalspp
agrsta
ctetriTABBA
TACRU
TPIRU
TQURU
TTSCA
ACRU
BEPA
PIRU
POSP
PRSE
TSCA
-1.0 0.0
athpro
isoobl
ampspc
cteara
ctespi
cteapp
ampnml
melcas
athorv
cteruf
ctepro
limaeg
ctehie
dalspp
agrsta
ctetriTABBA
TACRU
TPIRU
TQURU
TTSCA
ACRU
BEPA
PIRU
POSP
PRSE
TSCA
-1.0 0.0
athpro
isoobl
ampspc
cteara
ctespi
cteapp
ampnml
melcas
athorv
cteruf
ctepro
limaeg
ctehie
dalspp
agrsta
ctetriTABBA
TACRU
TPIRU
TQURU
TTSCA
ACRU
BEPA
PIRU
POSP
PRSE
TSCA
-1.0 0.0
athpro
isoobl
ampspc
cteara
ctespi
cteapp
ampnml
melcas
athorv
cteruf
ctepro
limaeg
ctehie
dalspp
agrsta
ctetriTABBA
TACRU
TPIRU
TQURU
TTSCA
ACRU
BEPA
PIRU
POSP
PRSE
TSCA
-1.0 0.0
-0.4
0.0
0.4
-0.4
0.0
0.4
ctecylctecyl
-0.4
0.0
0.4
-0.4
0.0
0.4
ctecylctecyl
-1.7
-1.0
0.0
1.0
asp02
asp22
bir22
bir08
oak04
oak05
pin06
pin07
spr21
spr23
hem12
hem20
-1.0 0.0 1.0
-1.0
0.0
1.0
-1.0
0.0
1.0
asp02
asp22
bir22
bir08
oak04
oak05
pin06
pin07
spr21
spr23
hem12
hem20
-1.0 0.0 1.0
asp22
bir22bir08
inf12
inf20
map25
map26
spr21
spr23hem12
hem20blu22 blu08
-1.0
-1.0
-0.5 0.0 0.5 1.0
0.0
1.0
asp22
bir22bir08
inf12
inf20
map25
map26
spr21
spr23hem12
hem20blu22 blu08
-1.0
-1.0
-0.5 0.0 0.5 1.0
0.0
1.0
asp22
bir22bir08
inf12
inf20
map25
map26
spr21
spr23hem12
hem20blu22 blu08
-1.0
-1.0
-0.5 0.0 0.5 1.0
0.0
1.0
asp22
bir22bir08
inf12
inf20
map25
map26
spr21
spr23hem12
hem20blu22 blu08
-1.0
-1.0
-0.5 0.0 0.5 1.0
0.0
1.0
A B
C D
55
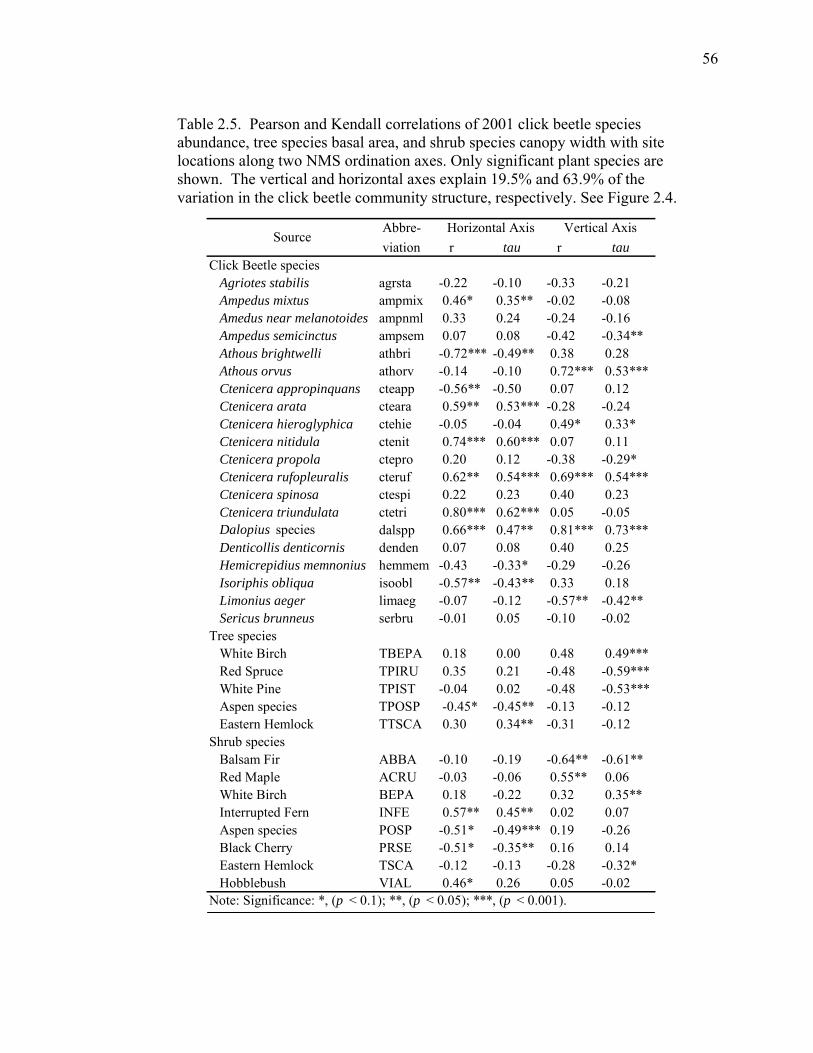
Table 2.5. Pearson and Kendall correlations of 2001 click beetle species abundance, tree species basal area, and shrub species canopy width with site locations along two NMS ordination axes. Only significant plant species are shown. The vertical and horizontal axes explain 19.5% and 63.9% of the variation in the click beetle community structure, respectively. See Figure 2.4.
Abbre- viation r tau r tau
Click Beetle species Agriotes stabilis agrsta -0.22 -0.10 -0.33 -0.21 Ampedus mixtus ampmix 0.46* 0.35** -0.02 -0.08 Amedus near melanotoides ampnml 0.33 0.24 -0.24 -0.16 Ampedus semicinctus ampsem 0.07 0.08 -0.42 -0.34** Athous brightwelli athbri -0.72*** -0.49** 0.38 0.28 Athous orvus athorv -0.14 -0.10 0.72*** 0.53*** Ctenicera appropinquans cteapp -0.56** -0.50 0.07 0.12 Ctenicera arata cteara 0.59** 0.53*** -0.28 -0.24 Ctenicera hieroglyphica ctehie -0.05 -0.04 0.49* 0.33* Ctenicera nitidula ctenit 0.74*** 0.60*** 0.07 0.11 Ctenicera propola ctepro 0.20 0.12 -0.38 -0.29* Ctenicera rufopleuralis cteruf 0.62** 0.54*** 0.69*** 0.54*** Ctenicera spinosa ctespi 0.22 0.23 0.40 0.23 Ctenicera triundulata ctetri 0.80*** 0.62*** 0.05 -0.05 Dalopius species dalspp 0.66*** 0.47** 0.81*** 0.73*** Denticollis denticornis denden 0.07 0.08 0.40 0.25 Hemicrepidius memnonius hemmem -0.43 -0.33* -0.29 -0.26 Isoriphis obliqua isoobl -0.57** -0.43** 0.33 0.18 Limonius aeger limaeg -0.07 -0.12 -0.57** -0.42** Sericus brunneus serbru -0.01 0.05 -0.10 -0.02Tree species White Birch TBEPA 0.18 0.00 0.48 0.49*** Red Spruce TPIRU 0.35 0.21 -0.48 -0.59*** White Pine TPIST -0.04 0.02 -0.48 -0.53*** Aspen species TPOSP -0.45* -0.45** -0.13 -0.12 Eastern Hemlock TTSCA 0.30 0.34** -0.31 -0.12Shrub species Balsam Fir ABBA -0.10 -0.19 -0.64** -0.61** Red Maple ACRU -0.03 -0.06 0.55** 0.06 White Birch BEPA 0.18 -0.22 0.32 0.35** Interrupted Fern INFE 0.57** 0.45** 0.02 0.07 Aspen species POSP -0.51* -0.49*** 0.19 -0.26 Black Cherry PRSE -0.51* -0.35** 0.16 0.14 Eastern Hemlock TSCA -0.12 -0.13 -0.28 -0.32* Hobblebush VIAL 0.46* 0.26 0.05 -0.02Note: Significance: *, (p < 0.1); **, (p < 0.05); ***, (p < 0.001).
Horizontal Axis Vertical AxisSource
56
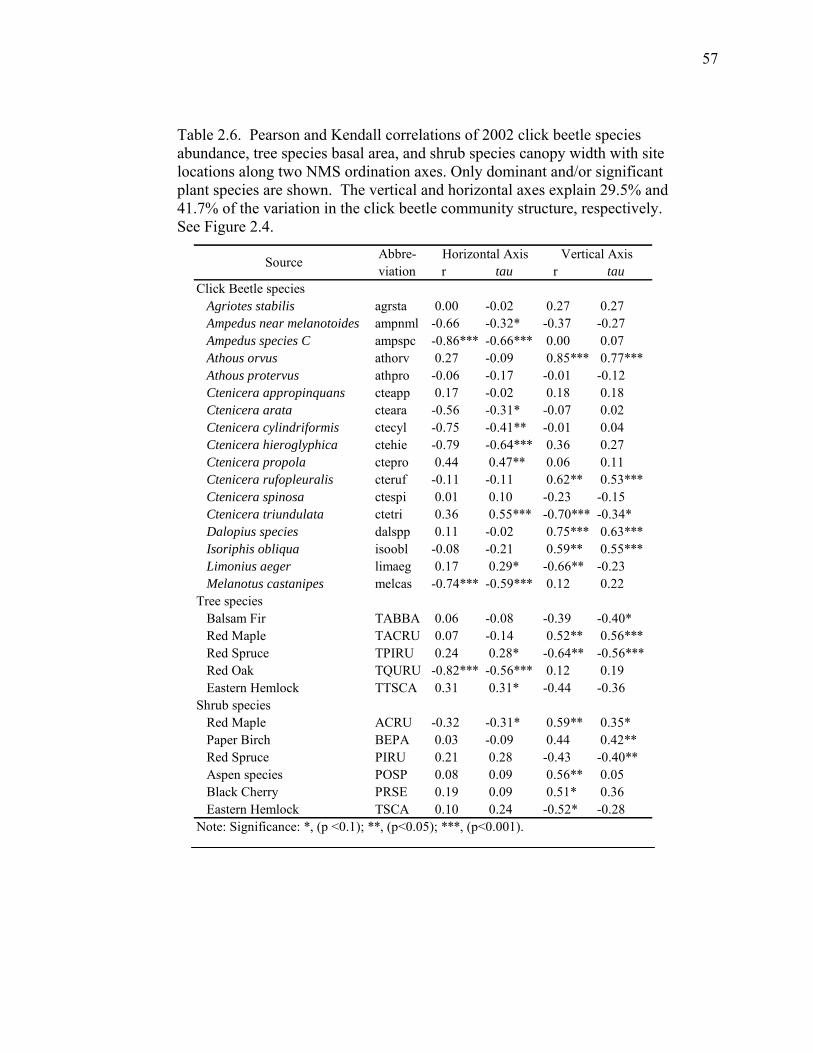
Table 2.6. Pearson and Kendall correlations of 2002 click beetle species abundance, tree species basal area, and shrub species canopy width with site locations along two NMS ordination axes. Only dominant and/or significant plant species are shown. The vertical and horizontal axes explain 29.5% and 41.7% of the variation in the click beetle community structure, respectively. See Figure 2.4.
Abbre- viation r tau r tau
Click Beetle species Agriotes stabilis agrsta 0.00 -0.02 0.27 0.27 Ampedus near melanotoides ampnml -0.66 -0.32* -0.37 -0.27 Ampedus species C ampspc -0.86*** -0.66*** 0.00 0.07 Athous orvus athorv 0.27 -0.09 0.85*** 0.77*** Athous protervus athpro -0.06 -0.17 -0.01 -0.12 Ctenicera appropinquans cteapp 0.17 -0.02 0.18 0.18 Ctenicera arata cteara -0.56 -0.31* -0.07 0.02 Ctenicera cylindriformis ctecyl -0.75 -0.41** -0.01 0.04 Ctenicera hieroglyphica ctehie -0.79 -0.64*** 0.36 0.27 Ctenicera propola ctepro 0.44 0.47** 0.06 0.11 Ctenicera rufopleuralis cteruf -0.11 -0.11 0.62** 0.53*** Ctenicera spinosa ctespi 0.01 0.10 -0.23 -0.15 Ctenicera triundulata ctetri 0.36 0.55*** -0.70*** -0.34* Dalopius species dalspp 0.11 -0.02 0.75*** 0.63*** Isoriphis obliqua isoobl -0.08 -0.21 0.59** 0.55*** Limonius aeger limaeg 0.17 0.29* -0.66** -0.23 Melanotus castanipes melcas -0.74*** -0.59*** 0.12 0.22Tree species Balsam Fir TABBA 0.06 -0.08 -0.39 -0.40* Red Maple TACRU 0.07 -0.14 0.52** 0.56*** Red Spruce TPIRU 0.24 0.28* -0.64** -0.56*** Red Oak TQURU -0.82*** -0.56*** 0.12 0.19 Eastern Hemlock TTSCA 0.31 0.31* -0.44 -0.36Shrub species Red Maple ACRU -0.32 -0.31* 0.59** 0.35* Paper Birch BEPA 0.03 -0.09 0.44 0.42** Red Spruce PIRU 0.21 0.28 -0.43 -0.40** Aspen species POSP 0.08 0.09 0.56** 0.05 Black Cherry PRSE 0.19 0.09 0.51* 0.36 Eastern Hemlock TSCA 0.10 0.24 -0.52* -0.28Note: Significance: *, (p <0.1); **, (p<0.05); ***, (p<0.001).
Source Horizontal Axis Vertical Axis
57
2.4.3. Relation of Click Beetle Species with Cover Types and Plant Species
In the 2001 individual species contrasts (p < 0.05), Athous brightwelli, Athous
orvus Becker, Dalopius spp., and I. obliqua, were more abundant in the hardwood cover
types, while Ctenicera arata, Ctenicera propola, C. triundulata, and Limonius aeger
were more abundant in the softwood cover types (Figure 2.2a). Of the specimens
captured in the hardwood cover types (Figure 2.3a), C. triundulata and Dalopius spp.,
were less abundant in the Blueberry than in either the Birch or the Maple. Of the
specimens collected in softwood cover types (Figure 2.3b), L. aeger was the only species
most abundant in the Spruce-Fir-Pine; it was intermediate in the Hemlock and least
abundant in the Fern-Hemlock. Dalopius spp. was most abundant in Fern-Hemlock and
least abundant in Spruce-Fir-Pine. Sericus brunneus was also least abundant in Spruce-
Fir-Pine, but it was most abundant in Hemlock. C. triundulata was least abundant in the
Spruce-Fir-Pine, while A. brightwelli was least abundant in Hemlock. A. stabilis was
most abundant in Hemlock, less abundant in Fern-Hemlock, and least abundant in
Spruce-Fir-Pine. In the 2002 individual species contrasts (p < 0.05), A. stabilis, Ampedus
near melanotoides, A. orvus, Ctenicera appropinquans Randall, Ctenicera hieroglyphica,
Dalopius spp., and Melanotus castanipes LeC. were more abundant in hardwood cover
types, while C. propola and C. triundulata were more abundant in softwood cover types
(Figure 2.2b). Of the specimens captured in the hardwood cover types (Figure 2.3c), C.
hieroglyphica and M. castanipes were most abundant in Oak. A. stabilis and C.
triundulata were most abundant in Birch-Maple. Dalopius spp. was least abundant in
Oak, more abundant in Aspen, and most abundant in Birch-Maple. Of the click beetles
collected in softwood cover types (Figure 2.3d), A. stabilis, C. propola, and Dalopius
58
spp. were most abundant in Hemlock. C. triundulata, was least abundant in Spruce-Fir-
Pine, more abundant in Pine, and most abundant in Hemlock.
The first four axes of the models of the CCA ordinations demonstrated that the
understory and overstory vegetation explained 66.4% and 70.6% of the variation in the
click beetle assemblage structure for 2001 and 2002, respectively (Appendix B.2). The
NMS ordinations separated stands according to hardwood and softwood dominance in
2001 (Figure 2.4a), and according to dominance by oak, non-oak hardwoods, and
softwoods in 2002 (Figure 2.4b), suggesting a relationship between the click beetle
assemblages and cover types. The 2001 NMS ordination explained 83.4% of the
variation in the click beetle assemblage structure, and correlations described the
association between click beetle species with the vegetation species (Table 2.5 and Figure
2.4c). Four click beetle species (A. orvus, C. hieroglyphica, Ctenicera rufopleuralis, and
Dalopius spp.) were associated with white birch and understory red maple. Four click
beetle species (A. brightwelli, C. appropinquans, Hemicrepidius memnonius Herbst, and
I. obliqua) were associated with aspen and understory black cherry. Three click beetle
species (Ampedus semicinctus Randall, C. propola, and L. aeger) were associated with
understory fir and hemlock and overstory pine and spruce. Six click beetle species
(Ampedus mixtus Herbst, C. arata, Ctenicera nitidula, C. rufopleuralis, C. triundulata,
and Dalopius spp.) were associated with overstory hemlock and understory hobblebush
and interrupted fern. The 2002 NMS ordination accounted for 71.2% of the variation in
the click beetle assemblage structure (Table 2.6 and Figure 2.4d). Click beetle
assemblages associated with the Oak cover type were more different from the other cover
types than those species associated with softwoods were from the other hardwood
59
species. This relationship was indicated by the horizontal axis, which accounted for
41.7% of the variation in the click beetle assemblages, separating the beetle species
associated with oak stands from those of other stands. The vertical axis, which accounted
for only for 29.5% of the variation, separated click beetle assemblages associated with
softwoods from those associated with hardwoods. Four click beetle species (A. orvus, C.
rufopleuralis, Dalopius spp., and I. obliqua) were associated with maple and understory
birch, aspen, and black cherry. Seven click beetle species (A. near melanotoides,
Ampedus species C, C. arata, Ctenicera cylindriformis Herbst, C. hieroglyphica, C.
propola, and M. castanipes) were associated with overstory oak and understory maple.
Two click beetle species (C. triundulata and L. aeger) were associated with spruce,
hemlock, and overstory fir.
2.5. Discussion
2.5.1. Click Beetle Assemblages and Plant Cover Types
My hypotheses for click beetle species richness and species abundance were
partially supported. Species richness was lowest in Spruce-Fir-Pine and highest in Oak.
Species abundance was lowest in Spruce-Fir-Pine and Pine and highest in Oak and
Maple. However, both species richness and species abundance were higher than
expected in Hemlock. Diversity was also generally higher in hardwood cover types than
softwood cover types. Similarity was generally low between hardwood and softwood
cover types. This indicated that in addition to species richness, abundance, and diversity
being lower in coniferous cover types (excluding hemlock), assemblages between these
cover types are different (Appendix B.3). The difference in species abundance, diversity,
60
and assemblage similarity between Oak and other non-oak hardwood cover types was
also noteworthy.
Many invertebrate communities living in forest soils are affected by the
composition of forest vegetation, and several studies have found differences in Elaterid
assemblages between hardwood- or softwood-dominated stands. Paquin and Coderre
(1997) conducted a survey in Canada of soil macroarthropod communities in three forest
types and ages-- deciduous (47 years), mixed (147 years), and coniferous (241 years).
The average abundance in the click beetle family was highest in the mixed forest and
lowest in the coniferous forest. Saetre et al. (1999) also found that the abundance of
many soil fauna taxa, including Elateridae, was higher in mixed spruce-birch stands than
in pure spruce stands in Sweden. They suggested that the birch leaf litter added substrate
and sustained moisture and therefore greatly influenced the soil fauna composition. In
contrast, Scheu et al. (2003) found that Elaterid biomass was greater in 30 year-old pure
spruce forests than in either pure beech or mixed stands; however, this result did not hold
over time, as the Elaterid biomass in the 120 year-old stands were not different between
the three cover types. The authors postulated that predators were of little importance for
Elaterids. Instead, the structuring factors seemed to be associated with the relatively
early growing stages of the stands. As spruce needles are less favorable than beech
leaves, they suggested the elaterid larvae may be able to survive on poorer food
substrates because of their long larval development and slow growth. This contrasting
result may be due to species-specific preferences. Since these three studies presented
only family-level information, it was not possible to determine vegetation preferences of
particular click beetles species. Ohsawa (2004) did identify click beetles to species and
61
found species-specific preferences for click beetles in Japan, identifying two species of
click beetles that preferred larch plantations, three species that were specific to stands
dominated by oaks but mixed with other broadleaved trees (secondary forest), and one
species that was specific to stands dominated by oak but mixed with coniferous species
(primary forest). Although the numbers of species among the three forest types were
similar, overall click beetle composition varied significantly.
2.5.2. Softwood Associates
Five species (A. near melanotoides, C. arata, C. propola, C. triundulata, and L.
aeger) were more abundant in the softwood cover types. In the softwood cover types, all
species except two (L. aeger and A. stabilis) had the lowest abundances in Spruce-Fir-
Pine and Pine. L. aeger, on the other hand, had the highest abundance in the Spruce-Fir-
Pine. C. triundulata is the only species that showed a difference in abundance between
Pine and Spruce-Fir-Pine, with higher abundance in Pine. All species except L. aeger (A.
stabilis, A. brightwelli Kirby, C. propola, C. triundulata, Dalopius spp., and S. brunneus)
had the highest abundances in Hemlock or Fern-Hemlock.
In 2001, three species (A. semicinctus, C. propola, and L. aeger) were correlated
with an increase in understory balsam fir and overstory white pine, red spruce, and
eastern hemlock. Six species (A. mixtus, C. arata, C. nitidula, C. rufopleuralis, C.
triundulata, and Dalopius spp.) were correlated with an increase in the overstory eastern
hemlock and red spruce and the understory interrupted fern and hobblebush, both located
in hemlock-dominated cover types. In 2002, likely due to a different array of vegetation
conditions sampled, C. triundulata and L. aeger were correlated with an increase in
62
understory and overstory red spruce and hemlock, and C. propola was correlated with an
increase in overstory red spruce. My results indicated that Spruce-Fir-Pine and Pine were
the least favored habitats within the softwood cover types for most click beetle species
(except L. aeger).
Most studies of click beetle species in coniferous forest types compared forest to
non-forest conditions rather than among coniferous types. For example, Strong et al.
(2002) compared click beetle assemblages in spruce-fir forest and edge to ski trails in
Vermont. Although low in numbers, five species (including L. aeger) were associated
with spruce-fir forest or edge or forest. Levesque and Levesque (1993) studied Elaterid
assemblages in Canada in non-forest habitats and a forest type dominated by white pine.
Of the 25 species captured in the stands dominated by white pine, 15 were also caught in
my study. Four of these species (C. propola, C. triundulata, L. aeger, and S. brunneus)
seemed to show preferences for specific softwood cover types in my study. However,
three of these species (C. appropinquans, C. cylindriformis, Dalopius spp., and M.
castanipes) had higher abundances in hardwood than softwood cover types. Brooks
(1960) described the regional habitats of Elaterids in southern Canada, separating the
coniferous forest formations from the grassland formations. Fifteen species (including A.
mixtus, C. nitidula, C. rufopleuralis, Ctenicera spinosa LeC., and S. brunneus) found in
my study are listed by Brooks (1960) as associated with the coniferous forest formations
of the Montane, Submontane, and Boreal Forest regions. Of these, my study found three
(C. arata, C. propola, and C. triundulata) were associated with softwoods, two (Agriotes
limosus LeC. and Athous rufifrons Randall) were species with few specimens but found
only in softwoods, one (C. appropinquans) was associated with hardwoods, and four
63
(Ampedus pullus Germar, Ctenicera mediana Germar, Denticollis denticornis Kirby, and
Lacon brevicornis [now named Danosoma brevicornis LeC.]) were species with few
specimens but found only in hardwoods. Six species (Agriotes fucosus LeC., A. stabilis,
Ctenicera cruciata L., C. hieroglyphica, L. aeger, and M. castanipes) found in forest
stands in my study are listed by Brooks as associated with the grassland formations of the
True Prairie and Eastern Parkland regions.
In a previous study (Chapter 1), three species of click beetles (C. arata, C.
nitidula, and L. aeger) were correlated with an increase in softwood basal area (p < 0.05,
at least 1 specimen per trap week summed between years). All three species were
associated with softwood vegetation species in this study, supporting my hypothesis of
click beetle species associated with softwood species.
2.5.3. Hardwood Associates
Ten species (A. stabilis, A. near melanotoides, Ampedus species C, A. brightwelli,
A. orvus, C. appropinquans, C. hieroglyphica, Dalopius spp., I. obliqua, and M.
castanipes) were more abundant in hardwood cover types. Blueberry was the least
favored by all species of click beetle identified in this study. C. hieroglyphica and M.
castanipes were most abundant in Oak. Dalopius spp. was least abundant in Oak, more
abundant in Aspen, and most abundant in Birch-Maple. A. stabilis and C. triundulata
were most abundant in Birch-Maple.
In 2001, four species (A. orvus, C. hieroglyphica, C. rufopleuralis, and Dalopius
spp.) were correlated with an increase in hardwood species, such as understory red maple
and understory and overstory white birch. Three click beetle species (A. brightwelli, C.
64
appropinquans, and I. obliqua) were correlated with an increase in understory black
cherry, and understory and overstory aspen. In 2002, although there was not a
completely distinct click beetle assemblage in Oak, other hardwood, or coniferous cover
types, assemblages in Oak were less similar to cover types with birch, maple, or aspen
than these assemblages were to each other. Assemblages in all hardwood cover types
were less similar to coniferous cover types than they were to each other, with Oak the
least similar to coniferous cover types. This difference was evident from the assemblage
similarity measures, which included only the presence or absence of a species.
There was further evidence from the NMS ordination, which included species
abundance, that differences between click beetle assemblages associated with Oak
(versus all other cover types) was greater than the difference between assemblages
associated with softwoods versus other hardwood cover types. Six click beetle species
(A. near melanotoides, Ampedus species C, C. arata, C. cylindriformis, C. hieroglyphica,
and M. castanipes) were associated with an increase in overstory red oaks and weakly
associated with understory red maple and overstory aspen. Four click beetle species (A.
orvus, C. rufopleuralis, Dalopius spp., and I. obliqua) were correlated with an increase in
understory aspen, black cherry, and white birch and understory and overstory red maple.
Therefore, in 2001, C. hieroglyphica was correlated with hardwood species in general
and C. arata was associated with softwood species, but each was associated with red oak
when this treatment was added in 2002.
Elaterid assemblages vary in stands composed of different hardwood species.
Axelsson et al. (1984) studied soil fauna in deciduous woodlands in Sweden and found
that Elateridae had the highest biomass within Coleoptera at both sites. While the
65
oak/birch/hazel site included several species the authors considered rhizophagous (e.g.
Agriotes species), the beech/ woodrush site was dominated by an omnivorous species.
Levesque and Levesque (1980) found that Elateridae assemblages in Quebec varied
across four deciduous forest types (birch, young maple, old maple, and mixed birch-
maple). Of the species in common between Levesque and Levesque and my study, all
but one were also captured in my hardwood stands, although two species (C. spinosa and
C. triundulata) were more abundant in my softwoods cover types. Four species had at
least seven specimens with at least 50% of the specimens in either the birch type (C.
appropinquans) or the mixed birch-maple type (C. hieroglyphica, A. collaris, and A.
stabilis).
In a previous study (Chapter 1), twelve click beetle species (A. stabilis, C.
cruciata, C. hieroglyphica, C. propola, C. triundulata, Elathous dicalceatus, Fornax
canadensis, I. obliqua, M. castanipes, Oxygonus montanus, S. brunneus, and Sericus
viridanus) were correlated with an increase in hardwood basal area (p < 0.05, at least 1
specimen per trap week summed between years). In this study, three of these species (C.
hieroglyphica, I. obliqua, and M. castanipes) were associated with specific hardwood
species, and four species (A. stabilis, C. hieroglyphica, I. obliqua, and M. castanipes)
were associated with hardwood cover types. However, one species (C. triundulata) was
associated with specific softwood species and softwood cover types. One species (C.
propola) was associated with softwood species and cover types in 2001, but was
associated with oaks when this tree species was included in the 2002 study. The other
species (E. dicalceatus, F. canadensis, O. montanus, S. brunneus, and S. viridanus) were
either not collected in high enough numbers or were not associated with either hardwood
66

or softwood species or cover types. Therefore, my hypothesis of click beetle species
associated with hardwood species was partially supported.
67
Chapter 3
INFLUENCE OF HARVEST GAPS AND COARSE WOODY MATERIAL
ON CLICK BEETLES (COLEOPTERA: ELATERIDAE)
IN MAINE’S ACADIAN FOREST
3.1. Abstract
I examined how the species richness, abundance, diversity, and assemblage
similarity of click beetles inhabiting coarse woody material (CWM) were affected by gap
harvesting and characteristics of the CWM (diameter, degree of decay, and wood type) in
Maine’s Acadian forest. Species assemblages varied between harvest treatments, canopy
conditions, CWM wood type (hardwood vs. softwood), and especially between CWM
decay classes and among diameter classes. Size of harvest gap did not influence the
species abundance of click beetles across the small range of gap sizes studied (0.01 to
0.21 ha), and there were few differences between the two harvest treatments. Four of the
most common species had higher abundances in closed canopy than harvest gaps. Click
beetle species richness and species abundance were higher in CWM that had larger
diameters and were more decayed. Click beetle diversity was higher in softwood than
hardwood CWM.
3.2. Introduction
Maintaining biodiversity in forest ecosystems while meeting economic goals for
wood production requires forest management that is based on sound ecological
principles. To achieve this goal, it has been recommended that forestry practices
68
emulate patterns of natural disturbances (e.g., insect outbreaks, fire, and windthrow)
using harvest arrays, variable retention, rotation schedule, and deadwood maintenance
(Franklin and Forman 1987, Franklin 1989, Hansen et al. 1991, Hunter 1993, Seymour et
al. 2002). Although there is a growing body of literature addressing this approach (Haila
et al. 1994, Bunnell 1995, Jonsell et al. 2005), there is still relatively little understanding
about the influence of forest management on the majority of forest species (Komonen
2001, Grove 2002a).
The Acadian Forest is considered to be a transitional ecoregion between the
boreal forest to the north and the eastern temperate forest to the south (Bailey 1995,
Lorimer and White 2003). Large, stand-replacing disturbances in the pre-European
settlement forest were unusual, with recurrence intervals of hundreds of years (Lorimer
1977, Seymour, et al. 2002, Lorimer and White 2003, Seymour 2005). Disturbances
occurred predominantly as small and frequent gaps, resulting in a forest structure
dominated by late-successional species in multi-aged stands. Therefore, a silvicultural
system modeled after this natural disturbance regime in Acadian forests would include
gap creation and the retention of biological legacies, including living retention trees and
deadwood (Seymour et al. 2002, Franklin et al. 1997).
Deadwood, including snags and downed coarse woody material (CWM), supports
a wide variety of animals, fungi, and plants and is vital for conserving biodiversity in
forests (Speight 1989, Lindenmayer and Franklin 2002). Diameter of the CWM is
important; usually larger diameters correspond to greater use or higher species richness
and abundance (Gutzwiller and Anderson 1987, Jonsell et al. 1998, Kolstrom and
Lumatjarvi 2000, Yee et al. 2001). Stage of decay also affects species assemblages, as
69

decomposing wood is occupied by a succession of species (Grove 2002a). Tree species
or wood type (hardwood or softwood) can affect saproxylic communities, but becomes
less important with advancing stages of decay (Jonsell et al 1998).
Harvest gaps in the forest canopy can have substantial influence on the forest
ecosystem, as forest harvesting often depletes the amount of deadwood through removal
of large living trees (potential deadwood), slash disposal, and site preparation (Fridman
and Walheim 2000). Harvesting can also alter the distribution of size and decay class
through the mechanical crushing of larger pieces in late-stage decay and through the
addition of small diameter slash (Freedman et al. 1996, Fraver et al. 2002. In some
intensively managed forests, many deadwood-dependent species are red-listed or
considered threatened (Kirby and Drake 1993, Ranius and Jansson 2000, Ehnstrom 2001,
Lindenmayer et al. 1996), and some species are now extinct (Kirby and Drake 1993).
Insects are the most numerous and diverse group of eukaryotic organisms
(Andrewartha and Birch 1984). Although insects mediate many important natural
processes within forest ecosystems (Crowson 1981, Wilson 1992), most are poorly
understood (Danks and Foottit 1989). Coleoptera is the largest order of insects and
includes ~40% of all arthropods (Grove and Stork 2000), and Elateridae (click beetles) is
the ninth most species rich family of Coleoptera, with approximately 10,000 described
and many undescribed species worldwide. Click beetles are generally regarded as pests
in agricultural systems, but many species live in forest soil and CWM without causing
any serious damage to living trees. In fact, click beetles have been shown to be important
as nutrient cyclers (Wolters 1989), as predators of forest pests (Morris 1951, Yano et al.
1984), and as prey for birds and other forest biota (Barron and Walley 1983, Holmes and
70
Robinson 1988, Heinrich and Bell 1995). Some species of click beetles are considered
threatened or endangered (Anon. 1999, Alexander 2003, Zach 2003), but the deficiency
of knowledge regarding most species in this family (especially outside Europe) is an
impediment to their conservation. Elaterids are an important taxa to study because the
family is species rich, numerically abundant, and can be sampled using relatively simple
trapping methods. Furthermore, elaterids are useful for forest biodiversity studies
because the species have diverse food and habitat preferences.
I hypothesized that creating small canopy gaps modeled after natural disturbance
patterns would retain adequate habitat structure for click beetles, thus maintaining
elaterid diversity and abundance in managed forests. I tested whether the abundance and
composition of click beetles living in CWM were affected by gap harvesting and CWM
characteristics, including decay class, diameter, and wood type (softwood or hardwood).
3.3. Methods
3.3.1. Study Site
This study took place in the Penobscot Experimental Forest (Figure C. 1) in east-
central Maine (44°50’ N, 68°35’ W). The dominant tree species in the forest include red
(Picea rubens Sarg.) and white spruce (P. glauca (Moench) Voss), balsam fir (Abies
balsamea (L.) Mill.), eastern white pine (Pinus strobus L.), eastern hemlock (Tsuga
canadensis (L.) Carr.), northern white cedar (Thuja occidentalis L.), red maple (Acer
rubrum L.), paper (Betula papyrifera Marsh.) and gray birch (B. populifolia Marsh.), and
quaking (Populus tremuloides Michx.) and bigtooth aspen (P. grandidentata Michx.).
The Penobscot Experimental Forest has a complicated history of insect outbreaks and
71
repeated partial cuttings that resulted in multi-cohort stand structures of many species (R.
Seymour, unpublished data). Soils range from glacial till ridges with well-drained or
sandy loams to flat areas between ridges with poorly to very poorly drained loams and
silt loams (Brissette 1996).
Sampling for this study used experimental plots established by the University of
Maine’s Acadian Forest Ecosystem Research Program, a long-term study comparing two
silvicultural systems patterned after the natural disturbance regime of the Acadian forest
(Saunders and Wagner 2005). The silvicultural systems include a 10% and 20%
expanding-gap harvest system with permanent reserve trees. The 10% harvest treatment
removes 10% of the canopy on a 10-year cutting cycle (range: 6.2 to 13.8%, assuming 5
m wide skid trails), with 10% of the basal area permanently reserved. The 20% harvest
treatment removes 20% of the canopy on a 10-year cutting cycle (range: 19.5 to 21.3%),
with 10 percent of the basal area permanently reserved. A basal area of 30% is retained
for one cutting cycle in gaps without sufficient advanced regeneration, and is then
reduced to the 10% permanent reserve at the next cycle. Each treatment is replicated
three times in 9.4 to 11.3 ha treatment plots using a randomized complete block design.
The first harvest for each block was applied in 1996, 1997, or 1998. At the time of this
study, vegetation in the gaps had recovered for 3 to 6 years since the harvest.
3.3.2. Field Invertebrate Sampling
I designed two experiments to compare click beetle assemblages in CWM of
different characteristics (diameter, type, and decay class). The first experiment compared
beetle assemblages in CWM in both the 10% and 20% harvest treatments in 2002. The
72
second experiment examined click beetle assemblages in CWM in the 10% harvest
treatment during 2001 and 2002 (Appendix C.3).
To collect click beetles from CWM, I constructed emergence traps of dark mesh
tents with clear collecting bottles, containing propylene glycol, located at the
approximately 1.0 m high peak (Figure C.2). I fitted the inverted upper collecting bottle
with a funnel to catch stronger flying insects; I positioned the lower collecting bottle
directly below the upper bottle to capture weaker flying insects that could not maneuver
into the funnel. I collected samples from mid-June through mid-September of 2001 and
2002, extracting samples biweekly. Insect samples were stored in 70% ETOH or pinned.
Adult click beetle specimens were identified to species by S. L. Thomas and S. LaPlant
and incorporated into the University of Maine Insect Collection.
To test the influence of the harvest treatments on click beetles in CWM, I
systematically searched all treatment plots for downed logs meeting specific
characteristics. These characteristics included harvest treatment (10% or 20%), canopy
condition (located in a harvest gap or under the closed canopy in the adjacent unharvested
forest matrix), CWM wood type (softwood or hardwood), diameter (small = 14-24 cm, or
large = 25+ cm), and two classes of decomposition based on Fraver et al. (2002). Only
logs in Decay Classes 2 and 4 were selected for my study. Logs identified in Decay
Class 2 have “wood that is sound to somewhat rotten; bark may or may not be attached;
branch stubs are firmly attached but only larger stubs are present; and log retains round
shape and lies on duff.” Decay Class 4 logs have “wood that is mostly rotten, “fluffy”
when dry and “doughy” when wet; branch stubs are rotted down; bark is detached or
absent (except Betula); and log is decidedly oval in cross section and usually
73
substantially buried in duff.” Therefore, there were 48 and 96 potential trap locations in
2001 (10% harvest treatment only) and 2002 (10% and 20% harvest treatments),
respectively (2 harvest treatments x 3 stands x 2 canopy conditions x 2 CWM wood types
x 2 decay classes x 2 diameter classes).
An emergence trap that enclosed a 1.0 m length of log was installed over each
selected log. For Decay Class 2 logs, the trap mesh was wrapped completely under the
log. For Decay Class 4 logs, the mesh was tucked between the leaf litter and the log,
without reaching beneath the highly decomposed material.
3.3.3. Analytical Approach
The principal response variables used to describe the click beetle assemblages
were species richness (number of species), total abundance (number of individuals),
species abundance (number of individuals of the most common species), diversity, and
assemblage similarity. I used Jaccard similarity measures, rarefaction, indicator species
analysis, general linear models, and non-metric multidimensional scaling to examine the
relationships between click beetle assemblages and the different trap location
characteristics. For analysis, emergence trap data were grouped in two ways.
First, I compared click beetle assemblages between harvest treatments (10% and
20%) for 2002. These analyses (referred to as Experiment 1) evaluated harvest treatment,
canopy condition, diameter, decay class, and wood type (hardwood or softwood).
Second, I compared beetle assemblages in the 10% harvest treatment during 2001 and
2002. Due to logistical difficulties, no differentiation was made between softwood and
hardwood logs in 2001; therefore, the wood characteristic “type” was not included in the
74
analysis. These analyses (referred to as Experiment 2) evaluated the effect of sample
year, canopy condition, diameter, and decay class. In both experiments, the diameter of
the smaller and larger ends (one meter apart) of each piece of CWM was averaged, and
this average diameter was used for all analyses.
I used cluster analysis of Jaccard percent similarity measures using internet-based
software provided by Brzustowski (2002) to compare similarity of species assemblages
between pooled samples for the different trap location characteristics. Rarefaction, which
takes both richness and abundance into account, was used to measure species diversity. I
used PAST (Hammer et al. 2001) to calculate the expected number of species derived
from random subsamples of the total abundance, comparing species diversity between
subsamples of similar sizes (Sanders 1968, Hurlbert 1971). Diversity between two
samples was considered significantly different when respective 95% confidence intervals
did not overlap. I used a t-test to determine significance between groups of stands for
click beetle richness and total abundance.
I assessed the affinity of each species for different trap location characteristics
with indicator species analysis (Dufrêne and Legendre 1997) using PC-ORD (McCune
and Mefford 1999). This method combines information on the faithfulness (present in all
samples of a group) and the exclusiveness (never present in other groups) of a species to
a particular group or habitat characteristic. Indicator values range from zero (no
indication) to 100 (perfect indication to a group without error). A Monte Carlo p-value
for each indicator value was determined as the proportion of 1,000 randomized trials with
an indicator value equal to or exceeding the observed indicator value. Because the
treatment plots had a deficit of large (>35 cm) diameter CWM (Fraver et al. 2002), I
75
separated diameter into the following three classes, with different numbers of traps per
class for 2001 and 2002, respectively: 14.0 - 24.5 cm (24, 54 traps), 24.6 - 34.5 cm (18,
35 traps), and >34.6 cm (6, 6 traps) and used these size classes for similarity measures,
species richness, total abundance, diversity, and indicator species analysis.
I examined the relationships between the individual click beetle species
abundances with various trap location characteristics using general linear models (PROC
GENMOD, SAS Institute). A negative binomial distribution was used because the data
were over-dispersed. Models were generated based on the main effects and their
interactions, selecting an optimal model with the second order Akaike Information
Criterion (Akaike 1974). Due to insufficient sample size of many species, only the 15
most common click beetle species were included. For Experiment 1, I generated general
linear models using harvest treatment, canopy condition, diameter, decay class, wood
type, species, and their interactions as main effects. For Experiment 2, I generated
general linear models using the variables year, canopy condition, diameter, decay class,
species, and their interactions as main effects. In the general linear models, CWM
diameter was used as a continuous variable.
To determine whether the size of a harvest gap influenced the abundance of the
emerging beetles, I also developed a reduced model based on trap locations only in
harvest gaps and using area of the gap as a main effect. For these reduced models, I was
concerned that harvest treatment and gap area were colinear, so models were generated
excluding either harvest treatment or gap area. Harvest treatment and gap area were not
significant for any reduced model (Table C.1).
76
3.4. Results
3.4.1. Description of taxa
I collected 1,058 click beetles of 60 different species, including two species
(Isorhipis obliqua Say and Fornax canadensis Brown) from Eunemidae, the false click
beetles, (Table C.2). Ctenicera triundulata Randall, Ampedus mixtus Herbst, and
Agriotes stabilis LeC. were the most common species, representing 20%, 13%, and 5% of
the total abundance, respectively. Sixteen species were singletons, and 23 species were
represented by only two to nine individuals. Click beetle abundance was higher for the
15 most common species in 2002 than in 2001 (p = 0.010, Table 3.1b, Table C.3b, Figure
C.3).
3.4.2. Harvest Treatment
In Experiment 1, species richness, total abundance, and diversity did not differ
between the 10% and 20% harvest treatments (Table 3.2a). However, assemblage
similarity, a measure of the overlap of species between habitats, was only 60%, indicating
a difference in species composition between the two harvest treatments. A. stabilis was a
significant indicator of the 20% harvest treatment (Table 3.3a). The mean abundances of
the 15 most common click beetle species were similar between the 10% and 20% harvest
treatments (p = 0.405, Table 3.1a).
3.4.3. Canopy Condition
In Experiment 1, species richness, total abundance, and diversity were similar
between closed canopy and harvest gap conditions (Table 3.2a). Ctenicera hieroglyphica
Say and Limonius aeger LeC. were significant indicators of closed canopy conditions
77
(Table 3.3a). Assemblage similarity was only 58%. For the fifteen most common click
beetle species, individual species responded differently to the canopy conditions (p =
0.001); no species were more likely to be found in harvest gaps, but four species (C.
hieroglyphica, Ctenicera propola LeC., Dalopius spp Brown, and L. aeger) were more
abundant in the closed canopy condition (Table 3.1a, Table C.1.3a, Figure 3.1a).
In Experiment 2, total abundance, species richness, and species diversity of click
beetles were similar in CWM in harvest gaps and under closed canopy conditions (Table
3.2b), but assemblage similarity was only 61%, suggesting a difference in species
composition. No species were found to be indicators of either canopy condition (Table
3.3b). The mean abundance of the 15 most common click beetle species was higher
under a closed canopy than in harvest gaps (p = 0.014, Table 3.1b, Table C.3b, Figure
3.2).
3.4.4. Coarse Woody Material Characteristics
3.4.4.1. Wood Type
In Experiment 1, species richness and total abundance were similar between
hardwood and softwood CWM; however, species diversity was higher in softwood CWM
(Table 3.2a, Figure C.4a). No species were indicators of softwood and hardwood logs
(Table 3.3a), but assemblage similarity was 64%, indicating a difference in species
composition. The mean abundances of the 15 most common click beetle species were
similar between the softwood and hardwood CWM (p = 0.177, Table 3.1a, Table C.3a).
78
3.4.4.2. Decay Class
In Experiment 1, species richness and total abundance were 46% and 56% higher
in Decay Class 4, respectively, but species diversity was higher in Decay Class 2 (Table
3.2a, Figure C.4b). C. triundulata was a significant indicator of Decay Class 4 (Table
3.3a), and the species composition was quite different (56% similarity). The 15 most
common click beetle species responded individually to the decay class of CWM (p <
0.001). Three species (A .semincinctus, A. scapullaris, and M. castanipes) were more
abundant in the less decayed (Class 2) CWM, and six species (A. brightwelli, Athous
orvus Becker, C. hieroglyphica, C. triundulata, Dalopius spp., and L. confusus) were
more likely to be found in the more decayed (Class 4) CWM (Table 3.1a, Table C.3a,
Figure 3.1b).
In Experiment 2, species richness and total abundance were 20% and 39% higher
in Decay Class 4 (more decayed), respectively, but species diversity was similar between
the two stages of decay (Table 3.2b). One species (C. triundulata) was an indicator of
Decay Class 4 (Table 3.3b). The similarity between species assemblages was low (only
57%). The 15 most common click beetle species responded individually to the decay
classes (p < 0.001), with four species (Ampedus semicinctus Randall, Athous scapullaris
Say, I. obliqua, and Melanotus castanipes LeC.) being more abundant in less decayed
CWM and four species (Athous brightwelli Kirby, C. triundulata, Dalopius spp., and
Limonius confusus LeC.) being more abundant in more decayed CWM (Table 3.1b, Table
C.3b, Figure C.5).
79
Table 3.1. General linear model results of click beetle species abundance for A) Experiment 1 and B) Experiment 2.
Source DF Chi-Square Pr > ChiSqA) Experiment 1 Harvest Treatment 1 0.69 0.405 Site within Harvest Treatment 4 24.72 <0.001 Beetle Species 14 204.06 <0.001 Type (Softwood v. Hardwood) 1 1.83 0.177 Diameter 1 29.8 <0.001 Canopy Condition 1 11.06 0.001 Decay Class 1 11.29 0.001 Beetle Species * Canopy Condition 14 48.19 <0.001 Beetle Species * Decay Class 14 77.29 <0.001 Beetle Species * Decay Class 14 52.62 <0.001B) Experiment 2 Year 1 7.21 0.010 Site 2 10.44 0.008 Beetle Species 14 64.91 <0.001 Decay Class 1 0.11 0.608 Canopy Condition 1 0.18 0.014 Diameter 1 2.08 <0.001 Diameter * Canopy Condition 1 13.24 0.008
80
Table 3.2. Summary of richness (number of species), total abundance (number of individuals), and rarefaction-estimated species diversity of click beetles for A) Experiment 1 (averaged by CWM type) and B) Experiment 2.
Number Species Totalof Sitesa Richness Abundance
A) Experiment 1 Harvest Treatment 10% Removal 48 4.7 7.9 36.9+/-1.0 (355) 20% Removal 48 4.8 9.0 35.0+/-0.1 (355) Type Hardwood 48 4.9 9.3 45.4+/-1.2 (380) Softwood 48 4.6 7.6 53.8+/-0.4 (380)d
Canopy Condition Gap 48 4.5 8.0 55.9+/-0.4 (420) Closed Canopy 48 5.0 8.9 55.1+/-0.9 (420) Decay Class Decay Class 2 48 3.9 6.6 55.9+/-0.3 (360)d
Decay Class 4 48 5.6d 10.3d 43.5+/-1.8 (360) Diameter Class 14-24.75cm 54 4.2 6.7 30.3+/-2.1 (110)
39.0+/-1.5 (270)d
25-34.75cm 35 4.7 8.5 26.3+/-1.6 (110)31.0+/-0.2 (270)
35cm + 6 10.0d 24.0d 17.0+/-0.2 (110)e
B) Experiment 2 Canopy Condition Gap 24 7.1 7.1 32.0+/-0.0 (165) Closed Canopy 24 7.5 7.5 31.8+/-0.4 (165) Decay Class Decay Class 2 24 6.5 6.1 27.0+/-0.0 (135) Decay Class 4 24 7.8c 8.5d 26.6+/-1.5 (135) Diameter Class 14-24.75cm 24 7.0 5.9 23.1+/-1.8 (75)
27.0+/-1.2 (110)d
25-34.75cm 18 6.2 6.8 20.1+/-1.4 (75)228.+/-0.4 (110)
35cm + 6 10.5d 14.8d 22.4+/-0.7 (75)aAveraged between CWD wood type traps for Experiment 1, bRarefaction-estimated number of species +/- SD (number of individuals in subsample),cHighest class (p = 0.10), d,eHighest and lowest class (p = 0.05).
Source Diversityb
81
Table 3.3. Indicator species analysis of click beetle species for A) Experiment 1 and B) Experiment 2 (the total number collected is averaged between softwood and hardwood types). Only significant species (p = 0.1) with an IV of at least 25 are shown.
Total number IndicatorSource Species collected Value pA) Experiment 1 Harvest Treatment 10% Removal No species 20% Removal Agriotes stabilis 35 34.4 0.002 Type Hardwood No species Softwood No species Canopy Condition Gap No species Closed Canopy Ctenicera hieroglyphica 25 27.1 0.001
Limonius aeger 24 27.3 0.001 Decay Class Decay Class 2 No species Decay Class 4 Ctenicera triundulata 151 70.7 0.001 Diameter Class 14-24.75cm No species 25-34.75cm No species 35cm + Agriotes collaris 8 44.4 0.002
Ampedus mixtus 121 35.7 0.097Athous brightwelli 14 27.8 0.020Athous rufifrons 35 64.0 0.001Ctenicera hieroglyphica 25 53.0 0.003Ctenicera triundulata 151 49.0 0.021Dalopius species 33 37.6 0.009Limonius aeger 24 39.4 0.013Limonius confusus 36 55.5 0.002
B) Experiment 2 Canopy Condition Gap No species Closed Canopy No species Decay Class Decay Class 2 No species Decay Class 4 Ctenicera triundulata 73 51.3 0.024 Diameter Class 14-24.75cm No species 25-34.75cm No species 35cm + Ampedus mixtus 46 28.6 0.008Note: An indicator value approaching 100 denotes the presence of a species and signifies a particulargroup without error. P values were determined using a Monte Carlo test with 1000 permutations andrepresents the probability of an indicator value greater than or equal to the observed indicator value.
82
Figure 3.1. Relative abundance of beetle species in Experiment 1 for A) Harvest Gap and Closed Canopy and B) Decay Class 2 and Decay Class 4. Individual species abundances in parentheses.
Lim
oniu
s co
nfus
us (3
6)
Cte
nice
ra h
iero
glyp
hica
(25)
Ampe
dus
mix
tus
(121
)
Mel
anot
us c
asta
nipe
s (2
1)
Atho
us o
rvus
(22)
Atho
us ru
fifro
ns (3
5)
Rel
ativ
e Ab
unda
nce
of B
eetle
s
0.00
0.25
0.50
0.75
1.00
Decay Class 2 Decay Class 4
Lim
oniu
s ae
ger (
24)
Cte
nice
ra p
ropo
la (1
5)
Dal
opiu
s sp
ecie
s (3
3)
Ampe
dus
luct
uosu
s (2
1)
Cte
nice
ra tr
iund
ulat
a (1
51)
Agrio
tes
stab
ilis (3
5)
Ampe
dus
sem
icin
ctus
(43)
Atho
us b
right
welli
(14)
Atho
us s
capu
llaris
(23)
* * * **
* *
*
*
Lim
oniu
s co
nfus
us (3
6)
Cte
nice
ra h
iero
glyp
hica
(25)
Ampe
dus
mix
tus
(121
)
Mel
anot
us c
asta
nipe
s (2
1)At
hous
orv
us (2
2)
Atho
us ru
fifro
ns (3
5)
Rel
ativ
e A
bund
ance
of B
eetle
s
0.00
0.25
0.50
0.75
1.00
Harvest GapClosed Canopy
Lim
oniu
s ae
ger (
24)
Cte
nice
ra p
ropo
la (1
5)D
alop
ius
spec
ies
(33)
Ampe
dus
luct
uosu
s (2
1)
Cte
nice
ra tr
iund
ulat
a (1
51)
Agrio
tes
stab
ilis (3
5)
Ampe
dus
sem
icin
ctus
(43)
Atho
us b
right
welli
(14)
Atho
us s
capu
llaris
(23)
** *
*
A
B
83
3.4.4.3. Diameter
In Experiment 1, click beetle species richness was 137% and 115% higher in the
large diameter class than in the small and medium diameter classes, respectively (Table
3.2a). Click beetle total abundance was 260% and 183% higher in the large diameter
class than in the small and medium diameter classes, respectively. Conversely, species
diversity decreased with CWM diameter (Table 3.2a, Figure C.4c). Nine species
(Agriotes collaris LeC., A. mixtus, A. brightwelli, Athous rufifrons Randall, C.
hieroglyphica, C. triundulata, Dalopius spp., L. aeger, and L. confusus) were indicators
of the largest diameter class, while no species were indicators of the two smaller classes
(Table 3.3a). The two smaller classes were 67% similar in species assemblage, but the
difference between the larger diameter class with the middle and smallest class was
greater, at 47% and 46% assemblage similarity, respectively. The mean abundance of the
Figure 3.2. General linear model response of the abundance of the most common click beetle species in all trap locations for Experiment 2 with diameter and harvest gap or closed canopy condition.
Coarse Woody Debris Diameter
10 20 30 40 50 60 70
Mea
n B
eetle
Abu
ndan
ce
0
1
2
3
4
5Harvet GapClosed Canopy
84
15 most common click beetle species increased with diameter of the CWM (p < 0.001,
Table 3.1a, Table C.3a).
In Experiment 2, click beetle species richness was 49% and 70% higher in the
large diameter class than in the small and medium diameter classes, respectively (Table
3.2b). Click beetle total abundance was 150% and 117% higher in the large diameter
class than in the small and medium diameter classes, respectively. Species diversity was
lower in the middle class than in the smallest class (Table 3.2b, Figure C.4d). One
species (A. mixtus) was an indicator of the largest class, but no species were indicators of
the two smaller classes (Table 3.3b). Assemblage similarity among diameter classes was
quite low. The two smaller classes were only 59% similar in species assemblage, and the
difference between each of these with the larger diameter class was 56% and 49%,
respectively. The mean abundance of the 15 most common click beetle species increased
more dramatically with CWM diameter under the closed canopy than in harvest gaps (p <
0.008, Table 3.1b, Table C.3b, Figure 3.2).
3.5. Discussion
3.5.1. Harvest Gaps
3.5.1.1. Gap Size and Harvest Treatment
I found that size of the harvest gap did not influence click beetle abundance in
downed logs, and there were few differences between the 10% and 20% harvest
treatments. Species richness, diversity, total abundance, and individual abundances of
the most common species were similar, and only A. stabilis was an indicator of the 20%
harvest treatment. However, there were differences in species composition between the
85
harvest treatments, mostly of uncommon species (fewer than 6 specimens).There are
several possible explanations for the general lack of response. First, the range of gaps
sizes was relatively limited (0.01 to 0.21 ha). Second, the maximum area of the harvest
gaps was relatively small, so that even the largest gaps were still influenced by the
surrounding stand. An experiment in a bottomland hardwood forest in South Carolina
that created canopy gaps of different sizes (0.13, 0.26, and 0.50 ha) found no differences
in the abundance of insect herbivores (Ulyshen et al. 2005) or carabid predators (Ulyshen
et al. 2006). Third, the retention trees that were distributed throughout the harvest gaps
further reduced the influence of the canopy openings.
3.5.1.2. Canopy Condition
Many saproxylic species can live in sun-exposed deadwood (Jonsell et al. 1998,
Lindhe 2004); in fact some species specialize in these environments (Kaila et al. 1997).
However, other species require or are more abundant in shaded deadwood (Hilszczanski
et al. 2005), especially species living in later stages of wood decay (Jonsell et al. 1998).
The 0.1 and 0.2 ha harvest gaps influenced the click beetles species assemblages.
The species composition differed, with 39-42% of the species found exclusively in either
harvest gaps or under closed canopy. Four of the most common species were found in
greater abundances in CWM under a closed canopy, and two of these species were
indicators of closed canopy. None of the most common species had higher abundances in
the harvest gaps, and no species were indicators of harvest gaps. However, my results
were not as dramatic as those in some studies of sun-exposed deadwood in clearcuts (e.g.
Kaila et al. 1997). This is not surprising, as the harvest created relatively small gaps for
both harvest treatments and retained trees throughout the gaps that reduced sun exposure.
86
3.5.2. Coarse Woody Material Characteristics
Speight (1989) defines saproxylic insects as those that are “dependent, during
some part of their life cycle, upon the dead or dying wood of moribund or dead trees
(standing or fallen), or upon wood-inhabiting fungi, or upon the presence of other
saproxylics.” Deadwood-dependent beetles outnumber all terrestrial vertebrates by 2-to-
1 (Parker 1982, Hunter 1990), and saproxylics comprise a substantial percentage of forest
insects (Kohler 2000, Martikainen et al. 2000, Siitonen 2001). Saproxylic insects
respond to a range of characteristics in deadwood, including those assessed in this study.
3.5.2.1. Wood Type
Recently dead wood is often colonized by insect species with narrow host
specificity, but as decomposition advances, there is less host specificity to individual tree
species, although there usually remains differentiation in saproxylic species assemblages
between hardwood and softwood CWM (Jonsell et al 1998, Kolström and Lumatjarvi
2000, and Wikars 2002). However, in this study, we found no difference between
hardwood and softwood CWM for most measures of click beetle assemblages.
Nevertheless, softwood CWM had higher diversity than hardwood CWM, and beetle
assemblage similarity was only 64%, demonstrating a difference in species composition
between wood types. These results may be due to our use of CWM in later stages of
decay, where host specificity is less likely, and to the possibility that other CWM
characteristics were more important in determining species assemblage than wood type.
3.5.2.2. Decay Class
A succession of insect species colonize wood as it decays. Fresh CWM (e.g.
Decay Class 1) is inhabited by a distinct fauna that often require fresh phloem or
87
sapwood (Hammond et al. 2004). As wood decomposes (Decay Classes 2-4), assisted by
suites of fungus species, the species richness of fungivores, scavengers, and predators
increases in response to increasing microhabitat diversity (Siitonen 2001). My study
reflected this succession. I deliberately avoided the early stage, as Elateridae are not
common to fresh deadwood, yet I still observed a difference between the later stages of
decay.
In this study, click beetle species richness and total abundance were higher in
Decay Class 4, and one species was an indicator of Decay Class 4. Four of the most
common click beetle species were more abundant in Decay Class 2, and six of the most
common species were more abundant in Decay Class 4. Assemblage similarity was low
(56-57%), suggesting a difference in species composition between decay classes.
Although few studies have been done on non-pest species, it is assumed that most click
beetle species in the later decay classes of CWM are scavengers and predators (Gur’yeva
1978), following the basic trend found by Siitonen (2001). In European forests, where
they have been studied more thoroughly, the preponderance of rare and endangered
invertebrates are found in the later stages of decomposing wood (Ehnstrom 2001). With
lack of availability of CWM and the reduced duration of later stages of decomposition
due to CWM crushing during harvest (Freedman et al. 1996), North American forests
may reflect the same pattern.
3.5.2.3. Diameter
The size of the deadwood is important to most saproxylic species (Appendix C.2).
Some species are able to use a wide range of downed CWM sizes, but many species seem
to rely on large-sized deadwood. As a result, there are different species assemblages in
88
CWM of increasing sizes. There is generally a positive relationship between CWM
diameter and species richness and abundance (Jonsell et al. 1998, Grove 2002a,
Hammond et al. 2004, but see Araya 1993), and in this study, click beetle species
richness and total abundance were higher in the largest diameter class. However,
diversity decreased with increasing diameter. Assemblage similarity was low between
the largest diameter class and the two smaller classes, indicating difference in species
composition. Further, no species were indicators of the smaller diameter logs, but nine
species, including A. mixtus, were indicators of larger diameter CWM (35+ cm).
Hammond et al. (2004) also lists A. mixtus as an indicator of larger diameter (41+ cm)
logs. In Europe, a number of click beetle species that are listed as endangered or
vulnerable live in large diameter CWM, snags, or hollow trees (Anon. 1999, Ranius and
Jansson 2000, Ranius and Jansson 2002, Zach 2003). However, not all species seem to
respond to diameter; Ranius and Jansson (2000) determined that M. castanipes
abundance in hollow trunks was not correlated with diameter, as was found in my study
with downed CWM.
Other factors being equal, larger diameter trees and CWM generally decay more
slowly, providing a more stable microclimate that benefits particular invertebrate species
(Palm 1959). For example, the endangered click beetle Limoniscus violaceus Muller
appears to require decaying wood at a certain moisture content to survive (Zach 2003).
Larger diameter CWM can also maintain a greater diversity of fungi, including those
species that are specific to larger wood pieces (Grove 2002a). Click beetles are
commonly assumed to be generalists, presumably increasing in numbers with increased
prey items, but there are several species with known prey or habitat requirements. For
89
example, Elater ferrugineus is habitually found where its prey, Dorcus parallelipedus
(Coleoptera: Lucanidae) is active, although it is also known to prey on the threatened
scarab beetle (Osmoderma eremita) (Svensson et al. 2004). Furthermore, several
endangered species in Europe are known to have habitat requirements specific to wood
decomposed by certain fungus species (Anon. 1999). Although I did not assess the fungi,
it is likely some beetle species I collected also respond to specific rot types or prey
species that were dependent on particular fungal species or CWM diameters (Appendix
C.2).
3.6. Conclusion
The ecological importance of CWM (both snags and downed logs) quantity and
quality is becoming well-known. Evidence a number of studies indicate that Elateridae,
as with many other saproxylic fauna, utilize a wide variety of CWM characteristics.
Based on the work presented here, providing the greatest diversity of habitats for
Elateridae should include providing CWM of specific sizes, decay classes, wood types,
and overtopping canopy conditions (gaps and closed canopy). Therefore, managing for
Elaterid diversity in Acadian Forest stands appears to require addressing the temporal and
spatial continuity of CWM characteristics.
90
EPILOGUE
Summary
The research on Elaterids in the Acadian forest presented in the three preceding
chapters had the following objectives:
1. Investigate whether click beetle assemblages and species abundance of
flying adults varied with stands that developed following clearcut,
shelterwood, and selection harvesting.
2. Determine whether stand conditions (stand structure, vegetation
composition, and deadwood conditions) influenced click beetle
assemblages and species abundance of flying adults.
3. Assess whether the composition of click beetle assemblages and
abundance of individual species emerging from soil were affected by
the species composition of overstory and understory vegetation.
4. Examine whether CWM characteristics (stage of decay, diameter, and
wood type [softwood or hardwood]) influenced the assemblage and
species abundance of emerging adult click beetles.
5. Document the influence of gap harvesting and CWM conditions on the
assemblages and species abundance of click beetle adults emerging
from soil and CWM.
The first and second objectives were addressed using towers with flight-intercept
traps to capture insects at seven different heights in the canopy of forest stands that
developed following clearcut, shelterwood, and selection harvesting (Chapter 1).
91
Abundances of specific species and click beetle assemblage, measured by diversity,
richness (numbers of species), overall abundance (numbers of individuals), and
assemblage similarity, varied among stands generated by the different harvest methods.
Stand characteristics (vegetation structure, composition, deadwood, and relative canopy
height) were measured, revealing that click beetle assemblages varied with each stand
characteristic, and that, for the stand characteristics, both species richness and species
abundance was best predicted by hardwood basal area. Apart from a precursor study
associated with this one (Su and Woods 2001), I have found no other studies have
captured Elaterids throughout the forest canopy. It was exciting to find that click beetles
are commonly found high in the canopy of Acadian forest stands. Relative canopy height
also was found to be a better measure of click beetle species richness than harvest
treatment and absolute height above the ground.
The third objective was addressed in Chapter 2 where emergence traps placed
over the soil were used to capture adult beetles as they emerged in five hardwood (Maple,
Birch, Aspen, Blueberry, and Oak) and four softwood (Spruce-Fir-Pine, Pine, Hemlock,
and Fern-Hemlock) cover types. Click beetle assemblages varied significantly among
vegetation conditions. Although click beetle assemblage overlapped in oak, other
hardwood, or coniferous stands, assemblages in oak were less similar to stands with
birch, maple, or aspen than these stands were to each other. Assemblages in all
hardwood stands were less similar to coniferous stands than they were to one other, with
oak stands being the least similar to coniferous stands. Five species of click beetle were
more abundant in softwood stands, and nine species were associated with increased
presence of specific softwood tree and shrub species. Ten species of click beetle were
92

more abundant in hardwood stands, and ten species were associated with increased
amounts of specific hardwood tree and shrub species, including six species associated
with oak stands.
Chapter 3 addressed objectives four and five using emergence traps to capture
adult beetles as they emerged from either soil or CWM in stands that were treated with
two gap-harvesting systems designed based on patterns of natural disturbance in the
Acadian forest. Species assemblages varied between harvest treatments, canopy
conditions, CWM wood type (hardwood vs. softwood), and especially between CWM
decay classes and among diameter classes. There were few differences between the two
harvest treatments, and size of harvest gap did not influence the species abundance of
click beetles across the small range of gap sizes studied (0.01 to 0.21 ha). Four of the
most common species had higher abundances in closed canopy than harvest gaps. Click
beetle species richness and species abundance were higher in CWM that had larger
diameters and were more decayed. Click beetle diversity was higher in softwood than
hardwood CWM.
Strengths and Limitations
In the first study (Chapter 1), pitfall traps, malaise traps, and non-baited intercept
traps were hung from towers. Malaise traps are generally less efficient at capturing
beetles (but see Ohsawa 2004), so the lack of beetle capture in our study was expected
and therefore not discussed. Many Elaterid-specific studies use pitfall traps, primarily in
agricultural studies, where species commonly move along the ground. However, some
forest studies have also captured Elaterid adults in pitfall traps (e.g., Levesque and
93
Levesque 1993, Strong et al. 2002), so it was surprising to capture no click beetles in our
pitfall traps. Non-baited flight intercept traps collect a large number of flying beetles and
can be distributed throughout the canopy, so this was a good methodological choice for
the first study. However, flight-intercept traps capture adult beetles after they have
emerged from their larval habitat, so they tend to measure overall stand abundance rather
than abundance from specific sites. These traps were useful for studying the abundance
of Elaterids in the canopy rather than only on or near the forest floor. Although the traps
were placed up to 11 m into the stands, the traps did not reach to the tops of the canopy in
the tallest stands, especially the selection harvest stands. Thus, this study could have
been improved had traps been placed fully throughout as well as above the canopy of
each stand.
Emergence traps were used in Chapters 2 and 3 because they effectively capture
adult beetles as they emerge from their larval habitat. As a result, emergence traps are
excellent for measuring beetle relationships with site-specific conditions. The Chapter 2
study was originally designed to include nutrient testing of samples of the top soil layers.
Several studies have suggested or concluded that soil nutrients and/or mineral soil type
are important determinants of Elaterid habitats (David et al. 1993, Ponge et al. 1997,
Saetre et al. 1999, Scheu et al. 2003). Including a nutrient dimension of this study would
have improved this study by providing a link from vegetation composition to the soil
inhabitants.
The study presented in Chapter 3 was limited in two ways. First, only the two
harvest treatments were compared. The study could have been improved if it had
included the untreated control stands with natural gaps in the comparison, either by using
94
stands from all three (controls and two harvest treatments) or at least comparing the
control stands to stands of one harvest treatment. In this way, it would have been
possible to more effectively test differences between the harvest methods and the
untreated control plots. Second, the study was limited by the results of the harvest
treatments. For example, the number of logs (CWM) of the correct combination of
characteristics was quite low in each stand. It was difficult to find large diameter logs
with specific combinations of characteristics (softwood or hardwood, decay class 2 or 4,
in the gap or in the forest matrix). Decay classes 2 and 4 were chosen because they were
most easily distinguished from one another. However, CWM pieces in decay class 3 were
most common, thus limiting opportunities for trap placement. This limitation may
change as the long-term study progresses, since trees are being retained in harvest gaps.
Some of these retention trees will become snags and downed logs, increasing the number
of possible trap sites, as well as providing a wider and more consistent diameter range of
the various downed log types. It was possible to wrap the emergence traps fully around
the decay class 2 logs, but for the decay class 4 logs the edges of the traps were placed
beneath the leaf litter, leaving the connection in place with the soil. This design was
appropriate for restricting intrusion from epigeal insects, but may not have fully separated
the decay class 4 logs from the surrounding soil, so measurement of click beetle
populations in the soil may have been affected by the presence of nearby CWM
(Chershire 1988, Marra and Edmonds 1998, Jabin et al. 2004). However, the sites
selected in for traps in this study deliberately avoided locations with nearby CWM, thus
limiting any effect of CWM on the soil traps.
95
Conservation and Forest Management Implications
Results and observations from this study have several implications for
maintaining biodiversity in managed forests. First, was the apparent importance of
vegetative composition in forest stands. Click beetle richness and overall abundance
were higher in stands dominated by deciduous trees, and many click beetle species were
associated with specific species of hardwood trees. Other species of click beetle had
higher abundances in coniferous stands, even in stands that were almost pure pine or pure
spruce-fir-pine with little to no moss or understory. Click beetle assemblages also varied
among stands dominated by different hardwood species (e.g., oak or maple) or stands
dominated by different softwood species (e.g., hemlock or pine). Therefore, maintaining
Elaterid diversity at the landscape level appears to require that a wide array of stands
dominated by different deciduous and/or coniferous species should be maintained.
Second was the importance of structural diversity in forest stands. In the first
study, click beetle richness, total abundance, and diversity increased with stand structural
diversity. In the third study, the small size of the harvest gaps and the increased structure
provided by the retention trees in harvest gaps appeared to help mitigate negative effects
of harvest gaps. Therefore, incorporating structural diversity into silvicultural practices
at the stand level, even in traditional methods like clearcut, shelterwood, and selection
harvest systems, may help maintain Elaterid diversity (e.g., Vanha-Majamaa and Jalonen
2001).
Third was the importance of deadwood (both snags and downed logs) quantity
and quality, including type (hardwood or softwood), diameter, and stage of decay.
Deadwood-dependent beetles outnumber all terrestrial vertebrates by 2-to-1 (Parker
96
1982), and saproxylics (fauna dependent on deadwood) comprise a substantial proportion
of forest insects. Differences in click beetle assemblages in softwood and hardwood logs
were found in this study. Other studies have found considerable differentiation in
saproxylic species assemblages between deadwood types (Jonsell et al. 1998, Kolstrom
and Lumatjarvi 2000, Wikars 2002, and Jonsell et al. 2004). As wood decomposes,
assisted by a wide array of fungal species, the species richness of fungivores, scavengers,
and predators increases in response to increasing microhabitat diversity (Siitonen 2001).
Several Elaterid species were found in this study to be nearly exclusive to either Decay
Classes 2 (less decomposed) or 4 (more decomposed) logs. In European forests, where
invertebrates have been studied more thoroughly, the preponderance of rare and
endangered invertebrates are found in the later stages of decomposing wood (Ehnstrom
2001). With the loss of later stages of decomposition due to harvest crushing (Freedman
et al. 1996), North American forests may reflect the same pattern of rare and endangered
species. Although some saproxylic species are able to use a wide range of deadwood
diameters, many species rely on large diameter pieces. Thus, there is generally a positive
relationship between deadwood diameter and species richness and abundance (Jonsell et
al. 1998, Grove 2002a, Hammond et al. 2004, but see Araya 1993). As a result, there are
different species assemblages in deadwood of increasing sizes. Results for click beetles
from this study corroborated findings of these other studies; moreover, as diameter size
class increased, the abundance of logs in the forest stands decreased (Fraver et al. 2002).
Forest managers are beginning to consider deadwood retention as part of their
silvicultural objectives by permanently retaining large trees in stands so that they can
eventually become deadwood (Seymour 2005), and by deliberately creating snags or high
97
stumps (Kaila et al. 1997, Jacobs 2005, Lilja et al. 2005). These modifications
addressing the diversity and continuity of deadwood may help to sustain biodiversity in
managed forests.
Future Directions
Results from the studies presented in this dissertation suggest several potential
directions for future research. First, a greater understanding about the importance of leaf
litter and soil nutrients and mineral soil type on forest-dwelling Elateridae is needed.
One approach could involve selecting several sites with similar forest cover types but
different soil types (e.g., Ponge et al. 2003), but to identify specimens to species to better
understand the preferences of individual species rather than simply summing abundance
for the family. Second, it would be helpful to use rearing studies that determine the food
preferences and length of the larval stage for different Elaterid species. Third, it would
be interesting to better understand the click beetle species dispersion, including how far
they disperse from their emergence point and how the females choose egg-laying sites
(especially for CWM). One study released several hundred marked specimens of one
species in an island field (Yamamura et al. 2003), however this was a pest species, easily
accessible and relatively easily recaptured. In a forest system, telemetry would be more
expensive but perhaps more beneficial (see Ranius 2006). Fourth, deadwood should be
studied more intensely. For example, many studies have noted the impact of different
fungal species on the invertebrate populations. Although there are no known species-
specific fungal associations with click beetles, it may be that rot type (brown or white)
may play a role in habitat preferences. Deadwood creation could also be studied. Logs
98
of specific diameters could be introduced to forest stands (or specific trees in the stand
cut) to address a wider and more continuous size range. Snags could be created by
girdling to compare snag and CWM, natural snag and girdled snags, or snag diameter,
decay class, and type (softwood and hardwood).
Context of Faith in Natural Resource Conservation
There are many contexts in which conservation of natural resources takes place.
A person’s or group’s faith can have a major impact on how they perceive the importance
of biodiversity and the need to preserve it. In recognition of this, the journal
Conservation Biology recently published a series of articles on the context of Christian
faith in conservation (Cobb 2005, Flood 2005, Henderson 2005, Johns 2005a, Johns
2005b, Orr 2005a, Orr 2005b, Stuart et al. 2005, Van Dyke 2005). I find it interesting
that that the major differences among the articles were in how the Christian church,
especially the portion in the United States, has responded to conservation philosophy, not
in how the Bible describes the need for conservation. No matter what people believe
about possible differences between the Bible and science, we cannot deny that the Bible
teaches specifically and copiously on the requirement of humans to care for the whole
creation. Here I discuss only one small theme in the ecology of faith-- “till and keep.”
One of the most important verses in the Bible that describes our relationship with
God in the context of conservation is Genesis 2:15.
The LORD God took the man and put him in the garden of Eden to till it
and keep it. (NRSV)
99
The two verbs used (till and keep) help us to understand what actions God desires
for us in the context of our interaction with the rest of the creation. The first word, till
(abad) is a common agricultural term for working the soil, referring to the use of our
natural resources. The idea here is that we are permitted to till the ground to provide for
our needs. But we are only to till in the context of second word, “keep” (shamar). This
word means to protect, attend to, watch, preserve, and save, or to hedge about as with
thorns (Strong 1990). The picture is given of a thorn hedge growing around that which
you wish to protect.
This word was exemplified well by something I experienced in Kenya. Each
family’s boma (enclosure often containing several homes) was surrounded by a thick,
living fence of plants with massive thorns; some species (like Euphorbia candelabrum)
contained a milky, extremely toxic latex that can blind or burn the skin. Shepherds kept
their animals in the fenced area each night to protect them from wild animals and thieves.
Every time I read this verse, I picture those thick, thorny fences. That is the kind of
protection God asks us to give to the rest of the creation.
The following are two of many verses that can help us to understand the word
“keep/shamar.” The first passage is the well-known story of the building of an ark to
save species from the coming flood. God commands Noah:
You are to bring into the ark two of all living creatures, male and female, to keep
them alive with you. Two of every kind of bird, of every kind of animal and of
every kind of creature that moves along the ground will come to you to be kept
alive. You are to take every kind of food that is to be eaten and store it away as
food for you and for them. (Genesis 6:19-21, TNIV)
100

The second passage is a blessing that God gave to the high priest of Israel for the
purpose of blessing the followers of God. Even today, it is often used in many Christian
churches at the end of the community gathering to bless the people as they leave.
The LORD bless you and keep you; the LORD make his face shine on you and be
gracious to you; the LORD turn his face toward you and give you peace.
(Numbers 6:24-26, TNIV)
I find both of these passages instructional in our understanding of the word
“keep/shamar.” In the first passage, God makes sure that the people and all the other
species are protected from the flood, but also note God’s extra instructions to make sure
Noah also provided whatever food they needed to survive. In the second passage,
“keep/shamar” is used to describe the kind of protection we wish God to provide for us.
When we connect these passages, we conclude a more profound understanding of our
role in keeping. As much as Christians desire God to keep us, protect us, watch over us,
sustain us, provide for us, and preserve us in times of need, this is what God expects us to
do for the entire creation. This is our role as keepers of the earth.
Therefore, one role of Christians is to make sure that our human wants do not
supercede the needs of the rest of the creation. We are permitted to use the natural
resources of the earth, but only in a way in which we can still protect and care for the rest
of the creation. When we do so, we are obeying God, our Creator and Keeper.
There are many other Scripture passages addressing conservation- game
regulation (Deuteronomy 22:6-7), taxonomic naming (Genesis 2:19-20), leaving
agricultural land fallow (Leviticus 25:2-5), clean water (Ezekiel 34:18), sprawl (Isaiah
101
5:8), praise of animals of no use to humans (Job 41:1-12), the proper role of those with
power (Matthew 20:20-28, John 13), and God’s love and care for, delight in, and blessing
on all of the creation (e.g. Genesis 1:22, Genesis 9:9-17, Job 39:13-18, John 3:16-18).
For me, these passages apply directly to our work in conservation and forest
management. My primary research interest is the question of how to use our forest
resources to meet our human needs (and perhaps our wants) while still caring for
(keeping) all the other species that depend on the forest ecosystem. My faith did not
affect my experimental design, my analyses, or my findings in this thesis. But it does
affect my desire to care for this creation and to help people better understand- and
perhaps even love- these tiny, amazing creatures that we have named click beetles.
God made the wildlife of the earth ... and all crawling things of the soil...
God saw that it was good. (Genesis 1:25, trans. E. Fox 1997).
102
LITERATURE CITED
Akaike, H. 1974. A new look at the statistical model identification. IEEE Trans.
Automatic Control AC. 19: 716-723.
Alexander, K. 2003. The British saproxylic invertebrate fauna. Proceedings of the second pan-European Conference on Saproxylic Beetles. People’s Trust for Endangered Species. Available from http://www.ptes.org/events/conferences/beetles_jun02.html.
Andrewartha, H.G. and L.C. Birch. 1984. The Ecological Web: More on the Distribution and Abundance of Animals. University of Chicago Press, Chicago. 520 p.
Anonymous. 1999. UK Biodiversity Group: Tranche 2 Volume VI: Terrestrial and freshwater species and habitats. English Nature, Peterborough. 48p. Available from www.ukbap.org.uk/UKPlans.aspx?ID=341
Apigian, K.O., D.L. Dahlsten, and S.L. Stephens. 2006. Biodiversity of Coleoptera and the Importance of Habitat Structural Features in a Sierra Nevada Mixed-conifer Forest. Environmental Entomology 35: 964-975
Araya, T.E. 1993. Relationship between decay types of dead wood and occurrence of. Lucanid beetles (Coleoptera: Lucanidae). Applied Entomology and Zoology 28: 27-33.
Axelsson B., U. Lohm, T. Persson. 1984. Enchytraeids, lumbricids and soil arthropods in a northern deciduous woodland—a quantitative study. Holarctic Ecology 7: 91-103.
Bailey, R.G. 1995. Descriptions of the ecoregions of the United States. USDA
Miscellaneous Publication No. 1931. 108p.
Balduf, W. V. 1935. The bionomics of entomophagous Coleoptera: John S. Swift Co. Inc., New York. 220 pp.
Balick, M.J., D.G. Furth, and G. Cooper-Driver. 1978. Biochemical and evolutionary aspects of arthropod predation on ferns. Oecologia 35: 55-89
103
Barron, J. R. and G. S. Walley. 1983. Revision of holarctic genus Pyracmon
(Hymenoptera: Ichnuemonidae). Canadian Entomologist 115: 227-241.
Basset, Y., Charles, E.L., Hammond, D.S. and Brown, V.K. 2001. Short-term effects of canopy openness on insect herbivores in a rain forest in Guyana. Journal of Applied Ecology 38: 1045-1058.
Beaudry, S., L.C. Duchesne, and B. Cote. 1997. Short-term effects of three forestry practices on carabid assemblages in a jack pine forest. Canadian Journal of Forest Resources 27: 2065-2071.
Bisson, I. A. and J. M. Stutchbury. 2000. Nesting success and nest-site selection by a
neotropical migrant in a fragmented landscape. Canadian Journal of Zoology 78: 858-863.
Blennow, K., Hedin, J. and Niklasson, M. 2002. TrackBeam, a simple tool for estimating potential exposure to the solar beam underneath tree canopies. Journal of Insect Conservation 6: 161-170.
Boiteau, G., Y. Bousquet, W. Osborn. 2000. Vertical and temporal distribution of Carabidae and Elateridae in flight above an agricultural landscape. Environmental Entomology 29: 1157–1163.
Brissette, J.C. 1996. Effects of intensity and frequency of harvesting on abundance, stocking and composition of natural regeneration in the Acadian Forest of eastern North America. Silva Fennica 30: 301-314.
Brokaw, N.V.L and R.A Lent. 1999. Vertical structure. Pp. 373-399 in Maintaining biodiversity in forest ecosystems. Cambridge: Cambridge University Press.
Brooks, A.R. 1960. Adult Elateridae of Southern Alberta, Saskatchewan, and Manitoba (Coleoptera). Canadian Entomologist Supplement 20, 92: 1-63.
Brzustowski, J. 2002. Clustering calculator [online]. Department of Biological Sciences, University of Alberta, Edmonton, Alta. Available from http://www2.biology.ualberta.ca/jbrzusto/cluster.php [updated 3 July 2002; cited 2 April 2006].
Bunnell, F.L. 1995. Forest-dwelling vertebrate faunas and natural fire regimes in British Columbia: patterns and implications for conservation. Conservation Biology 9: 636-644.
104
Busing, R. T., and P. S. White. 1997. Species diversity and small-scale disturbance in an
old-growth temperate forest: a consideration of gap partitioning concepts. Oikos 78: 562-568.
Campbell, R.E. 1937. Temperature and moisture preferences of wireworms. Ecology 18: 479-489.
Carlton, C. E., and H. W. Robison. 1998. Diversity of litter-dwelling beetles in deciduous forests of the Ouachita highlands of Arkansas (Insecta: Coleoptera). Biodiversity and Conservation 7: 1589-1605.
Chershire, J.M. 1988. Occurrence of a soil-inhabiting pest of row crops, Melanotus similis (Kirby) (Coleoptera: Elateridae), in forest habitats. J. Entomol. Sci. 23: 75-76.
Clarke, K.R. 1993. Non-parametric multivariate analyses of changes in community structure. Australian Journal of Ecology 18: 117-143.
Craighead, F.C. 1950. Insect enemies of Eastern forests. USDA Misc. Publ. No. 657. 679 Pp.
Crowson, R. A. 1981. The biology of Coleoptera. Academic Press, London, 802 pp. Danks, H.V. and Foottit, R.G. 1989. Insects of the boreal zone of Canada. Canadian
Entomologist 121: 626-690.
David, J.F., J.F. Ponge, and F. Delecour. 1993. The saprophagous. macrofauna of different types of humus in beech forests of the. Ardenne (Belgium). Pedobiologia 37: 49-56.
DeGraaf, R.M., J.B. Hestbeck, and M. Yamasaki. 1998. Associations between breeding bird abundance and stand structure in the White Mountains, New Hampshire and Maine, USA. Forest Ecology and Management 103: 217-233.
Dietrich, H. 1945. The Elateridae of New York State. Cornell University Agricultural Experiment Station Memorandum 269: 1-79.
Downie, N.M. and R.H. Arnett Jr. 1996. The Beetles of Northeastern North America. Vol. I and II. Sandhill Crane Press, Gainesville, Florida. 1721 pp.
105
Dufrêne, M. and P. Legendre. 1997. Species assemblages and indicator species: the
need for a flexible asymmetrical approach. Ecological Monographs 67: 345-366.
Ehnstrom, B. 2001. Leaving dead wood for insects in boreal forests- suggestions for the future. Scandinavian Journal of Forestry Research Supplement 3: 91-98.
Elton, C. S. 1966. Dying and dead wood. Pp. 279-305. In: The patterns of animal
communities. New York: John Wiley and Sons, Inc.
Evans, F. 1989. A list of the insects recorded from Evans’ Old Field, E.S. George Reserve, Livingston County, Michigan. Available from http://www.ummz.lsa.umich.edu/esgr/biota/EOFFAUNATXT.html [cited 3 February 2006].
Falconer, D.S. 1945. On the behavior of wireworms of the genus Agriotes Esch. (Coleoptera, Elateridae) in relation to temperature. J. Exptl. Biol. 21: 17-32.
Fermon, H., M. Waltert, R.I. Vane-Wright, and M. Mühlenberg. 2005. Forest use and vertical stratification in fruit-feeding butterflies of Sulawesi, Indonesia. Impacts
for conservation. Biodiversity and Conservation 14: 333-350.
Fox, C.J.S. 1961. The distribution and abundance of wireworms in the Annapolis Valley of Nova Scotia. Canadian Entomologist 93:276-279.
Fox, E. 1995. The five books of Moses: Genesis, Exodus, Leviticus, Numbers, and
Deuteronomy. Schocken Books Inc. New York. 1024 pp.
Franklin, J. 1989. Toward a new forestry. American Forests. 95: 37-44 Franklin, J. F. and R. T. T. Forman. 1987. Creating landscape patterns by forest cutting:
ecological consequences and principles. Landscape Ecology 1: 5-18.
Franklin, J.F., D.R. Berg, D.A Thornburgh, and J.C. Tappeiner. 1997. Alternative silvicultural approaches to timber harvesting: variable retention harvest systems. Pp. 111-139. In K. Kohm and J.F. Franklin, Creating a forestry for the 21st Century. Island Press, Washington, DC
Fraver, S., R.G. Wagner, and M. Day. 2002. Dynamics of down woody debris following gap harvesting in the Acadian forest of central Maine, USA. Canadian Journal of Forest Research 32: 2094–2105.
106
Freedman, B., V. Zelazny, D. Beaudette, T. Fleming, S. Flemming, G. Forbes, J.S.
Gerrow, G. Johnson, and S. Woodley. 1996. Biodiversity implications of changes in the quantity of dead organic matter in managed forests. Environmental Reviews 4: 238-265.
Fridman, J. and M. Walheim. 2000. Amount, structure, and dynamics of dead wood on
managed forestland in Sweden: For. Ecol. Manage. 31: 23–26.
Fulton, B.B. 1928. Some temperature relations of Melanotus (Coleoptera, Elateridae). J. Econ. Ent. 21: 889-97.
Gorham L., S. King, B. Keeland, S. Mopper. 2002. Effects of canopy gaps and flooding on homopterans of a bottomland hardwood forest. Wetlands 22: 541-549.
Grove, S. J. 2002a. Saproxylic insect ecology and the sustainable management of forests. Annu. Rev. Ecol. Syst. 33: 1-23.
Grove, S. J. 2002b. Tree basal area and dead wood as surrogate indicators of saproxylic insect faunal integrity: a case study from the Australian lowland tropics. Ecological Indicators 1: 171-188.
Grove, S.J. and N.E. Stork. 2000. An inordinate fondness for beetles. Invertebrate Taxonomy 14: 733-39.
Guenette, J. and M. Villard. 2005. Thresholds in forest bird response to habitat alteration as quantitative targets for conservation. Conservation Biology 19: 1168-1180.
Gur'yeva,Ye. L. 1969. Some trends in the evolution of click beetles (Coleoptera, Elateridae). Entomologicheskiye Obozreniye 48: 263–272 (in Russian; translation in Entomological Review, 1978, Washington 48: 154–159).
Gutzwiller, K. J. and S. H. Anderson. 1987. Multiscale associations between cavity- nesting birds and features of Wyoming streamside woodlands. Condor 89: 534-548.
Haila, Y., I.K. Hanski, J. Niemelä, P. Punttila, S. Raivio, and H. Tukia. 1994. Forestry and the boreal fauna: matching management with natural forest dynamics. Ann. Zool. Fennici 31: 187-202.
Hamer, K.C., J.K. Hill, L.A. Lace, and A.M. Langan. 1997. Ecological and biogeographical effects of forest disturbance on tropical butterflies of Sumba, Indonesia. Journal of Biogeography 24: 67-75.
Hammer, Ø., D.A.T Harper, and Ryan, P.D. 2001. PAST: Palaeontological Statistics
107
software package for education and data analysis. Palaeontologia Electronica 4: 1-9.
Hammond, H.E.J., D.W. Langor, and J.R. Spence. 2004. Saproxylic beetles (Coleoptera) using Populus in boreal aspen stands of western Canada: spatiotemporal variation and conservation of assemblages. Can. J. For. Res. 34: 1-19.
Hansen, A.J., T.A. Spies, F.J. Swanson, and J. L. Ohmann. 1991. Conserving biodiversity in managed forests. BioScience 41: 382-392.
Harmon, M.E., J.F. Franklin, F.J. Swanson, P. Sollins, S.V. Gregory, J.D. Lattin, N.H. Anderson, S.P. Cline, N.G.. Aumen, J.R. Sedell, G.W. Lienkaemper, K. Cromack Jr., K.W. Cummins. 1986. Ecology of coarse woody debris in temperate ecosystems. Advances in Ecological Research 15: 133-302.
Harpole, D.N. and C.A. Haas. 1999. Effects of seven silvicultural treatments on terrestrial salamanders. Forest Ecology and Management 114: 349-356.
Heck, K.L., Jr., G. Van Belle, and D. Simberloff. 1975. Explicit calculation of the rarefaction diversity measurement and the determination of sufficient sample size. Ecology 56: 1459-1461.
Heinrich, B., R. Bell. 1995. Winter food of a small insectivorous bird, the Golden- crowned Kinglet. Wilson Bull. 107: 558–561.
Heliola, J.M. Koivula, and J. Niemelä. 2001. Distribution of carabid beetles (Coleoptera, Carabidae) across a boreal forest- clearcut ecotone. Conservation Biology. 15: 370-377.
Hendrix, S.D. 1980. An evolutionary and ecological perspective of the insect fauna of ferns. American Naturalist 115: 171-196.
Hill, M.O. 1973. Diversity and evenness: a unifying notation and its consequences. Ecology 54: 427–473.
Hilszczanski, J., H. Gibb, J. Hjältén, O. Atlegrim, T. Johansson, R.B. Pettersson, J.P. Ball, and K. Danell. 2005. Parasitoids (Hymenoptera, Ichneumonoidea) of saproxylic beetles are affected by forest successional stage and dead wood characteristics in boreal spruce forest. Biol. Conserv. 126: 456-464.
108
Holmes, R.T. and S.K. Robinson. 1981. Tree species preferences of foraging insectivorous birds in a northern hardwoods forest. Oecologia 48: 31-35.
Holmes, R.T. and S.K. Robinson. 1988. Spatial patterns, foraging tactics, and diets of ground-foraging birds in a northern hardwoods forest. Wilson Bulletin 100: 377-394.
Hunter, M.L. , Jr. 1999. Biological Diversity. Pp. 3-21 in Maintaining biodiversity in forest ecosystems. Cambridge: Cambridge University Press.
Hunter, M.L., Jr. 1993. Natural fire regimes as spatial models for managing boreal forests. Biological Conservation 65: 115-120.
Hurlbert, S.H. 1971. The non-concept of species diversity: a critique and alternative parameters. Ecology 52: 577-586.
Jabin, M., D. Mohr, H. Kappes, W. Topp. 2004. Influence of deadwood on density of soil macro-arthropods in a managed oak-beech forest. Forest Ecology and Management 194 :61-69.
Jacobs, J.M. 2004. Saproxylic beetle assemblages in the boreal mixedwood of Alberta: succession, wildfire and variable retention forestry. M.S. Thesis. University of Alberta, Edmonton.
Jennings, D.T., M.W. Houseweart, and G.A. Dunn. 1986. Carabid beetles (Coleoptera: Carabidae) associated. with strip clearcut and dense spruce-fir forests of Maine (USA). Coleopterists Bulletin 40: 251-263.
Jenny, Hans. 1980. The Soil Resource. Springer-Verlag. New York. 377 pp. Johnson, P.J. 2002. Family Elateridae. pp. 160-173. In: Arnett, R.H., Jr., Thomas, M.C.,
Skelley, P.E., and Frank, J.H. (eds.) American Beetles, Volume 2: Polyphaga: Scarabaeoidea through Curculionoidea. CRC Press, Boca Raton, USA.
Jones, E.W. 1951. Laboratory studies on the moisture relations of Limonius (Coleoptera: Elateridae). Ecology 32: 284-293.
Jongman, R.H.G., C.J.F Ter Braak, and O.F.R. Van Tongeren. 1995. Data analysis in
comunity and landscape ecology. Cambridege University Press, Cambridge.
Jonsell, M., J. Weslien, and B. Ehnstrom. 1998. Substrate requirements of red-listed saproxylic invertebrates in Sweden. Biodiversity and Conservation 7: 749-764.
109
Jonsell, M., K. Nittérus and K. Stighäll. 2004. Saproxylic beetles in natural and man-
made deciduous high stumps retained for conservation. Biological Conservation 118: 163-173.
Jonsell, M., M. Schroeder, and J. Weslien. 2005. Saproxylic beetles in high stumps of spruce: Fungal flora important for determining the species composition. Scandinavian Journal of Forest Research 20: 54-62.
Kaila, L., P. Martikainen, P. Punttila. 1997. Dead trees left in clear-cuts benefit saproxylic Coleoptera adapted to natural disturbances in boreal forest. Biodiversity and Conservation 6:1-18.
Kapos, V. 1989. Effects of isolation on the water status of forest patches in the Brazilian Amazon. Journal of Tropical Ecology 5: 173-185.
Kirby, K.J. and C.M. Drake. 1993. Dead wood matters: The ecology and conservation
of saproxylic invertebrates in Britain. Proceedings of a British Ecological Society Meeting held at Dunham Massey Park, 24 April 1992. English Nature, Peterborough, UK.
Knapp, S.M., C.A. Haas, D.N. Harpole, and R.L. Kirkpatrick. 2003. Initial effects of clearcutting and alternative silvicultural practices on terrestrial salamander abundances. Conservation Biology 17: 752-762.
Kohler, F. 2000. Totholzkäfer in naturwaldzellen des nördlichen Rheinlandes. vergelichende studien zur totholzkaferfäuna Deutschlands und deutschen naturwaldforschung. [Saproxylic beetles in nature forests of the northern Rhineland. Comparative studies on the saproxylic beetles of Germany and contributions to German nature forest research] (In German). Landesamt für Agrarordnung NRW, Löbf, Germany. From Grove 2002a.
Kolström, M. and J. Lumatjarvi. 2000. Saproxylic beetles on aspen in commercial forests: a simulation approach to species richness. Forest Ecology and Management 126: 113-120.
Komonen, A. 2001. Structure of insect communities inhabiting old-growth forest specialist bracket fungi. Ecological Entomology 26: 63-75.
Kremen, C., R.K. Colwell, T.L. Erwin, D.D. Murphy, R.F. Noss, and M.A. Sanjayan. 1993. Terrestrial arthropod assemblages: Their use in conservation planning. Conservation Biology 7: 796-808.
Kruskal, J.B. 1964. Multidimensional scaling by optimizing goodness of fit to a
110
nonmetric hypothesis. Psychometrika 29: 1-17.
LaFrance, J. 1968. The seasonal movements of wireworms (Coleoptera: Elateridae) in relation to soil moisture and temperature in the organic soils of southwestern Quebec. The Canadian Entomologist 100: 801-807.
Lees, A.D. 1943a. On the behavior of wireworms of the genus Agriotes Esch. (Coleoptera, Elateridae). I. Reactions to humidity. J. Exptl. Biol. 20: 43-53.
Lees, A.D. 1943b. On the behavior of wireworms of the genus Agriotes Esch. (Coleoptera, Elateridae). II. Reactions to moisture. J. Exptl. Biol. 20: 54-60.
Lefko, S.A., L.P. Pedigo, M.E. Rice, and W.D. Batchelor. 1998. Spatial modeling of preferred wireworm (Coleoptera: Elateridae) habitat. Environmental Entomology 27: 312-317.
Levesque, C. and G-Y. Levesque. 1980. Activite des taupins (Coleopterea: Ealateridea) de biotopes forestiers decidus des Laurentides (Quebec). Le Naturaliste Canadien 107: 95-99.
Levesque, C. and G-Y. Levesque. 1993. Abundance and seasonal activity of Elateroidea (Coleoptera) in a raspberry plantation and adjacent sties in southern Quebec, Canada. The Colepterists Bulletin. 47: 269-277.
Lilja, S., M. De Chantal, T. Kuuluvainen, I. Vanha-Majamaa, and P. Puttonen. 2005. Restoring natural characteristics in managed Norway spruce [Picea abies (L.) Karst.] stands with partial cutting, dead wood restoration and fire: immediate treatment effects. Scandinavian Journal of Forest Research 20: 68-78.
Lindenmayer, D.B. and J.F. Franklin. 2002. Conserving forest biodiversity: A comprehensive multiscaled approach. Island Press, Washington DC, USA.
Lindenmayer, D.B., A. Welsh, C.F. Donnelly, and R. Meggs. 1996. The use of nest trees by the mountain brushtail possum (Trichosurus caninus) (Phalangeridate: Marsupialia). I. Number of occupied trees and frequency of tree use. Wildlife Research 23: 343-361.
Linit, M.J., P.S. Johnson, R.A. McKinney, W.H. Kearby. 1986. Insects and leaf area losses of planted northern red oak seedlings in an Ozark forest. Forest Science 32: 11-20.
111
Lohr, S.M, S.A. Gauthreaux, and J.C. Kilgo. 2002. Importance of coarse woody debris to avian communities in loblolly pine forests. Conservation Biology 16: 767-777. Lorimer, C.G. 1977. The presettlement forest and natural disturbance cycle of
northeastern Maine. Ecology 58: 139-148.
Lorimer, C.G. and A.S. White. 2003. Scale and frequency of natural disturbances in the northeastern United States: implications for early successional forest habitat and regional age distributions. Forest Ecology and Management 185: 41-64.
Machmer, M. 2002. Effects of ecosystem restoration treatments on cavity-nesting birds, their habitat, and their insectivorous prey in fire-maintained forests of southeastern British Columbia. USDA Forest Service Gen. Tech. Rep. PSW-GTR-181.2002.
Maeto, K., S. Sato, and H. Miyata. 2002. Species diversity of longicorn beetles in humid warm-temperate forests: the impact of forest management practices on old-growth
forest species in southwestern Japan. Biodiversity and Conservation 11: 1919-1937.
Maine Forest Service. 2005. The 2005 Biennial Report on the State of the Forest and Progress Report on Forest Sustainability Standards. Report to the Joint Standing Committee of the 122nd Legislature on Agriculture, Conservation and Forestry, December 29, 2005. 124pp.
Marra, J.L. and R.L Edmonds. 1998. Effects of coarse woody debris and soil depth on the density and diversity of soil invertebrates on clearcut and forested sites on the Olympic Peninsula, Washington. Environmental Entomology 27: 1111-1124.
Marra, J.L. and R.L Edmonds. 2005. Soil arthropod responses to different patch types in a mixed-conifer forest of the Sierra Nevada. Forest Science 51: 255-265.
Martikainen, P., J. Siitonen, P. Punttila, L. Kaila, J. Rauah. 2000. Species richness of Coleoptera in mature managed and old-growth boreal forests in southern Finland. Biological Conservation 94: 199-209.
McCune, B. and J.B. Grace. 2002. Analysis of Ecological Communities. MjM Software Design, Gleneden Beach, Oregon, USA.
McCune, B. and M.J. Mefford. 1999. PC-ORD. Multivariate Analysis of Ecological Data. Version 4.37. MjM Software, Gleneden Beach, Oregon, USA.
112
Millennium Ecosystem Assessment. 2005. Ecosystems and human well-being: Current
state and trends, Volume 1. Island Press. St. Louis MO, USA. 815 Pp.
Moore, J., R. Oiumet, D. Houle, C. Camiré. 2004. Effects of two silvicultural. practices on ground beetles (Coleoptera: Carabidae) in a northern hardwood forest, Quebec, Canada. Canadian Journal of Forest Research 34: 959-968.
Morris, R.F. 1951. The larval Elateridae of eastern spruce forests and their role in the natural control of Gilpinia hercyniae (Htg.) (Hymenoptera: Diprionidea). Canadian Entomologist 83: 133-147.
New Revised Standard Version. 1989. The Holy Bible. Cambridge University Press. Cambridge. 1151 pp. Niemelä, J. 1997. Invertebrates and Boreal Forest Management. Conservation Biology
11: 601-610.
Niemelä, J., Y. Haila, and P. Punttila. 1996. The importance of small-scale heterogeneity in boreal forests: diversity variation in forest-floor invertebrates across the successional gradient. - Ecography 19: 352-368.
Nilsson, S.G. and Baranowski, R. 1997. Habitat predictability and the occurrence of
wood beetles in old-growth beech forests. Ecography 20: 491-498.
Novotny, V., P. Drozd, S.E. Miller, M. Kulfan, M. Janda, Y. Basset, and G.D. Weiblen. 2006. Why Are There So Many Species of Herbivorous Insects in Tropical Rainforests? Science. 25: 1115-1118.
Ohsawa, M. and T. Nagaike. 2006. Influence of forest types and effects of forestry activities on species richness and composition of Chrysomelidae in the Central Mountainous Region of Japan. Biodiversity and Conservation 15: 1179-1191.
Økland, B., A. Bakke, S. Hågvar and T. Kvamme. 1996. What factors influence the diversity of saproxylic beetles? A multiscaled study from a spruce forest in southern Norway. Biodiversity and Conservation 5: 75-100.
Palik, B. and T. Engstrom. 1999. Species Composition. Pp. 65-94 in Maintaining biodiversity in forest ecosystems. Cambridge: Cambridge University Press.
113
Palm, T. 1959. Die Holz- und Rinden-Käfer der süd- und mittelschwedishen
Laubbäume. – Opuscula Entomolica Supplement 16: 1-374. [The wood- and bark- beetles of south and mid-Swedish broadleaves] In German. From Grove 2002a.
Paquin, P. and D. Coderre. 1997. Changes in soil macroarthropod communities in relation to forest maturation through three successional stages in the Canadian boreal forest. Oecologia 112: 104-111.
Parker, S.P. 1982. Synopsis and Classification of Living Organisms. New York: McGraw-Hill. 1232 pp.
Peñaloza, C. and A.G. Farji-Brener. 2003. The importance of treefall gaps as foraging sites for leaf-cutting ants depends on forest age. J. of Tropical Ecology 19: 60-605.
Penev, L.D. 1992. Qualitative and quantitative spatial variation in soil wire-worm assemblages in relation to climatic and habitat factors. Oikos 63: 180-192.
Pettersson, R.B. 1996. Effect of forestry on the abundance and diversity of arboreal spiders in the boreal spruce forest. Ecography 19: 221-228.
Phillips, D.L. and D.J. Shure. 1990. Patch-Size Effects on Early Succession in Southern Appalachian Forests. Ecology 71: 204-212.
Phillips, I.D. and T.P. Cobbs. 2005. Effects of habitat structure and lid transparency on pitfall catches. Environmental Entomology 34: 875-882.
Ponge J.F., P. Arpin, F. Sondag, F. Delecour. Soil fauna and site assessment in beech stands of the Belgian Ardennes. Canadian Journal of Forest Research 27: 2053-2064.
Poulson, T.L. and W. J. Platt. 1989. Gap light regimes influence canopy tree diversity. Ecology 70: 553-555.
Ranius, R. and N. Jansson. 2000. The influence of forest regrowth, original canopy cover and tree size on saproxylic beetles associated with old oaks. Biological Conservation 95: 85-94.
Ranius, R. and N. Jansson. 2002. A comparison of three methods to survey saproxylic beetles in hollow oaks. Biodiversity and Conservation 11: 1759-1771.
114
Ranius, T. 2002. Osmoderma eremita as an indicator of species richness of beetles in
tree hollows. Biodiversity and Conservation 11: 931-941.
Raup, D.M. 1975. Taxonomic diversity estimation using rarefaction. Paleobiology 1: 333-342.
Rodgers, D.J. and R.L. Kitching. 1998. Vertical stratification of rainforest collembolan (Collembola:. Insecta) assemblages: description of ecological patterns and hypothesis concerning their generation. Ecography 21: 392-400.
Saetre, P., P.-O. Brandtberg, H. Lundkvist, J. Bengtsson. 1999. Soil organisms and
carbon, nitrogen and phosphorus mineralisation in Norway spruce and mixed Norway spruce - Birch stands. Biology and Fertility of Soils. 28: 382-388.
Salim, E. and O. Ullsten (eds.). 1999. Our Forests, Our Future: Report of the World Commission on Forests and Sustainable Development. Cambridge University Press, Cambridge, U.K., 1999.
Sanders, H.L. 1968. Marine benthic diversity: a comparative study. Am. Natur. 102:
243-282.
SAS Institute Inc. 2000. Release 8.01. Cary, NC, USA. Saunders, M.R. and R.G. Wagner. 2005. Ten-year results of the Forest Ecosystem
Research Program (FERP) – successes and challenges. pp. 147-153. In: Peterson, C.E., and Maguire, D.A. (Eds.) Balancing ecosystem values: innovative experiments for sustainable forestry. U.S. Department of Agriculture, Forest Service, Pacific Northwest Research Station, Portland, OR. Gen. Tech. Rep. PNW-GTR-635.
Scheu, S., D. Albers, J. Alphei, R. Buryn, U. Klages, S. Migge, C. Platner, and J.-A. Salamon. 2003. The soil fauna community in pure and mixed stands of beech and spruce of different age: trophic structure and structuring forces. Oikos 101: 225-238.
Schiegg, K. 2000. Are there saproxylic beetle species characteristic for high dead wood connectivity? Ecography 23: 579-587.
Schofield, D.A. 2003. Vegetation dynamics and tree radial growth response in harvest gaps, natural gaps, and closed canopy conditions in Maine’s Acadian forest. M.S. Thesis. University of Maine, Orono.
115
Schowalter, T. and Y. Zhang. 2005. Canopy arthropod assemblages in four overstory
and three understory plant species in mixed-conifer old-growth forest in California. Forest Science 51: 233-242.
Schowalter, T.D. 1995. Canopy arthropod response to forest age and alternative harvest practices in western Oregon. Forest Ecology and Management 78: 115-125.
Schumann, M.E., A.S. White, and J.W. Witham. 2003. The effects of harvest-created gaps on plant species diversity, composition, and abundance in a Maine oak-pine forest. Forest Ecology and Management 176: 543-561.
Sendak, P.E., J.C. Brissette, R.M. Frank. 2003. Silviculture affects composition, growth, and yield in mixed northern conifers: 40-year results from the Penobscot Experimental Forest Canadian Journal of Forest Research 33: 2116-2128.
Seymour, R.S. 2005. Integrating natural disturbance parameters into conventional silvicultural systems: experience from the Acadian forest of NE North America. Pp. 41-48. In: Peterson, C.E., and Maguire, D.A. (Eds.) Balancing ecosystem values: innovative experiments for sustainable forestry. U.S. Department of Agriculture, Forest Service, Pacific Northwest Research Station, Portland, OR. Gen. Tech. Rep. PNW-GTR-635. 389 p.
Seymour, R.S. and M.L. Hunter. 1999. Principles of ecological forestry. Pp. 22-61 in Maintaining biodiversity in forest ecosystems. Cambridge: Cambridge University Press.
Seymour, R.S., A.S White, and P.G. deMaynadier. 2002. Natural disturbance regimes in northeastern North America- evaluating silvicultural systems using natural scales and frequencies. Forest Ecology and Management 155: 357-367.
Shelly, T.E. 1988. Relative abundance of day-flying Insects in treefall gaps vs. shaded understory in a neotropical forest. Biotropica 20: 114-119.
Siitonen J. 1994. Decaying wood and saproxylic Coleoptera in two old spruce forests: a
comparison based on two sampling methods. Annales Zoologici Fennici 31: 89-95.
Siitonen J. 2001. Forest management, coarse woody debris, and saproxylic organisms; Fennoscandian boreal forests as an example. Ecol. Bull.49: 11-42.
116
Sippola, A., J. Siitonen, and P. Punttila. 2002. Beetle diversity in timberline forests: a
comparison between old-growth and regeneration areas in Finnish Lapland. Annales Zoologici Fennici 39: 69-86.
Smith, D.M., B.C. Larson, M.J. Kelty, and P.M.S. Ashton. 1997. The practice of silviculture: Applied forest ecology. Ninth edition. John Wiley and Sons, Inc. New York. 537pp.
Speight, M.C.D. 1989. Saproxylic invertebrates and their conservation. Nature and Environment Series 46, Council of Europe, Strasbourg.
Strong, A.M., C.T. Dickert, and R.T. Bell. 2002. Effects of a ski trail on a ground beetle (Carabidae, Elateridae) community in northern Vermont. Journal of Insect Conservation 6: 149-159.
Su, J.C. and S.A. Woods. 2001. Importance of Sampling Along a Vertical Gradient to Compare the Insect Fauna in Managed Forests. Environmental Entomology 30: 400-408.
Svensson, G.P., M.C. Larsson, and J. Hedin. 2004. Attraction of the larval predator Elater ferrugineus to the sex pheromone of its prey, Osmoderma eremita, and its implication for conservation biology. Journal of Chemical Ecology 30: 353-363.
Taylor, R.J. and N. Doran. 2001. Use of Terrestrial Invertebrates as Indicators of the Ecological Sustainability of Forest Management under the Montreal Process. Journal of Insect Conservation 5: 221-231.
Ter Braak, C.J.F. 1986. Canonical Correspondence Analysis: A New Eigenvector Technique for Multivariate Direct Gradient Analysis. Ecology 67: 1167–1179.
Ter Braak, C.J.F. 2003. Program CANOCO Version 4.5A. (C) 1988-2003 Biometris - quantitative methods in the life and earth sciences. Plant Research International, Wageningen University and Research Centre. Box 100, 6700 AC Wageningen, the Netherlands.
Theenhaus, A., and M. Schaefer. 1995. The effects of clear-cutting and liming on the soil macrofauna of a beech forest. Forest Ecology and Management 77: 35-51.
Today’s New International Version. 2005. The Holy Bible. International Bible Society.
Grand Rapids, MI. 1234 pp.
117
Tostowaryk, W. 1972. Coleopterous predators of the Swaine jackpine sawfly,
Neodiprion swainei Middleton (Hymenoptera, Diprionidae). Canadian Journal of Zoology 50:1139-1146
Ulyshen, M.D., J.L. Hanula, S. Horn, J.C. John, and C.E. Moorman. 2005. Herbivorous insect response to group selection cutting in a southeastern bottomland hardwood forest. Environ. Entomol. 34: 395-402.
Ulyshen, M.D., J.L. Hanula, S. Horn, J.C. John, J.C. Kilgo, and C.E. Moorman. 2006. The response of ground beetles (Coleoptera: Carabidae) to selection cutting in a South Carolina bottomland hardwood forest. Biodiversity and Conservation 14: 261-274.
Valladares G., A. Salvo, L. Cagnolo. 2006. Habitat Fragmentation Effects on Trophic Processes of Insect-Plant Food Webs. Conservation Biology 20: 212-217.
Van Wagner, C.E. 1968. The line intersect method in forest fuel sampling. Forest Science 14: 20-26.
Vanha-Majamaa, I. and J. Jalonen. 2001. Green Tree Retention in Fennoscandian Forestry. Scandinavian Journal of Forest Research 16: 79-90.
Walla, T.R., S. Engen, P.J. DeVries, R. Lande. 2004. .Modeling vertical beta-diversity in tropical butterfly communities. Oikos 107: 610-618.
Wikars, L.-O. 2002. Dependence on fire in wood-living insects: An experiment with burned and unburned spruce and birch logs. Journal of Insect Conservation 6: 1-12.
Wilson, E.O. 1992. The Diversity of Life. Belknap Press of Harvard University
Press, Cambridge, MA.
Wilson, M.F. 1974. Avian community organization and habitat structure. Ecology 55: 1017-1029.
Wolters, V. 1989. The influence of omnivorous elaterid larvae on the microbial carbon cycle in different forest soils. Oecologia 80: 405-413.
Woodruff, R.E. 2004. Click Beetles, Alaus spp. (Insecta: Coleoptera: Elateridae). UF/IFAS Extension. EENY-085. 5pp.
118
Work, T.T., D.P. Shorthouse, J.R. Spence, W.J.A. Volney, D. Langor. 2004. Stand
composition and structure of the boreal mixedwood and epigaeic arthropods of the Ecosystem Management Emulating Natural Disturbance (EMEND) landbase in northwestern Alberta. Canadian Journal of Forest Research 34: 417-430.
Yamamura, K., M. Kishita, N. Arakaki, F. Kawamura, and Y. Sadoyama. 2003. Estimation of dispersal distance by mark-recapture experiments using traps: correction of bias caused by the artificial removal by traps. Population Ecology 45: 149-155.
Yano, K., K. Tsuchiya and S. Hamasaki. 1984. Aphid-feeding by adult Elaterid beetles (Coleoptera: Elateridae). Entomological Society of Japan 52: 441-444.
Yee, M, Z.Q. Yuan, C.L. Mohammed. 2001. Not just waste wood: decaying logs as key habitats in Tasmania's wet sclerophyll Eucalytus obliqua production forests: the ecology of large and small logs compared. Tasforests 13: 119-128.
Zach, P. 2003. The occurrence and conservation status of Limoniscus violaceus and Ampedus quadrisignatus (Coleoptera: Elateridae) in Central Slovakia. Proceedings of the second pan-European Conference on Saproxylic Beetles. People’s Trust for Endangered Species. Available from http://www.ptes.org/events/conferences/beetles_jun02.html.
Zacharuk, R.Y. 1962. Seasonal behavior of larvae of Ctenicera spp. and other wireworms (Coloeoptera: Elateridae), in relation to temperature, moisture, food, and gravity. Canadian Journal of Zoology 40: 697-718.
Zacharuk, R.Y. 1963. Comparative food preferences of soil-, sand-, and wood- inhabiting wireworms (Coleoptera, Elateridae). Bull. Entomol. Res. 54: 161-165.
119
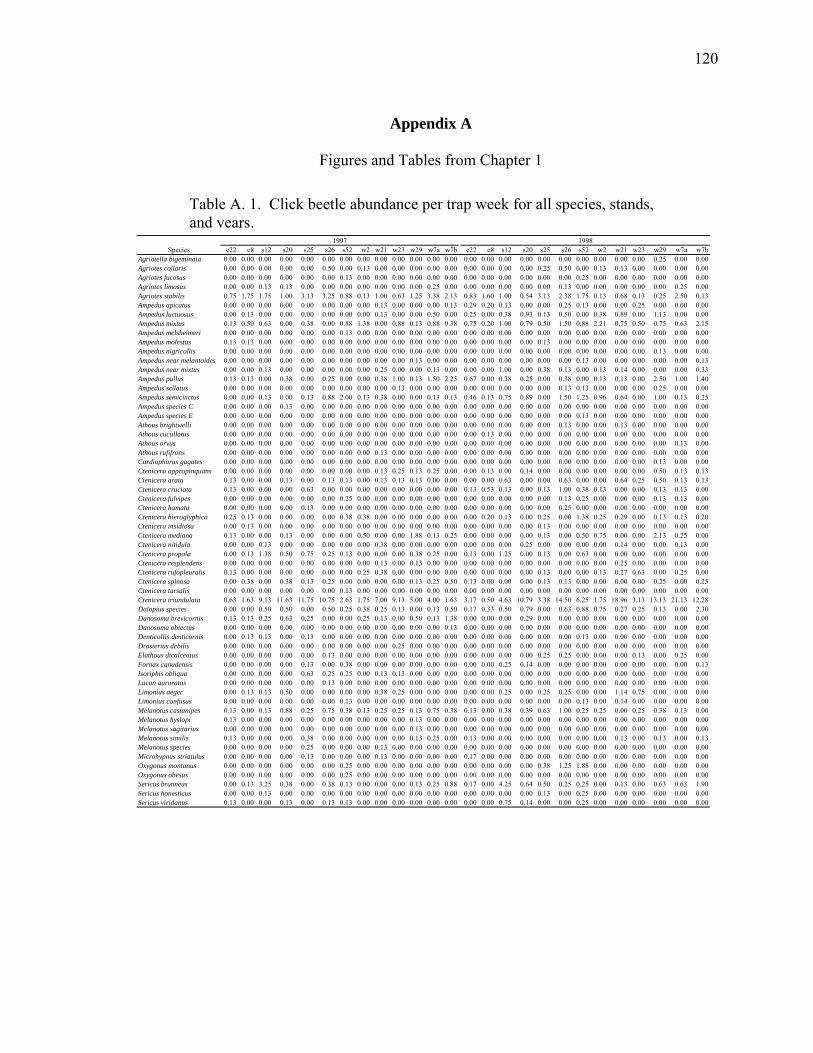
Appendix A
Figures and Tables from Chapter 1
c22 c8 s12 s20 s25 s26 s52 w2 w21 w23 w29 w7a w7b c22 c8 s12 s20 s25 s26 s52 w2 w21 w23 w29 w7a w7bAgriotella bigeminata 0.00 0.00 0.00 0.00 0.00 0.00 0.00 0.00 0.00 0.00 0.00 0.00 0.00 0.00 0.00 0.00 0.00 0.00 0.00 0.00 0.00 0.00 0.00 0.25 0.00 0.00Agriotes collaris 0.00 0.00 0.00 0.00 0.00 0.50 0.00 0.13 0.00 0.00 0.00 0.00 0.00 0.00 0.00 0.00 0.00 0.25 0.50 0.00 0.13 0.13 0.00 0.00 0.00 0.00Agriotes fucosus 0.00 0.00 0.00 0.00 0.00 0.00 0.13 0.00 0.00 0.00 0.00 0.00 0.00 0.00 0.00 0.00 0.00 0.00 0.00 0.25 0.00 0.00 0.00 0.00 0.00 0.00Agriotes limosus 0.00 0.00 0.13 0.13 0.00 0.00 0.00 0.00 0.00 0.00 0.00 0.25 0.00 0.00 0.00 0.00 0.00 0.00 0.13 0.00 0.00 0.00 0.00 0.00 0.25 0.00Agriotes stabilis 0.75 1.75 1.75 1.00 3.13 3.25 0.88 0.13 1.00 0.63 1.25 3.38 2.13 0.83 1.60 1.00 0.54 3.13 2.38 1.75 0.13 0.68 0.13 0.25 2.50 0.13Ampedus apicatus 0.00 0.00 0.00 0.00 0.00 0.00 0.00 0.00 0.13 0.00 0.00 0.00 0.13 0.29 0.20 0.13 0.00 0.00 0.25 0.13 0.00 0.00 0.25 0.00 0.00 0.00Ampedus luctuosus 0.00 0.13 0.00 0.00 0.00 0.00 0.00 0.00 0.13 0.00 0.00 0.50 0.00 0.25 0.00 0.38 0.93 0.13 0.50 0.00 0.38 0.89 0.00 1.13 0.00 0.00Ampedus mixtus 0.13 0.50 0.63 0.00 0.38 0.00 0.88 1.38 0.00 0.88 0.13 0.88 0.38 0.75 0.20 1.00 0.79 0.50 1.50 0.88 2.21 0.75 0.50 0.75 0.63 2.15Ampedus melsheimeri 0.00 0.00 0.00 0.00 0.00 0.00 0.13 0.00 0.00 0.00 0.00 0.00 0.00 0.00 0.00 0.00 0.00 0.00 0.00 0.00 0.00 0.00 0.00 0.00 0.00 0.00Ampedus molestus 0.13 0.13 0.00 0.00 0.00 0.00 0.00 0.00 0.00 0.00 0.00 0.00 0.00 0.00 0.00 0.00 0.00 0.13 0.00 0.00 0.00 0.00 0.00 0.00 0.00 0.00Ampedus nigricollis 0.00 0.00 0.00 0.00 0.00 0.00 0.00 0.00 0.00 0.00 0.00 0.00 0.00 0.00 0.00 0.00 0.00 0.00 0.00 0.00 0.00 0.00 0.00 0.13 0.00 0.00Ampedus near melantoides 0.00 0.00 0.00 0.00 0.00 0.00 0.00 0.00 0.00 0.00 0.13 0.00 0.00 0.00 0.00 0.00 0.00 0.00 0.00 0.13 0.00 0.00 0.00 0.00 0.00 0.13Ampedus near mixtus 0.00 0.00 0.13 0.00 0.00 0.00 0.00 0.00 0.25 0.00 0.00 0.13 0.00 0.00 0.00 1.00 0.00 0.38 0.13 0.00 0.13 0.14 0.00 0.00 0.00 0.33Ampedus pullus 0.13 0.13 0.00 0.38 0.00 0.25 0.00 0.00 0.38 1.00 0.13 1.50 2.25 0.67 0.00 0.38 0.25 0.00 0.38 0.00 0.13 0.13 0.00 2.50 1.00 1.40Ampedus sellatus 0.00 0.00 0.00 0.00 0.00 0.00 0.00 0.00 0.00 0.13 0.00 0.00 0.00 0.00 0.00 0.00 0.00 0.00 0.13 0.13 0.00 0.00 0.00 0.25 0.00 0.00Ampedus semicinctus 0.00 0.00 0.13 0.00 0.13 0.88 2.00 0.13 0.38 0.00 0.00 0.13 0.13 0.46 0.13 0.75 0.89 0.00 1.50 1.25 0.96 0.64 0.00 1.00 0.13 0.25Ampedus species C 0.00 0.00 0.00 0.13 0.00 0.00 0.00 0.00 0.00 0.00 0.00 0.00 0.00 0.00 0.00 0.00 0.00 0.00 0.00 0.00 0.00 0.00 0.00 0.00 0.00 0.00Ampedus species E 0.00 0.00 0.00 0.00 0.00 0.00 0.00 0.00 0.00 0.00 0.00 0.00 0.00 0.00 0.00 0.00 0.00 0.00 0.00 0.13 0.00 0.00 0.00 0.00 0.00 0.00Athous brightwelli 0.00 0.00 0.00 0.00 0.00 0.00 0.00 0.00 0.00 0.00 0.00 0.00 0.00 0.00 0.00 0.00 0.00 0.00 0.13 0.00 0.00 0.13 0.00 0.00 0.00 0.00Athous cucullatus 0.00 0.00 0.00 0.00 0.00 0.00 0.00 0.00 0.00 0.00 0.00 0.00 0.00 0.00 0.13 0.00 0.00 0.00 0.00 0.00 0.00 0.00 0.00 0.00 0.00 0.00Athous orvus 0.00 0.00 0.00 0.00 0.00 0.00 0.00 0.00 0.00 0.00 0.00 0.00 0.00 0.00 0.00 0.00 0.00 0.00 0.00 0.00 0.00 0.00 0.00 0.00 0.13 0.00Athous rufifrons 0.00 0.00 0.00 0.00 0.00 0.00 0.00 0.00 0.13 0.00 0.00 0.00 0.00 0.00 0.00 0.00 0.00 0.00 0.00 0.00 0.00 0.00 0.00 0.00 0.00 0.00Cardiophorus gagates 0.00 0.00 0.00 0.00 0.00 0.00 0.00 0.00 0.00 0.00 0.00 0.00 0.00 0.00 0.00 0.00 0.00 0.00 0.00 0.00 0.00 0.00 0.00 0.13 0.00 0.00Ctenicera appropinquans 0.00 0.00 0.00 0.00 0.00 0.00 0.00 0.00 0.13 0.25 0.13 0.25 0.00 0.00 0.13 0.00 0.14 0.00 0.00 0.00 0.00 0.00 0.00 0.50 0.13 0.13Ctenicera arata 0.13 0.00 0.00 0.13 0.00 0.13 0.13 0.00 0.13 0.13 0.13 0.00 0.00 0.00 0.00 0.63 0.00 0.00 0.63 0.00 0.00 0.64 0.25 0.50 0.13 0.13Ctenicera cruciata 0.13 0.00 0.00 0.00 0.63 0.00 0.00 0.00 0.00 0.00 0.00 0.00 0.00 0.13 0.53 0.13 0.00 0.13 1.00 0.38 0.13 0.00 0.00 0.13 0.13 0.00Ctenicera fulvipes 0.00 0.00 0.00 0.00 0.00 0.00 0.25 0.00 0.00 0.00 0.00 0.00 0.00 0.00 0.00 0.00 0.00 0.00 0.13 0.25 0.00 0.00 0.00 0.13 0.13 0.00Ctenicera hamata 0.00 0.00 0.00 0.00 0.13 0.00 0.00 0.00 0.00 0.00 0.00 0.00 0.00 0.00 0.00 0.00 0.00 0.00 0.25 0.00 0.00 0.00 0.00 0.00 0.00 0.00Ctenicera hieroglyphica 0.25 0.13 0.00 0.00 0.00 0.00 0.38 0.38 0.00 0.00 0.00 0.00 0.00 0.00 0.20 0.13 0.00 0.25 0.00 1.38 0.25 0.29 0.00 0.13 0.13 0.20Ctenicera insidiosa 0.00 0.13 0.00 0.00 0.00 0.00 0.00 0.00 0.00 0.00 0.00 0.00 0.00 0.00 0.00 0.00 0.00 0.13 0.00 0.00 0.00 0.00 0.00 0.00 0.00 0.00Ctenicera mediana 0.13 0.00 0.00 0.13 0.00 0.00 0.00 0.50 0.00 0.00 1.88 0.13 0.25 0.00 0.00 0.00 0.00 0.13 0.00 0.50 0.75 0.00 0.00 2.13 0.25 0.00Ctenicera nitidula 0.00 0.00 0.13 0.00 0.00 0.00 0.00 0.00 0.38 0.00 0.00 0.00 0.00 0.00 0.00 0.00 0.25 0.00 0.00 0.00 0.00 0.14 0.00 0.00 0.13 0.00Ctenicera propola 0.00 0.13 1.38 0.50 0.75 0.25 0.13 0.00 0.00 0.00 0.38 0.25 0.00 0.13 0.00 1.25 0.00 0.13 0.00 0.63 0.00 0.00 0.00 0.00 0.00 0.00Ctenicera resplendens 0.00 0.00 0.00 0.00 0.00 0.00 0.00 0.00 0.13 0.00 0.13 0.00 0.00 0.00 0.00 0.00 0.00 0.00 0.00 0.00 0.00 0.25 0.00 0.00 0.00 0.00Ctenicera rufopleuralis 0.13 0.00 0.00 0.00 0.00 0.00 0.00 0.25 0.38 0.00 0.00 0.00 0.00 0.00 0.00 0.00 0.00 0.13 0.00 0.00 0.13 0.27 0.63 0.00 0.25 0.00Ctenicera spinosa 0.00 0.38 0.00 0.38 0.13 0.25 0.00 0.00 0.00 0.00 0.13 0.25 0.50 0.13 0.00 0.00 0.00 0.13 0.13 0.00 0.00 0.00 0.00 0.25 0.00 0.25Ctenicera tarsalis 0.00 0.00 0.00 0.00 0.00 0.00 0.13 0.00 0.00 0.00 0.00 0.00 0.00 0.00 0.00 0.00 0.00 0.00 0.00 0.00 0.00 0.00 0.00 0.00 0.00 0.00Ctenicera triundulata 0.63 1.63 9.13 11.63 11.75 10.75 2.63 1.75 7.00 9.13 5.00 4.00 1.63 3.17 0.50 4.63 10.79 3.38 14.50 6.25 1.75 18.96 3.13 13.13 21.13 12.28Dalopius species 0.00 0.00 0.50 0.50 0.00 0.50 0.25 0.38 0.25 0.13 0.00 0.13 0.50 0.17 0.33 0.50 0.79 0.00 0.63 0.88 0.75 0.27 0.25 0.13 0.00 2.30Danosoma brevicornis 0.13 0.13 0.25 0.63 0.25 0.00 0.00 0.25 0.13 0.00 0.50 0.13 1.38 0.00 0.00 0.00 0.29 0.00 0.00 0.00 0.00 0.00 0.00 0.00 0.00 0.00Danosoma obtectus 0.00 0.00 0.00 0.00 0.00 0.00 0.00 0.00 0.00 0.00 0.00 0.00 0.13 0.00 0.00 0.00 0.00 0.00 0.00 0.00 0.00 0.00 0.00 0.00 0.00 0.00Denticollis denticornis 0.00 0.13 0.13 0.00 0.13 0.00 0.00 0.00 0.00 0.00 0.00 0.00 0.00 0.00 0.00 0.00 0.00 0.00 0.00 0.13 0.00 0.00 0.00 0.00 0.00 0.00Drasterius debilis 0.00 0.00 0.00 0.00 0.00 0.00 0.00 0.00 0.00 0.25 0.00 0.00 0.00 0.00 0.00 0.00 0.00 0.00 0.00 0.00 0.00 0.00 0.00 0.00 0.00 0.00Elathous dicalceatus 0.00 0.00 0.00 0.00 0.00 0.13 0.00 0.00 0.00 0.00 0.00 0.00 0.00 0.00 0.00 0.00 0.00 0.25 0.25 0.00 0.00 0.00 0.13 0.00 0.25 0.00Fornax canadensis 0.00 0.00 0.00 0.00 0.13 0.00 0.38 0.00 0.00 0.00 0.00 0.00 0.00 0.00 0.00 0.25 0.14 0.00 0.00 0.00 0.00 0.00 0.00 0.00 0.00 0.13Isoriphis obliqua 0.00 0.00 0.00 0.00 0.63 0.25 0.25 0.00 0.13 0.13 0.00 0.00 0.00 0.00 0.00 0.00 0.00 0.00 0.00 0.00 0.00 0.00 0.00 0.00 0.00 0.00Lacon auroratus 0.00 0.00 0.00 0.00 0.00 0.13 0.00 0.00 0.00 0.00 0.00 0.00 0.00 0.00 0.00 0.00 0.00 0.00 0.00 0.00 0.00 0.00 0.00 0.00 0.00 0.00Limonius aeger 0.00 0.13 0.13 0.50 0.00 0.00 0.00 0.00 0.38 0.25 0.00 0.00 0.00 0.00 0.00 0.25 0.00 0.25 0.25 0.00 0.00 1.14 0.75 0.00 0.00 0.00Limonius confusus 0.00 0.00 0.00 0.00 0.00 0.00 0.13 0.00 0.00 0.00 0.00 0.00 0.00 0.00 0.00 0.00 0.00 0.00 0.00 0.13 0.00 0.14 0.00 0.00 0.00 0.00Melanotus castanipes 0.13 0.00 0.13 0.88 0.25 0.75 0.38 0.13 0.25 0.25 0.13 0.75 0.38 0.13 0.00 0.38 0.39 0.63 1.00 0.25 0.25 0.00 0.25 0.38 0.13 0.00Melanotus hyslopi 0.13 0.00 0.00 0.00 0.00 0.00 0.00 0.00 0.00 0.00 0.13 0.00 0.00 0.00 0.00 0.00 0.00 0.00 0.00 0.00 0.00 0.00 0.00 0.00 0.00 0.00Melanotus sagitarius 0.00 0.00 0.00 0.00 0.00 0.00 0.00 0.00 0.00 0.00 0.13 0.00 0.00 0.00 0.00 0.00 0.00 0.00 0.00 0.00 0.00 0.00 0.00 0.00 0.00 0.00Melanotus similis 0.13 0.00 0.00 0.00 0.38 0.00 0.00 0.00 0.00 0.00 0.13 0.25 0.00 0.13 0.00 0.00 0.00 0.00 0.00 0.00 0.00 0.13 0.00 0.13 0.00 0.13Melanotus species 0.00 0.00 0.00 0.00 0.25 0.00 0.00 0.00 0.13 0.00 0.00 0.00 0.00 0.00 0.00 0.00 0.00 0.00 0.00 0.00 0.00 0.00 0.00 0.00 0.00 0.00Microhypnus striatulus 0.00 0.00 0.00 0.00 0.13 0.00 0.00 0.00 0.13 0.00 0.00 0.00 0.00 0.17 0.00 0.00 0.00 0.00 0.00 0.00 0.00 0.00 0.00 0.00 0.00 0.00Oxygonus montanus 0.00 0.00 0.00 0.00 0.00 0.00 0.25 0.00 0.00 0.00 0.00 0.00 0.00 0.00 0.00 0.00 0.00 0.38 1.25 1.88 0.00 0.00 0.00 0.00 0.00 0.00Oxygonus obesus 0.00 0.00 0.00 0.00 0.00 0.00 0.25 0.00 0.00 0.00 0.00 0.00 0.00 0.00 0.00 0.00 0.00 0.00 0.00 0.00 0.00 0.00 0.00 0.00 0.00 0.00Sericus brunneus 0.00 0.13 3.25 0.38 0.00 0.38 0.13 0.00 0.00 0.00 0.13 0.25 0.88 0.17 0.00 4.25 0.64 0.50 0.25 0.25 0.00 0.13 0.00 0.63 0.63 1.90Sericus honesticus 0.00 0.00 0.13 0.00 0.00 0.00 0.00 0.00 0.00 0.00 0.00 0.00 0.00 0.00 0.00 0.00 0.00 0.13 0.00 0.25 0.00 0.00 0.00 0.00 0.00 0.00Sericus viridanus 0.13 0.00 0.00 0.13 0.00 0.13 0.13 0.00 0.00 0.00 0.00 0.00 0.00 0.00 0.00 0.75 0.14 0.00 0.00 0.25 0.00 0.00 0.00 0.00 0.00 0.00
Species1997 1998
Table A. 1. Click beetle abundance per trap week for all species, stands, and years.
120
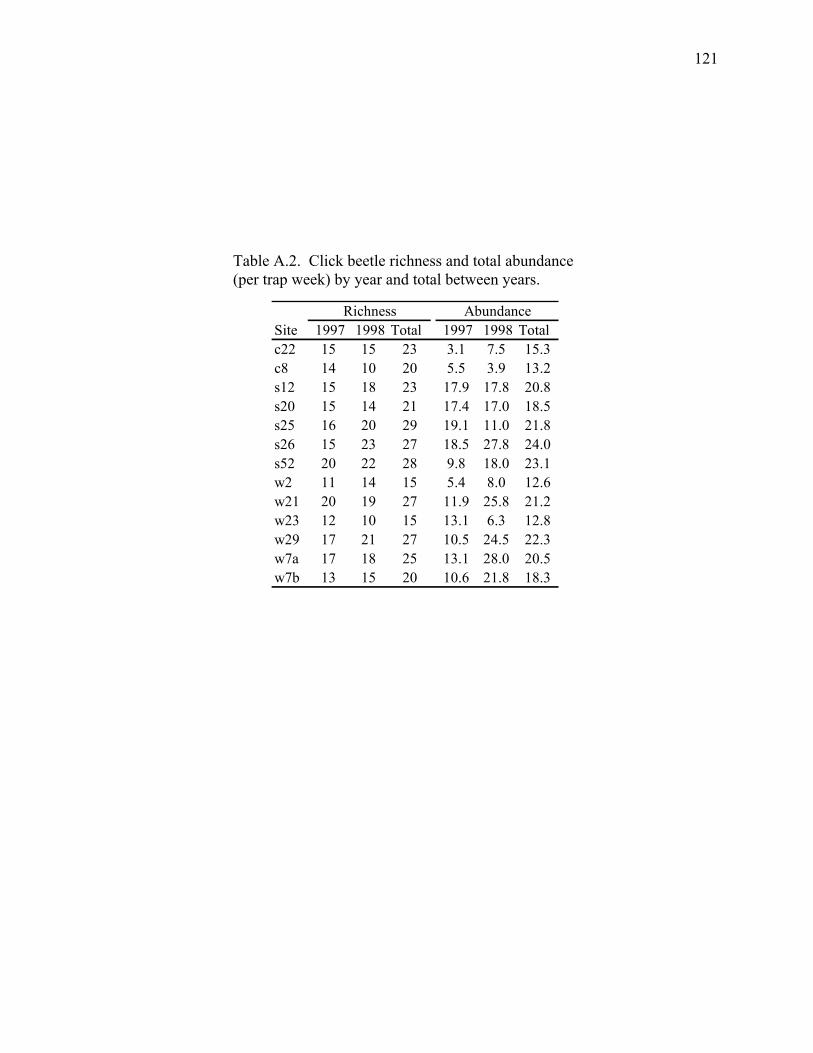
Site 1997 1998 Total 1997 1998 Totalc22 15 15 23 3.1 7.5 15.3c8 14 10 20 5.5 3.9 13.2s12 15 18 23 17.9 17.8 20.8s20 15 14 21 17.4 17.0 18.5s25 16 20 29 19.1 11.0 21.8s26 15 23 27 18.5 27.8 24.0s52 20 22 28 9.8 18.0 23.1w2 11 14 15 5.4 8.0 12.6w21 20 19 27 11.9 25.8 21.2w23 12 10 15 13.1 6.3 12.8w29 17 21 27 10.5 24.5 22.3w7a 17 18 25 13.1 28.0 20.5w7b 13 15 20 10.6 21.8 18.3
Richness Abundance
Table A.2. Click beetle richness and total abundance (per trap week) by year and total between years.
121
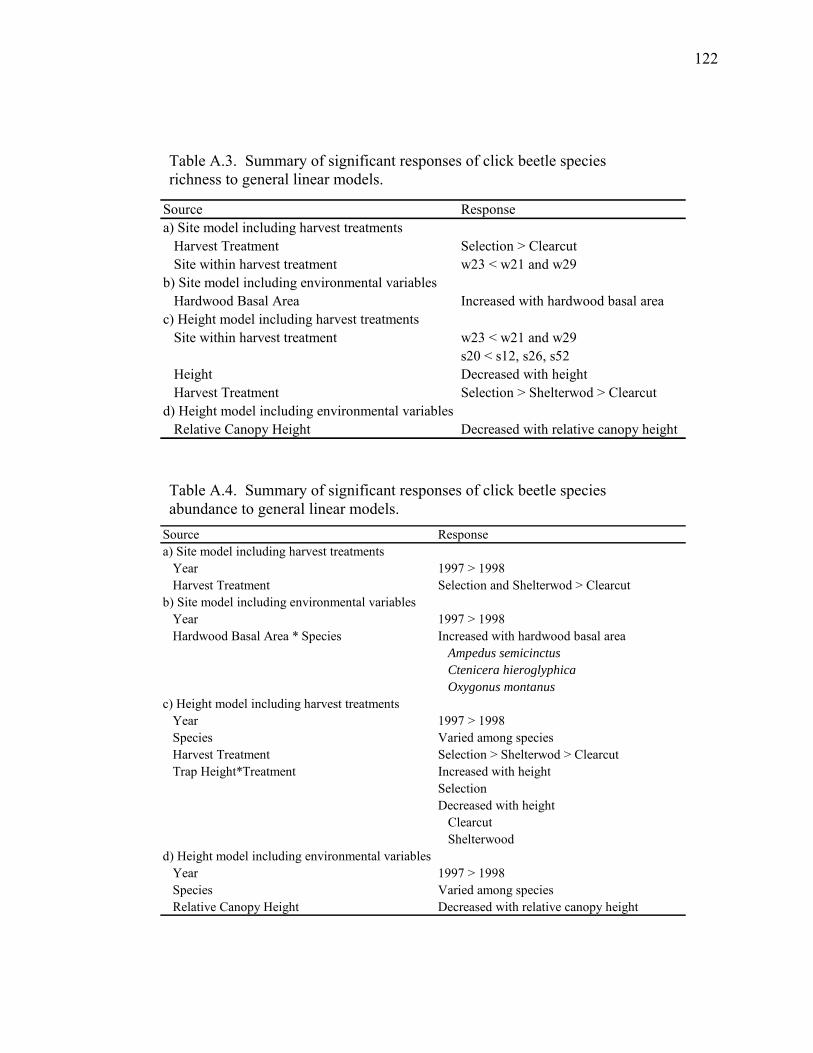
Table A.3. Summary of significant responses of click beetle species richness to general linear models.
Source Responsea) Site model including harvest treatments Harvest Treatment Selection > Clearcut Site within harvest treatment w23 < w21 and w29b) Site model including environmental variables Hardwood Basal Area Increased with hardwood basal areac) Height model including harvest treatments Site within harvest treatment w23 < w21 and w29
s20 < s12, s26, s52 Height Decreased with height Harvest Treatment Selection > Shelterwod > Clearcutd) Height model including environmental variables Relative Canopy Height Decreased with relative canopy height
Table A.4. Summary of significant responses of click beetle species abundance to general linear models.
Source Responsea) Site model including harvest treatments Year 1997 > 1998 Harvest Treatment Selection and Shelterwod > Clearcutb) Site model including environmental variables Year 1997 > 1998 Hardwood Basal Area * Species Increased with hardwood basal area
Ampedus semicinctus Ctenicera hieroglyphica Oxygonus montanus
c) Height model including harvest treatments Year 1997 > 1998 Species Varied among species Harvest Treatment Selection > Shelterwod > Clearcut Trap Height*Treatment Increased with height
Selection Decreased with height Clearcut Shelterwood
d) Height model including environmental variables Year 1997 > 1998 Species Varied among species Relative Canopy Height Decreased with relative canopy height
122
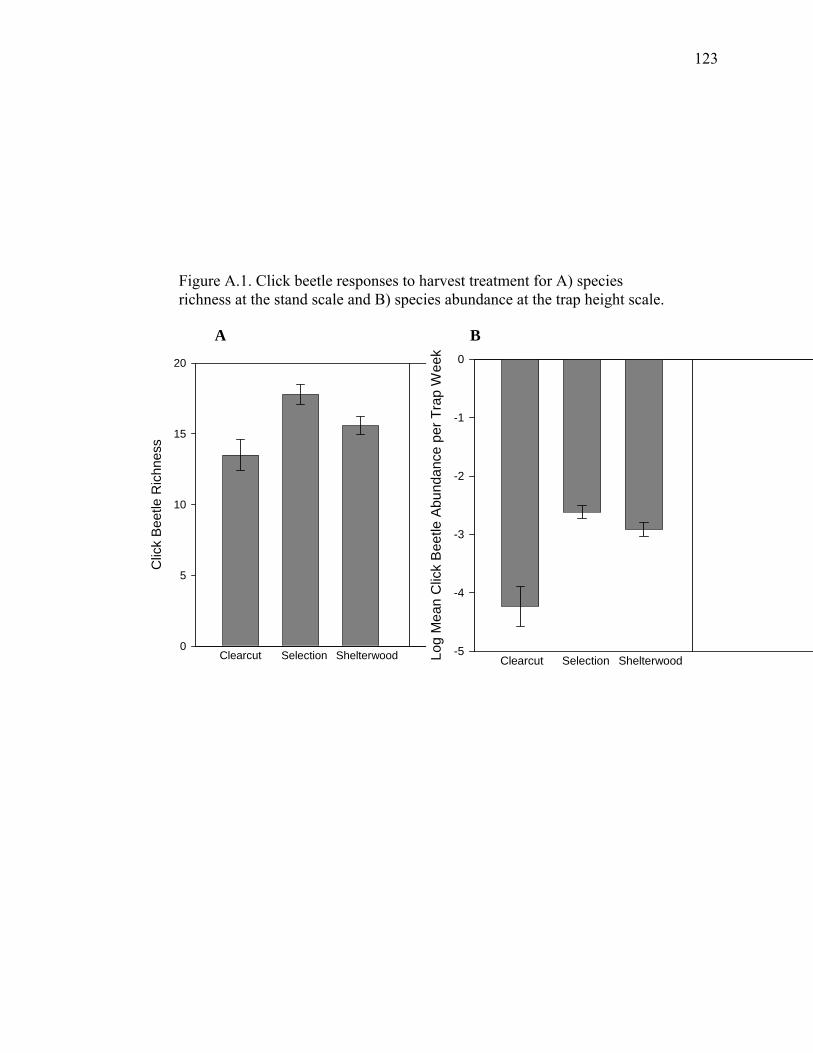
Figure A.1. Click beetle responses to harvest treatment for A) species richness at the stand scale and B) species abundance at the trap height scale.
Clic
k B
eetle
Ric
hnes
s
0
5
10
15
20
Clearcut Selection Shelterwood Log
Mea
n C
lick
Bee
tle A
bund
ance
per
Tra
p W
eek
-5
-4
-3
-2
-1
0
Clearcut Selection Shelterwood
A B
123
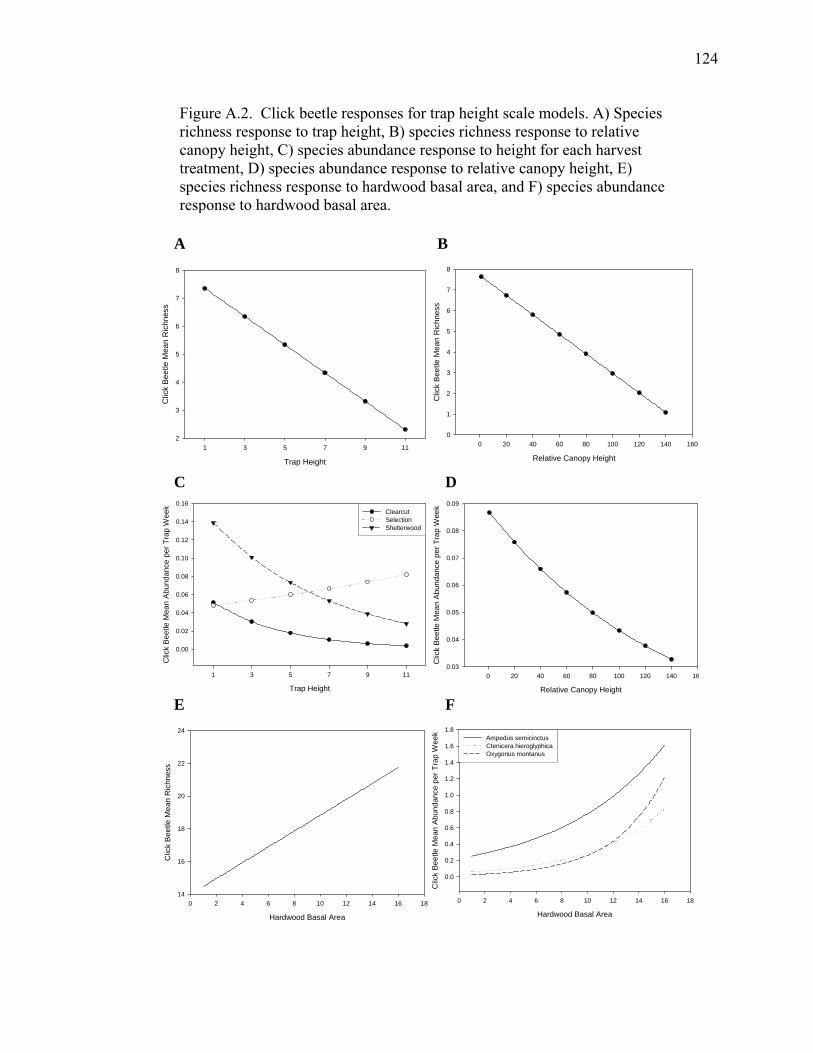
Figure A.2. Click beetle responses for trap height scale models. A) Species richness response to trap height, B) species richness response to relative canopy height, C) species abundance response to height for each harvest treatment, D) species abundance response to relative canopy height, E) species richness response to hardwood basal area, and F) species abundance response to hardwood basal area.
Relative Canopy Height
0 20 40 60 80 100 120 140 160C
lick
Bee
tle M
ean
Ric
hnes
s0
1
2
3
4
5
6
7
8
Trap Height
1 3 5 7 9 11
Clic
k B
eetle
Mea
n R
ichn
ess
2
3
4
5
6
7
8
A B
Trap Height
1 3 5 7 9 11
Clic
k B
eetle
Mea
n A
bund
ance
per
Tra
p W
eek
0.00
0.02
0.04
0.06
0.08
0.10
0.12
0.14
0.16ClearcutSelectionShelterwood
Relative Canopy Height
0 20 40 60 80 100 120 140 16
Clic
k B
eetle
Mea
n A
bund
ance
per
Tra
p W
eek
0.03
0.04
0.05
0.06
0.07
0.08
0.09
C D
Hardwood Basal Area
0 2 4 6 8 10 12 14 16 18
Clic
k B
eetle
Mea
n R
ichn
ess
14
16
18
20
22
24
Hardwood Basal Area
0 2 4 6 8 10 12 14 16 18
Clic
k Be
etle
Mea
n Ab
unda
nce
per T
rap
Wee
k
0.0
0.2
0.4
0.6
0.8
1.0
1.2
1.4
1.6
1.8Ampedus semicinctusCtenicera hieroglyphicaOxygonus montanus
E F
124
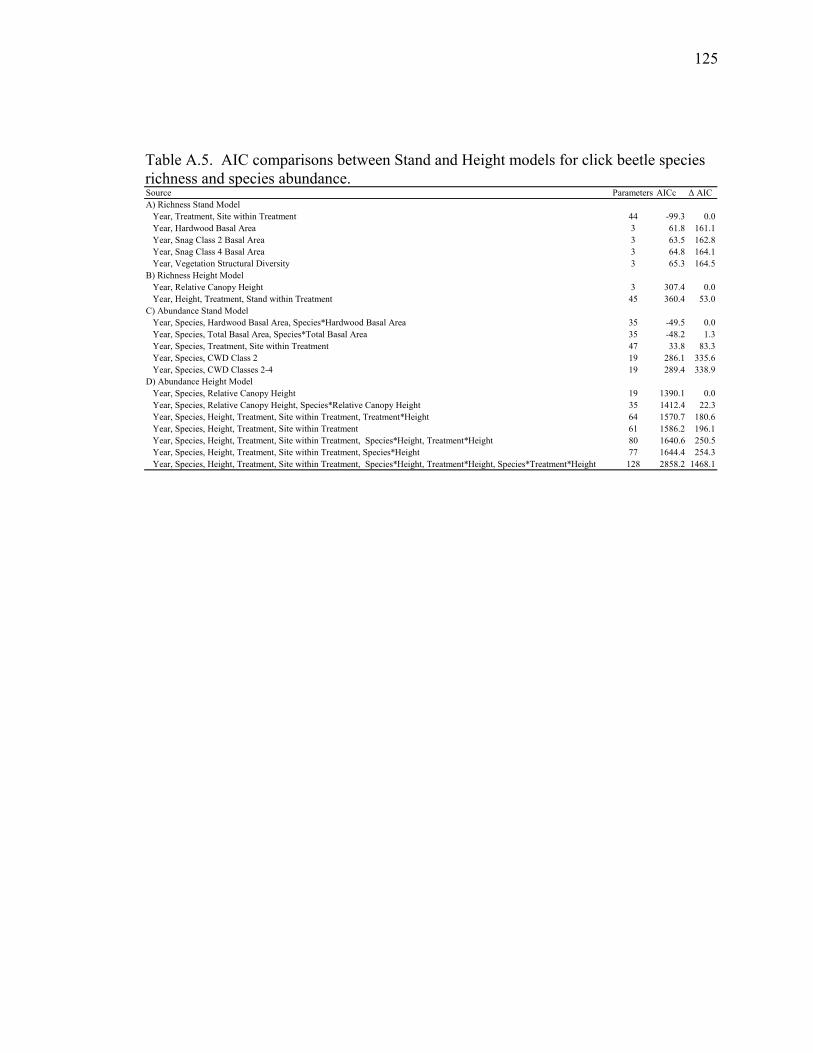
Table A.5. AIC comparisons between Stand and Height models for click beetle species richness and species abundance. Source Parameters AICc Δ AICA) Richness Stand Model Year, Treatment, Site within Treatment 44 -99.3 0.0 Year, Hardwood Basal Area 3 61.8 161.1 Year, Snag Class 2 Basal Area 3 63.5 162.8 Year, Snag Class 4 Basal Area 3 64.8 164.1 Year, Vegetation Structural Diversity 3 65.3 164.5B) Richness Height Model Year, Relative Canopy Height 3 307.4 0.0 Year, Height, Treatment, Stand within Treatment 45 360.4 53.0C) Abundance Stand Model Year, Species, Hardwood Basal Area, Species*Hardwood Basal Area 35 -49.5 0.0 Year, Species, Total Basal Area, Species*Total Basal Area 35 -48.2 1.3 Year, Species, Treatment, Site within Treatment 47 33.8 83.3 Year, Species, CWD Class 2 19 286.1 335.6 Year, Species, CWD Classes 2-4 19 289.4 338.9D) Abundance Height Model Year, Species, Relative Canopy Height 19 1390.1 0.0 Year, Species, Relative Canopy Height, Species*Relative Canopy Height 35 1412.4 22.3 Year, Species, Height, Treatment, Site within Treatment, Treatment*Height 64 1570.7 180.6 Year, Species, Height, Treatment, Site within Treatment 61 1586.2 196.1 Year, Species, Height, Treatment, Site within Treatment, Species*Height, Treatment*Height 80 1640.6 250.5 Year, Species, Height, Treatment, Site within Treatment, Species*Height 77 1644.4 254.3 Year, Species, Height, Treatment, Site within Treatment, Species*Height, Treatment*Height, Species*Treatment*Height 128 2858.2 1468.1
125
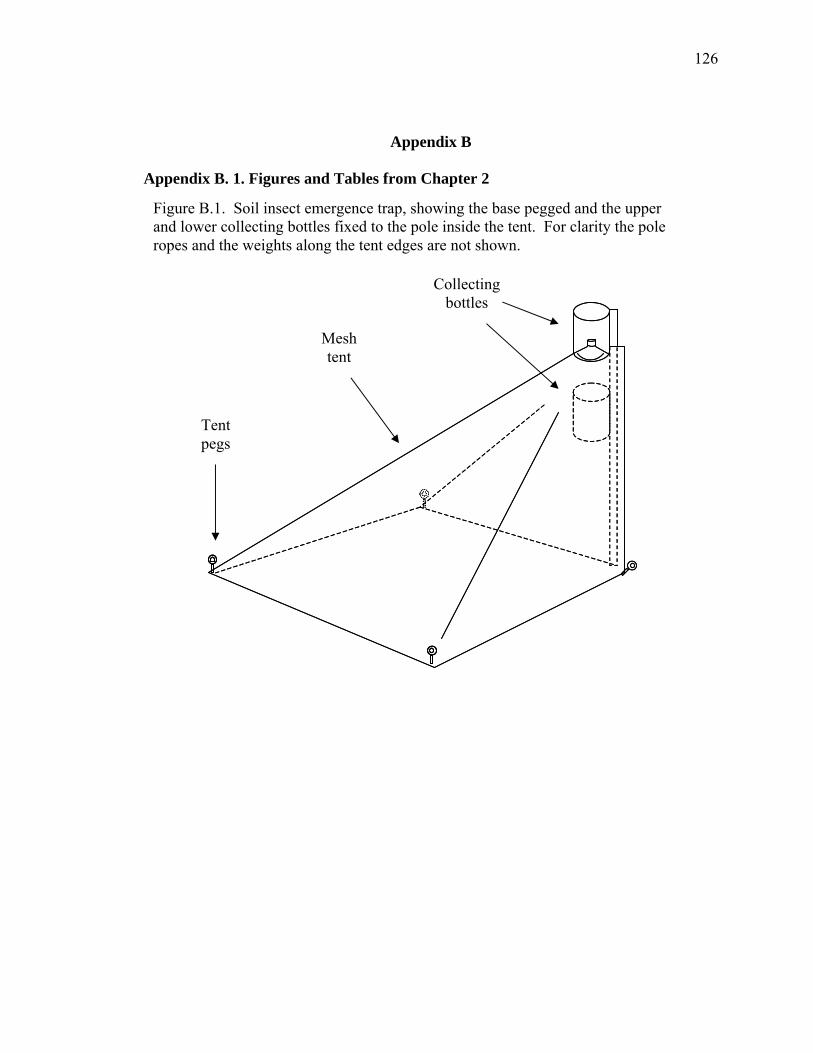
Appendix B
Appendix B. 1. Figures and Tables from Chapter 2
Figure B.1. Soil insect emergence trap, showing the base pegged and the upper and lower collecting bottles fixed to the pole inside the tent. For clarity the pole ropes and the weights along the tent edges are not shown.
Collecting bottles
Mesh tent
Tent pegs
126
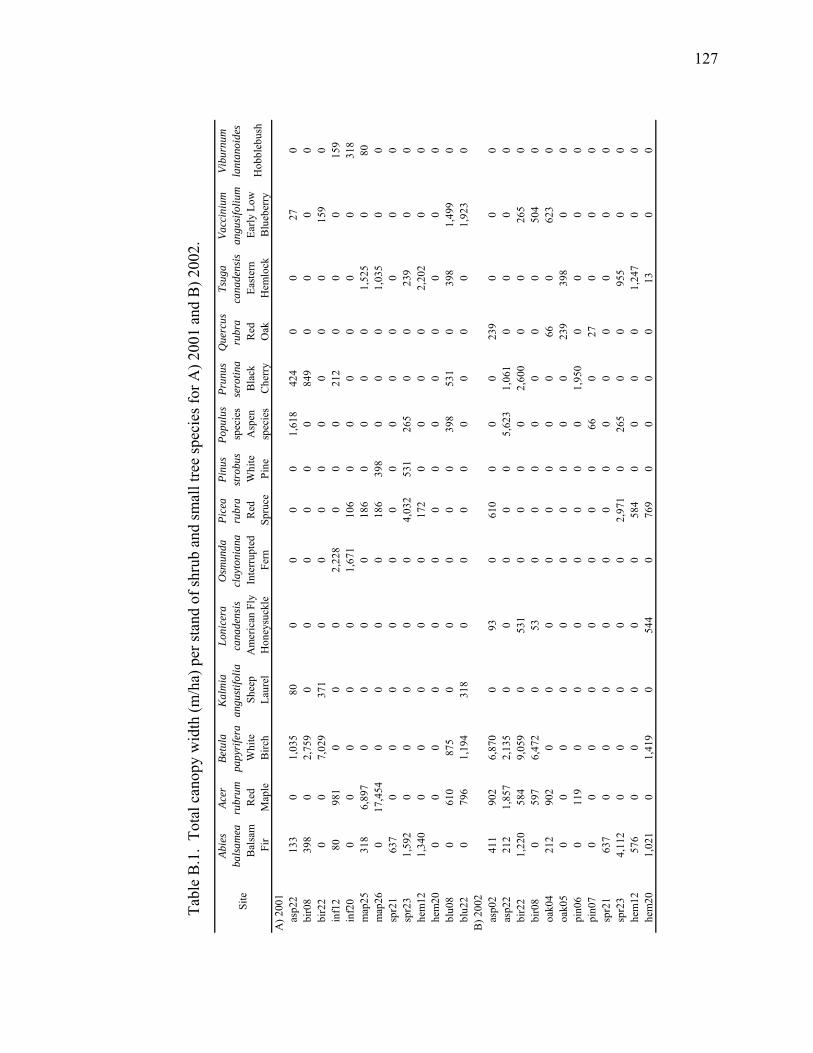
Tabl
e B
.1.
Tota
l can
opy
wid
th (m
/ha)
per
stan
d of
shru
b an
d sm
all t
ree
spec
ies f
or A
) 200
1 an
d B
) 200
2.
Abie
s ba
lsam
eaAc
er
rubr
umBe
tula
pa
pyri
fera
Kal
mia
an
gust
ifolia
Loni
cera
ca
nade
nsis
Osm
unda
cl
ayto
nian
aPi
cea
rubr
aPi
nus
stro
bus
Popu
lus
spec
ies
Prun
us
sero
tina
Que
rcus
ru
bra
Tsug
a ca
nade
nsis
Vacc
iniu
m
angu
sifo
lium
Vibu
rnum
la
ntan
oide
s
Bal
sam
Fi
rR
ed
Map
leW
hite
Birc
hSh
eep
Laur
elA
mer
ican
Fly
H
oney
suck
leIn
terr
upte
d Fe
rnR
ed
Spru
ceW
hite
Pi
neA
spen
sp
ecie
sB
lack
C
herr
yR
ed
O
akEa
ster
n H
emlo
ckEa
rly L
ow
Blu
eber
ryH
obbl
ebus
h
A) 2
001
as
p22
133
01,
035
800
00
01,
618
424
00
270
bi
r08
398
02,
759
00
00
00
849
00
00
bi
r22
00
7,02
937
10
00
00
00
015
90
in
f12
8098
10
00
2,22
80
00
212
00
015
9
inf2
00
00
00
1,67
110
60
00
00
031
8
map
2531
86,
897
00
00
186
00
00
1,52
50
80
map
260
17,4
540
00
018
639
80
00
1,03
50
0
spr2
163
70
00
00
00
00
00
00
sp
r23
1,59
20
00
00
4,03
253
126
50
023
90
0
hem
121,
340
00
00
017
20
00
02,
202
00
he
m20
00
00
00
00
00
00
00
bl
u08
061
087
50
00
00
398
531
039
81,
499
0
blu2
20
796
1,19
431
80
00
00
00
01,
923
0B
) 200
2
asp0
241
190
26,
870
093
061
00
00
239
00
0
asp2
221
21,
857
2,13
50
00
00
5,62
31,
061
00
00
bi
r22
1,22
058
49,
059
053
10
00
02,
600
00
265
0
bir0
80
597
6,47
20
530
00
00
00
504
0
oak0
421
290
20
00
00
00
066
062
30
oa
k05
00
00
00
00
00
239
398
00
pi
n06
011
90
00
00
00
1,95
00
00
0
pin0
70
00
00
00
066
027
00
0
spr2
163
70
00
00
00
00
00
00
sp
r23
4,11
20
00
00
2,97
10
265
00
955
00
he
m12
576
00
00
058
40
00
01,
247
00
he
m20
1,02
10
1,41
90
544
076
90
00
013
00
Site
127
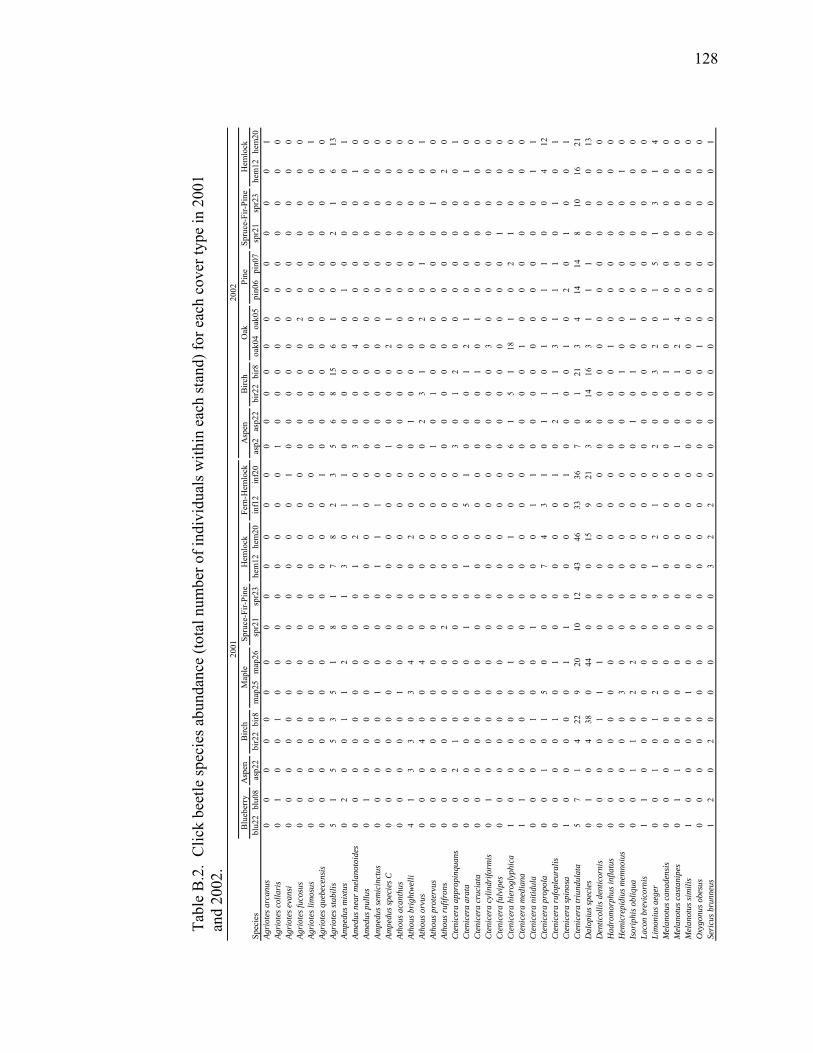
Tabl
e B
.2.
Clic
k be
etle
spec
ies a
bund
ance
(tot
al n
umbe
r of i
ndiv
idua
ls w
ithin
eac
h st
and)
for e
ach
cove
r typ
e in
200
1 an
d 20
02.
Asp
enSp
ecie
sbl
u22
blu0
8as
p22
bir2
2bi
r8m
ap25
map
26sp
r21
spr2
3he
m12
hem
20in
f12
inf2
0as
p2as
p22
bir2
2bi
r8oa
k04
oak0
5pi
n06
pin0
7sp
r21
spr2
3he
m12
hem
20Ag
riot
es a
rcan
us0
00
00
00
00
00
00
00
00
00
00
00
01
Agri
otes
col
lari
s0
10
01
00
00
00
00
10
00
00
00
00
00
Agri
otes
eva
nsi
00
00
00
00
00
00
10
00
00
00
00
00
0Ag
riot
es fu
cosu
s0
00
00
00
00
00
00
00
00
02
00
00
00
Agri
otes
lim
osus
00
00
00
00
00
00
00
00
00
00
00
00
1Ag
riot
es q
uebe
cens
is0
00
00
00
00
00
01
00
00
00
00
00
00
Agri
otes
stab
ilis
51
55
35
18
17
82
35
68
156
10
02
16
13Am
pedu
s mix
tus
02
00
11
20
13
01
10
00
00
01
00
00
1Am
edus
nea
r mel
anot
oide
s0
00
00
00
00
12
10
30
00
40
00
00
10
Amed
us p
ullu
s0
10
00
00
00
00
00
00
00
00
00
00
00
Ampe
dus s
emic
inct
us0
00
00
10
00
11
10
00
00
00
00
00
00
Ampe
dus s
peci
es C
00
00
00
00
00
00
01
00
02
10
00
00
0At
hous
aca
nthu
s0
00
00
10
00
00
00
00
00
00
00
00
00
Atho
us b
righ
twel
li4
13
30
34
00
02
00
01
00
00
00
00
00
Atho
us o
rvus
00
04
00
40
00
00
00
23
10
20
10
00
1At
hous
pro
terv
us0
00
00
00
00
00
00
10
10
00
00
01
00
Atho
us ru
fifro
ns0
00
00
00
20
00
00
00
00
00
00
00
20
Cte
nice
ra a
ppro
pinq
uans
00
21
00
00
00
00
03
01
20
00
00
00
1C
teni
cera
ara
ta0
00
00
00
10
10
51
00
01
21
00
00
10
Cte
nice
ra c
ruci
ata
00
00
00
00
00
00
00
00
10
10
00
00
0C
teni
cera
cyl
indr
iform
is0
10
00
00
00
00
00
00
00
30
00
00
00
Cte
nice
ra fu
lvip
es0
00
00
00
00
00
00
00
00
00
00
10
00
Cte
nice
ra h
iero
glyp
hica
10
00
00
10
00
10
06
15
118
10
21
00
0C
teni
cera
med
iana
11
00
00
00
00
00
00
00
01
00
00
00
0C
teni
cera
niti
dula
00
00
10
01
00
01
10
00
00
00
00
01
1C
teni
cera
pro
pola
00
10
15
00
07
43
10
11
01
01
10
04
12C
teni
cera
rufo
pleu
ralis
00
00
10
10
00
00
10
21
13
11
10
10
1C
teni
cera
spin
osa
10
00
00
11
00
00
10
00
01
02
01
00
1C
teni
cera
triu
ndul
ata
57
14
229
2010
1243
4633
367
01
213
414
148
1016
21D
alop
ius s
peci
es0
10
438
044
00
015
921
38
1416
31
11
00
013
Den
ticol
lis d
entic
orni
s0
00
01
11
00
00
00
00
00
00
00
00
00
Had
rom
orph
us in
flatu
s0
00
00
00
00
00
00
00
00
10
00
00
00
Hem
icre
pidi
us m
emno
ius
00
00
03
00
00
00
00
00
10
00
00
01
0Is
orip
his o
bliq
ua0
01
10
22
00
00
00
01
01
01
00
00
00
Laco
n br
evic
orni
s1
10
00
00
00
00
00
00
00
00
00
00
00
Lim
oniu
s aeg
er0
01
01
20
09
12
10
20
03
20
15
13
14
Mel
anot
us c
anad
ensi
s0
00
00
00
00
00
00
00
01
01
00
00
00
Mel
anot
us c
asta
nipe
s0
11
00
00
00
00
00
10
01
24
00
00
00
Mel
anot
us si
mili
s1
00
00
10
00
00
00
00
00
00
00
00
00
Oxy
gonu
s obe
sus
00
00
00
00
00
00
00
00
01
00
00
00
0Se
ricu
s bru
nneu
s1
20
20
00
00
32
20
00
00
00
00
00
01
Hem
lock
2002
Birc
hO
akPi
neSp
ruce
-Fir-
Pine
Hem
lock
Fern
-Hem
lock
2001
Asp
enB
irch
Blu
eber
ryM
aple
Spru
ce-F
ir-Pi
ne
128
Appendix B.2. NMS v. CCA
Two ordination analyses were used to examine the relation between click beetle
species abundance and the vegetation community. I used non-metric multidimensional
scaling (NMS; Kruskal 1964) to determine the strongest gradients in the click beetle
assemblage structure among cover types and to associate click beetle species with
particular vegetation species. Canonical correspondence analysis (CCA, Ter Braak 1986)
was used to determine the amount of the variation in the click beetle assemblage that
could be accounted for by vegetation variables. To exclude bias provided by including
rare species (Jongman et al. 1995), I included only the 20 and 17 most common species
for 2001 and 2002, respectively, in the analyses. A cube root transformation was used to
reduce dominance of the most abundant species (McCune & Grace 2002).
NMS is an iterative ordination method based on ranked distances between sample
units. This method searches for low stress, measured by the relationship between the
ranked distances in the original multidimensional space and the reduced dimensions
produced by the ordination. NMS is an effective ordination method for community data;
it is robust to a large proportion of zero values and does not assume normality (Clarke
1993, McCune and Grace 2002). I used PC-ORD (McCune and Mefford 1999) with
random starting configurations and the quantitative version of the Sorensen distance
measure; the run with the lowest stress was used for the final analysis. In a previous
NMS analysis on the stands in common between sample years, I examined the relative
position of the species and found little difference between years. In order to use all of the
stands, however, I analyzed the two years separately. For each year, six axes were
assessed and three axes were selected. I presented results for only the two axes that had
129
significant Monte Carlo test results (p < 0.05). The 2001 ordination final stress was 5.96,
and the two axes were 93.6% orthogonal and explained 19.5% and 63.9% of the variation
in the click beetle assemblage structure. The 2002 ordination final stress was 6.11, and
the two axes were 99.9% orthogonal and explained 29.5% and 41.7% of the variation in
the click beetle assemblage structure. I subsequently performed Pearson and Kendall
correlations between the ordination axes with the beetle species and the vegetation
species, and joint-plotted the vegetation species. A high correlation between a vegetation
species and an NMS axis indicated a strong association between that vegetation species
with the click beetle species associated with the axis. I overlaid polygons encircling the
stands of major vegetation types.
CCA conducts an ordination that is constrained by the environmental variables in
that CCA regresses the click beetle species onto the environmental variables and then
ordinates the results. The eigenvalues are estimates of “inertia,” or the total variance in
the species data set. The interset correlations indicate the influence of the environmental
variables in structuring the ordination. CANOCO version 4.5A (Ter Braak 2003) was
used to employ automatic forward selection to determine the most important vegetation
species and the order of their inclusion in the model based on the conditional effects (the
variance each vegetation species explained after selecting the most important variables).
I subsequently carried out an automatic CCA to determine the statistical significance of
each model. Monte Carlo analysis was performed using 1,000 permutations to test each
CCA model at a significance level of alpha = 0.05. For each year, models were based on
the following vegetation categories: “understory only” (including shrubs, small trees, and
ferns), “overstory only,” and “mixed understory and overstory.” The results from the
130
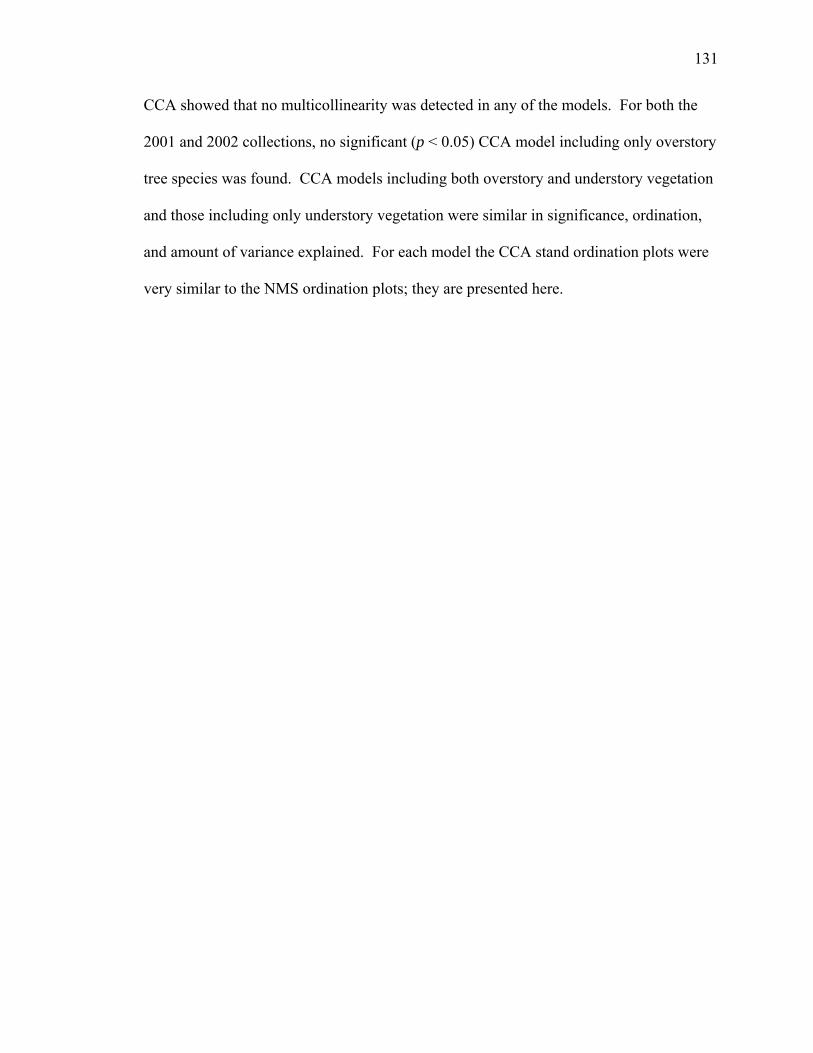
CCA showed that no multicollinearity was detected in any of the models. For both the
2001 and 2002 collections, no significant (p < 0.05) CCA model including only overstory
tree species was found. CCA models including both overstory and understory vegetation
and those including only understory vegetation were similar in significance, ordination,
and amount of variance explained. For each model the CCA stand ordination plots were
very similar to the NMS ordination plots; they are presented here.
131
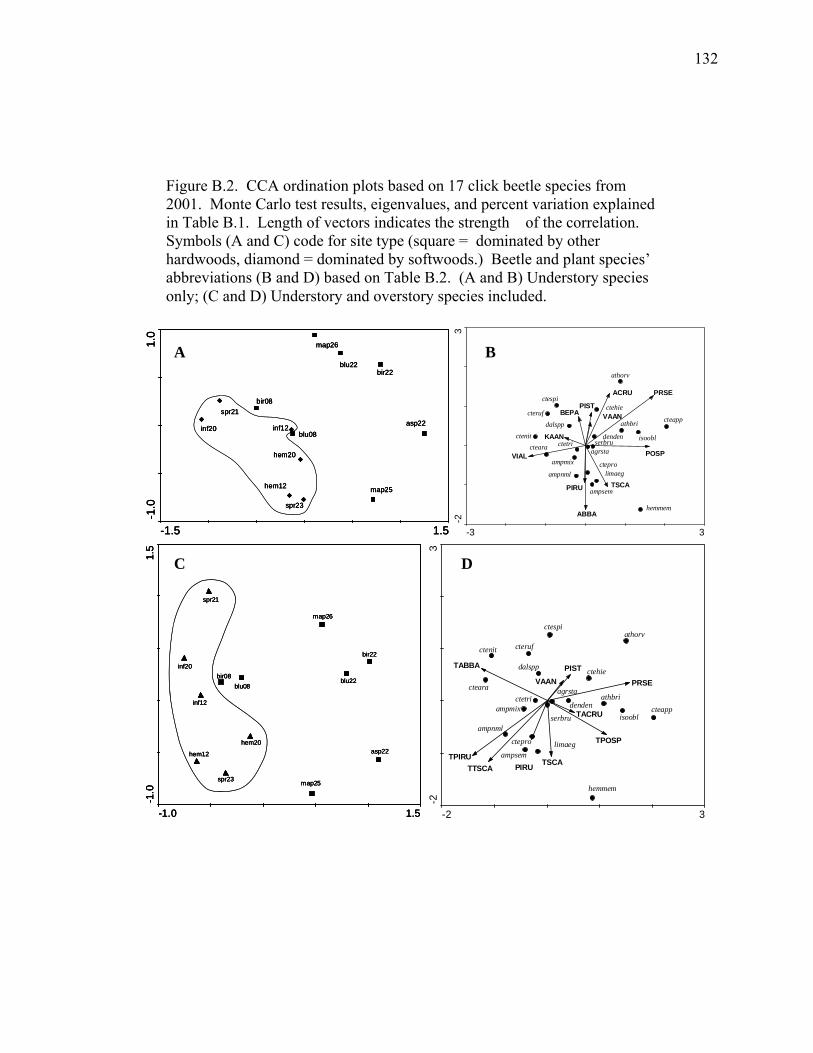
Figure B.2. CCA ordination plots based on 17 click beetle species from 2001. Monte Carlo test results, eigenvalues, and percent variation explained in Table B.1. Length of vectors indicates the strength of the correlation. Symbols (A and C) code for site type (square = dominated by other hardwoods, diamond = dominated by softwoods.) Beetle and plant species’ abbreviations (B and D) based on Table B.2. (A and B) Understory species only; (C and D) Understory and overstory species included.
-1.5 1.5
-1.0
1.0
asp22
bir22
bir08
inf12inf20
map25
map26
spr21
spr23
hem12
hem20
blu22
blu08
-1.5 1.5
-1.0
1.0
asp22
bir22
bir08
inf12inf20
map25
map26
spr21
spr23
hem12
hem20
blu22
blu08
-1.5 1.5
-1.0
1.0
asp22
bir22
bir08
inf12inf20
map25
map26
spr21
spr23
hem12
hem20
blu22
blu08
-3 3
-23
cteapp
ctehiecteruf
denden
hemmem
ampnml
ampsem
ctenit
ctespi
isoobl
athorv
cteara
ampmix
serbru
limaeg
athbri
ctepro
agrsta
dalspp
ctetri
ABBA
ACRU
BEPA
KAAN
PIRU
PIST
POSP
PRSE
TSCA
VAAN
VIAL
A B
-1.0 1.5
-1.0
1.5
asp22
bir22
bir08
inf12
inf20
map25
map26
spr21
spr23
hem12
hem20
blu22blu08
-1.0 1.5
-1.0
1.5
asp22
bir22
bir08
inf12
inf20
map25
map26
spr21
spr23
hem12
hem20
blu22blu08
-1.0 1.5
-1.0
1.5
asp22
bir22
bir08
inf12
inf20
map25
map26
spr21
spr23
hem12
hem20
blu22blu08
-2 3
-23
cteapp
ctehie
cteruf
denden
hemmem
ampnml
ampsem
ctenit
ctespi
isoobl
athorv
cteara
ampmixserbru
limaeg
athbri
ctepro
agrsta
dalspp
ctetri
TABBA
TACRU
TPIRU
TPOSP
TTSCA PIRU
PIST
PRSE
TSCA
VAAN
C D
132
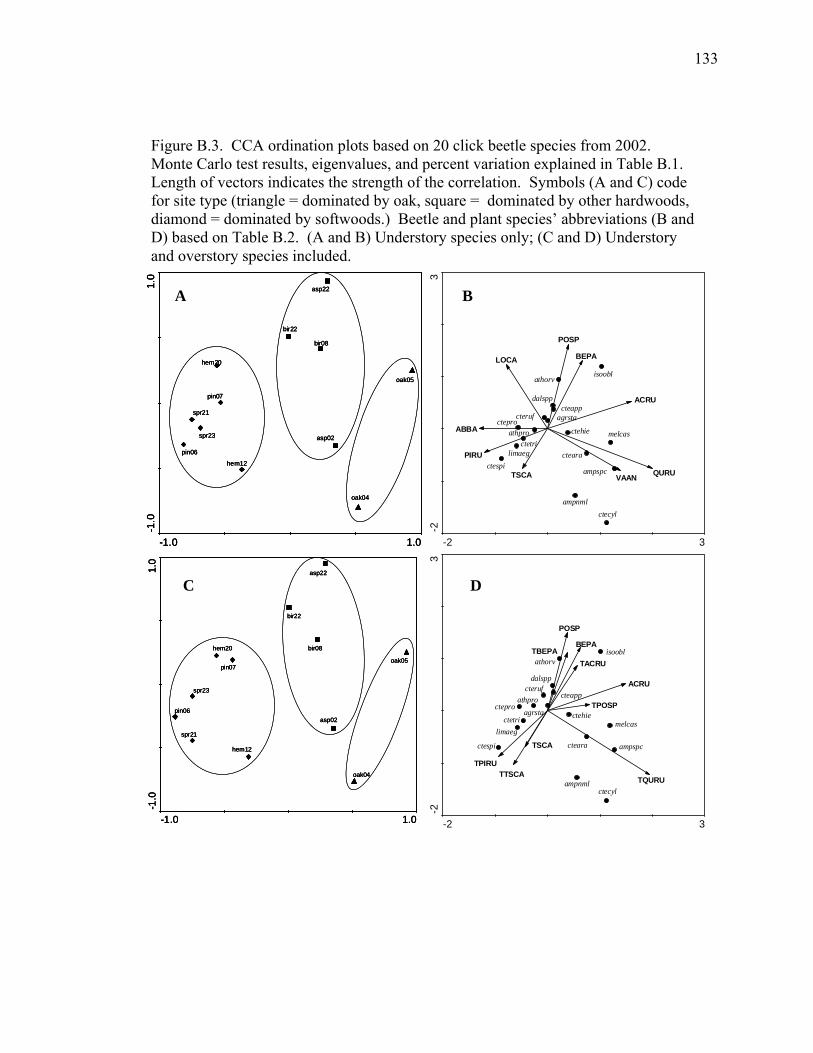
Figure B.3. CCA ordination plots based on 20 click beetle species from 2002. Monte Carlo test results, eigenvalues, and percent variation explained in Table B.1. Length of vectors indicates the strength of the correlation. Symbols (A and C) code for site type (triangle = dominated by oak, square = dominated by other hardwoods, diamond = dominated by softwoods.) Beetle and plant species’ abbreviations (B and D) based on Table B.2. (A and B) Understory species only; (C and D) Understory and overstory species included.
-2 3
-23
athpro
ctecyl
isoobl
ampspcctearactespi
cteapp
ampnml
melcas
athorv
cteruf
ctepro
limaeg
ctehie
dalspp
agrstactetri
TACRUTBEPA
TPIRU
TPOSP
TQURUTTSCA
ACRU
BEPA
POSP
TSCA
-2 3
-23
athpro
ctecyl
isoobl
ampspc
ctearactespi
cteapp
ampnml
melcas
athorv
cterufctepro
limaeg
ctehie
dalspp
agrsta
ctetri
ABBA
ACRU
BEPALOCA
PIRU
POSP
QURUTSCA VAAN
-1.0 1.0
-1.0
1.0
asp02
asp22
bir22
bir08
oak04
oak05
pin06
pin07
spr21
spr23
hem12
hem20
-1.0 1.0
-1.0
1.0
asp02
asp22
bir22
bir08
oak04
oak05
pin06
pin07
spr21
spr23
hem12
hem20
-1.0 1.0
-1.0
1.0
asp02
asp22
bir22
bir08
oak04
oak05
pin06
pin07
spr21
spr23
hem12
hem20
-1.0 1.0
-1.0
1.0
asp02
asp22
bir22
bir08
oak04
oak05
pin06
pin07
spr21
spr23
hem12
hem20
-1.0 1.0
-1.0
1.0
asp02
asp22
bir22
bir08
oak04
oak05
pin06
pin07
spr21
spr23
hem12
hem20
-1.0 1.0
-1.0
1.0
asp02
asp22
bir22
bir08
oak04
oak05
pin06
pin07
spr21
spr23
hem12
hem20
A B
C D
133
Source (Montel Carlo Test Results) Axis 1 Axis 2 Axis 3 Axis 42001 Shrubs (F-ratio: 1.837; P-value 0.046) Eigenvalues (Total: 1.223; Canonical: 1.166) 0.26 0.23 0.18 0.13 Cumulative percentage variance of species data 21.0 40.1 54.6 65.42001 Shrubs & Trees (F-ratio: 1.783; P-value 0.022) Eigenvalues (Total: 1.223; Canonical: 1.1) 0.28 0.23 0.18 0.13 Cumulative percentage variance of species data 22.8 41.4 55.9 66.42002 Shrubs (F-ratio: 2.141; P-value 0.0100) Eigenvalues (Total: 0.902; Canonical: 0.817) 0.22 0.20 0.13 0.09 Cumulative percentage variance of species data 24.3 46.0 60.9 70.52002 Shrubs & Trees (F-ratio: 2.896; P-value 0.004) Eigenvalues (Total: 0.902; Canonical: 0.872) 0.22 0.20 0.13 0.09 Cumulative percentage variance of species data 24.5 46.8 60.8 70.6
Table B.3. Results of Canonical Correspondence Analysis for 2001 and 2002 click beetle abundances with tree and shrub species.
134
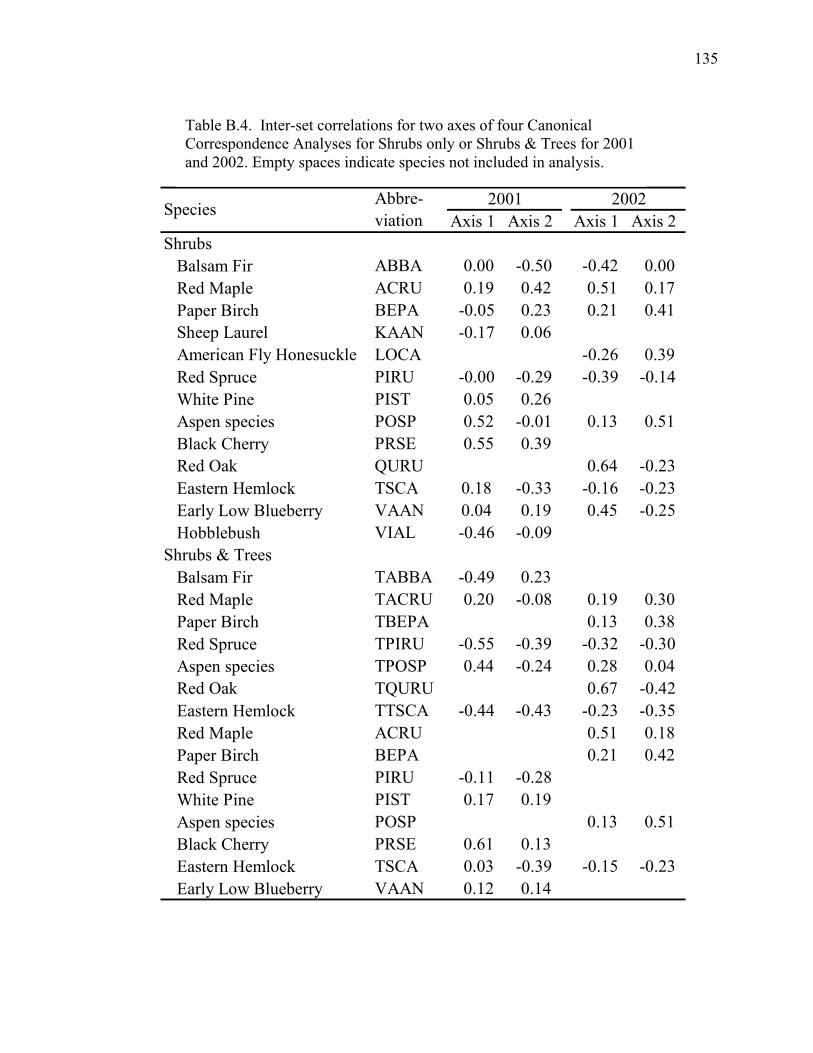
Axis 1 Axis 2 Axis 1 Axis 2Shrubs Balsam Fir ABBA 0.00 -0.50 -0.42 0.00 Red Maple ACRU 0.19 0.42 0.51 0.17 Paper Birch BEPA -0.05 0.23 0.21 0.41 Sheep Laurel KAAN -0.17 0.06 American Fly Honesuckle LOCA -0.26 0.39 Red Spruce PIRU -0.00 -0.29 -0.39 -0.14 White Pine PIST 0.05 0.26 Aspen species POSP 0.52 -0.01 0.13 0.51 Black Cherry PRSE 0.55 0.39 Red Oak QURU 0.64 -0.23 Eastern Hemlock TSCA 0.18 -0.33 -0.16 -0.23 Early Low Blueberry VAAN 0.04 0.19 0.45 -0.25 Hobblebush VIAL -0.46 -0.09Shrubs & Trees Balsam Fir TABBA -0.49 0.23 Red Maple TACRU 0.20 -0.08 0.19 0.30 Paper Birch TBEPA 0.13 0.38 Red Spruce TPIRU -0.55 -0.39 -0.32 -0.30 Aspen species TPOSP 0.44 -0.24 0.28 0.04 Red Oak TQURU 0.67 -0.42 Eastern Hemlock TTSCA -0.44 -0.43 -0.23 -0.35 Red Maple ACRU 0.51 0.18 Paper Birch BEPA 0.21 0.42 Red Spruce PIRU -0.11 -0.28 White Pine PIST 0.17 0.19 Aspen species POSP 0.13 0.51 Black Cherry PRSE 0.61 0.13 Eastern Hemlock TSCA 0.03 -0.39 -0.15 -0.23 Early Low Blueberry VAAN 0.12 0.14
Species Abbre-viation
2001 2002
Table B.4. Inter-set correlations for two axes of four Canonical Correspondence Analyses for Shrubs only or Shrubs & Trees for 2001 and 2002. Empty spaces indicate species not included in analysis.
135
Appendix B.3. Variation in click beetle assemblages
B.3.1. Distant hemlock trees did not influence Maple Cover Type
In 2001, vegetation at the two maple stands near the traps (within 5 m) was
dominated by many smaller-diameter maple trees; however, a few large diameter
hemlock trees at 5 to 12 m from the traps were included by the 10-factor prism and
therefore dominate the overall basal area for these two stands. To determine whether
these distant hemlocks influenced the results, I compared the assemblages in the Maple
cover type to the assemblages in the Hemlock cover type. I contrasted the relative
abundances of the click beetle species in the Maple and Hemlock cover types, using 95%
confidence intervals as described in the methods. The elaterid species associated with
Maple were associated with all the hardwood cover types combined, and the elaterid
species associated with Hemlock were associated with all the softwood cover types
combined. The assemblage similarity for Maple was most similar to other hardwood
cover types compared to the softwood cover types, except for Blueberry (very different
because they had so little overstory) and the 2001 Aspen (different because there was
only one stand). The NMS ordinations also placed the stands in the Maple cover type
closer to the other hardwood stands than to the softwood stands. Therefore, I believe the
distant hemlocks did not have a significant influence on click beetle assemblages in the
Maple cover type.
136
B.3.2. Possible Small-scale Heterogeneity
I sampled sites within cover types that were sometimes near sites within another
cover type. For example, the hemlock sites sampled in 2001 were located near the fern-
hemlock sites. Therefore, I examined the differences between the Hemlock and Fern-
Hemlock cover types. Overall click beetle species richness, species abundance, and
assemblage similarity were similar between these two cover types, although diversity was
higher in the Fern-Hemlock than the Hemlock cover type. Three species (Ctenicera
triundulata, Dalopius spp., and Sericus brunneus) had similar abundances between the
Hemlock and Fern-Hemlock cover types, but Agriotes stabilis, Athous brightwelli, and
Limonius aeger had lower abundances in Fern-Hemlock than Hemlock. These results
indicated that although Hemlock was preferred over other softwood cover types for
several species, the areas dominated by ferns within those stands were likely not as
favorable for three species of click beetles. (In contrast, Hendrix (1980) and Balick et al.
(1978) identified one Elaterid as a fern herbivore and one as a fern associate). This
small-scale heterogeneity suggested that click beetle communities may have responded to
fine scale differences in forest vegetation. As a result, these small-scale responses to
vegetation serve to increase the overall diversity of Elaterid species in the region.
Other studies have found small-scale heterogeneity within forest stands. Apigian
et al (2006) studied litter-inhabiting beetles, including 22 species of Elateridae, in a
Sierran mixed-conifer forest and determined that the beetle assemblages were
heterogeneous across smaller (~60 m) and larger (100’s of meters) spatial scales.
Niemelä et al. (1996) found that in the boreal forest, assemblages of beetles in the family
Carabidae can be heterogeneous even at scales as narrow as 10-15 m; this may be due to
137
micro-habitat preferences for specific types of ground cover. However, I detected only
minor differences between Hemlock and Fern-Hemlock cover types.
B.3.3. Vegetation species explain majority of variation in click beetle
assemblages
Results from the CCA suggest that the understory layer is a better predictor of the
click beetle assemblages than the overstory layer. However, this is obfuscated by the
influence of the overstory on the understory species. Why are the click beetle
assemblages seemingly responding to the vegetation species? Although relatively little is
known about these click beetle species, there are several possibilities. First, a direct
relationship may exist where the click beetle larvae may feed on the roots of specific
plant species. Click beetle larvae are well known as pests in agricultural systems, and
species found in forests can survive on vegetative matter (Fox 1961). However, this is
not a strong possibility. Most soil-dwelling species are predaceous or omnivorous
(Johnson 2002), and those that are primarily herbivorous feed on a wide array of plant
species (C. Pilcher, P. Johnson, pers. communication). Second, an indirect relationship
may exist with click beetles responding to prey types that are specific to vegetation
species. Some click beetle species are known to be effective predators of wood borers
(Craighead 1950 and Woodruff 2004), and many species in our study are known to feed
on pests of forest trees (Tostowaryk 1972 and Morris 1951). However, these species
were not specific to their prey items (sometimes feeding on vegetable matter), and even
species responding to specialized chemical cues from their preferred prey also feed on
other species (Svensson et al. 2004).
138
Third, an indirect relationship may exist with click beetles responding to the soil
conditions (e.g. soil type, nutrients, temperature, and moisture) influenced by or
correlated with the vegetation community. To a certain extent the mineral soil layer
influences the plant communities (Jenny 1980). Click beetle assemblages are known to
change across certain mineral soil types, despite similarities in soil moisture and
dominant vegetation (Penev 1992). However, our vegetation treatments were not
correlated with the soil mineral types. The leaf litter can influence the click beetle
assemblages; several species are considered to be saprophagous on dead leaves
(Zacharuk 1963, Wolters 1989, and David et al. 1993), and even carnivorous larvae will
shift to become detritivorous or saprophagous in the absence of prey (Balduf 1935).
Because of this, Saetre et al. (1999) and Scheu et al. (2003) interpreted the changes in
click beetle assemblages across different forest stands as responses to nutrient input from
leaf fall. Additionally, Ponge et al. (1997) and David et al. (1993) found that Elaterid
larvae abundance increased with the shift from dystrophic mull to dysmoder, with a
corresponding increase in acidity and decrease in iron, calcium, magnesium. Trees and
shrubs also influence the temperature and moisture of the soil (Phillips and Shure 1990
and Kapos 1989), both of which greatly impact the presence and movement of click
beetles (Lees 1943a&b, Zacharuk 1962, and LaFrance 1968). This is a complex
relationship; soil conditions affect the plant communities, plant communities affect the
soil conditions, both soil conditions and plant communities seem to affect click beetle
assemblages, and click beetles influence the nutrients available to plants (Wolters 1989).
We believe that the interaction between the vegetation and soil conditions is most likely
139

driving the results of our study (see Figure B.4 and Table B.5 for mineral soil information
on our sites).
140
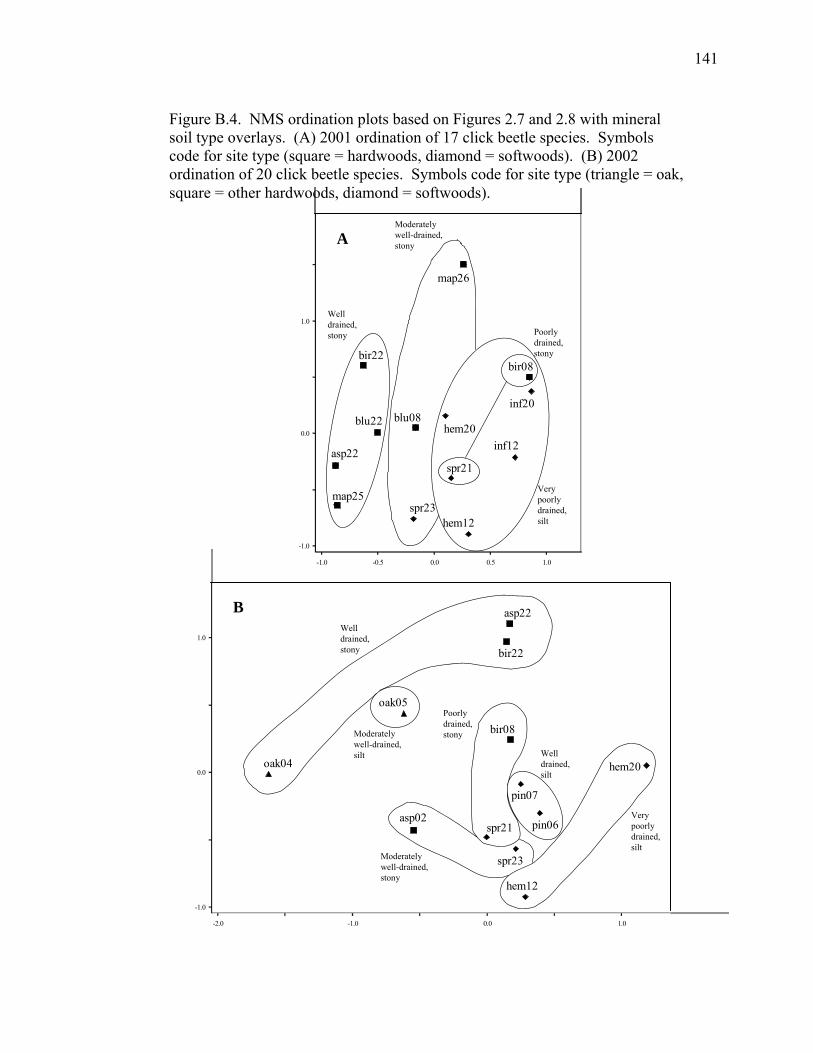
Figure B.4. NMS ordination plots based on Figures 2.7 and 2.8 with mineral soil type overlays. (A) 2001 ordination of 17 click beetle species. Symbols code for site type (square = hardwoods, diamond = softwoods). (B) 2002 ordination of 20 click beetle species. Symbols code for site type (triangle = oak, square = other hardwoods, diamond = softwoods).
asp02
asp22
bir22
bir08
oak04
oak05
pin06
pin07
spr21
spr23
hem12
hem20
-2.0
-1.0
-1.0 0.0 1.0
0.0
1.0Well drained, stony
Well drained, silt
Very poorly drained, silt
Poorlydrained, stony
Moderately well-drained,stony
Moderately well-drained,silt
asp02
asp22
bir22
bir08
oak04
oak05
pin06
pin07
spr21
spr23
hem12
hem20
-2.0
-1.0
-1.0 0.0 1.0
0.0
1.0Well drained, stony
Well drained, silt
Very poorly drained, silt
Poorlydrained, stony
Moderately well-drained,stony
Moderately well-drained,silt
asp02
asp22
bir22
bir08
oak04
oak05
pin06
pin07
spr21
spr23
hem12
hem20
-2.0
-1.0
-1.0 0.0 1.0
0.0
1.0Well drained, stony
Well drained, silt
Very poorly drained, silt
Poorlydrained, stony
Moderately well-drained,stony
Moderately well-drained,silt
asp02
asp22
bir22
bir08
oak04
oak05
pin06
pin07
spr21
spr23
hem12
hem20
-2.0
-1.0
-1.0 0.0 1.0
0.0
1.0Well drained, stony
Well drained, silt
Very poorly drained, silt
Poorlydrained, stony
Moderately well-drained,stony
Moderately well-drained,silt
asp22
bir22bir08
inf12
inf20
map25
map26
spr21
spr23hem12
hem20blu22 blu08
-1.0
-1.0
-0.5 0.0 0.5 1.0
0.0
1.0
Very poorly drained, silt
Poorlydrained, stony
Moderately well-drained,stony
Well drained, stony
asp22
bir22bir08
inf12
inf20
map25
map26
spr21
spr23hem12
hem20blu22 blu08
-1.0
-1.0
-0.5 0.0 0.5 1.0
0.0
1.0
asp22
bir22bir08
inf12
inf20
map25
map26
spr21
spr23hem12
hem20blu22 blu08
-1.0
-1.0
-0.5 0.0 0.5 1.0
0.0
1.0
Very poorly drained, silt
Poorlydrained, stony
Moderately well-drained,stony
Well drained, stony
asp22
bir22bir08
inf12
inf20
map25
map26
spr21
spr23hem12
hem20blu22 blu08
-1.0
-1.0
-0.5 0.0 0.5 1.0
0.0
1.0
Very poorly drained, silt
Poorlydrained, stony
Moderately well-drained,stony
Well drained, stony
asp22
bir22bir08
inf12
inf20
map25
map26
spr21
spr23hem12
hem20blu22 blu08
-1.0
-1.0
-0.5 0.0 0.5 1.0
0.0
1.0
asp22
bir22bir08
inf12
inf20
map25
map26
spr21
spr23hem12
hem20blu22 blu08
-1.0
-1.0
-0.5 0.0 0.5 1.0
0.0
1.0
Very poorly drained, silt
Poorlydrained, stony
Moderately well-drained,stony
Well drained, stony
A
B
141
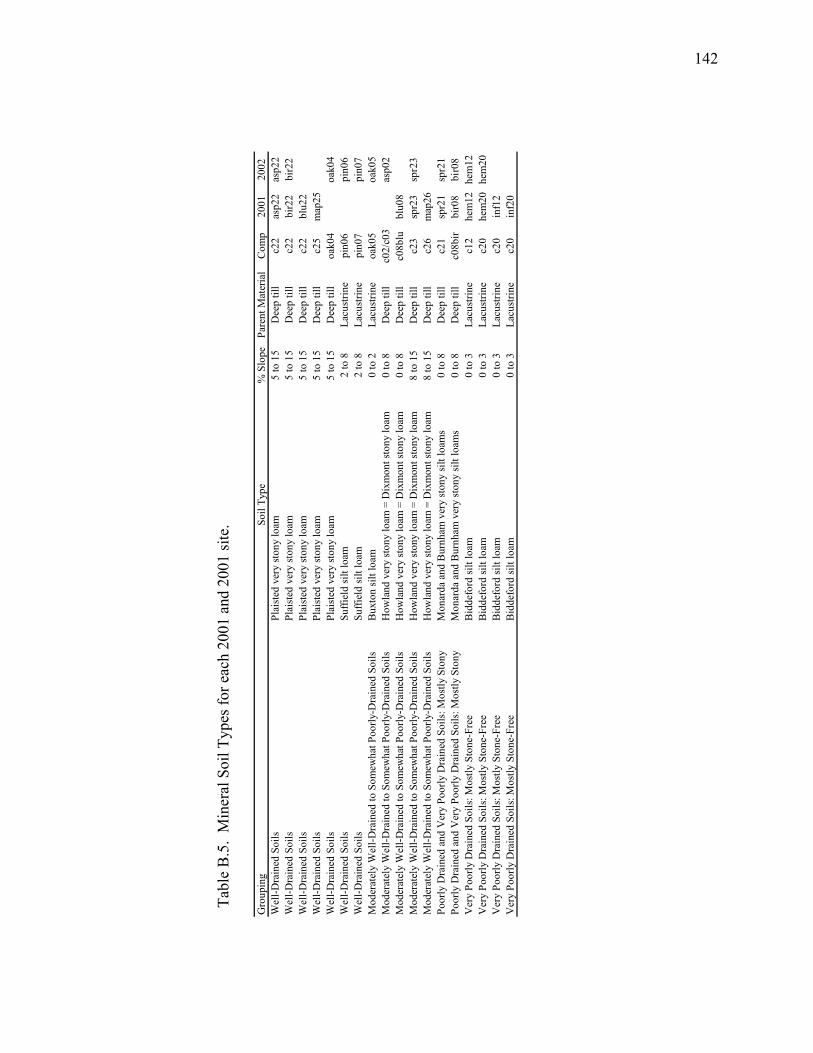
Gro
upin
gSo
il Ty
pe%
Slo
pePa
rent
Mat
eria
lC
omp
2001
2002
Wel
l-Dra
ined
Soi
lsPl
aist
ed v
ery
ston
y lo
am5
to 1
5D
eep
till
c22
asp2
2as
p22
Wel
l-Dra
ined
Soi
lsPl
aist
ed v
ery
ston
y lo
am5
to 1
5D
eep
till
c22
bir2
2bi
r22
Wel
l-Dra
ined
Soi
lsPl
aist
ed v
ery
ston
y lo
am5
to 1
5D
eep
till
c22
blu2
2W
ell-D
rain
ed S
oils
Plai
sted
ver
y st
ony
loam
5 to
15
Dee
p til
lc2
5m
ap25
Wel
l-Dra
ined
Soi
lsPl
aist
ed v
ery
ston
y lo
am5
to 1
5D
eep
till
oak0
4oa
k04
Wel
l-Dra
ined
Soi
lsSu
ffiel
d si
lt lo
am2
to 8
Lacu
strin
epi
n06
pin0
6W
ell-D
rain
ed S
oils
Suffi
eld
silt
loam
2 to
8La
cust
rine
pin0
7pi
n07
Mod
erat
ely
Wel
l-Dra
ined
to S
omew
hat P
oorly
-Dra
ined
Soi
lsB
uxto
n si
lt lo
am0
to 2
Lacu
strin
eoa
k05
oak0
5M
oder
atel
y W
ell-D
rain
ed to
Som
ewha
t Poo
rly-D
rain
ed S
oils
How
land
ver
y st
ony
loam
= D
ixm
ont s
tony
loam
0 to
8D
eep
till
c02/
c03
asp0
2M
oder
atel
y W
ell-D
rain
ed to
Som
ewha
t Poo
rly-D
rain
ed S
oils
How
land
ver
y st
ony
loam
= D
ixm
ont s
tony
loam
0 to
8D
eep
till
c08b
lubl
u08
Mod
erat
ely
Wel
l-Dra
ined
to S
omew
hat P
oorly
-Dra
ined
Soi
lsH
owla
nd v
ery
ston
y lo
am =
Dix
mon
t sto
ny lo
am8
to 1
5D
eep
till
c23
spr2
3sp
r23
Mod
erat
ely
Wel
l-Dra
ined
to S
omew
hat P
oorly
-Dra
ined
Soi
lsH
owla
nd v
ery
ston
y lo
am =
Dix
mon
t sto
ny lo
am8
to 1
5D
eep
till
c26
map
26Po
orly
Dra
ined
and
Ver
y Po
orly
Dra
ined
Soi
ls: M
ostly
Sto
nyM
onar
da a
nd B
urnh
am v
ery
ston
y si
lt lo
ams
0 to
8D
eep
till
c21
spr2
1sp
r21
Poor
ly D
rain
ed a
nd V
ery
Poor
ly D
rain
ed S
oils
: Mos
tly S
tony
Mon
arda
and
Bur
nham
ver
y st
ony
silt
loam
s0
to 8
Dee
p til
lc0
8bir
bir0
8bi
r08
Ver
y Po
orly
Dra
ined
Soi
ls: M
ostly
Sto
ne-F
ree
Bid
defo
rd si
lt lo
am0
to 3
Lacu
strin
ec1
2he
m12
hem
12V
ery
Poor
ly D
rain
ed S
oils
: Mos
tly S
tone
-Fre
eB
idde
ford
silt
loam
0 to
3La
cust
rine
c20
hem
20he
m20
Ver
y Po
orly
Dra
ined
Soi
ls: M
ostly
Sto
ne-F
ree
Bid
defo
rd si
lt lo
am0
to 3
Lacu
strin
ec2
0in
f12
Ver
y Po
orly
Dra
ined
Soi
ls: M
ostly
Sto
ne-F
ree
Bid
defo
rd si
lt lo
am0
to 3
Lacu
strin
ec2
0in
f20
Tabl
e B
.5.
Min
eral
Soi
l Typ
es fo
r eac
h 20
01 a
nd 2
001
site
.
142
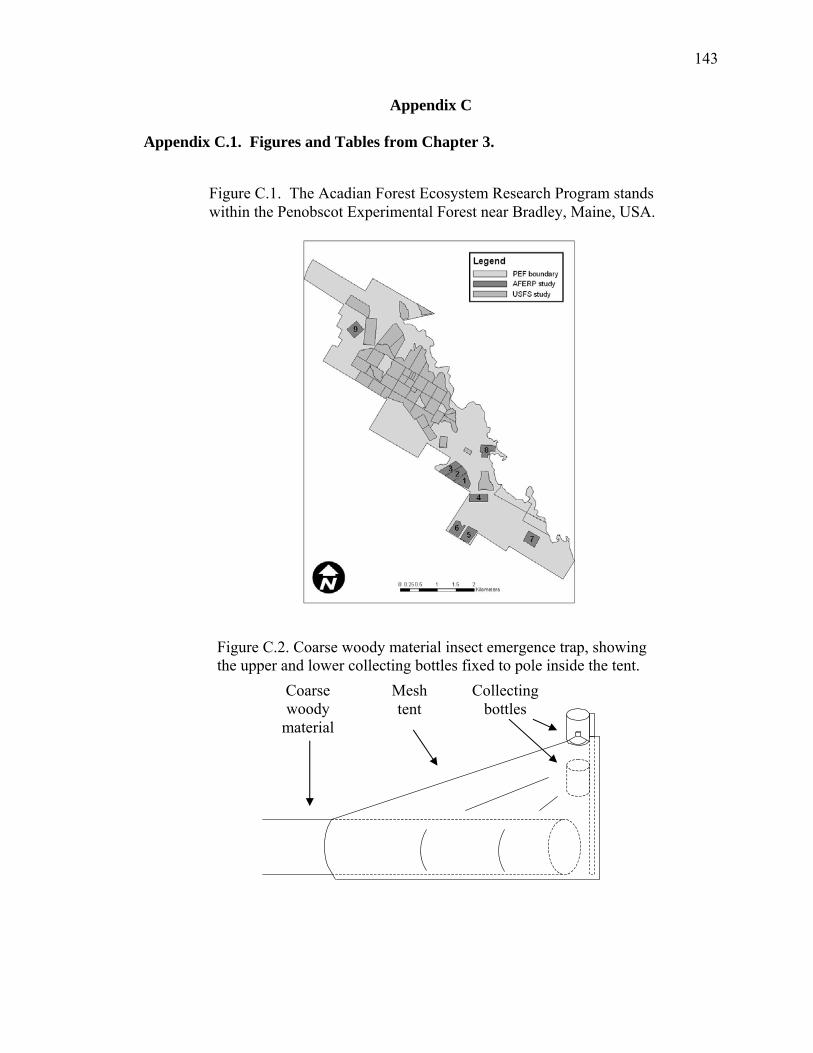
Appendix C Appendix C.1. Figures and Tables from Chapter 3.
Figure C.2. Coarse woody material insect emergence trap, showing the upper and lower collecting bottles fixed to pole inside the tent.
Collecting bottles
Mesh tent
Coarse woody
material
Figure C.1. The Acadian Forest Ecosystem Research Program stands within the Penobscot Experimental Forest near Bradley, Maine, USA.
143
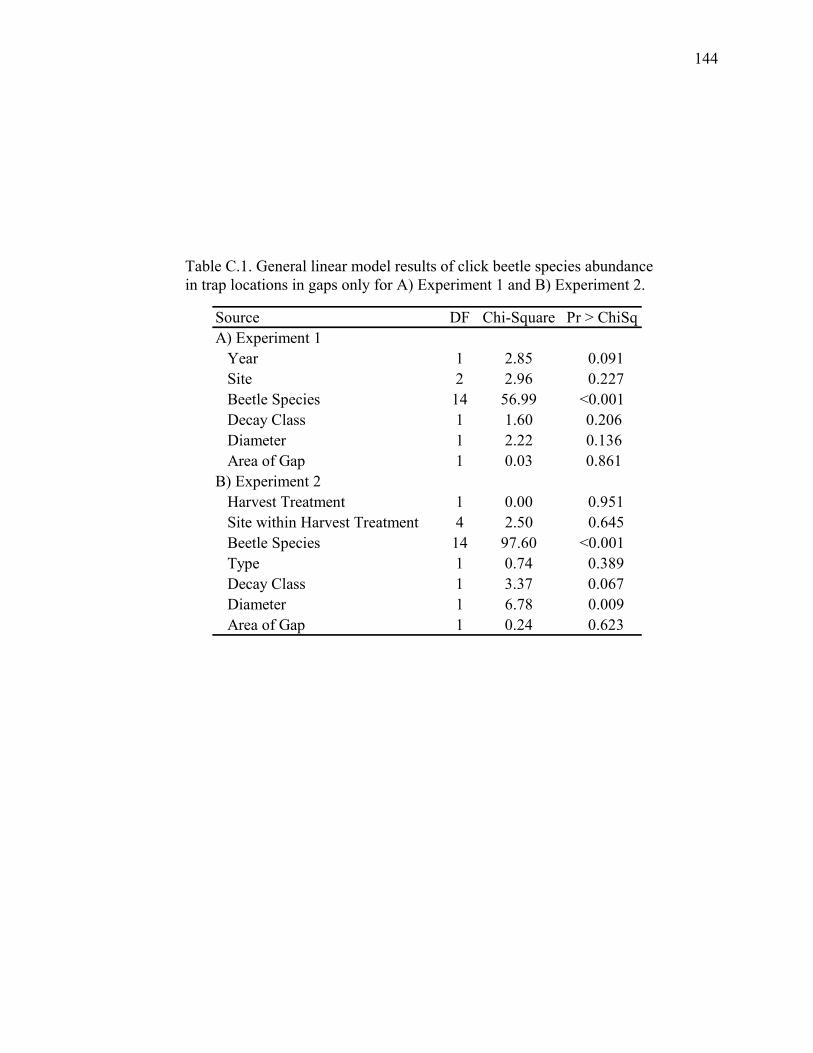
Source DF Chi-Square Pr > ChiSqA) Experiment 1 Year 1 2.85 0.091 Site 2 2.96 0.227 Beetle Species 14 56.99 <0.001 Decay Class 1 1.60 0.206 Diameter 1 2.22 0.136 Area of Gap 1 0.03 0.861B) Experiment 2 Harvest Treatment 1 0.00 0.951 Site within Harvest Treatment 4 2.50 0.645 Beetle Species 14 97.60 <0.001 Type 1 0.74 0.389 Decay Class 1 3.37 0.067 Diameter 1 6.78 0.009 Area of Gap 1 0.24 0.623
Table C.1. General linear model results of click beetle species abundance in trap locations in gaps only for A) Experiment 1 and B) Experiment 2.
144
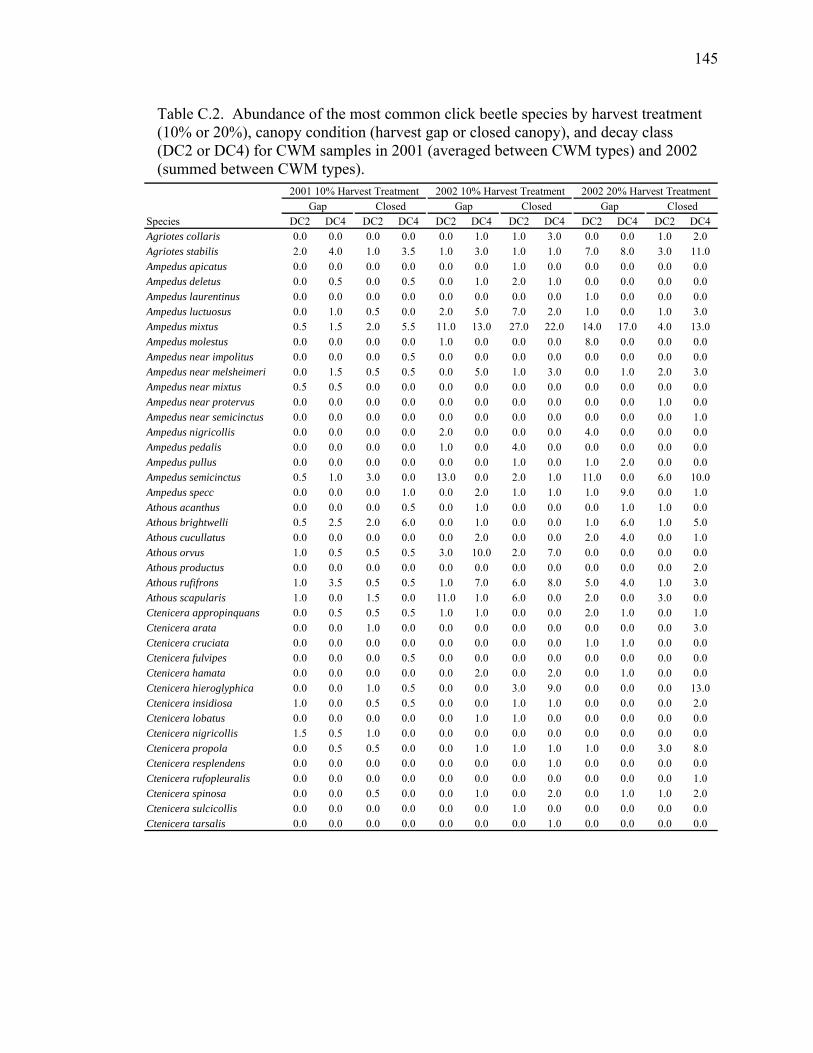
Table C.2. Abundance of the most common click beetle species by harvest treatment (10% or 20%), canopy condition (harvest gap or closed canopy), and decay class (DC2 or DC4) for CWM samples in 2001 (averaged between CWM types) and 2002 (summed between CWM types).
Species DC2 DC4 DC2 DC4 DC2 DC4 DC2 DC4 DC2 DC4 DC2 DC4Agriotes collaris 0.0 0.0 0.0 0.0 0.0 1.0 1.0 3.0 0.0 0.0 1.0 2.0Agriotes stabilis 2.0 4.0 1.0 3.5 1.0 3.0 1.0 1.0 7.0 8.0 3.0 11.0Ampedus apicatus 0.0 0.0 0.0 0.0 0.0 0.0 1.0 0.0 0.0 0.0 0.0 0.0Ampedus deletus 0.0 0.5 0.0 0.5 0.0 1.0 2.0 1.0 0.0 0.0 0.0 0.0Ampedus laurentinus 0.0 0.0 0.0 0.0 0.0 0.0 0.0 0.0 1.0 0.0 0.0 0.0Ampedus luctuosus 0.0 1.0 0.5 0.0 2.0 5.0 7.0 2.0 1.0 0.0 1.0 3.0Ampedus mixtus 0.5 1.5 2.0 5.5 11.0 13.0 27.0 22.0 14.0 17.0 4.0 13.0Ampedus molestus 0.0 0.0 0.0 0.0 1.0 0.0 0.0 0.0 8.0 0.0 0.0 0.0Ampedus near impolitus 0.0 0.0 0.0 0.5 0.0 0.0 0.0 0.0 0.0 0.0 0.0 0.0Ampedus near melsheimeri 0.0 1.5 0.5 0.5 0.0 5.0 1.0 3.0 0.0 1.0 2.0 3.0Ampedus near mixtus 0.5 0.5 0.0 0.0 0.0 0.0 0.0 0.0 0.0 0.0 0.0 0.0Ampedus near protervus 0.0 0.0 0.0 0.0 0.0 0.0 0.0 0.0 0.0 0.0 1.0 0.0Ampedus near semicinctus 0.0 0.0 0.0 0.0 0.0 0.0 0.0 0.0 0.0 0.0 0.0 1.0Ampedus nigricollis 0.0 0.0 0.0 0.0 2.0 0.0 0.0 0.0 4.0 0.0 0.0 0.0Ampedus pedalis 0.0 0.0 0.0 0.0 1.0 0.0 4.0 0.0 0.0 0.0 0.0 0.0Ampedus pullus 0.0 0.0 0.0 0.0 0.0 0.0 1.0 0.0 1.0 2.0 0.0 0.0Ampedus semicinctus 0.5 1.0 3.0 0.0 13.0 0.0 2.0 1.0 11.0 0.0 6.0 10.0Ampedus specc 0.0 0.0 0.0 1.0 0.0 2.0 1.0 1.0 1.0 9.0 0.0 1.0Athous acanthus 0.0 0.0 0.0 0.5 0.0 1.0 0.0 0.0 0.0 1.0 1.0 0.0Athous brightwelli 0.5 2.5 2.0 6.0 0.0 1.0 0.0 0.0 1.0 6.0 1.0 5.0Athous cucullatus 0.0 0.0 0.0 0.0 0.0 2.0 0.0 0.0 2.0 4.0 0.0 1.0Athous orvus 1.0 0.5 0.5 0.5 3.0 10.0 2.0 7.0 0.0 0.0 0.0 0.0Athous productus 0.0 0.0 0.0 0.0 0.0 0.0 0.0 0.0 0.0 0.0 0.0 2.0Athous rufifrons 1.0 3.5 0.5 0.5 1.0 7.0 6.0 8.0 5.0 4.0 1.0 3.0Athous scapularis 1.0 0.0 1.5 0.0 11.0 1.0 6.0 0.0 2.0 0.0 3.0 0.0Ctenicera appropinquans 0.0 0.5 0.5 0.5 1.0 1.0 0.0 0.0 2.0 1.0 0.0 1.0Ctenicera arata 0.0 0.0 1.0 0.0 0.0 0.0 0.0 0.0 0.0 0.0 0.0 3.0Ctenicera cruciata 0.0 0.0 0.0 0.0 0.0 0.0 0.0 0.0 1.0 1.0 0.0 0.0Ctenicera fulvipes 0.0 0.0 0.0 0.5 0.0 0.0 0.0 0.0 0.0 0.0 0.0 0.0Ctenicera hamata 0.0 0.0 0.0 0.0 0.0 2.0 0.0 2.0 0.0 1.0 0.0 0.0Ctenicera hieroglyphica 0.0 0.0 1.0 0.5 0.0 0.0 3.0 9.0 0.0 0.0 0.0 13.0Ctenicera insidiosa 1.0 0.0 0.5 0.5 0.0 0.0 1.0 1.0 0.0 0.0 0.0 2.0Ctenicera lobatus 0.0 0.0 0.0 0.0 0.0 1.0 1.0 0.0 0.0 0.0 0.0 0.0Ctenicera nigricollis 1.5 0.5 1.0 0.0 0.0 0.0 0.0 0.0 0.0 0.0 0.0 0.0Ctenicera propola 0.0 0.5 0.5 0.0 0.0 1.0 1.0 1.0 1.0 0.0 3.0 8.0Ctenicera resplendens 0.0 0.0 0.0 0.0 0.0 0.0 0.0 1.0 0.0 0.0 0.0 0.0Ctenicera rufopleuralis 0.0 0.0 0.0 0.0 0.0 0.0 0.0 0.0 0.0 0.0 0.0 1.0Ctenicera spinosa 0.0 0.0 0.5 0.0 0.0 1.0 0.0 2.0 0.0 1.0 1.0 2.0Ctenicera sulcicollis 0.0 0.0 0.0 0.0 0.0 0.0 1.0 0.0 0.0 0.0 0.0 0.0Ctenicera tarsalis 0.0 0.0 0.0 0.0 0.0 0.0 0.0 1.0 0.0 0.0 0.0 0.0
2001 10% Harvest Treatment 2002 10% Harvest Treatment 2002 20% Harvest TreatmentGap Closed Gap Closed Gap Closed
145
Species DC2 DC4 DC2 DC4 DC2 DC4 DC2 DC4 DC2 DC4 DC2 DC4Ctenicera triundulata 5.0 10.5 9.5 6.0 7.0 36.0 11.0 28.0 8.0 20.0 6.0 35.0Dalopius species 1.0 4.5 1.5 2.0 1.0 8.0 3.0 7.0 1.0 1.0 0.0 12.0Denticollis denticornis 0.5 1.0 0.0 1.5 0.0 0.0 4.0 0.0 1.0 2.0 1.0 0.0Drasterius debilis 0.0 0.0 0.0 0.0 0.0 0.0 2.0 0.0 1.0 0.0 0.0 0.0Fornax canadensis 0.0 0.0 0.0 0.0 7.0 0.0 0.0 0.0 4.0 0.0 0.0 0.0Hemicrepidius memnonius 0.0 0.5 0.0 0.5 0.0 1.0 1.0 0.0 1.0 2.0 0.0 0.0Hypolithus striatulus 0.0 0.0 0.0 0.0 0.0 0.0 0.0 0.0 0.0 0.0 1.0 0.0Isoriphis obliqua 8.0 0.5 1.0 1.0 3.0 0.0 1.0 1.0 2.0 0.0 3.0 1.0Lacon aurorata 0.0 0.5 0.5 0.0 0.0 1.0 2.0 0.0 2.0 0.0 0.0 0.0Lacon brevicornis 0.0 0.0 0.0 0.0 0.0 0.0 0.0 0.0 7.0 0.0 0.0 0.0Lacon obtecta 0.0 0.0 0.0 0.0 0.0 0.0 0.0 0.0 1.0 0.0 0.0 0.0Limonius aeger 2.5 0.5 1.0 1.0 0.0 2.0 4.0 8.0 0.0 1.0 4.0 5.0Limonius confusus 0.0 2.0 0.0 1.5 1.0 10.0 0.0 9.0 2.0 2.0 1.0 11.0Limonius stigma 0.0 0.0 0.5 0.0 0.0 0.0 0.0 0.0 0.0 0.0 0.0 0.0Megapenthes species A 0.0 0.0 0.0 0.0 0.0 0.0 1.0 0.0 0.0 0.0 0.0 0.0Megapenthes stigmosus 0.0 0.0 0.0 0.0 0.0 0.0 0.0 1.0 0.0 0.0 0.0 0.0Melanotus castanipes 2.5 0.0 1.0 0.5 5.0 1.0 4.0 2.0 5.0 1.0 2.0 1.0Oxygonus montanus 0.0 0.0 0.0 0.0 0.0 0.0 1.0 0.0 0.0 0.0 0.0 0.0Sericus brunneus 0.0 0.5 0.0 0.0 0.0 1.0 0.0 0.0 0.0 0.0 0.0 0.0Sericus viridanus 0.0 0.0 0.0 0.5 0.0 5.0 0.0 3.0 0.0 0.0 0.0 1.0
2001 10% Harvest Treatment 2002 10% Harvest Treatment 2002 20% Harvest TreatmentGap Closed Gap Closed Gap Closed
Table C.2. Continued.
146
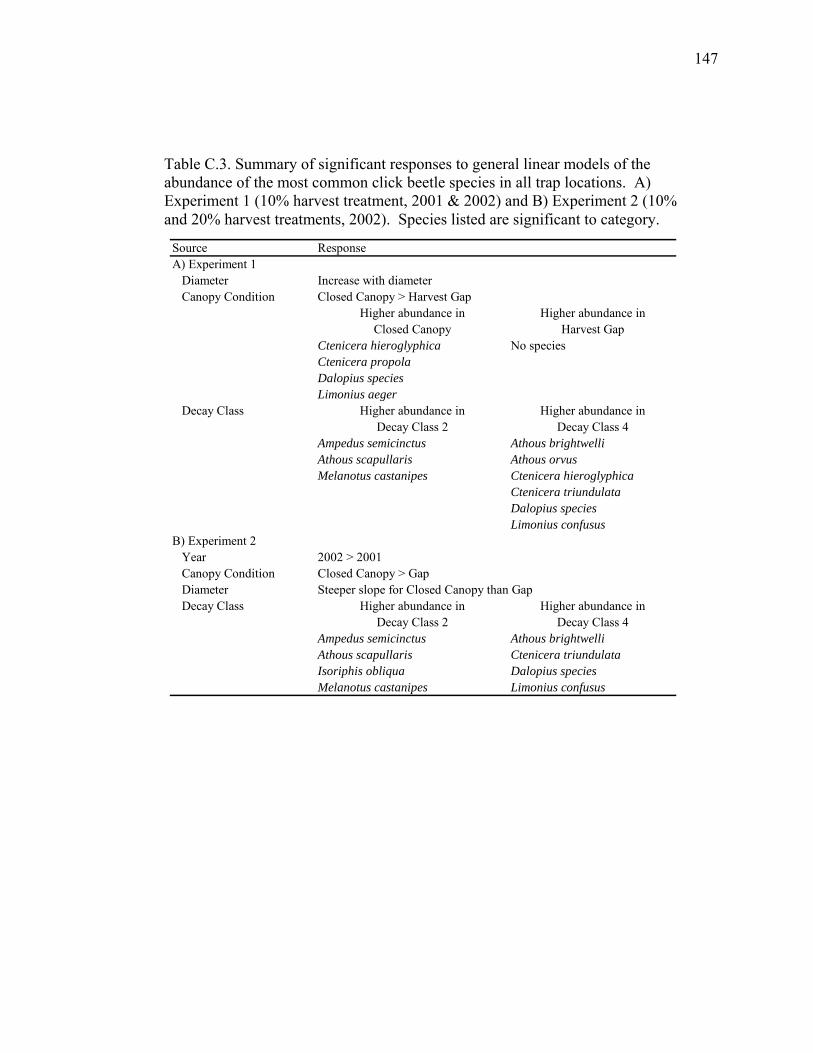
Table C.3. Summary of significant responses to general linear models of the abundance of the most common click beetle species in all trap locations. A) Experiment 1 (10% harvest treatment, 2001 & 2002) and B) Experiment 2 (10% and 20% harvest treatments, 2002). Species listed are significant to category.
Source ResponseA) Experiment 1 Diameter Increase with diameter Canopy Condition Closed Canopy > Harvest Gap
Higher abundance in Higher abundance inClosed Canopy Harvest Gap
Ctenicera hieroglyphica No speciesCtenicera propolaDalopius speciesLimonius aeger
Decay Class Higher abundance in Higher abundance inDecay Class 2 Decay Class 4
Ampedus semicinctus Athous brightwelliAthous scapullaris Athous orvusMelanotus castanipes Ctenicera hieroglyphica
Ctenicera triundulataDalopius speciesLimonius confusus
B) Experiment 2 Year 2002 > 2001 Canopy Condition Closed Canopy > Gap Diameter Steeper slope for Closed Canopy than Gap Decay Class Higher abundance in Higher abundance in
Decay Class 2 Decay Class 4Ampedus semicinctus Athous brightwelliAthous scapullaris Ctenicera triundulataIsoriphis obliqua Dalopius speciesMelanotus castanipes Limonius confusus
147
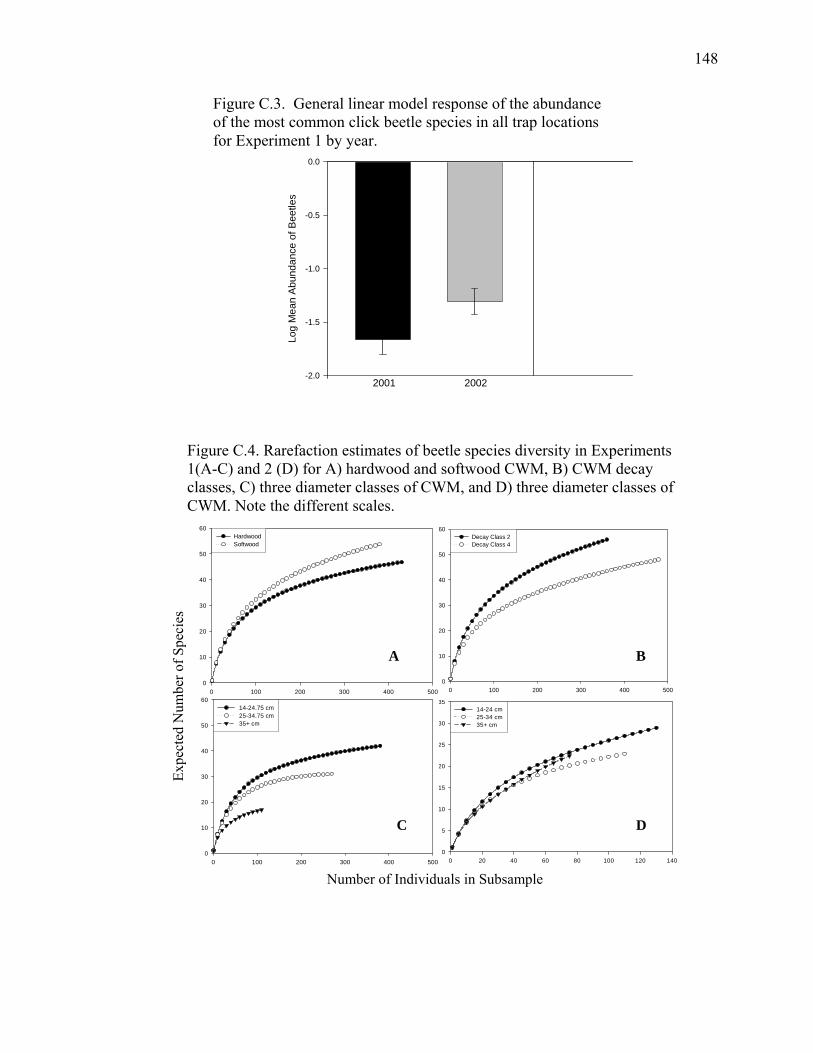
Figure C.4. Rarefaction estimates of beetle species diversity in Experiments 1(A-C) and 2 (D) for A) hardwood and softwood CWM, B) CWM decay classes, C) three diameter classes of CWM, and D) three diameter classes of CWM. Note the different scales.
0 20 40 60 80 100 120 1400
5
10
15
20
25
30
3514-24 cm25-34 cm35+ cm
0 100 200 300 400 5000
10
20
30
40
50
60Decay Class 2 Decay Class 4
0 100 200 300 400 5000
10
20
30
40
50
60HardwoodSoftwood
Expe
cted
Num
ber o
f Spe
cies
0 100 200 300 400 5000
10
20
30
40
50
6014-24.75 cm25-34.75 cm35+ cm
Number of Individuals in Subsample
A B
C D
Figure C.3. General linear model response of the abundance of the most common click beetle species in all trap locations for Experiment 1 by year.
Log
Mea
n A
bund
ance
of B
eetle
s
-2.0
-1.5
-1.0
-0.5
0.0
2001 2002
148
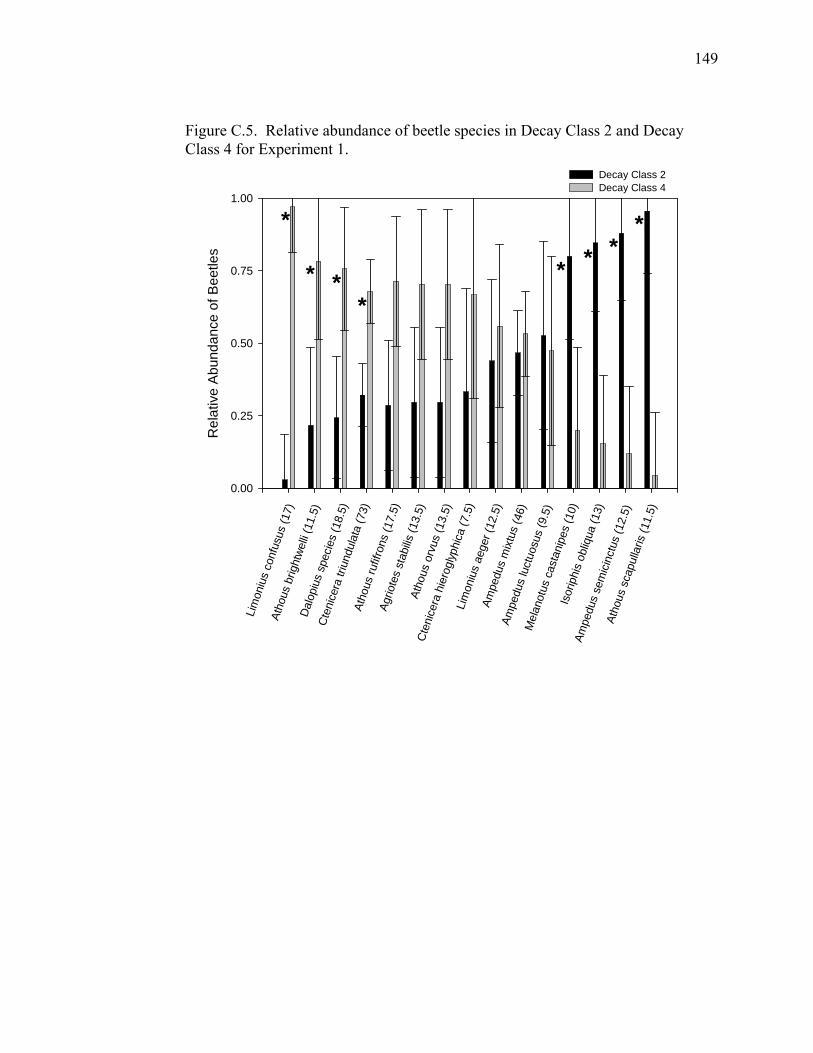
Figure C.5. Relative abundance of beetle species in Decay Class 2 and Decay Class 4 for Experiment 1.
Lim
oniu
s co
nfus
us (1
7)
Cte
nice
ra h
iero
glyp
hica
(7.5
)Am
pedu
s m
ixtu
s (4
6)M
elan
otus
cas
tani
pes
(10)
Atho
us o
rvus
(13.
5)
Atho
us ru
fifro
ns (1
7.5)
Rel
ativ
e A
bund
ance
of B
eetle
s
0.00
0.25
0.50
0.75
1.00
Decay Class 2 Decay Class 4
Lim
oniu
s ae
ger (
12.5
)
Isor
iphi
s ob
liqua
(13)
Dal
opiu
s sp
ecie
s (1
8.5)
Ampe
dus
luct
uosu
s (9
.5)
Cte
nice
ra tr
iund
ulat
a (7
3)Ag
riote
s st
abilis
(13.
5)
Ampe
dus
sem
icin
ctus
(12.
5)
Atho
us b
right
welli
(11.
5)
Atho
us s
capu
llaris
(11.
5)
*
* **
* **
*
149
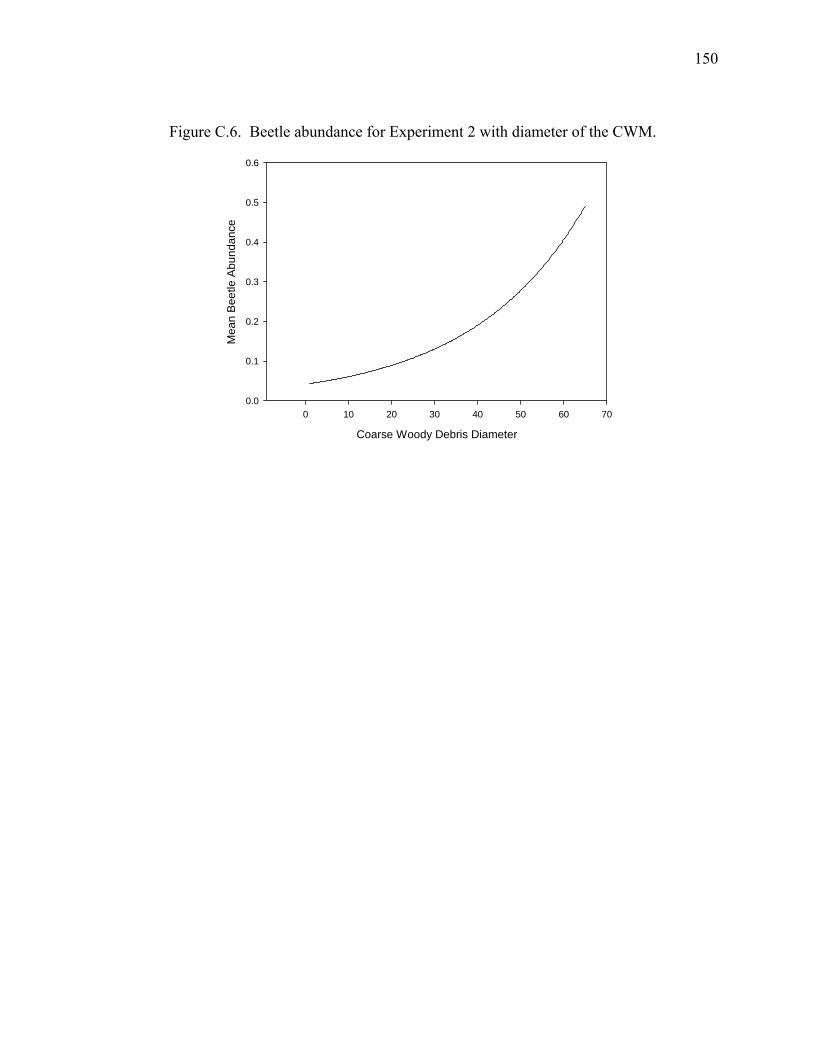
Figure C.6. Beetle abundance for Experiment 2 with diameter of the CWM.
Coarse Woody Debris Diameter
0 10 20 30 40 50 60 70
Mea
n B
eetle
Abu
ndan
ce
0.0
0.1
0.2
0.3
0.4
0.5
0.6
150
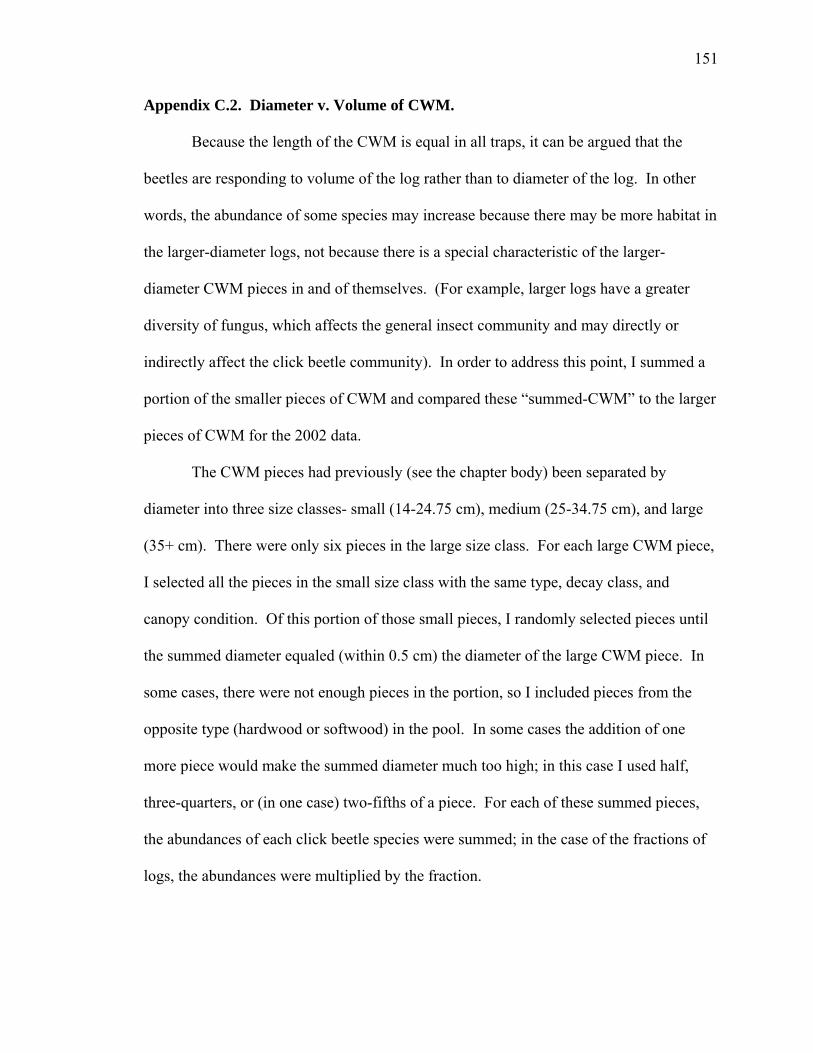
Appendix C.2. Diameter v. Volume of CWM.
Because the length of the CWM is equal in all traps, it can be argued that the
beetles are responding to volume of the log rather than to diameter of the log. In other
words, the abundance of some species may increase because there may be more habitat in
the larger-diameter logs, not because there is a special characteristic of the larger-
diameter CWM pieces in and of themselves. (For example, larger logs have a greater
diversity of fungus, which affects the general insect community and may directly or
indirectly affect the click beetle community). In order to address this point, I summed a
portion of the smaller pieces of CWM and compared these “summed-CWM” to the larger
pieces of CWM for the 2002 data.
The CWM pieces had previously (see the chapter body) been separated by
diameter into three size classes- small (14-24.75 cm), medium (25-34.75 cm), and large
(35+ cm). There were only six pieces in the large size class. For each large CWM piece,
I selected all the pieces in the small size class with the same type, decay class, and
canopy condition. Of this portion of those small pieces, I randomly selected pieces until
the summed diameter equaled (within 0.5 cm) the diameter of the large CWM piece. In
some cases, there were not enough pieces in the portion, so I included pieces from the
opposite type (hardwood or softwood) in the pool. In some cases the addition of one
more piece would make the summed diameter much too high; in this case I used half,
three-quarters, or (in one case) two-fifths of a piece. For each of these summed pieces,
the abundances of each click beetle species were summed; in the case of the fractions of
logs, the abundances were multiplied by the fraction.
151
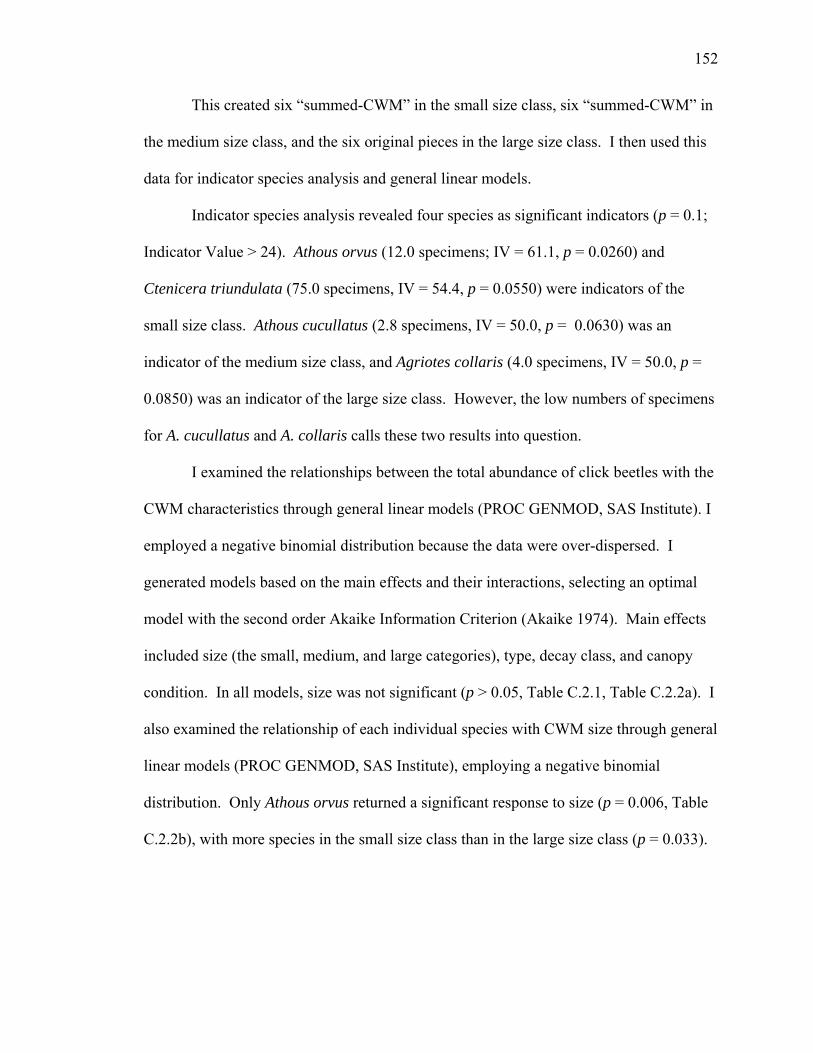
This created six “summed-CWM” in the small size class, six “summed-CWM” in
the medium size class, and the six original pieces in the large size class. I then used this
data for indicator species analysis and general linear models.
Indicator species analysis revealed four species as significant indicators (p = 0.1;
Indicator Value > 24). Athous orvus (12.0 specimens; IV = 61.1, p = 0.0260) and
Ctenicera triundulata (75.0 specimens, IV = 54.4, p = 0.0550) were indicators of the
small size class. Athous cucullatus (2.8 specimens, IV = 50.0, p = 0.0630) was an
indicator of the medium size class, and Agriotes collaris (4.0 specimens, IV = 50.0, p =
0.0850) was an indicator of the large size class. However, the low numbers of specimens
for A. cucullatus and A. collaris calls these two results into question.
I examined the relationships between the total abundance of click beetles with the
CWM characteristics through general linear models (PROC GENMOD, SAS Institute). I
employed a negative binomial distribution because the data were over-dispersed. I
generated models based on the main effects and their interactions, selecting an optimal
model with the second order Akaike Information Criterion (Akaike 1974). Main effects
included size (the small, medium, and large categories), type, decay class, and canopy
condition. In all models, size was not significant (p > 0.05, Table C.2.1, Table C.2.2a). I
also examined the relationship of each individual species with CWM size through general
linear models (PROC GENMOD, SAS Institute), employing a negative binomial
distribution. Only Athous orvus returned a significant response to size (p = 0.006, Table
C.2.2b), with more species in the small size class than in the large size class (p = 0.033).
152
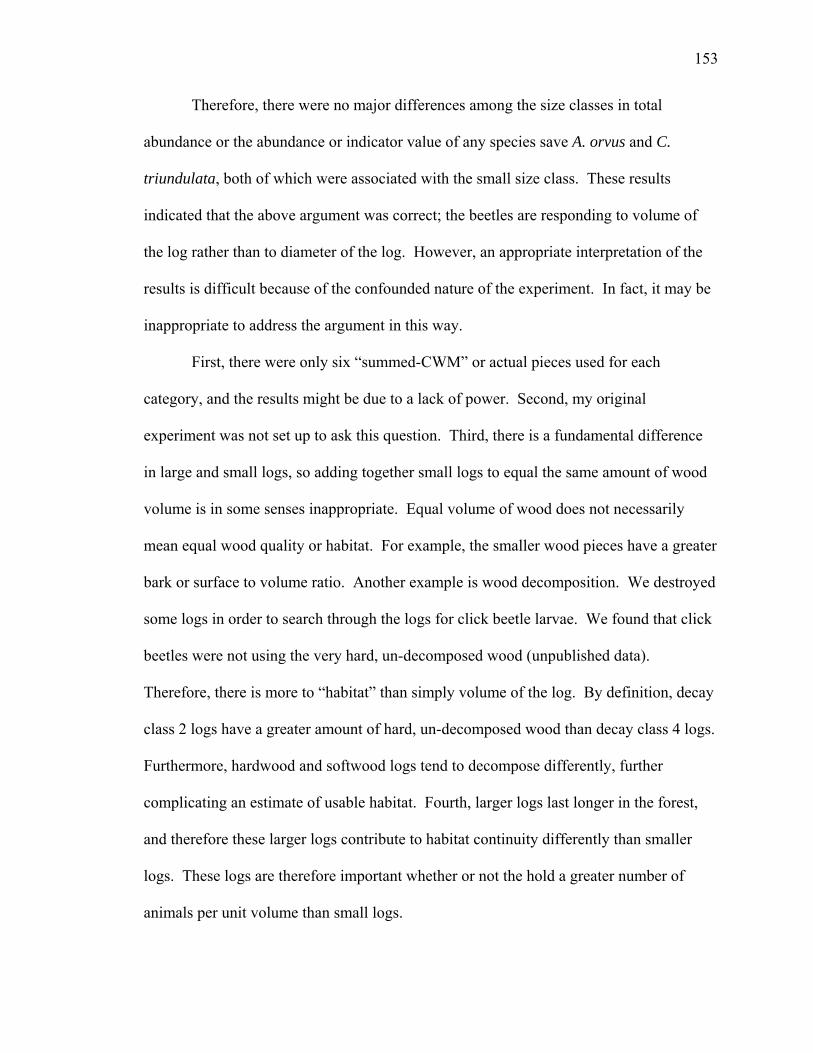
Therefore, there were no major differences among the size classes in total
abundance or the abundance or indicator value of any species save A. orvus and C.
triundulata, both of which were associated with the small size class. These results
indicated that the above argument was correct; the beetles are responding to volume of
the log rather than to diameter of the log. However, an appropriate interpretation of the
results is difficult because of the confounded nature of the experiment. In fact, it may be
inappropriate to address the argument in this way.
First, there were only six “summed-CWM” or actual pieces used for each
category, and the results might be due to a lack of power. Second, my original
experiment was not set up to ask this question. Third, there is a fundamental difference
in large and small logs, so adding together small logs to equal the same amount of wood
volume is in some senses inappropriate. Equal volume of wood does not necessarily
mean equal wood quality or habitat. For example, the smaller wood pieces have a greater
bark or surface to volume ratio. Another example is wood decomposition. We destroyed
some logs in order to search through the logs for click beetle larvae. We found that click
beetles were not using the very hard, un-decomposed wood (unpublished data).
Therefore, there is more to “habitat” than simply volume of the log. By definition, decay
class 2 logs have a greater amount of hard, un-decomposed wood than decay class 4 logs.
Furthermore, hardwood and softwood logs tend to decompose differently, further
complicating an estimate of usable habitat. Fourth, larger logs last longer in the forest,
and therefore these larger logs contribute to habitat continuity differently than smaller
logs. These logs are therefore important whether or not the hold a greater number of
animals per unit volume than small logs.
153
Table C.4. AIC Comparisons of models comparing total abundance of all 44 click beetle species between the three size categories using the summed CWM method. Size was non-significant (p > 0.05) for all models. Source Parameters AICc DifferenceSize 1 -1640.7 0.0Size, Canopy Condition 5 -1620.5 20.2Size, Canopy Condition, Type, Decay Class 7 -1607.2 33.5Size, Canopy Condition, Type 7 -1607.1 33.6Size, Canopy Condition, Decay Class 7 -1606.5 34.2Size, Canopy Condition, Size*Canopy Condition 11 -1568.3 72.4Size, Canopy Condition, Type, Decay Class, Size*Canopy Condition 13 -1514.0 126.7Size, Canopy Condition, Type, Size*Canopy Condition 13 -1513.9 126.8Size, Canopy Condition, Decay Class, Size*Canopy Condition 13 -1513.5 127.2
Table C.5. Results of individual general linear models for Experiment 2 "summed-CWM," where logs in small and medium size categories were summed together to add up to the same diameter as each log in the large size class and size category is the only term in the model. A) Total abundance of all 44 species summed together. B) Species run with individual models. Note: aTotal abundance not separated by species. bModel did not converge.
Species Small Medium Large Total P valueA) Total Abundance 44 species 147.00 90.00 144.00 381.00 0.274a
B) Individual Species Agriotes stabilis 7.00 4.50 2.00 13.50 0.134 Ampedus mixtus 22.00 16.75 32.00 70.75 0.660 Ampedus semicinctus 5.00 1.00 4.00 10.00 0.596 Athous orvus 11.00 0.00 1.00 12.00 0.006 Athous rufifrons 5.00 4.75 11.00 20.75 0.374 Ctenicera hieroglyphica 7.00 2.75 8.00 17.75 0.447 Ctenicera triundulata 41.00 17.30 17.00 75.30 0.066 Dalopius species 9.00 2.50 9.00 20.50 0.233 Limonius aeger 8.00 3.15 4.00 15.15 -b
Limonius confusus 7.00 1.50 14.00 22.50 0.084
Number of Individuals
154
Appendix C.3. Experiment 3: Soil
This is to be read in conjunction with Chapter 3. Introduction, methods, and
discussion points are not repeated here if redundant with Chapter 3.
C.3.1. Abstract
I compared click beetle abundance and species composition in soil in a field
experiment using two harvest treatments that created canopy gaps patterned after the
natural disturbance regime of the Acadian forest in central Maine, USA. Size of harvest
gap did not influence the species abundance of click beetles across the small range of gap
sizes studied (0.01 to 0.21 ha). Abundance of the most common species was higher in
the closed canopy than in the harvest gaps. Overall abundance was slightly higher in the
smaller gap harvest treatment and was influenced by tree species composition, especially
fir, pine, hemlock, maple, and birch. Although click beetle species richness was similar
between the harvest treatments and between the canopy conditions, there were different
assemblages of species between each. I concluded that the abundance and composition
of click beetles were affected by gap harvesting.
C.3.2. Introduction
I examined whether the abundance and composition of click beetles living in soil
were influenced by gap harvesting. Harvest gaps in the forest canopy can have
substantial influence on the forest ecosystem. Harvesting alters stand structure and
removes biomass on which many species depend (Grove 2002b, Fraver et al. 2002).
Canopy gaps often support more diverse and productive herbaceous and woody plant
155
communities (Busing and White 1997, Schofield 2003, Schumann et al. 2003) due to
increased sunlight and unique microsite conditions (Poulson and Platt 1989). In turn,
these changes affect populations of forest birds (Bisson and Stutchbury 2000, Guenette
and Villard 2005), amphibians (Harpole and Hass 1999, Knapp et al 2003), and
invertebrates (Basset et al. 2001, Peñaloza and Farji-Brener 2003, Gorham et al. 2002).
Properly interpreting gap dynamics is essential to developing appropriate silvicultural
guidelines for the Acadian forest (Seymour, et al. 2002, Lorimer and White 2003).
C.3.3. Methods
C.3.3.1. Field Invertebrate Sampling
To test the influence of the harvest treatments on click beetles in soil, during
2002, I selected areas of ground with no substantial CWM within one meter and
employed emergence traps that covered one square meter of soil (Figure B.1). Twenty-
four traps were used to collect from selected areas in the three treatment plots within each
harvest treatment (10% or 20%) and distributed between canopy conditions (harvest gap
or closed canopy). In each of the treatment plots I used two replications of each
combination of harvest treatment-canopy condition. I used a 10-factor prism to
determine the basal area of each tree species around each trap.
C.3.3.2. Analytical Approach
I compared beetle assemblages in soil in both harvest treatments (10% and 20%)
for 2002, evaluating harvest treatment and canopy condition in my analyses. Hereafter
this third approach is referred to as “Experiment 3.” I measured assemblages and used
ISA and rarefaction as in Chapter 3. For the general linear models, I generated models of
156
the eight most common species; the main effects were harvest treatment, canopy
condition, and species. A reduced model was developed as in Chapter 3, based on trap
locations only in harvest gaps and using area of the gap as a main effect.
Because click beetle larvae in the soil may be influenced by vegetation
composition, for Experiment 3 I examined relationships between click beetle species
abundance and the vegetation community by ordinating trap locations in click beetle
species-space with non-metric multidimensional scaling (NMS; Kruskal 1964) using PC-
ORD (McCune and Mefford 1999). NMS is an iterative ordination method based on
ranked distances between sample units; it searches for low stress, measured by the
relationship between the ranked distances in the original multidimensional space and the
reduced dimensions produced by the ordination. NMS is an effective ordination method
for community data; it does not assume normality and is robust to a large proportion of
zero values (Clarke 1993, McCune and Grace 2002). I summed the click beetle samples
between replicated traps and used all 26 species collected from soil traps. I used the
quantitative version of the Sorensen distance measure and random starting
configurations; the run with the lowest stress was used for the final analysis. I assessed
the dimensionality of six axes and selected three axes with a final stress of 4.7. All three
axes had significant Monte Carlo test results; however, I presented results for only the
two axes that described the most variation. Subsequently, I performed Pearson and
Kendall Correlations between the ordination axes with the beetle species and the tree
basal area gradients and joint-plotted the environmental variables. A high correlation
between any vegetation variable and an NMS axis indicated a persuasive association
157
between that variable with the beetle species associated with the axis. I overlaid a
polygon encircling the closed canopy trap locations.
In order to compare the CWM and soil habitats, I also analyzed all the data from
2002 (CWM and soil) comparing assemblage measurements and indicator species in
decay class2 and 4 and soil. I ordinated trap locations in click beetle species-space with
NMS using PC-ORD (McCune and Mefford 1999) based on the 60 click beetle species in
the 2002 CWM and soil traps. I used the quantitative version of the Sorensen distance
measure and a starting configuration based on a previously run medium autopilot mode;
the run with the lowest stress was used for the final analysis. I assessed the
dimensionality of six axes and selected three axes with a final stress of 21.85. This stress
is tending toward high in Clark’s (1993) “rules of thumb,” but this ordination has high
sample size, and stress tends to increase with sample size.
C.3.4. Results
C.3.4.1. Description of Taxa
I collected 267 click beetles of 26 different species, including one species
(Isoriphis obliqua) from Eunemidae, the false click beetles, (Table C.6). Ctenicera
triundulata, Agriotes stabilis, and Limonius aegis were the most common species,
representing 30%, 30%, and 7% of the total abundance, respectively. Eight species were
singletons, and 12 species were represented by only two to nine individuals.
C.3.4.2. Harvest Treatment
Four more species were found in the 20% harvest treatment than in the 10%
harvest treatment (Table C.7a), but total abundance was 43% higher in the 10% harvest
158
treatment. Beetle assemblages showed 62% similarity between the two harvest
treatments. No species were found to be significant indicators, and species diversity was
not different for the harvest treatments. There was no difference between harvest
treatments (p = 0.304) for the abundance of the eight most common species (Table C.8a).
C.3.4.3. Canopy Condition
Total richness was similar for the canopy conditions, no species were found to be
significant indicators, and species diversity was not different for the canopy conditions
(Table C.7a). However, the total abundance was 143% higher in the closed canopy than
in the harvested gaps. There was high turnover in species assemblage (46% similarity)
between canopy conditions.
Mean click beetle abundance was also higher in the closed canopy condition than
the harvest gaps (p < 0.001) for the eight most common species (Table C.8a, Figure C.7).
In the reduced model, including only the trap locations in the harvest gaps, beetle
abundance did not change in response to area of the gap (Table C.8b).
The NMS ordination on all species (Table C.9, Table C.10, Figure C.8) separated
trap locations by canopy condition (Figure C.8a), and most species’ centroids were
clustered close to the centroids of the closed canopy sites (Figure C.8b). White pine was
negatively correlated with the horizontal axis, with relatively higher basal area in the
harvest gaps than in the closed canopy trap locations. Balsam fir, red maple, white birch,
and eastern hemlock were positively correlated with the horizontal axis, and balsam fir
was negatively correlated with the vertical axis. The ordination represented 90.0% of the
variation in the click beetle community, with 45.9% depicted by the horizontal axis and
44.1% by the vertical axis. The axes were 99.9% orthogonal.
159
C.3.4.4. CWM and Soil
The overall number of click beetles caught in 2002 also varied between the CWM
decay classes and soil (Figure C.9). Richness per trap decreased from less decayed
CWM to more decayed CWM by 6% and then to soil by 38%, and species diversity also
decreased with increased decomposition to soil (Figure C.10). Decay Class 4, however,
had the highest abundance per trap, being 53% higher than Decay Class 2 and 81%
higher than soil. Indicator species analysis results depend on the number of habitat types
included, so adding the soil trap locations modified some of the results for the CWM
decay classes. Three species were indicators of less decayed CWM, three of more
decayed CWM, and seven of soil (Table C.11). Ctenicera triundulata had been found to
be an indicator of Decay Class 4 in the CWM analysis (Table 3.3), but it was an indicator
of soil when soil trap locations were added to the analysis (Table C.11). The two CWM
classes were 56% similar in species assemblage, as mentioned above. There was even
greater turnover between each of these with soil, at 43% and 37% similarity for Decay
Class 4 and 2, respectively.
Despite possible stress problems, the general trends of the sites in the NMS
ordination are evident, with Decay Class 4 mixed between Soil and Decay Class 2. All
axes had significant Monte Carlo test results. Axes 1, 2, and 3 accounted for 29.2%,
19.3%, and 20.0% of the variation in the data, respectively, for a total of 68.5% (Figure
C.11).
160
C.3.5. Discussion
C.3.5.1. Canopy Condition
Many studies have shown a change in insect species richness or abundance
following a forest disturbance; some species are attracted to disturbance patches, while
others can be reduced or eliminated (Schowalter 1985). Often these species are
herbivores responding to the greater abundance of herbaceous plants (Gorham et al.
2002, Peñaloza and Farji-Brener 2003, Ulyshen et al. 2005) or predators and parasitoids
responding to prey items, vegetation structure, light intensity, temperature, or soil
moisture (Shelly 1988, Marra and Edmonds 2005, Valladares et al. 2006, Hilszczanski et
al. 2005). Although such findings have yet to be demonstrated for the species in my
study, many elaterid species have demonstrated similar sensitivity to variables affected
by harvesting, such as light intensity, temperature and moisture (Fulton 1928, Campbell
1937, Lees 1943a&b, Falconer 1945, Jones 1951, LaFrance 1968, Blennow et al. 2002),
food preference (Zacharuk 1963, Svensson et al. 2004), climate (Penev 1992), vegetation
structure (Thomas, chapter 1), soil type (Wolters 1989, David et al. 1993, Strbac 1997)
and land use (Lefko et al. 1998). Several studies have shown a decrease in elaterid
abundance following forest harvesting (Theenhaus and Schaefer 1995, Marra and
Edmonds 1998, Siira-Pietikainen et al. 2003).
The 0.1 and 0.2 ha harvest gaps influenced the assemblage of click beetles in my
study. Although species richness and diversity between closed canopy conditions and
harvest gaps were similar, the species assemblage differed. Abundance was much higher
under closed canopy conditions. The NMS clustered most species within the closed
canopy trap locations; of the seven species located outside the closed canopy cluster, only
161
Athous cucullatus had more than three individuals. A. cucullatus is known to live in non-
forest habitat, having been found in prairie (Paiero et al. 2006) and old field habitats
(Evans 1989).
The NMS ordination indicated that basal area of three coniferous tree species (fir,
pine, and hemlock) and two hardwood species (red maple and white birch) influenced the
composition of the click beetle assemblages. This result may simply reflect the
dominance of coniferous trees across my study locations and the relatively higher basal
area of white pine in the harvest gaps than in the closed canopy. However, other studies
have also found an influence of tree species on elaterid assemblages. For example, Scheu
et al. (2003) determined that elaterids were more strongly affected by tree species than
stand age (30 yr. or 120 yr.), with greater abundance in spruce stands than in either mixed
or beech stands. Saetre et al. (1999) also found a difference among tree species, but
found greater abundance in the mixed stands (birch-spruce) than in pure spruce stands.
Saetre et al. proposed that the presence of birch leaf litter greatly influenced the
composition of soil fauna by regulating soil moisture and through general food inputs,
which in turn affected higher trophic levels.
C.3.5.2. Gap Size
See chapter for discussion.
C.3.5.3. Harvest Treatment
Harvest treatment did not have a large influence on species richness
Species richness did not differ between harvest treatments, but there were
differences in abundance and assemblage. Four more species were found in the 20%
harvest treatment than in the 10% harvest treatment, but total abundance was 43% higher
162
in the 10% harvest treatment. Beetle assemblages showed 62% similarity between the
two harvest treatments. No species were found to be significant indicators, and species
diversity was not different for the harvest treatments.
C.3.5.4. CWM and Soil
A few studies have examined the effect of CWM on soil invertebrate
assemblages. Jabin et al. (2004) investigated the density of soil macro-arthropods in a
forest, finding approximately twice as many individuals near to CWM (within 10 cm) as
they found distant to CWM (further than 500 cm). Furthermore, this difference was more
pronounced in the edge zone between the oak-beech forest and meadows. Marra and
Edmonds (1998) also found that distance to CWM influenced arthropod density, although
soil depth was more influential for most species. Of the two click beetle species they
observed, soil depth did not influence density, but one species had higher densities more
distant to CWM (100-110 cm) than close to CWM (0-10 cm). Chershire (1988) observed
that the elaterid Melanotus similis, considered a pest of row crops in agricultural systems,
was also common in forest systems. Many larvae were collected from decomposing
CWM, but the majority was collected in soil adjacent to CWM.
In my studies, comparisons of the 2002 collections of both soil and CWM
identified three indicators of Decay Class 2 CWM, three of Decay Class 4 CWM, and
seven for soil. When only the CWM information was included in the analysis, Ctenicera
triundulata was determined to be an indicator of Decay Class 4, but in this mixed
analysis of soil and CWM, it was an indicator of soil. This result suggests that some
species of click beetles, although found in logs of the later stages of decomposition, are
more likely to be found in soil. These species may move freely between the two habitats,
163

but concentrate in the soil. For my soil traps, I did not measure distance to CWM; it may
be that these species are influenced by the presence of nearby CWM. Those species that
did not switch between habitats likely have early- or late-stage decomposing CWM as
their primary habitat.
164
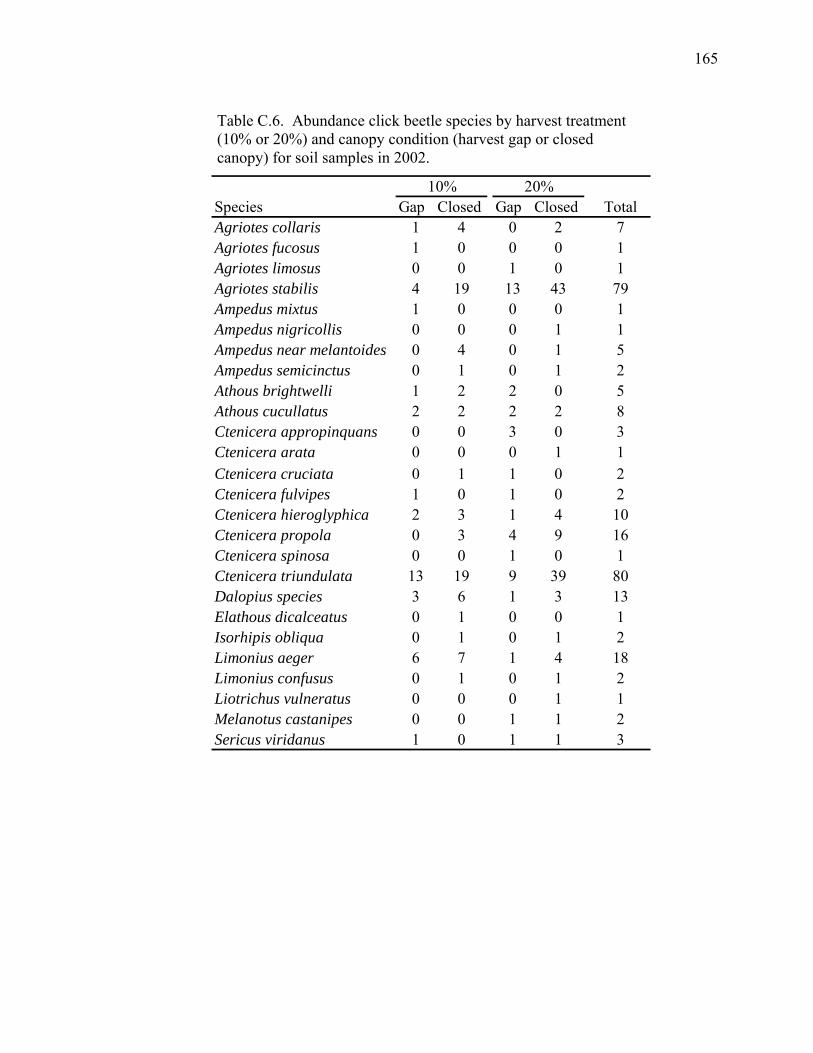
Table C.6. Abundance click beetle species by harvest treatment (10% or 20%) and canopy condition (harvest gap or closed canopy) for soil samples in 2002.
Species Gap Closed Gap Closed TotalAgriotes collaris 1 4 0 2 7Agriotes fucosus 1 0 0 0 1Agriotes limosus 0 0 1 0 1Agriotes stabilis 4 19 13 43 79Ampedus mixtus 1 0 0 0 1Ampedus nigricollis 0 0 0 1 1Ampedus near melantoides 0 4 0 1 5Ampedus semicinctus 0 1 0 1 2Athous brightwelli 1 2 2 0 5Athous cucullatus 2 2 2 2 8Ctenicera appropinquans 0 0 3 0 3Ctenicera arata 0 0 0 1 1Ctenicera cruciata 0 1 1 0 2Ctenicera fulvipes 1 0 1 0 2Ctenicera hieroglyphica 2 3 1 4 10Ctenicera propola 0 3 4 9 16Ctenicera spinosa 0 0 1 0 1Ctenicera triundulata 13 19 9 39 80Dalopius species 3 6 1 3 13Elathous dicalceatus 0 1 0 0 1Isorhipis obliqua 0 1 0 1 2Limonius aeger 6 7 1 4 18Limonius confusus 0 1 0 1 2Liotrichus vulneratus 0 0 0 1 1Melanotus castanipes 0 0 1 1 2Sericus viridanus 1 0 1 1 3
10% 20%
165
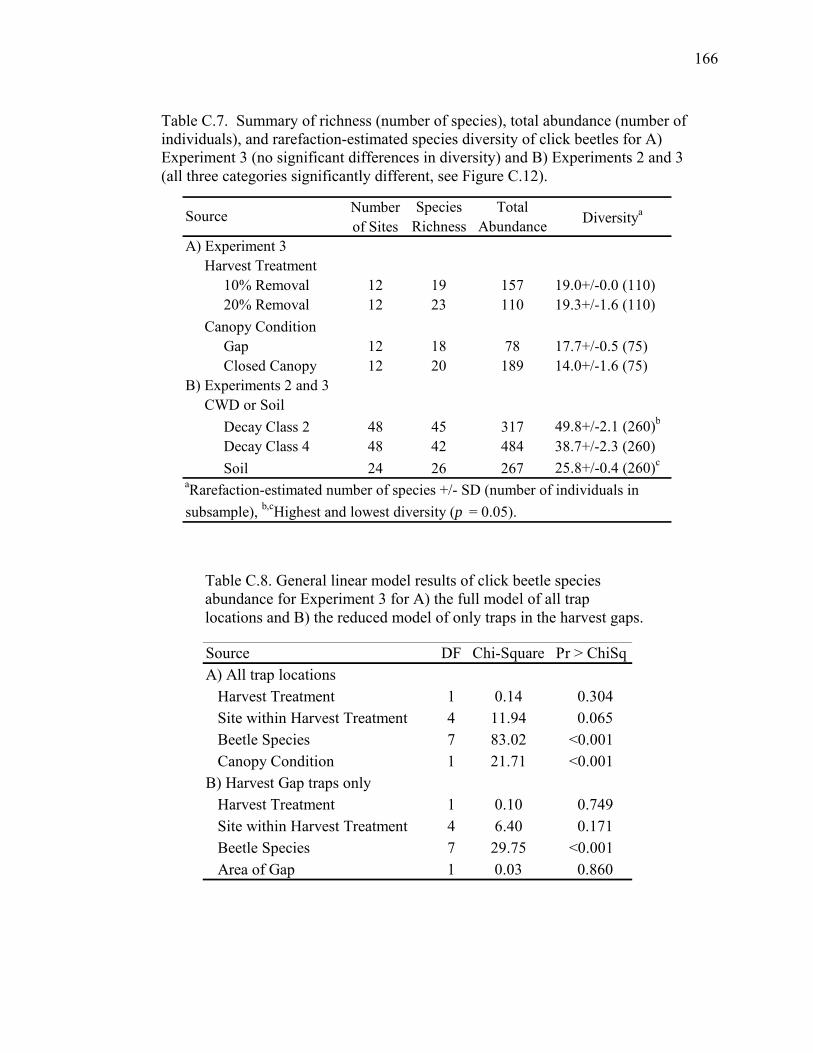
Source DF Chi-Square Pr > ChiSqA) All trap locations Harvest Treatment 1 0.14 0.304 Site within Harvest Treatment 4 11.94 0.065 Beetle Species 7 83.02 <0.001 Canopy Condition 1 21.71 <0.001B) Harvest Gap traps only Harvest Treatment 1 0.10 0.749 Site within Harvest Treatment 4 6.40 0.171 Beetle Species 7 29.75 <0.001 Area of Gap 1 0.03 0.860
Table C.8. General linear model results of click beetle species abundance for Experiment 3 for A) the full model of all trap locations and B) the reduced model of only traps in the harvest gaps.
Table C.7. Summary of richness (number of species), total abundance (number of individuals), and rarefaction-estimated species diversity of click beetles for A) Experiment 3 (no significant differences in diversity) and B) Experiments 2 and 3 (all three categories significantly different, see Figure C.12).
Number Species Totalof Sites Richness Abundance
A) Experiment 3 Harvest Treatment 10% Removal 12 19 157 19.0+/-0.0 (110) 20% Removal 12 23 110 19.3+/-1.6 (110) Canopy Condition Gap 12 18 78 17.7+/-0.5 (75) Closed Canopy 12 20 189 14.0+/-1.6 (75)B) Experiments 2 and 3 CWD or Soil Decay Class 2 48 45 317 49.8+/-2.1 (260)b
Decay Class 4 48 42 484 38.7+/-2.3 (260) Soil 24 26 267 25.8+/-0.4 (260)c
aRarefaction-estimated number of species +/- SD (number of individuals insubsample), b,cHighest and lowest diversity (p = 0.05).
Source Diversitya
166
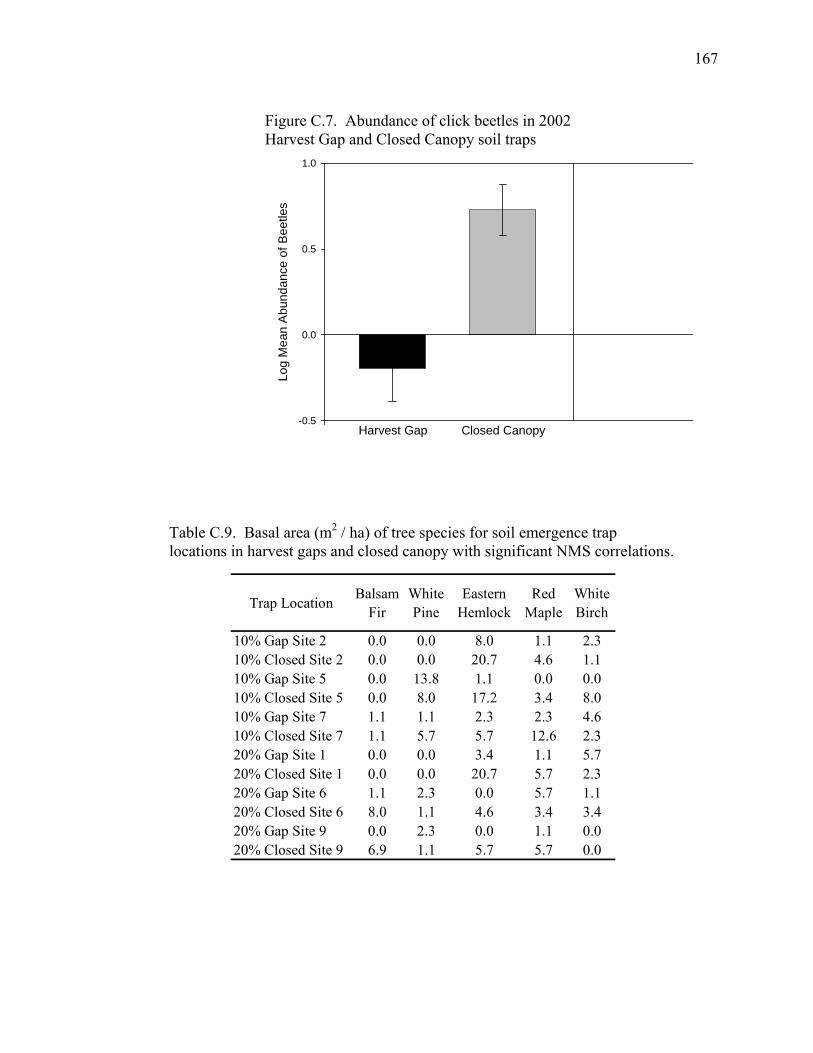
Table C.9. Basal area (m2 / ha) of tree species for soil emergence trap locations in harvest gaps and closed canopy with significant NMS correlations.
Trap Location Balsam Fir
White Pine
Eastern Hemlock
Red Maple
White Birch
10% Gap Site 2 0.0 0.0 8.0 1.1 2.310% Closed Site 2 0.0 0.0 20.7 4.6 1.110% Gap Site 5 0.0 13.8 1.1 0.0 0.010% Closed Site 5 0.0 8.0 17.2 3.4 8.010% Gap Site 7 1.1 1.1 2.3 2.3 4.610% Closed Site 7 1.1 5.7 5.7 12.6 2.320% Gap Site 1 0.0 0.0 3.4 1.1 5.720% Closed Site 1 0.0 0.0 20.7 5.7 2.320% Gap Site 6 1.1 2.3 0.0 5.7 1.120% Closed Site 6 8.0 1.1 4.6 3.4 3.420% Gap Site 9 0.0 2.3 0.0 1.1 0.020% Closed Site 9 6.9 1.1 5.7 5.7 0.0
Figure C.7. Abundance of click beetles in 2002 Harvest Gap and Closed Canopy soil traps
Log
Mea
n A
bund
ance
of B
eetle
s
-0.5
0.0
0.5
1.0
Harvest Gap Closed Canopy
167
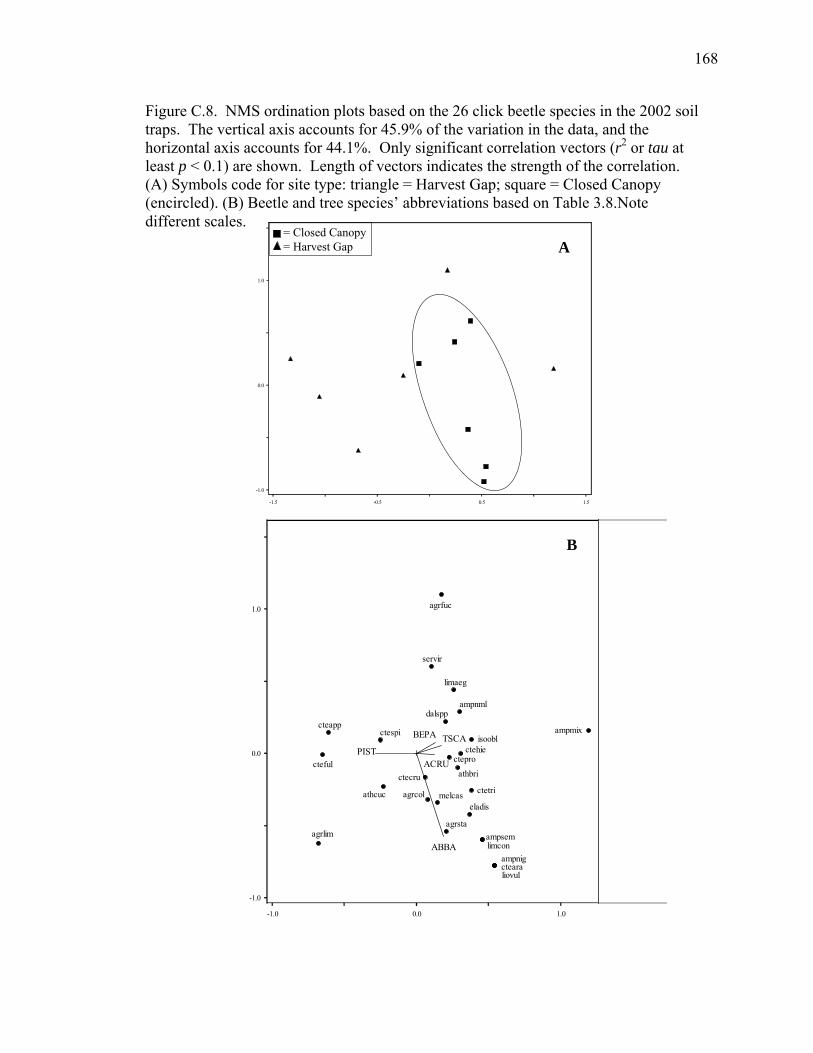
Figure C.8. NMS ordination plots based on the 26 click beetle species in the 2002 soil traps. The vertical axis accounts for 45.9% of the variation in the data, and the horizontal axis accounts for 44.1%. Only significant correlation vectors (r2 or tau at least p < 0.1) are shown. Length of vectors indicates the strength of the correlation. (A) Symbols code for site type: triangle = Harvest Gap; square = Closed Canopy (encircled). (B) Beetle and tree species’ abbreviations based on Table 3.8.Note different scales.
-1.5
-1.0
-0.5 0.5 1.5
0.0
1.0
= Closed Canopy= Harvest Gap
-1.5
-1.0
-0.5 0.5 1.5
0.0
1.0
-1.5
-1.0
-0.5 0.5 1.5
0.0
1.0
= Closed Canopy= Harvest Gap A
agrfuc
agrlim
ampmix
ampnigcteara
ctespi
eladis
liovul
ampsem
ctecructeful
isoobl
limcon
melcas
cteapp
servir
ampnml
athbri
agrcolathcuc
ctehie
dalspp
ctepro
limaeg
agrsta
ctetri
ABBA
PISTTSCA
ACRU
BEPA
-1.0
-1.0
0.0 1.0
0.0
1.0 agrfuc
agrlim
ampmix
ampnigcteara
ctespi
eladis
liovul
ampsem
ctecructeful
isoobl
limcon
melcas
cteapp
servir
ampnml
athbri
agrcolathcuc
ctehie
dalspp
ctepro
limaeg
agrsta
ctetri
ABBA
PISTTSCA
ACRU
BEPA
-1.0
-1.0
0.0 1.0
0.0
1.0
B
168
Table C.10. Pearson and Kendall correlations of click beetle species and tree species basal area with site locations along two NMS ordination axes. The vertical and horizontal axes explain 45.9% and 44.1% of the variation in the click beetle community structure, respectively. Note: Only the tree species with significant correlations with one or both ordination axes are shown. *, (p < 0.1); **, (p < 0.05); ***, (p < 0.001)
Abbre-viation r tau r tau
Click Beetle Species Agriotes collaris agrcol 0.08 0.10 -0.43 -0.40** Agriotes fucosus agrfuc 0.07 -0.04 0.58** 0.41** Agriotes limosus agrlim -0.30 -0.26 -0.33 -0.26 Agriotes stabilis agrsta 0.25 -0.05 -0.80*** -0.73*** Ampedus mixtus ampmix 0.52** 0.41** 0.08 0.04 Ampedus nigricollis ampnig 0.23 0.33* -0.41 -0.33* Amedus near melanotoides ampnml 0.21 0.16 0.24 0.25 Ampedus semicinctus ampsem 0.29 0.33* -0.47* -0.39** Athous brightwelli athbri 0.23 0.16 -0.10 -0.16 Athous cucullatus athcuc -0.36 -0.25 -0.42 -0.40** Ctenicera appropinquans cteapp -0.37 -0.40** 0.11 0.08 Ctenicera arata cteara 0.23 0.33* -0.41 -0.33* Ctenicera cruciata ctecru 0.04 -0.06 -0.13 -0.17 Ctenicera fulvipes cteful -0.42 -0.39** -0.01 -0.11 Ctenicera hieroglyphica ctehie 0.46* 0.38** 0.00 0.02 Ctenicera propola ctepro 0.24 0.23 -0.03 -0.23 Ctenicera spinosa ctespi -0.11 -0.19 0.05 -0.04 Ctenicera triundulata ctetri 0.70*** 0.77*** -0.57** -0.33* Dalopius species dalspp 0.17 -0.02 0.23 0.38** Elathous discalceatus eladis 0.16 0.11 -0.22 -0.19 Isoriphis obliqua isoobl 0.25 0.22 0.08 0.11 Limonius aeger limaeg 0.32 0.26 0.66*** 0.53*** Limonius confusus limcon 0.29 0.33* -0.47* -0.39** Liotrichus vulneratus liovul 0.23 0.33* -0.41 -0.33* Melanotus castanipes melcas 0.09 0.11 -0.27 -0.28* Sericus viridanus servir 0.09 -0.02 0.61*** 0.45***Tree Species Balsam Fir ABBA 0.15 0.46** 0.46*** -0.46** Red Maple ACRU 0.10 0.27* 0.01 -0.11 White Birch BEPA 0.11 0.27* 0.06 0.18 White Pine PIST 0.23* -0.26 0.00 -0.07 Eastern Hemlock TSCA 0.14 0.30* 0.04 0.17
SourceHorizontal Axis Vertical Axis
169
Mean Abundance Decay Class 4
0.0 0.2 0.4 0.6 0.8 1.0 1.2
Mea
n A
bund
ance
Dec
ay C
lass
2
0
1
2
3
Mean Abundance Decay Class 4
0.0 0.1 0.2 0.3 0.4 0.5
0.0
0.2
0.4
0.6
0.8
Mean Abundance Soil
0.0 0.5 1.0 1.5 2.0 2.5 3.0
Mea
n A
bund
ance
Dec
ay C
lass
4
0
1
2
3
Mean Abundance Soil
0.0 0.1 0.2 0.3 0.4 0.5 0.6 0.7
0.0
0.2
0.4
0.6
0.8Mean Abundance Soil
0.0 0.1 0.2 0.3 0.4 0.5
0.0
0.2
0.4
0.6
0.8
Mean Abundance Soil
0.0 0.2 0.4 0.6 0.8 1.0 1.2
Mea
n A
bund
ance
Dec
ay C
lass
2
0
1
2
3
Figure C.9. Abundance per trap for all 60 click beetle species in the 2002 CWM and soil traps. (A&B) Decay Class 2 x Decay Class 4; (B) without Ctenicera triundulata, Ampedus mixtus, or Ampedus semicinctus; (C&D) Decay Class 2 x Soil; (D) without C. triundulata, A. mixtus, A. semicinctus, or Agriotes stabilis; (E&F) Decay Class 4 x Soil; (F) without C. triundulata, A. mixtus, or A. stabilis.
A
E
C
F
D
B
170
Figure C.10. Rarefaction estimates of beetle species diversity for CWM decay classes and soil in Experiments 2 and 3.
Expe
cted
Num
bero
fSpe
cies
0 100 200 300 400 5000
10
20
30
40
50
60Decay Class 2 Decay Class 4Soil
Number of Individuals in Subsample
Table C.11. Indicator species analysis of click beetle species for CWM decay classes and soil in Experiments 2 and 3.
Total number IndicatorSource Species collected Value pDecay Class 2 Ampedus semicinctus 45 21.2 0.029
Athous scapullaris 23 17.9 0.003Melanotus castanipes 23 18.6 0.030
Decay Class 4 Ampedus mixtus 122 34.1 0.008Athous rufifrons 35 20.2 0.025Limonius confusus 38 20.5 0.007
Soil Agriotes collaris 15 18.5 0.008Agriotes stabilis 114 61.2 0.001Athous cucullatus 17 18.6 0.011Ctenicera hieroglyphica 35 16.5 0.060Ctenicera propola 31 22.6 0.007Ctenicera triundulata 231 46.8 0.001Limonius aeger 42 22.4 0.013
Note: An indicator value approaching 100 denotes the presence of a species andsignifies a particular group without error. P values were determined using a MonteCarlo test with 1000 permutations and represents the probability of an indicatorvalue greater than or equal to the observed indicator value.
171
Figure C.11. NMS ordination plots based on the 60 click beetle species in the 2002 CWM and soil traps. We used PC-ORD (McCune and Mefford 1999) with the quantitative version of the Sorensen distance measure and a starting configuration based on a previously run medium autopilot mode; the run with the lowest stress was used for the final analysis. We assessed the dimensionality of six axes and selected three axes with a final stress of 21.85. This stress is tending toward high in Clark’s (1993) “rules of thumb,” but this ordination has high sample size, and stress tends to increase with sample size. Despite this, the general picture of the sites is evident, with Decay Class 4 mixed between Soil and Decay Class 2. All axes had significant Monte Carlo test results. Axes 1, 2, and 3 account for 29.2%, 19.3%, and 20.0% of the variation in the data, respectively, for a total of 68.5%. The axes were 99.4-99.8% orthogonal. Symbols code for site type: triangle = Soil, diamond = Decay Class 4, and square = Decay Class 2.
-1.5
-2.0
-0.5 0.5 1.5
-1.0
0.0
1.0
2.0
A. Axes 1 x 2
172
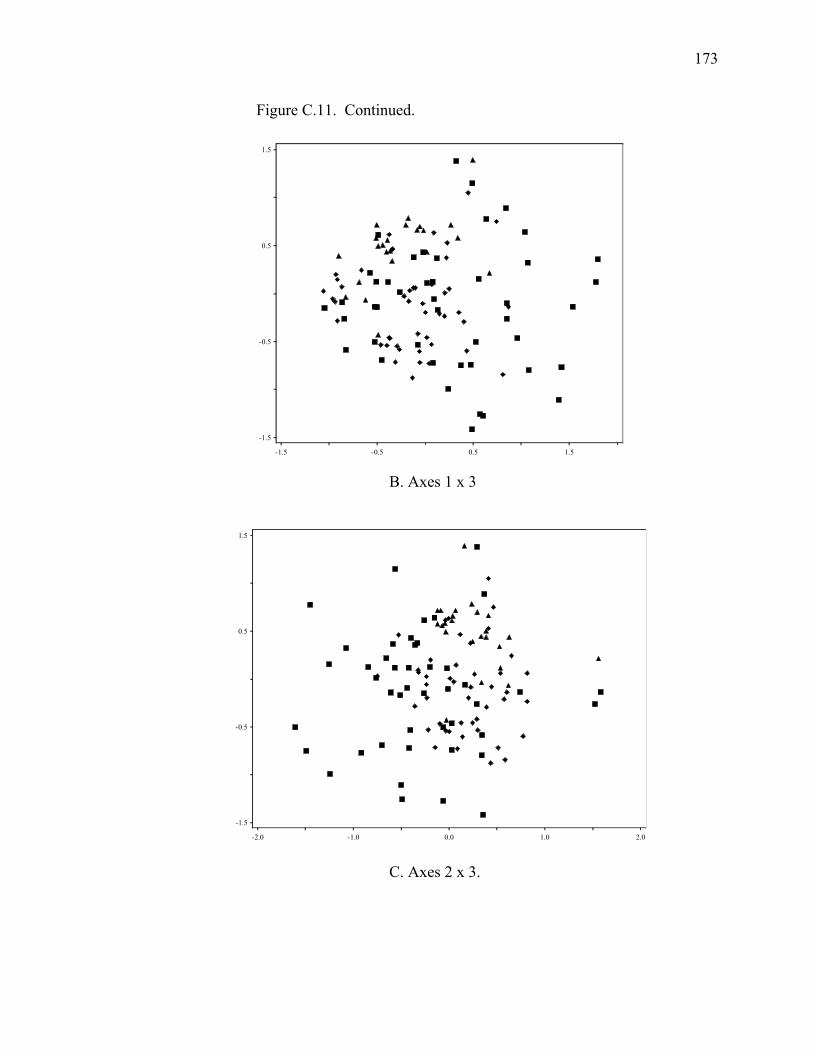
-1.5
-1.5
-0.5 0.5 1.5
-0.5
0.5
1.5
-2.0
-1.5
-1.0 0.0 1.0 2.0
-0.5
0.5
1.5
Figure C.11. Continued.
B. Axes 1 x 3
C. Axes 2 x 3.
173
BIOGRAPHY OF THE AUTHOR
Shelly L. Thomas was born in Danville, Pennsylvania, and graduated from
Wellsboro High School, Wellsboro, Pennsylvania (home of the Pennsylvania Grand
Canyon). She attended Eastern University near Philadelphia and graduated Magna Cum
Laude in 1995 with a Bachelor’s degree in Biology. During her undergraduate career,
she earned her Naturalist Certificate from Au Sable Environmental Institute in Michigan,
where she developed a passion for creation care, beetles, and teaching. Shelly worked
with staphylinid beetles in California and with burying beetles at the Apostle Islands
National Lakeshore in Wisconsin. She taught environmental education in Michigan and
developed an environmental education program in Kenya, on the shores of Lake Victoria.
Shelly then entered the Ecology and Environmental Studies graduate program,
concentrating in Conservation Biology, at The University of Maine. She taught for two
years in the Milford, Maine eighth grade science class through the NSF GK-12 program.
As part of this program she worked in the Arabuko-Sokoke Forest in Kenya with A
Rocha International. She presented her research at many Society for Conservation
Biology and Entomological Society of America conferences. Shelly was Small Group
Director at Pathway Wesleyan Church, where she helped organize the Growth Ring
Ministry, trained leaders, and led small groups. She taught on Biblical equality between
women and men at Emmanuel Wesleyan Seminary in Swaziland through World Hope
Canada. Shelly enjoys the beauty of Maine, hiking, paddling, rock-climbing, camping,
and playing with friends. She is a candidate for the Doctor of Philosophy degree in
Ecology and Environmental Science from The University of Maine in May, 2007.
174