effects of gabab ligands on the gsh-induced …
TRANSCRIPT

University of Rhode Island University of Rhode Island
DigitalCommons@URI DigitalCommons@URI
Open Access Master's Theses
2015
EFFECTS OF GABAB LIGANDS ON THE GSH-INDUCED EFFECTS OF GABAB LIGANDS ON THE GSH-INDUCED
ELECTRICAL ACTIVITY OF THE HYPOSTOME IN HYDRA ELECTRICAL ACTIVITY OF THE HYPOSTOME IN HYDRA
Bianca M. Lauro University of Rhode Island, [email protected]
Follow this and additional works at: https://digitalcommons.uri.edu/theses
Recommended Citation Recommended Citation Lauro, Bianca M., "EFFECTS OF GABAB LIGANDS ON THE GSH-INDUCED ELECTRICAL ACTIVITY OF THE HYPOSTOME IN HYDRA" (2015). Open Access Master's Theses. Paper 538. https://digitalcommons.uri.edu/theses/538
This Thesis is brought to you for free and open access by DigitalCommons@URI. It has been accepted for inclusion in Open Access Master's Theses by an authorized administrator of DigitalCommons@URI. For more information, please contact [email protected].

EFFECTS OF GABAB LIGANDS ON THE GSH-INDUCED
ELECTRICAL ACTIVITY OF THE HYPOSTOME IN
HYDRA
BY
BIANCA M. LAURO
A THESIS SUBMITTED IN PARTIAL FULFILLMENT OF THE
REQUIREMENTS FOR THE DEGREE OF
MASTER OF SCIENCE
IN
NEUROSCIENCE
UNIVERSITY OF RHODE ISLAND
2015

MASTER OF SCIENCE DEGREE THESIS
OF
BIANCA M. LAURO
APPROVED:
Thesis Committee:
Major Professor Gabriele Kass-Simon Walter Besio Gavino Puggioni
Nasser H. Zawia
DEAN OF THE GRADUATE SCHOOL
UNIVERSITY OF RHODE ISLAND 2015
ABSTRACT
Reduced glutathione, GSH, artificially induces the signature feeding behavior in
the early-evolved metazoan, Hydra vulgaris. Evidence has shown that the mouth
opening response is prolonged by the inhibitory neurotransmitter, GABA. By making
extracellular recordings of a detached reduced-tentacle hypostome, it is possible to
record the electrical activity produced by GSH and to observe the effects of the
inhibitory neurotransmitter, gamma-amino-butyric acid (GABA), the GABAB agonist
(baclofen) and the GABAB antagonist, (phaclofen).
When an electrode is placed on the mouth of the hypostome, thus blocking the
mouth opening, and the ligands are placed in the bath surrounding the base of the
hypostome, the following effects are observed: GSH increased small-uncorrelated
hypostomal pulses (SUHPs), medium-uncorrelated hypostomal pulses (MUHPs),
pacemaker bursting pulses (PBPs) and pulses per pacemaker bursting pulse (P/PBPs).
Although GABA per se produced no effect when administered with GSH, baclofen
caused an increase in SUHPs, while phaclofen per se caused a decrease;
coadministration of baclofen and phaclofen mutually cancelled their individual effects.
This suggests that at least some of the SUHPs might be GSH neuronal impulses
having metabotropic (GABAB) receptor involvement. GSH coadministered with
baclofen and phaclofen caused a decrease in MUHPs and rhythmic potentials (RPs);
GABA administered with GSH produced no effect on MUHPs and RPs.
When the ligands were placed within the pipette at the mouth (exposing the
mouth opening to ligands and blocking the proximal portion of the hypostome), the
following effects were observed: GSH increased MUHPs and decreased extra-large

uncorrelated hypostomal pulses (XLUHPs) and P/PBPs; this comports with the
previously observed GSH induced cone-formation of the hypostome, now
hypothesized to be reflected in the increase MUHPs (which may be muscle pulses)
and the concurrent inhibition of body contraction (considered to be mediated by
XLUHPs and PBPs). This effect was abolished by GABA, which increased the
frequency of the large pulses, but not mimicked by baclofen nor counteracted by
phaclofen, both of which also decreased in the large pulses. This suggests that GABA
inhibition of GSH activity might also involve the action of GABA on its ionotropic
receptors and that GABAB receptors exist on the excitatory effector circuits. GSH
administered with baclofen caused a decrease in SUHPs.
In general, GSH administered alone, GSH and GABA, GSH and phaclofen, GSH
and baclofen and GSH coadministered with baclofen and phaclofen caused
significantly increased activity when applied directly to the apex of the hypostome,
indicating that both GSH and GABAB receptors are concentrated in or around the
hypostomal apex.
Although GABA combined with GSH produced no significant differences in the
frequency of any of the parameters measured in the bath-applied method,
coadministration increased LUHPs, XLUHPs, PBPs and RPs in the pipette-applied
method—suggesting prolongation of mouth opening. The results support the
behavioral observations that GABA inhibits the cessation of the GSH-induced feeding
response and indicates that GSH and GABA receptors are differentially distributed in
the hypostome.

iv
ACKNOWLEDGMENTS
A sophomore in college, I knocked on the door of Dr. Kass-Simon’s laboratory
asking to be a part of her research group. Five years later, I would not have become
the person I am today without her. A mentor, friend, professor, and role model, her
guidance and support has paved the way for a successful thesis that I am utmost proud
of.
To my committee members, Dr. Walter Besio and Dr. Gavino Puggioni, I am
sincerely grateful for their commitment to my research project and guidance over the
course of this study.
Thank you, Dr. Steve Irvine, for serving as committee chair for my thesis defense.
To my fellow graduate students, Vandana Nandivada, Steven Steinmetz,
Stephanie Guertin, Bailey Munro, thank you for helping with the care of the hydra.
Thank you, Brian Velleco, with assistance formulating dilution methods for the dose
response experiments.
Finally, thank you to my mother and two sisters, Dana and Alana, for their
continued support.

v
PREFACE
This thesis is being submitted in manuscript format. It is composed of one
manuscript and one appendix. The title of the manuscript is “Effect of GABAB
ligands on the GSH-induced electrical activity of the hypostome in hydra.” The
manuscript is prepared for submission to Comparative Biochemistry and Physiology
A.

vi
TABLE OF CONTENTS
ABSTRACT .................................................................................................................. ii
ACKNOWLEDGMENTS .......................................................................................... iv
PREFACE ..................................................................................................................... v
TABLE OF CONTENTS ............................................................................................ vi
LIST OF TABLES ..................................................................................................... vii
LIST OF FIGURES .................................................................................................. viii
EFFECTS OF GABAB RECEPTOR LIGANDS ON THE GSH-INDUCED
ELECTRICAL ACTIVITY OF THE HYPOSTOME IN HYDRA
INTRODUCTION ................................................................................................ 2
MATERIALS AND METHODS ........................................................................ 11
RESULTS ........................................................................................................... 18
DISCUSSION ..................................................................................................... 29
TABLES .............................................................................................................. 37
FIGURES ............................................................................................................ 76
APPENDIX: Raw Data ............................................................................................ 137
BIBLIOGRAPHY .................................................................................................... 152

vii
LIST OF TABLES EFFECTS OF GABAB RECEPTOR LIGANDS ON THE GSH-INDUCED ELECTRICAL ACTIVITY OF THE HYPOSTOME IN HYDRA
TABLE PAGE
Table 1. Effects of various treatments on the SUHPs: a) B.A b) P.A ........................ 37
Table 2. Effects of various treatments on the MUHPs: a) B.A b) P.A ...................... 40
Table 3. Effects of various treatments on the LUHPs: a) B.A b) P.A ........................ 43
Table 4. Effects of various treatments on the XLUHPs: a) B.A b) P.A .................... 46
Table 5. Effects of various treatments on the PBPs: a) B.A b) P.A ........................... 49
Table 6. Effects of various treatments on the P/PBP: a) B.A b) P.A ......................... 52
Table 7. Effects of various treatments on the RPs: a) B.A b) P.A .............................. 55
Table 8. Comparison of responses in B.A method vs. P.A method: SUHPs .............. 58
Table 9. Comparison of responses in B.A method vs. P.A method: MUHPs ............. 60
Table 10. Comparison of responses in B.A method vs. P.A method: LUHPs ............ 62
Table 11. Comparison of responses in B.A method vs. P.A method: XLUHPs ......... 64
Table 12. Comparison of responses in B.A method vs. P.A method: PBPs ............... 66
Table 13. Comparison of responses in B.A method vs. P.A method: P/PBPs ............ 68
Table 14. Comparison of responses in B.A method vs. P.A method: RPs ................. 70
Table 15. Comparison of responses in B.A method vs. P.A method:
a) GSH 5x10⁻⁷M: XLUHPs b) GSH 5x10⁻⁸M: MUHPs c) GSH 5x10⁻⁷M + Phaclofen
10-8 M: PBPs ............................................................................................................... 72
Table 16. GSH dose response in a) B.A b) P.A .......................................................... 74

viii
LIST OF FIGURES
FIGURE PAGE
Figure 1. Schematic diagram of ablated hypostome. .................................................. 76
Figure 2. 24-hr regeneration of tentacle-free hypostome in Hydra ............................. 78
Figure 3. Schematic diagram of bath-applied electrode placement ............................ 80
Figure 4. Sample bath-applied recording .................................................................... 82
Figure 5. Schematic diagram of pipette-applied electrode placement ........................ 84
Figure 6. Sample pipette-applied recording ............................................................... 86
Figure 7. Effect of SUHPs: bath-applied ................................................................... 88
Figure 8. Effect of XLUHPs: bath-applied ................................................................ 90
Figure 9. GSH dose response: B.A. SUHPs, MUHPs, RPs ........................................ 92
Figure 10. GSH dose response: B.A. LUHPs, XLUHPs ............................................ 94
Figure 11. GSH dose response: B.A. PBPs, P/PBPs ................................................... 96
Figure 12. Effect of MUHPs: pipette-applied ............................................................. 98
Figure 13. GSH dose response: P.A. LUHPs, XLUHPs ........................................... 100
Figure 14. GSH dose response: P.A. PBPs, P/PBPs ................................................ 102
Figure 15. GSH dose response: P.A. SUHPs, MUHPs, RPs .................................... 104
Figure 16. Effect of MUHPs: bath-applied .............................................................. 106
Figure 17. Effect of LUHPs: bath-applied ............................................................... 108
Figure 18. Effect of PBPs: bath-applied .................................................................. 110
Figure 19. Effect of P/PBPs: bath-applied ............................................................... 112
Figure 20. Effect of RPs: bath-applied ..................................................................... 114

ix
Figure 21. Effect of LUHPs: pipette-applied ............................................................ 116
Figure 22. Effect of P/PBPs: pipette-applied ............................................................ 118
Figure 23. Effect of XLUHPs: pipette-applied ......................................................... 120
Figure 24. Effect of RPs: pipette-applied .................................................................. 122
Figure 25. Sample recording: GSH 5x10⁻⁷ + GABA 10-6 ......................................... 124
Figure 26. Effect of SUHPs: pipette-applied ............................................................ 126
Figure 27. Sample recording: GSH 5x10⁻⁷ + Baclofen 10-8 ...................................... 128
Figure 28. Effect of PBPs: pipette-applied ............................................................... 130
Figure 29. Sample recording: GSH 5x10⁻⁷ + Phaclofen 10-8 .................................... 132
Figure 30. Sample recording: GSH 5x10⁻⁷ + Baclofen 10-8 + Phaclofen 10-8 ........... 134
Figure 31. Sample recording: GSH 5x10⁻⁷, GSH 5x10⁻⁷ + GABA 10-6, GSH 5x10⁻⁷ +
Phaclofen 10-8, GSH 5x10⁻⁷ + Baclofen 10-8, GSH 5x10⁻⁷ +Phaclofen 10-8 + Baclofen
10-8 on GSH-elicited potentials ................................................................................. 136

1
MANUSCRIPT
“EFFECTS OF GABAB RECEPTOR LIGANDS ON THE
GSH-INDUCED ELECTRICAL ACTIVITY OF THE HYPOSTOME
IN HYDRA”
BY
B M LAURO1, G KASS-SIMON1*
is formatted and prepared for submission to Comparative Biochemistry
and Physiology A.
1 Interdisciplinary Neurosciences Program, University of Rhode Island, Kingston, RI 02881

2
EFFECTS OF GABAB RECEPTOR LIGANDS ON THE GSH-INDUCED
ELECTRICAL ACTIVITY OF THE HYPOSTOME IN HYDRA
INTRODUCTION
Hydra is an early-evolved metazoan found in small lakes and ponds, and is
considered the quintessential example of an animal with a simple nervous system.
Hydra’s long, cylindrical body column has two main body layers consisting of an
ectoderm and endoderm separated by a gel-like mesoglea. Distributed along the
ectoderm lays a simple nervous system composed of interconnecting, synapsing
neurons (Hadzi, 1909; Koizumi, 2007; Kinnamon and Westfall, 1981). The two body
layers meet at the apex of the mouth surrounded by a whorl of tentacles amid
specialized stinging cells called cnidocytes—used for capturing prey. Its feeding
behavior consists of tentacle writhing, longitudinal body contractions, and mouth
opening/closing. Nonetheless, the neuronal mechanisms controlling the patterned
behavior have not been fully described.
Numerous sensory cells are involved in hydra’s feeding behavior. One of the
most intriguing physiological phenomena is the chemical induction of a complex
feeding pattern of behavior in the fresh water polyp, Hydra vulgaris by GSH
(Loomis, 1955). The artificially induced GSH feeding behavior of hydra is a well-
defined quantifiable mechanism and is one of the most familiar chemosensory
behaviors to date. Specifically, used to study the dynamics of receptor binding
(Lenhoff and Bovaird, 1961) and the behavioral physiology of a ligand-induced
feeding behavior. After piercing its prey (with cnidocytes on hydra’s tentacles), the

3
captured releases the tripeptide glutathione (GSH). Tentacle writhing, mouth
(hypostome) opening, and body contractions result and are the key features of this
synchronized behavior (Loomis and Lenhoff, 1956; Lenhoff et al., 1961; Bellis et al.,
1992; Grosvenor et al., 1996; Pierobon et al., 1995; Kass-Simon et al., 2003). The
hypostome maximally expands to accompany the size of homogenate and the prey is
ingested along the endoderm-lined gut. Eventually, hydra regurgitates the quarry and
closes the mouth; the feeding behavior lasts approximately 30 minutes. The signature
role and specific function of receptors and organelles involved during a centrally
correlated behavior (such as the ability to capture, ingest, and regurgitate prey) has
yet to be understood; it is important to identify the existence and the behaviorally-
correlated output of these receptors and organelles in hydra’s feeding.
Experiments to localize the GSH receptors have been carried out by many
investigators. After approximately one-two minutes of GSH exposure, the mouth will
rapidly open and remain open until an inhibitory stimulus is initiated. The feeding
response is quickly terminated by the removal of GSH and application of KCl and
veratridine (Pierobon et al., 2004). The GSH-induced feeding behavior is also
antagonized by L-glutamic acid (Lenhoff and Bovaird, 1961). Homogenized
cnidocyte-fractions of hydra tentacles with radiolabeled glutamate inhibited GSH
binding (Venturini, 1987) and it was believed that glutamate was a competitive
inhibitor of GSH binding at the GSH receptor site. However, other studies showed
that glutamate had bound to its own receptors and that GSH was still binding to its
receptor site (Bellis et al., 1991; Grosvenor et al., 1992). Thus, there may be a site on
the glutamate receptor, specifically for GSH binding.

4
Neuronal gap junctions indicated the first ultrastructural evidence of electrical
synapses in Hydra’s nervous system and more frequently occurring, chemical
synapses produced by the same neuron in the hypostome (Westfall et al., 1980).
These chemical and electrical synapses are similar to indirect and direct, interneuronal
communication between neurons in the brain (Meier and Dermietzel, 2006). Synaptic
connectivity between the hypostome and the tentacles is due in part to multiple
neuronal clusters found between the hypostome-tentacle junction (Kinnamon and
Westfall, 1982)—similar to ganglia found in the mammalian nervous system.
Chemical synapses and gap junctions between neurons of the hypostome and tentacle
junction may be involved in eliciting the feeding behavior from mouth opening to
tentacle writhing (Kinnamon and Westfall, 1982). The simultaneous opening of the
mouth and tentacle writhing is a signature behavior that may be under specific
neuronal control. Kass-Simon (1972) placed electrodes just near the tentacles and the
original electrical findings indicated that there were impulse initiation sites at the base
of the tentacles. Thus, the newly observed proximal nerve net at the base of the
hypostome and the distal nerve net at the apex of the hypostome may be involved in
coordinating hydra’s feeding response (Hufnagel and Kass-Simon, unpublished).
Evidence of chemoreception, elicited by hydra’s response to GSH, can be
found when hydra is exposed to concentrations ranging from high nanomolar to low
micromolar of GSH (Lenhoff, 1961; Bellis et al., 1992). A quantitative assay of
mouth opening duration (Lenhoff, 1961) led to characterization of the glutathione
chemoreceptor; the GSH-induced feeding response (Pierobon et al., 1995) was
quantified by duration of mouth opening that lasted 10 minutes with1 µm GSH.

5
Maximal duration of mouth opening occurs at 5 µM GSH with a 50% response at 1
µM GSH (Grosvenor et al., 1996). After the 30-minute time lapse of hydra’s feeding
behavior, the mouth will slowly close. However, evidence has shown that the major
invertebrate inhibitory neurotransmitter, gamma-immuno butyric acid (GABA) at 100
µM, prolonged the duration of the response in which the time for the mouth to close
was increased (Pierobon et al., 1995). In addition, the major excitatory
neurotransmitter in the mammalian nervous system, glutamate has been shown to be
involved in this coordinated effect by increasing tentacle activity in the tentacle pulse
pacemaker system (TPs) (Kay and Kass-Simon, 2008); the GSH-induced feeding
behavior is dose dependent, saturable, and antagonized by L-glutamic acid (Lenhoff
and Bovaird, 1961; Bellis et al., 1991).
The hypostome (mouth) plays a signature role in executing this behavior.
Numerous sensory nerve cells surround the dome of the hypostome and the question
that has yet to be answered is what do these nerves do to open and close the mouth?
Labeling with L96+ antibody has indicated a specialized endodermal tissue type
separating the ectoderm from the endoderm in this specialized structure (Technau et
al., 1995). The hypostome’s ability to extend considerably during feeding behavior
without tearing is due to this one-cell thick ring of endodermal tissue between the
ectodermal and endodermal lining of the mouth (Technau et al., 1995). Scanning
electron microscopy of the internal lining of the hypostome has revealed that it has
endodermal cylindrical microvilli along the inside of the hypostome with protruding
flagella and microvilli extending towards the hypostomal, tentacle region (Wood,
1979). The microvilli in addition to the mucous producing endoderm along the inside

6
lining of the mouth may be chemoreceptive sites that initiate chemically mediated
behaviors (Kass-Simon and Hufnagel, 1992; Slautterback, 1967). In addition, an even
distribution of multiple synpases between epitheliomuscular cells and neurons were
found in the region between the hypostome and the tentacle area in the oral epidermis
(ectoderm)—suggesting delicate muscular control of the mouth opening/closing
behavior and its ability to engulf prey (Kinnamon and Westfall, 1982).
Previous studies identified a circular nerve ring surrounding the hypostome
(Westfall et al., 1974; Grimmelikhuijzen et al., 1985; Koizumi et al., 1992). However,
recent evidence has identified two centralized nerve rings found within the
hypostome—the proximal and distal nerve rings of the ectodermal layer representing a
simplified model of the mammalian brain; they are connected to one another by
radially anastomosing neurons (Hufnagel and Kass-Simon, unpublished). The
proximal nerve ring has been identified to run between, and slightly below the
tentacles (Hufnagel and Kass-Simon, unpublished) and is presumed responsible for the
body-contraction pacemaker impulses (Passano and McCullough, 1964; Kass-Simon,
1972, 1973). The proximal nerve ring receives neuronal and behaviorally-correlated
input from impulses arising in the tentacle pacemaker conducting system (Rushforth
and Burke, 1971; Kass-Simon, 1972, 1973; Hufnagel et al., 2009). There is also
recent evidence of an anti-GABAB receptor antibody labeling of the proximal nerve
ring suggesting the existence of GABAB receptor proteins occurring in Hydra (Kass-
Simon and Hufnagel, unpublished). Although the newly observed distal nerve ring,
located at the tip of the hypostome, is a loosely organized ring of interconnecting
neurons and is hypothesized to be responsible for coordinating hydra’s feeding

7
response—has not been found to label with anti-GABAB receptor antibody (Hufnagel
and Kass-Simon, unpublished). However, labeling of the endodermal layer of the
hypostome with anti-GABAB receptor antibody suggests possible involvement in
hydra’s mouth opening and closing behavior during feeding (Hufnagel and Kass-
Simon, unpublished).
Three main endogenous pacemaker systems work together to control the
behavior of Hydra—the ectodermal contraction burst system (CBs)—located in
between and just below the tentacles (Passano and McCullough, 1963, 1964), the
tentacle pulse system (TP)—located in the proximal part of each tentacle (Rushforth
and Burke, 1971; Kass-Simon, 1972, 1973), and the endodermal rhythmic potential
system—located near the base of the hydra (Passano and McCullough, 1962; Kass-
Simon and Passano, 1978).
During the initial stages of feeding behavior, Hydra’s tentacles writhe together.
In the presence of 10µM GSH in whole tentacle preparations, recordings from the
tentacles revealed that GSH inhibits the tentacle contraction pulse (TCP) system and
induces monophasic pulses. These pulses are suggestive of the characteristic writhing
movement of tentacles observable during feeding behavior (Rushforth and Burke,
1971). The TCP system produces bursts similar to that of the contraction burst system
and sometimes precede contraction burst pulses; the interpulse interval within a burst
of pulses decreases and then slowly increases. GABA and glutamate receptors are
also involved in modulating pacemaker activity in hydra (Kass-Simon et al., 2003).
Initial post-feeding behavior results in an increased frequency of tentacle pulses and
contraction bursts (Grosvenor et al., 1996). However, GABA alone decreases the

8
number of contraction bursts (CBs) and pulses per pacemaker burst (P/PBP) among
the ectoderm and rhythmic potentials (RPs) among the endoderm; GABA does not
affect the tentacle pacemaker system. The contraction burst system is conducted
through the body column and around the hypostome—resulting in a burst of pulses
parallel with a shortening of the body column and tentacular contractions (Kass-
Simon, 1972, 1973). The rhythmic potential system produces pulses that are
frequently not identifiable with any overt behavior of hydra although they increase in
frequency when the animal elongates. They are conducted in a regular pattern, on the
endoderm (Kass-Simon and Passano, 1978; Kass-Simon et al., 2003).
Multiple endogenous neurotransmitters have been discovered in hydra and may
be involved in the modulation of such an effect. Strychnine-sensitive glycine
receptors (glyRs) occur in hydra’s tissues and activation of these glyRs cause
increased prolongation to the GSH-induced feeding response. Glutamate, the major
excitatory neurotransmitter in the mammalian nervous system, has also been reported
in hydra’s tissues. In particular, biochemical and immunohistochemical studies have
identified the existence of GABA in hydra’s tissues. Pierobon et al. (1995) and
Concas et al. (1998), report high affinity specific binding of radiolabeled GABA to
hydra membranes—binding was displaced by the GABAA agonist, muscimol.
Specifically, co-application of 1 µM GABA and 100 nM pentobarbital (GABAA-
receptor modulator) to hydras caused a significant increase in the response to feeding
behavior (Pierobon et al., 2004)—suggesting that GABAA receptors may be involved
in the prolongation of hydra’s feeding behavior.

9
Widely expressed in the human body, GABA is involved in numerous
neurological and psychiatric functions. Studies on membrane preparation from rat
brain using selective drugs in pharmacology have identified at least two distinct
classes of GABA receptor—GABAA and GABAB—differing substantially in
electrophysiological properties (Olsen et al., 1999). The GABAA receptor complex
contains an integral Cl− ionophore, whereas GABAB receptors couple to Ca2+ and K+
channels via GTP-binding proteins (Bormann, 1988).
If GABA is involved in prolonging the duration of the response in which the
time for the mouth to close was increased, the question that needs to be answered is
what are the specific receptors involved in controlling this behavior?
Electrophysiological evidence demonstrates that GABA and glutamate differentially
affect hydra’s pacemaker systems and appear to do so by acting upon their
respective ionotropic receptors. Kass-Simon et al. (2003) report strong evidence
that GABA’s effects on the endodermal pacemaker systems are inhibitory, while
glutamate’s effects are excitatory; this evidence is consistent with the assigned roles
of glutamate and GABA in other systems—giving support for classical receptor-
mediated amino-acid transmission. Evidence exists supporting the inhibitory effect
of GABA by prolonging the GSH-induced mouth opening during feeding behavior
(Pierobon et al., 1995). Electrophysiological studies have shown that agonists and
antagonists to GABA affect the electrical activity in hydra— GABAA agonists
decreased the number of contraction bursts and rhythmic potentials; GABA
antagonists caused an increase in the frequency of rhythmic potentials and the
number of pulses per contraction burst (Kass-Simon and Pannaccione, unpublished;

10
Kass-Simon et al., 2003). There is also electrophysiology evidence showing the role
of NMDA and GABAB receptors involved in controlling nematocyst discharge in
hydra (Scappaticci and Kass-Simon, 2008). Nematocyst discharge was increased
with application of baclofen (GABAB agonist) and counteracted with phaclofen
(GABAB antagonist)—suggesting possible modulation of other chemosensory
behaviors within hydra.
A central problem concerning hydra’s feeding response is the question of
whether GABAB receptors might be involved in orchestrating the GSH induced
feeding behavior. The main question addressed in the present study is what is the
role of GABAB receptors in modulating the GSH electrical activity. In order to
determine the role of GABAB on the GSH induced impulses, GABAB agonists and
antagonists combined with GSH were used during electrical recording exploiting the
proximal and distal nerve rings of hydra—the bath applied method and the pipette
filled method, respectively. The experiments were carried out on isolated, reduced-
tentacle hypostomes.

11
MATERIALS AND METHODS
I. Animals
Hydra vulgaris, raised at 18 ± 1.0°C in bicarbonate versene culture solution
(BVC) consisting of 1x10⁻⁷M NaHCO3, 1x10⁻⁶M CaCl2, 1x10⁻⁸M EDTA (Loomis and
Lenhoff, 1956) at a pH between 6.8-7.2 were selected at random, 24 ± 2 hours after
having been fed with brine shrimp ad liberatum. Hydra exhibit increased contractile
behaviors after having been fed (Passano and McCullough, 1964; Grosvenor et al.,
1996) and thus were consistently selected, prepped and used for recordings at the
allotted time. Hydra heads and tentacles were ablated from the body of the
experimental animals; tentacles were allowed to fully relax to maximal expansion and
were carefully cut below the tentacle insertion region, taking care to leave intact the
contraction burst pacemaker region located at the origin of the tentacle insertion site;
the excised heads were allowed to heal for 24 ± 2 hours before electrical recordings
(Figure 1)—small regenerated tentacle buds (not exceeding 1 mm) were evident at
time of recording (Figure 2).
II. Recording Methods
Electrical recordings were conducted at 22 ± 2.0°C, under red light on a low
setting (Dolan-Jenner Industries, Inc. Fiber-Lite 190 Lamp with a red filter). The light
was turned on before the start of recording. Earlier work had indicated that red light
did not affect the pacemaker-controlled behavior of hydra (Passano and McCullough,
1962; 1964) and that hydras were unresponsive to red light (Wilson, 1891; Haug,
1933). However, recent evidence in our laboratory indicated that tentacles are
sensitive to red light—increasing the frequency of their contractions relative to

12
darkness (Guertin and Kass-Simon, 2015). Nonetheless, since all of the present
experiments were conducted in constant red light, light exposure would not have
affected our experimental results.
The electrical recording protocol was modified from the procedures of Passano
and McCullough, 1964, Kass-Simon et al., 2003, Ruggieri et al., 2004, Kay and Kass-
Simon, 2009. Extracellular recordings were made with a suction electrode attached
directly at the mouth opening of the hypostome of the hydra. Recordings were begun
as soon as the hypostome was attached. Impulses from the suction electrode were
delivered to the head stage of an AM systems, Model 3000 AC/DC differential
amplifier, converted to digital output with Power Lab and visualized using LabChart 7
software (AD Instruments) on a MacBook Pro. During recording, the preparations
were observed through a dissecting microscope at 100X magnification.
III. Ligands. The following ligands were used: reduced glutathione (GSH), GABA,
and the GABAB agonists and antagonists, baclofen and phaclofen. Test substances
were made fresh at 10-fold their final concentration and were subsequently diluted.
Two methods were used to apply ligands to the hypostome.
a) Bath-applied Ligand: One tentacle-free hypostome was placed in a 10 mL
petri dish with 7 mL BVC. A suction electrode was attached over the apex of the
mouth. The recording protocol was as follows: a ten-minute BVC control period
followed by a ten minute treatment period at the beginning of which 1 mL GSH at
4x10⁻⁶ M and/or neuro-transmitter ligand was added to the bath with a 1.0 mL syringe
(Figure 3). Each ten-minute period was subdivided into two periods, control period 1

13
(C1) and control period 2 (C2), treatment period 1 (T1) and treatment period 2 for
statistical analysis. The first thirty seconds of each experimental sub-period was
omitted in the analysis to allow the preparation to adapt. C1 (acclimation period) was
eliminated from statistical analysis. Thus, comparisons were made for 4.5 minutes in
C2, T1, and T2 (Figure 4).
b) Pipette-filled Ligand: One tentacle-free hypostome was placed in a 10 mL
petri dish containing 7 mL BVC. The stopcock on the electrode holder was opened
and a test substance was drawn into the pipette tip under slight negative pressure prior
to hypostome attachment. The stopcock was then closed, so that no liquid leaked from
the pipette. Visual examination of the pipette tip ensured that the fluid level within the
pipette tip remained unchanged as the tip was placed onto a hypostome in the BVC-
containing dish. By opening the stopcock, the slight negative pressure in the pipette
allowed a hypostome to be attached to the pipette tip. The stopcock was then closed
preventing further leakage and/or suctioning of BVC into the pipette tip (Figure 5).
Recordings began as soon as the hypostome was attached and lasted for 10 minutes
with the thirty seconds (acclimation) omitted from analysis. The remaining recording
time was divided into two treatment periods (T1, T2) for analysis with the first 30
seconds from treatment period (T1) omitted. The BVC control period, C1 and C2-
The C1 and C2 of the bath-applied ligand experiments, at 30 sec after attachment
(above), were used as the controls for T1 and T2, respectively. Thus, comparisons
were made for 4.5 minutes in C1, C2, T1, and T2 (Figure 6).
The following agonists and antagonists were used: L-glutathione reduced
(GSH), gamma-amino butyric acid (GABA), baclofen, and phaclofen. All substances

14
were purchased from Tocris Cookson Inc. (Ballwin, MO, USA), except GABA, and
GSH, which were purchased from Sigma-Aldrich (St Louis, MO, USA). The
following single treatment and combination experiments in final concentrations were
performed: GSH (1x10⁻⁶M), GSH (5x10⁻⁷M), GSH (1x10⁻⁸M), GSH (5x10⁻⁷M)+
GABA (1x10⁻⁶M), GSH (5x10⁻⁷M) + Phaclofen (1x10⁻⁸M), GSH (5x10⁻⁷M) +
Baclofen (1x10⁻⁸M), GSH (5x10⁻⁷M) + Phaclofen (1x10⁻⁸M) + Baclofen (1x10⁻⁸M).
Doses of Phaclofen, Baclofen, and GABA used in combination experiments were
chosen from previous electrophysiology experiments (Nandivada and Kass-Simon,
unpublished; Pierobon et al., 2003, Scappaticci et al., 2004).
IV. Data Analysis
As stated above, because the prolonged ten-minute treatment could have
resulted in either desensitization, or have been necessary for the substances to take
effect and/or reach their site of action, each ten-minute period was subdivided into two
4.5-minute periods for data analysis. In the bath-applied method, the first 30 seconds
was eliminated in each sub-period to allow for acclimation—treatment 1 (T1) and
treatment 2 (T2).
For each ligand series, at least seven animals were used. The following
comparisons were made in the bath-applied method: C2 vs. T1, C2 vs. T2, T2 vs. T1.
The following comparisons were made in the pipette-applied method: C1 vs. T1, C1
vs. T2, C2 vs. T1, C2 vs. T2 and T2 vs. T1. In the bath-applied series, each set of
animals (in the testing periods T1 and T2) was compared against its own BVC control
period BVC (C2). In the pipette-filled series, each set of test periods- (T1, T2) for 7
15
preparations was respectively compared to the set of 7 (C1) and (C2) control periods
of the bath-applied series as described above.
The following parameters were measured for each 4.5-min period: frequency of
small uncorrelated hypostomal pulses (SUHPs, 30-300 µV), medium uncorrelated
hypostomal pulses (MUHPs, 301-570 µV), large uncorrelated hypostomal pulses
(LUHPs, 571-800 µV), extra-large uncorrelated hypostomal pulses (≥ 801 µV),
rhythmic potentials (RPs), pacemaker bursting pulses (PBPs) and pulses per
pacemaker bursts pulse (P/PBP). Pulses were measured from peak to peak. PBPs and
P/PBPs (subset of MUHPs, LUHPs and XLUHPs) were visually identified by their
characteristic bursting pattern. RP’s (subset of SUHPs) were identified by their
regular recurrence pattern (Passano and McCullough, 1962; Guertin and Kass-Simon,
2015).
Pulses were binned using the Spike Histogram module on Lab Chart 7 (AD
Instruments). The sub-period being analyzed (C1, C2, T1, T2) was highlighted and
selected for analysis. Using the spike train-setup prompt, a train parameter was
created. The pulses were binned using arbitrary size categories. The pulse, spike
detector was set to 80.1 mV, 57.1 mV, 30.1 mV, and 3.0 mV to identify the number of
pulses including and greater than the set voltage for the selected 4.5-min period. To
identify the number of pulses between 30-300 µV (SUHPs), the number of pulses
generated for 30.1 mV was subtracted from 3.0 mV. To identify the number of pulses
between 301-570 µV (MUHPs), the number of pulses generated for 57.1 mV was
subtracted from 30.1 mV. To identify the number of pulses between 571-800 µV
(LUHPs), the number of pulses generated for 80.1 mV was subtracted from 57.1 mV.

16
To identify the number of pulses equal and greater to 801 µV (XLUHPs), the number
of pulses generated for 80.1 mV was reported.
Data analysis was similar to that used in previous electrophysiology studies (Kay
and Kass-Simon, 2009; Ruggeri et al., 2004; Guertin and Kass-Simon, 2015). A
Friedman Two-Way Analysis of Variance (FANOVA) for each parameter was used in
R (Revolution Analytics) to determine differences among the designated recording
periods in each class of treatments in the bath-applied method and in the pipette-
applied method. Significant differences were further analyzed using the Friedman-
test-with-post-hoc command for multiple comparisons.
In order to determine the effect of GSH concentrations (5x10⁻⁸, 5x10⁻⁷, 5x10⁻⁶) on
the parameters measured, T1 + T2 were added together in the bath-applied method and
in the pipette-applied method. The treatment periods for each concentration were
compared with FANOVAs for each parameter measured. Significant differences were
analyzed with post-hoc analysis. Thus, comparisons were made between (GSH 5x10-
8, GSH 5x10⁻⁷, GSH 5x10⁻⁶) in the bath-applied method and in the pipette-applied
method.
In post-hoc analysis, to determine whether the treatments in the bath-applied
method were significantly different from those in the pipette-applied method,
comparisons were made as follows: For each set of trials in which T1 and T2 were not
significantly different from each other either in the bath-applied or pipette-applied
method, T1+T2 were added to create the parameter Tb (bath applied) and Tp (pipette
applied) which were compared with the Welch two-sample t-tests for SUHPs, MUHPs
LUHPs, XLUHPs, PBPs, P/PBPs and RPs. In those cases where T1 and T2 were

17
significantly different from each other in either method, T1 of the bath-applied method
was compared to T1 of the pipette-applied method and T2 of the bath-applied was
compared to T2 of the pipette-applied method. SUHPs, MUHPs, LUHPs, XLUHPs
and PBPs are presented as medians ± inter-quartile ranges (m ± i.q.r.) and as means ±
standard deviations (µ ± s.d.). P/PBP are the average number of pulses per
pacemaker burst and are calculated by taking the total number of pulses in each PBP
and dividing the total by the number of PBPs in that period. RPs and P/PBP are
reported as medians ± inter-quartile ranges (m ± i.q.r) and as means ± standard
error (µ ± s.e.). Values were considered to be significantly different at P< 0.5, with a
potentially significant trend at 0.05<P<0.1 (Guertin and Kass-Simon, 2015).
18
RESULTS
I. Effect of GSH Concentration
a) Bath-applied
GSH at 5x10⁻⁶M (Fig. 4) caused significant increases in SUHPs in treatment
period (T1) and (T2) relative to BVC control period (C2) (SUHPs: Table 1a, T1>C2*,
p≤0.0426, T1>C2*, p≤0.0428). GSH at 5x10⁻⁶M caused significant increases in
MUHPs in treatment period (T1) relative to BVC control period (C2) (MUHPs: Table
2a, T1>C2*, p≤0.00505). GSH at 5x10⁻⁶M caused significant increases in PBPs and
P/PBPs in treatment period (T1) relative to BVC control period (C2) and potentially
significant increases in treatment period (T2) relative to (C2) (PBPs: Table 5a,
T1>C2*, p≤0.0152, T2>C2^, p≤0.0537; P/PBPs: Table 6a, T1>C2*, p≤0.0151,
T2>C2^, p≤0.0538). GSH at 5x10⁻⁷M caused significant increases in SUHPs in
treatment period (T1) relative to BVC control period (C2) (SUHPs: Figure 7, Table 1a,
T1>C2*, p≤0.00984). GSH at 5x10⁻⁷M caused significant decreases in XLUHPs in
treatment period (T2) relative to BVC control period (C2) and potentially significant
decreases in treatment period (T2) relative to treatment period (T1) (XLUHPs, Figure
8, Table 4a, T2<C2*, p≤0.0428, T2<T1^, p≤0.0612). GSH at 5x10⁻⁸M caused
potentially significant decreases in LUHPs and RPs in treatment period (T2) relative
to BVC control period (C2) (LUHPs, Table 3a, T2<C2^, p≤0.0693; RPs, Table 7a,
T2<C2^, p≤0.0751). GSH at 5x10⁻⁸M caused significant decreases in MUHPs in
treatment period (T2) relative to treatment period (T1) (MUHPs, Table 2a, T2<T1*,
p≤0.0266). GSH at 5x10⁻⁸M caused significant increases in PBPs in treatment period
(T2) relative to BVC control period (C2) (PBPs: Table 5a, T2>C2*, p≤0.0327).

19
There was a significant increase in frequency of SUHPs in GSH 5x10⁻⁶ relative
to GSH 5x10⁻⁷ (Figure 9, Table 16a, p≤0.00195*) and a potentially significant
increase in SUHPs in GSH 5x10⁻⁸ relative GSH 5x10⁻⁷ (Figure, 9, Table 16a,
p≤0.0604^)—suggesting that the higher and lower concentrations of GSH were able to
induce smaller, neuronal pulses. There were no significant differences in LUHPs or
XLUHPs at these concentrations (Figure 10, Table 16a). There was a significant
increase in PBPs and P/PBPs in GSH 5x10⁻⁸ relative to GSH 5x10⁻⁶ (Figure 11,
Table 16a, PBPs: p≤0.0444*, P/PBPs: p≤0.0184*)—suggesting that the stronger
concentration of GSH may saturated receptors, decreasing larger muscle pulses
associated with contraction bursts. There was a significant increase in RPs in GSH
5x10⁻⁶ relative to GSH 5x10⁻⁷ (Figure 9, Table 16a, RPs: p≤0.0104*)—suggesting
that the stronger concentration of GSH induced small, RPs.
b) Pipette-Applied
GSH at 5x10⁻⁶M caused significant decreases in XLUHPs in treatment period
(T2) and (T1) relative to BVC control periods (C1) and (C2) (XLUHPS: Table 4b,
T1<C1*, p≤0.0323; T2<C1*, p≤0.0323; T1<C2*, p≤0.0171; T2<C2*, p≤0.0169).
GSH at 5x10⁻⁷M caused potentially significant increases in MUHPs in treatment
period (T1) relative to BVC control period (C2) (MUHPs: Figure 12, Table 2b,
T1>C2^, p≤0.0741). GSH at 5x10⁻⁸M caused significant decreases in P/PBPs in
treatment period (T1) relative to BVC control period (C1) (P/PBPs: Table 6b,
T1<C1*, p≤0.0157).
There was a significant decrease in LUHPs, XLUHPs, PBPs and P/PBPs in GSH
5x10⁻⁶M relative to GSH 5x10⁻⁷M (LUHPs: Figure 13, Table 16b, p≤0.0324*;

20
XLUHPs: Figure 13, Table 16b, p≤0.0140*; PBPs: Figure 14, Table 16b, p≤0.0483*;
P/PBPs: Figure 14, Table 16b, p≤0.0379*). There were no significant differences in
SUHPs, MUHPs or RPs at these concentrations (Figure 15, Table 16b).
II. Effect of GABA on GSH-elicited potentials
a). Bath-applied
GABA at 1x10⁻⁶M combined with GSH at 5x10⁻⁷M produced no significant
differences in the rates of any of the six parameters being measured, compared to plain
BVC control periods (p>0.1) (Figure 7, 8, 16-20, Table 1a-7a).
b). Pipette-applied
GABA at 1x10⁻⁶M combined with GSH at 5x10⁻⁷M caused significant
increases in LUHPs and potentially significant increases in P/PBPs in treatment period
(T2) relative to BVC control period (C2) (LUHPs: 21, Table 3b, T2>C2*, p≤0.0440;
P/PBPs: Figure 22, Table 6b, T2>C2^, p≤0.0569). GABA at 1x10⁻⁶M combined with
GSH at 5x10⁻⁷M caused significant increases in XLUHPs in treatment period (T1)
relative to BVC control period (C1) (XLUHPs: Figure 23, Table 4b, T1>T1*,
p≤0.0450). GABA at 1x10⁻⁶M combined with GSH at 5x10⁻⁷M caused significant
increases in RPs in treatment period (T1) relative to BVC control period (C2) (RPs:
Figure 24, Table 7b, T1>C2*, p≤0.03235).
Although GABA at 1x10⁻⁶M combined with GSH at 5x10⁻⁷M produced no
significant differences in the rates of any of the parameters measured in the bath-
applied method, GABA at 1x10⁻⁶M combined with GSH at 5x10⁻⁷M increased four of
the seven parameters measured in the pipette-applied method—LUHPs, XLUHPs,

21
PBPs and RPs (Figure 25) (Table 3b, 4b, 5b, 7b). The number of pulses produced for
the parameters MUHPS, LUHPs, XLUHPs, PBPs, P/PBPs and RPs in the pipette-
applied method was also significantly greater relative to the pipette-applied method.
III. Effect of Baclofen on GSH-elicited potentials
a). Bath-applied
Baclofen, administered at 1x10⁻⁸M in the presence of 5x10⁻⁷M GSH, caused a
potentially significant increase in MUHPs in T2 relative to BVC control period (C2)
(MUHPs: Figure 16, Table 2a T2>C2^ p≤0.0798).
b). Pipette-applied
Baclofen, administered at 1x10⁻⁸M in the presence of 5x10⁻⁷M GSH caused
significant decreases in SUHPs in treatment period (T2) relative to BVC control
periods (C1) and (C2) and potentially significant decreases in treatment period (T1)
relative to BVC control period (C1) (SUHPs: Figure 26, Table 1b, T1<C1^,
p≤0.06227, T2<C1*, p≤0.00236, T2<C2*, p≤0.00536). Baclofen, administered at
1x10⁻⁸M in the presence of 5x10⁻⁷M GSH caused significant decreases in XLUHPs in
treatment period (T2) relative to BVC control period (C1) and (C2) and caused
significant decreases in XLUHPs in treatment period (T1) relative to BVC control
period (C2) (XLUHPs: Figure 23, Table 4b: T2<C1*, p≤0.0413; T2<C2*, p≤0.0109;
T1<C2*, p≤0.0414). Baclofen, administered at 1x10⁻⁸M in the presence of 5x10⁻⁷M
GSH caused significant decreases in P/PBPs in treatment period (T1) and (T2) relative
to BVC control period (C1) (P/PBPs: Figure 22, Table 6b, T1<C1*, p≤0.00827,
T2<C1*, p≤0.0439).

22
Baclofen, administered at 1x10⁻⁸M in the presence of 5x10⁻⁷M GSH caused
significant decreases in SUHPs in the bath-applied method (Table 1a), however,
baclofen, administered at 1x10⁻⁸M in the presence of 5x10⁻⁷M GSH caused significant
increases in SUHPs, XLUHPs, and P/PBPs in the pipette-applied method (Figure 27,
Table 1b, 4b, 6b). In addition, the pipette-applied method produced significantly more
SUHPs relative to the bath-applied method (Table 8).
IV. Effect of Phaclofen on GSH-elicited potentials
a). Bath-applied
Phaclofen, administered at 1x10⁻⁸M in the presence of 5x10⁻⁷M GSH, caused a
potentially significant decrease in SUHPs in T2 relative to BVC control period (C2)
(SUHPs: Figure 7, Table 1a, T2<C2^ p≤0.0784).
b). Pipette-applied
Phaclofen, administered at 1x10⁻⁸M in the presence of 5x10⁻⁷M GSH caused
potentially significant increases in LUHPs in treatment period (T2) relative to BVC
control period (C2) (LUHPs: Figure 21, Table 3b, T2>C2^, p≤0.0734). Phaclofen,
administered at 1x10⁻⁸M in the presence of 5x10⁻⁷M GSH caused significant decreases
in XLUHPs in (XLUHPs, Figure 23, Table 4b, T2<T1*, p≤0.00821) and potentially
significant decreases in PBPs in treatment period (T2) relative to treatment period (T1)
(PBPs: Figure 28, Table 5b, T2<T1^, p≤0.0709).
Phaclofen, administered at 1x10⁻⁸M in the presence of 5x10⁻⁷M GSH caused
potentially significant decreases in SUHPs in the bath-applied method (Table 1a).
Phaclofen, administered at 1x10⁻⁸M in the presence of 5x10⁻⁷M GSH caused increases

23
in LUHPs but decreases in XLUHPs and PBPs in the pipette-applied method (Table
3b, 4b, 5b). Phaclofen, inhibits, the inhibition produced by the GABA mechanism. In
addition, Phaclofen administered along with GSH 5x10⁻⁷M caused significantly
higher SUHPs, MUHPs and LUHPs in the pipette-applied method relative to the bath-
applied method (Figure 29, Table 8, 9, 10). In the case where treatment period 1 (T1)
was different from treatment period 2 (T2) for PBPs, the pipette-applied method
caused potentially significant increases in PBPs relative to the bath-applied method
(Table 15c).
V. Effect of Baclofen and Phaclofen on GSH-elicited potentials
a). Bath-applied
Baclofen, at 1x10⁻⁸M, added with 1x10⁻⁸M Phaclofen and 5x10⁻⁷M GSH
caused a significant decrease in MUHPs and RPs in T2 relative to BVC control period
(C2) (MUHPs: Figure 16, Table 2a, T2<C2*, p≤0.00379; RPs: Figure 20, Table 7a,
T2<C2*, p≤0.00969).
b). Pipette-applied
Baclofen, at 1x10⁻⁸M, added with 1x10⁻⁸M Phaclofen and 5x10⁻⁷M GSH
caused significant decreases in SUHPs in treatment period (T2) relative to BVC
control periods (C1) and (C2) (SUHPs: Figure 26, Table 1b, T2<C1*, p≤0.0106,
T2<C2*, p≤0.0196).
Baclofen, at 1x10⁻⁸M, added with 1x10⁻⁸M Phaclofen and 5x10⁻⁷M GSH
caused decreases in MUHPs and RPs in the bath-applied method (Table 2a, 7a) and
decreases in SUHPs in the pipette-applied method (Table 1b). In addition, Baclofen,

24
at 1x10⁻⁸M, added with 1x10⁻⁸M Phaclofen and 5x10⁻⁷M GSH caused significantly
higher MUHPs, LUHPs, PBPs and P/PBPs in the pipette-applied method relative to
the bath-applied method (Figure 30, Table 9, 10, 12, 13).
VI. Comparison of Responses in Bath-applied method vs. pipette applied method
where treatment period 1 (T1) was the same relative to treatment period 2 (T2)
a). Effect of the bath-applied method vs. pipette-applied method on GSH Dose
Response
GSH at 5x10⁻⁶M caused potentially significant increases in SUHPs and
significantly increased the amount of XLUHPs in the bath-applied treatment (Tb)
relative to the pipette-applied treatment (Tp) (SUHPS: Table 8, Tb>Tp^, p≤0.0702;
XLUHPs: Table 11, Tb>Tp*, p≤0.0265). GSH at 5x10⁻⁶M caused significant
decreases in PBPs and P/PBPs in the bath-applied treatment relative to the pipette-
applied treatment (PBPs: Table 12, Tb<Tp*, p≤0.00649; P/PBPs: Table 13, Tb<Tp*,
p≤0.00256). GSH at 5x10⁻⁷M caused significant decreases in SUHPs, LUHPs, PBPs,
P/PBPs and RPs in the (Tb) relative to the (Tp) (SUHPs, Table 8, Tb<Tp*, p≤0.0126;
LUHPs, Table 10, Tb<Tp*, p≤0.0146; PBPs, Table 12, Tb<Tp*, p≤0.00369; P/PBPs,
Tb<Tp*, p≤0.005567; RPs, Table 14, Tb<Tp*, p≤0.0254). GSH at 5x10⁻⁸M caused
potentially significant decreases in PBPs in (Tb) relative to (Tp) (PBPs: Table 12,
Tb<Tp*, p≤0.0982).
Thus, increased level of electrical activity in the parameters measured was
greater in the pipette-applied method relative to the bath-applied method.

25
b). Effect of the bath-applied method vs. pipette-applied method on GABA-elicited
GSH-potentials
GABA at 1x10⁻⁶M combined with GSH at 5x10⁻⁷M caused significant
decreases in XLUHPs, PBPs, P/PBPs and RPs in the treatment bath-applied (Tb)
relative to the treatment pipette-applied (Tp) (XLUHPs: Table 11, Tb<Tp*,
p≤0.000182; PBPs: Table 12, Tb<Tp*, p≤0.0000499; P/PBPs: Table 13, Tb<Tp*,
p≤0.0326; RPs: Table 14, Tb<Tp*, p≤0.00657).
Thus, the increased level of activity in the parameters measured was greater in
the pipette-applied method relative to the bath-applied method.
c). Effect of the bath-applied method vs. pipette-applied method on Baclofen-elicited
GSH-potentials
Baclofen, administered at 1x10⁻⁸M in the presence of 5x10⁻⁷M GSH caused
significant decreases in SUHPs in the treatment bath-applied (Tb) relative to the
treatment pipette-applied (Tp) (SUHPs: Table 8, Tb<Tp*, p≤0.00364).
Small pulses with no observable pattern in behavior may be produced by the
endoderm located in the hypostome associated with elongation of the mouth during
feeding. Baclofen caused significant increases in small pulses (SUHPs) in the pipette-
applied method relative to the bath-applied method where GABA is also found to be
working, suggesting that there are more GABA B receptors at the apex.
d). Effect of the bath-applied method vs. pipette applied method on Phaclofen-elicited
GSH-potentials
Phaclofen, administered at 1x10⁻⁸M in the presence of 5x10⁻⁷M GSH caused
significant decreases in SUHPs, MUHPs and LUHPs in the treatment bath-applied

26
(Tb) relative to the treatment pipette-applied (Tp) (SUHPs: Table 8, Tb<Tp*,
p≤0.00758; MUHPs, Table 9, Tb<Tp*, p≤0.00309; LUHPs: Table 10, Tb<Tp*,
p≤0.0119).
Thus, increased level of electrical activity in the parameters measured was
greater in the pipette-applied method relative to the bath-applied method.
e). Effect of the bath-applied method vs. pipette-applied method on Baclofen and
Phaclofen-elicited GSH-potentials
Baclofen, at 1x10⁻⁸M, added with 1x10⁻⁸M Phaclofen and 5x10⁻⁷M GSH
caused potentially significant decreases in MUHPs and significant decreases in
LUHPs, PBPs and P/PBPs in treatment bath-applied (Tb) relative to treatment pipette-
applied (Tp) (MUHPs: Table 9, Tb<Tp^, p≤0.0702; LUHPs: Table 10, Tb<Tp*,
p≤0.00943; PBPs: Table 12, Tb<Tp*, p≤ 2.60x10⁻⁶; P/PBPs: Table 13, Tb<Tp*,
p≤0.00272).
Baclofen, coadministered with Phaclofen and GSH caused significantly more
medium, large, pacemaker bursting pulses and pacemaker per pacemaker bursting
pulses in the pipette-applied method relative to the bath-applied method. GSH
administered alone caused significant increases in medium and larger pulses. Larger
pulses may be associated with mouth contractions observed prior to mouth opening,
after mouth elongation.

27
VII. Comparison of Responses in bath-applied method vs. pipette applied method
where treatment period 1 (T1) was different relative to treatment period 2 (T2)
a). Effect of XLUHP responses using GSH 5x10⁻⁷M in the bath-applied method vs.
pipette-applied method
GSH 5x10⁻⁷M produced more XLUHPs in treatment period (T2p) for the
pipette-applied method than the treatment period (T2b) for the bath-applied method
(Table 15a, T2p>T2b*, p≤0.0469).
XLUHPs may be produced by the ectoderm, associated with mouth
contractions. Thus, GSH increasing the amount of contractile activity in pipette-
applied method relative to the bath-applied method as well as in the latter treatment
period may indicate initial mouth elongation followed by secondary mouth
contractions associated with hydra’s feeding behavior prior to mouth opening.
b). Effect of MUHP responses using GSH 5x10⁻⁸M the bath-applied method vs.
pipette-applied method
GSH at 5x10⁻⁸M produced no significant increases or decreases in MUHPs in
the treatment period (T1p) for the pipette-applied method relative to the treatment
period (T1b) for the bath-applied method. GSH at 5x10⁻⁸M produced no significant
increases or decreases in MUHPs in the treatment period (T2p) for the pipette-applied
method relative to the treatment period (T2b) for the bath-applied method (Table 15b).

28
c). Effect of PBP responses using GSH 5x10⁻⁷M administered with Phaclofen 1x10-
8M in the bath-applied method vs. pipette-applied method
GSH 5x10⁻⁷M administered with Phaclofen 1x10⁻⁸M produced potentially
more PBPs in the treatment period (T1p) for the pipette-applied method than the
treatment period (T1b) for the bath-applied method (T1P>T1B, p≤0.0617). GSH
5x10⁻⁷M administered with Phaclofen 1x10⁻⁸M for PBPs is the same in the treatment
period (T2p) for the pipette-applied method as the treatment period (T2b) for the bath-
applied method (Table 15c).

29
DISCUSSION
In determining the electrical correlates associated with mouth opening and
closing behavior, one must first consider the changing anatomical structure observable
during this behavior. Of the many behaviors exhibited by hydra during feeding, one
of the first is the elongation of the hypostome. As tentacle writhing is activated, the
cone-shaped hypostome elongates as the tentacles begin to direct the prey homogenate
towards the mouth opening. The mouth rapidly opens and contractile motions of the
hypostome follow. It is hypothesized that the smaller pulses (SUHPS, RPs, MUHPs
and LUHPs) may be involved in the initial opening of the hypostome and the larger
bursting pulses (XLUHPs, PBPs and P/PBPs) may be involved in the observed
contraction of the hypostome.
In studies on Hydra, the question of the role of neurotransmitters in modulating
the GSH-induced feeding response has been raised. This study presents
electrophysiology evidence of the GSH-induced feeding response in Hydra and
evidence that in Hydra, GABA, acting through an inhibitory mechanism, inhibits
cessation of the GSH-induced feeding response—prolonging hypostomal activity.
Although it is not possible to specifically discern where the receptor ligands are
affecting the pacemaker systems, the above findings support previous studies on
GABA receptor ligands altering hydra’s pacemaker activity (Concas et al., 1998;
Kass-Simon et al, 2003; Kass-Simon and Scappaticci, 2004; Kass-Simon and
Scappaticci, 2008).
In order to find out the exact role of GABA in modulating the GSH-induced
feeding response, we recorded from reduced-tentacle hypostomes. At the apex of the

30
hypostome, there are sensory cells; distributed perpendicular to the apex of the
hypostome, there are ganglion cells. The large putative hypostomal contraction
pacemaker pulses may be produced by pacemaker neurons associated with the
proximal nerve ring (Kass-simon, 1972, Hufnagel and Kass-Simon unpublished) and
the epithelial muscular cells. The small, uncorrelated hypostomal pulses do not make
patterns and appear to be neuronal and part of the hypostomal nerve net. The medium,
uncorrelated hypostomal pulses may or may not be a subset of the large, uncorrelated
hypostomal pulses because they do not fall into a bursting pattern. The rhythmic
potentials have previously been found to be conducted on the endoderm and are
associated with the contraction of the circular endodermal epithelial muscle cells
(Kass-Simon and Passano, 1978). The small, uncorrelated hypostomal pulses binned
in the present analysis include the frequency of rhythmic potentials.
We hypothesize that GSH induces the subtentacular pacemaker system located at
or near the proximal nerve ring due to the increased level of extra-large uncorrelated
hypostomal pulses (XLUHPs) in the bath-applied method—not observed during the
pipette-applied method. Pacemaker activity, at the site of a loosely involved nerve
ring under the tentacles can be GSH-induced. GABA, through its inhibitory
mechanism, may be inhibiting some neuron that was previously inhibiting the GSH
response.
I. Effect of GSH Concentration
In the bath-applied method, GSH increased small-uncorrelated pulses,
(SUHPs), medium-uncorrelated pulses (MUHPs), pacemaker bursting pulses (PBPs)

31
and pulses per pacemaker bursting pulse (P/PBPs). In the pipette-applied method
GSH did not affect SUHPs but increased MUHPs and decreased XLUHPs and
P/PBPs; this supports previously observed GSH induced cone-formation of the
hypostome, now hypothesized to be reflected in the increase in medium sized pulses
(MUHPs) and the concurrent inhibition of body contraction (considered to be
mediated by XLUHPs and PBPs which are presumed to include neuroeffector
responses to the activity of the proximal nerve ring and pacemaker system. The
absence of activity attributed to rhythmic potentials in this finding is supported by
previous studies in that the contraction burst system (ectodermal pulses) may inhibit
the RP system (Passano and McCullough, 1963; Taddei-Ferretti and Chillemi, 1987).
Kass-Simon et al., 1975 showed a morphological basis for the communication
between the endoderm and the ectoderm through gap junctions, and thus, the
ectodermal contraction burst system communicates with the endodermal rhythmic
potential system such that the CB system will contract and inhibit the RP system until
the contraction is over and an RP results. It is our hypothesis that the PBP system is a
subset of the CB system. That both PBPs and P/PBPs were affected suggests that an
entire PBP system in the hypostome may exist and has been essentially activated.
Comparison of responses in bath-applied method vs. pipette-applied method revealed
that GSH at 5x10⁻⁷ caused significantly more pulses in the pipette-applied method
where the base of the hypostome was blocked, and ligand administration was directly
at the apex of the mouth. Whether the mouth opened during recording is unknown.
Thus, the increased level of electrical activity in the parameters measured and
compared in the pipette-applied method relative to the bath-applied method support

32
the hypothesis that the receptors for GSH may be located towards the distal portion of
the mouth near the apex of the hypostome.
II. Effect of GABA on GSH-elicited potentials
The administration of GABA with GSH yielded no activity in the bath-applied
method where the mouth of the hypostome was blocked. However, GSH administered
with GABA in the pipette-applied method where ligand was in direct contact with the
mouth opening produced increased larger pulse activity and rhythmic potentials. The
prolonged GSH-induced electrical activity by GABA and subsequent increased larger
bursting pulses suggests that GABA essentially inhibited the cessation of the GSH-
induced pacemaker activity. Comparison of responses in the parameters measured
yielded higher activity in the pipette-applied method relative to the bath-applied
method. This supports the hypothesis that GABA is acting at the distal portion or
apex of the hypostome.
III. Effect of Baclofen on GSH-elicited potentials
Baclofen, administered at 1x10⁻⁸M in the presence of 5x10⁻⁷M GSH caused
significant decreases in SUHPs in the bath-applied method. Baclofen, administered at
1x10⁻⁸M in the presence of 5x10⁻⁷M GSH where ligand was in direct contact with
mouth opening caused significant increases in SUHPs, XLUHPs, and P/PBPs in the
pipette-applied method. This suggests that there are metabotropic GABAB neuronal
receptors on the hypostomal nerve net, which include neurons of the pacemaker
systems that mediate cone formation and hypostomal and body contractions. Baclofen
caused significant increases in small pulses (SUHPs) in the pipette-applied method

33
relative to the bath-applied method where GABA is also found to be working. These
small pulses with no observable pattern in behavior may be produced by the endoderm
located in the hypostome associated with elongation of the mouth during feeding.
This outcome is supported by recent findings in which the endodermal layer of the
hypostome was labeled with anti-GABAB receptor antibody (Hufnagel and Kass-
Simon, unpublished).
IV. Effect of Phaclofen on GSH-elicited potentials
Phaclofen, administered at 1x10⁻⁸M in the presence of 5x10⁻⁷M GSH caused
potentially significant decreases in SUHPs in the bath-applied method, supporting the
idea that neuronal metabotropic GABAB receptors are distributed around the
hypostome. Phaclofen caused significantly higher small, medium, and large pulses in
the pipette-applied method relative to the bath-applied method, indicating that GABAB
receptors at the mouth or the lining of the mouth inhibit mouth closure and that these
pulses are inhibited by the GABAB antagonist, phaclofen. Thus, phaclofen may block
the inhibitory mechanism caused by GABA and it’s agonist, baclofen, by decreasing
the amount of small, medium and large pulses associated with mouth elongation
during hydra’s feeding behavior.
V. Effect of Baclofen and Phaclofen on GSH-elicited potentials
Baclofen, coadministered with phaclofen and GSH caused significantly more
medium, large, pacemaker bursting pulses and pacemaker per pacemaker bursting
pulses in the pipette-applied method relative to the bath-applied method. GSH
administered alone caused significant increases in medium and larger pulses. Larger

34
pulses may be associated with mouth contractions observed secondary to mouth
elongation but prior to mouth opening. Thus, baclofen together with phaclofen may
wipe out the inhibitory mechanism of GABA prolonging the cessation of the feeding
behavior by producing more medium to larger pacemaker bursting pulses in the
pipette-applied method relative to the bath-applied method where more pacemaker
cells may be located relative to the newly observed distal nerve ring.
Although GABA combined with GSH produced no significant differences in
the frequency of any of the parameters measured in the bath-applied method,
coadministration of GSH and GABA alone increased LUHPs, XLUHPs, PBPs and
RPs in the pipette-applied method (Figure 25). The results support the behavioral
observations that GABA inhibits the cessation of the GSH-induced feeding response
and indicates that GSH and GABA receptors are differentially distributed in the
hypostome. It is also possible to conclude that GABA acting through its metabotropic
receptors is inhibiting the GSH-induced feeding response by altering the underlying
GSH-induced electrical activity. This is supported by our findings that the application
of baclofen and phaclofen on the GSH-induced elicited potentials blocked GABAB
electrical activity and its presumed contribution to GABA inhibition. GSH and
GABA alone caused significant increases in LUHPs, XLUHPs, P/PBPs and RPs; the
application of baclofen and phaclofen, together with GSH counteracted this effect and
caused significant decreases in SUHPs, MUHPs and RPs. Increased levels of
electrical activity in the parameters measured was greater in the pipette-applied
method relative to the bath-applied method in all treatments—suggesting that most of
the GSH receptors may be found in the distal nerve ring closer to the apex of the

35
hypostome relative to the proximal nerve ring located around the base of the
hypostome (Figure 31).

36
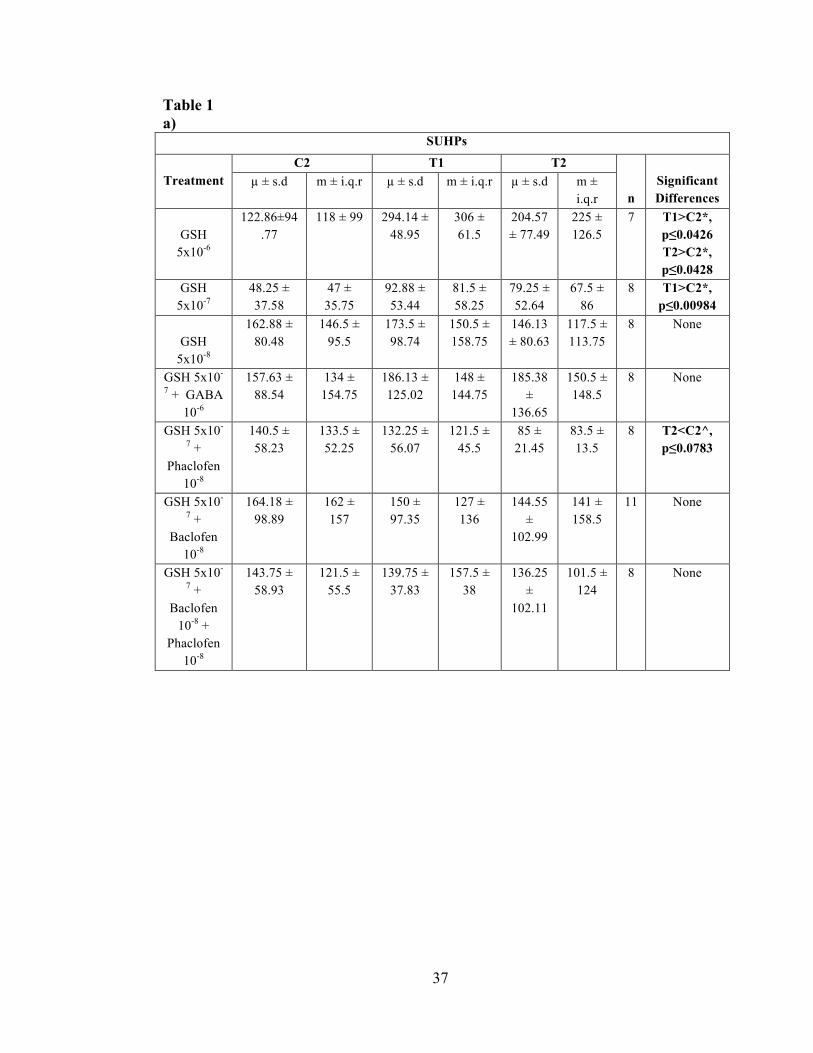
Table 1. The effect of various treatments on the number of small, uncorrelated
hypostomal pulses in the a) bath-applied method and b) pipette-applied method. Data
is reported as means and standard deviation (µ ± s.d) and as medians and interquartile
range (m ± i.q.r). Significance was calculated with FANOVAs. Asterisks denote a
significant difference. Carets denote a potentially significant difference.
37
Table 1 a) SUHPs
Treatment
C2 T1 T2
n
Significant Differences
µ ± s.d m ± i.q.r µ ± s.d m ± i.q.r µ ± s.d m ± i.q.r
GSH
5x10⁻⁶
122.86±94.77
118 ± 99 294.14 ± 48.95
306 ± 61.5
204.57 ± 77.49
225 ± 126.5
7 T1>C2*, p≤0.0426 T2>C2*, p≤0.0428
GSH 5x10⁻⁷
48.25 ± 37.58
47 ± 35.75
92.88 ± 53.44
81.5 ± 58.25
79.25 ± 52.64
67.5 ± 86
8 T1>C2*, p≤0.00984
GSH
5x10⁻⁸
162.88 ± 80.48
146.5 ± 95.5
173.5 ± 98.74
150.5 ± 158.75
146.13 ± 80.63
117.5 ± 113.75
8 None
GSH 5x10-
7 + GABA 10-6
157.63 ± 88.54
134 ± 154.75
186.13 ± 125.02
148 ± 144.75
185.38 ±
136.65
150.5 ± 148.5
8 None
GSH 5x10-
7 + Phaclofen
10-8
140.5 ± 58.23
133.5 ± 52.25
132.25 ± 56.07
121.5 ± 45.5
85 ± 21.45
83.5 ± 13.5
8 T2<C2^, p≤0.0783
GSH 5x10-
7 + Baclofen
10-8
164.18 ± 98.89
162 ± 157
150 ± 97.35
127 ± 136
144.55 ±
102.99
141 ± 158.5
11 None
GSH 5x10-
7 + Baclofen
10-8 + Phaclofen
10-8
143.75 ± 58.93
121.5 ± 55.5
139.75 ± 37.83
157.5 ± 38
136.25 ±
102.11
101.5 ± 124
8 None

38
Table 1 b)
SUHPs
Treatment
C1 C2 T1 T2 n
Significant Differences µ ± s.d
m ± i.q.r
µ ± s.d m ± i.q.r
µ ± s.d m ± i.q.r
µ ± s.d m ± i.q.r
GSH 5x10⁻⁶
205.71 ± 108.83
156 ± 69
184.86 ± 82.21
136 ± 71
155.57 ± 117.52
159 ± 202.5
177.43 ± 150.16
144 ± 262
7 None
GSH 5x10⁻⁷
205.71 ± 108.83
156 ± 69
184.86 ± 82.21
136 ± 71
156 ± 72.15
169 ± 124.5
143.57 ± 67.01
108 ±
101.5
7 None
GSH 5x10⁻⁸
205.71 ± 108.83
156 ± 69
184.86 ± 82.21
136 ± 71
130.17 ± 120.09
71 ± 137.25
71.67 ±
51.37
51.5 ±
61.75
6 None
GSH 5x10-
7 + GABA 1x10⁻⁶
205.71 ± 108.83
156 ± 69
184.86 ± 82.21
136 ± 71
225 ± 77.04
235 ± 116
169.14 ± 39.87
178 ± 55
7 None
GSH 5x10-
7 + Phaclofen
1x10⁻⁸
205.71 ± 108.83
156 ± 69
184.86 ± 82.21
136 ± 71
187.71 ± 77.75
200 ± 114.5
174.57 ± 65.38
194 ± 69
7 None
GSH 5x10-
7 + Baclofen
1x10⁻⁸
205.71 ± 108.83
156 ± 69
184.86 ± 82.21
136 ± 71
68.14 ±
21.51
66 ± 37
43.71 ±
13.40
48 ± 22
7
T1<C1^, p≤0.00623 T2<C1*,
p≤0.00237, T2<C2*,
p≤0.00537 GSH 5x10-
7 + Baclofen 1x10⁻⁸ +
Phaclofen 1x10⁻⁸
205.71 ± 108.83
156 ± 69
184.86 ± 82.21
136 ± 71
109.86 ± 83.91
53 ± 124.5
53.43 ±
30.56
47 ± 33
7
T2<C1*, p≤0.0106 T2<C2*, p≤0.0196

39
Table 2. The effect of various treatments on the number of medium, uncorrelated
hypostomal pulses in the a) bath-applied method and b) pipette-applied method. Data
is reported as means and standard deviation (µ ± s.d) and as medians and interquartile
range (m ± i.q.r). Significance was calculated with FANOVAs. Asterisks denote a
significant difference. Carets denote a potentially significant difference.

40
Table 2 a)
MUHPs
Treatment
C2 T1 T2 n
Significant Differences
µ ± s.d
m ± i.q.r
µ ± s.d
m ± i.q.r
µ ± s.d
m ± i.q.r
GSH 5x10⁻⁶ 2.14 ±
3.14
0 ± 3.5
11.71 ±
7.57
13 ± 12.5
3.86 ±
3.14 4 ± 5 7 T1>C2*,
p≤0.00505
GSH 5x10⁻⁷ 1.5 ± 1
1 ± 1.25
3.25 ±
2.90
2.5 ± 4.75
6 ± 5.59
5.5 ± 6.25 8 None
GSH 5x10⁻⁸ 6 ± 6.26
6 ± 4.75
7.5 ± 6.98 6 ± 8
4.63 ±
6.52
1 ± 6.25 8 T2<T1*,
p≤0.0266
GSH 5x10⁻⁷ + GABA 10-6
8.25 ±
9.35
4.5 ± 11
6.13 ±
4.91
5.5 ± 4.75
4.25 ±
7.14 1 ± 2 8 None
GSH 5x10⁻⁷ + Phaclofen 10-8
2.13 ±
2.09
1.5 ± 2
1.88 ±
2.09
1.5 ± 1.25
1.13 ±
1.36
0.5 ± 2 8 None
GSH 5x10⁻⁷ + Baclofen 10-8
6.55 ±
9.51
3 ± 5.5
4.91 ±
6.27 3 ± 4
7.18 ±
13.97 2 ± 2 11 T2>C2^,
p≤0.0798
GSH 5x10⁻⁷ + Baclofen 10-8 + Phaclofen 10-8
3.88 ±
2.09
3 ± 2.75
4.88 ±
7.25
1 ± 6.25
0.38 ±
0.70
0 ± 0.25 8 T2<C2*,
p≤0.00379

41
Table 2 b)
MUHPS
Treatment
C1 C2 T1 T2
n
Significant Differences µ ±
s.d m ± i.q.r
µ ± s.d
m ± i.q.r
µ ± s.d
m ± i.q.r
µ ± s.d
m ± i.q.r
GSH 5x10⁻⁶ 6.29 ±
3.88
6 ± 5
3 ± 3.66
2 ± 4
3.71 ±
3.49
2 ± 3.5
7.43 ±
6.99
5 ± 11 7 None
GSH 5x10⁻⁷ 6.29 ±
3.88
6 ± 5
3 ± 3.66
2 ± 4
11.14 ±
5.33
11 ± 7.5
3.71 ±
4.06
2 ± 2.5 7 T1>C2^,
p≤0.0741
GSH 5x10⁻⁸ 6.29 ±
3.88
6 ± 5
3 ± 3.66
2 ± 4
7 ± 7.94
3 ± 6.75
3 ± 2.77
2 ± 3.5 6 None
GSH 5x10⁻⁷ + GABA10-6
6.29 ±
3.88
6 ± 5
3 ± 3.66
2 ± 4
6.57 ±
7.96
4 ± 5.5
3.29 ±
4.40
1 ± 3.5 7 None
GSH 5x10⁻⁷ + Phaclofen 10-8
6.29 ±
3.88
6 ± 5
3 ± 3.66
2 ± 4
6.43 ±
3.58
7 ± 4.5
8.14 ±
7.08
8 ± 7 7 None
GSH 5x10⁻⁷ + Baclofen 10-8
6.29 ±
3.88
6 ± 5
3 ± 3.66
2 ± 4
4.14 ±
4.79
1 ± 5.5
5.86 ±
5.91
5 ± 4.5 7 None
GSH 5x10⁻⁷ + Baclofen 10-8 + Phaclofen 10-8
6.29 ±
3.88
6 ± 5
3 ± 3.66
2 ± 4
3.14 ±
3.31
2 ± 4.0
5.14 ±
5.25
3 ± 4 7 None

42
Table 3. The effect of various treatments on the number of large, uncorrelated
hypostomal pulses in the a) bath-applied method and b) pipette-applied method. Data
is reported as means and standard deviation (µ ± s.d) and as medians and interquartile
range (m ± i.q.r). Significance was calculated with FANOVAs. Asterisks denote a
significant difference. Carets denote a potentially significant difference.

43
Table 3 a)
LUHPs
Treatment
C2 T1 T2 n
Significant Differences
µ ± s.d
m ± i.q.r
µ ± s.d
m ± i.q.r
µ ± s.d
m ± i.q.r
GSH 5x10⁻⁶ 1.57 ±
1.59 1 ± 3
0.57 ±
0.73 0 ± 1
1.57 ±
1.99 0 ± 3 7 None
GSH 5x10⁻⁷ 1.25 ±
1.20
1 ± 2.25
0.5 ± 0.71 0 ± 1
1.25 ±
1.79
0 ± 2.25 8 None
GSH 5x10⁻⁸ 2.13 ±
1.83
1.5 ± 3.25
0.63 ±
0.70
0.5 ± 1
0.38 ±
0.48 0 ± 1 8 T2<C2^,
p≤0.0693
GSH 5x10⁻⁷ + GABA 10-6 2.25 ±
2.49
1.5 ± 4
3 ± 2.83
2.5 ± 3.25
0.88 ±
1.05
0.5 ± 1.25 8 None
GSH 5x10⁻⁷ + Phaclofen 10-8
1.63 ±
3.60
0 ± 0.5
0.75 ±
0.97
0.5 ± 1
1.13 ±
1.36
0.5 ± 2 8 None
GSH 5x10⁻⁷ + Baclofen 10-8
2.09 ±
2.11 1 ± 4
1.55 ±
1.74
1 ± 2.5
1.64 ±
2.62 1 ± 2 11 None
GSH 5x10⁻⁷ + Baclofen 10-8 + Phaclofen 10-8
0.63 ±
0.48 1 ± 1 0.5 ±
0.87 0 ± 0.5
0.25 ±
0.43
0 ± 0.25 8 None

44
Table 3 b)
LUHPS
Treatment
C1 C2 T1 T2 n
Significant Differences
µ ± s.d
m ± i.q.r
µ ± s.d
m ± i.q.r
µ ± s.d
m ± i.q.r
µ ± s.d
m ± i.q.r
GSH 5x10⁻⁶ 0.86 ±
0.64
1 ± 0.5
1 ± 2.07
0 ± 0.5
0.57 ±
0.73
0 ± 1
1.14 ±
2.80
0 ± 0 7 None
GSH 5x10⁻⁷ 0.86 ±
0.64
1 ± 0.5
1 ± 2.07
0 ± 0.5
4.43 ±
4.03
4 ± 7
3.86 ±
4.12
3 ± 3.5 7 None
GSH 5x10⁻⁸ 0.86 ±
0.64
1 ± 0.5
1 ± 2.07
0 ± 0.5
2.17 ±
2.19
1.5 ±
3.25
0.83 ±
0.69
1 ± 0.75 6 None
GSH 5x10⁻⁷ + GABA 1x10⁻⁶
0.86 ±
0.64
1 ± 0.5
1 ± 2.07
0 ± 0.5
3.29 ±
4.86
1 ± 1.5
5.29 ±
7.36
2 ± 4.5 7 T2>C2*,
p≤0.0440
GSH 5x10⁻⁷ + Phaclofen 1x10⁻⁸
0.86 ±
0.64
1 ± 0.5
1 ± 2.07
0 ± 0.5
5.57 ±
6.28
5 ± 6.5
4.71 ±
4.40
4 ± 4.5 7 T2>C2^,
p≤0.0734
GSH 5x10⁻⁷ + Baclofen 10-8
0.86 ±
0.64
1 ± 0.5
1 ± 2.07
0 ± 0.5
1.57 ±
1.59
1 ± 1.5
2.57 ±
2.82
2 ± 4 7 None
GSH 5x10⁻⁷ + Baclofen 10-8 + Phaclofen 10-8
0.86 ±
0.64
1 ± 0.5
1 ± 2.07
0 ± 0.5
4 ± 3.82
5 ± 6.5
5.57 ±
6.39
3 ± 8 7 None

45
Table 4: The effect of various treatments on the number of extra-large, uncorrelated
hypostomal pulses in the a) bath-applied method and b) pipette-applied method. Data
is reported as means and standard deviation (µ ± s.d) and as medians and interquartile
range (m ± i.q.r). Significance was calculated with FANOVAs. Asterisks denote a
significant difference. Carets denote a potentially significant difference.

46
Table 4 a)
XLUHPs
Treatment
C2 T1 T2 n
Significant Differences
µ ± s.d
m ± i.q.r
µ ± s.d
m ± i.q.r
µ ± s.d
m ± i.q.r
GSH 5x10⁻⁶ 5.43 ±
7.29 1 ± 8 2 ±
2.56 1 ± 1.5
3.43 ±
3.89 1 ± 7 7 None
GSH 5x10⁻⁷ 3.75 ±
2.49
4 ± 3.5
3.63 ±
3.57
3 ± 2.75
1.75 ±
3.56
0 ± 1.25 8
T2<C2*, p≤0.0428 T2<T1^, p≤0.0612
GSH 5x10⁻⁸ 10.13 ±
7.27
7.5 ± 7.25
5.25 ±
7.14
1 ± 8.75
5.38 ±
6.82
0.5 ± 12 8 None
GSH 5x10⁻⁷ + GABA 10-6
6.88 ±
4.54
7.5 ± 5.25
6.63 ±
5.17
6.5 ± 9.75
2.75 ±
5.09 1 ± 2 8 None
GSH 5x10⁻⁷ + Phaclofen 10-8
12.25 ±
7.84
13 ± 10.75
10.5 ±
8.08
10.5 ± 14
10.38 ±
6.56
10.5 ±
10.25 8 None
GSH 5x10⁻⁷ + Baclofen 10-8
5.82 ±
6.46
3 ± 12.5
4.55 ±
6.01
0 ± 8.5
3.55 ±
4.92
2 ± 4.5 11 None
GSH 5x10⁻⁷ + Baclofen 10-8 + Phaclofen 10-8
7 ± 6.87 5 ± 9 3 ±
3.74 1.5 ± 4
6 ± 5.63
5.5 ± 12 8 None

47
Table 4 b)
XLUHPS
Treatment
C1 C2 T1 T2 n
Significant Differences
µ ± s.d
m ± i.q.r
µ ± s.d
m ± i.q.r
µ ± s.d
m ± i.q.r
µ ± s.d
m ± i.q.r
GSH 5x10⁻⁶ 11.14 ±
3.83
12 ± 7
12.14 ±
6.98
11 ± 11
0.43 ±
0.73
0 ± 0.5
0.29 ±
0.45
0 ± 0.5 7
T1<C1*, p≤0.0323 T2<C1*, p≤0.0323 T1<C2*, p≤0.0171 T2<C2*, p≤0.0169
GSH 5x10⁻⁷ 11.14 ±
3.83
12 ± 7
12.14 ±
6.98
11 ± 11
12.86 ±
13.31
7 ± 16.5
12.86 ±
10.55
13 ± 20 7 None
GSH 5x10⁻⁸ 11.14 ±
3.83
12 ± 7
12.14 ±
6.98
11 ± 11
8.67 ±
11.23
4 ± 5.75
7 ± 10.13
3 ± 5.75 6 None
GSH 5x10⁻⁷ + GABA 10-6
11.14 ±
3.83
12 ± 7
12.14 ±
6.98
11 ± 11
22.71 ±
9.91
23 ± 7.5
15 ± 6.63
16 ± 7 7 T1>C1*,
p≤0.0450
GSH 5x10⁻⁷ + Phaclofen 10-8
11.14 ±
3.83
12 ± 7
12.14 ±
6.98
11 ± 11
19.43 ±
10.18
20 ± 11
7.71 ±
7.59
2 ± 13.5 7 T2<T1*,
p≤0.00821
GSH 5x10⁻⁷ + Baclofen 10-8
11.14 ±
3.83
12 ± 7
12.14 ±
6.98
11 ± 11
3.86 ±
6.17
0 ± 5
1.71 ±
3.81
0 ± 0.5 7
T2<C1*, p≤0.0413 T2<C2*, p≤0.0109 T1<C2*, p≤0.0414
GSH 5x10⁻⁷ + Baclofen 10-8 + Phaclofen
10-8
11.14 ±
3.83
12 ± 7
12.14 ±
6.98
11 ± 11
8.43 ±
7.89
10 ± 14.5
5 ± 6.82
2 ± 7.5 7 None

48
Table 5. The effect of various treatments on the number of pacemaker bursting pulses
in the a) bath-applied method and b) pipette-applied method. Data is reported as
means and standard error (µ ± s.d) and as medians and interquartile range (m ± i.q.r).
Significance was calculated with FANOVAs. Asterisks denote a significant
difference. Carets denote a potentially significant difference.

49
Table 5 a)
PBPs
Treatment
C2 T1 T2 n
Significant Differences
µ ± s.d
m ± i.q.r
µ ± s.d
m ± i.q.r
µ ± s.d
m ± i.q.r
GSH 5x10⁻⁶ 1.14 ±
0.83 1 ± 0 0 ± 0 0 ± 0
0.29 ±
0.70 0 ± 0 7
T1>C2*, p≤0.0152 T2>C2^, p≤0.0537
GSH 5x10⁻⁷ 0.63 ±
0.48 1 ± 1
0.13 ±
0.33 0 ± 0
0.63 ±
0.48 1 ± 1 8 None
GSH 5x10⁻⁸ 1.63 ±
0.99
1.5 ± 1.25
0.75 ±
0.83
0.5 ± 1.25
0.63 ±
0.70
0.5 ± 1 8 T2>C2*,
p≤0.0327
GSH 5x10⁻⁷ + GABA 10-
6
0.63 ±
0.48 1 ± 1
0.63 ±
0.48 1 ± 1
0.25 ±
0.43
0 ± 0.25 8 None
GSH 5x10⁻⁷ + Phaclofen 10-8
1.25 ±
0.66 1 ± 1
0.88 ±
0.60
1 ± 0.25
1 ± 0.71
1 ± 0.5 8 None
GSH 5x10⁻⁷ + Baclofen 10-8
1.09 ±
0.83
1 ± 1.5
1 ± 1.22
1 ± 1.5
0.64 ±
0.92 0 ± 1 11 None
GSH 5x10⁻⁷ + Baclofen 10-8 + Phaclofen10-8
0.63 ±
0.70
0.5 ± 1
0.25 ±
0.43
0 ± 0.25
0.5 ± 0.5
0.5 ± 1 8 None

50
Table 5 b)
PBPS
Treatment
C1 C2 T1 T2 n
Significant Differences
µ ± s.d
m ± i.q.r
µ ± s.d
m ± i.q.r
µ ± s.d
m ± i.q.r
µ ± s.d
m ± i.q.r
GSH 5x10⁻⁶ 1.43 ±
0.49
1 ± 1
1.43 ±
0.73
2 ± 1
1.14 ±
1.12
1 ± 2
1.14 ±
0.99
2 ± 2 7 None
GSH 5x10⁻⁷ 1.43 ±
0.49
1 ± 1
1.43 ±
0.73
2 ± 1
2.14 ±
0.64
2 ± 0.5
1.29 ±
1.03
1 ± 1.5 7 None
GSH 5x10⁻⁸ 1.43 ±
0.49
1 ± 1
1.43 ±
0.73
2 ± 1
2 ± 1.41
2 ± 2
1.17 ±
0.69
1 ± 0.75 6 None
GSH 5x10⁻⁷ + GABA 10-6
1.43 ±
0.49
1 ± 1
1.43 ±
0.73
2 ± 1
2.43 ±
0.90
2 ± 1
1.57 ±
0.73
1 ± 1 7 None
GSH 5x10⁻⁷ + Phaclofen 10-8
1.43 ±
0.49
1 ± 1
1.43 ±
0.73
2 ± 1
2.14 ±
1.25
2 ± 1.5
0.86 ±
0.83
1 ± 1.5 7 T2<T1^,
p≤0.0855
GSH 5x10⁻⁷ + Baclofen 10-8
1.43 ±
0.49
1 ± 1
1.43 ±
0.73
2 ± 1
1.29 ±
1.48
0 ± 3
1.57 ±
1.18
2 ± 2 7 None
GSH 5x10⁻⁷ + Baclofen 10-8 + Phaclofen 10-8
1.43 ±
0.49
1 ± 1
1.43 ±
0.73
2 ± 1
2 ± 0.53
2 ± 0
1.43 ±
0.49
1 ± 1 7 None

51
Table 6. The effect of various treatments on the number of pulses per pacemaker
bursting pulse in the a) bath-applied method and b) pipette-applied method. Data is
reported as means and standard error (µ ± s.e) and as medians and interquartile range
(m ± i.q.r). Significance was calculated with FANOVAs. Asterisks denote a
significant difference. Carets denote a potentially significant difference.

52
Table 6 a)
P/PBPs
Treatment C2 T1 T2
n
Significant Differences µ ± s.e m ± i.q.r µ ± s.e m ± i.q.r µ ± s.e m ±
i.q.r GSH 5x10⁻⁶ 9.29 ±
1.93 9 ± 4 0 ± 0 0 ± 0 1.36 ±
1.26 0 ± 0 7 T2>C2^,
p≤0.0538 T1<C2*, p≤0.0151
GSH 5x10⁻⁷ 4.25 ± 1.31
4.5 ± 7.25
1.5 ± 1.40
0 ± 0 6.63 ± 2.40
6 ± 9 8 None
GSH 5x10⁻⁸ 9.28 ± 1.41
9.8 ± 3.55
5.56 ± 2.13
3.5 ± 10.13
5.13 ± 1.92
3 ± 11.25
8 None
GSH 5x10⁻⁷ + GABA 10-6
7.75 ± 2.31
9.5 ± 11.75
9.88 ± 3.11
11 ± 15.25
3.63 ± 2.36
0 ± 2.5
8 None
GSH 5x10⁻⁷ + Phaclofen 10-8
10.13 ± 2.11
9.5 ± 8.25
9.56 ± 2.06
2 ± 5.25 9.63 ± 2.30
11.25 ± 7.13
8 None
GSH 5x10⁻⁷ + Baclofen 10-8
8.55 ± 1.89
9.5 ± 11 4.93 ± 1.46
7 ± 8.25 4.82 ± 1.75
0 ± 11 11 None
GSH 5x10⁻⁷ + Baclofen 10-8 + Phaclofen
10-8
3.75 ± 1.33
3.5 ± 7.25
2.13 ± 1.37
0 ± 1.5 6 ± 2.19
4.5 ± 12
8 None

53
Table 6 b)
P/PBPS
Treatment
C1 C2 T1 T2 n
Significant Differences
µ ± s.e
m ± i.q.r
µ ± s.e
m ± i.q.r
µ ± s.e
m ± i.q.r
µ ± s.e
m ± i.q.r
GSH 5x10⁻⁶ 9.29 ±
1.52
8.5 ±
5.75
7.29 ±
1.38
8 ± 4.25
3.14 ±
1.20
3.5 ±
4.75
7.55 ±
1.53
8.5 ± 5.09 7 None
GSH 5x10⁻⁷ 9.29 ±
1.52
8.5 ±
5.75
7.29 ±
1.38
8 ± 4.25
12.76 ±
1.57
11 ±
4.92
12.02 ±
3.22
13 ± 11.92 7 None
GSH 5x10⁻⁸ 9.29 ±
1.52
8.5 ±
5.75
7.29 ±
1.38
8 ± 4.25
6.21 ±
1.43
6.17 ±
1.15
6.83 ±
1.61
7 ± 4.63 6 T1<C1*,
p≤0.0157
GSH 5x10⁻⁷ + GABA 10-6
9.29 ±
1.52
8.5 ±
5.75
7.29 ±
1.38
8 ± 4.25
11.91 ±
1.64
11 ± 6
16.14 ±
1.80
16 ± 3.75 7 T2>C2^,
p≤0.0569
GSH 5x10⁻⁷ + Phaclofen 10-8
9.29 ±
1.52
8.5 ±
5.75
7.29 ±
1.38
8 ± 4.25
12.56 ±
4.50
7.5 ±
9.05
9.07 ±
3.38
9.5 ± 16 7 None
GSH 5x10⁻⁷ + Baclofen 10-8
9.29 ±
1.52
8.5 ±
5.75
7.29 ±
1.38
8 ± 4.25
2.76 ±
1.22
0 ± 5.83
6.40 ±
1.68
7.33 ±
6.75 7
T1<C1*, p≤0.00827 T2<C1*, p≤0.0439
GSH 5x10⁻⁷ + Baclofen 10-8 + Phaclofen 10-8
9.29 ±
1.52
8.5 ±
5.75
7.29 ±
1.38
8 ± 4.25
14.12 ±
3.45
9.5 ±
9.59
12 ± 1.52
10.5 ±
6.75 7 None

54
Table 7. The effect of various treatments on the RP system in the a) bath-applied
method and b) pipette-applied method. Data is reported as means and standard error
(µ ± s.e) and as medians and interquartile range (m ± i.q.r). Significance was
calculated with FANOVAs. Asterisks denote a significant difference. Carets denote a
potentially significant difference.

55
Table 7 a)
RPs
Treatment
C2 T1 T2 n
Significant Differences
µ ± s.e
m ± i.q.r
µ ± s.e
m ± i.q.r
µ ± s.e
m ± i.q.r
GSH 5x10⁻⁶ 2.14 ±
1.08 0 ± 4
5.71 ±
2.26
4 ± 7.5
6.29 ±
2.01 7 ± 6 7 None
GSH 5x10⁻⁷ 0.75 ±
0.46 0 ± 1
1.13 ±
0.57
0.5 ± 1.25
0.63 ±
0.35 0 ± 1 8 None
GSH 5x10⁻⁸ 6.25 ±
2.09
5 ± 11.5
1.63 ±
0.86
1 ± 0.25
1 ± 0.40 2 ± 0 8 T2<C2^,
p≤0.0751
GSH 5x10⁻⁷ + GABA 10-
6
2.63 ±
0.68
2.5 ± 3.25
2.5 ± 0.83
1.5 ± 3.75
2.13 ±
0.48
2 ± 2.25 8 None
GSH 5x10⁻⁷ + Phaclofen 10-8
7.63 ±
2.79
5.5 ± 6.5
5.25 ±
2.32
2 ± 5.25
3.38 ±
1.30
2 ± 3.75 8 None
GSH 5x10⁻⁷ + Baclofen 10-8
8.73 ±
3.54 3 ± 8
4.27 ±
1.63
2 ± 6.5
3.82 ±
1.52
3 ± 4.5 11 None
GSH 5x10⁻⁷ + Baclofen 10-8 + Phaclofen 10-8
8.75 ±
1.48
7.5 ± 6.75
5.88 ±
1.92
4.5 ± 4.5
3.13 ±
1.29
2 ± 3.25 8 T2<C2*,
p≤0.00969

56
Table 7 b)
RPS
Treatment
C1 C2 T1 T2 n
Significant Differences
µ ± s.e
m ± i.q.r
µ ± s.e
m ± i.q.r
µ ± s.e
m ± i.q.r
µ ± s.e
m ± i.q.r
GSH 5x10⁻⁶ 3.86 ±
1.30
3 ± 5
2.43 ±
1.24
2 ± 2.5
7 ± 2.71
6 ± 6
7 ± 2.36
6 ± 4
7 None
GSH 5x10⁻⁷ 3.86 ±
1.30
3 ± 5
2.43 ±
1.24
2 ± 2.5
10.43 ±
5.22
3 ± 13.5
11.57 ±
5.54
4 ± 16
7 None
GSH 5x10⁻⁸ 3.86 ±
1.30
3 ± 5
2.43 ±
1.24
2 ± 2.5
2 ± 0.53
1 ± 2.25
1.83 ±
0.46
1 ± 1.5
6 None
GSH 5x10⁻⁷ + GABA 10-6
3.86 ±
1.30
3 ± 5
2.43 ±
1.24
2 ± 2.5
7.43 ±
1.63
9 ± 8
5 ± 1.29
3 ± 3.5
7 T1>C2*, p≤0.0324
GSH 5x10⁻⁷ + Phaclofen 10-8
3.86 ±
1.30
3 ± 5
2.43 ±
1.24
2 ± 2.5
3.86 ±
1.06
3 ± 3.5
2.71 ±
1.52
1 ± 3
7 None
GSH 5x10⁻⁷ + Baclofen 10-8
3.86 ±
1.30
3 ± 5
2.43 ±
1.24
2 ± 2.5
4.29 ±
0.45
3 ± 4
3.29 ±
1.17
2 ± 4.5
7 None
GSH 5x10⁻⁷ + Baclofen 10-8 + Phaclofen 10-8
3.86 ±
1.30
3 ± 5
2.43 ±
1.24
2 ± 2.5
3.29 ±
1.34
3 ± 5.5
3.29 ±
1.04
2 ± 5
7 None

57
Table 8: The comparison of SUHP responses in bath-applied method vs. pipette
applied method where treatment period 1 (T1) was the same as treatment period 2
(T2). Data is reported as means and standard deviation (µ ± s.d) and as medians and
interquartile range (m ± i.q.r). Significance was calculated with Welch two-sample t-
tests. Asterisks denote a significant difference. Carets denote a potentially significant
difference.

58
Table 8 SUHPs
Treatment
TB TP Significant Differences µ + s.d m + i.q.r µ + s.d m + i.q.r
GSH 5x10⁻⁶ 249.36 ± 78.78
259 ± 96.75
166.5± 135.27
151.5 ± 222.75
TB>TP^ p≤0.0702
GSH 5x10⁻⁷ 83.57 ± 54.63
77 ± 80 149.79 ± 69.91
141.5 ± 130
TB<TP* p≤0.0126
GSH 5x10⁻⁸ 156.58 ± 97.28
112.5 ± 165.5
100.92 ± 96.88
63 ± 85.75
None
GSH 5x10⁻⁷ + GABA 10-6
194.86 ± 136.87
155 ± 179.75
197.07 ± 67.40
184.5 ± 88.75
None
GSH 5x10⁻⁷ + Phaclofen 10-8
109.57± 50.93
89.5 ± 46.25
181.14 ± 72.13
194.5 ± 74.5
TB<TP* p≤0.00758
GSH 5x10⁻⁷ +Baclofen 10-8
165.29 ± 111.01
199 ± 186.5
55.93 ± 21.69
53 ± 27.25
TB<TP* p≤0.00364
GSH 5x10⁻⁷ +Phaclofen 10-8 +
Baclofen 10-8
128 ±75.60
130 ± 81.25
81.64 ± 72.84
50 ± 47.75
None

59
Table 9: The comparison of MUHP responses in bath-applied method vs. pipette
applied method where treatment period 1 (T1) was the same as treatment period 2
(T2). Data is reported as means and standard deviation (µ ± s.d) and as medians and
interquartile range (m ± i.q.r). Significance was calculated with Welch two-sample t-
tests. Asterisks denote a significant difference. Carets denote a potentially significant
difference.

60
Table 9 MUHPS
Treatment
TB TP Significant Differences µ + s.d m + i.q.r µ + s.d m + i.q.r
GSH 5x10⁻⁶ 7.79 ± 7.00
6 ± 10.75 5.57 ± 5.82
3 ±7 None
GSH 5x10- 4.79 ± 4.79
4 ± 5.5 7.43 ± 6.02
6.5 ± 10.5
None
GSH 5x10⁻⁷ + GABA 10-6
4.86 ± 6.56
1.5 ± 4.75
4.93 ± 6.64
2 ± 5 None
GSH 5x10⁻⁷ + Phaclofen 10-8
1.5 ± 1.92 1 ± 2 7.29 ± 5.67
7.5 ± 6.5 TB<TP*, p≤0.00309
GSH 5x10⁻⁷ +Baclofen 10-8
7.5 ± 12.70
3 ± 4 5 ± 5.45 3 ± 6.25 None
GSH 5x10⁻⁷ +Phaclofen 10-8 +
Baclofen 10-8
1.36 ± 2.74
0 ± 1 4.14 ± 4.50
2.5 ± 4.5 TB<TP^, p≤0.0702

61
Table 10: The comparison of LUHP responses in bath-applied method vs. pipette
applied method where treatment period 1 (T1) was the same as treatment period 2
(T2). Data is reported as means and standard deviation (µ ± s.d) and as medians and
interquartile range (m ± i.q.r). Significance was calculated with Welch two-sample t-
tests. Asterisks denote a significant difference. Carets denote a potentially significant
difference.

62
Table 10 LUHPS
Treatment
TB TP Significant Differences µ + s.d m + i.q.r µ + s.d m + iqr
GSH 5x10⁻⁶ 1.07 ± 1.58
0 ± 1.75 0.86 ± 2.07
0 ± 0.75 None
GSH 5x10⁻⁷ 0.86 ± 1.46
0 ± 1 4.14 ± 4.09
3.5 ± 6.25
TB<TP*, p≤0.0146
GSH 5x10⁻⁸ 0.58 ± 0.64
0.5 ± 1 1.5 ± 1.76 1 ± 2 None
GSH 5x10⁻⁷ + GABA 10-6
2.21 ± 2.43
1.5 ± 2.75
4.29 ± 6.32
1.5 ± 1.75
None
GSH 5x10⁻⁷ + Phaclofen 10-8
0.71 ± 0.96
0 ± 1 5.14 ± 5.44
4.5 ± 5.5 TB<TP*, p≤0.0119
GSH 5x10⁻⁷ +Baclofen 10-8
1.71 ± 2.37
1 ± 2 2.07 ± 2.34
1.5 ± 2.75
None
GSH 5x10⁻⁷ +Phaclofen 10-8 +
Baclofen 10-8
0.29 ± 0.59
0 ± 0 4.79 ± 5.32
4 ± 7.25 TB<TP*, p≤0.00943

63
Table 11: The comparison of XLUHP responses in bath-applied method vs. pipette
applied method where treatment period 1 (T1) was the same as treatment period 2
(T2). Data is reported as means and standard deviation (µ ± s.d) and as medians and
interquartile range (m ± i.q.r). Significance was calculated with Welch two-sample t-
tests. Asterisks denote a significant difference. Carets denote a potentially significant
difference.

64
Table 11 XLUHPS
Treatment
TB TP Significant Differences µ ± s.d m ± i.q.r µ ± s.d m ± i.q.r
GSH 5x10⁻⁶ 2.71 ± 3.37
1 ± 4.25 0.36 ± 0.61
0 ± 0.75 TB>TP*, p≤0.0265
GSH 5x10⁻⁸ 6 ± 7.51 0.5 ± 12 7.83 ± 10.73
3.5 ± 6 None
GSH 5x10⁻⁷ + GABA 1x10⁻⁶
5.29 ± 5.61
2 ± 8.75 18.86 ± 9.27
19 ± 7.75 TB<TP*, p≤1.82e-4
GSH 5x10⁻⁷ + Phaclofen 10-8
10.57 ± 7.46
10.5 ± 10.75
13.57 ± 10.72
15 ± 17.5 None
GSH 5x10⁻⁷ +Baclofen 10-8
3.86 ± 5.41
1 ± 5.5 2.79 ± 5.24
0 ± 1 None
GSH 5x10⁻⁷ +Phaclofen 10-8 +
Baclofen 10-8
5.07 ± 5.11
2.5 ± 10.5
6.71 ± 7.57
2 ± 12.75 None
65
Table 12: The comparison of PBP responses in bath-applied method vs. pipette
applied method where treatment period 1 (T1) was the same as treatment period 2
(T2). Data is reported as means and standard deviation (µ ± s.d) and as medians and
interquartile range (m ± i.q.r). Significance was calculated with Welch two-sample t-
tests. Asterisks denote a significant difference. Carets denote a potentially significant
difference.

66
Table 12 PBPS
Treatment
TB TP Significant Differences µ + s.d m + i.q.r µ + s.d m + i.q.r
GSH 5x10⁻⁶ 0.14 ± 0.52
0 ± 0 1.14 ± 1.06
1.5 ± 2 TB<TP*, p≤0.00649
GSH 5x10⁻⁷ 0.43 ± 0.50
0 ± 1 1.71 ± 0.96
2 ± 1 TB<TP*, p≤3.69e-4
GSH 5x10⁻⁸ 0.83 ± 0.80
1 ± 1.25 1.58 ± 1.19
1 ± 1.25 TB<TP^, p≤0.0982
GSH 5x10⁻⁷ + GABA 10-6
0.5 ± 0.5 0.5 ± 1 2 ± 0.93 2 ± 1.75 TB<TP*, p≤4.99e-5
GSH 5x10⁻⁷ +Baclofen 10-8
0.86 ± 1.25
0 ± 1 1.43 ± 1.35
1.5 ± 3 None
GSH 5x10⁻⁷ +Phaclofen 10-8 +
Baclofen 10-8
0.43 ± 0.50
0 ± 1 1.71 ± 0.59
2 ± 1 TB<TP*, p≤2.60e-6

67
Table 13: The comparison of P/PBP responses in bath-applied method vs. pipette
applied method where treatment period 1 (T1) was the same as treatment period 2
(T2). Data is reported as means and standard error (µ ± s.e) and as medians and
interquartile range (m ± i.q.r). Significance was calculated with Welch two-sample t-
tests. Asterisks denote a significant difference. Carets denote a potentially significant
difference.
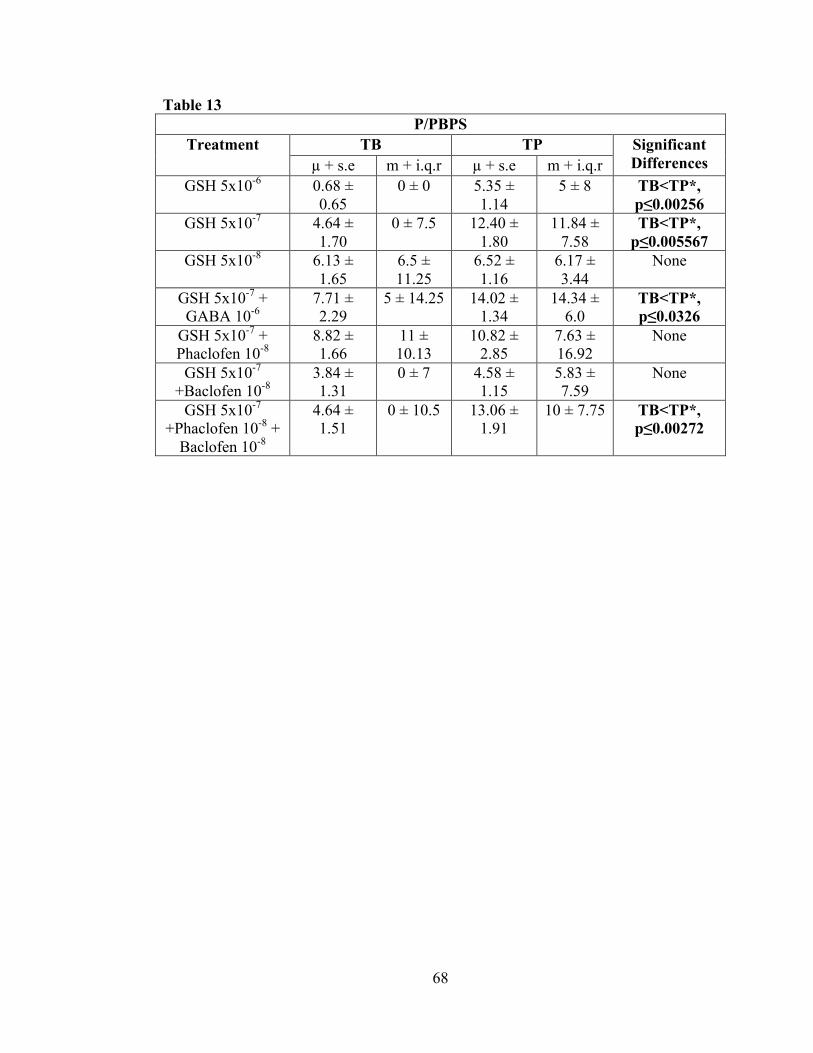
68
Table 13 P/PBPS
Treatment TB TP Significant Differences µ + s.e m + i.q.r µ + s.e m + i.q.r
GSH 5x10⁻⁶ 0.68 ± 0.65
0 ± 0 5.35 ± 1.14
5 ± 8 TB<TP*, p≤0.00256
GSH 5x10⁻⁷ 4.64 ± 1.70
0 ± 7.5 12.40 ± 1.80
11.84 ± 7.58
TB<TP*, p≤0.005567
GSH 5x10⁻⁸ 6.13 ± 1.65
6.5 ± 11.25
6.52 ± 1.16
6.17 ± 3.44
None
GSH 5x10⁻⁷ + GABA 10-6
7.71 ± 2.29
5 ± 14.25 14.02 ± 1.34
14.34 ± 6.0
TB<TP*, p≤0.0326
GSH 5x10⁻⁷ + Phaclofen 10-8
8.82 ± 1.66
11 ± 10.13
10.82 ± 2.85
7.63 ± 16.92
None
GSH 5x10⁻⁷ +Baclofen 10-8
3.84 ± 1.31
0 ± 7 4.58 ± 1.15
5.83 ± 7.59
None
GSH 5x10⁻⁷ +Phaclofen 10-8 +
Baclofen 10-8
4.64 ± 1.51
0 ± 10.5 13.06 ± 1.91
10 ± 7.75 TB<TP*, p≤0.00272

69
Table 14: The comparison of RP responses in bath-applied method vs. pipette applied
method where treatment period 1 (T1) was the same as treatment period 2 (T2). Data
is reported as means and standard error (µ ± s.e) and as medians and interquartile
range (m ± i.q.r). Significance was calculated with Welch two-sample t-tests.
Asterisks denote a significant difference. Carets denote a potentially significant
difference.

70
Table 14 RPs
Treatment TB TP Significant Differences µ + s.e m + i.q.r µ + s.e m + i.q.r
GSH 5x10⁻⁶ 6 ± 1.51 4.5 ± 6 7 ± 1.80 6 ± 5.5 None GSH 5x10⁻⁷ 1 ± 0.38 0.5 ± 1 11 ± 3.81 3.5 ±
17.75 TB<TP*, p≤0.0254
GSH 5x10⁻⁸ 1.67 ± 0.60
1 ± 1.25 1.92 ± 0.38
1 ± 2.25 None
GSH 5x10⁻⁷ + GABA 10-6
2.36 ± 0.55
1.5 ± 3 6.21 ± 1.09
4.5 ± 6.75
TB<TP*, p≤0.00657
GSH 5x10⁻⁷ + Phaclofen 10-8
4.79 ± 1.50
2 ± 6.5 3.29 ± 0.94
2 ± 4.5 None
GSH 5x10⁻⁷ +Baclofen 10-8
2.36 ± 0.95
1 ± 2.75 3.79 ± 0.85
2.5 ± 5.75
None
GSH 5x10⁻⁷ +Phaclofen 10-8 +
Baclofen 10-8
4.93 ± 1.34
4 ± 4.5 3.29 ± 0.85
2.5 ± 6 None

71
Table 15: The comparison of responses in bath-applied method vs. pipette applied
method where treatment period 1 (T1) was different from treatment period 2 (T2).
Data is reported as means and standard deviation (µ ± s.d) and as medians and
interquartile range (m ± i.q.r). Significance was calculated with Welch two-sample t-
tests. Asterisks denote a significant difference. Carets denote a potentially significant
difference. a) GSH 5x10⁻⁷M, XLUHPs b) GSH 5x10⁻⁸M, MUHPs c) GSH 5x10⁻⁷M +
Phaclofen 10-8M: PBPs.

72
Table 15 a)
GSH 5x10⁻⁷, XLUHPS T1B T1P Significant
Differences µ ± s.d 3.71 ± 3.81 12.86 ±
13.31
None m ± i.q.r 3 ± 3.5 7 ± 16.5
T2B T2P µ ± s.d 2 ± 3.74 12.86 ±
10.55 T2B<T2P*, p≤0.0469
m ± i.q.r 0 ± 1.5 13 ± 20 b)
GSH 5x10⁻⁸, MUHPS T1B T1P Significant
Differences µ ± s.d 9 ± 7.46 7 ± 7.94 None
m ± i.q.r 8.5 ± 8.5 3 ± 6.75 T2B T2P Significant
Differences µ ± s.d 6 ±7 3 ± 2.77 None
m ± i.q.r 2.5 ± 10.50 2 ± 3.5 c)
GSH 5x10⁻⁷ + Phaclofen 10-8, PBPs T1B T1P Significant
Differences µ ± s.d 0.86 ± 0.64 2.14 ± 1.25 T1P>T1B^,
p≤0.0617 m ± i.q.r 1 ± 0.5 2 ± 1.5 T2B T2P
µ ± s.d 1 ± 0.76 0.86 ± 0.83 None m ± i.q.r 1 ± 1.0 1 ± 1.5

73
Table 16: The comparison of the dose response of GSH 5x10⁻⁸, GSH 5x10⁻⁷, GSH
5x10⁻⁶ in the a) bath-applied method and b) pipette-applied method. Data is reported
as means and standard deviation (µ ± s.d) for SUHPs, MUHPs, LUHPs, XLUHPs,
PBPs and as means and standard error (µ ± s.e) for P/PBPs and RPs. Asterisks
denote a significant difference. Carets denote a potentially significant difference.

74
Table 16: a)
GSH: Bath-Applied 5x10⁻⁸ 5x10⁻⁷ 5x10⁻⁶ Significant Differences
SUHPs 165.29 ±94.00
84.07 ± 55.15
249.36 ± 78.78
5x10⁻⁷ < 5x10⁻⁶, p≤0.00195*, 5x10⁻⁷ < 5x10⁻⁸,p≤0.0604^
MUHPs 6.86 ± 7.03
4.79 ± 4.78
7.79 ± 7.00
None
LUHPs 0.57 ± 0.62
0.86 ± 1.46
1.07 ± 1.33
None
XLUHPs 6 ± 7.20 2.93 ± 3.86
3.71 ± 5.72
None
PBPs 0.78 ± 0.77
0.43 ± 0.49
0.14 ± 0.52
5x10⁻⁶ < 5x10⁻⁸ p≤0.00444*
P/PBPs 6.11 ± 1.44
4.64 ± 1.59
0.68 ± 0.66
5x10⁻⁶ < 5x10⁻⁸ p≤0.0184*
RPs 1.5 ± 0.50 0.79 ± 0.33
6 ± 1.51 5x10⁻⁶ > 5x10⁻⁷ p≤0.0104*
b) GSH: Pipette-Applied
5x10-‐8 5x10-‐7 5x10-‐6 Significant Differences SUHPs 165.29 ±
94.00 149.79 ± 69.91
166.50 ± 135.27
None
MUHPs 6.89 ± 7.03 7.43 ± 6.02 5.57 ± 5.82 None LUHPs 1.5 ± 1.76 4.42 ± 4.23 1 ± 2.20 5x10⁻⁶ < 5x10⁻⁷,
p≤0.032* XLUHP
s 7.83 ± 10.73 12.33 ±
12.09 0.42 ± 0.64 5x10⁻⁶ < 5x10⁻⁷,
p≤0.0140* PBPs 1.58 ± 1.19 1.92 ± 0.86 1 ± 1.08 5x10⁻⁶ < 5x10⁻⁷,
p≤0.0483* P/PBPs 6.52 ± 1.16 12.46 ±
1.43 4.53 ± 1.07 5x10⁻⁶ < 5x10⁻⁷,
p≤0.0379* RPs 1.5 ± 0.50 11 ± 3.81 7 ± 1.80 None

75
Figure 1. Schematic diagram of an ablated hypostome.

76
Figure 1.

77
Figure 2. A side view of an ablated hypostome preparation after 24-hr regeneration.
Tentacle stubs are labeled TS. The hypostome (mouth) is labeled M.

78
Figure 2.

79
Figure 3. Schematic diagram of bath-applied method electrode placement.

80
Figure 3.

81
Figure 4. Sample recording from the bath-applied method with GSH 5x10⁻⁶ M. a)
control period (C2); b) treatment period (T1); c) treatment period (T2). Samples were
taken from comparable times after the addition of the test substance in each treatment
period, and control period C2. Diamonds (SUHPs), squares (MUHPs) and stars
(LUHPs).

82
Figure 4. a.
b.
c.

83
Figure 5. Schematic diagram of pipette-applied electrode placement.

84
Figure 5.

85
Figure 6. Sample recording from the pipette-applied method with GSH 5x10⁻⁶M. a)
treatment period (T1); b) treatment period (T2). Samples were taken from comparable
times after the addition of the test substance in each treatment period. Diamonds
(SUHPs), crosses (RPs), squares (MUHPs), stars (LUHPs) and arrows (PBPs).

86
Figure 6.
a.
b.

87
Figure 7. Log (mean) effects of GSH 5x10⁻⁷, GSH 5x10⁻⁷ + GABA 10-6, GSH 5x10⁻⁷ +
Phaclofen 10-8, GSH 5x10⁻⁷ + Baclofen 10-8, GSH 5x10⁻⁷ + Phaclofen 10-8 + Baclofen
10-8 on SUHPs in the bath-applied method. Control period BVC (C2). Data is
reported as means and standard deviations (µ ± s.d). * (significant differences).
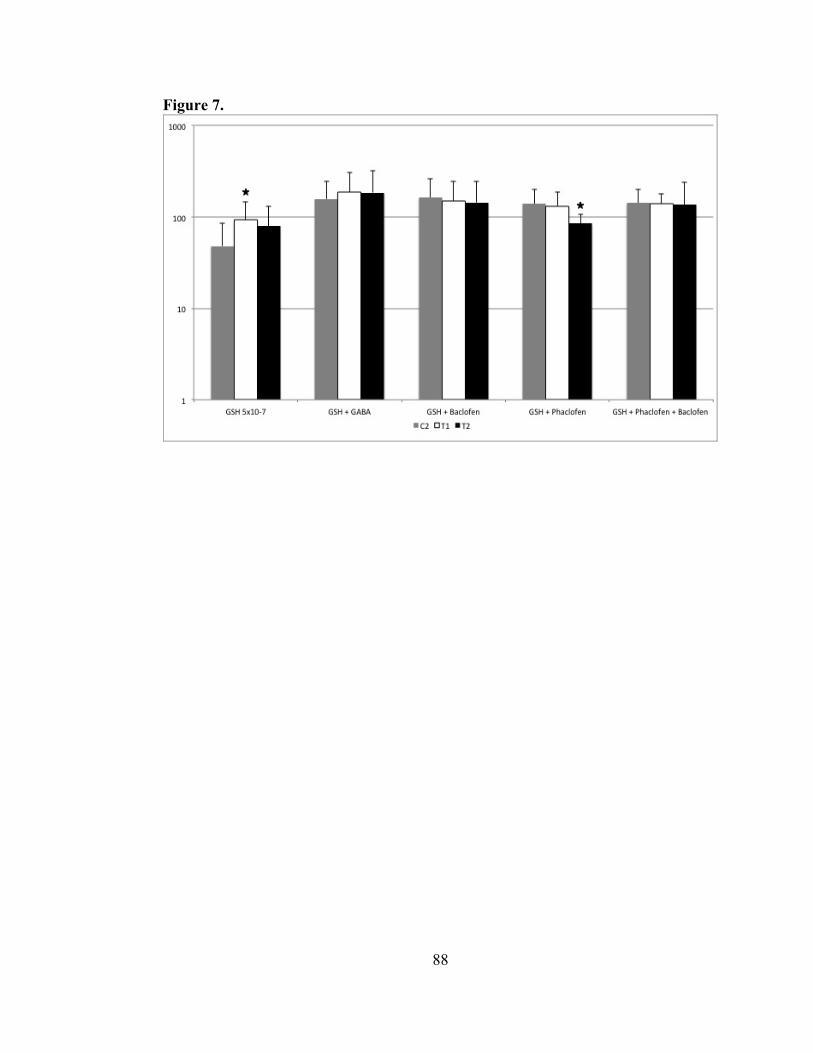
88
Figure 7.

89
Figure 8. Log (mean) effects of GSH 5x10⁻⁷, GSH 5x10⁻⁷ + GABA 10-6, GSH 5x10⁻⁷
+ Phaclofen 10-8, GSH 5x10⁻⁷ + Baclofen 10-8, GSH 5x10⁻⁷ + Phaclofen 10-8 +
Baclofen 10-8 on XLUHPs in the bath-applied method. Control period BVC (C2).
Data is reported as means and standard deviations (µ ± s.d). * (significant
differences), ** (potentially significant differences).

90
Figure 8.

91
Figure 9. The bath-applied method effect on the GSH dose response for SUHPs,
MUHPs and RPs. Data is reported as mean and standard deviation (SUHPs, MUHPs)
(µ ± s.d.) and means and standard error (RPs) (µ ± s.e). Black diamonds (SUHPs),
squares (MUHPs), white diamonds (RPs).

92
Figure 9.
0.01
0.1
1
10
100
1000
1 2 3
Log (mean) pulse
GSH 5x10-‐8 (1), GSH 5x10-‐7 (2), GSH 5x10-‐6 (3)
SUHP
MUHP
RP

93
Figure 10. The bath-applied method effect on the GSH dose response for LUHPs and
XLUHPs. Control is (C2) from bath-applied BVC. Data is reported as mean and
standard deviation (µ ± s.d.). Stars (LUHPs) and circles (XLUHPs).

94
Figure 10.
0.1
1
10
100
1 2 3
Log (mean) pulse
GSH 5x10-‐8 (1), GSH 5x10-‐7 (2), GSH 5x10-‐6 (3)
LUHP
XLUHP

95
Figure 11. The bath-applied method effect on the GSH dose response for PBPs and
P/PBPs. Control is (C2) from bath-applied BVC. Data is reported as mean and
standard deviation (PBPs) (µ ± s.d.) and means and standard error (P/PBPs) (µ ± s.e).
Black triangles (PBPs) and clear triangles (P/PBPs).

96
Figure 11.
0.01
0.1
1
10
1 2 3
Log (mean) pulse
GSH 5x10-‐8 (1), GSH 5x10-‐7 (2), GSH 5x10-‐6 (3)
PBP
P/PBP

97
Figure 12. Log (mean) effects of GSH 5x10⁻⁷, GSH 5x10⁻⁷ + GABA 10-6, GSH 5x10⁻⁷
+ Phaclofen 10-8, GSH 5x10⁻⁷ + Baclofen 10-8, GSH 5x10⁻⁷ + Phaclofen 10-8 +
Baclofen 10-8 on MUHPs in the pipette-applied method. Control period BVC (C1)
(C2). Data is reported as means and standard deviations (µ ± s.d). ** (potentially
significant differences).

98
Figure 12.

99
Figure 13. The pipette-applied method effect on the GSH dose response for LUHPs
and XLUHPs. Control is (C1) and (C2) from bath-applied BVC. Data is reported as
mean and standard deviation (µ ± s.d.). Stars (LUHPs) and circles (XLUHPs).

100
Figure 13.
0.1
1
10
100
1 2 3
Log (mean) pulse
GSH 5x10-‐8 (1), GSH 5x10-‐7 (2), GSH 5x10-‐6 (3)
LUHP
XLUHP
101
Figure 14. The pipette-applied method effect on the GSH dose response for PBPs and
P/PBPs. Control is (C1) and (C2) from bath-applied BVC. Data is reported as mean
and standard deviation (PBPs) (µ ± s.d.) and means and standard error (P/PBPs) (µ ±
s.e). Black triangles (PBPs) and clear triangles (P/PBPs).

102
Figure 14.
0.1
1
10
100
1 2 3
Log (mean) pulse
GSH 5x10-‐8 (1), GSH 5x10-‐7 (2), GSH 5x10-‐6 (3)
PBP
P/PBP

103
Figure 15. The pipette-applied method effect on the GSH dose response for SUHPS,
MUHPs and RPs. Control is (C1) and (C2) from bath-applied BVC. Data is reported
as mean and standard deviation (SUHPs, MUHPs) (µ ± s.d.) and means and standard
error (RPs) (µ ± s.e). Black diamonds (SUHPs), squares (MUHPs) and white
diamonds (RPs).

104
Figure 15.
1
10
100
1000
1 2 3
Log (mean) pulse
GSH 5x10-‐8 (1), GSH 5x10-‐7 (2), GSH 5x10-‐6 (3)
SUHP
MUHP
RP

105
Figure 16. Log (mean) effects of GSH 5x10⁻⁷, GSH 5x10⁻⁷ + GABA 10-6, GSH 5x10⁻⁷
+ Phaclofen 10-8, GSH 5x10⁻⁷ + Baclofen 10-8, GSH 5x10⁻⁷ + Phaclofen 10-8 +
Baclofen 10-8 on MUHPs in the bath-applied method. Control period BVC (C2).
Data is reported as means and standard deviations (µ ± s.d). * (significant
differences), ** (potentially significant differences).
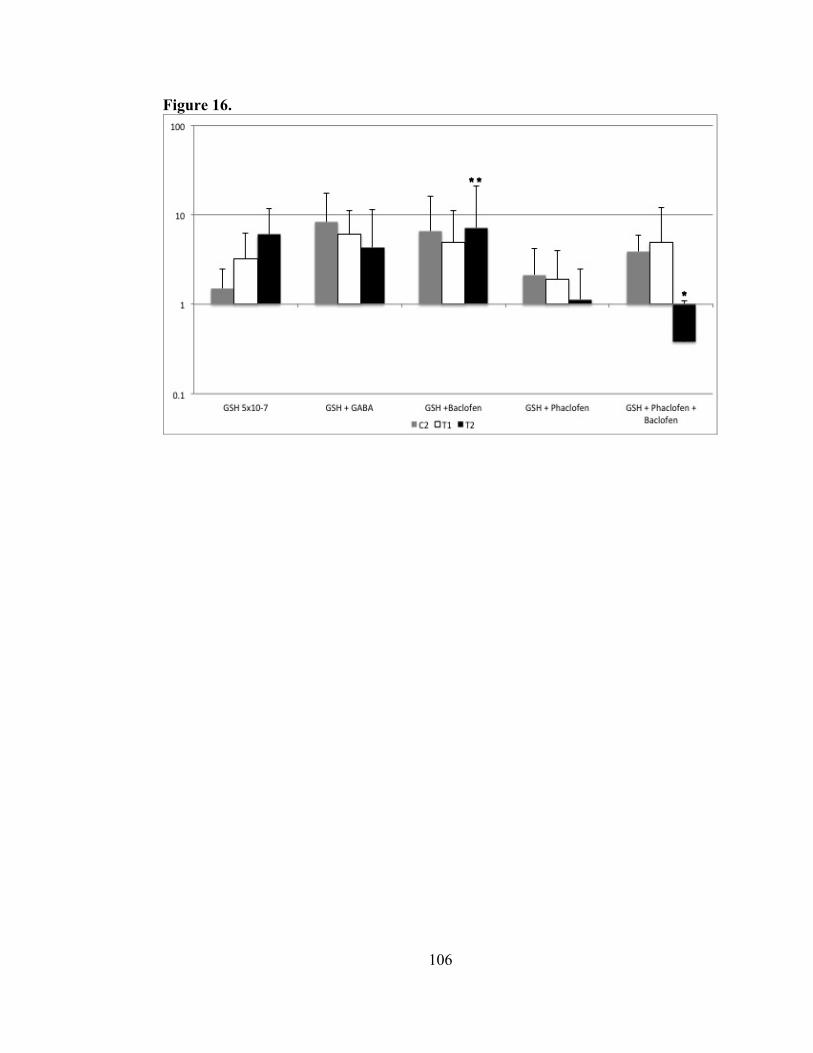
106
Figure 16.

107
Figure 17. Log (mean) effects of GSH 5x10⁻⁷, GSH 5x10⁻⁷ + GABA 10-6, GSH 5x10⁻⁷
+ Phaclofen 10-8, GSH 5x10⁻⁷ + Baclofen 10-8, GSH 5x10⁻⁷ + Phaclofen 10-8 +
Baclofen 10-8 on LUHPs in the bath-applied method. Control period BVC (C2). Data
is reported as means and standard deviations (µ ± s.d).
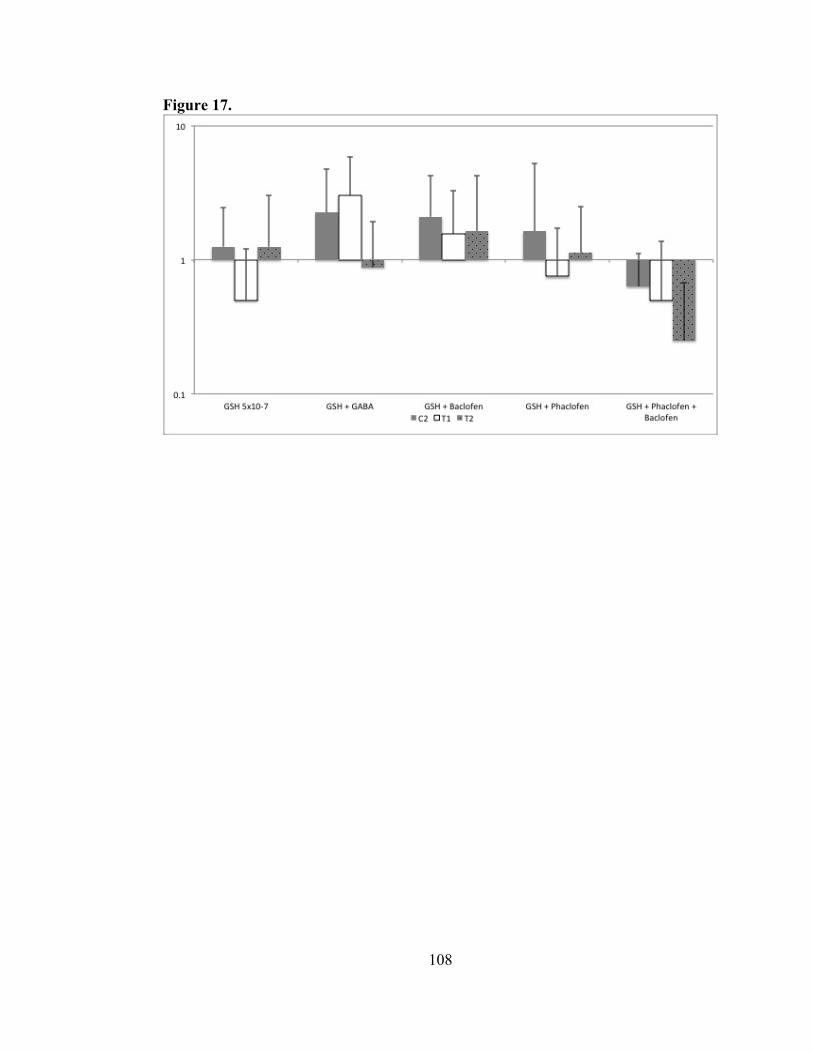
108
Figure 17.

109
Figure 18. Log (mean) effects of GSH 5x10⁻⁷, GSH 5x10⁻⁷ + GABA 10-6, GSH 5x10⁻⁷
+ Phaclofen 10-8, GSH 5x10⁻⁷ + Baclofen 10-8, GSH 5x10⁻⁷ + Phaclofen 10-8 +
Baclofen 10-8 on PBPs in the bath-applied method. Control period BVC (C2). Data is
reported as means and standard deviations (µ ± s.d).

110
Figure 18.

111
Figure 19. Log (mean) effects of GSH 5x10⁻⁷, GSH 5x10⁻⁷ + GABA 10-6, GSH 5x10⁻⁷
+ Phaclofen 10-8, GSH 5x10⁻⁷ + Baclofen 10-8, GSH 5x10⁻⁷ + Phaclofen 10-8 +
Baclofen 10-8 on P/PBPs in the bath-applied method. Control period BVC (C2). Data
is reported as means and standard error (µ ± s.e).

112
Figure 19.

113
Figure 20. Log (mean) effects of GSH 5x10⁻⁷, GSH 5x10⁻⁷ + GABA 10-6, GSH 5x10⁻⁷
+ Phaclofen 10-8, GSH 5x10⁻⁷ + Baclofen 10-8, GSH 5x10⁻⁷ + Phaclofen 10-8 +
Baclofen 10-8 on RPs in the bath-applied method. Control period BVC (C2). Data is
reported as means and standard error (µ ± s.e). * (significant differences).

114
Figure 20.

115
Figure 21. Log (mean) effects of GSH 5x10⁻⁷, GSH 5x10⁻⁷ + GABA 10-6, GSH 5x10⁻⁷
+ Phaclofen 10-8, GSH 5x10⁻⁷ + Baclofen 10-8, GSH 5x10⁻⁷ + Phaclofen 10-8 +
Baclofen 10-8 on LUHPs in the pipette-applied method. Control period BVC (C1)
(C2). Data is reported as means and standard deviations (µ ± s.d). * (significant
differences), ** (potentially significant differences).

116
Figure 21.

117
Figure 22. Log (mean) effects of GSH 5x10⁻⁷, GSH 5x10⁻⁷ + GABA 10-6, GSH 5x10⁻⁷
+ Phaclofen 10-8, GSH 5x10⁻⁷ + Baclofen 10-8, GSH 5x10⁻⁷ + Phaclofen 10-8 +
Baclofen 10-8 on P/PBPs in the pipette-applied method. Control period BVC (C1)
(C2). Data is reported as means and standard error (µ ± s.e). * (significant
differences), ** (potentially significant differences).

118
Figure 22.

119
Figure 23. Log (mean) effects of GSH 5x10⁻⁷, GSH 5x10⁻⁷ + GABA 10-6, GSH 5x10⁻⁷
+ Phaclofen 10-8, GSH 5x10⁻⁷ + Baclofen 10-8, GSH 5x10⁻⁷ + Phaclofen 10-8 +
Baclofen 10-8 on XLUHPs in the pipette-applied method. Control period BVC (C1)
(C2). Data is reported as means and standard deviations (µ ± s.d). * (significant
differences).
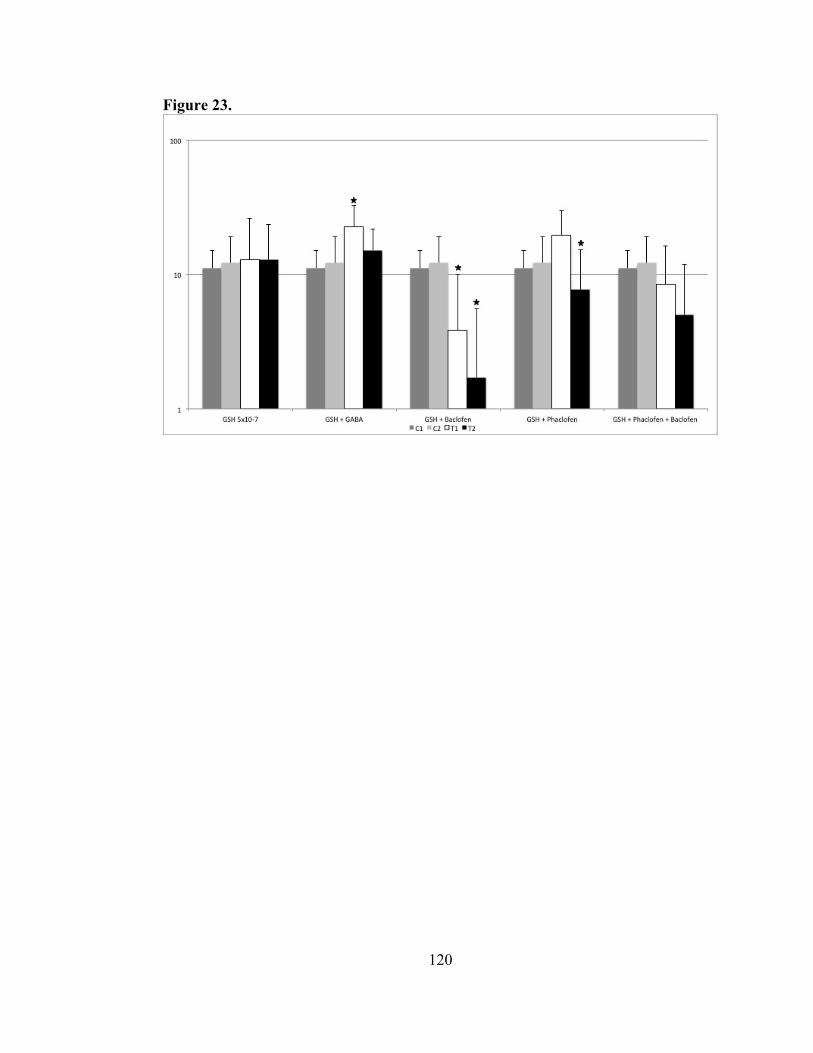
120
Figure 23.

121
Figure 24. Log (mean) effects of GSH 5x10⁻⁷, GSH 5x10⁻⁷ + GABA 10-6, GSH 5x10⁻⁷
+ Phaclofen 10-8, GSH 5x10⁻⁷ + Baclofen 10-8, GSH 5x10⁻⁷ + Phaclofen 10-8 +
Baclofen 10-8 on RPs in the pipette-applied method. Control period BVC (C1) (C2).
Data is reported as means and standard error (µ ± s.e). * (significant differences).

122
Figure 24.

123
Figure 25. Sample recording with GSH 5x10⁻⁷ and GABA 10-6 in a) control (C2)
bath-applied b) GSH 5x10⁻⁷ + GABA 10-6 (T2) bath-applied method c) control (C2)
bath-applied method d) GSH 5x10⁻⁷ + GABA 10-6 pipette-applied method. Diamonds
(SUHPs), squares (MUHPs), stars (LUHPs) and arrows (PBPs).

124
Figure 25. a.
b.
c.
d.

125
Figure 26. Log (mean) effects of GSH 5x10⁻⁷, GSH 5x10⁻⁷ + GABA 10-6, GSH 5x10⁻⁷
+ Phaclofen 10-8, GSH 5x10⁻⁷ + Baclofen 10-8, GSH 5x10⁻⁷ + Phaclofen 10-8 +
Baclofen 10-8 on SUHPs in the pipette-applied method. Control period BVC (C1)
(C2). Data is reported as means and standard deviations (µ ± s.d). * (significant
differences), ** (potentially significant differences).

126
Figure 26.

127
Figure 27: Sample recording from the bath-applied and pipette-applied experiment. a)
control period BVC (C2); b) treatment period (T1) with GSH 5x10⁻⁷M pipette-applied
c) treatment period (T1) with GSH 5x10⁻⁷M + Baclofen 1x10⁻⁸M bath-applied d)
treatment period (T1) with GSH 5x10⁻⁷M + Baclofen 1x10⁻⁸M pipette-applied .
Samples were taken from equivalent times after the addition of the test substance in
each period, and control period (C2). Diamonds (SUHPs), squares (MUHPs), stars
(LUHPs), crosses (RPs) and arrows (PBPs).

128
Figure 27. a.
b.
c.
d.

129
Figure 28. Log (mean) effects of GSH 5x10⁻⁷, GSH 5x10⁻⁷ + GABA 10-6, GSH 5x10⁻⁷
+ Phaclofen 10-8, GSH 5x10⁻⁷ + Baclofen 10-8, GSH 5x10⁻⁷ + Phaclofen 10-8 +
Baclofen 10-8 on PBPs in the pipette-applied method. Control period BVC (C1) (C2).
Data is reported as means and standard deviations (µ ± s.d). ** (potentially significant
differences).

130
Figure 28.

131
Figure 29. Sample recording from the bath-applied and pipette-applied method. a)
control period BVC (C2) b) treatment period (T2) with GSH 5x10⁻⁷M pipette-applied
c) treatment period (T2) with GSH 5x10⁻⁷M + Phaclofen 1x10⁻⁸M bath-applied d)
treatment period (T2) with GSH 5x10⁻⁷M + Phaclofen 1x10⁻⁸M pipette-applied.
Samples were taken from equivalent times after the addition of the test substance in
each period, and control period. Diamonds (SUHPs), squares (MUHPs), stars
(LUHPs), arrows (PBPs) and crosses (RPs).

132
Figure 29.
a.
b.
c.
d.

133
Figure 30: Sample recording from the bath-applied method and the pipette-applied
method. a) control period BVC (C2) b) treatment period (T2) with GSH 5x10⁻⁷ M
pipette-applied c) treatment period (T2) with GSH 5x10⁻⁷ M + Baclofen 1x10⁻⁸M +
Phaclofen 1x10⁻⁸M bath-applied d) treatment period (T2) with GSH 5x10⁻⁷ M +
Baclofen 1x10⁻⁸M + Phaclofen pipette-applied. Samples were taken from equivalent
times after the addition of the test substance in each period, and control period.
Diamonds (SUHPs), squares (MUHPs) and crosses (RPs).

134
Figure 30: a.
b.
c.
d.

135
Figure 31: Sample recording from the pipette-applied experiment. a) control period
BVC (C2) b) treatment period (T2) with GSH 5x10⁻⁷. c) treatment period (T2) with
GSH 5x10⁻⁷ + GABA 10-6 c) treatment period (T2) with GSH 5x10⁻⁷ + Baclofen 10-8
d) treatment period (T2) with GSH 5x10⁻⁷M + Phaclofen 1x10⁻⁸M e) treatment period
(T2) with GSH 5x10⁻⁷M + Baclofen 1x10⁻⁸M + Phaclofen 1x10⁻⁸M. Samples were
taken from equivalent times after the addition of the test substance in each period, and
control period (C2). Diamonds (SUHPs), squares (MUHPs) and stars (LUHPs).

136
Figure 31. a.
b.
c.
d.
e.

137
APPENDIX: Raw Data
GSH 5x10⁻⁶: Bath-Applied Method
GSH 5x10-‐6M C2
Trial SUHP MUHP LUHP XLUHP PBP P/B RP
1 74 8 3 0 1 13 0
2 118 0 3 10 1 10 6
3 134 6 0 1 1 8 0
4 30 0 0 0 0 0 0
5 17 0 0 0 1 7 0
6 319 0 4 21 3 9 2
7 168 1 1 6 1 18 7
Sum 860 15 11 38 8 65 15
GSH 5x10-‐6M T1
Trial SUHP MUHP LUHP XLUHP PBP P/B RP
1 313 21 0 1 0 0 0
2 298 9 0 1 0 0 0
3 343 13 1 0 0 0 5
4 353 15 1 0 0 0 2
5 235 21 2 2 0 0 17
6 306 1 0 2 0 0 12
7 211 2 0 8 0 0 4
Sum 2059 82 4 14 0 0 40
GSH 5x10-‐6M T2
Trial SUHP MUHP LUHP XLUHP PBP P/B RP
1 117 9 2 0 0 0 2
2 225 4 0 0 0 0 0
3 148 0 0 0 0 0 2
4 102 5 5 9 2 9.5 8
5 243 1 4 5 0 0 7
6 322 7 0 1 0 0 17
7 275 1 0 9 0 0 8
Sum 1432 27 11 24 2 9.5 44

138
GSH 5x10⁻⁶: Pipette-Applied Method
GSH 5x10-‐6M T1
Trial SUHP MUHP LUHP XLUHP PBP P/B RP
1 351 6 2 0 0 0 23
2 226 2 0 0 0 0 2
3 251 2 0 0 2 3.5 6
4 159 1 1 1 0 0 7
5 41 4 0 0 1 4 9
6 31 11 1 2 3 9 2
7 30 0 0 0 2 5.5 0
Sum 1089 26 4 3 8 22 49
GSH 5x10-‐6M T2
Trial SUHP MUHP LUHP XLUHP PBP P/B RP 1 424 9 8 1 0 6.33 21
2 256 19 0 0 2 12.5 4
3 331 1 0 1 0 4.5 3 4 144 2 0 0 0 0 8
5 35 5 0 0 2 9 6
6 28 16 0 0 2 12 7 7 24 0 0 0 2 8.5 0
Sum 1242 52 8 2 8 52.83 49

139
GSH 5x10⁻⁷: Bath-Applied
GSH 5x10-‐7M C2
Trial SUHP MUHP LUHP XLUHP PBP P/B RP
1 50 1 0 8 1 7 0
2 44 1 3 4 0 0 1 3 10 3 1 1 1 5 0
4 27 2 2 6 1 10 0
5 2 0 0 0 0 0 0
6 56 1 1 5 1 4 4
7 66 3 3 4 1 8 1
8 131 1 0 2 0 0 0 Sum 386 12 10 30 5 34 6 GSH 5x10-‐7M T1
Trial SUHP MUHP LUHP XLUHP PBP P/B RP
1 191 1 0 12 1 12 0
2 118 8 0 2 0 0 2
3 43 3 0 0 0 0 1
4 74 0 1 3 0 0 1
5 10 0 0 0 0 0 0
6 83 5 0 5 0 0 5
7 80 2 1 4 0 0 0
8 144 7 2 3 0 0 0
Sum 743 26 4 29 1 12 9
GSH 5x10-‐7M T2
Trial SUHP MUHP LUHP XLUHP PBP P/B RP
1 159 0 0 11 1 12 1
2 50 18 0 0 1 21 0
3 127 10 0 0 0 0 0
4 24 2 5 1 1 8 1
5 2 6 0 0 1 6 0
6 72 5 3 0 1 6 0
7 137 7 2 2 0 0 3
8 63 0 0 0 0 0 0
Sum 634 48 10 14 5 53 5
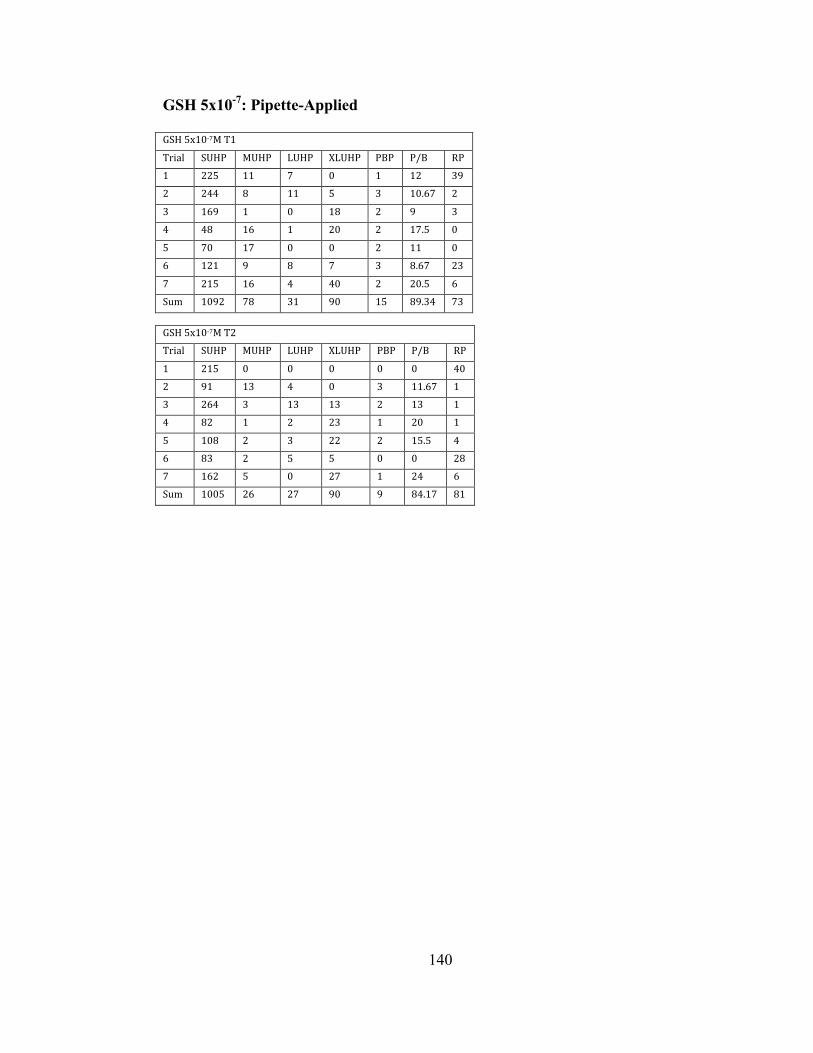
140
GSH 5x10⁻⁷: Pipette-Applied
GSH 5x10-‐7M T1
Trial SUHP MUHP LUHP XLUHP PBP P/B RP
1 225 11 7 0 1 12 39
2 244 8 11 5 3 10.67 2
3 169 1 0 18 2 9 3
4 48 16 1 20 2 17.5 0
5 70 17 0 0 2 11 0
6 121 9 8 7 3 8.67 23
7 215 16 4 40 2 20.5 6
Sum 1092 78 31 90 15 89.34 73
GSH 5x10-‐7M T2
Trial SUHP MUHP LUHP XLUHP PBP P/B RP
1 215 0 0 0 0 0 40
2 91 13 4 0 3 11.67 1
3 264 3 13 13 2 13 1
4 82 1 2 23 1 20 1
5 108 2 3 22 2 15.5 4
6 83 2 5 5 0 0 28
7 162 5 0 27 1 24 6
Sum 1005 26 27 90 9 84.17 81

141
GSH 5x10⁻⁸: Bath-Applied
GSH 5x10-‐8M C2
Trial SUHP MUHP LUHP XLUHP PBP P/B RP
1 112 0 0 12 1 12 12
2 184 6 4 7 1 14 13 3 294 6 2 25 3 10.6 1
4 42 0 0 0 0 0 14
5 106 21 5 6 2 12 0
6 272 6 1 17 2 8 9
7 121 7 4 6 3 8.6 0
8 172 2 1 8 1 9 1 Sum 1303 48 17 81 13 74.2 50 GSH 5x10-‐8M T1
Trial SUHP MUHP LUHP XLUHP PBP P/B RP
1 253 1 0 1 0 0 1
2 98 8 0 0 0 0 8
3 348 9 2 8 2 7 1
4 36 1 0 0 0 0 1
5 91 12 1 0 1 16 0
6 127 23 1 21 2 9.5 1
7 174 2 0 11 1 12 1
8 261 4 1 1 0 0 0
Sum 1388 60 5 42 6 44.5 13
GSH 5x10-‐8M T2
Trial SUHP MUHP LUHP XLUHP PBP P/B RP
1 276 0 0 0 0 0 2
2 98 1 1 16 1 12 3
3 137 4 1 11 1 11 0
4 57 0 1 0 0 0 0
5 91 13 0 0 2 6 2
6 267 18 0 15 1 12 1
7 67 0 0 1 0 0 0
8 176 1 0 0 0 0 0
Sum 1169 37 3 43 5 41 8

142
GSH 5x10⁻⁸: Pipette-Applied
GSH 5x10-‐8M T1
Trial SUHP MUHP LUHP XLUHP PBP P/B RP
1 360 23 6 33 1 13 1
2 38 3 0 2 4 5.25 4 3 62 11 1 5 3 6.33 1
4 80 3 4 9 3 6.67 1
5 26 2 2 3 1 6 1
6 215 0 0 0 0 0 4
Sum 781 42 13 52 12 37.25 12 GSH 5x10-‐8M T2
Trial SUHP MUHP LUHP XLUHP PBP P/B RP
1 64 8 1 29 2 13.5 1 2 18 5 1 0 1 6 1
3 34 3 1 7 2 9.5 1
4 108 1 2 2 1 8 3
5 39 1 0 4 1 4 1
6 167 0 0 0 0 0 4
Sum 430 18 5 42 7 41 11

143
GSH + GABA: Bath-Applied
GSH GABA C2
Trial SUHP MUHP LUHP XLUHPS PBP P/B RP
1 162 7 3 11 1 18 4
2 227 30 7 8 0 0 1 3 306 1 0 4 0 0 5
4 253 12 4 15 1 14 4
5 78 1 4 7 1 10 5
6 106 2 0 2 0 0 1
7 79 12 0 0 1 11 0
8 50 1 0 8 1 9 1 Sum 1261 66 18 55 5 62 21 GSH GABA T1
Trial SUHP MUHP LUHP XLUHP PBP P/B RP
1 169 0 3 13 1 16 6
2 185 17 2 4 0 0 1
3 391 6 3 9 1 10 4
4 390 3 0 1 0 0 6
5 94 9 7 10 1 26 0
6 127 2 1 14 1 15 1
7 49 5 8 1 1 12 0
8 84 7 0 1 0 0 2
Sum 1489 49 24 53 5 79 20
GSH GABA T2
Trial SUHP MUHP LUHP XLUHP PBP P/B RP
1 141 1 2 16 1 19 4
2 210 0 0 2 0 0 1
3 492 0 0 0 0 0 2
4 280 22 3 2 0 0 3
5 42 1 1 0 0 0 1
6 79 1 1 2 0 0 4
7 79 1 0 0 1 10 0
8 160 8 0 0 0 0 2
Sum 1483 34 7 22 2 29 17

144
GSH + GABA: Pipette-Applied
GSH GABA T1
Trial SUHP MUHP LUHP XLUHP PBP P/B RP
1 235 6 1 5 2 7 12
2 154 1 1 22 4 7 10
3 256 25 15 16 1 20 13
4 365 4 1 26 2 11 3
5 147 8 3 23 3 9.67 9
6 277 2 2 27 2 15 2
7 141 0 0 40 3 13.67 3
Sum 1575 46 23 159 17 83.34 52
GSH GABA T2
Trial SUHP MUHP LUHP XLUHP PBP P/B RP
1 127 1 9 8 2 8.5 12
2 112 0 2 19 1 15 7 3 147 13 22 3 3 13 6
4 191 2 1 24 1 25 3
5 193 6 2 19 2 19.5 3
6 178 1 0 16 1 16 1
7 236 0 1 16 1 16 3
Sum 1184 23 37 105 11 113 35

145
GSH + Phaclofen: Bath-Applied
GSH Phaclofen C2
Trial SUHP MUHP LUHP XLUHP PBP P/PBP RP
1 115 0 0 7 0 0 6
2 103 1 2 4 2 7 2 3 46 0 11 11 2 11 1
4 260 5 0 16 1 17 8
5 171 2 0 15 2 8 10
6 162 6 0 0 1 5 27
7 120 2 0 25 1 14 5
8 147 1 0 20 1 19 2 Sum 1124 17 13 98 10 81 61 GSH Phaclofen T1
Trial SUHP MUHP LUHP PBP P/PBP RP
1 115 0 0 19 1 14 1
2 87 2 0 7 1 9 0
3 50 2 3 16 1 12 3
4 245 7 1 0 0 0 17
5 138 0 0 14 1 15 16
6 110 1 1 2 0 0 2
7 185 2 0 23 2 11.5 1
8 128 1 1 3 1 15 2
Sum 1058 15 6 84 7 76.5 42
GSH Phaclofen T2
Trial SUHP MUHP LUHP PBP P/PBP RP
1 91 0 0 15 1 12 0
2 73 0 1 8 2 7.5 1
3 52 0 0 0 0 0 2
4 88 1 0 13 1 12 10
5 86 0 2 5 0 0 9
6 81 4 2 5 1 20 3
7 133 2 0 21 2 10.5 2
8 76 2 4 16 1 15 0
Sum 680 9 9 83 8 77 27

146
GSH + Phaclofen: Pipette-Applied
GSH Phaclofen T1
Trial SUHP MUHP LUHP XLUHP PBP P/B RP
1 320 12 5 37 1 37 9
2 260 9 19 25 2 23 0
3 133 2 9 24 4 7.75 2
4 200 7 1 17 3 6.33 2
5 93 6 0 3 0 0 6
6 103 8 5 10 2 7.5 5
7 205 1 0 20 3 6.33 3
Sum 1314 45 39 136 15 87.91 27
GSH Phaclofen T2
Trial SUHP MUHP LUHP XLUHP PBP P/B RP
1 204 9 4 15 1 21 12
2 195 8 14 0 1 22 1
3 74 4 7 15 2 11 0
4 294 23 5 2 0 0 0
5 194 11 2 1 0 0 0
6 131 2 1 2 0 0 2
7 130 0 0 19 2 9.5 4
Sum 1222 57 33 54 6 63.5 19

147
GSH + Baclofen: Bath-Applied
GSH Baclofen C1
Trial SUHP MUHP LUHP XLUHP PBP P/B RP
1 303 4 0 0 0 0 3
2 76 7 6 11 2 9.5 1
3 206 8 1 14 2 11.5 2
4 228 3 4 15 1 16 2
5 45 1 0 0 2 16.5 0
6 26 0 0 0 2 5.5 4
7 299 34 4 3 0 0 3
8 72 1 0 0 0 0 4
9 234 3 0 0 1 17 21
10 155 3 1 16 1 10 16
11 162 8 7 5 1 8 40
Sum 1806 72 23 64 12 94 96
GSH BACLOFEN T1
Trial SUHP MUHP LUHP XLUHP PBP P/B RP 1 350 4 1 0 0 0 1
2 207 3 3 17 2 7 0 3 93 4 2 6 1 7 2
4 217 0 0 13 0 0 2
5 59 0 0 0 4 13.75 0 6 28 0 0 0 0 0 0
7 237 22 4 0 0 0 13
8 39 0 0 0 1 9 5 9 127 3 5 3 1 10 0
10 166 2 1 0 0 0 8 11 127 16 1 11 2 7.5 16
Sum 1650 54 17 50 11 54.25 47
GSH BACLOFEN T2
Trial SUHP MUHP LUHP XLUHP PBP P/B RP
1 30 3 0 2 0 0 4 2 329 47 9 2 0 0 1
3 286 2 1 0 0 0 3 4 207 3 2 4 1 4 0
5 41 0 0 0 3 11 0
6 39 0 0 0 0 0 0 7 191 17 2 10 1 11 7
8 40 2 0 0 0 0 5
9 141 0 1 5 1 12 0 10 154 2 0 0 0 0 4
11 132 3 3 16 1 15 18 Sum 1590 79 18 39 7 53 42

148
GSH + Baclofen: Pipette-Applied
GSH Baclofen T1
Trial SUHP MUHP LUHP XLUHP PBP P/B RP
1 66 1 1 0 0 0 2
2 91 10 5 9 3 7.67 3
3 38 0 1 0 0 0 8
4 86 13 2 1 3 5.66 4
5 93 1 2 17 3 6 2
6 64 1 0 0 0 0 1
7 39 3 0 0 0 0 10
Sum 477 29 11 27 9 19.33 30
GSH Baclofen T2
Trial SUHP MUHP LUHP XLUHP PBP P/B RP
1 48 0 0 0 0 0 2
2 50 5 8 11 2 10.5 1
3 26 3 0 0 3 7.33 8
4 64 19 2 0 3 9 0
5 31 8 3 1 1 12 1
6 31 5 5 0 2 6 3
7 56 1 0 0 0 0 8
Sum 306 41 18 12 11 44.83 23

149
GSH + Baclofen + Phaclofen: Bath-Applied
GSH PHAC BAC C2
Trial SUHP MUHP LUHP XLUHPS PBP P/B RP
1 69 3 1 0 0 0 11
2 142 5 1 1 0 0 5 3 114 1 0 10 1 8 5
4 100 3 1 1 0 0 16
5 241 2 0 19 2 7 4
6 127 7 0 1 0 0 8
7 238 3 1 15 1 8 14
8 116 7 1 9 1 7 7 Sum 1147 31 5 56 5 30 70 GSH PHAC BAC T1
Trial SUHP MUHP LUHP XLUHPS PBP P/B RP
1 71 10 0 0 1 6 10
2 165 5 2 3 0 0 6
3 178 0 0 7 0 0 0
4 82 1 0 0 0 0 4
5 142 0 0 11 1 11 5
6 155 1 0 0 0 0 3
7 160 0 0 2 0 0 18
8 165 22 2 1 0 0 1
Sum 1118 39 4 24 2 17 47 GSH PHAC BAC T2
Trial SUHP MUHP LUHP XLUHPS PBP P/B RP
1 118 2 1 0 0 0 4
2 85 0 0 9 1 9 4
3 37 0 0 12 1 12 0
4 9 0 0 2 0 0 2
5 84 0 0 13 1 12 1
6 178 0 0 0 0 0 0
7 328 0 1 12 1 15 12
8 251 1 0 0 0 0 2
Sum 1090 3 2 48 4 48 25
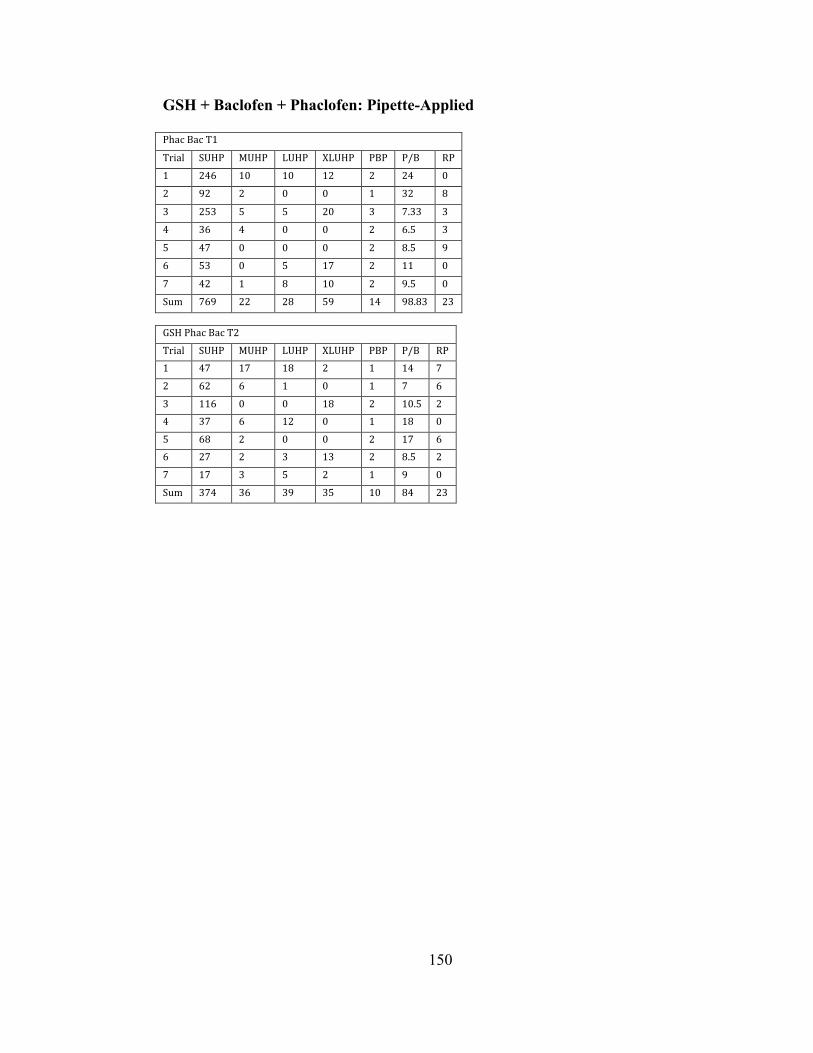
150
GSH + Baclofen + Phaclofen: Pipette-Applied
Phac Bac T1
Trial SUHP MUHP LUHP XLUHP PBP P/B RP
1 246 10 10 12 2 24 0
2 92 2 0 0 1 32 8
3 253 5 5 20 3 7.33 3
4 36 4 0 0 2 6.5 3
5 47 0 0 0 2 8.5 9
6 53 0 5 17 2 11 0
7 42 1 8 10 2 9.5 0
Sum 769 22 28 59 14 98.83 23
GSH Phac Bac T2
Trial SUHP MUHP LUHP XLUHP PBP P/B RP 1 47 17 18 2 1 14 7
2 62 6 1 0 1 7 6
3 116 0 0 18 2 10.5 2 4 37 6 12 0 1 18 0
5 68 2 0 0 2 17 6 6 27 2 3 13 2 8.5 2
7 17 3 5 2 1 9 0
Sum 374 36 39 35 10 84 23

151
BVC: Pipette-Applied
BVC C1
Trial SUHP MUHP LUHP XLUHP PBP P/B RP
1 156 6 1 15 1 15 5
2 249 0 0 12 2 8.5 0
3 455 12 1 15 2 9.5 3
4 128 9 2 5 1 8 0
5 156 6 1 15 1 15 7
6 123 2 0 8 2 4 10
7 173 9 1 8 1 5 2
Sum 1440 44 6 78 10 65 27
BVC C2
Trial SUHP MUHP LUHP XLUHP PBP P/PBP RP
1 136 4 0 20 2 10.5 0
2 129 0 0 18 1 10 0
3 262 2 6 11 2 8 3
4 130 11 1 8 1 8 2
5 136 4 0 20 2 10.5 0
6 146 0 0 8 2 4 10
7 355 0 0 0 0 0 2
Sum 1294 21 7 85 10 51 17

152
BIBLIOGRAPHY
Bellis, S.L., Grosvenor, W., Kass-Simon, G., and Rhoads, D.E. (1991).
Chemoreception in Hydra vulgaris (attenuata): initial characterization of two
distinct binding sites for L glutamic acid. Biochimica et Biophysica Acta, 106,
189-94.
Bellis, S.L., Kass-Simon, G., and Rhoads, D.E. (1992). Partial characterization and
detergent solubilization of the putative glutathione chemoreceptor from Hydra.
Biochemistry, 31, 9838-43.
Bellis, S.L., Laux, D., and Rhoads, D.E. (1994). Affinity purification of Hydra
glutathione binding proteins. FEBS Letters, 354, 320-4.
Bormann, J. (1988) Electrophysiology of GABAA and GABAB receptor subtypes.
Trends Neurosci, 11, 112-116.
Concas, A., P. Pierobon, M. C. Mostallino, P. Porcu, G. Marino, R. Minei, and G.
Biggio. (1998). Modulation of γ-amino-butyric acid (GABA) receptors and
feeding response by neurosteroids in Hydra vulgaris. Neuroscience, 85, 979-
988.
Daniel, W. W. (1990). Applied Nonparametric Statistics, second edition. PWS-Kent,
Boston, 274-275.
Grimmelikhuijzen, C. J. P. (1984). Peptides in the nervous system of coelenterates. In:
S. Falkmer, R. Hakanson, F. Sundler (eds), Evolution and Tumor Pathology of
the Neuroendocrine System, 39-58.

153
Grosvenor, W., Bellis, S.L., Kass-Simon, G., and Rhoads, D.E. 1992. Chemoreception
in Hydra: specific binding of glutathione to a membrane fraction. Biochimica
et Biophysica Acta, 1117, 120-125.
Grosvenor, W., D. Rhoads, Kass-Simon, G. (1996). Chemoreceptive control of the
feeding process in hydra. Chemical Senses, 21, 313-321.
Hadzi, H. (1909). Über das Nervensystem von Hydra. Arb Zool Inst Univ Wein, 17,
225-268.
Haug, G. (1933). Die Lichtreaktionen der Hydren. Z. verl. Physiol, 19, 246-303.
Heiman, G. (2014). Basic Statistics for the Behavioral Sciences. Wadsworth,
California, 265-272.
Kass-Simon, G. (1972). Longitudinal conduction and contraction burst pulses from
hypostomal excitation loci in Hydra attenuata. Journal of Comparative
Physiology, 80, 29-49.
Kass-Simon, G. (1973). Transmitting systems in Hydra. Seto marine biological
laboratory, 20, 583-593.
Kass-Simon, G., Hufnagel, L.A. (1992). Suspected chemoreceptors in coelenterates
and ctenophores. Microscopy Research and Technique, 22, 265-284.
Kass-Simon, G., Passano, L.M. (1978). A neuropharmacological analysis of the
pacemakers and conducting tissues of Hydra attenuta. Journal of Comparative
Physiology, 128, 71-79.
Kass-Simon, G., Pierobon, P. (2007). Cnidarian neurochemical transmission: an
updated overview. Comp. Biochem. Physiol. A, 1446, 9-25.

154
Kass-Simon G, Pannaccione A, Pierobon P. (2003). GABA and glutamate receptors
are involved in modulating pacemaker activity in hydra. Comp. Biochem.
Physiol. A Mol Integr Physiol, 136, 329-342.
Kass-Simon, G., Scappaticci, A.A. (2002). The developmental and behavioral
physiology of nematocysts. Can. J. Zool, 80, 1772-1794.
Kass-Simon, G., Zompa, M.A., Scappaticci, A.A., Zackroff, R.V., Hufnagel, L.A.
(2009). Nucleolar binding of an anti-NMDA receptor antibody in hydra: a non-
canonical role for an NMDA receptor protein? J. Exp Zool A Ecol Genet
Physiol, 10, 763-765.
Kay, J.C., Kass-Simon, G. (2009). Glutamatergic Transmission in Hydra: NMDA/D-
Serine Affects the Electrical Activity of the Body and Tentacles of Hydra
vulgaris (Cnidaria, Hydrozoa). Biol. Bull, 210, 113-125.
Kinnamon, J. C., and J. A. Westfall (1981) A three-dimensional serial reconstruction
of neuronal distributions in the hypostome of a Hydra. J. Morphol, 168, 321–
329.
Kinnamon, J.C., and J.A. Westfall. (1982). Types of neurons and synaptic connections
at hypostome-tentacle junctions in Hydra. J. Morphol, 173, 119-128.
Koizumi, O. (2007). Nerve ring of the hypostome in hydra: is it an origin of the central
nervous system of bilaterian animals? Brain Behav Evol. 69, 151-159.
Koizumi, O., M. Itazawa, H. Mizumoto, S. Minobe, L. Javois, C.J.P.
Grimmelikhuijzen, and H.R. Bode. (1992). Nerve Ring of the hypostome in
Hydra. I. Its structure and maintenance. J. Comp. Neurol, 326, 7-21.

155
Lenhoff, H., Bovaird, J. (1961). Action of glutamic acid and glutathione analogues
on the Hydra glutathione-receptor. Nature, 189, 486-487.
Loomis, W.F. (1955). Glutathione control of the specific feeding reactions of Hydra.
Ann. New York Acad. Sci, 62, 208-209. Loomis, W.F., Lenhoff, H.M. (1956). Growth and sexual differentiation of Hydra in
mass ulture. Journal of Experimental Zoology, 132, 555-573.
Meier, C., Dermietzel, R. (2006). Electrical Synapses- Gap Junctions in the Brain.
Cell Communication in Nervous and Immune System, 43, 99-128.
Nandivada, V. Kass-Simon, G. (2006, October). The effect of reduced glutathione
(GSH) on the electrical activity of the hypostome of Hydra vulgaris. Poster
session presented at the meeting of Society for Neuroscience, San Diego.
Olsen, R.W, DeLorey, T.M. (1999). "Chapter 16: GABA and Glycine". In Siegel
G.J., Agranoff, B.W., Fisher, S.K., Albers, R.W., Uhler, M.D. Basic
neurochemistry: molecular, cellular, and medical aspects (Sixth ed.).
Philadelphia: Lippincott- Raven.
Passano, L.M., McCullough, C.B. (1962). Light response and the rhythmic
potentials of Hydra. Proceedings of the National Academy of Science of the
Unites States of America, 48, 1376-1382.
Passano, L.M., McCullough, C.B. (1963). Pacemaker hierarchies controlling behavior of Hydra. Nature, 199, 1174-1175.
Passano, L.M., McCullough, C.B. (1964). Coordinating systems and behavior in
Hydra: I. Pacemaker system of the periodic contractions. Journal of
Experimental Biology, 41, 643-644.
156
Passano, L.M., McCullough, C.B. (1965). Coordinating systems in Hydra: the
rhythmic potential system. J. Exp. Biol, 42, 205-231.
Pierobon, P., Concas, A., Santoro, G., Marino, R., Minei, A., Panacione, M.,
Mostallino, C., Biggio, G. (1995). Biochemical and functional identification
of GABA receptors in Hydra vulgaris. Life Sci, 56, 1485-1497.
Pierobon, P., Sogliano, C., Minei, R., Tino, A., Porcu, P., Marino, Tortiglione, C.,
Concas, A. (2004). Putative NMDA receptors in Hydra: a biochemical and
behavioral study. European Journal of Neuroscience, 20, 2598-2604.
Ruggieri, R.D., Pierobon, P., Kass-Simon, G. (2004). Pacemaker activity in Hydra
is modulated by glycine receptor ligands. Journal of Comparative
Biochemistry and Physiology, 138A, 193-202.
Rushforth, N.B., Burke, D.S. (1971). Behavioral and electrophysiological studies of
Hydra: II. Pacemaker activity of isolated tentacles. Biological Bulletin, 140, 502-519.
Scappaticci, A.A. and Kass-Simon, G. (2008). NMDA and GABAB receptors are
involved in controlling nematocyst discharge in hydra. Comp. Biochem.
Physiol. Part A, 150, 415-422.
Scappaticci, A., Jacques, R., Carroll, J., Hufnagel, L., Kass-Simon, G. (2004).
Immunocytochemical evidence for an NMDA1 receptor subunit in dissociated cells
of Hydra vulgaris, 316, 263-270.
Siegel, S. (1956). Non-Parametric Statistics for the Behavioral Sciences.
McGraw-Hill, New York, 83-87.

157
Slautterback, D.B. (1967). Coated vesicles in absorptive cells of Hydra. J. Cell Sci.
2, 563-572.
Technau, U., Holstein, T.W. (1995). Head formation in Hydra is different in apical
and basal tissue. Development, 121, 1273-1282.
Venturini, G. (1987). The hydra GSH receptor. Pharmacological and radioligand
binding studies. Comp. Biochem. Physiol., 87C, 321-324.
Wilson, E.B. (1891). The heliotropism of hydra. Amer. Nat, 25, 413-433.
Wood, R. (1979). The Fine Structure of the Hypostome and Mouth of Hydra. Cell
Tissue Res. 199, 319-338.